
Submitted:
25 November 2024
Posted:
26 November 2024
You are already at the latest version
Abstract
The rapid growth of the world population led to an exponential growth in industrial activity all around the world. Consequently, CO2 emissions have risen almost 400% since 1950 due to human activities. Considering that microalgae biomass is recognized as a renewable feedstock to produce third generation biofuels and bioenergy, the scope of the present research was to investigate al-ternative routes to produce bioethanol and biomethane in laboratory scale from dried algae biomass. The first step was to evaluate and optimize the production of sugars from the received biomass. Thus, three different techniques with three different solvents were tested to identify the most ef-fective and efficient in terms of saccharification yield. With the assistance of an autoclave or a high temperature water bath and 0.2M NaOH as a solvent, yields of 79.16 ± 3.03% and 85.73 ± 3.23% were achieved which correspond to 9.24 and 9.80 g/L of glucose respectively. Furthermore, the most efficient method from the pretreatment step was chosen to carry out a factorial design to produce bioethanol. The experiments showed that the loading of cellulase was of crucial importance to the optimization of the process. Regarding the ethanol yields obtained, the highest was 76.12 ± 4.90% with a concentration of 4.40 ± 0.28 g/L (0.3 Μ NaOH, 750 μL/gcellulose and 65 μL/gstarch). In addition, the stillages derived from the fermentation broth were assessed through a BMP test to evaluate their biomethane potential. They exhibited increased biomethane yields in comparison with the untreated feedstock. The highest methane yield recorded was 217.88 ± 10.40 mL/gVS. Finally, the energy that could be produced if both products (bioethanol and biomethane) were valorized, was evaluated. The analysis showed that up to 1044.48 kWh/tn of algae feedstock could be produced, with the biomethane production contributing 75.26% to the total energy output.
Keywords:
Bioethanol
; biomethane
; enzymatic hydrolysis
; microalgae
1. Introduction
In the latest decade, the world population showed an exponential growth rate, from 7.51 billion in 2016 to 7.91 billion in 2021 and it is projected to reach 9.71 billion by 2050 [1] leading to a tremendous increase in energy demand, especially fossil fuels (i.e., coal, oil and natural gas). Nevertheless, the uncontrolled use of fossil fuels is a major concern due to their depletion as well as the negative effects on the environment [2].
Regarding the energy consumption, the world energy use showed a dramatic increase from 8,589 million tonnes (Mtoe) recorded in 1955 to 13,147 Mtoe, recorded in 2015 [3]. Regarding the primary energy consumption across Europe, based on data obtained from Eurostat [4] a significant decrease from approximately 1,500 (Mtoe) recorded in 2006 to approximately 1,250 (Mtoe) in 2020. According to the findings of [5], the total demand for primary energy is projected to be approximately 17,500 Mtoe in 2040. This rapid increase in the demand for energy shall create an immense amount of stress in the energy production sector. For this reason, during the last decades, not only research has turned towards the development of new methods for energy production but also attempts have been made towards global policy changes. In this context, efficient alternatives for fossil fuels such as biofuels deriving from lignocellulosic biomass or other types of organic matter are currently trending among other environmental technologies [6,7].
In addition, since 2018, the EU revised Renewable Energy Directive (RED II) is in effect. This directive focuses on emission prevention in the transport sector via the development and blending of advanced biofuels and conventional fuels. More specifically, in 2018, biofuels were blended with fossil fuels at a rate of 5.2%. Currently, the blending of conventional biofuels (food based) is estimated at 4.1%, well below the 7% limit set in legislation up to 2030 (RED II). The blending of advanced (non-food based) biofuels is estimated at 1.2%. The majority of these fuels have derived (1%, group B) from waste such as fats and oils, while a small proportion (0.2%, group A) has derived from pine oil and cellulosic feedstocks [8,9].
On the other hand, the current scenario of anthropogenic pollution and unrestricted greenhouse gas emissions poses risks of exacerbating global warming, causing adverse impacts such as ocean acidification, desertification, and altered weather patterns. Global CO2 emissions due to human activities have increased by almost 400% since 1950 and the high concentration of CO2 in the atmosphere is predicted to continuously increase if the problem of CO2 emission is not addressed [10]. According to the 2015 Paris agreement, the rise in temperature of Earth should be kept below 2°C in comparison to the preindustrial levels, and the increase in Earth’s temperature should be limited to below 1.5°C. To achieve this goal, hundreds of tons of CO2 should be captured and stored annually until 2030 [2]. Despite all the efforts made, greenhouse gas emissions are still a pressing matter that needs to be resolved. Considering the decisions of the United Nations COP 28 for the importance of conserving, protecting and restoring nature and ecosystems towards achieving the Paris agreement temperature goal and preserving terrestrial and marine ecosystems serving as greenhouse gas sinks and reservoirs and biodiversity being preserved, a progressive shift away from fossil fuels may help ensure the survival of many ecosystems [11,12].
Considering all the above, biofuels represent a promising category of fuels derived from renewable sources, characterized by minimal environmental impact, widespread availability, sustainability and reliability. Within this category, microalgae-based fuels emerge as a particularly environmentally friendly and promising option, demonstrating remarkable effectiveness in reducing global CO2 emissions. Research suggests that one kilogram of microalgae biomass can sequester approximately 1.83 kilograms of CO2 [13]. In addition, certain microalgae species could utilize sulfur oxides (SOx) and nitrogen oxides (NOx) as additional nutrient sources in addition to CO2 [14]. Moreover, according to the existing literature algal biomass typically contains large amounts of carbohydrates (5-23%), lipids (7-23%), and proteins (6-52%), but all those parameters are strongly species and cultivation dependent [15]. This fact indicates that biomass originated from algae could potentially be a very valuable substrate to produce different types of fuels.
Furthermore, microalgae are considered as a 3rd generation feedstock for the production of sustainable biofuels not only due to their abundance in various aquatic environments but also because they do not require arable land for their cultivation [16]. The main fuels indicated in the literature that can be produced from microalgae include the production of alcohols (i.e., bioethanol), biodiesel, and biogas although there is a plethora of byproducts from algae biomass [17,18].
The production of bioethanol is achieved simply by fermenting simple sugars such as glucose and maltose into alcohols with the assistance of certain species of yeast such as Saccharomyces cerevisiae and Zymomonas mobilis [19]. The conventional technique to produce bioethanol requires a pretreatment step and the hydrolysis of polysaccharides into monosaccharides and finally the yeast fermentation [20,21,22].
In addition, algae biomass could also be a quality feedstock to produce biogas via anaerobic digestion (AD). Usually before AD, the feedstock (i.e., conventional plants) undergoes a pretreatment step, chemical or mechanical in some cases, in order to reduce the lignin content [23].
The scope of this study is to explore possible routes in order to valorize algae biomass in laboratory scale towards the production of biofuels, producing bioethanol via ethanolic fermentation and biogas via anaerobic digestion based on the circular economy concept. To achieve this goal, pretreatment techniques were studied and evaluated for maximizing the sugars produced. The ethanolic fermentation process was investigated, and the derived stillages were subjected to the biochemical methane potential assay (BMP test) to evaluate their biomethane potential.
2. Materials and Methods
2.1. Materials
The algae biomass that was utilized throughout the study was kindly provided by Algen, Slovenia. The biomass was received at the Unit of Environmental Science and Technology, School of Chemical Engineering, NTUA, for analysis and processing. In total, about 500g of feedstock were received and characterized in terms of physicochemical composition. All chemicals utilized were of analytical quality. Regarding the use of enzymes, Novozymes® (Denmark) kindly supplied us Spirizyme Excel XHS (2337 U/mL) and CellicTec3 (171.7 FPU/mL). For the purpose of enzymatic hydrolysis as a first step for the production of fermentable sugars, the enzyme loadings remained constant throughout the pretreatment investigation at 45μL/gstarch for amylase and 500 μL/gcellulose for cellulase based on preliminary experiments. As far as the fermentation process is concerned, the yeast strain employed was Saccharomyces cerevisiae (baker’s yeast) which also remained constant at 2% (d.b.).
2.2. Analytical Methods
For the estimation of total and water-soluble solids, hemicellulose, cellulose, and lignin in algal biomass (as received and pretreated), the National Renewable Energy Laboratory (NREL) procedure was applied [24]. For total starch determination, the Total Starch (AA/AMG) test kit (e.g., Megazyme, Wicklow, Ireland) was used (AACC Method 76-13.01). The Soxhlet standard method (5520E) was utilized for the quantification of fats and lipids [25,26]. Marketable kits (Glucose oxidase-peroxidase method (GOD/PAP), Biosis SA, Athens, Greece; Spectro-quant Volatile Organic Acids Test 1018909 by Merck KGaA Millipore, Darmstadt, Germany; Ethanol Assay Kit, K-EtOHLQR, Megazymes) were used for the photometric determination of glucose, volatile fatty acids, and ethanol in the liquid fraction, respectively. All analyses took place in triplicate. The KERN DAB 100-3 Moisture Analyzer was utilized to determine the moisture content of the substrate prior to its treatment. This approach was employed to obtain reliable measurements of the dry matter to estimate the solids, enzymes, and yeast loadings.
2.3. Experimental Methods
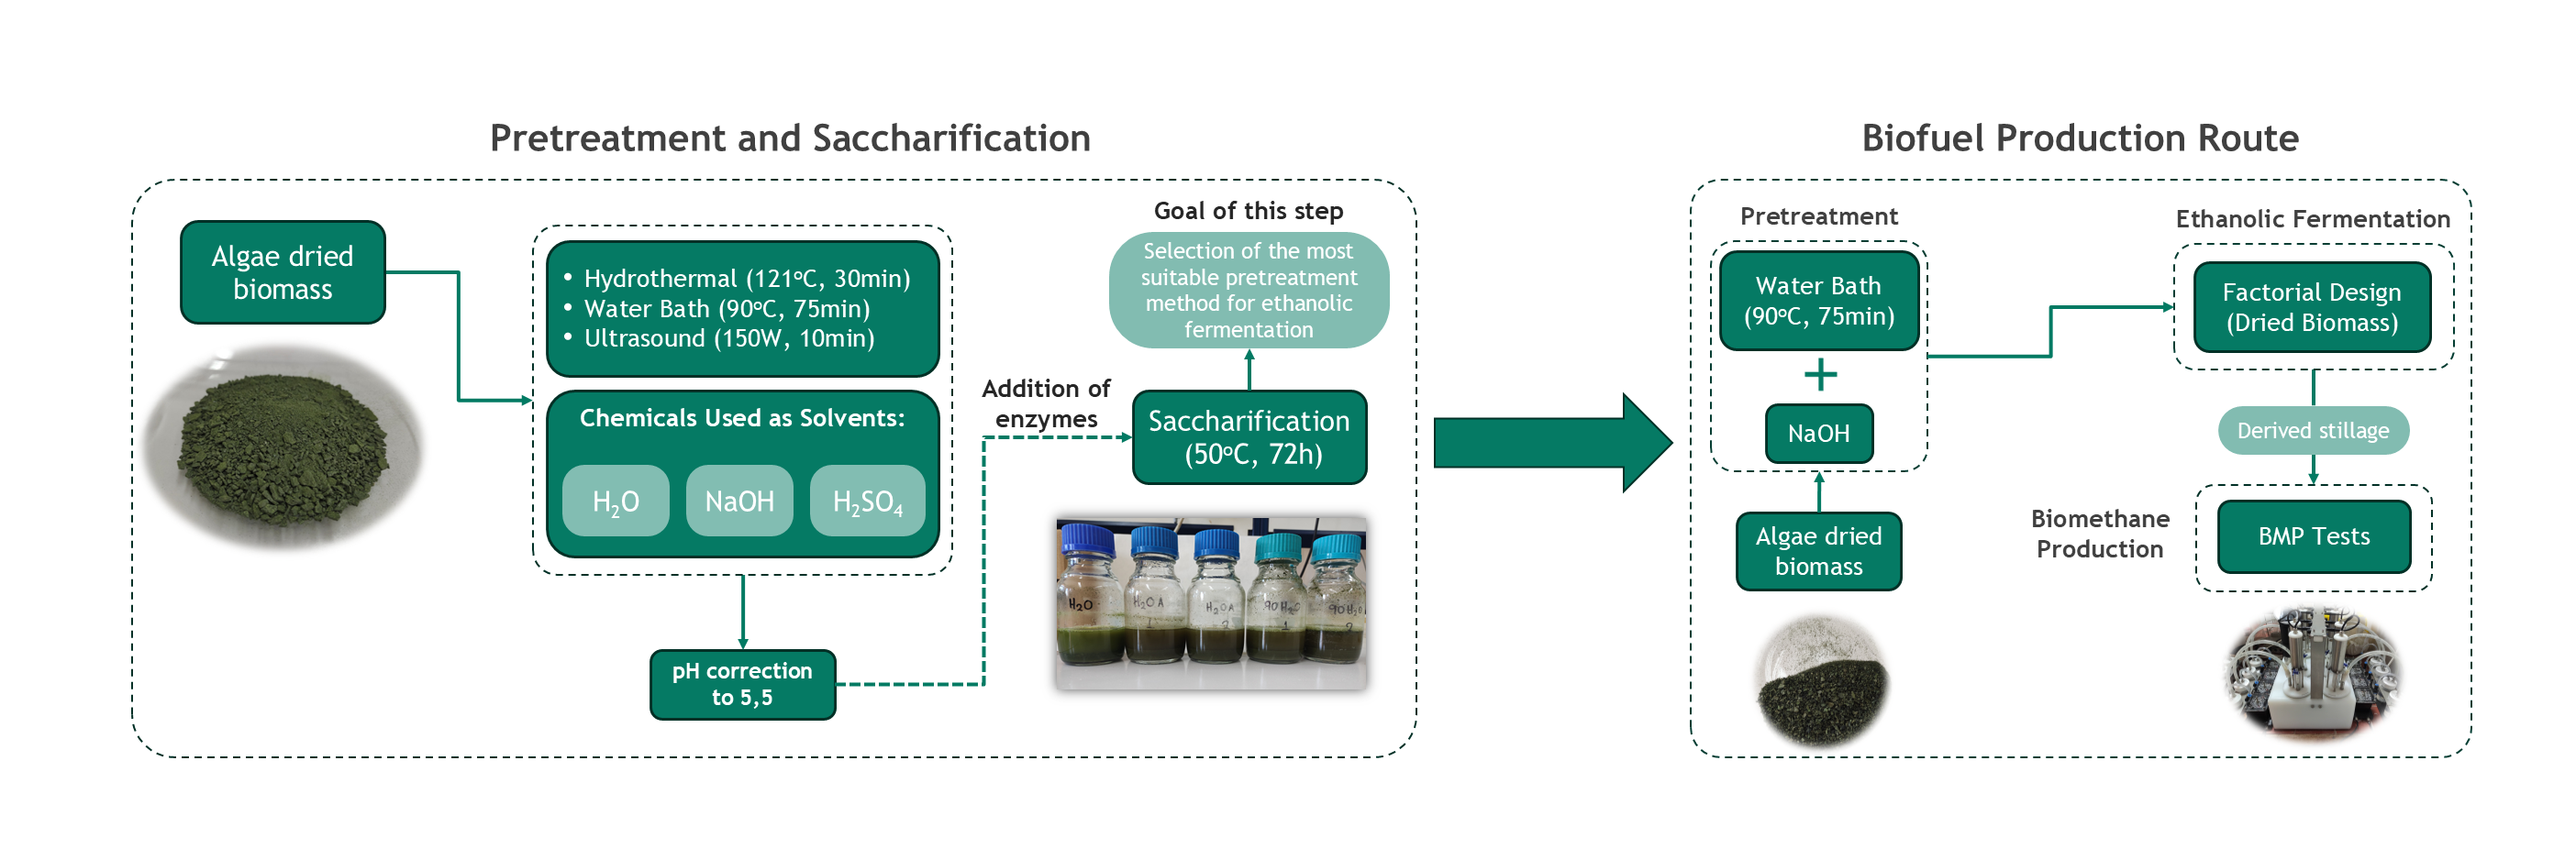
2.3.1. Pretreatment and Saccharification
Regarding the methods used for the pretreatment of biomass, according to literature there is a vast selection of pretreatment methods that could be utilized in order to maximize the potential sugars from algae biomass such as supercritical carbon dioxide, ammonia fiber explosion, ultrasonication, acid pretreatment and alkaline pretreatment [27,28,29,30,31,32].
Considering the requirements in equipment and in chemicals for each of the proposed pretreatment techniques in literature, it was decided to conduct a series of experiments combining some of the most effective techniques, according to the recent updates in research. All of the experiments were carried out in laboratory scale (250mL boro-bottles with 100mL final volume). The solid loading and enzyme loadings were kept constant at 10%w/w, 45μL/gstarch and 500 μL/gcellulose to maintain comparability of results.
Three different pretreatment techniques were employed in this research study. (A) The samples were hydrothermally pretreated using an autoclave (ISOLAB Laborgerate GmbH) at 121oC for 30 minutes. (B) The samples were treated in a water bath at 90oC for 75 minutes. (C) The samples were ultrasonicated at 150W for 10 minutes using an ultrasonic probe (Branson Ultrasonics™ Sonifier™ SFX550 Cell Disruptor). For each pretreatment three different cases were examined as solvents: (1) Distilled water, (2) Alkaline solution of NaOH (0.2M) and (3) Acid solution of H2SO4 (1% v/v). All the above are summarized in Table 1.
In addition, an experiment using just distilled water was conducted as blank. It is worth mentioning that each experiment was carried out in duplicate for more reliable results. After the pretreatment phase, the pH of each sample was set at approximately 5.5 and the enzymes were added to the mixture for the saccharification process. The enzymatic hydrolysis conditions were the following: 72 hours retention time at 50oC and 150 rpm using a shaker (KS 3000 i control, IKA, Staufen, Germany). Also, the glucose concentration was monitored throughout the 72-hour period of each experiment and the maximum concentration was recorded. At the end of each experiment, the whole mixture was transferred to falcon tubes for the separation of solid from the liquid fraction via centrifugation at 3.5k rpm for 10 minutes. The solid part was dried at 35oC in a Carbolite AX30 hot air oven, for 24 hours and it was fully characterized in terms of total solids, moisture content, volatile solids, ash, cellulose, hemicellulose, starch and lignin both soluble and insoluble. In the liquid fraction the ethanol, glucose, volatile organic acid and phenol concentrations were measured.
The saccharification yield was estimated to assess the efficiency of the process for each case. The term saccharification yield denotes the ratio of the quantity of sugars produced from the degradation of polysaccharides to the theoretical sugar content present in the feedstock (Equation (1)):
To confirm the efficiency of the saccharification process, the degradation efficiencies of both the solid and major polysaccharides i.e., cellulose and starch were calculated according to the following equation:
2.3.2. Bioethanol Production
To produce bioethanol in lab-scale, the simultaneous saccharification and fermentation (SSF) mode was applied to the algae biomass as it was determined by the preliminary experiments carried out. At first all the experiments were carried out in 250 mL autoclavable bottles, using a shaker (KS 3000 i control, IKA, Staufen, Germany). For the optimization trials, the experiments were performed under different concentrations of chemicals, and different enzyme loadings (Cellulolytic and Amylolytic enzymes) by applying the principles of factorial design. Enzyme loadings of 25, 45 and 65 μL/gstarch for Spirizyme Excel XHS and 250, 500 and 750 μL/gcellulose for the CellicTec3 were tested by applying a constant solid loading of 10% w/w. The chemical means and the pretreatment method were selected during the pretreatment investigation step. The same pretreatment was applied to all the trials. The fermentation step was conducted at 35oC for 24h using 2% w/w of yeast Saccharomyces cerevisiae.
To quantify the efficiency of the process, two parameters were measured at t=0h and t=24h. The first parameter was the ethanol content which was also the goal of this step. The second parameter was the glucose content to determine if the fermentation was successful or if there was excess glucose at 24h which could indicate the effect of an inhibitor.
The equation for the calculation of ethanol yield is taking into consideration the produced ethanol from the process of simultaneous fermentation and saccharification and the theoretical ethanol that could be produced if all glucose in the feedstock was metabolized to ethanol (Equation (3)).
2.3.3. Biochemical Methane Potential Assay
The biochemical methane potential assay was conducted to assess the biodegradability of the dried feedstock as well as the derived stillage from the ethanolic fermentation conducted in the previous step. For this purpose, a lab scale BMP continuously agitated batch reactor manufactured by CJC LABS with a working volume of 1L (Figure 1) was utilized along with a small scrubbing unit to estimate the produced methane. The assay was conducted according to the protocol developed by Angelidaki [33]. The apparatus could conduct 16 simultaneous batch experiments. In each cycle, two vessels were utilized to conduct one blank and one control experiment to verify the activity of the inoculum. The control was conducted with granulated cellulose to replicate the whole process of the degradation. The retention time of each cycle was set to 30 days and the cumulative methane content was measured with the assistance of the integrated data logger of the reactor. Each vessel of the apparatus was partially filled, and the chosen VS ratio of the inoculum and substrate was set to 1:4. The latter was chosen based on the quantity of the stillages derived from ethanolic fermentation. The inoculum was received from an existing anaerobic digestion plant treating municipal sewage sludge in Athens, Greece (VS 20.8 g/L). Upon the completion of each cycle the corresponding yield for each case was calculated according to the following equation:
3. Results and Discussion
3.1. Chemical Composition
The first step was to determine the composition of the received dried biomass. All the measured parameters according to paragraph 2.2 are presented in Table 2. As can be observed, the feedstock had elevated content of lignin and a lower content in carbohydrates i.e., cellulose and starch.
The results obtained from the characterization of the feedstock showed a slight deviation from those that can be found in the literature. More specifically, algae biomass typically contains high lipid content in a range between 8-77% (d.b.) depending on the strain [23]. In our case, the lipid content did not exceed 1% (d.b.). Also, the carbohydrate content was in the low limits of literature. Depending on the strain, the range of the carbohydrate content of algal species is between 11-50% (d.b.) [21] while our feedstock was measured at 10.99 ± 0.73% (d.b.). Considering that the received algae biomass was cultivated in an open raceway pond neither the purity of the dominant strain nor the cultivation conditions can be ensured, consequently the composition of the derived biomass could have fluctuations compared with those of pure strain cultivations.
3.2. Lab-Scale Pretreatment Method Investigation
To initiate the pretreatment experiments, a trial was conducted as blank by using distilled water and the enzyme mixture (45μL/gstarch and 500 μL/gcellulose for Spirizyme Excel XHS and CellicTec3 respectively). This trial resulted as expected, due to high lignin content as shown in Table 2, in a saccharification yield of lower than 1% according to Equation (1). Consequently, the application of a pretreatment method was deemed necessary. The results of the 72-hour period of monitoring the glucose concentration in all the experiments of Table 1 are presented in Figure 2, Figure 3 and Figure 4.
The saccharification yields of these experiments are shown in Figure 5. In the saccharification process two experiments were the most effective in terms of yield; A.2 and B.2 which correspond to alkaline hydrothermal pretreatment and alkaline thermal pretreatment respectively. A.2 and B.2 yielded 79.16 ± 3.03% with concentration of 9.24 g/L and 85.73 ± 3.23% with glucose concentration of 9.80 g/L respectively. In addition, a notable conclusion is that when distilled water was used i.e., B.1 and C.1 despite the hydrothermal pretreatment, the yields were below 1%, indicating the effect of the solvents in the production of sugars. This fact comes to support the research of Kassim [27] who concluded that the alkaline pretreatment in combination with high temperatures favored the production of reducing sugars i.e., glucose. In addition, according to Kumar [17], acid and alkali pretreatment are widely acceptable methods because they are less energy intensive and at the same time efficient methods in removing unwanted materials from biomass.
In Figure 6 and Figure 7 the concentrations of phenolic compounds and volatile organic acids at the end of the enzymatic hydrolysis are presented.
The highest phenolic concentrations recorded were observed in experiments A.2 and C.2 (53.30 ± 4.67 and 48.80 ± 5.09 mg/L) with the use of NaOH and autoclave or ultrasonication respectively. These slightly elevated phenolic concentrations are an indication of the breakdown of complex polymers inside lignin compounds, implying the efficiency of the pretreatment method. Nevertheless, these concentrations did not seem to inhibit the enzymatic hydrolysis [34,35].
On the other hand, the volatile organic acid concentrations were significantly higher in 72 hours of the experiment, giving concentrations from 2.71 ± 0.19 to 6.19 ± 0.36 g/L with the highest being at experiment B.2. This increase in the concentration of VOAs could be due to the 72-hour retention time of enzymatic hydrolysis [36]. More specifically, during the enzymatic hydrolysis, at a specific point the concentration of glucose dropped dramatically as shown in Figure 2, Figure 3 and Figure 4 while at the end of each experiment the concentration of VOAs spiked. This fact could be due to glucose oxidation to VOA compounds.
As far as the solid fraction of each experiment is concerned, the results are presented in Figure 8.
According to Figure 8, the degradation efficiencies of both starch and cellulose were quite elevated; in all cases the efficiencies ranged from 59.30 to 96.35%. This result indicates both the effectiveness of pretreatment methods and enzymatic hydrolysis. The highest degradation of cellulose and starch recorded was 92.73% and 96.35% in experiments B.2 and A.2 respectively.
Regarding the degradation of solid, it ranged from 11.58% to 38.17% at experiment A.2. The high degradation of solid in experiment A.2 is justified due to the elevated pressure in the autoclave that favors the breakdown of the solid.
To conclude, the degradation efficiencies that were calculated confirm the results that had derived from the saccharification yields. The goal of this step was to identify the most effective pretreatment combination to produce sugars that could stand as a viable substrate for alcoholic fermentation. From all the experiments of this step and considering the future scalability of the process, the combination of alkaline pretreatment and 90oC water bath was selected to be used as the pretreatment step.
3.3. Factorial Design for Bioethanol Production
Utilizing the optimal pretreatment method from the previous step, a factorial design was performed, as mentioned in paragraph 2.3.2 for dried algae biomass to assess the bioethanol production, focusing on bioethanol yield. Consequently, the liquid phase of the residues after fermentation was analyzed in terms of ethanol and residual glucose concentrations. These results are shown in Table 3. The ethanol yield for each experiment was calculated according to equation (3).
In addition, mean values and standard deviations were calculated, in order to assess random errors with 95% statistical significance. The Cochran criterion was applied to validate the homogeneity of fluctuations. Furthermore, a mathematical model was developed, showing the impact and the significance of the chosen factor to the optimization parameter. In this procedure, ethanol yield was examined as the optimization parameter. Checking of developed mathematical model adequacy was achieved by Fisher criterion.
Algae dried biomass seem to offer the highest ethanol yield (76.12 ± 4.90%) corresponding to 4.40 ± 0.28g/L of ethanol, when 0.3 M NaOH was added along with 65 μL Spirizyme Excel XHS/gstarch and 750 μL CellicTec3/ gcellulose. It is important to note that after each experiment as shown in Table 3, the concentration of glucose is very close to zero, indicating that at the end of the fermentation, S. cerevisiae had completely metabolized the glucose produced into ethanol.
Based on the results of the factorial experiment presented in Table 3 and the mathematical processing as suggested by Felekis and Nikolaou [37,38], the following equation was constructed both in coded and in physical values to indicate the impact of the operational conditions chosen for the maximization of ethanol yield.
Coded values:
Physical Values:
The analysis of the factorial design revealed that the highest ethanol yield was achieved with high levels of NaOH, amylase, and cellulase. Additionally, the analysis highlighted that the ethanol production from algae dried biomass is positively impacted just by the concentration of cellulase within the studied range. This means that the increase of the cellulase concentration would overall favor the production of ethanol from algae dried biomass.
3.4. Biomethane Potential
The biomethane yields were calculated in accordance with Eq 4. The results obtained from the assay are presented in Figure 9.
These results were satisfactory since according to Ward [39] all the yields were within the range mentioned in the literature. For example, the methane yield from mixed culture of Scenedesmus sp. and Chlorella sp. was 143 mL/gVS. In addition, the methane yield obtained from the digestion of the dried feedstock without any treatment was measured at 122.29 ± 16.54 mL/gVS. The highest methane yield obtained from the assays was recorded in experiment 5 corresponding to 217.88 ± 10.40 mL/gVS followed by experiment 2 with 200.31 ± 14.7 mL/gVS. This fact reveals that ethanolic fermentation prior to anaerobic digestion favors biomethane production, especially in the case of experiment 5 (0.3 Μ NaOH, 750 μL/gcellulose and 65 μL/gstarch), the ethanol yield almost doubled. It is worth mentioning that the maximum yield was obtained from the experiment that only one factor (NaOH) was at the high level during the factorial experiment, while the other two (amylase and cellulase) were at the lower level of the design.
3.5. Energy Production Routes
Based on the results obtained from all the previously mentioned processes, 2 scenarios were set up in this section of the study towards energy production i.e., if all the products from the bioethanol and biogas production were valorized.
The first route involved solely the biogas production from the received dry biomass without further treatment. As mentioned in paragraph 3.4 the sample from the untreated feedstock yielded 123.74 ± 14.54 mL/gVS. Considering the lower heating value (LHV) of biomethane to be 10 kWh/m3 [40], 683.03 ± 63.54 kWh/tn of dried feedstock could be produced.
The second route involved both ethanolic fermentation and biomethane production. Based on the yields obtained from the factorial design and the BMP assays, the energy per ton of wet feedstock from each fuel and experiment was calculated. The total energy of algae derived bioethanol and biomethane per experiment is presented in Figure 10. It is worth noting that in total 1045 kWh/tn of algae could be produced in from the proposed process in experiment 5. Similarly, the minimum energy that could be produced was calculated to be 885 kWh/tn of algae.
4. Conclusions
To sum up, the goal of this work was to showcase alternative routes for the valorization of algae biomass. The chemical composition of the feedstock is a crucial parameter for the success of the proposed processes, especially for bioethanol. In addition, the investigation for pretreatment methods showed that thermal pretreatments combined with alkali pretreatment favor sugar production during enzymatic hydrolysis. More specifically, the concentration of glucose derived from alkali and thermal pretreatment combinations i.e., autoclave and water bath with the use of NaOH, reached 9.24 and 9.80g/L respectively. Considering the future scale up of the process, the most viable method was chosen (water bath at 90oC and NaOH 0.2M) for the fermentation step.
As far as the fermentation step is concerned, a factorial design was carried out and the derived outcome was proven to be enlightening considering that just one critical parameter (the cellulase loading) was proven to be significant in the range studied which was the concentration of cellulase. It is worth noting that the highest yield recorded was 76.12 ± 4.90% when 0.3 Μ NaOH was added along with 750 μL/gcellulose and 65 μL/gstarch.
In addition, the biochemical methane potential assays showcased the prospect of applying anaerobic digestion to algae biomass stillage towards the production of biomethane. The maximum methane yield was 217.88 ± 10.40 mL/gVS from the residue of experiment 5 of the factorial design.
Last but not least, the energy production scenarios from the overall process revealed that firstly, the application of ethanolic fermentation prior to anaerobic digestion enhances not only the biomethane production but the overall energy production; more than 1000 kWh/tn of algae could be produced by applying the proposed treatment train.
Author Contributions
Conceptualization, S.M. and E.M.B.; methodology, S.M. and E.M.B.; formal analysis, S.M. and E.M.B.; investigation, P.F.C. and E.K.F.; resources, D.M.; writing—original draft preparation, P.F.C., S.M. and E.M.B.; data curation, S.M. and E.M.B.; writing—review and editing, P.F.C., S.M. and E.M.B.; visualization, P.F.C.; supervision, S.M. and E.M.B.; project administration, D.M. All authors have read and agreed to the published version of the manuscript.
Funding
This project has received funding from the European Union’s Horizon 2020 research and innovation program under grant agreement No 101084405 (CRONUS).
Data Availability Statement
No new data were created or analyzed in this study. Data sharing is not applicable to this article.
Conflicts of Interest
The authors declare no conflicts of interest.
References
- H. Ritchie et al., “Population Growth,” Our World in Data, Jul. 2023, Accessed: Feb. 25, 2024. [Online]. Available: https://ourworldindata.org/population-growth.
- D. Y. C. Leung, G. Caramanna, and M. M. Maroto-Valer, “An overview of current status of carbon dioxide capture and storage technologies,” Renewable and Sustainable Energy Reviews, vol. 39, pp. 426–443, Nov. 2014. [CrossRef]
- K. Dong, X. Dong, and Q. Jiang, “How renewable energy consumption lower global CO2 emissions? Evidence from countries with different income levels,” World Economy, vol. 43, no. 6, pp. 1665–1698, Jun. 2020. [CrossRef]
- “EU energy consumption plummeted in 2020—Products Eurostat News—Eurostat.” Accessed: Nov. 22, 2024. [Online]. Available: https://ec.europa.eu/eurostat/web/products-eurostat-news/-/ddn-20211221-1.
- T. Ahmad and D. Zhang, “A critical review of comparative global historical energy consumption and future demand: The story told so far,” Energy Reports, vol. 6, pp. 1973–1991, Nov. 2020. [CrossRef]
- L. Cherwoo et al., “Biofuels an alternative to traditional fossil fuels: A comprehensive review,” Sustainable Energy Technologies and Assessments, vol. 60, p. 103503, Dec. 2023. [CrossRef]
- R. Aniza, W. H. Chen, E. E. Kwon, Q. V. Bach, and A. T. Hoang, “Lignocellulosic biofuel properties and reactivity analyzed by thermogravimetric analysis (TGA) toward zero carbon scheme: A critical review,” Apr. 01, 2024, Elsevier Ltd. [CrossRef]
- B. Flach, S. Phillips, S. Lieberz, J. Lappin, and S. Bolla, “EU Biofuels Annual 2018. USDA Foreign Agricultural Service,” 2018.
- European Commission, “Renewable Energy—Recast to 2030 (RED II)—European Commission.” Accessed: Feb. 27, 2024. [Online]. Available: https://joint-research-centre.ec.europa.eu/welcome-jec-website/reference-regulatory-framework/renewable-energy-recast-2030-red-ii_en.
- K. O. Yoro and M. O. Daramola, “CO2 emission sources, greenhouse gases, and the global warming effect,” in Advances in Carbon Capture: Methods, Technologies and Applications, Elsevier, 2020, pp. 3–28. [CrossRef]
- UNFCCC, “COP 28: What Was Achieved and What Happens Next? | UNFCCC.” Accessed: Feb. 27, 2024. [Online]. Available: https://unfccc.int/cop28/5-key-takeaways.
- T. Jiang et al., “COP 28: Challenge of coping with climate crisis,” Jan. 08, 2024, Cell Press. [CrossRef]
- G. Pascon et al., “Potential application and beneficial effects of a marine microalgal biomass produced in a high-rate algal pond (HRAP) in diets of European sea bass, Dicentrarchus labrax,” 2021. [CrossRef]
- X. Wang, Y. Zhang, C. Xia, A. Alqahtani, A. Sharma, and A. Pugazhendhi, “A review on optimistic biorefinery products: Biofuel and bioproducts from algae biomass,” Fuel, vol. 338, Apr. 2023. [CrossRef]
- B. Sialve, N. Bernet, and O. Bernard, “Anaerobic digestion of microalgae as a necessary step to make microalgal biodiesel sustainable,” Jul. 2009. [CrossRef]
- A. M. Silva Benavides, K. Ranglová, J. R. Malapascua, J. Masojídek, and G. Torzillo, “Diurnal changes of photosynthesis and growth of Arthrospira platensis cultured in a thin-layer cascade and an open pond,” Algal Res, vol. 28, pp. 48–56, Dec. 2017. [CrossRef]
- M. Kumar, Y. Sun, R. Rathour, A. Pandey, I. S. Thakur, and D. C. W. Tsang, “Algae as potential feedstock for the production of biofuels and value-added products: Opportunities and challenges,” May 10, 2020, Elsevier B.V. [CrossRef]
- S. H. Ho, S. W. Huang, C. Y. Chen, T. Hasunuma, A. Kondo, and J. S. Chang, “Bioethanol production using carbohydrate-rich microalgae biomass as feedstock,” Bioresour Technol, vol. 135, pp. 191–198, 2013. [CrossRef]
- . A. Adeleye and W. Braide, “Comparative study of bioethanol production from agricultural wastes by Zymomonas mobilis and Saccharomyces cerevisiae,” 2018. [Online]. Available: https://www.researchgate.net/publication/334593862.
- V. S. Muthuraman and N. Kasianantham, “Valorization opportunities and adaptability assessment of algae based biofuels for futuristic sustainability-A review,” Jun. 01, 2023, Institution of Chemical Engineers. [CrossRef]
- K. Kusmiyati, H. Hadiyanto, and A. Fudholi, “Treatment updates of microalgae biomass for bioethanol production: A comparative study,” Jan. 10, 2023, Elsevier Ltd. [CrossRef]
- Q. Al Abdallah, B. T. Nixon, and J. R. Fortwendel, “The enzymatic conversion of major algal and cyanobacterial carbohydrates to bioethanol,” 2016, Frontiers Media S.A. [CrossRef]
- A. Jabłońska-Trypuć, E. Wołejko, M. D. Ernazarovna, A. Głowacka, G. Sokołowska, and U. Wydro, “Using Algae for Biofuel Production: A Review,” Feb. 01, 2023, MDPI. [CrossRef]
- Sluiter et al., “Determination of Structural Carbohydrates and Lignin in Biomass: Laboratory Analytical Procedure (LAP) (Revised July 2011),” 2008, Accessed: Jan. 15, 2024. [Online]. Available: http://www.nrel.gov/biomass/analytical_procedures.html.
- G. G. Hewavitharana, D. N. Perera, S. B. Navaratne, and I. Wickramasinghe, “Extraction methods of fat from food samples and preparation of fatty acid methyl esters for gas chromatography: A review,” Arabian Journal of Chemistry, vol. 13, no. 8, pp. 6865–6875, Aug. 2020. [CrossRef]
- S. S. Nielsen, “Food Analysis Laboratory Manual,” 2017. [CrossRef]
- M. A. Kassim and S. Bhattacharya, “Dilute alkaline pretreatment for reducing sugar production from Tetraselmis suecica and Chlorella sp. biomass,” Process Biochemistry, vol. 51, no. 11, pp. 1757–1766, Nov. 2016. [CrossRef]
- A. Sathish and R. C. Sims, “Biodiesel from mixed culture algae via a wet lipid extraction procedure,” Bioresour Technol, vol. 118, pp. 643–647, Aug. 2012. [CrossRef]
- B. Bals, C. Wedding, V. Balan, E. Sendich, and B. Dale, “Evaluating the impact of ammonia fiber expansion (AFEX) pretreatment conditions on the cost of ethanol production,” Bioresour Technol, vol. 102, no. 2, pp. 1277–1283, Jan. 2011. [CrossRef]
- B. C. Liau et al., “Supercritical fluids extraction and anti-solvent purification of carotenoids from microalgae and associated bioactivity,” J Supercrit Fluids, vol. 55, no. 1, pp. 169–175, Nov. 2010. [CrossRef]
- S. Tang, C. Qin, H. Wang, S. Li, and S. Tian, “Study on supercritical extraction of lipids and enrichment of DHA from oil-rich microalgae,” J Supercrit Fluids, vol. 57, no. 1, pp. 44–49, May 2011. [CrossRef]
- R. Harun, W. S. Y. Jason, T. Cherrington, and M. K. Danquah, “Exploring alkaline pre-treatment of microalgal biomass for bioethanol production,” Appl Energy, vol. 88, no. 10, pp. 3464–3467, Oct. 2011. [CrossRef]
- I. Angelidaki et al., “Defining the biomethane potential (BMP) of solid organic wastes and energy crops: A proposed protocol for batch assays,” Water Science and Technology, vol. 59, no. 5, pp. 927–934, 2009. [CrossRef]
- T. Ji, F. Liaqat, M. I. Khazi, N. Liaqat, M. Z. Nawaz, and D. Zhu, “Lignin biotransformation: Advances in enzymatic valorization and bioproduction strategies,” Sep. 15, 2024, Elsevier B.V. [CrossRef]
- N. Wei, W. Xu, S. Li, and J. Shi, “Sustainable depolymerization of lignin into aromatic compounds using amphiphilic Anderson-type polyoxometalate catalysts,” Int J Biol Macromol, p. 133257, Jun. 2024. [CrossRef]
- K. Kuruti et al., “Generation of bioethanol and VFA through anaerobic acidogenic fermentation route with press mud obtained from sugar mill as a feedstock,” Bioresour Technol, vol. 192, pp. 646–653, Sep. 2015. [CrossRef]
- V. Felekis, C. Stavraki, D. Malamis, S. Mai, and E. M. Barampouti, “Optimisation of Bioethanol Production in a Potato Processing Industry,” Fermentation, vol. 9, no. 2, Feb. 2023. [CrossRef]
- M. Nikolaou et al., “Valorisation of bakery waste via the bioethanol pathway,” Energy, vol. 280, Oct. 2023. [CrossRef]
- A. J. Ward, D. M. Lewis, and F. B. Green, “Anaerobic digestion of algae biomass: A review,” 2014, Elsevier. [CrossRef]
- “An introduction to biogas and biomethane—Outlook for biogas and biomethane: Prospects for organic growth—Analysis—IEA.” Accessed: Aug. 01, 2024. [Online]. Available: https://www.iea.org/reports/outlook-for-biogas-and-biomethane-prospects-for-organic-growth/an-introduction-to-biogas-and-biomethane.
Figure 1.
(a) BMP Reactor (b) Reactor schematic.
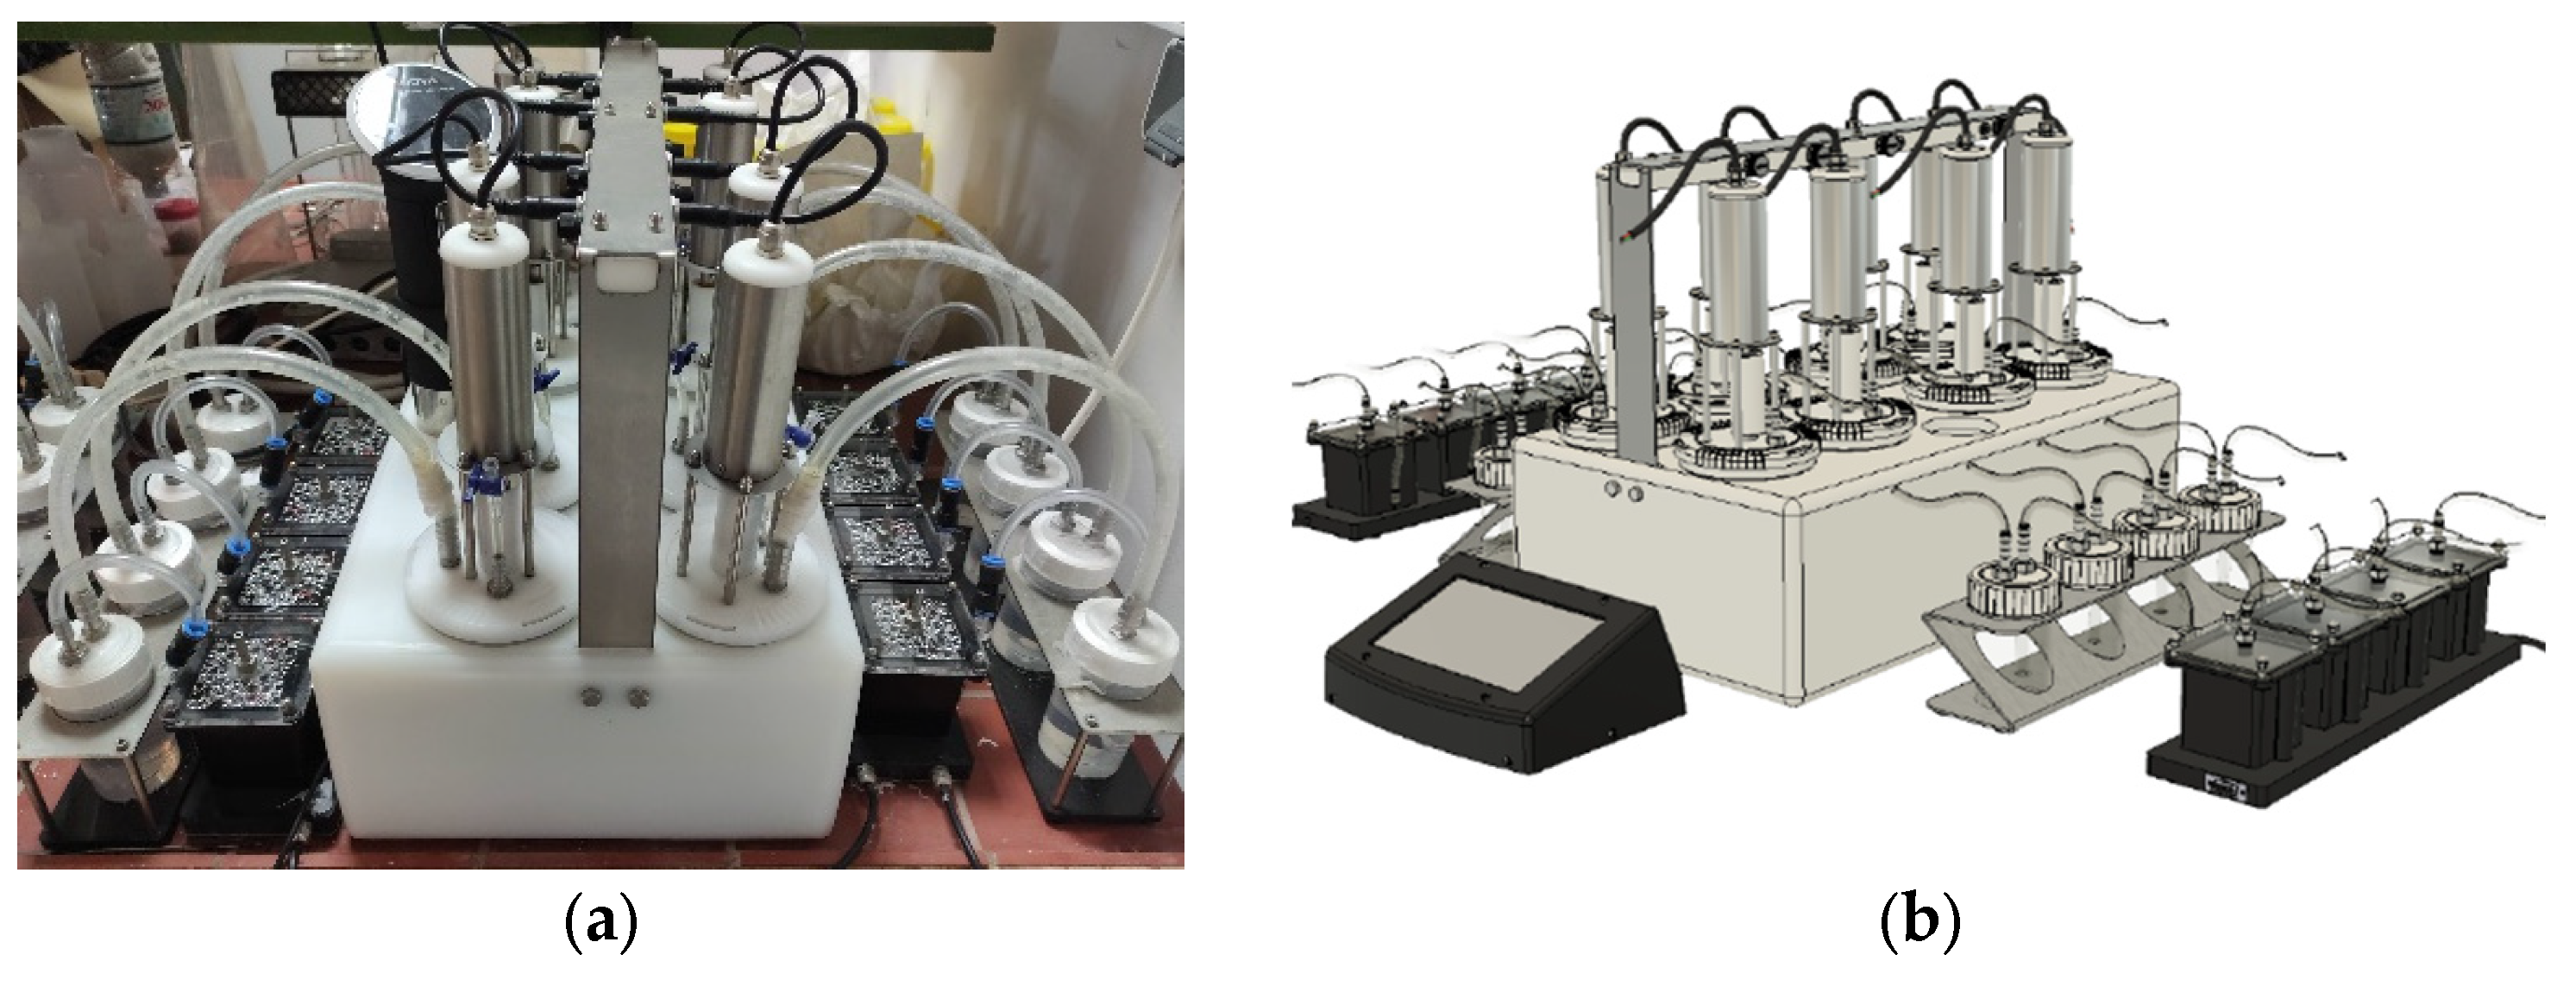
Figure 2.
Glucose concentration throughout the 72-hour enzymatic hydrolysis of algae after pretreatment in autoclave at 121oC for 30min.
Figure 2.
Glucose concentration throughout the 72-hour enzymatic hydrolysis of algae after pretreatment in autoclave at 121oC for 30min.
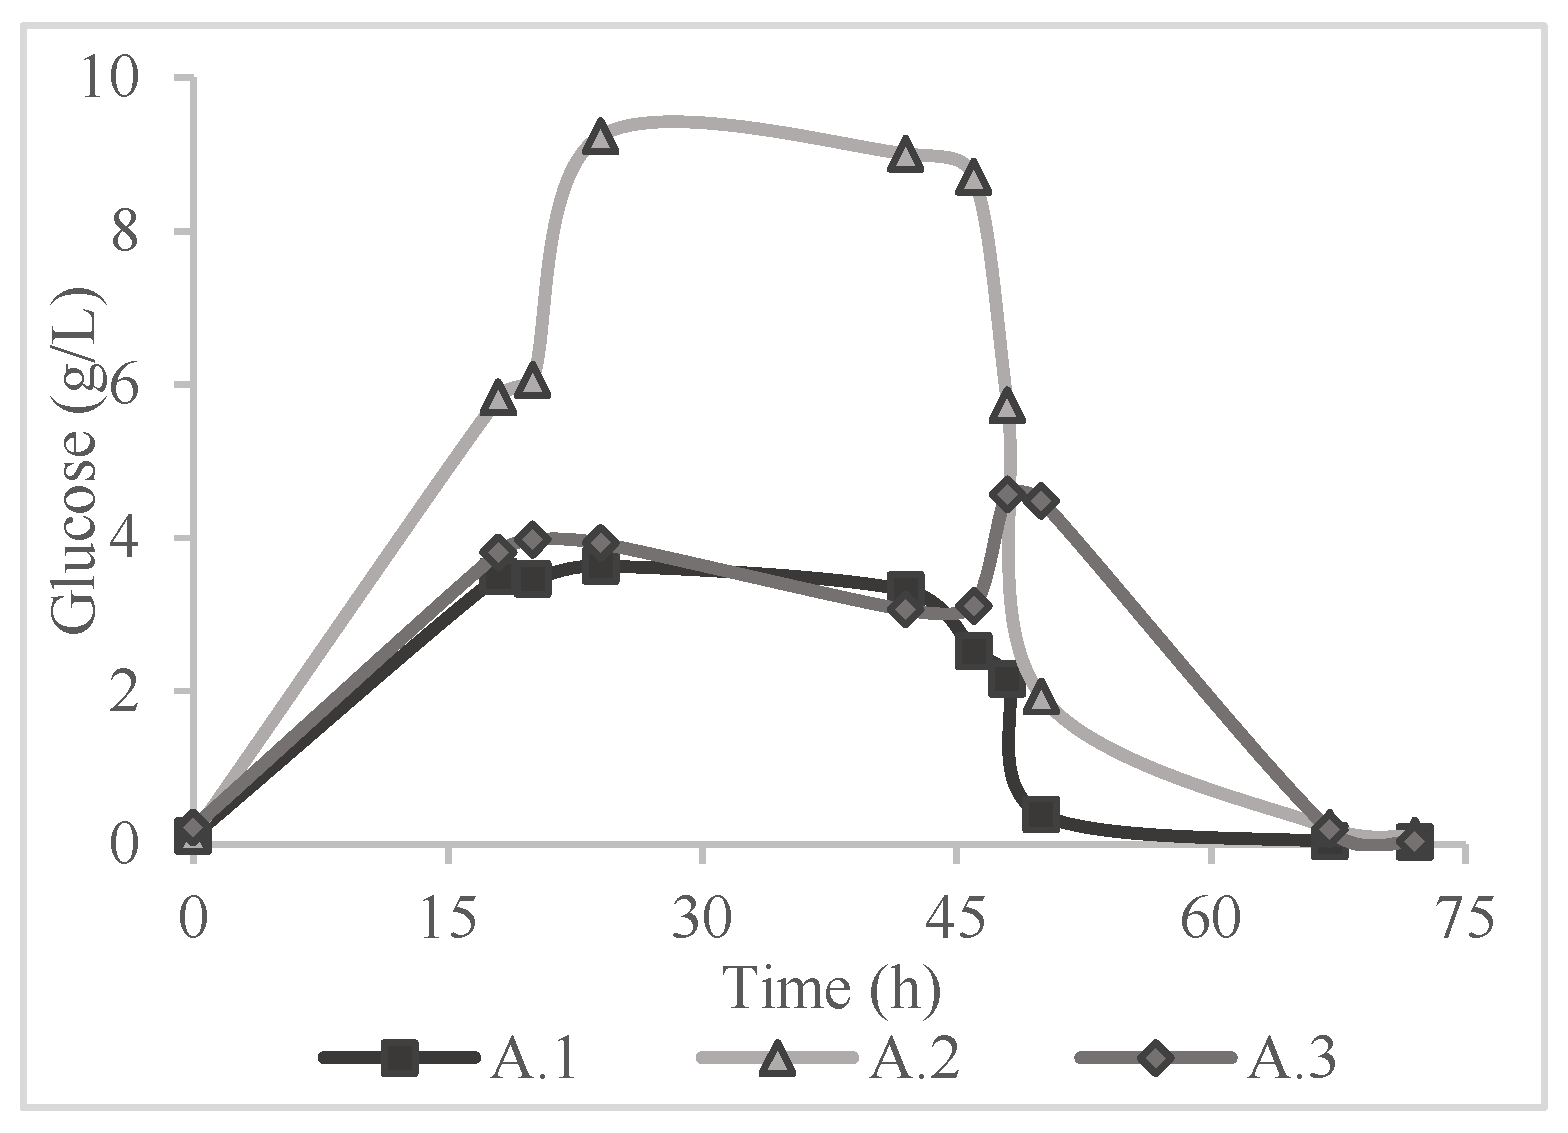
Figure 3.
Glucose concentration throughout the 72-hour enzymatic hydrolysis of algae after pretreatment in water bath at 90oC for 75min.
Figure 3.
Glucose concentration throughout the 72-hour enzymatic hydrolysis of algae after pretreatment in water bath at 90oC for 75min.
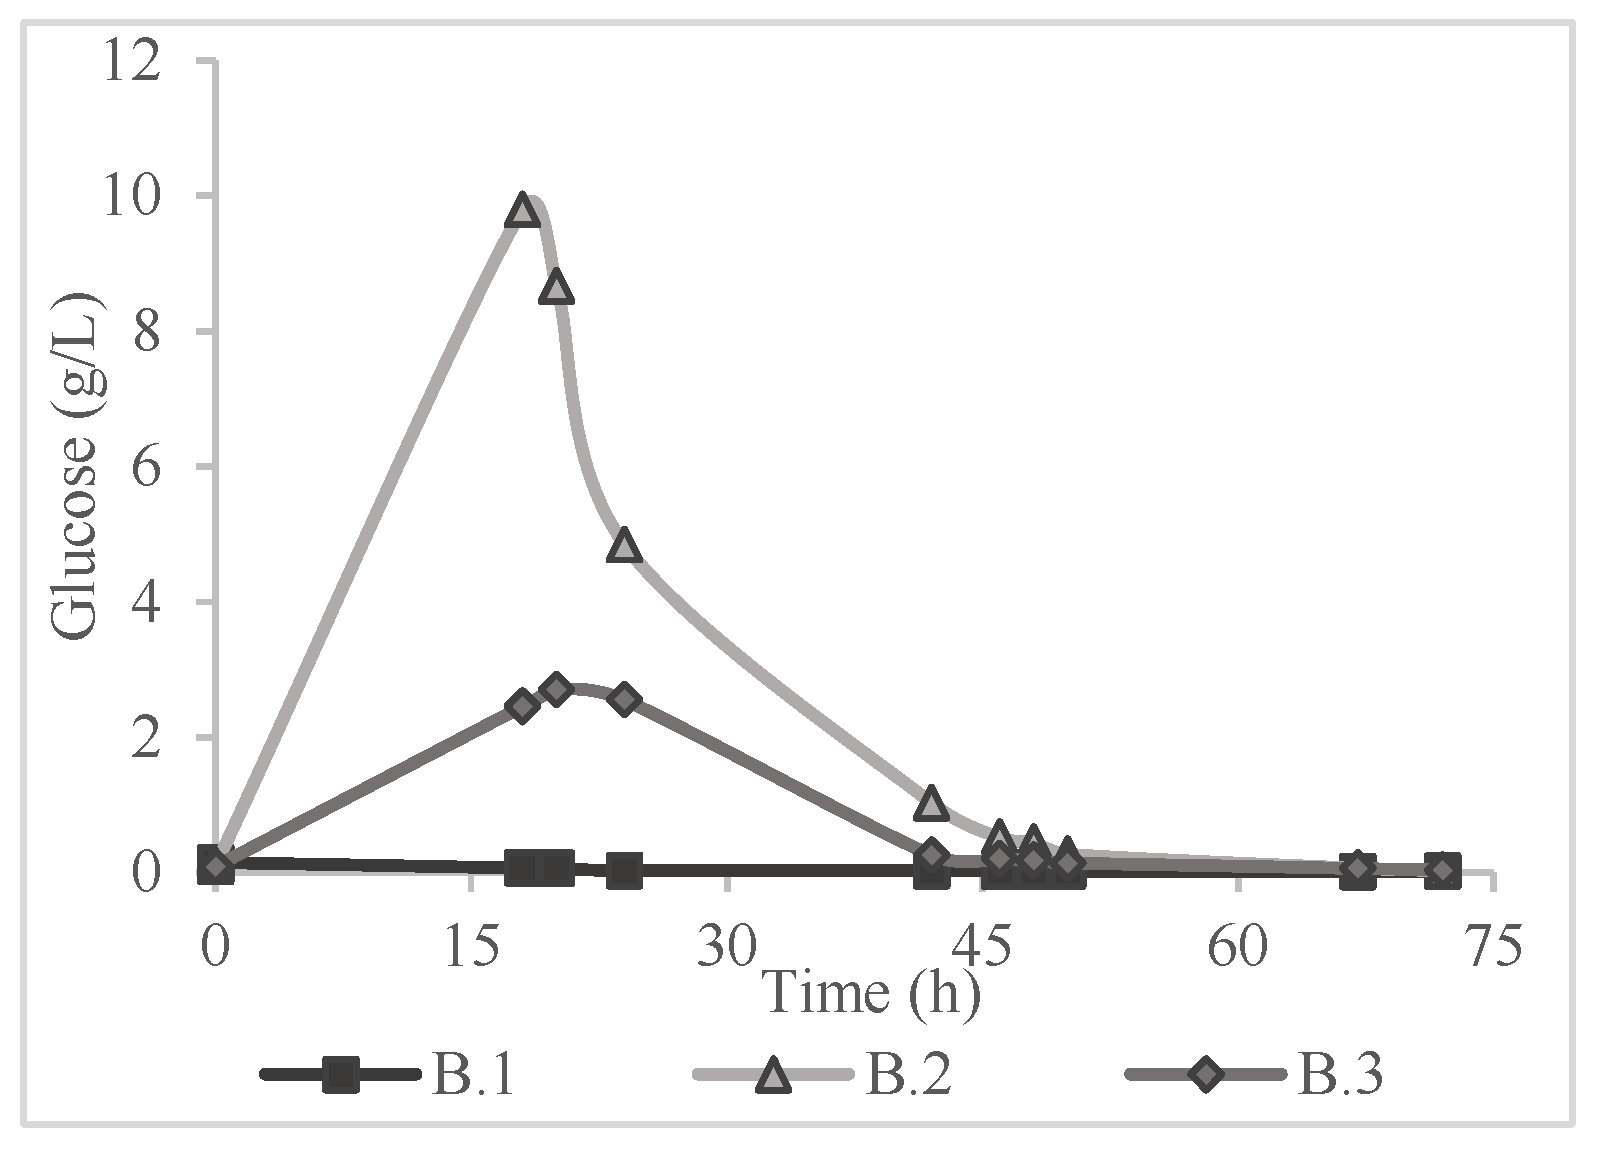
Figure 4.
Glucose concentration throughout 72-hour enzymatic hydrolysis of algae after ultrasonic pretreatment at 150W for 10min.
Figure 4.
Glucose concentration throughout 72-hour enzymatic hydrolysis of algae after ultrasonic pretreatment at 150W for 10min.
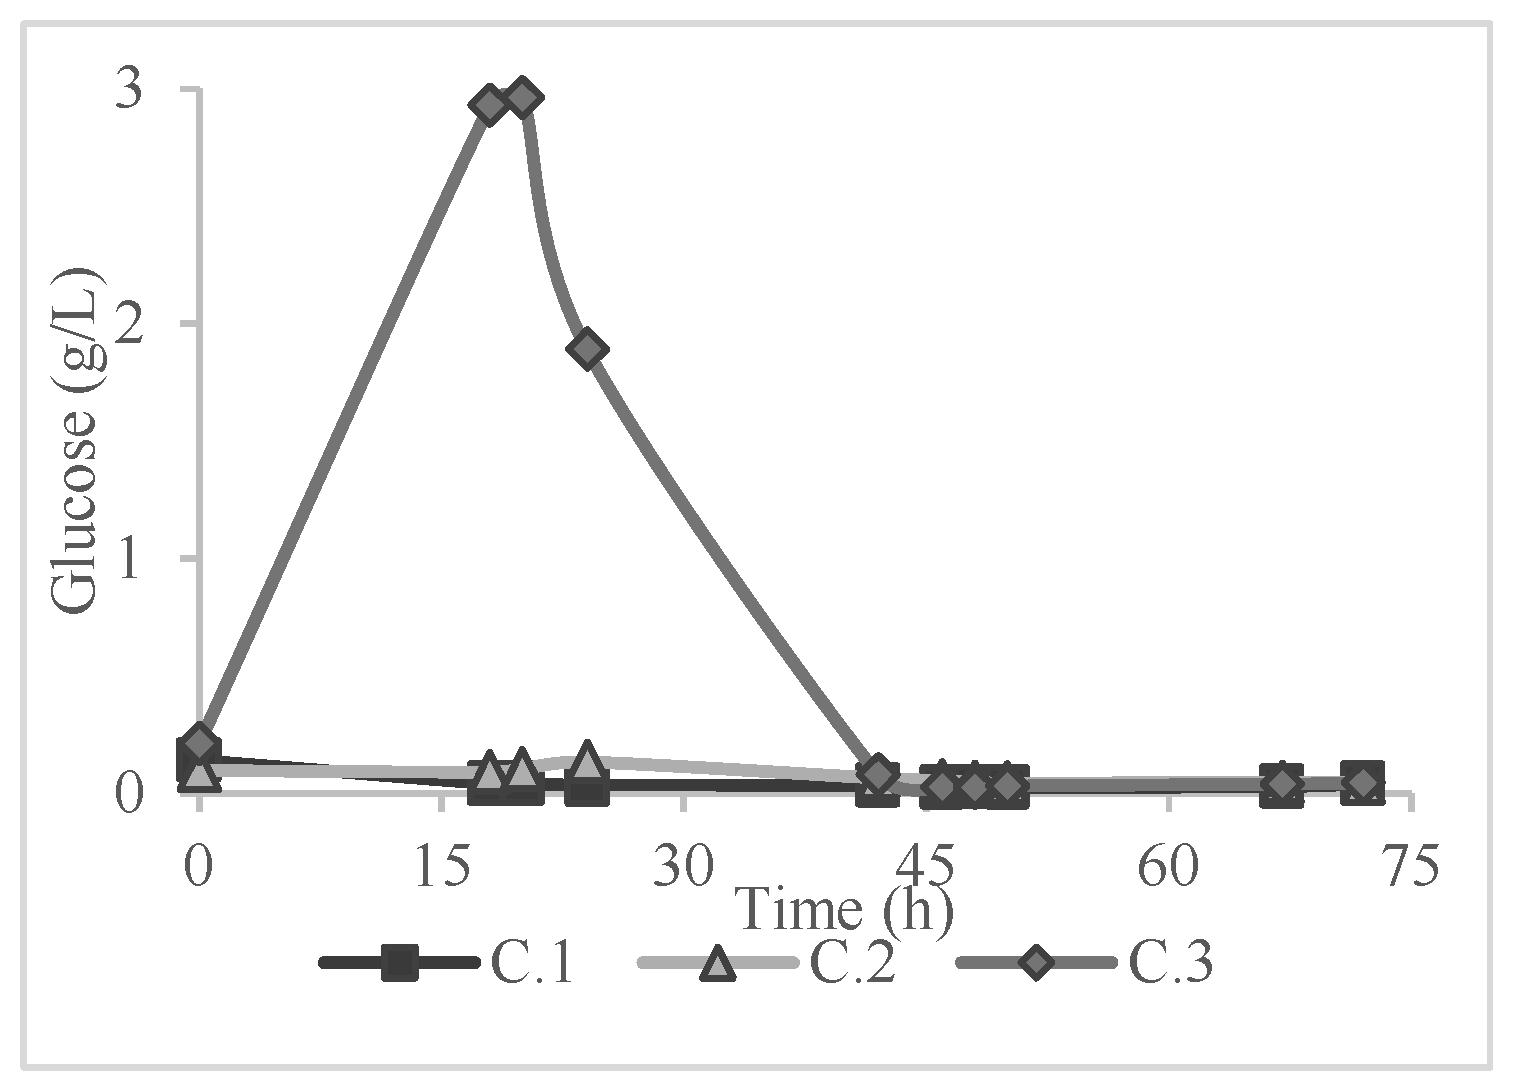
Figure 5.
Saccharification yields per pretreatment method and solvent.
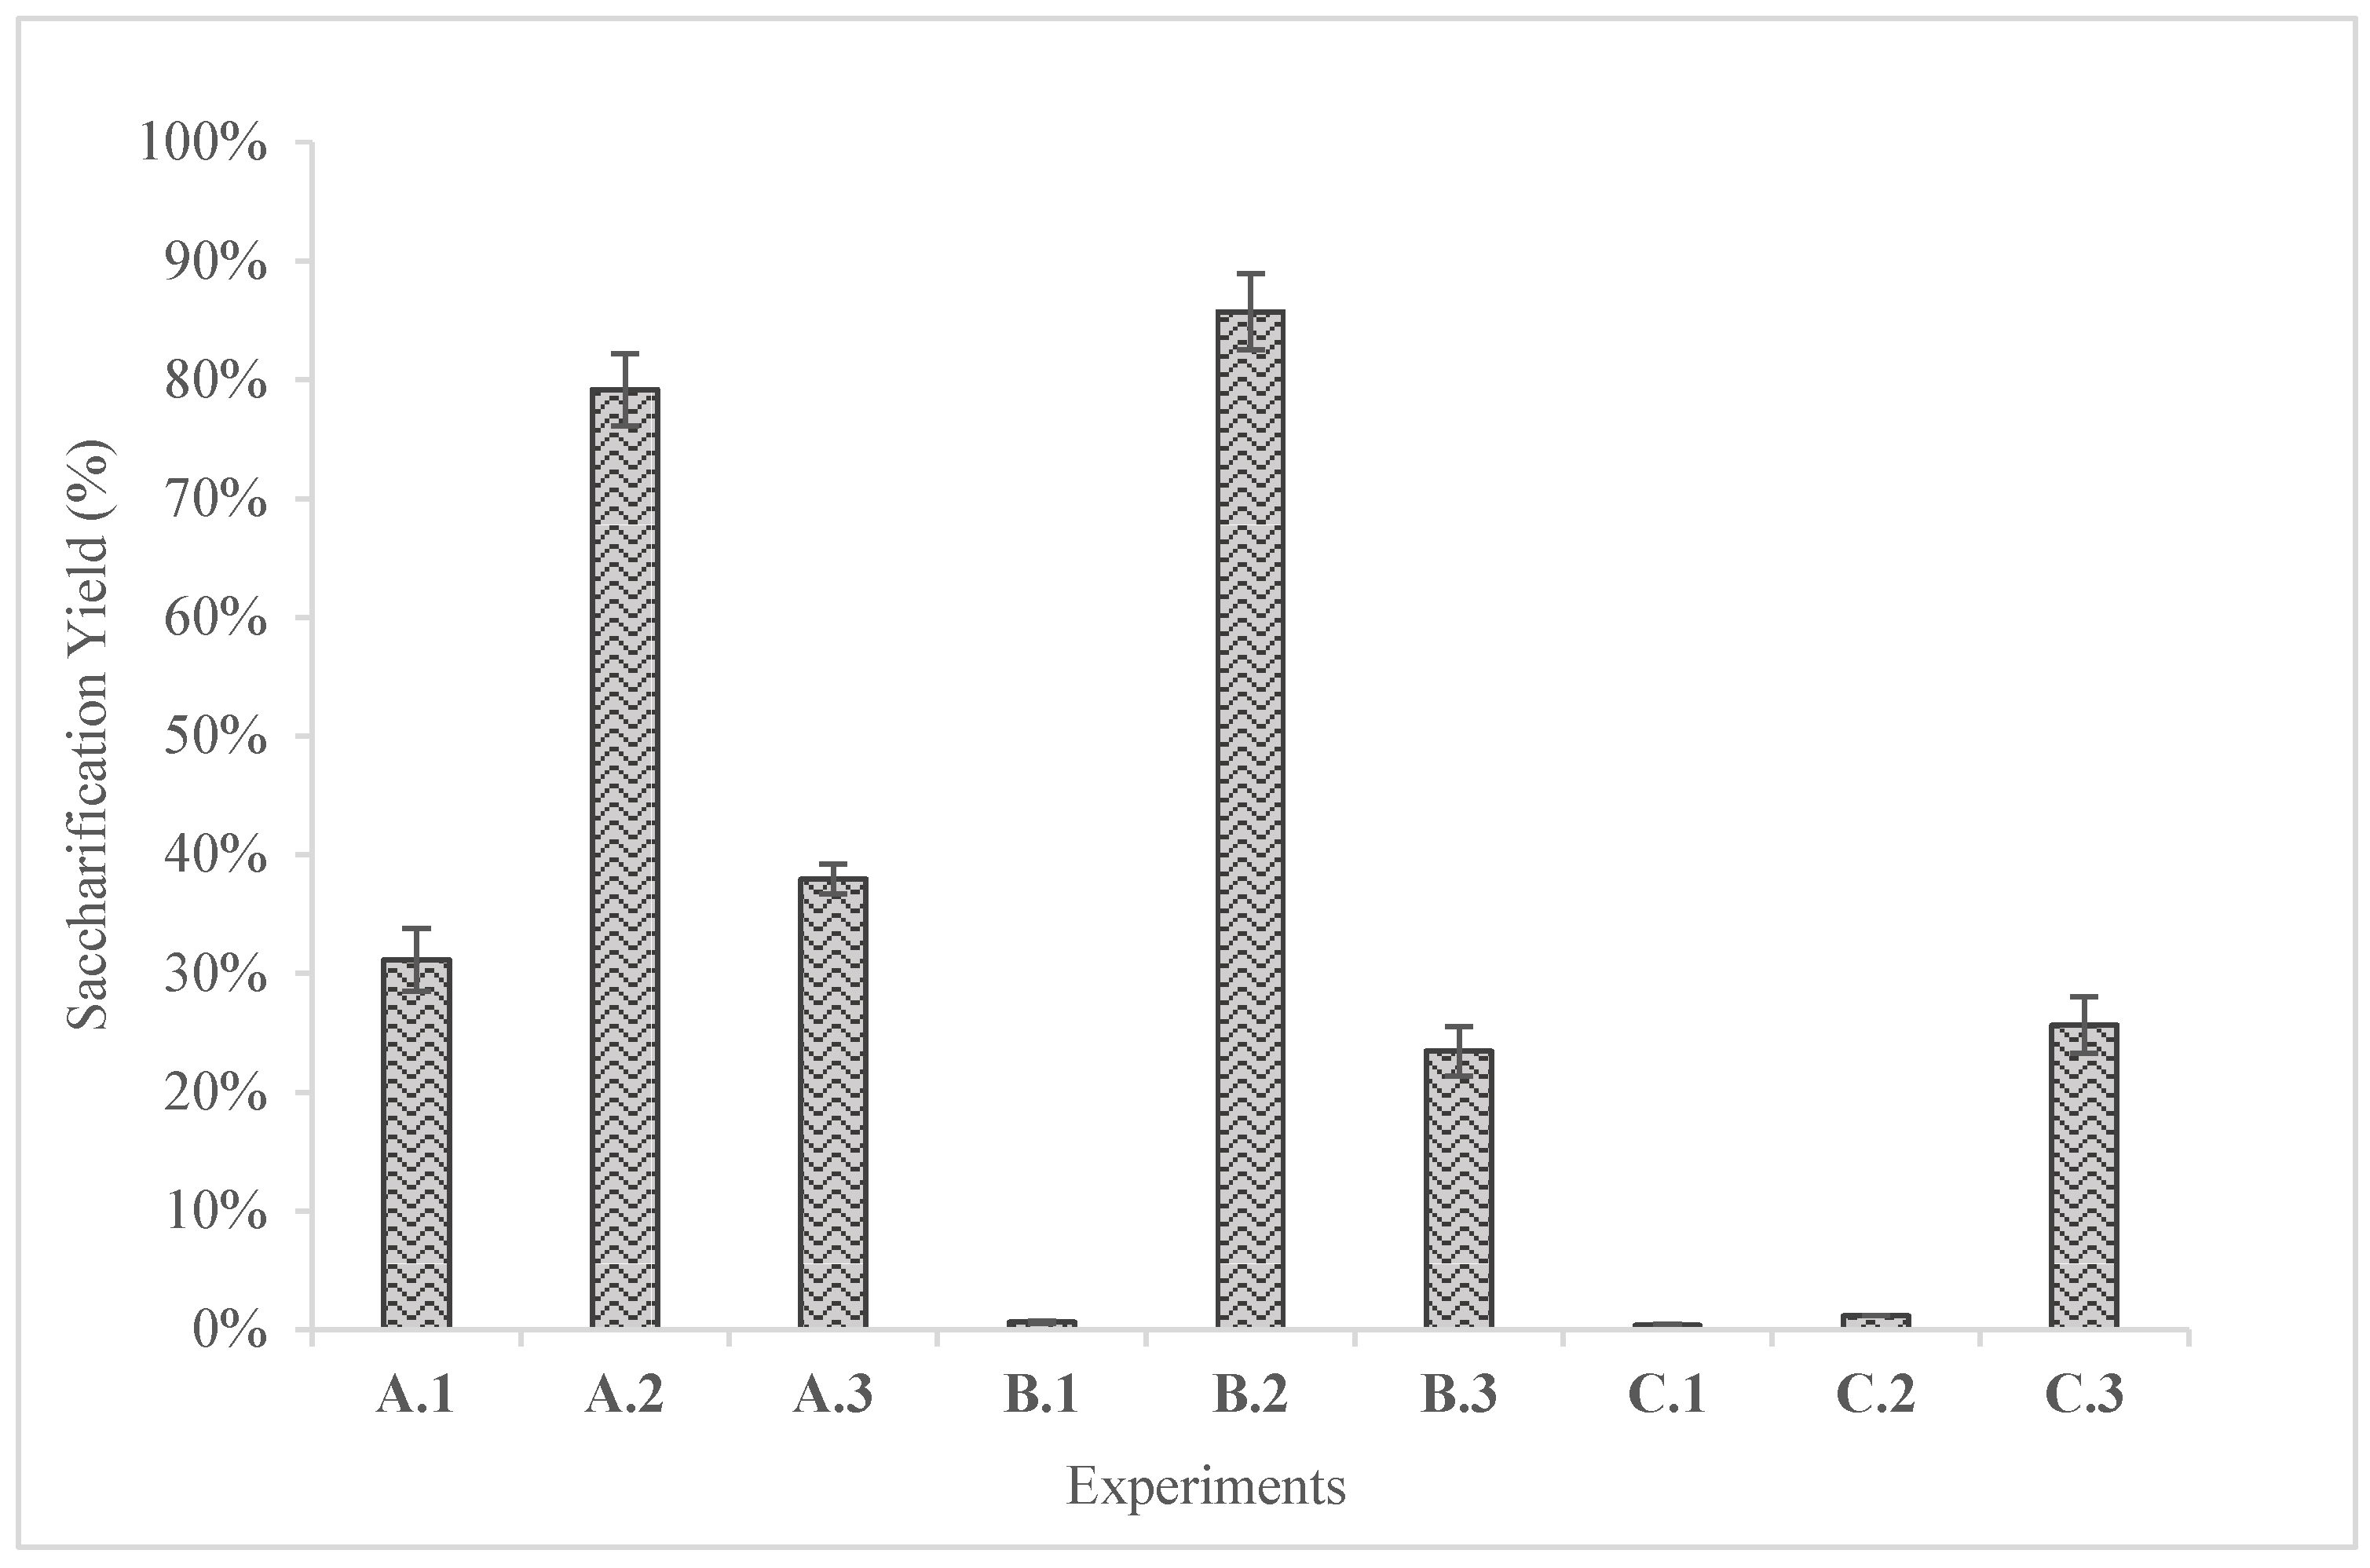
Figure 6.
Phenolic content after 72-hour enzymatic hydrolysis.
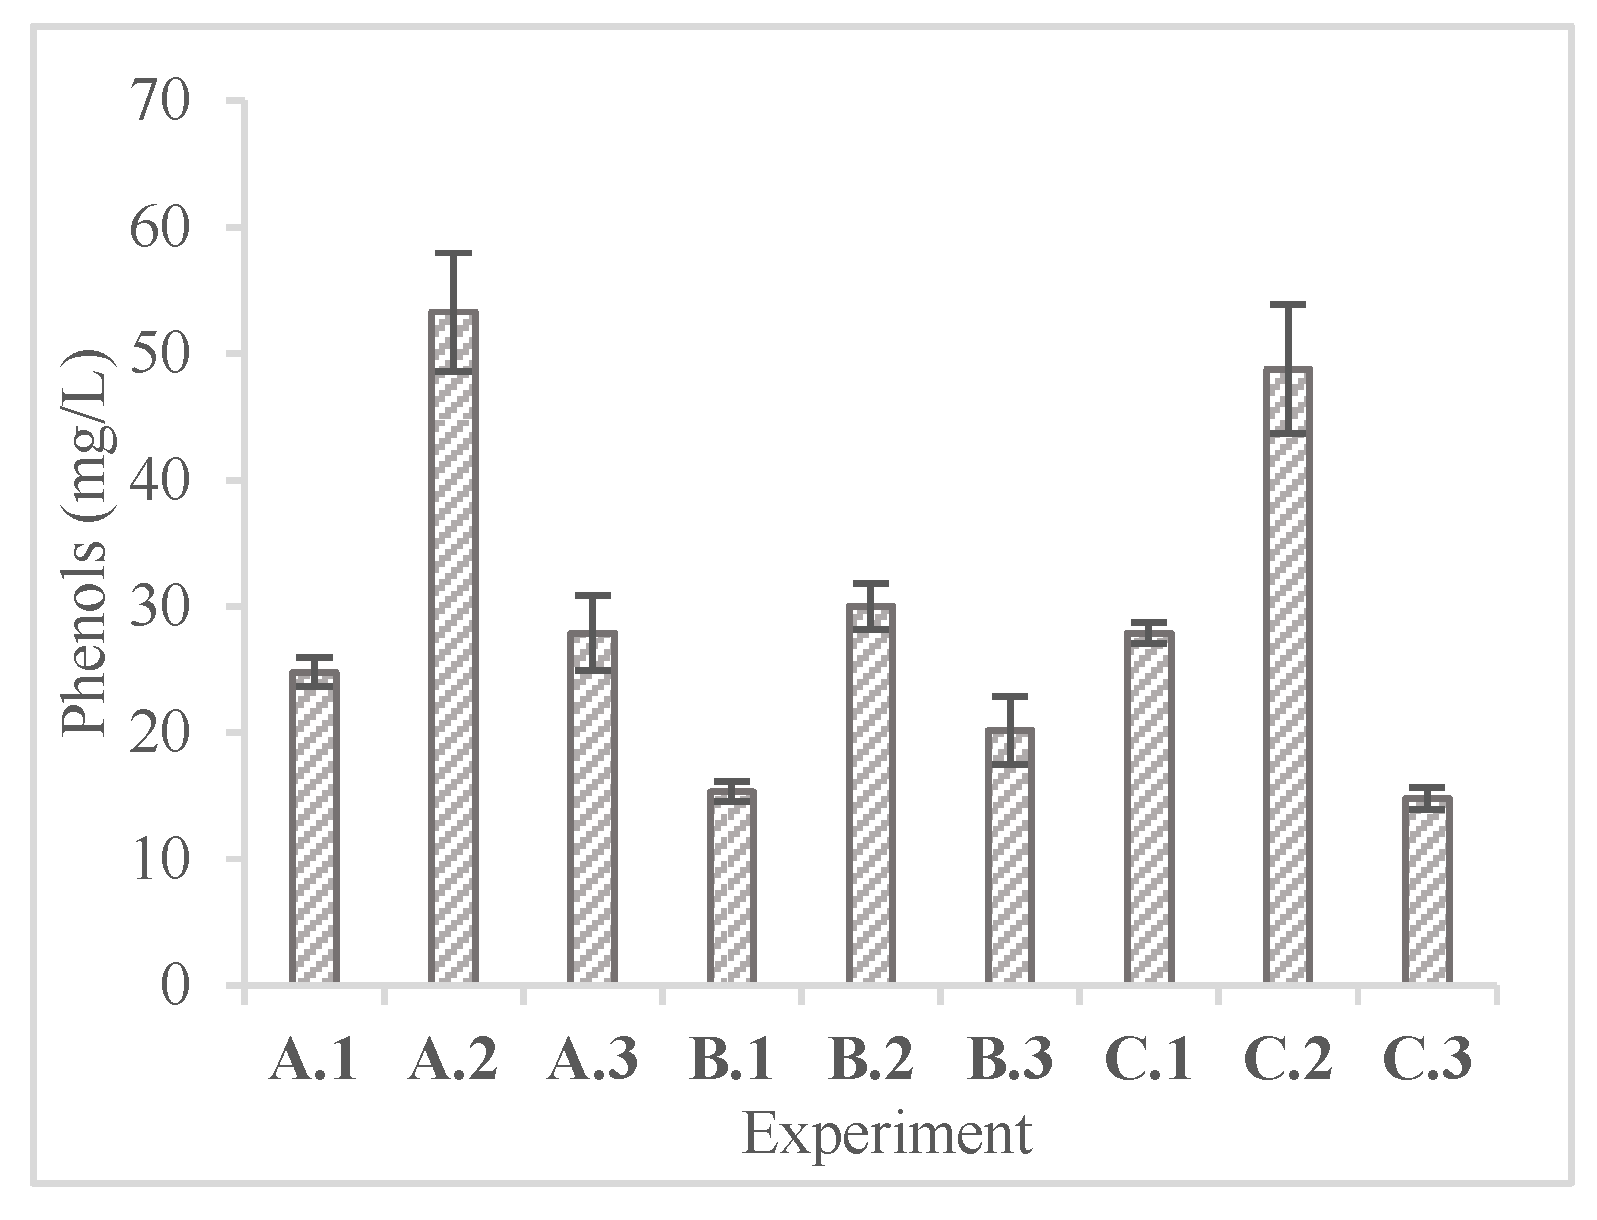
Figure 7.
Volatile Organic Acid concentration after 72-hour enzymatic hydrolysis.
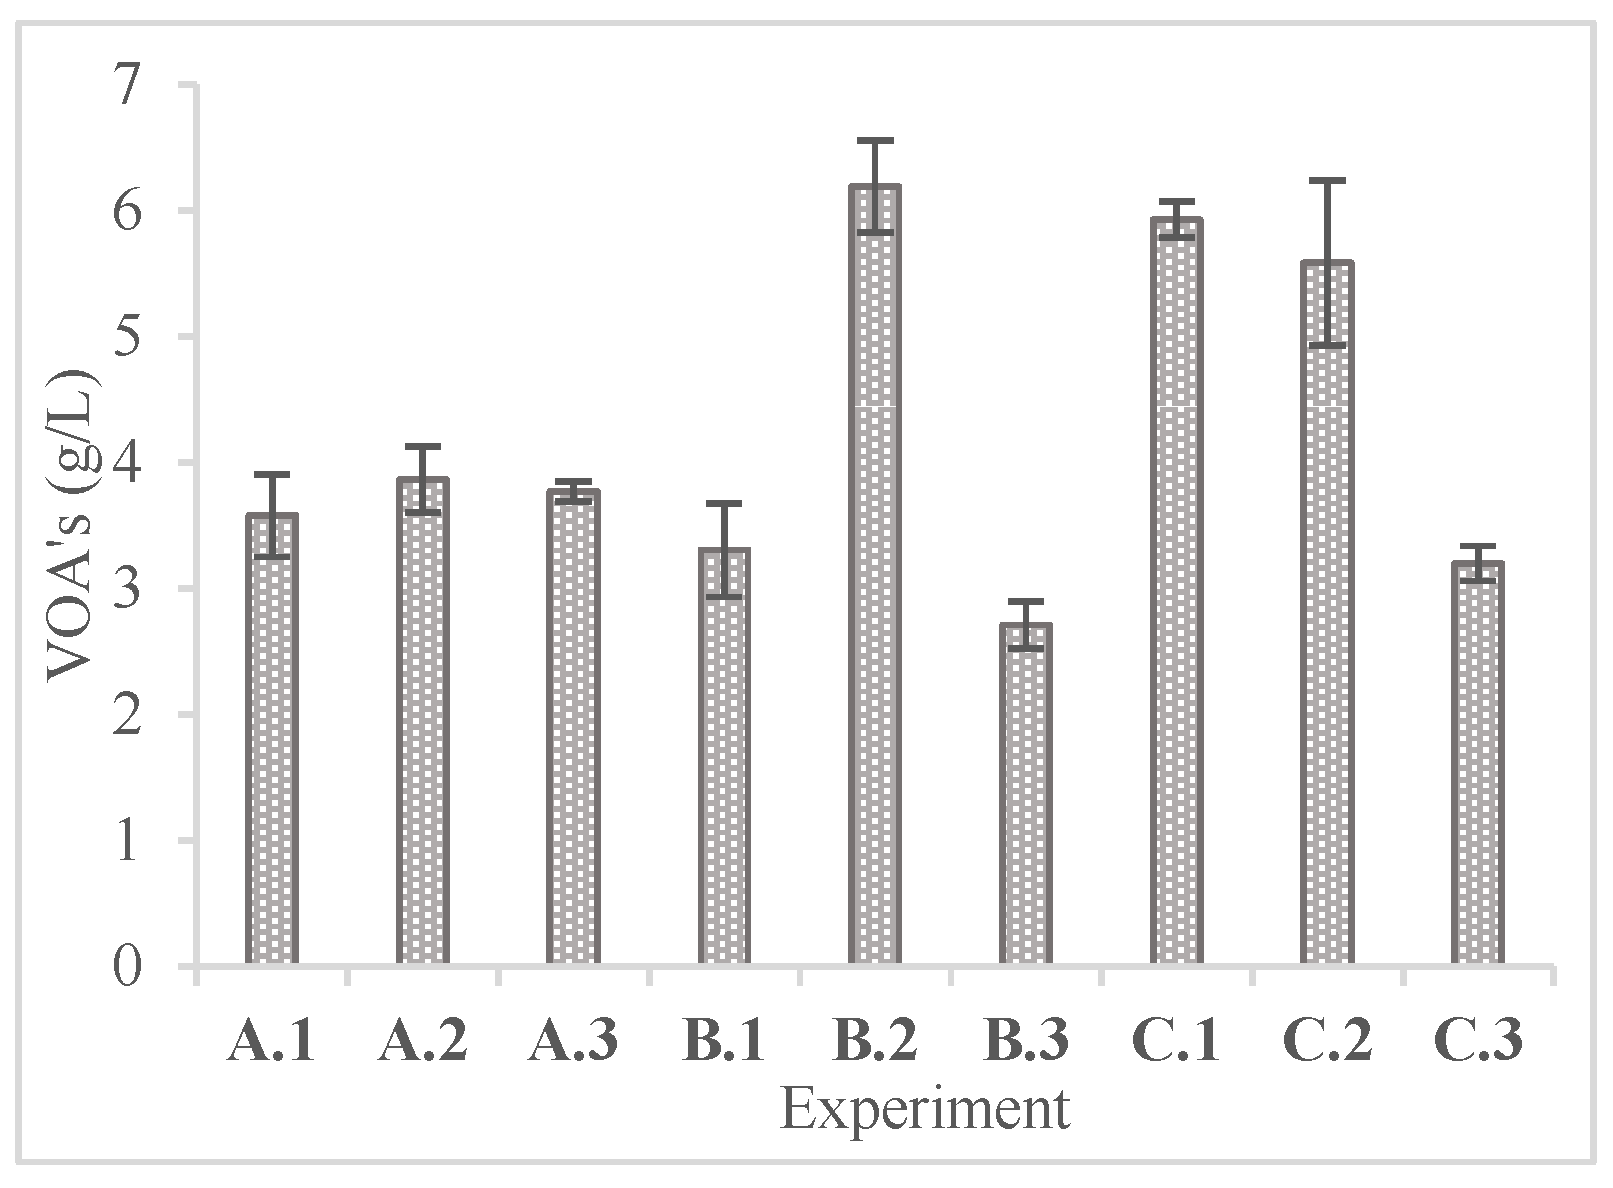
Figure 8.
Degradation of solid and major polysaccharides after enzymatic hydrolysis.
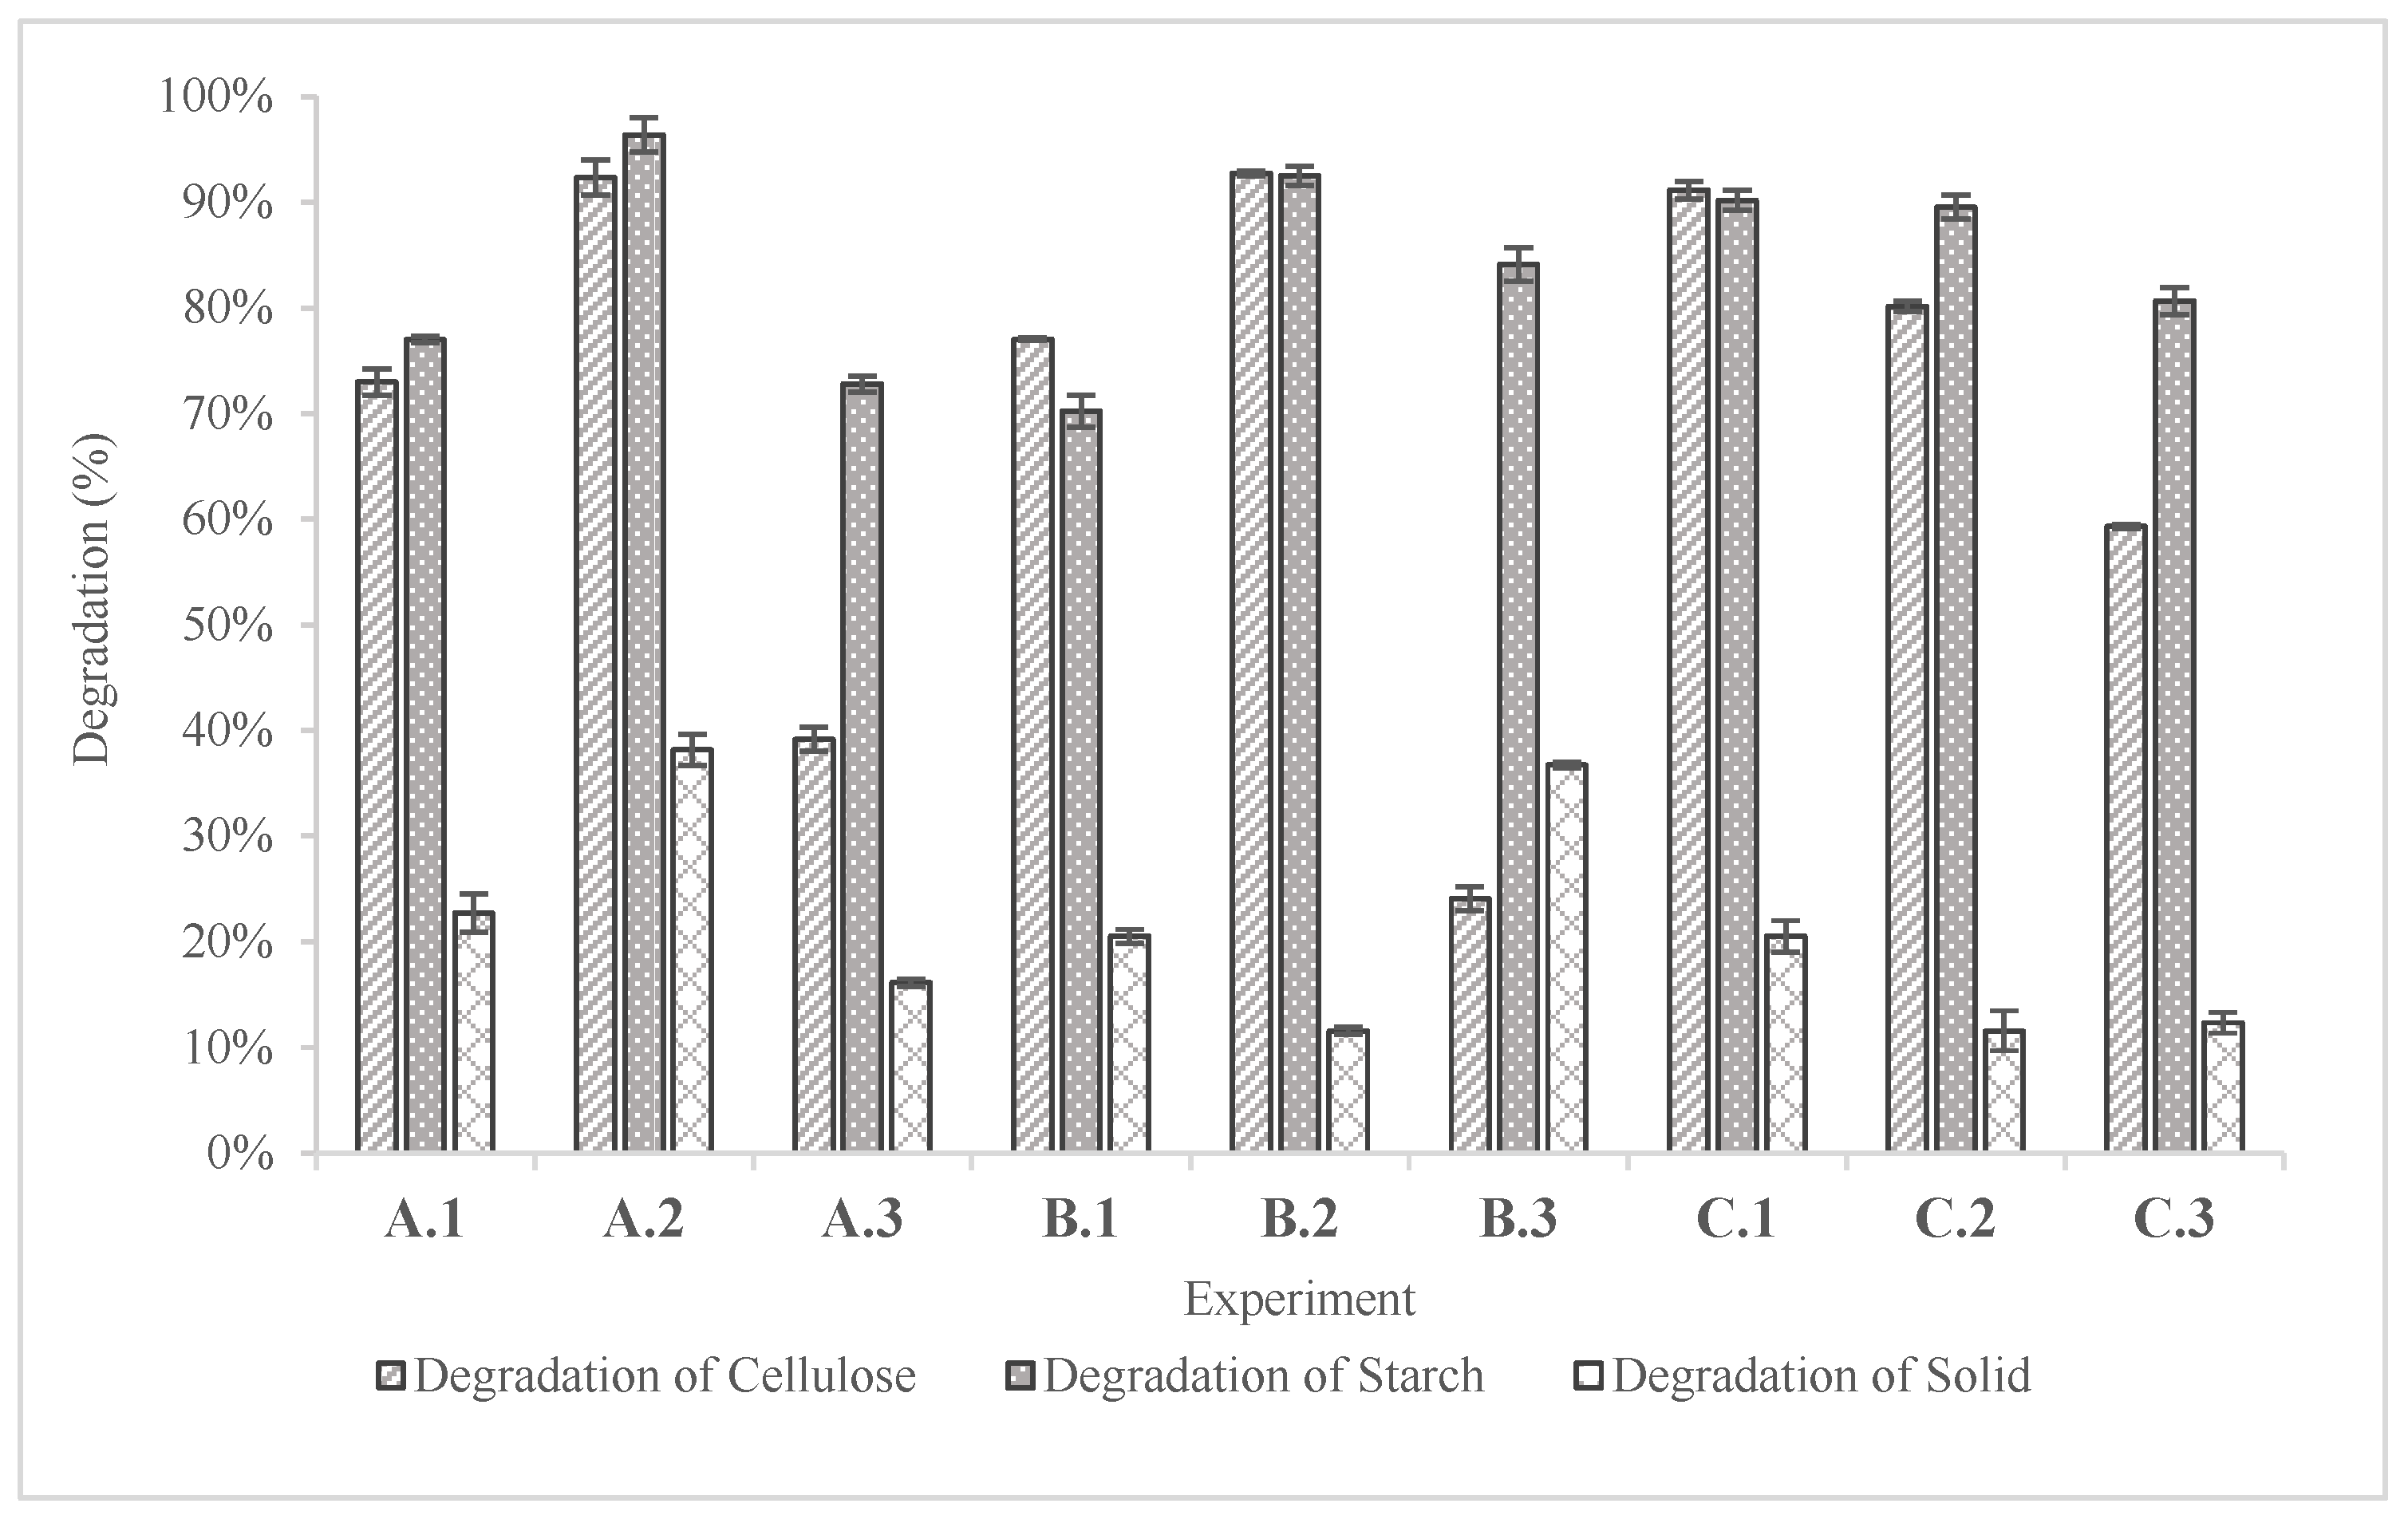
Figure 9.
Total produced biomethane from the BMP experiments.
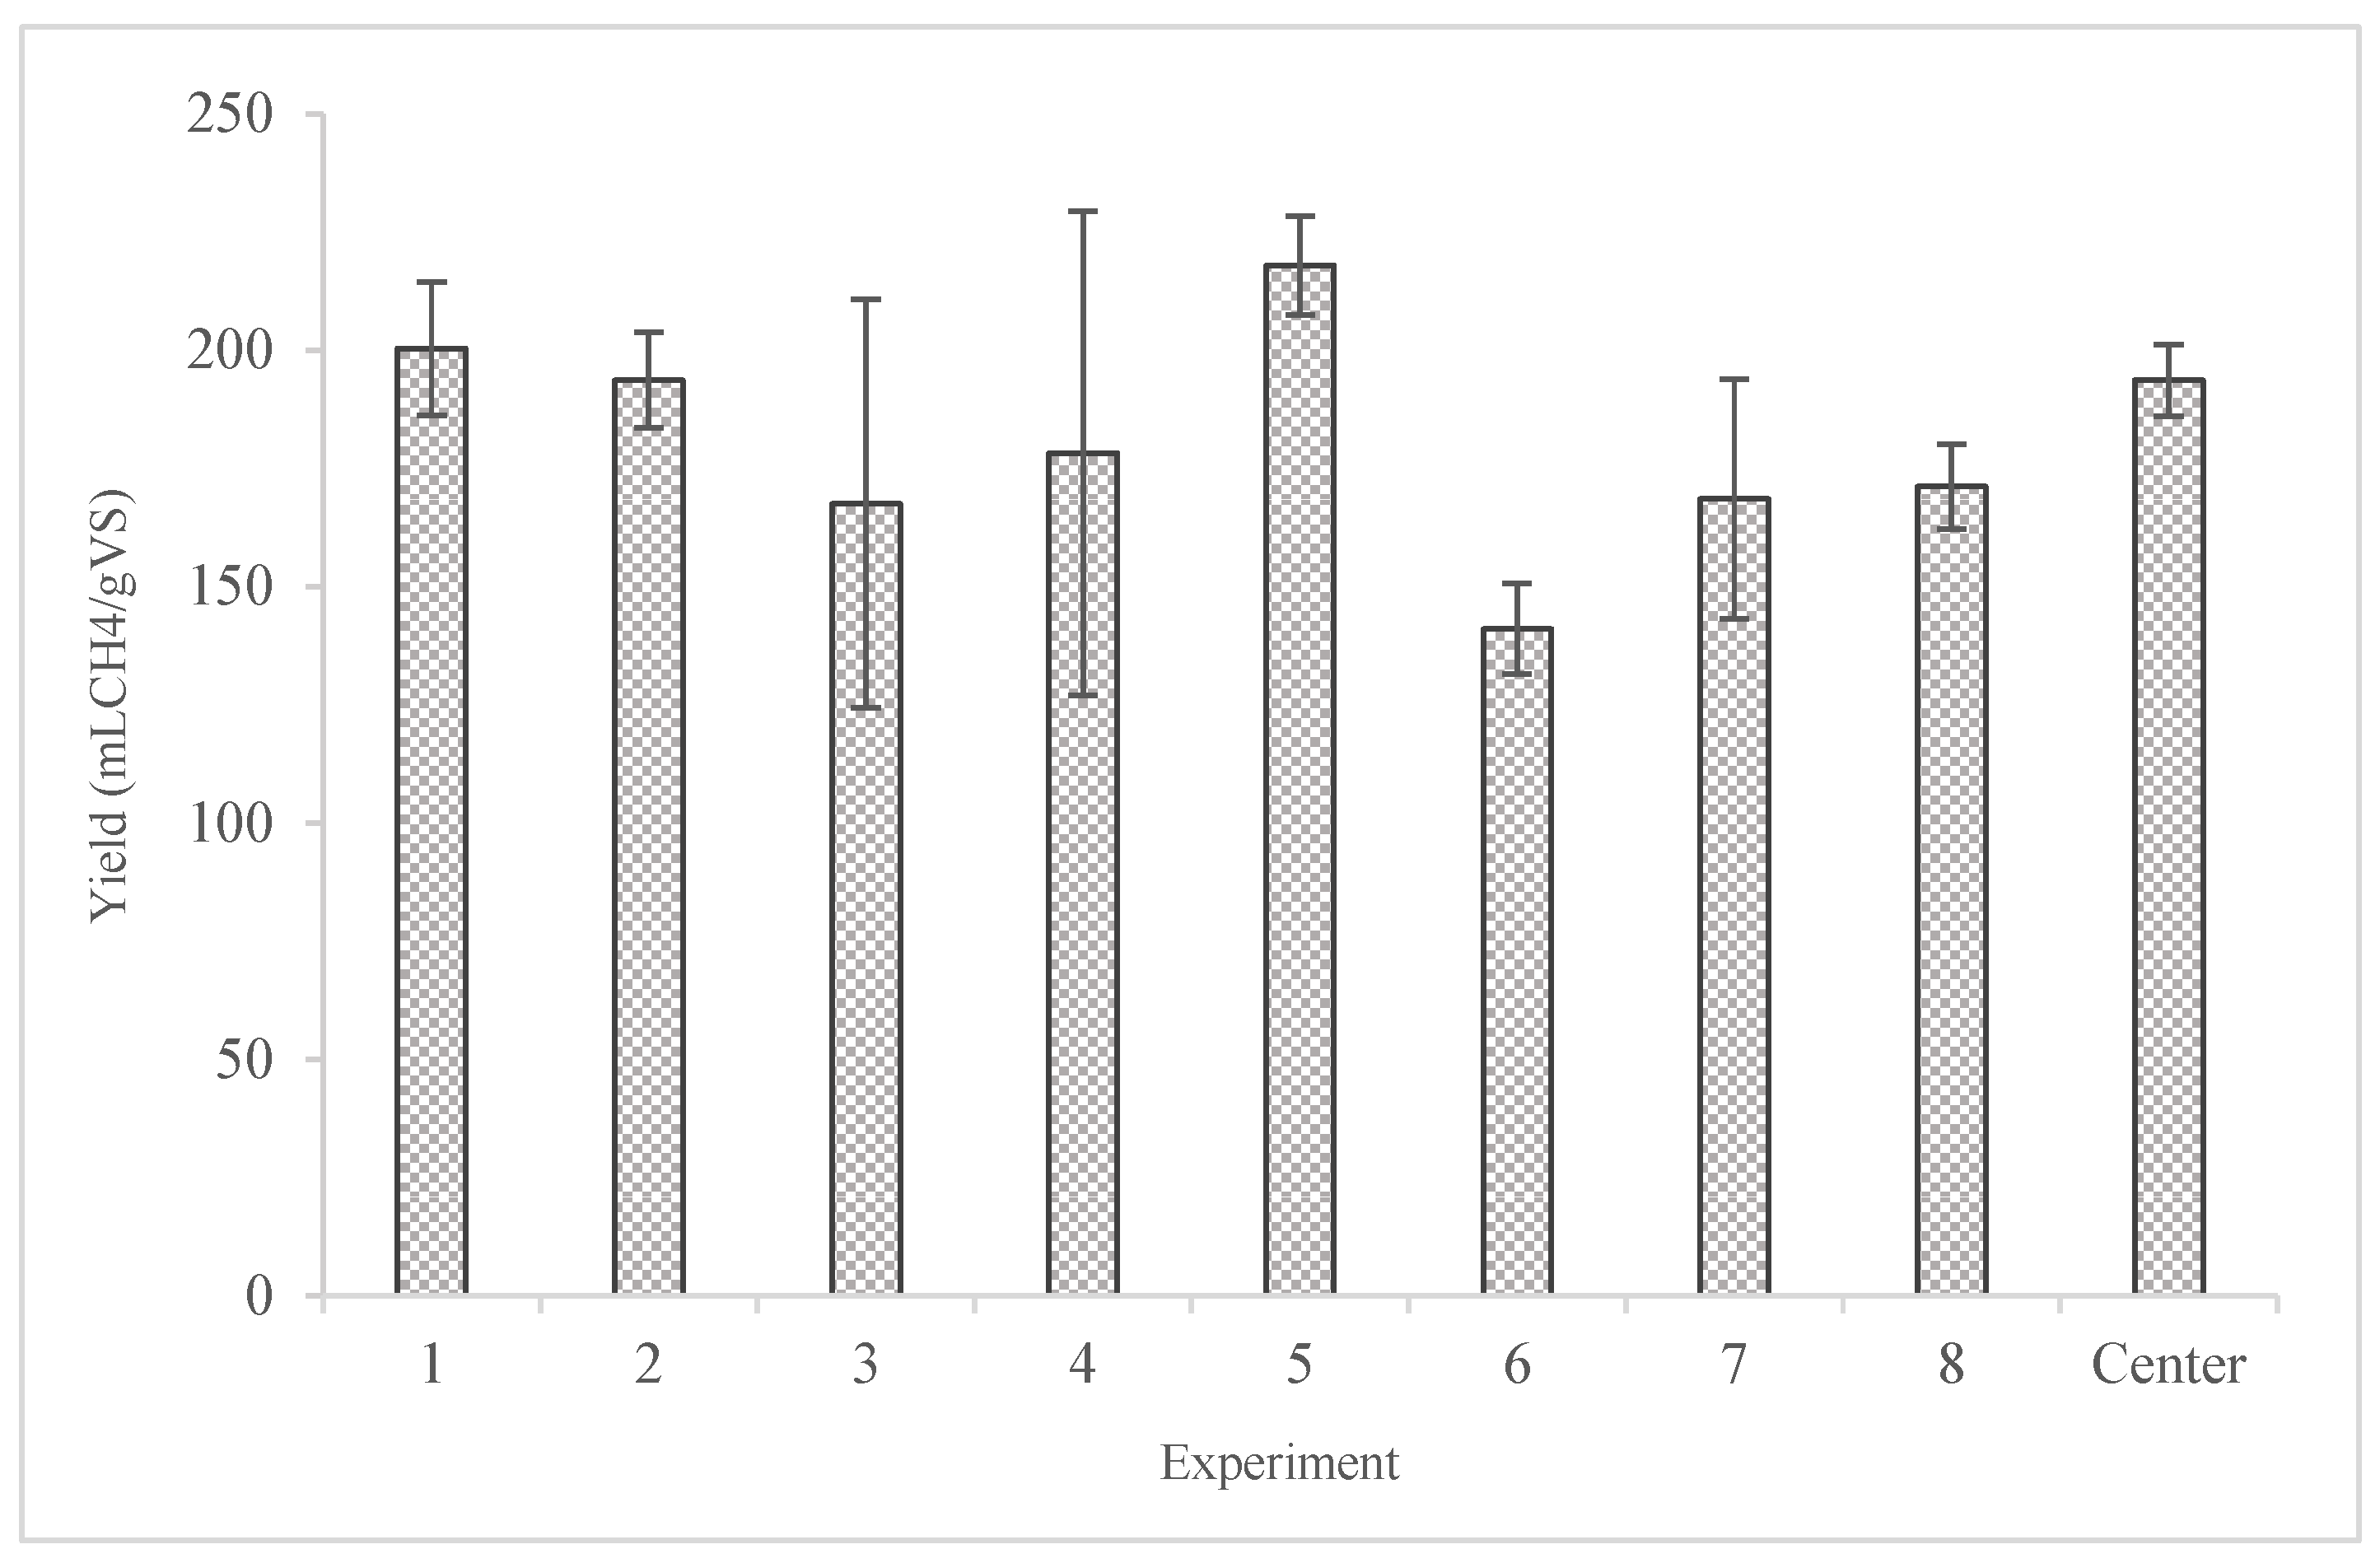
Figure 10.
Potential energy produced from ethanolic fermentation and biomethane.
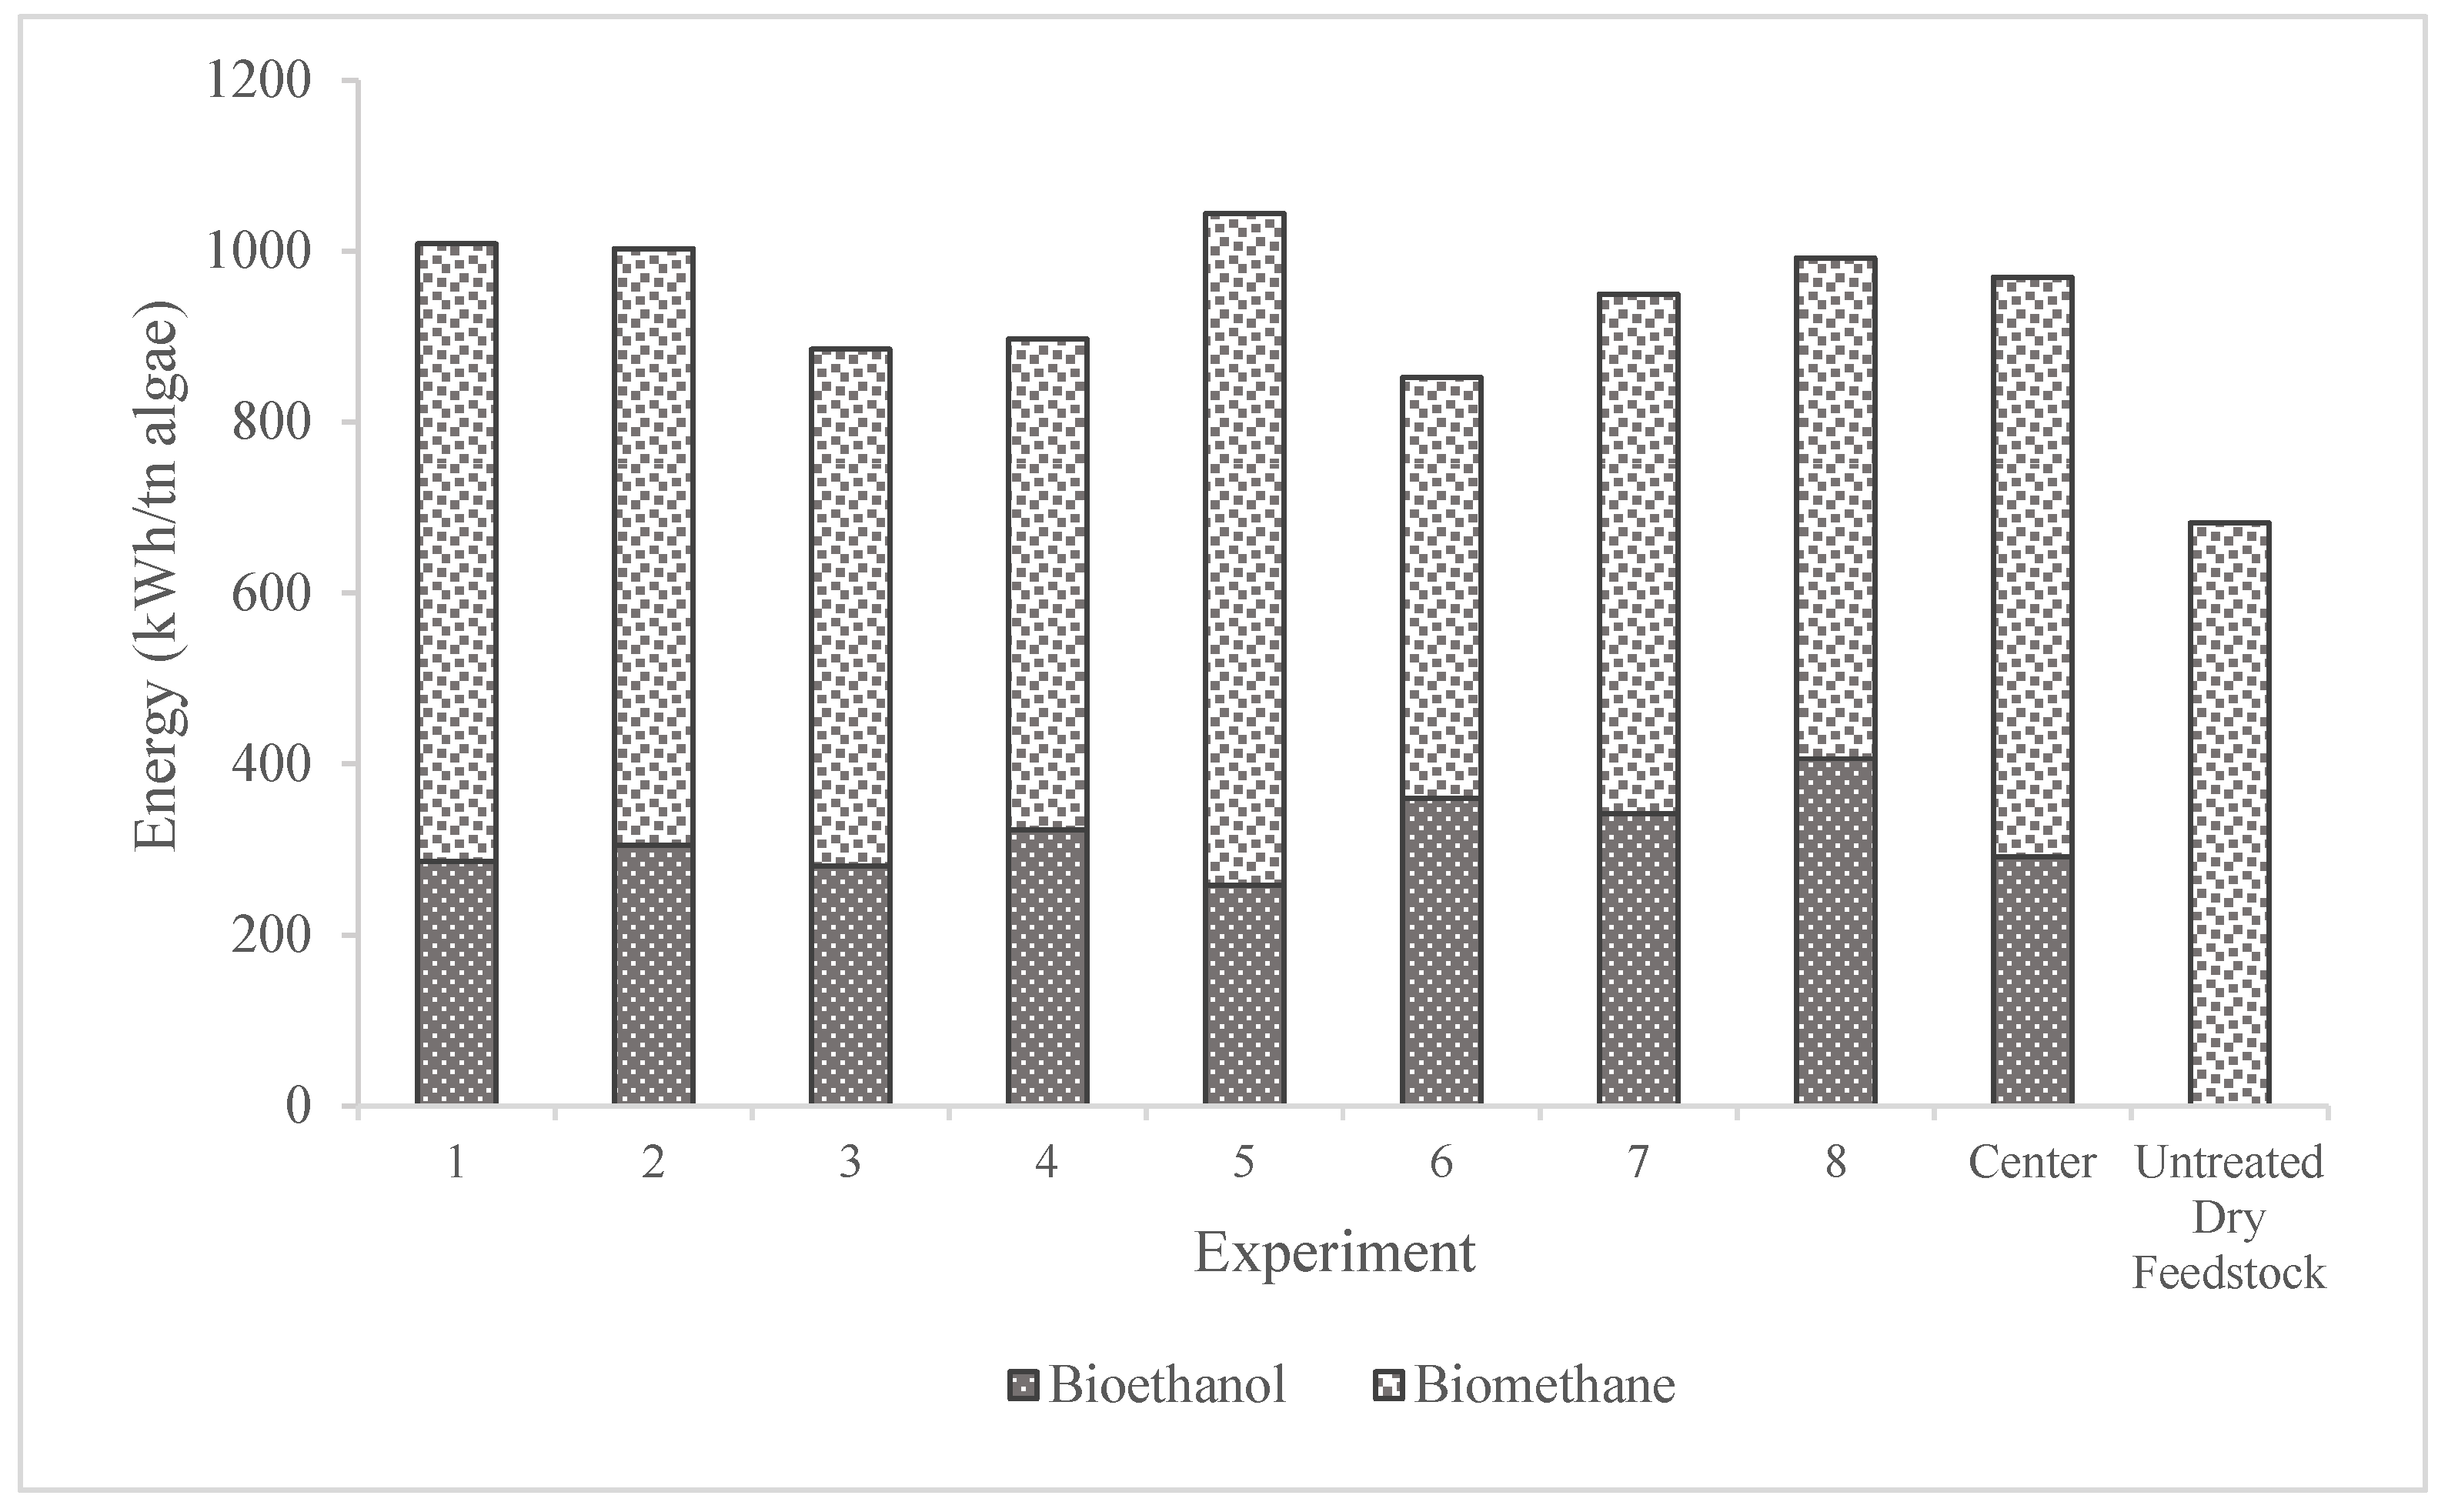

Table 1.
Conditions and solvents used for pretreatment step prior to enzymatic hydrolysis.
| Experiment | Conditions | Solvent |
|---|---|---|
| A.1 | Hydrothermal at 121oC for 30 minutes | Distilled H2O |
| A.2 | NaOH (0.2M) | |
| A.3 | H2SO4 (1% v/v) | |
| B.1 | Water bath at 90oC for 75 minutes | Distilled H2O |
| B.2 | NaOH (0.2M) | |
| B.3 | H2SO4 (1% v/v) | |
| C.1 | Ultrasonication at 150W for 10 minutes | Distilled H2O |
| C.2 | NaOH (0,2M) | |
| C.3 | H2SO4 (1% v/v) |
Table 2.
Composition of the received dried algal biomass.
| Parameter (% d.b.) | Feedstock |
| Total Solids | 91.96 ± 0.78 |
| Moisture | 8.04 ± 0.78 |
| Volatile Solids | 65.79 ± 0.66 |
| Ash | 34.21 ± 0.66 |
| Oils | 0.95 ± 0.00 |
| Water Soluble Solids | 12.25 ± 0.04 |
| Free Glucose | 0.08 ± 0.01 |
| Starch | 1.78 ± 0.16 |
| Cellulose | 9.21± 0.57 |
| Hemicellulose | 17.52 ± 1.21 |
| Acid Soluble Lignin | 1.07 ± 0.07 |
| Acid Insoluble Lignin | 26.72 ± 4.38 |
| Total Nitrogen (Kjeldahl) | 4.18 ± 0.10 |
Table 3.
Ethanol concentrations and ethanol yields after alkali pretreatment and 24h of SSF for dried algae biomass.
Table 3.
Ethanol concentrations and ethanol yields after alkali pretreatment and 24h of SSF for dried algae biomass.
| No. | Conditions | Liquid Phase after Fermentation | Yield | |||
| NaOH (M) | CellicTec3 (μL/gcellulose) |
Spirizyme Excel XHS (μL/gstarch) |
Ethanol Concentration (g/L) |
Glucose Concentration (g/L) |
Ethanol yield (%) | |
| 1 | 0.1 | 250 | 25 | 3.10 ± 0.42 | 0.08 ± 0.01 | 53.63 ± 7.35 |
| 2 | 0.1 | 750 | 25 | 3.30 ± 0.14 | 0.09 ± 0.01 | 57.09 ± 2.44 |
| 3 | 0.1 | 250 | 65 | 3.19 ± 1.42 | 0.13 ± 0.04 | 54.65 ± 2.84 |
| 4 | 0.1 | 750 | 65 | 3.58 ± 1.44 | 0.12 ± 0.03 | 61.26 ± 2.56 |
| 5 | 0.3 | 250 | 25 | 2.80 + 0.28 | 0.11 ± 0.00 | 48.43 ± 4.88 |
| 6 | 0.3 | 750 | 25 | 3.90 ± 0.14 | 0.11 ± 0.00 | 67.47 ± 2.45 |
| 7 | 0.3 | 250 | 65 | 3.70 ± 0.14 | 0.10 ± 0.00 | 64.00 ± 2.44 |
| 8 | 0.3 | 750 | 65 | 4.40 ± 0.28 | 0.10 ± 0.02 | 76.12 ± 4.90 |
| Center | 0.2 | 500 | 45 | 2.95 ± 0.25 | 0.06 ± 0.00 | 50.26 ± 4.96 |
Table 4.
Fractions of the total potentially produced energy.
| No. | Bioethanol | Biomethane | Total energy | Bioethanol (%) | Biomethane (%) |
| kWh/tn algae | |||||
| 1 | 286.14 | 722.68 | 1008.82 | 28.36 | 71.64 |
| 2 | 304.60 | 698.54 | 1003.14 | 30.36 | 69.64 |
| 3 | 280.70 | 604.46 | 885.16 | 31.71 | 68.29 |
| 4 | 323.22 | 574.20 | 897.42 | 36.02 | 63.98 |
| 5 | 258.39 | 786.08 | 1044.48 | 24.74 | 75.26 |
| 6 | 359.98 | 492.43 | 852.41 | 42.23 | 57.77 |
| 7 | 341.47 | 607.90 | 949.36 | 35.97 | 64.03 |
| 8 | 406.13 | 585.89 | 992.02 | 40.94 | 59.06 |
| Center | 290.94 | 678.70 | 969.64 | 30.01 | 69.99 |
Disclaimer/Publisher’s Note: The statements, opinions and data contained in all publications are solely those of the individual author(s) and contributor(s) and not of MDPI and/or the editor(s). MDPI and/or the editor(s) disclaim responsibility for any injury to people or property resulting from any ideas, methods, instructions or products referred to in the content. |
© 2024 by the authors. Licensee MDPI, Basel, Switzerland. This article is an open access article distributed under the terms and conditions of the Creative Commons Attribution (CC BY) license (http://creativecommons.org/licenses/by/4.0/).
Copyright: This open access article is published under a Creative Commons CC BY 4.0 license, which permit the free download, distribution, and reuse, provided that the author and preprint are cited in any reuse.


