
Submitted:
25 July 2025
Posted:
28 July 2025
You are already at the latest version
Abstract
Predicting absolute values of hemolysis using the power-law model to guide medical device design is hampered by uncertainties stemming from four sources of model inputs: incoming/upstream velocity profiles, blood viscosity model, power law hemolysis coefficients, and obtaining accurate stress exposure times. Amidst all these uncertainties, enabling rapid assessments and predictions of relative hemolysis would still be valuable towards evaluating device design prototypes. Towards achieving this objective, hemolysis data from Eulerian modeling framework was first generated from computational fluid dynamic simulations encompassing: five blood viscosity models, four sets of hemolysis power law coefficients, fully developed as well as developing velocity flow conditions, wide range of shear stresses (1 – 600 Pa), strain rates (1 – 10,000 s-1) and stress exposure times (5 – 400 milliseconds). Corresponding hemolysis predictions were also made in a Lagrangian framework via numerical integration of shear stress and residence time spatial variations under the assumption of fully developed Newtonian fluid flow. Absolute hemolysis predictions (from both frameworks) were proportional to each other and independent of the blood viscosity model. Further, relative hemolysis trends were not dependent on the hemolysis power law coefficients. However, accuracy in wall shear stresses in developing flow conditions are necessary for accurate relative hemolysis assessments.
Keywords:
hemolysis
; power law model
; non-Newtonian
; laminar
; uncertainty
1. Introduction
Hemolysis, the destruction of red blood cells (RBC) caused by non-physiological stresses in blood-contacting medical devices, is a major concern for patient safety. Exposure to low shear stress and long exposure time can substantially damage the red blood cells, leading to biochemical changes. Similarly, high shear stress but short exposure time can cause instantaneous rupture of the blood cells due to mechanical forces. Therefore, designing blood contacting devices that mitigate hemolysis through appropriate flow control strategies is of interest. In support of this effort, hemolysis of blood (a complex shear-thinning fluid) has been studied in geometries ranging from: straight capillary tubes [1] (cf. Figure 1a) to idealized benchmark geometries (that share many of the physical characteristics and features of a complex medical device) such as the generic Food and Drug Administration (FDA) benchmark nozzle model (cf. Figure 1b,c) [2,3,4,5].
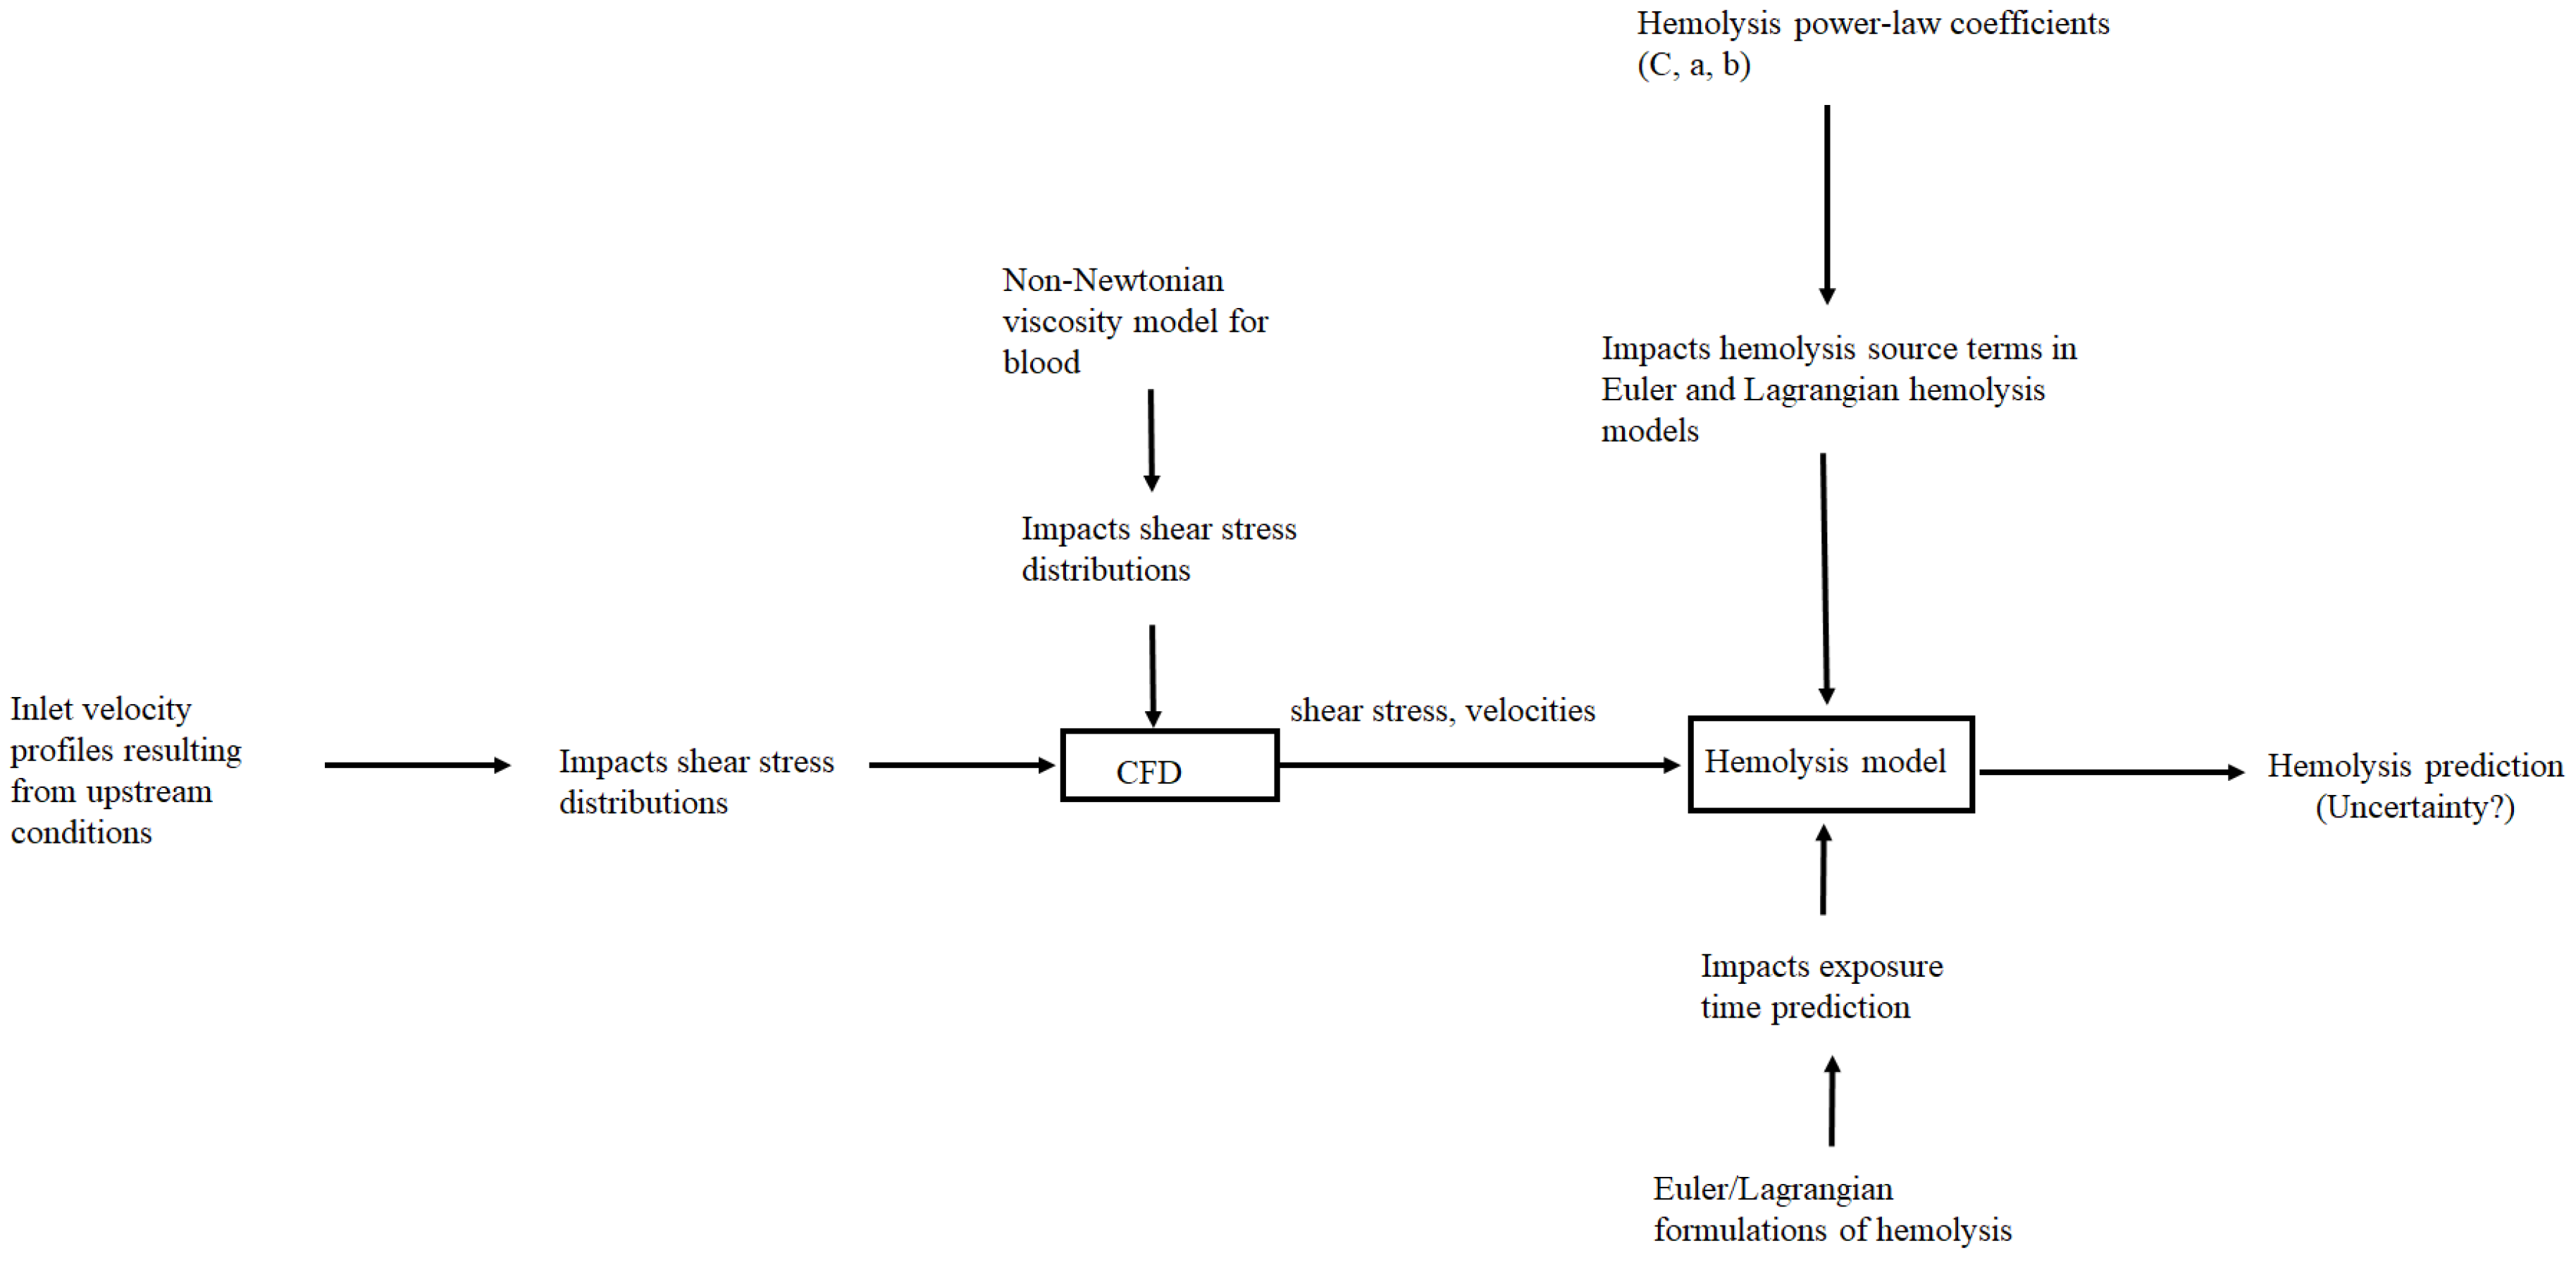
However, even after standardizing experimental protocols for generating benchmark measurement data, significant measurement and computational fluid dynamics (CFD) based prediction variability was observed in the data presented in inter-/multi-laboratory studies of these geometries [2,3,4,5]. Further, recent studies have assessed the universal applicability of the commonly employed hemolysis power law model (to quantify blood damage) [6] and even highlighted prediction variations resulting from implementing this model in Eulerian and Lagrangian frameworks [7]. Even by restricting ourselves to the laminar flow conditions associated with the geometries shows in Figure 1, the measured and predicted variabilities in flow and hemolysis characteristics appear to stem from four main sources of uncertainty shown in Figure 2. Amidst all these uncertainties, a recent conclusion regarding the practical (clinical) utility of hemolysis modeling appears to be that while current hemolysis modeling frameworks cannot predict the absolute values of hemolysis, it might be possible to predict their relative values in different flow and device configurations [6].
In light of this recent conclusion, the goal of this paper is to enable rapid assessments and predictions of relative hemolysis towards quickly evaluating device design prototypes. The investigated scenarios include: three flow configurations (cf. Figure 1) for investigating inlet velocity profile variability/uncertainty (well defined inlet velocities associated with fully developed flow conditions in the straight capillary tube to spatially varying incoming velocity profiles at the throat section of the FDA nozzle throat that is governed by the flow direction), five blood viscosity models (one Newtonian and four non-Newtonian models that are summarized in Table 1) for blood viscosity model uncertainty/sensitivities, four sets of hemolysis power law constants (Table 2) for power law coefficients uncertainty/sensitivities employed in both Eulerian/Lagrangian model framework uncertainties. We specifically restrict ourselves to laminar flow conditions for the following reasons: The average Reynolds number (Re) stays within the laminar regime in many anatomical regions within the human body [8]. Blood is a shear thinning fluid that approaches Newtonian behavior at high strain rates, therefore the effects of and differences between non-Newtonian models are expected to become more pronounced at the lower strain rates associated with laminar flow conditions. Furthermore, the impact of any turbulence modeling uncertainties on our predictions and conclusions is avoided. Also, the turbulent Reynolds stresses that are predicted in Reynolds Average Navier Stokes (RANS) turbulence modeling approaches do not directly correspond to the real mechanical or physical stress experienced by the RBC.
Figure 2.
Sources of uncertainty in hemolysis prediction under laminar flow conditions.
The specific contributions of this study regarding the four sources of uncertainties delineated above are:
1.1. Assessing Prediction Sensitivity to Inflow Velocity Profiles
The incoming velocity profile at the inlet of a medical device is governed by the upstream geometry. Experimental measurements showed that even at laminar conditions, for a throat Reynolds number (Ret) of 2000, the size and the velocity of the jet in the sudden expansion region downstream of the throat in the FDA nozzle (cf. Figure 1c) was very sensitive to the inflow (upstream) conditions [2]. Further, CFD predicted shear stress distributions (derived from velocity profiles), particularly the wall shear stress distributions also showed significant variations in laminar regimes [3,4]. This has particular relevance and impact for developing shear-induced blood damage models since not only are the shear stresses high in the near-wall region but the RBC exposure time is also high due to lower near-wall velocities. A medical device (Eg: a ventricular assist device) may also have very short (and/or curved) entrance and exit conduits, and an accurate inlet velocity profile specification may be necessary to capture the flow and hemolysis characteristics within the device accurately. Within the FDA nozzle, at identical Ret, the direction of flow (forward/reverse cf. Figure 1b and 1c) has been shown to have a significant impact on the hemolysis under turbulent conditions [5]. Hemolysis was exacerbated in the reverse flow direction (cf. Figure 1b) due to flow impingement when the geometry transitions from the sudden expansion section to the throat. However, the impact on flow direction under laminar conditions in the FDA geometry has not been assessed where most of the hemolysis is anticipated to occur at the throat [3,4].
Contribution #1 of this study: The first goal of this study is to assess the impact of this uncertainty/variations in upstream inlet velocity profiles on the relative hemolysis at the throat. This is undertaken by comparing CFD based hemolysis predictions in the bidirectional FDA nozzle for flow directions shown in Figure 1b,c using an Eulerian representation of the hemolysis power law model. Blood flow in the human body is pulsatile. However, temporal variations in inflow velocity profiles, are not considered here since pulsatile or time-dependent inflow boundary conditions have been shown to have a minimal impact on the time-averaged wall shear stress predictions within the FDA nozzle [12,13]. Therefore, only steady-state laminar flow simulations are performed in this study.
1.2. Prediction Sensitivity to Blood Viscosity Models
Blood is a shear-thinning fluid with significant viscosity variations at low shear rates. Different viscosity models have been proposed to model this behavior of blood and are summarized in Table 1. The shear thinning viscosity predicted by the different models are shown in Figure 3.
The significant variations in viscosity among the models observed at low strain rates (< 100 s-1) in Figure 3 implies that the choice of the viscosity model may significantly impact the velocity and shear stresses profiles and consequently hemolysis predictions at laminar flow conditions. Indeed, Trias et al. [14] observed up to 10% differences in velocity, pressure, and shear stress fields between Newtonian and non-Newtonian models (Casson, Carreau Yasuda) and a 17% difference in hemolysis predictions at Ret = 500 in the FDA nozzle geometry. Similarly, Good [13] analyzed Newtonian and non-Newtonian models (Casson and Carreau) under steady and pulsatile flows in the FDA nozzle, finding notable differences in recirculation patterns, pressure drop, and throat velocities, particularly at Ret = 500. Significant influence of viscosity models on wall shear stress and velocity distributions at Ret = 500 have been observed in other studies as well [15,16]. Our recent study showed significant prediction variations in blood damage (by nearly a factor of six) among the non-Newtonian models at Ret = 500 associated with forward flow in the bidirectional FDA nozzle (cf. Figure 1c) [17].
Contribution #2 of this study: Previous studies have confirmed that for laminar flow within the FDA nozzle, the regions of highest shear stress [3,4] and highest hemolysis rates occur at the throat at Ret < 2000 [14,17]. Previous studies have also shown that Non-Newtonian fluids have similar shear stress characteristics as Newtonian fluids [18] in round pipe geometries and fully developed flow conditions. Therefore, it is important to assess if the hemolysis prediction differences between Newtonian and Non-Newtonian fluids within the FDA nozzle observed previously [14,17] were only being exacerbated due to differences in the incoming velocity profiles that is a function of upstream geometry features. In order to delineate between the inlet velocity profile and viscosity effects, hemolysis predictions within the FDA nozzle employing different non-Newtonian models will be carried out for both flow directions (cf. Figure 1b and 1c). The impact of flow direction/inlet velocity profiles will then be individually assessed for each viscosity model. In addition, non-Newtonian models will be employed to predict hemolysis in the straight capillary tube (cf. Figure 1a) with well-defined fully developed velocity profiles imposed at the inlet to assess the impact of viscosity model alone on the hemolysis.
1.3. Prediction Sensitivity to Hemolysis Power-Law Constants
The relationship between flow-induced mechanical stress and red blood cell (RBC) damage are often expressed in terms of a hemolysis power law model where the blood damage index D is expressed as a function of shear stress (τ) and exposure time (t) as:
Where C, b and a are empirically derived coefficients generally obtained from measurements in Couette-type blood shearing devices with uniform-shear, laminar conditions and well-defined exposure times [11]. While D in Eq. 1 can be computed in a Lagrangian framework by tracking τ and t along multiple pathlines/streamlines and obtaining a mass-weighted summation/average, a corresponding Eulerian representation of Eq. (1) is obtained by solving a scalar transport equation for the time-linearized damage field De as:
Where the dependency on the exposure time (which is not directly available in an Eulerian framework) is built into the time linearized blood damage index De as De = D1/a. The erroneous approximations associated with generalizing this approach in simple geometries has been discussed by Faghih et al. [7] especially when there are large regions of flow acceleration and recirculation. The Eulerian and Lagrangian approximations are also compared in this study in the context of relative hemolysis predictions in the more complex bidirectional FDA nozzle. The constants of Giersiepen et al. [10] were used by Trias et al [14] and Krishnamoorthy and Gholizadeh [17] to assess damage due to Non-Newtonian flows in the FDA nozzle and are also used in the FDA nozzle simulations in this study. Device specific coefficients for the Kameneva et al. [1] geometry were derived by Craven et al. [11] but were expressed in terms of the parametric variable ξ (with 0 ≤ ξ ≥ 1) and are used in the capillary tube portion of this study for ξ values of 0.5, 0.75 and 1.0 respectively. Just to give a sense of the magnitude of absolute hemolysis variability resulting from the use of these constants, the source term of Eq. 2 is shown in Figure 4 as a function of shear stress for the hemolysis constants employed in this study. A three orders of magnitude variation is seen across the range of shear stresses (< 600 Pa) associated with this study.
Contribution #3 of this study: The fact that hemolysis power-law constants obtained from blood shearing devices are device specific as well as blood sample specific has been well recognized [6,11]. Furthermore, given the wide variations in the source term magnitude shown in Figure 4, there is now consensus that the absolute values of hemolysis cannot be predicted accurately using the power-law formulation in the absence of device and blood sample specific coefficients. Given this shortcoming, this study explores the ability to predict relative hemolysis (as a function of shear stress or Re) in the straight capillary tube geometry (cf. Figure 1a) for different choice of power law coefficients (Table 2). The simulations are carried out employing all of the viscosity models (Table 1) and the relative hemolysis rates (i.e., absolute hemolysis versus shear stress variations) assessed. In addition, fully developed velocity profiles are maintained at the inlet thereby enabling us to delineate the effects of hemolysis power law coefficient variations alone.
1.4. Prediction Sensitivity to Eulerian and Lagrangian Formulations of the Hemolysis Power-Law
The fact that Eulerian representation results in erroneous residence time when there is flow acceleration or recirculation has been well recognized [7]. However, it may be difficult to obtain a converged solution using the Lagrangian formulation due to the need to generate an adequate number of pathlines within a complex device geometry. In lieu of this, an analytical solution to blood damage index will be estimated via numerical integration of shear stress and residence time spatial variations under the assumption of fully developed Newtonian fluid flow. The absolute hemolysis values in both Eulerian and this simplified Lagrangian framework are compared and their ability to predict relative hemolysis rates assessed.
Contribution #4 of this study: Recent studies [7] have suggested that due to the erroneous treatment of residence time in the Eulerian formulation (resulting from flow acceleration) may necessitate the formulation/deduction of separate sets of coefficients for each (Eulerian/Lagrangian) formulation, our goal is to explore if this requirement may be alleviated for relative hemolysis assessments.
2. Methods
The steady-state computational fluid dynamics (CFD) simulations were carried out using ANSYS FLUENT [18]. The incompressible Navier-Stokes equations (Eqs. 3 and 4) were used to calculate velocity profiles. The steady state mass conservation equation shown in Eq. 3 was used in conjunction with the momentum conservation equation (Eq. 4) for carrying out the calculations.
In Eq. (3), and represent the density and velocity vector, respectively.
where is the stress tensor, the static pressure and the direction of the gravitational component. The stress tensor is evaluated as:
where μ is the molecular viscosity, I is the unit tensor, and the second term on the right hand side is the effect of volume dilation. The pressure velocity coupling associated with Equations (3) and (4) was handled using the SIMPLE scheme and the gradients were evaluated using the Lease-Square Cell Based option. The various non-Newtonian viscosity models shown in Table 1 were implemented as user-defined-functions in ANSYS FLUENT [18] to compute μ.
The source term for the scalar transport equation for hemolysis prediction in the Eulerian framework listed previously (cf. Eq. 2) was also implemented as a user-defined-function. Hemolysis predictions in the Lagrangian framework were made via numerical integration of shear stress and residence time spatial variations under the assumption of fully developed Newtonian fluid flow. Under these conditions, the radial (r) variations in velocity (v) and shear stress (τ) for a circular pipe of radius R are represented as:
The pressure gradient (ΔP/L) (where L is the flow length) in Eqs. 6 and 7 can be expressed as a function of Reynolds number (Re) and average inlet velocity (vavg) as [19]:
The stress exposure time t can also be computed based on L and Eq. 6 as:
The radial variations in shear stress and residence time based on Eqs. 7 and 9 can be employed to compute the radial variations in blood damage D in the power law model as:
Finally, given the assumption of constant density, the blood damage at the outlet in the Lagrangian reference frame can be obtained by integrating across the cross sectional area A as:
3. Results and Discussion
3.1. Mesh Convergence and Velocity Profiles
Under fully-developed laminar flow conditions for Newtonian fluids, the Darcy friction factor (fD) has been shown to be equal to 64/Re [19]. Therefore, mesh convergence in the capillary geometry was ensured by predicting the pressure drop and shear stresses at fully developed flow conditions and comparing the predictions against theoretical values [19]. This is shown in Figure 5. It is interesting to see that the results from the Casson model that shows the most deviation from Newtonian behavior at low strain rate conditions (cf. Figure 3) also results in similar fD as Newtonian fluids in this geometry. This is aligned with previous measurements involving Non-Newtonian fluids [20].
Mesh convergence in the FDA nozzle for the reverse flow direction (Figure 1b) was evaluated for Reynolds numbers 125, 500, and 2000 by modeling blood as a Newtonian fluid and progressively refining the mesh with element counts of 231K, 439K, and 966K. Key solution parameters, including velocity profiles, were monitored to assess sensitivity to mesh density. Refinement was continued until further increases in element count resulted in negligible changes, indicating that the solution reflected the physical behavior rather than mesh-dependent artifacts. As illustrated in Figure 6 (a-f), the velocity profiles corresponding to different mesh densities overlap almost entirely. This overlap demonstrates that the numerical results remain consistent and are independent of further mesh refinement at the tested Reynolds numbers. The convergence analysis confirms that increasing the mesh density from 231K to 966K elements does not significantly alter the velocity profiles, indicating that mesh convergence has been achieved. This ensures the reliability and accuracy of the numerical solution for subsequent analysis, as the results are no longer influenced by discretization errors. Mesh convergence on this identical 966K mesh albeit for the forward flow direction (Figure 1c) has been demonstrated in our previous publication [17].
Figure 7 illustrates variations in axial velocity predictions using both Newtonian and non-Newtonian models under reverse flow conditions along the monitor locations shown in Figure 1b. At low Reynold’s Numbers, there are distinct differences in the velocity profiles predicted by the different viscosity models. At an axial location of Z = 0.088, the highest peak velocities are predicted by the Newtonian model. This was expected since Newtonian fluids do not account for shear-thinning behavior of the fluid whereas prediction differences from the Non-Newtonian models result from their unique treatment of viscosity dependencies on shear rates (cf. Table 1). The Casson, Cross and Power Law models predict the lowest velocities at this axial location at Re 125 resulting from the highest viscosity predicted by these models at low strain rates (cf. Figure 3). However, differences between the models reduce at higher Re when convection starts to dominate momentum diffusion. At an axial location of Z = 0 corresponding to the throat inlet, a nearly uniform velocity profile is obtained across all scenarios (Re, viscosity models). Furthermore, the throat length (0.04 m) is smaller than 0.05ReD which is the minimum requirement for achieving fully developed flow at Re 500, 2000. This will have implications when hemolysis predictions in the Eulerian framework are compared against those in the simplified Lagrangian framework (Eq. 11) where a fully developed velocity profile has been assumed.
Under laminar flow conditions within the FDA geometry, previous studies have shown that most of the hemolysis occurs due to the high shear stresses at the throat [14,17]. This was confirmed in this study as well, where nearly 80% of the hemolysis was found to occur due to the high shear stresses at the throat wall for both flow directions. Consequently, the average shear stress at the throat wall was employed to compute the Darcy friction factor (fD) as per Eq. 12 and the results are compared against the theoretical value of 64/Re associated with fully developed flow condition in Figure 8.
Due to steeper velocity gradients at the throat inlet in comparison to the fully developed velocity profile (Figure 7 a, c, e), the fD values for most of the scenarios are a factor of 2-3 higher than the theoretical value.
3.2. Hemolysis Assessments
In Figure 9, the absolute values of the blood damage index (D) (cf. Eqs. 2 and 11) are shown for the capillary tube geometry. The predictions from the Lagrangian model were scaled (by numbers shown in the legend) to enable representation on the same graph for relative hemolysis predictions. While the absolute values of D are sensitive to the hemolysis coefficients (cf. Table 3) employed in the simulations, the relative hemolysis variations show the same trends. Further, when fully developed flow conditions persist throughout the capillary tube geometry, absolute hemolysis predictions (in both Eulerian and Lagrangian formulations) remain proportional to each other and are independent of the blood viscosity model or the hemolysis power law coefficients. However, the value of the proportionality constant (the number to which the Lagrangian values are scaled as indicated in the legends) are specific to the power law coefficients employed in the analysis. The value of the proportionality constant are also different for the Newtonian (Figure 9a) and Casson viscosity models (Figure 9b). However, the relative variations are independent of the viscosity model as shown in Figure 9c. While recent studies [7] have suggested that due to the erroneous treatment of residence time in the Eulerian formulation (resulting from flow acceleration, recirculation) may necessitate the formulation/deduction of separate sets of coefficients for each (Eulerian/Lagrangian) formulation, the results from this study suggest that this requirement may be alleviated for relative hemolysis assessments in simple geometries when the conditions of fully developed flow are present, since Eulerian and Lagrangian absolute hemolysis predictions are simply proportional to each other. Also, considering the challenges with obtaining a converged solution to relative hemolysis in the Lagrangian framework as mentioned previously (i.e., generating an adequate number of flow pathlines), these results suggest that under conditions of fully developed flow the Eulerian framework may still be employed for relative hemolysis assessments irrespective of the hemolysis power law or viscosity model employed.
The absolute values of the blood damage index predicted by the Eulerian framework (cf. Eq. 2) across the throat of the FDA nozzle geometry is shown in Figure 10. First, except for the Casson model, the absolute hemolysis predictions are relatively insensitive to the viscosity model employed. Second, in contrast to previous studies [5], the forward flow direction (cf. Figure 1c) results in higher blood damage than reverse flow with the impact of flow direction becoming more significant at higher Reynolds numbers. This may be attributed to the differences in velocity profiles across the throat section for the two scenarios. Although the incoming throat velocity are nearly uniform across all Re (cf. Figure 7a, c, and e), the flow becomes fully developed after a throat length of 0.025 m (0.05ReD) at Re 125. Consequently, the blood damage index results are relatively insensitive (less than 1% variation) to the flow direction at Re 125. However, as Re increases, the entrance length for fully developed flow increases and the differences in the velocity profiles resulting from the flow direction, contributes towards increasing difference in blood damage index. This is confirmed in Figure 11 where the average wall shear stresses at the throat wall are shown. Again, except the Casson model, the results are insensitive to the viscosity model employed. The fact that the prediction differences resulting from flow direction, increase with Re indicates that this is due to velocity profile differences between the two scenarios.
To assess how these deviations from fully developed flow velocity profiles impact relative hemolysis predictions, all of the blood damage index predictions (for both flow directions) obtained from the Eulerian framework (cf. Figure 10) are shown in Figure 12a, along with scaled values obtained from the simplified Lagrangian framework (Eq. 11) where a fully developed velocity profile and Newtonian viscosity has been assumed. Since only three values of Re (125, 500 and 2000) were considered in this geometry, blood damage predictions at other intermediate Re were also made using the simplified Lagrangian framework. It is interesting to note that even when developing flow conditions do not persist throughout the geometry, identical variations in relative hemolysis are observed in both the Eulerian and Lagrangian frameworks. In addition, this variation is independent of the viscosity model employed.
Therefore, in simple geometries similar to the ones investigated in this study (capillary tubes, FDA benchmark nozzle) where hemolysis is dominated by wall shear, the aforementioned Lagrangian hemolysis modeling methodology that is formulated based on fully developed Newtonian fluid flow could be a employed as a surrogate for quick relative hemolysis assessments. This could be done by generating an absolute hemolysis versus shear stress curve apriori (based on Eqs. 6 – 11) using any sets of power law coefficients of choice as shown in Figure 12b. Next, if fully developed flow conditions are thought to persist throughout the geometry, then wall shear stress values could be estimated based on average inlet velocity and Re from Eq. 7. If not, wall averaged shear stress can be obtained from CFD simulations for different design prototypes or flow situations and relative hemolysis assessments made based on this curve (cf. Figure 12b).
5. Conclusions
The goal of this paper is to enable rapid assessments and predictions of relative hemolysis towards quickly evaluating device design prototypes. Towards achieving this objective, absolute hemolysis predictions in an Eulerian framework was first generated from computational fluid dynamic (CFD) simulations under laminar flow conditions encompassing: five blood viscosity models, four sets of hemolysis power law coefficients, fully developed as well as developing velocity flow conditions, wide range of shear stresses (1 – 600 Pa), strain rates (1 – 10,000 s-1) and stress exposure times (5 – 400 milliseconds). Corresponding absolute hemolysis predictions were also obtained in an expedient manner in a Lagrangian framework via numerical integration of shear stress and residence time spatial variations under the assumption of fully developed Newtonian fluid flow. Based on the results of this study the following conclusions may be drawn:
- At laminar, fully developed flow conditions, both Newtonian and non-Newtonian models showed identical shear stress variations with Reynolds number.
- When fully developed flow conditions persist throughout the geometry, absolute hemolysis predictions (in both Eulerian and Lagrangian formulations) were proportional to each other and independent of the blood viscosity model or the hemolysis power law coefficients. However, the value of the proportionality constant was specific to the power law coefficients employed in the analysis. The value of the proportionality constant was also different for the Casson non-viscosity model.
- While recent studies [7] have suggested that due to the erroneous treatment of residence time in the Eulerian formulation (resulting from flow acceleration) may necessitate the formulation/deduction of separate sets of coefficients for each (Eulerian/Lagrangian) formulation, the results from this study suggest that this requirement may be alleviated for relative hemolysis assessments when the conditions of fully developed flow are present since Eulerian and Lagrangian absolute hemolysis predictions are simply proportional to each other.
- Even when developing flow conditions persist throughout the geometry, identical variations in absolute hemolysis as a function of wall shear stresses was observed between the Eulerian and Lagrangian frameworks that was generally independent of the viscosity model. Therefore, in simple geometries similar to the ones investigated in this study (capillary tubes, FDA benchmark nozzle) where hemolysis is dominated by wall shear and hemolysis in recirculation regions are absent, the simplified Lagrangian hemolysis modeling methodology formulated based on fully developed Newtonian fluid flow could be a employed as a surrogate for quick relative hemolysis assessments. This could be done by generating an absolute hemolysis versus shear stress curve apriori using any sets of power law coefficients of choice. Next, wall shear stress values could be obtained from CFD simulations for different design prototypes or flow situations and relative hemolysis assessments made based on the curve.
Author Contributions
This article was published by contributions of the following individuals: Conceptualization, Nasim Gholizadeh and Gautham Krishnamoorthy.; methodology, Nasim Gholizadeh and Gautham Krishnamoorthy.; formal analysis.; Nasim Gholizadeh, Ryan Wang, Gayatri Gautham; investigation:, Nasim Gholizadeh, Ryan Wang, Gayatri Gautham.; writing—original draft preparation, Nasim Gholizadeh.; writing—review and editing, Gautham Krishnamoorthy.; visualization, Nasim Gholizadeh, Ryan Wang, Gayatri Gautham.; supervision, Gautham Krishnamoorthy. All authors have read and agreed to the published version of the manuscript.
Funding
This research received no external funding.
Data Availability Statement
All data that is relevant to this study is contained within the article. Any additional supplemental information that is needed is available upon request from the corresponding author.
Conflicts of Interest
The authors declare no conflicts of interest.
References
- Kameneva, M.V., Burgreen, G.W., Kono, K., Repko, B., Antaki, J.F. and Umezu, M., 2004. Effects of turbulent stresses upon mechanical hemolysis: experimental and computational analysis. ASAIO journal, 50(5), pp.418-423.
- Hariharan, P., M. Giarra, V. Reddy, S. Day, K. B. Manning, S. Deutsch, S. F. C. Stewart, M. R. Myers, M. R. Berman, G. W. Burgreen, E. G. Paterson, and R. A. Malinauskas. Experimental particle image velocimetry protocol and results database for validating computational fluid dynamic simulations of the FDA benchmark nozzle model. J. Biomech. Eng. 2011, 133(4). [CrossRef]
- Stewart, S.F.C., Hariharan, P., Paterson, E.G. et al. Results of FDA’s First Interlaboratory Computational Study of a Nozzle with a Sudden Contraction and Conical Diffuser. Cardiovasc Eng Tech, 2013, Vol. 4, 374–391. [CrossRef]
- Stewart, S. F. C., Paterson, E. G., Burgreen, G. W., Hariharan, P., Giarra, M., Reddy, V., Day, S. W., Manning, K. B., Deutsch, S., Berman, M. R., Myers, M. R., & Malinauskas, R. A. Assessment of CFD performance in simulations of an idealized medical device: Results of FDA’s first computational Interlaboratory study. Cardiovascular Engineering and Technology, 2012, 3(2), 139-160. [CrossRef]
- Herbertson, L. H., Olia, S. E., Daly, A., Noatch, C. P., Smith, W. A., Kameneva, M. V., & Malinauskas, R. A. Multilaboratory study of flow-induced Hemolysis using the FDA benchmark nozzle model. Artificial Organs, 2014, 39(3), 237-248. [CrossRef]
- Mantegazza, A., Tobin, N., Manning, K.B. and Craven, B.A., 2023. Examining the universality of the hemolysis power law model from simulations of the FDA nozzle using calibrated model coefficients. Biomechanics and modeling in mechanobiology, 22(2), pp.433-451.
- Faghih, M.M., Craven, B.A. and Sharp, M.K., 2023. Practical implications of the erroneous treatment of exposure time in the Eulerian hemolysis power law model. Artificial Organs, 47(9), pp.1531-1538.
- Menon, K., Hu, Z. and Marsden, A.L., 2024. Cardiovascular fluid dynamics: a journey through our circulation. Flow, 4, p.E7.
- Kopernik, M., Modelling of blood thrombosis at microscopic and mesoscopic scales. Computer Assisted Methods in Engineering and Science, 2019, 25(1), pp.21-45.
- Giersiepen, M., Wurzinger, L.J., Opitz, R. and Reul, H., 1990. Estimation of shear stress-related blood damage in heart valve prostheses-in vitro comparison of 25 aortic valves. The International journal of artificial organs, 13(5), pp.300-306.
- Craven, B.A., Aycock, K.I., Herbertson, L.H. et al. A CFD-based Kriging surrogate modeling approach for predicting device-specific hemolysis power law coefficients in blood-contacting medical devices. Biomech Model Mechanobiol, 2019, Vol 18, 1005–1030. [CrossRef]
- Stiehm, M., Wüstenhagen, C., Siewert, S., Grabow, N. and Schmitz, K.P., 2017. Numerical simulation of pulsatile flow through a coronary nozzle model based on FDA’s benchmark geometry. Current Directions in Biomedical Engineering, 3(2), pp.775-778.
- Good, Bryan C. ‘The Effects of non-Newtonian Blood Modeling and Pulsatility on Hemodynamics in the Food and Drug Administration’s Benchmark Nozzle Model’ Biorheology 59 (2022/2023) 1–18 1, DOI 10.3233/BIR-201019.
- Trias, M., Arbona, A., Massó, J., Miñano, B., & Bona, C. FDA’s nozzle numerical simulation challenge: Non-Newtonian fluid effects and blood damage. PLOS ONE, 2014, 9(3), e92638. [CrossRef]
- Hussein, B.K.; Al-Azawy, M.G.; Al-Waaly, A.A.; Hamza, Z.A. Evaluation of Turbulence and Non-Newtonian Blood Rheology Models Through FDA Nozzle. In 2021 International Conference on Advance of Sustainable Engineering and its Application (ICASEA); IEEE: 2021, pp. 1-5.
- Zakaria, M.S., Zainudin, S.H., Abdullah, H., Yuan, C.S., Abd Latif, M.J. and Osman, K., 2019. CFD Simulation of Non-Newtonian Effect on Hemodynamics Characteristics of Blood Flow through Benchmark Nozzle. Journal of Advanced Research in Fluid Mechanics and Thermal Sciences, 64(1), pp.117-125.
- Krishnamoorthy, G. and Gholizadeh, N., 2024. Blood Damage Analysis within the FDA Benchmark Nozzle Geometry at Laminar Conditions: Prediction Sensitivities to Software and Non-Newtonian Viscosity Models. Symmetry, 16(9), p.1165.
- ANSYS Inc. ANSYS Fluent. Version 2023 R2, ANSYS Inc., 2023. https://www.ansys.com/products/fluids/ansys-fluent.
- McCabe, Warren Lee, Julian Cleveland Smith, and Peter Harriott. Unit operations of chemical engineering. Vol. 5. New York: McGraw-hill, 1967.
- Metzner, A.B. and Reed, J.C., 1955. Flow of non-newtonian fluids—correlation of the laminar, transition, and turbulent-flow regions. Aiche journal, 1(4), pp.434-440.
Figure 1.
Geometries examined in this study: (a) Straight capillary tube (Kameneva et al. [1]); (b) Reverse flow in the bidirectional FDA benchmark nozzle; (c) Forward flow in the bidirectional FDA benchmark nozzle.
Figure 1.
Geometries examined in this study: (a) Straight capillary tube (Kameneva et al. [1]); (b) Reverse flow in the bidirectional FDA benchmark nozzle; (c) Forward flow in the bidirectional FDA benchmark nozzle.
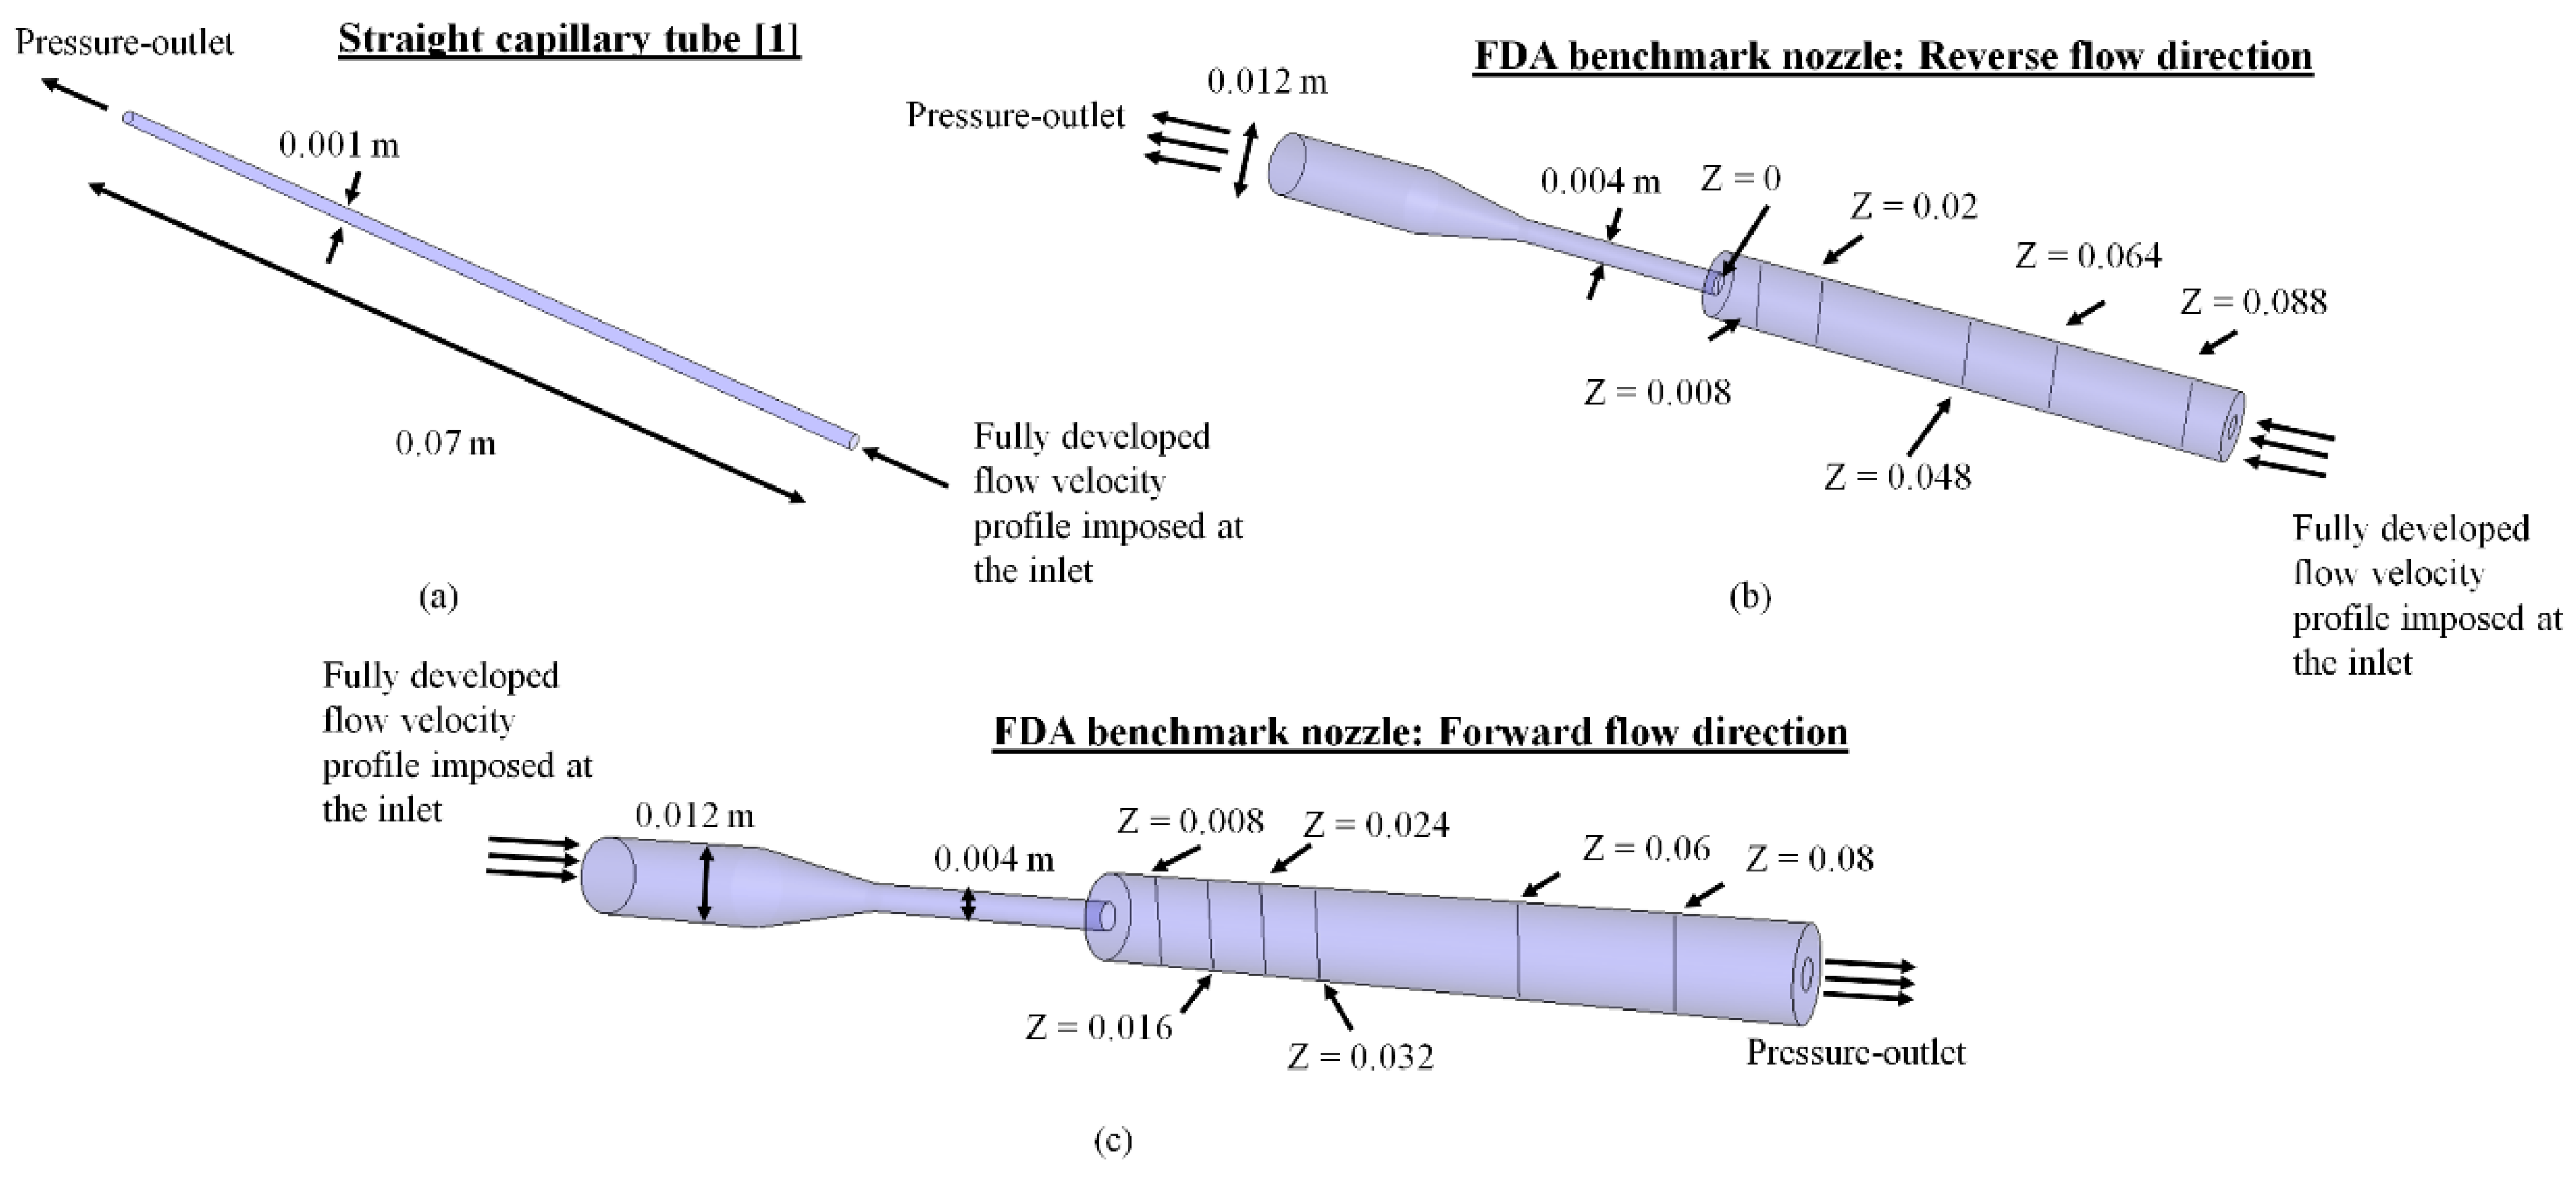
Figure 3.
Viscosity variations employing the different Non-Newtonian models for blood investigated in this study. A constant viscosity of 0.0035 Pa-s (shown) was used in the FDA nozzle geometry.
Figure 3.
Viscosity variations employing the different Non-Newtonian models for blood investigated in this study. A constant viscosity of 0.0035 Pa-s (shown) was used in the FDA nozzle geometry.
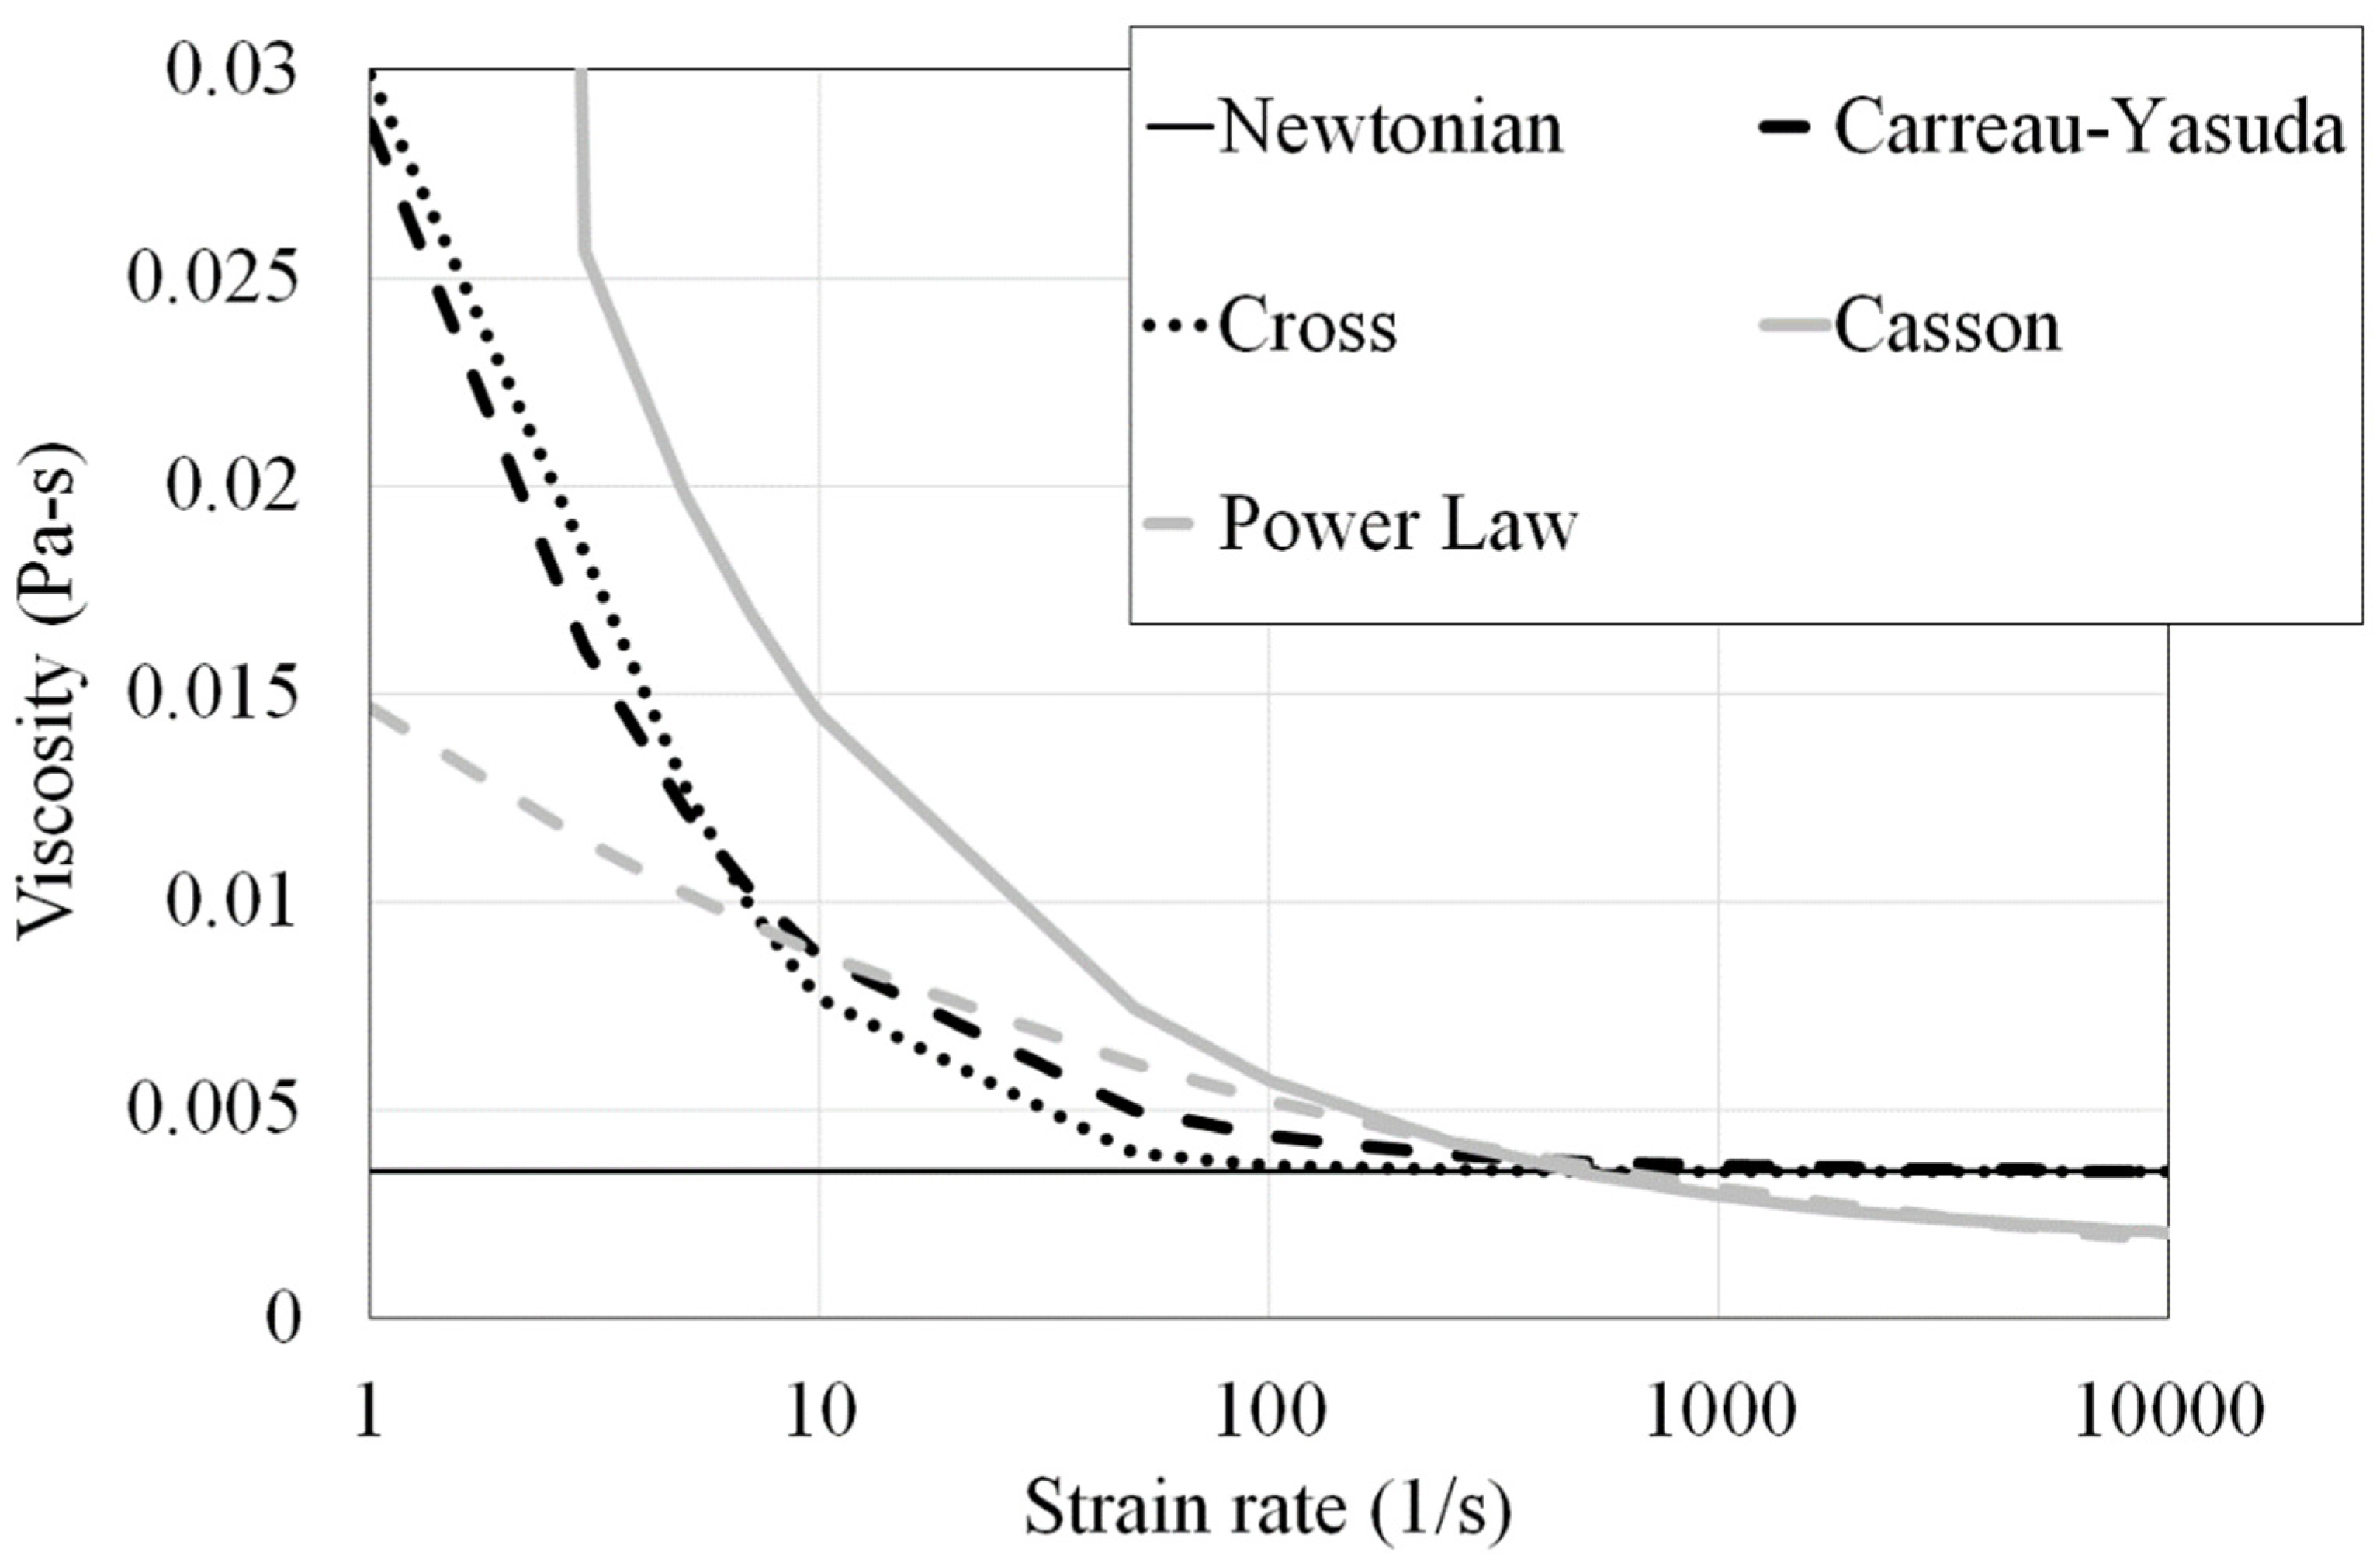
Figure 4.
Source term magnitude (right hand side of equation) in Eq. (2) variations as a function of shear stress.
Figure 4.
Source term magnitude (right hand side of equation) in Eq. (2) variations as a function of shear stress.
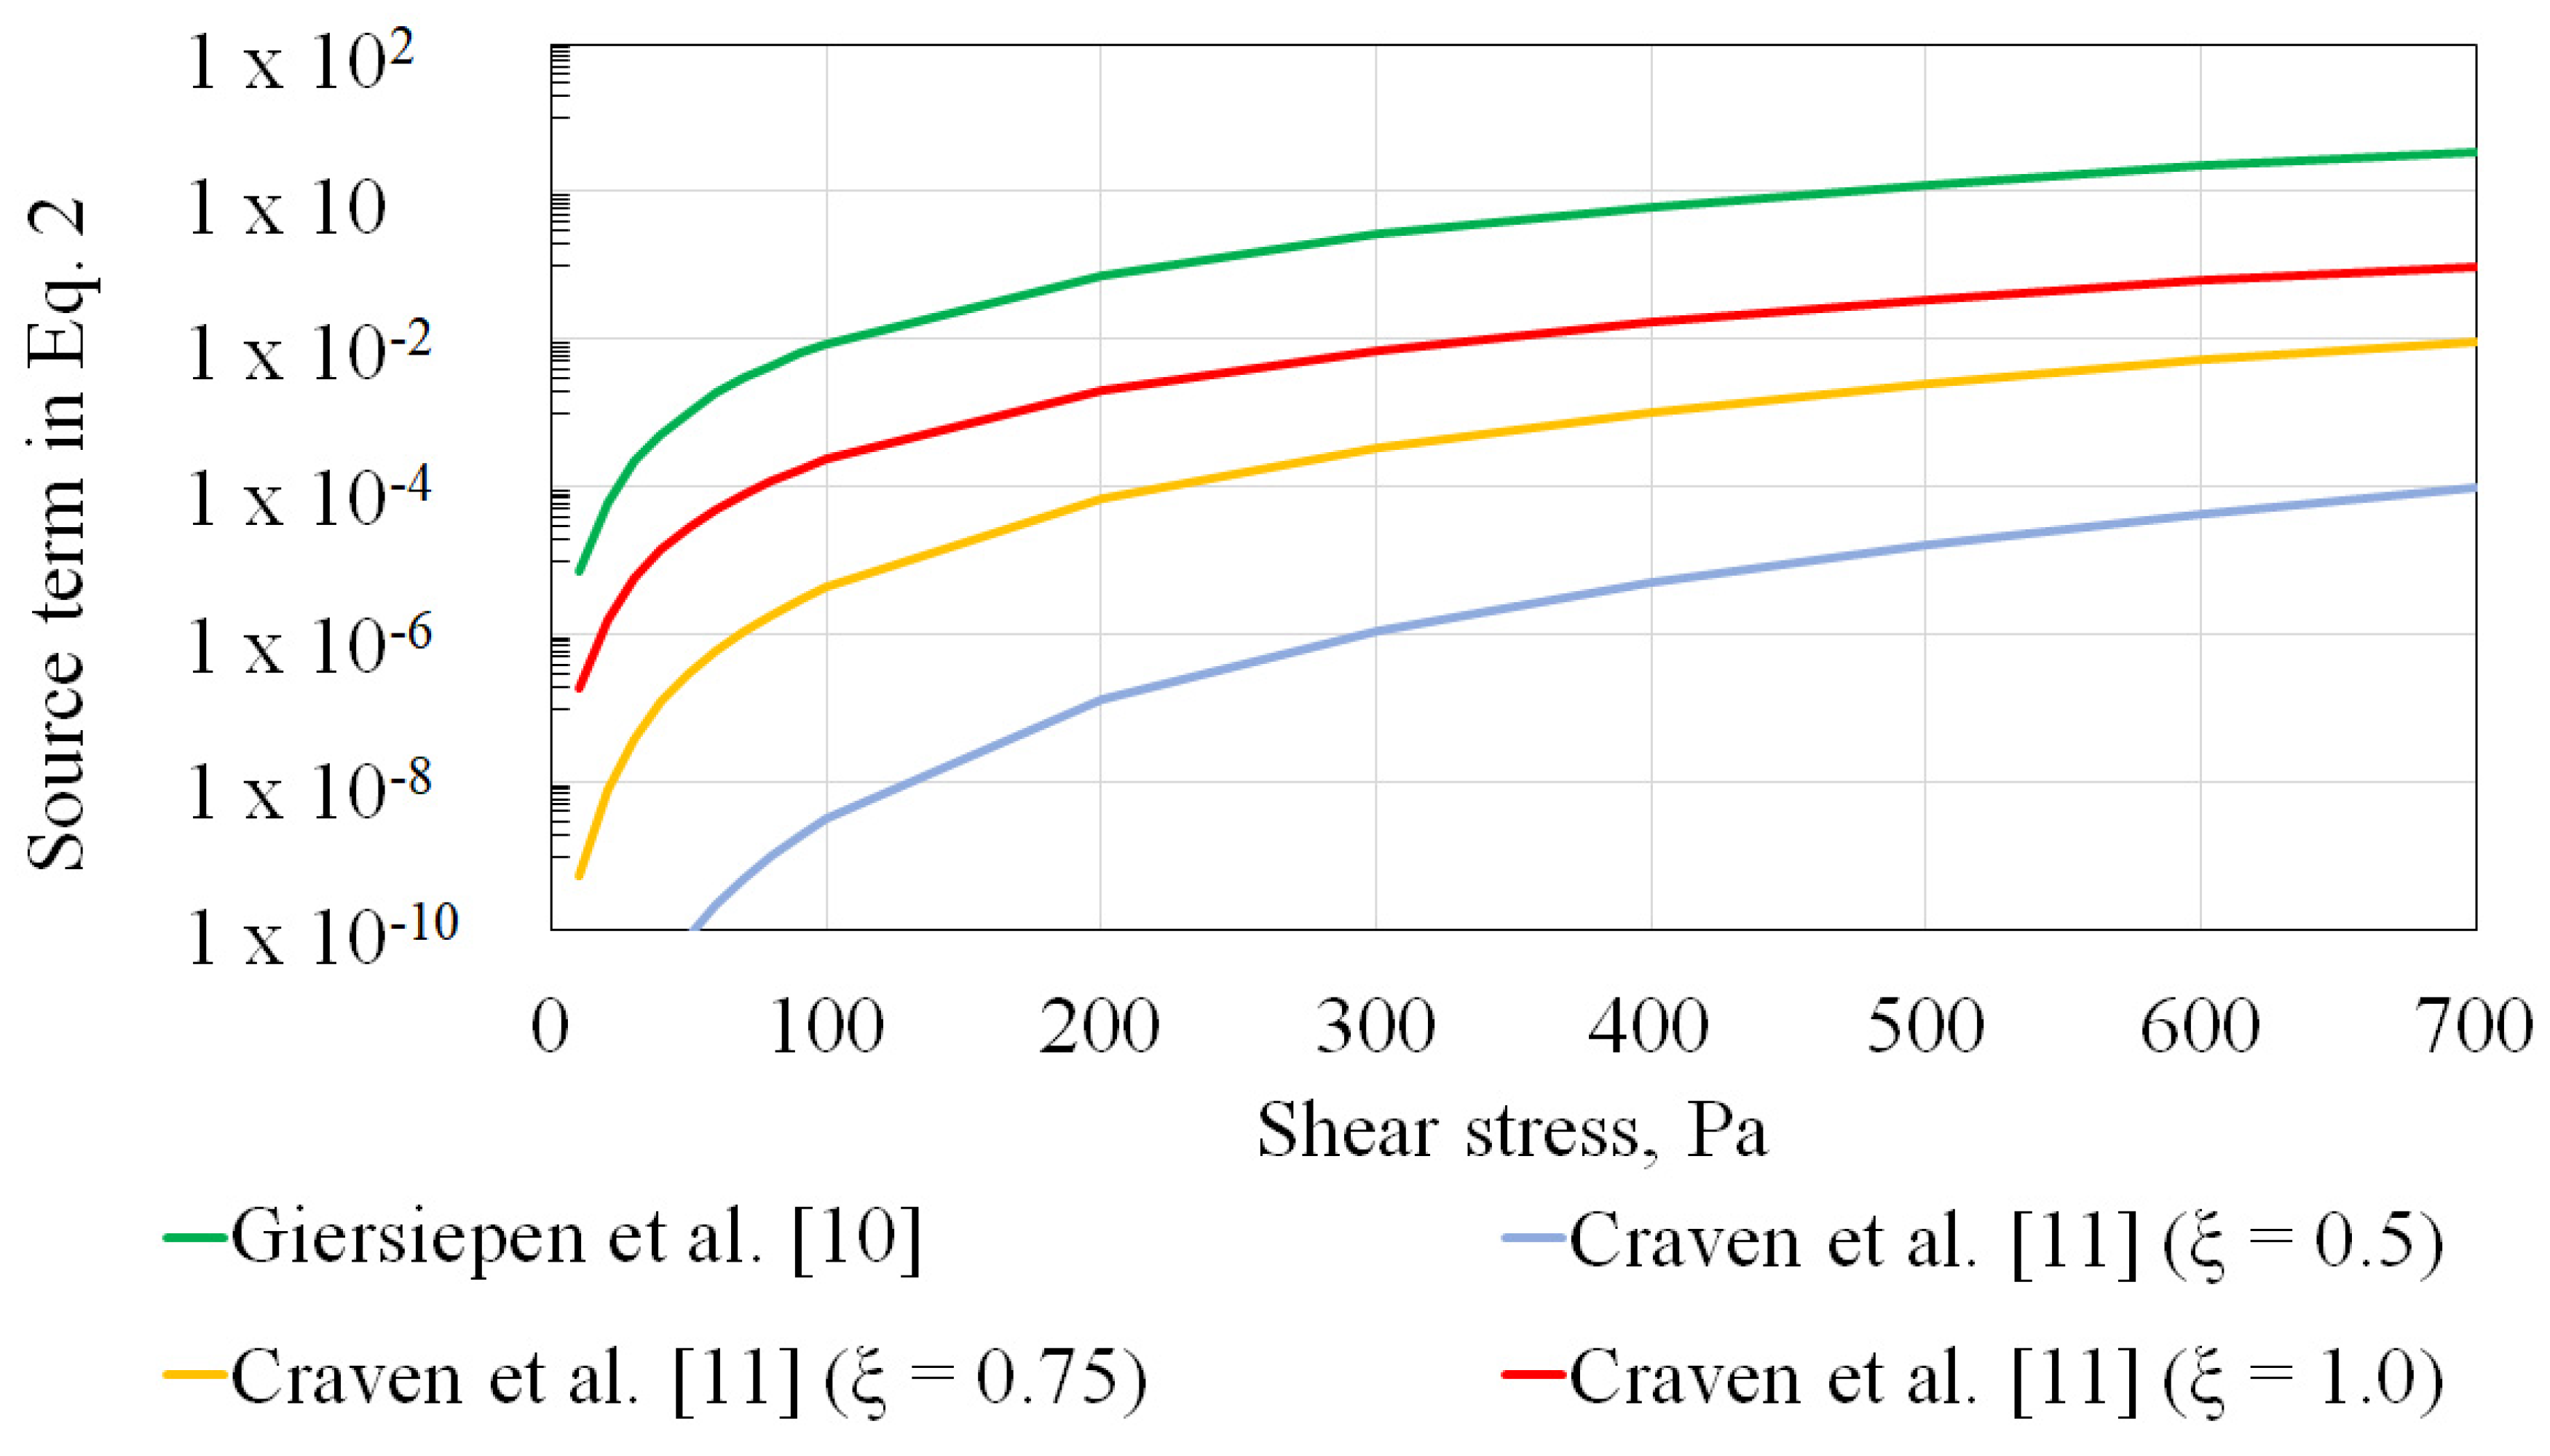
Figure 5.
Darcy friction factor (fD) predictions against theoritical values towards demonstrating mesh convergence in the capillary tube geometry.
Figure 5.
Darcy friction factor (fD) predictions against theoritical values towards demonstrating mesh convergence in the capillary tube geometry.
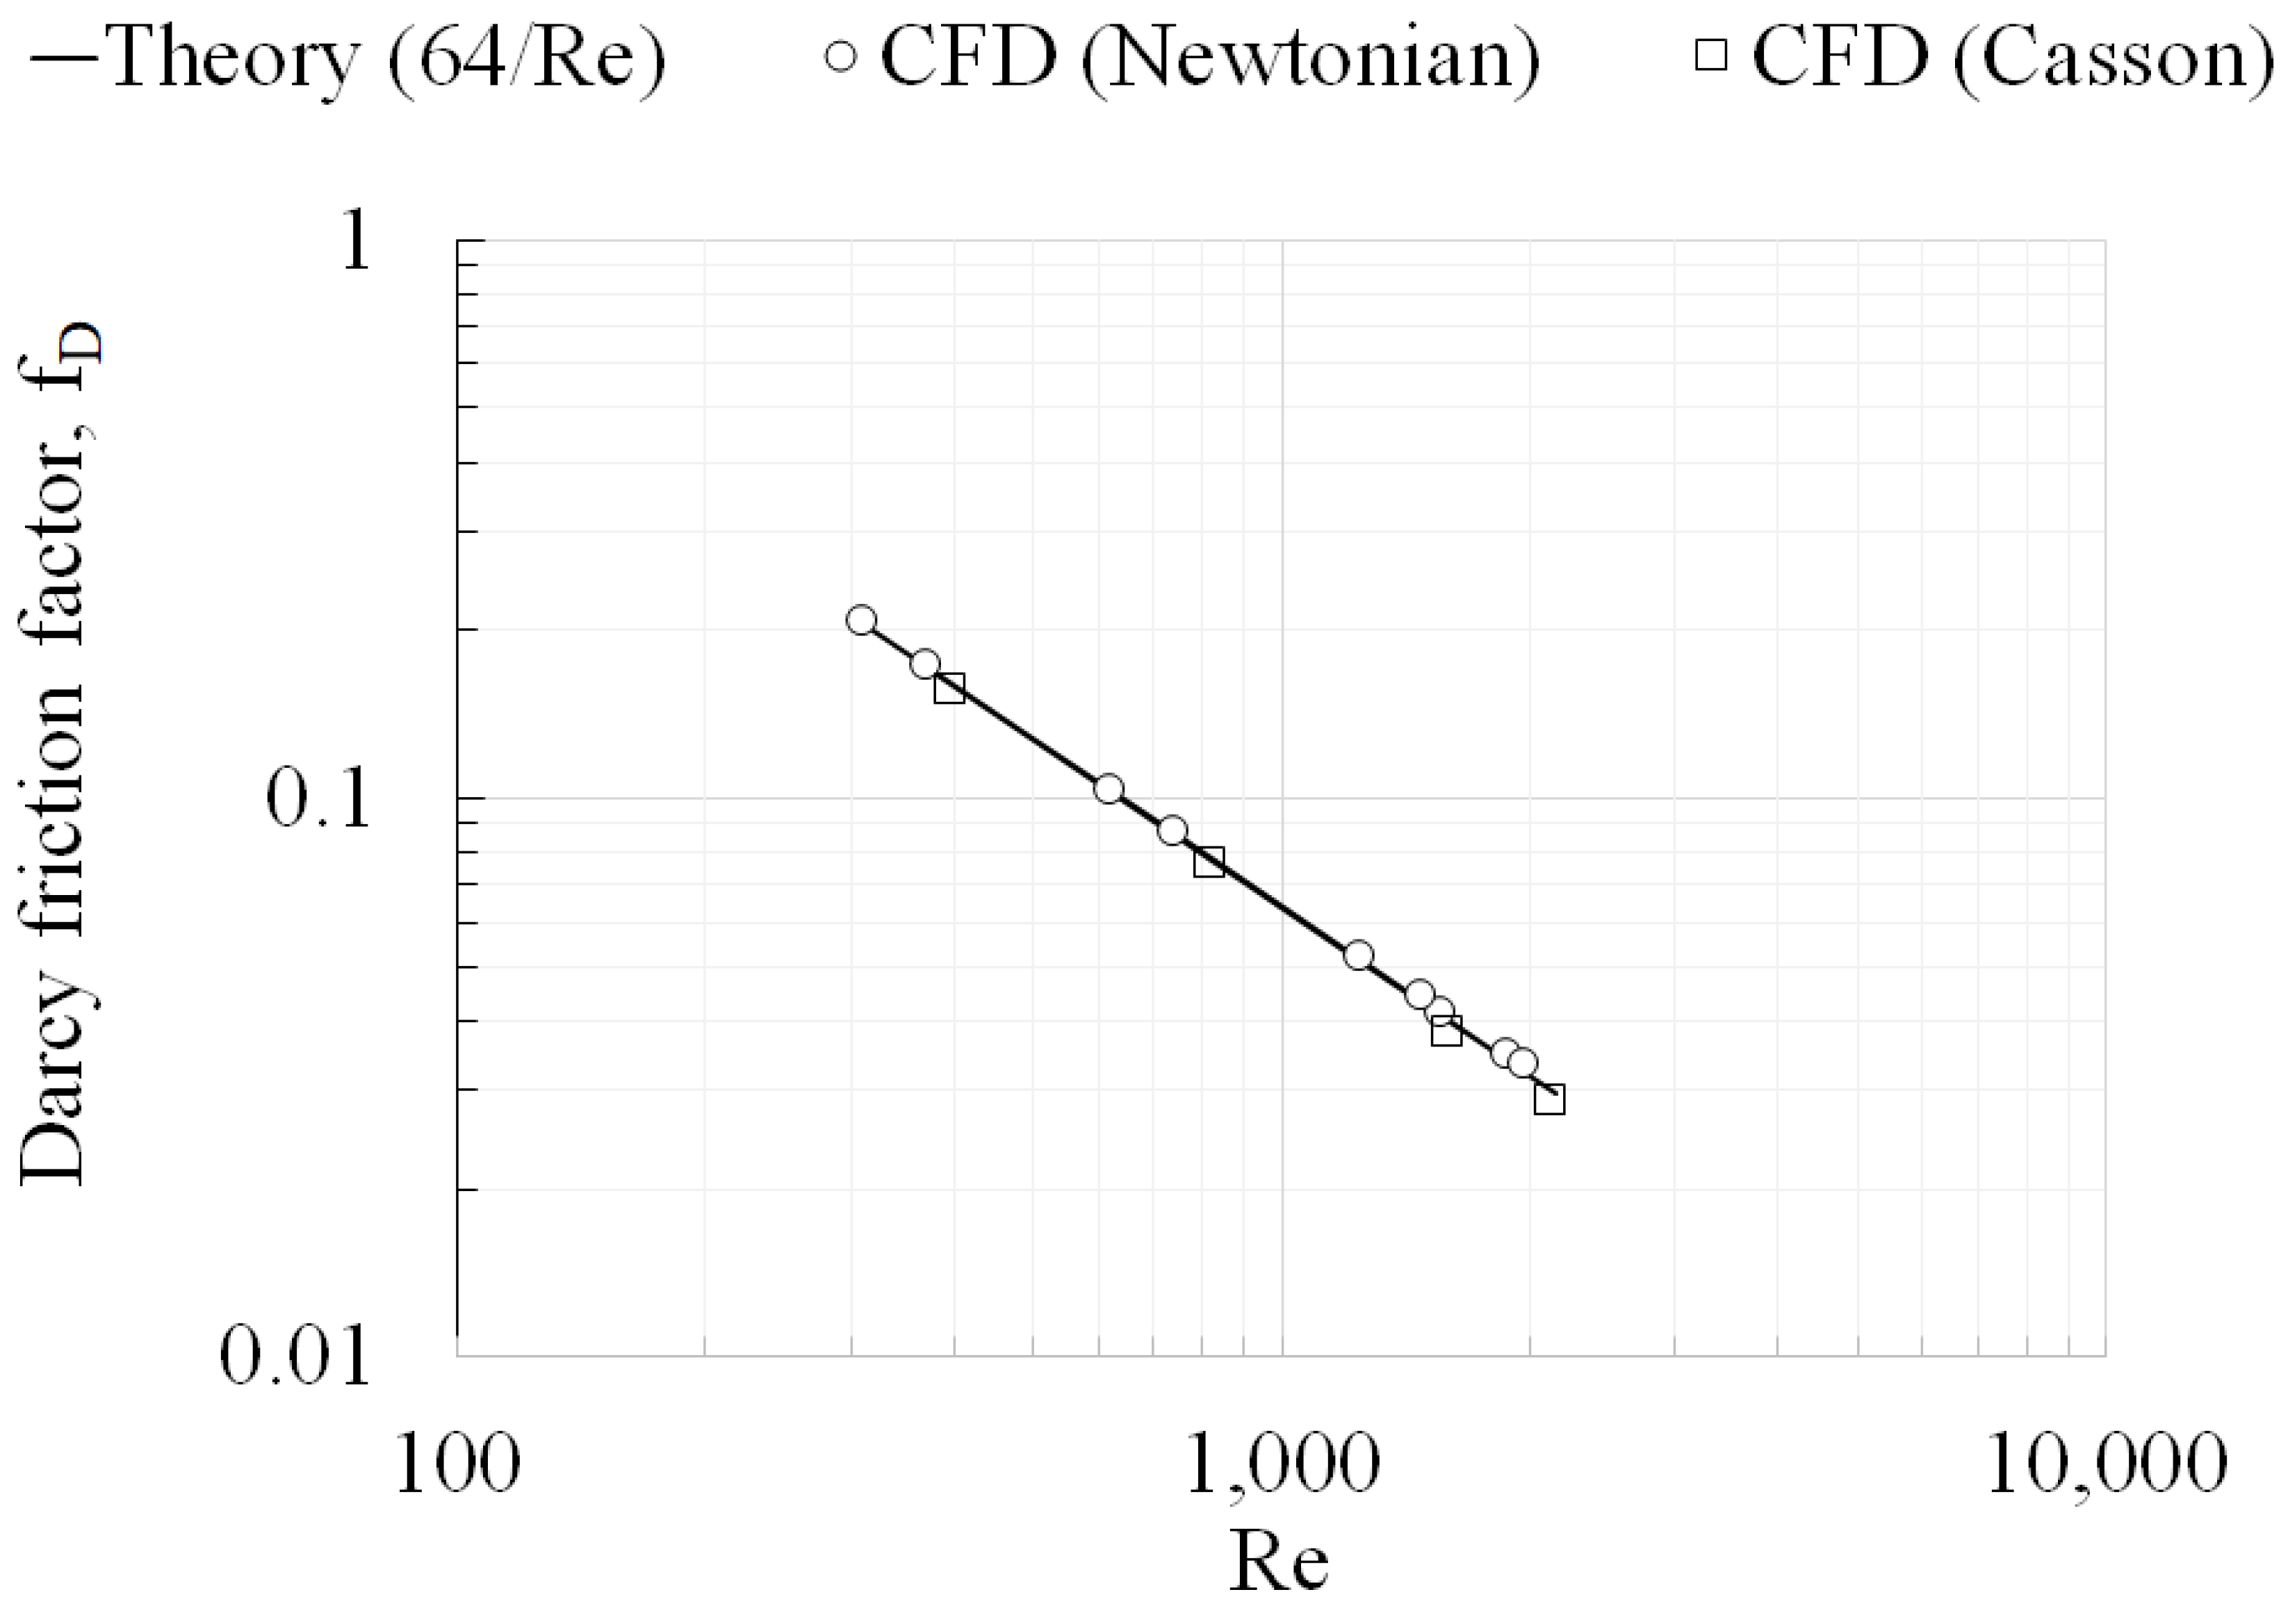
Figure 6.
Velocity profiles at different axial locations predicted using different mesh sizes towards demonstrating mesh convergence in the FDA nozzle geometry for reverse flow direction. (a) Z = 0; (b) Z = 0.008; (c) Z = 0.02; (d) Z = 0.048; (e) Z = 0.064; (f) Z = 0.088.
Figure 6.
Velocity profiles at different axial locations predicted using different mesh sizes towards demonstrating mesh convergence in the FDA nozzle geometry for reverse flow direction. (a) Z = 0; (b) Z = 0.008; (c) Z = 0.02; (d) Z = 0.048; (e) Z = 0.064; (f) Z = 0.088.
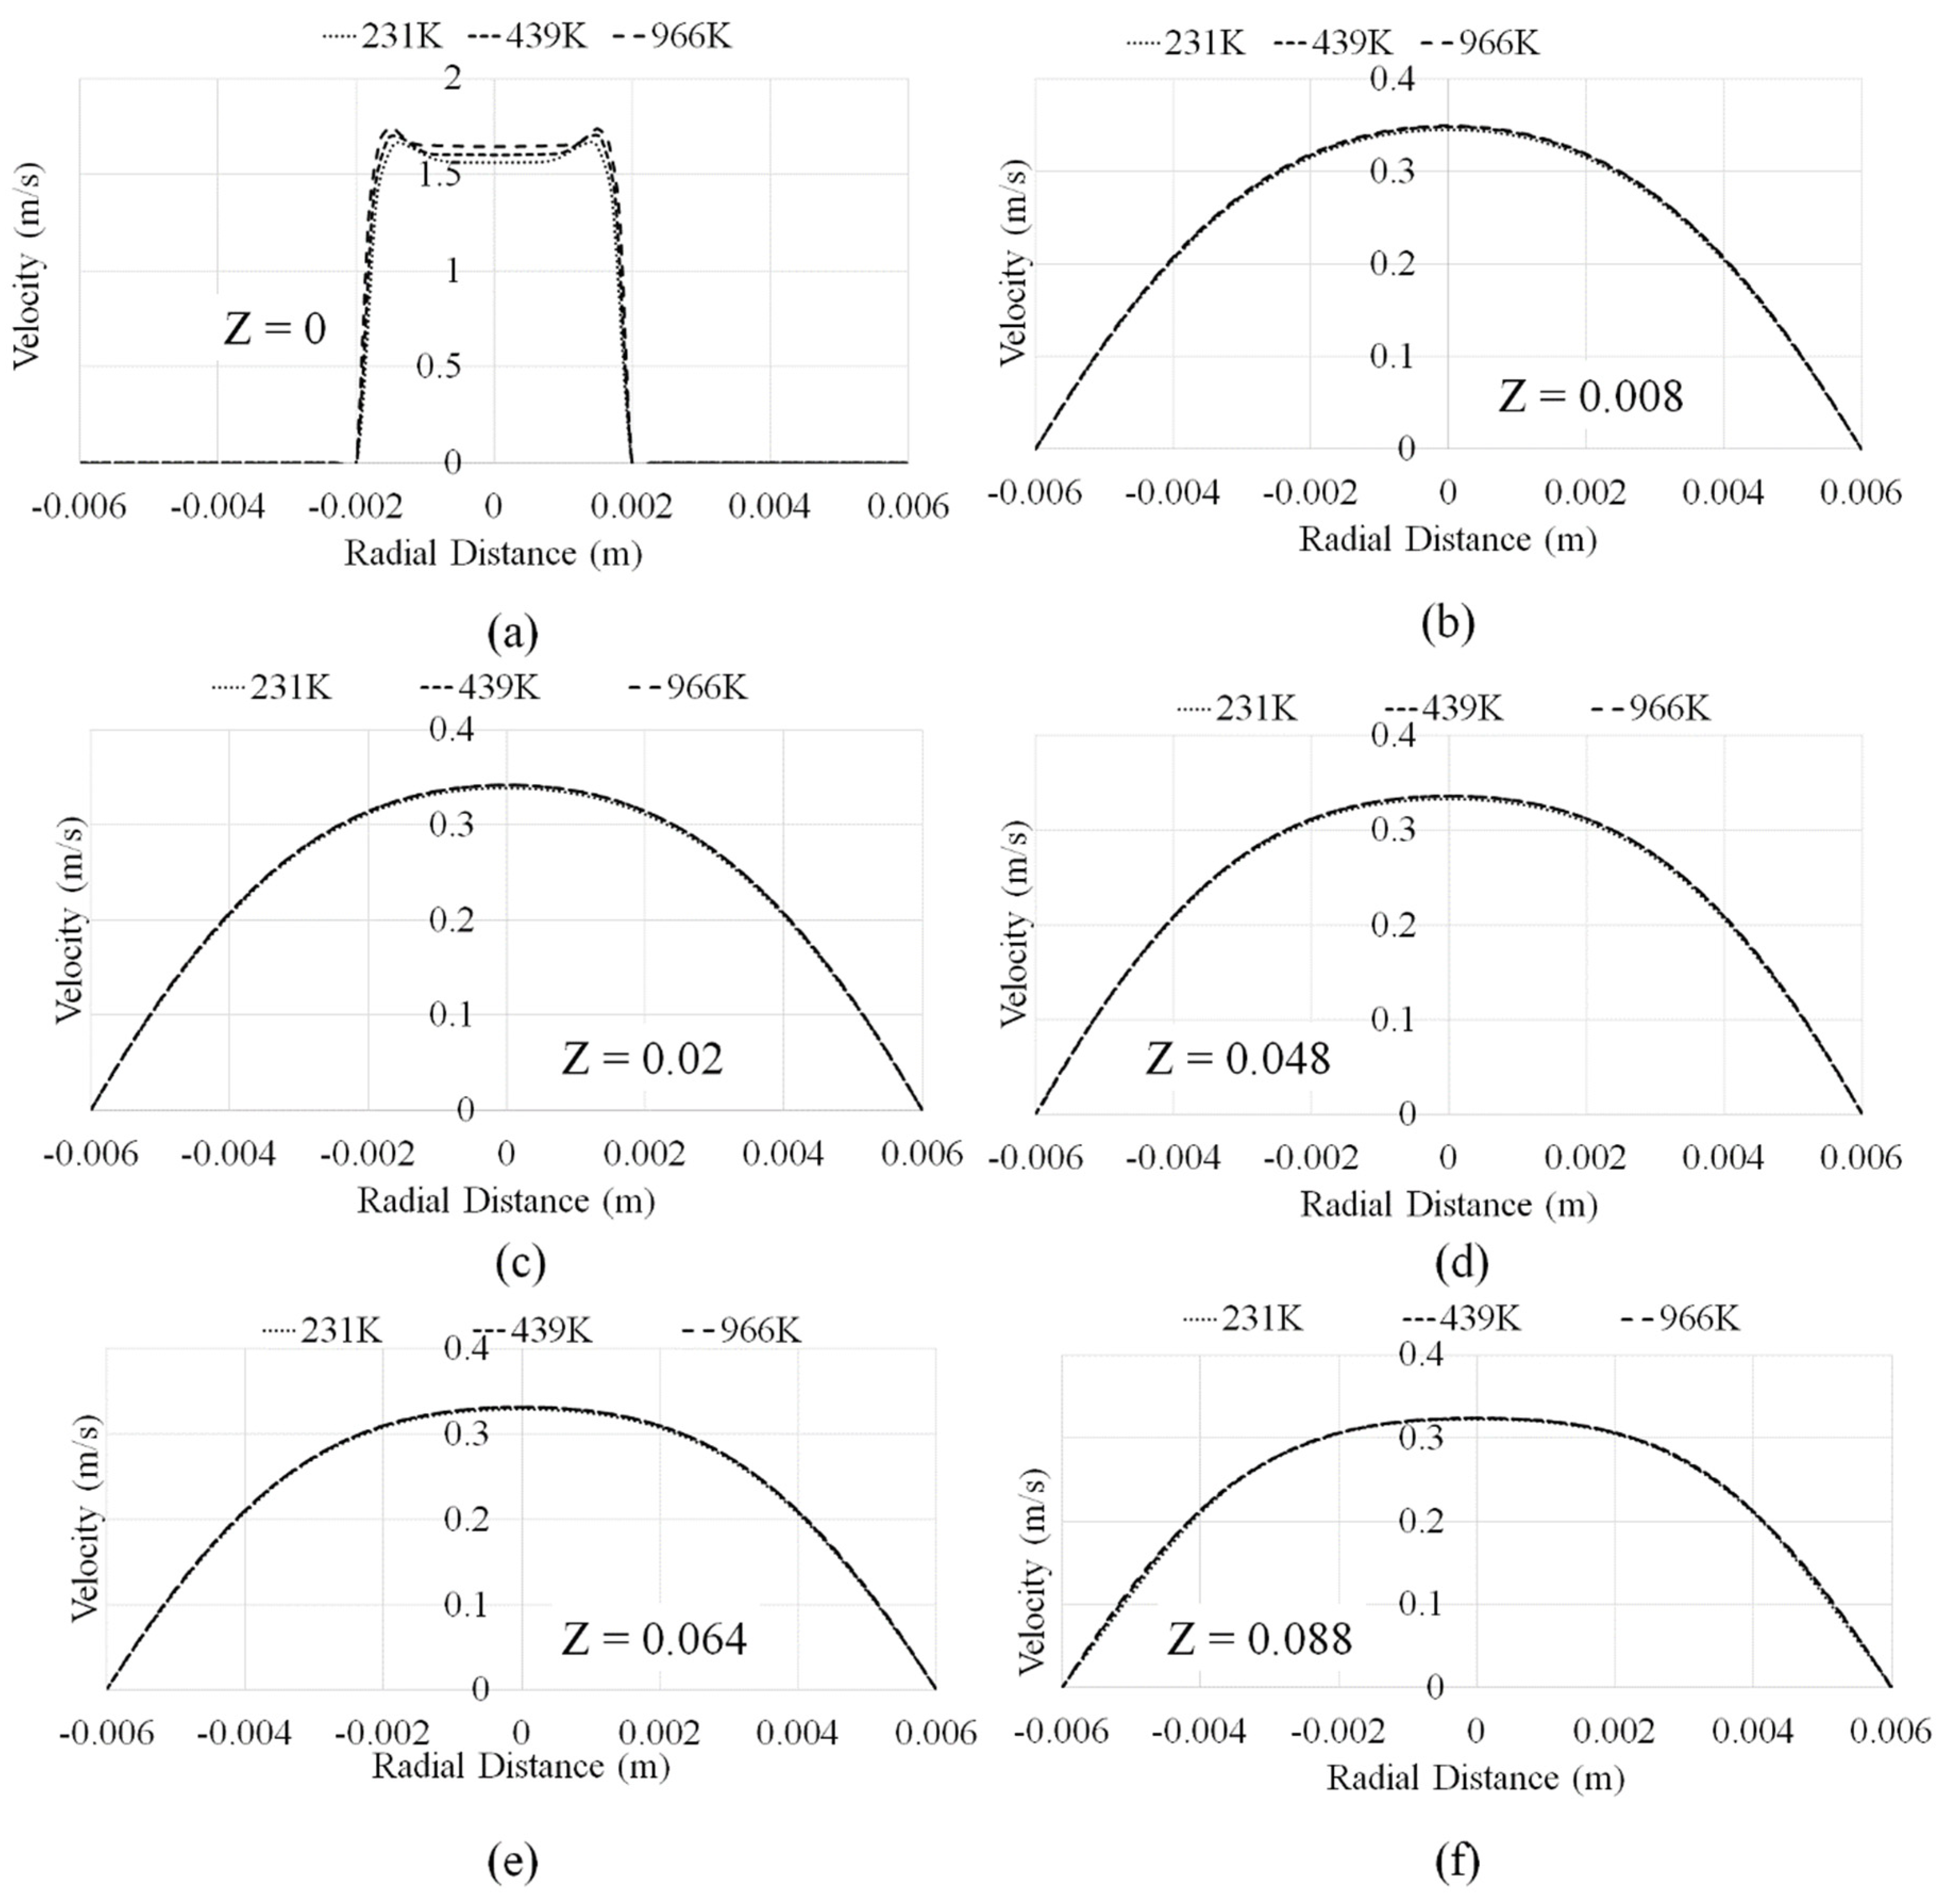
Figure 7.
Velocity profiles at different axial locations predicted using different Non-Newtonian models in the FDA nozzle geometry for reverse flow direction. (a) Z = 0 (Re 125); (b) Z = 0.088 (Re 125); (c) Z = 0 (Re 500); (d) Z = 0.088 (Re 500); (e) Z = 0 (Re 2000); (f) Z = 0.088 (Re 2000).
Figure 7.
Velocity profiles at different axial locations predicted using different Non-Newtonian models in the FDA nozzle geometry for reverse flow direction. (a) Z = 0 (Re 125); (b) Z = 0.088 (Re 125); (c) Z = 0 (Re 500); (d) Z = 0.088 (Re 500); (e) Z = 0 (Re 2000); (f) Z = 0.088 (Re 2000).
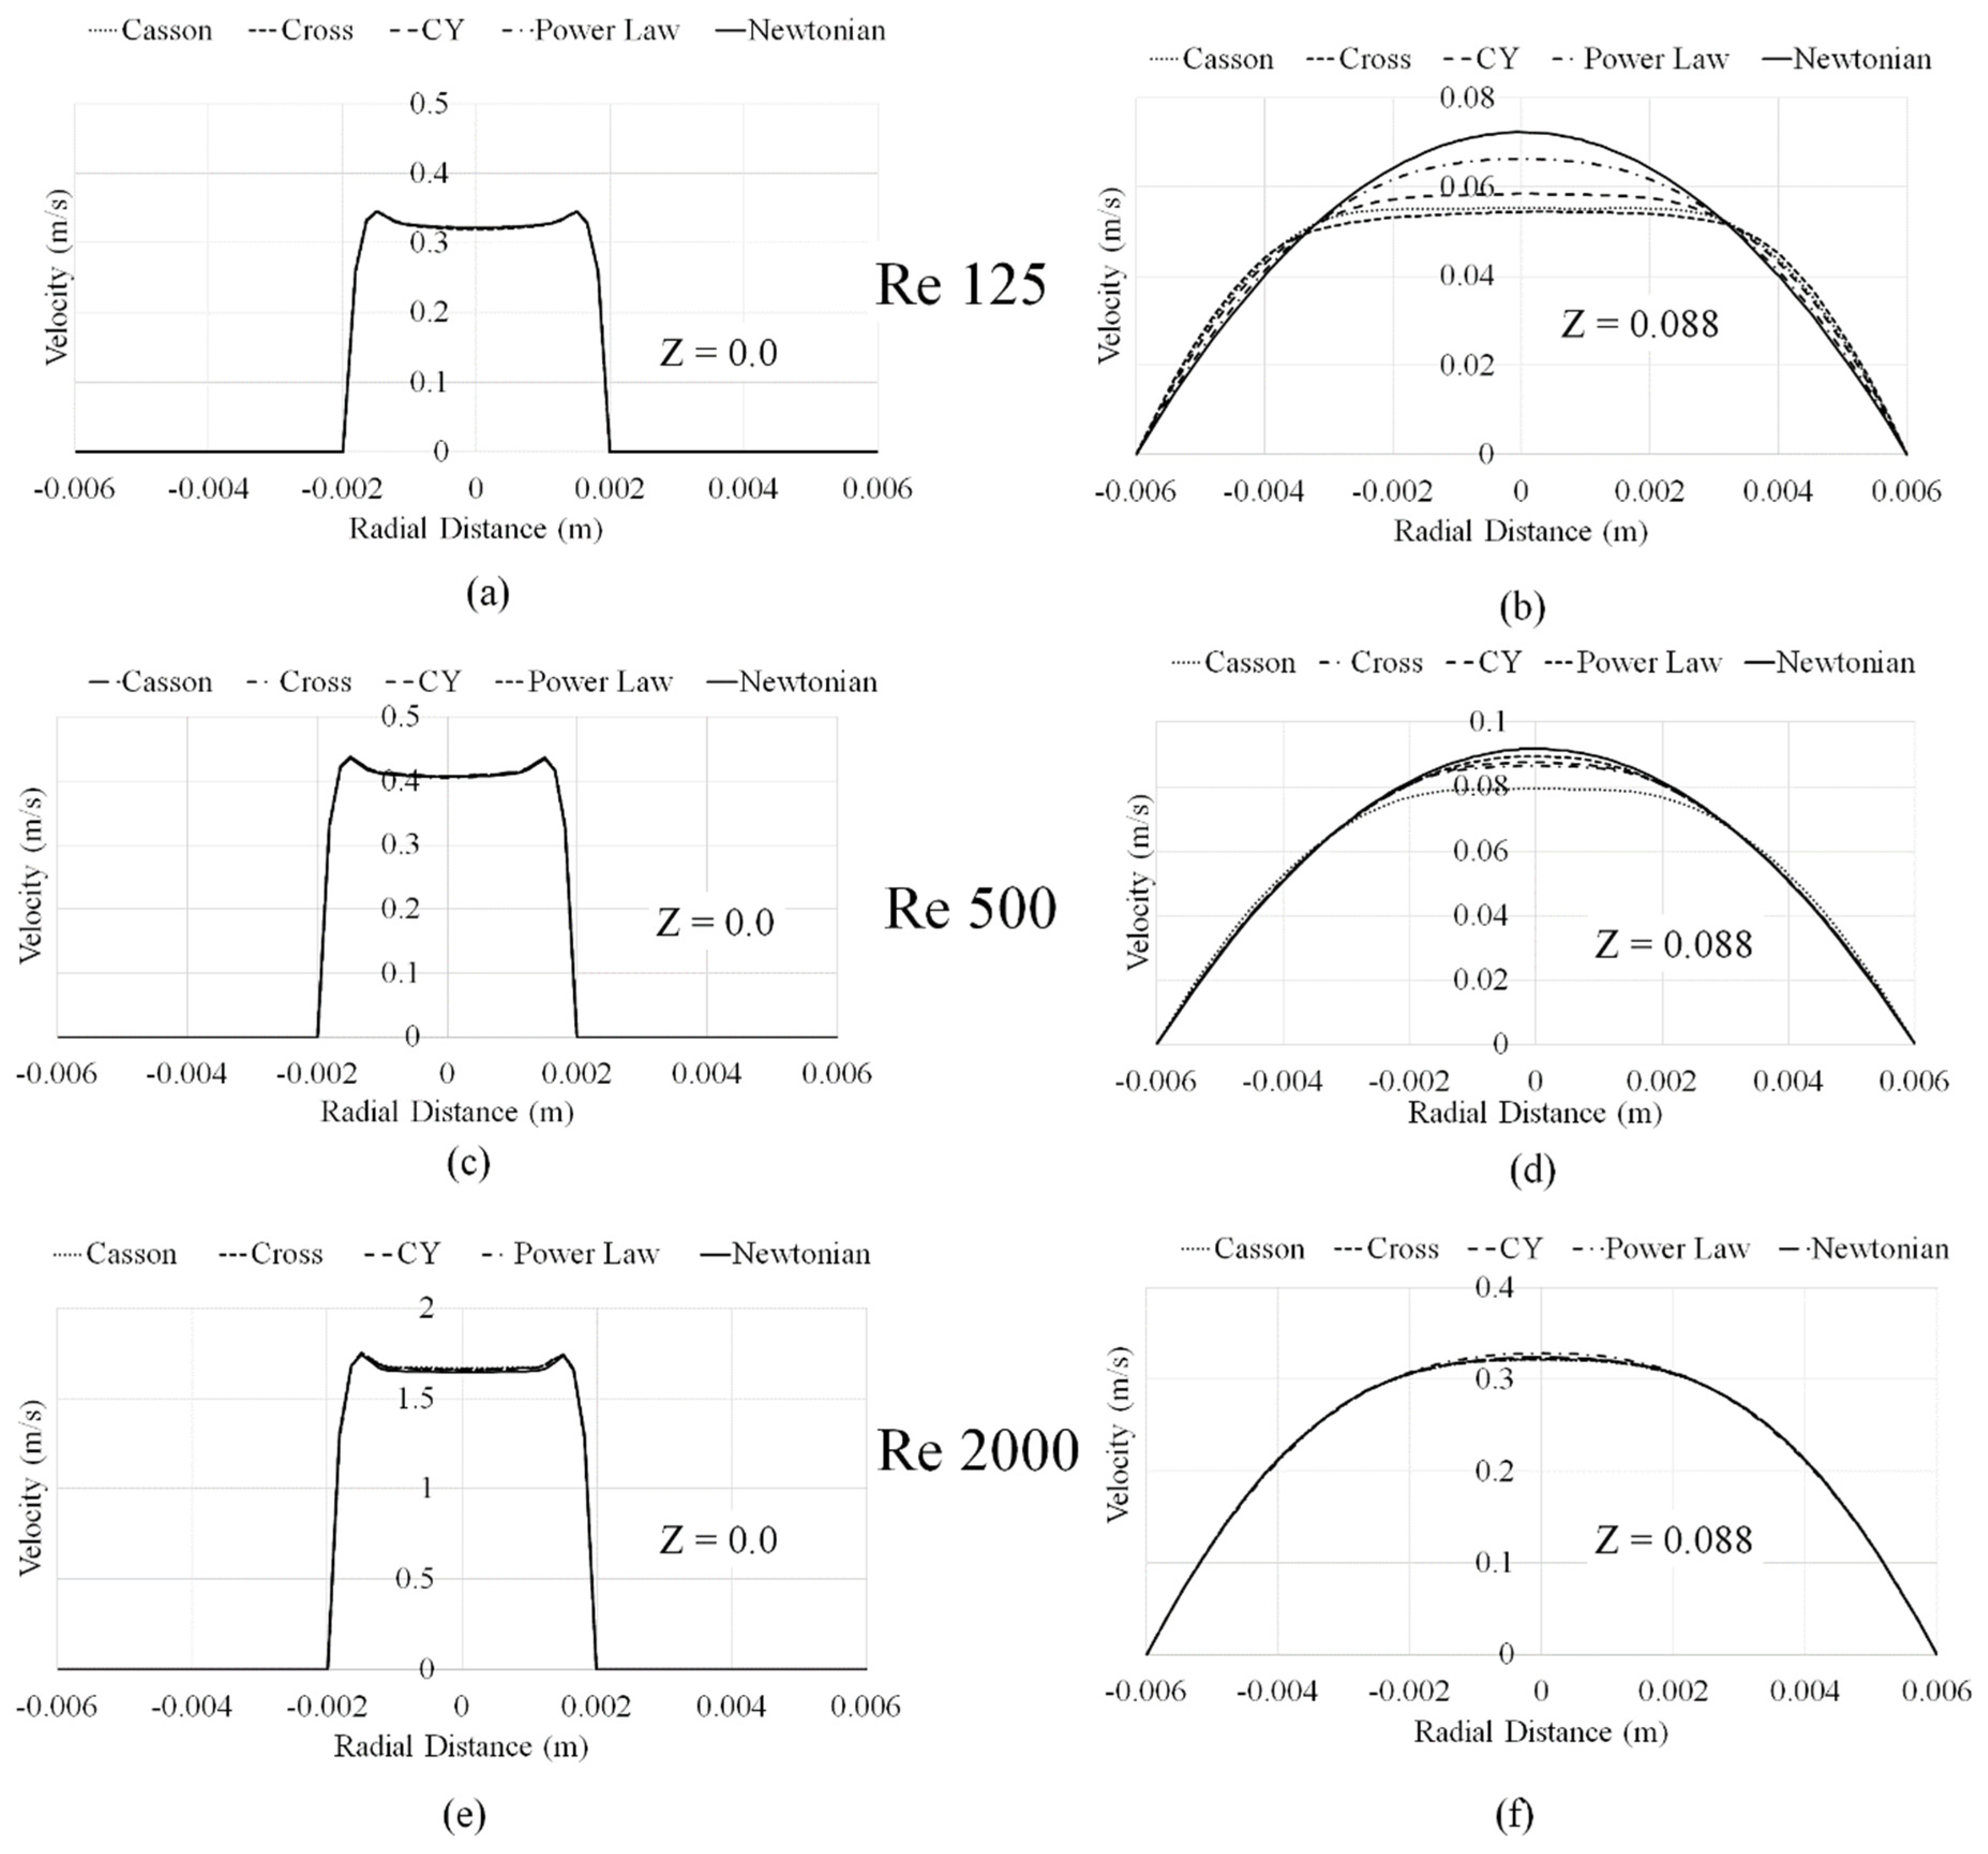
Figure 8.
Deviation from fully developed flow in FDA nozzle.
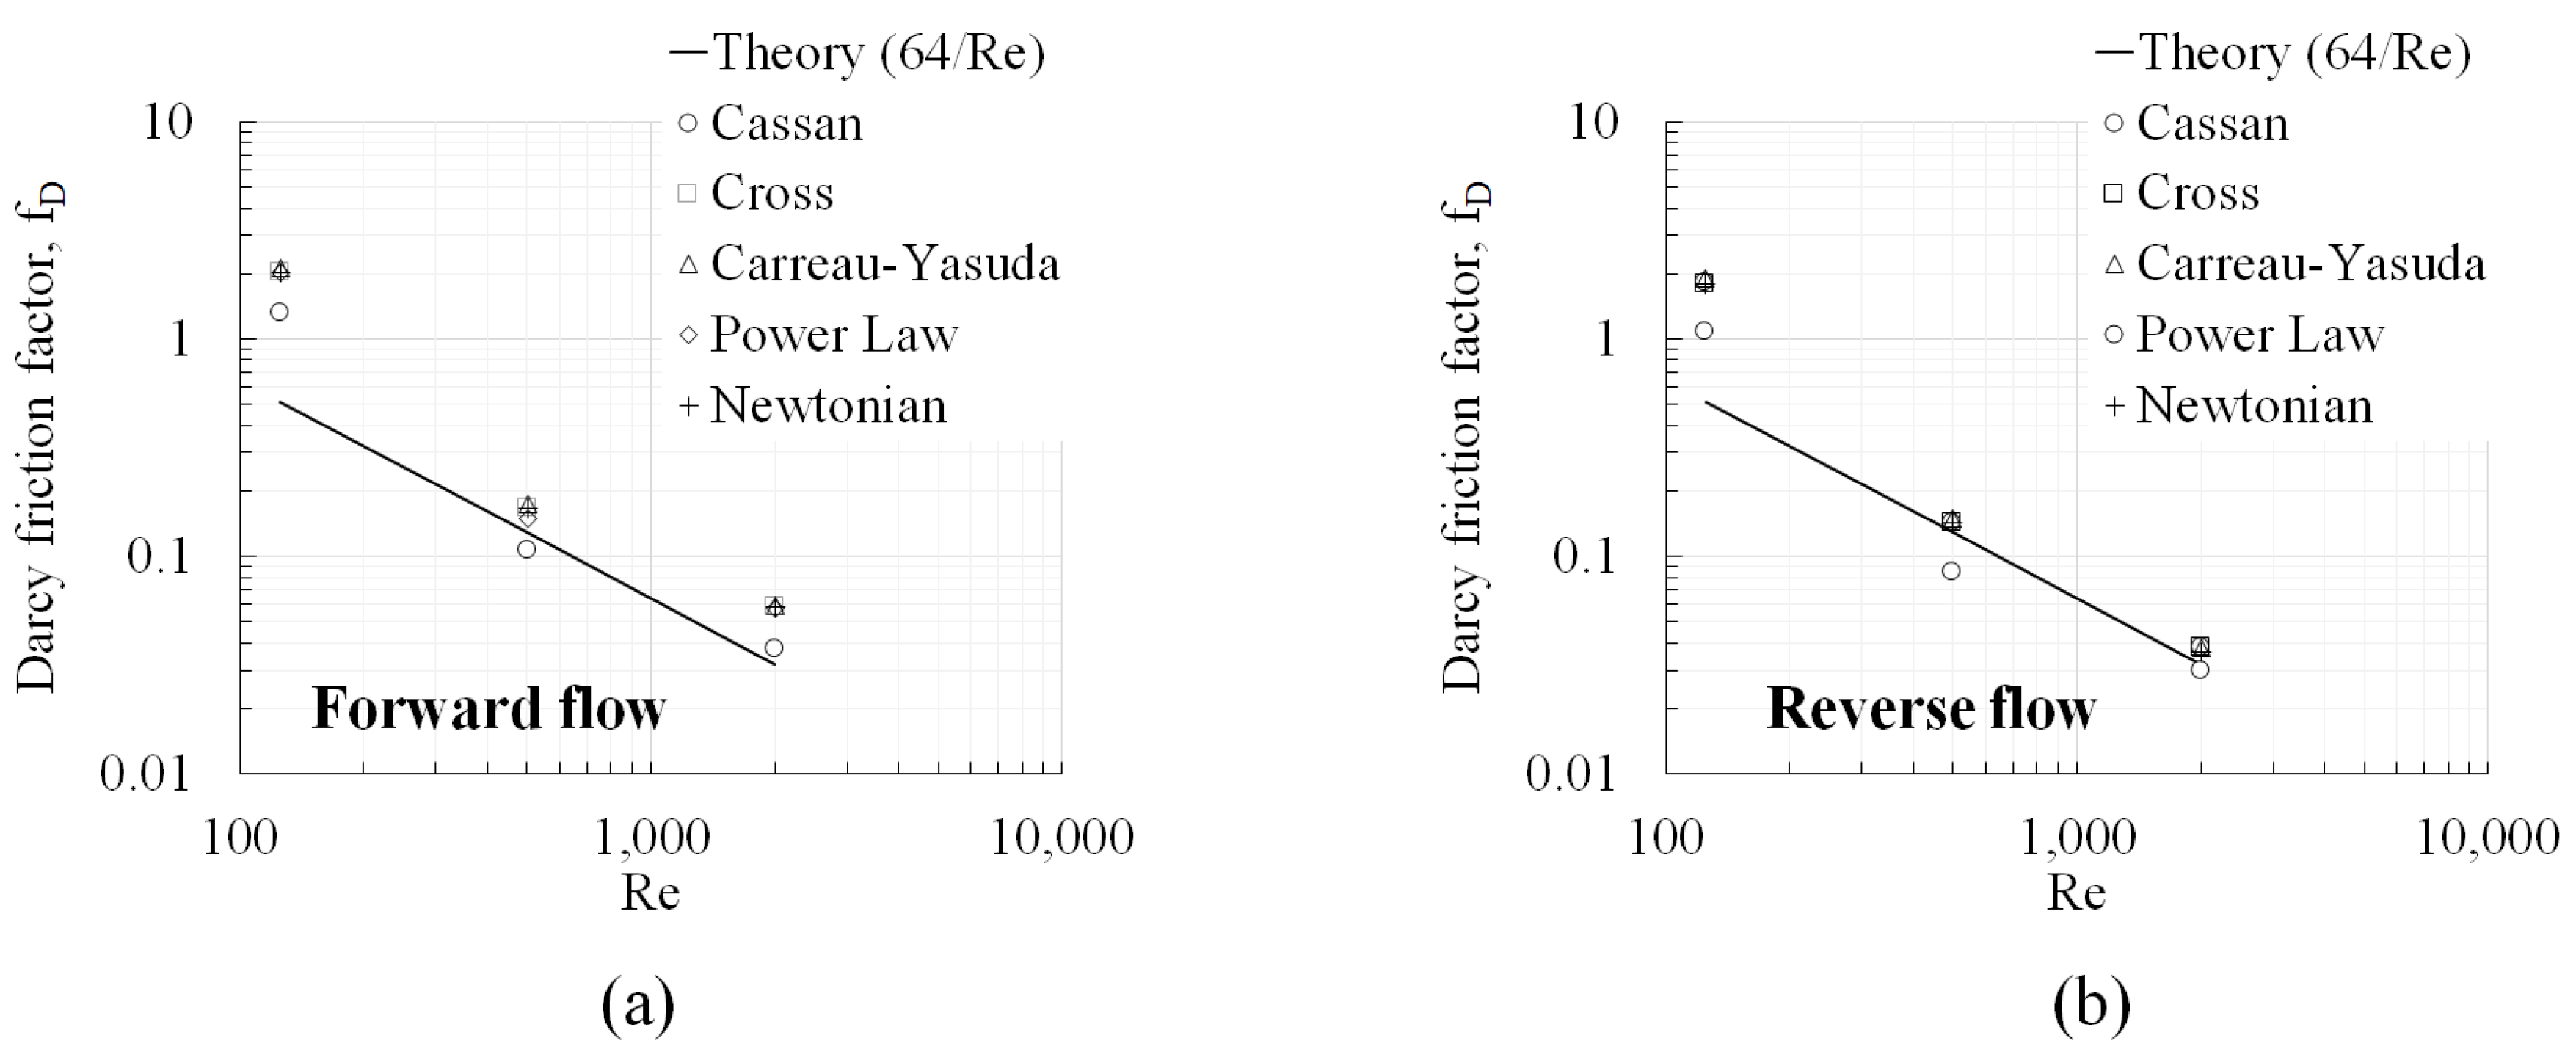
Figure 9.
Eulerian and Lagrangian blood damage index predictions in the capillary tube (a) Newtonian viscosity model; (b) Casson viscosity model; (c) Newtonian and Casson models .
Figure 9.
Eulerian and Lagrangian blood damage index predictions in the capillary tube (a) Newtonian viscosity model; (b) Casson viscosity model; (c) Newtonian and Casson models .
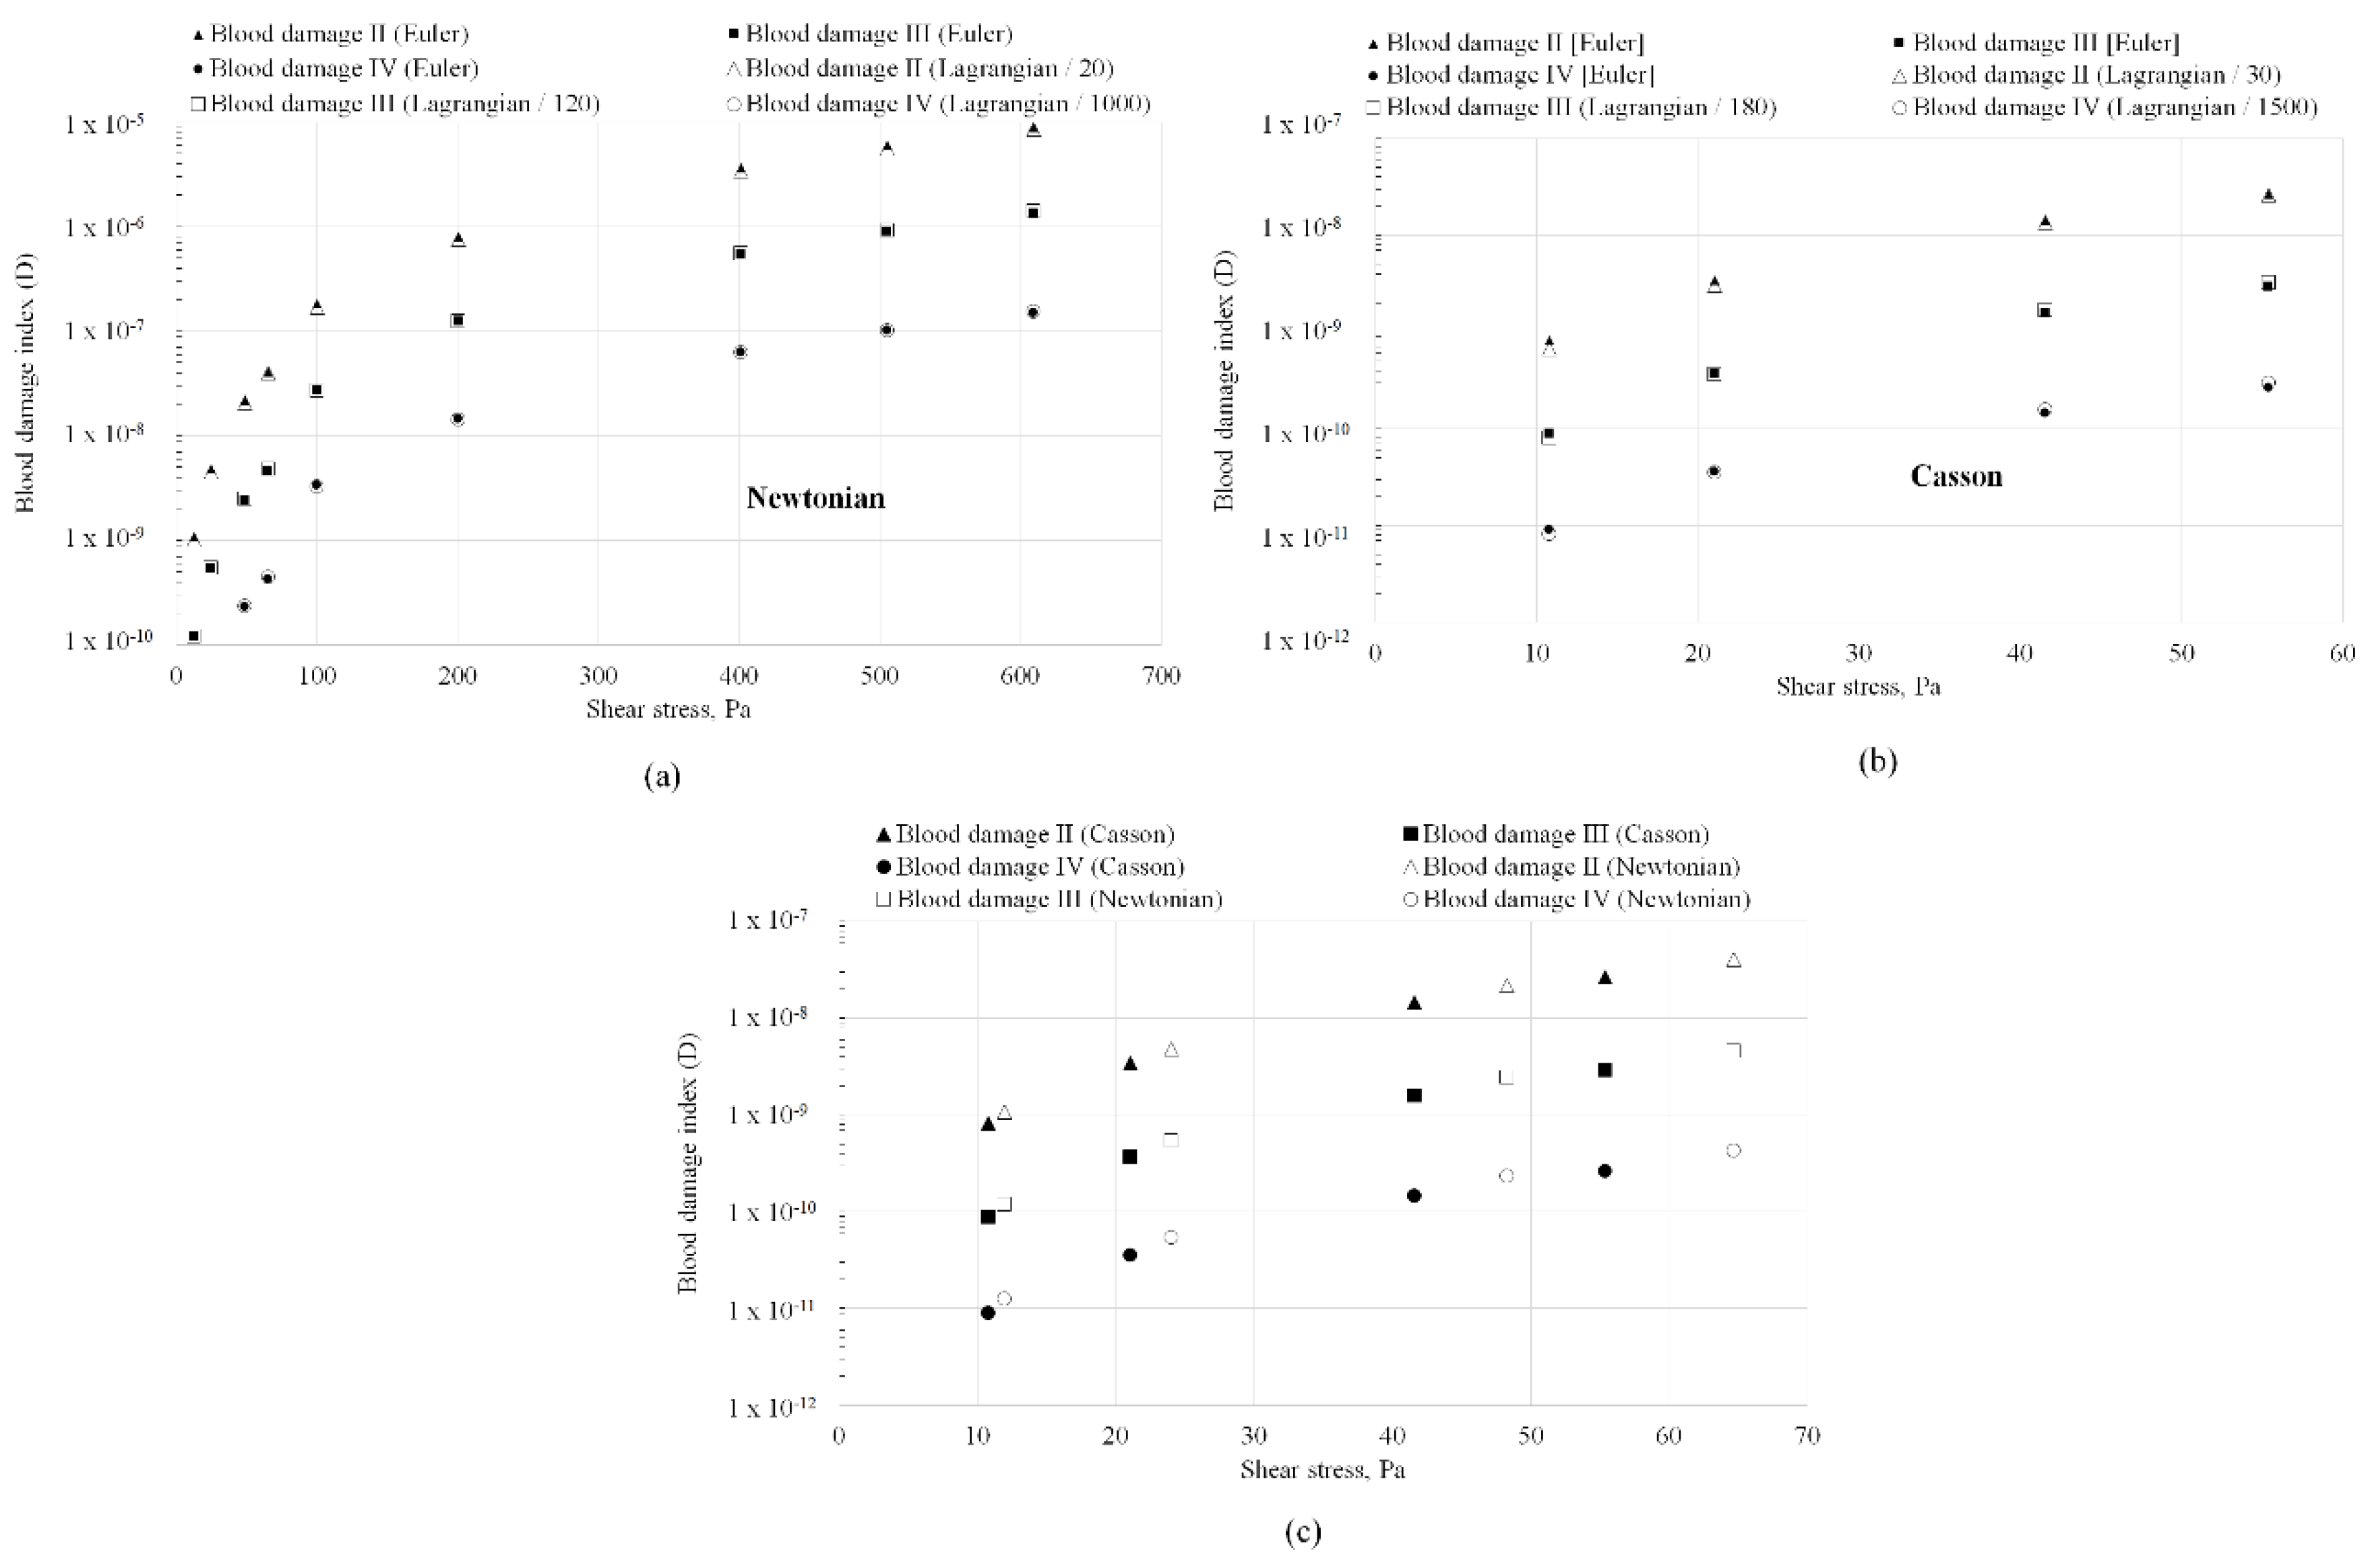
Figure 10.
Absolute values of the blood damage index predicted by the Eulerian framework across the throat of the FDA nozzle geometry (a) Re 125; (b) Re 500 (c) Re 2000. Prediction differences resulting from the flow direction are also shown. .
Figure 10.
Absolute values of the blood damage index predicted by the Eulerian framework across the throat of the FDA nozzle geometry (a) Re 125; (b) Re 500 (c) Re 2000. Prediction differences resulting from the flow direction are also shown. .
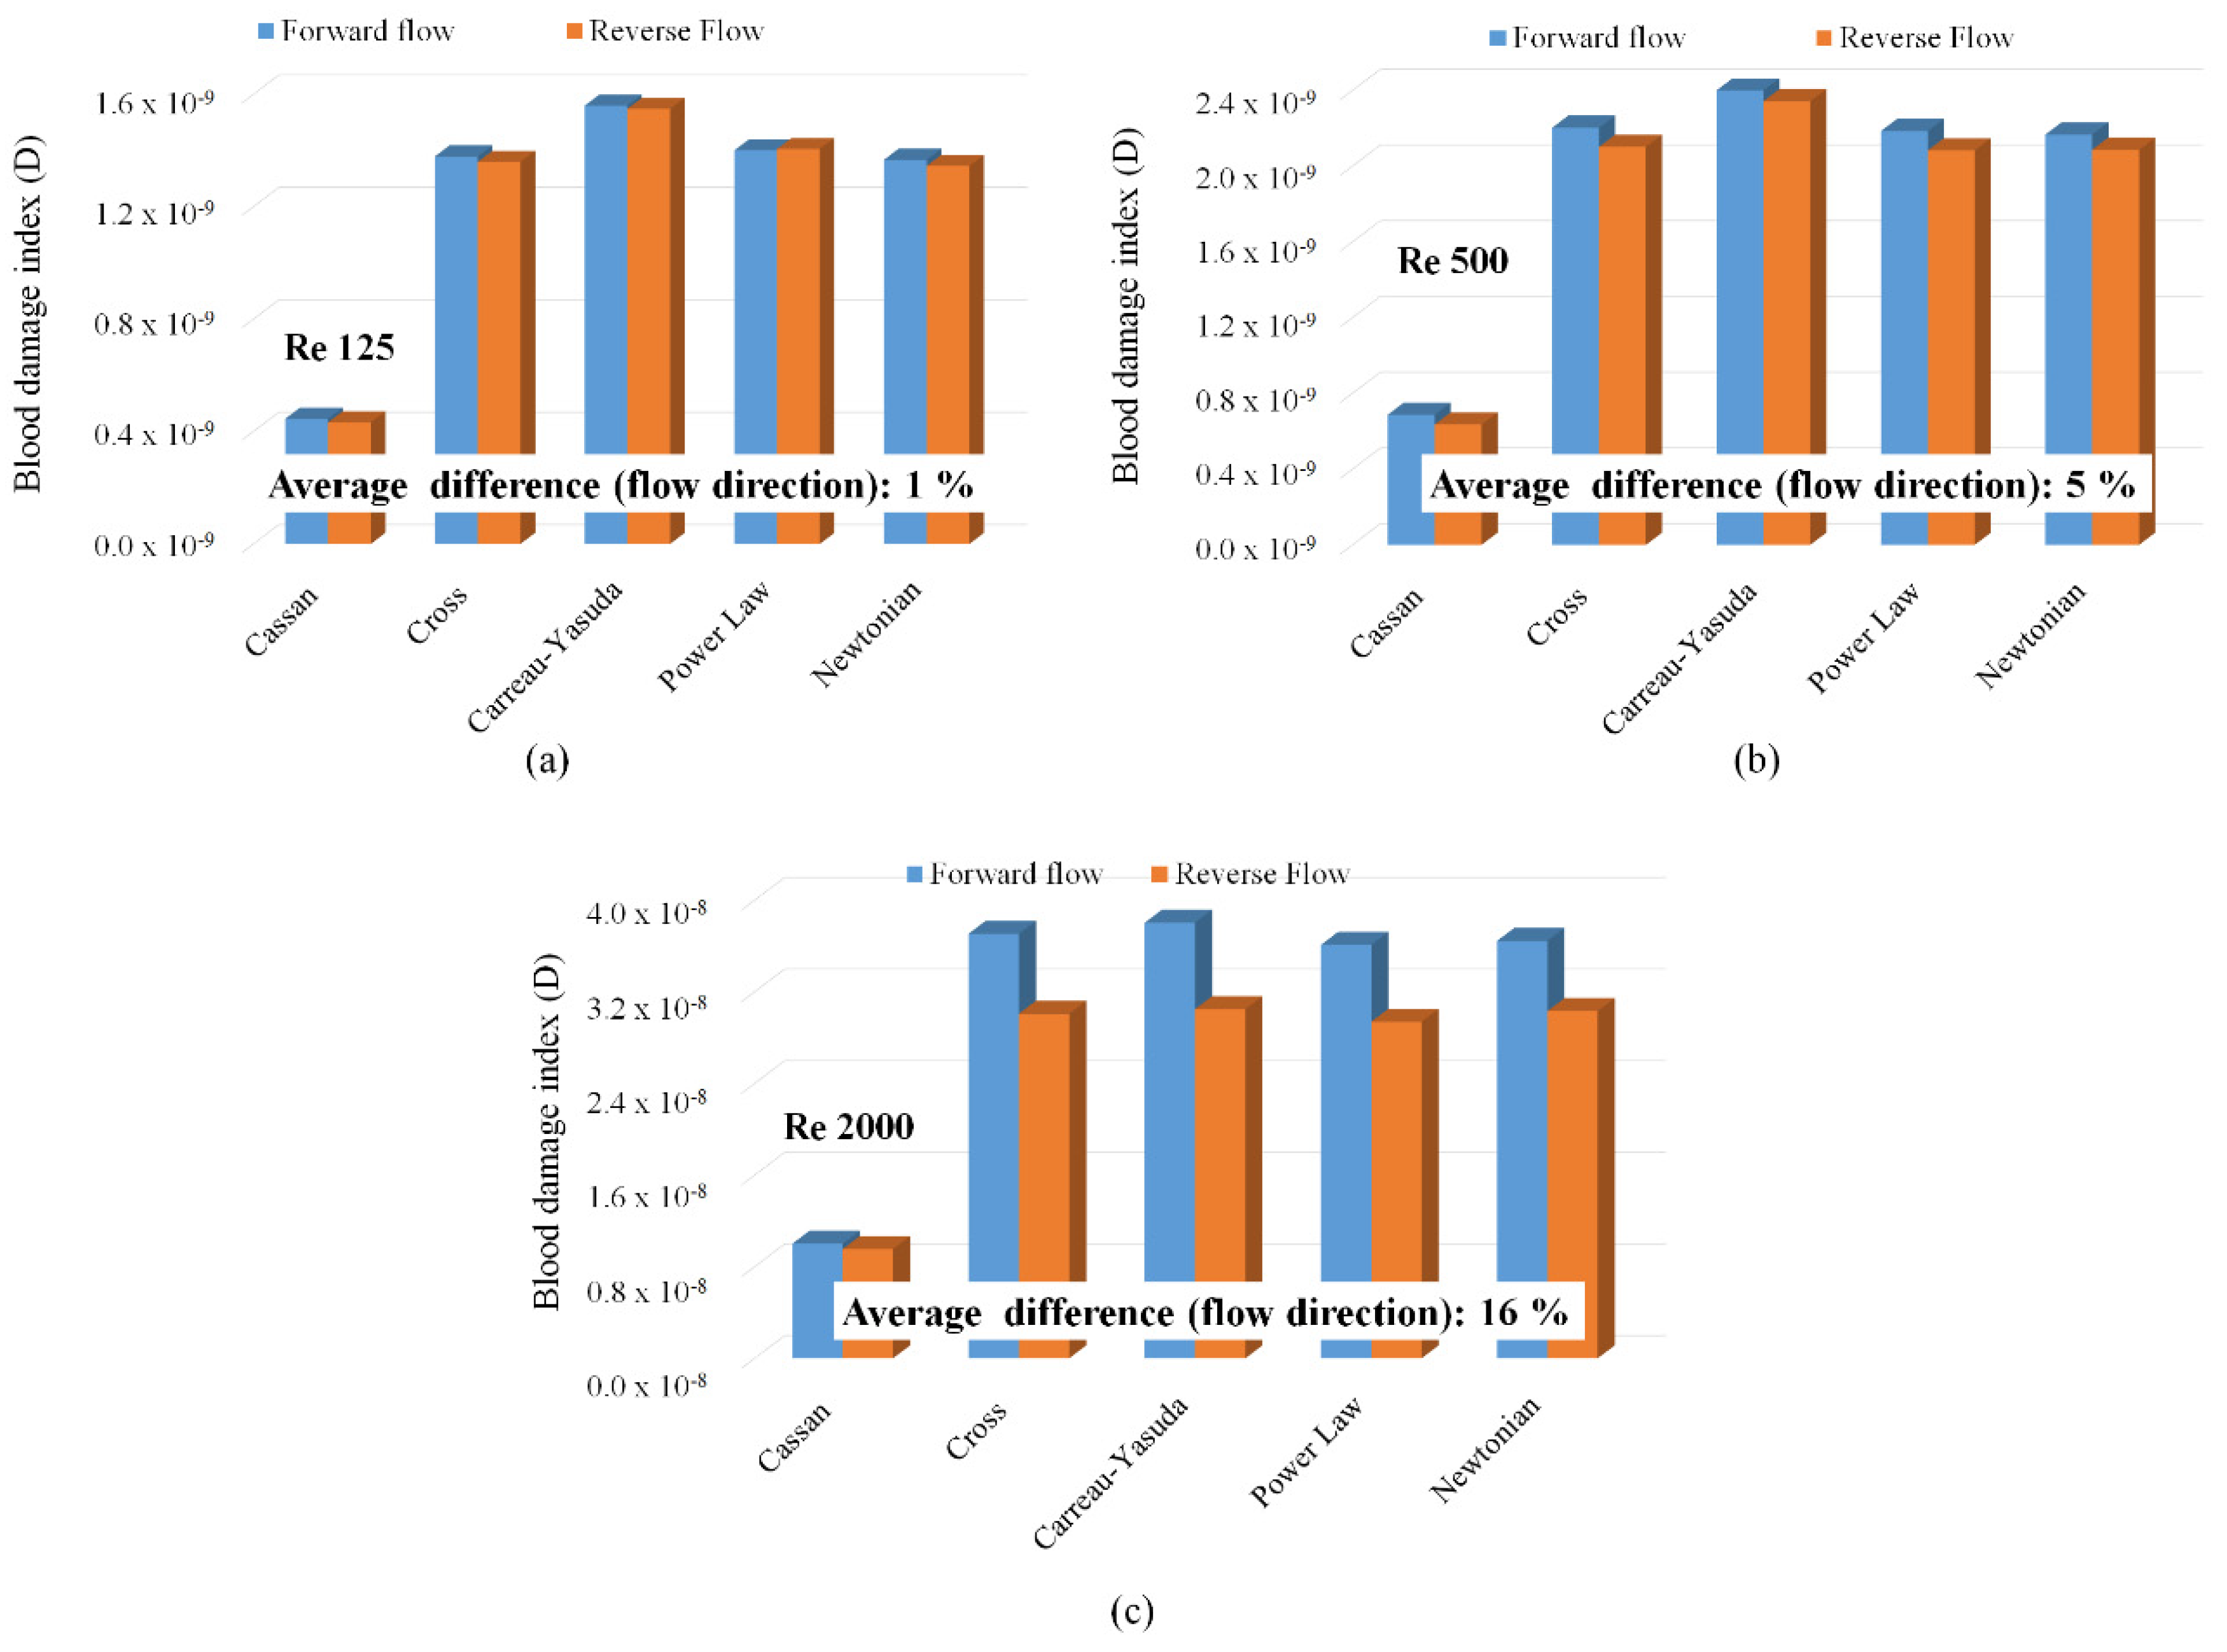
Figure 11.
Average shear stresses at the throat of the FDA nozzle geometry (a) Re 125; (b) Re 500 (c) Re 2000. Prediction differences resulting from the flow direction are also shown.
Figure 11.
Average shear stresses at the throat of the FDA nozzle geometry (a) Re 125; (b) Re 500 (c) Re 2000. Prediction differences resulting from the flow direction are also shown.
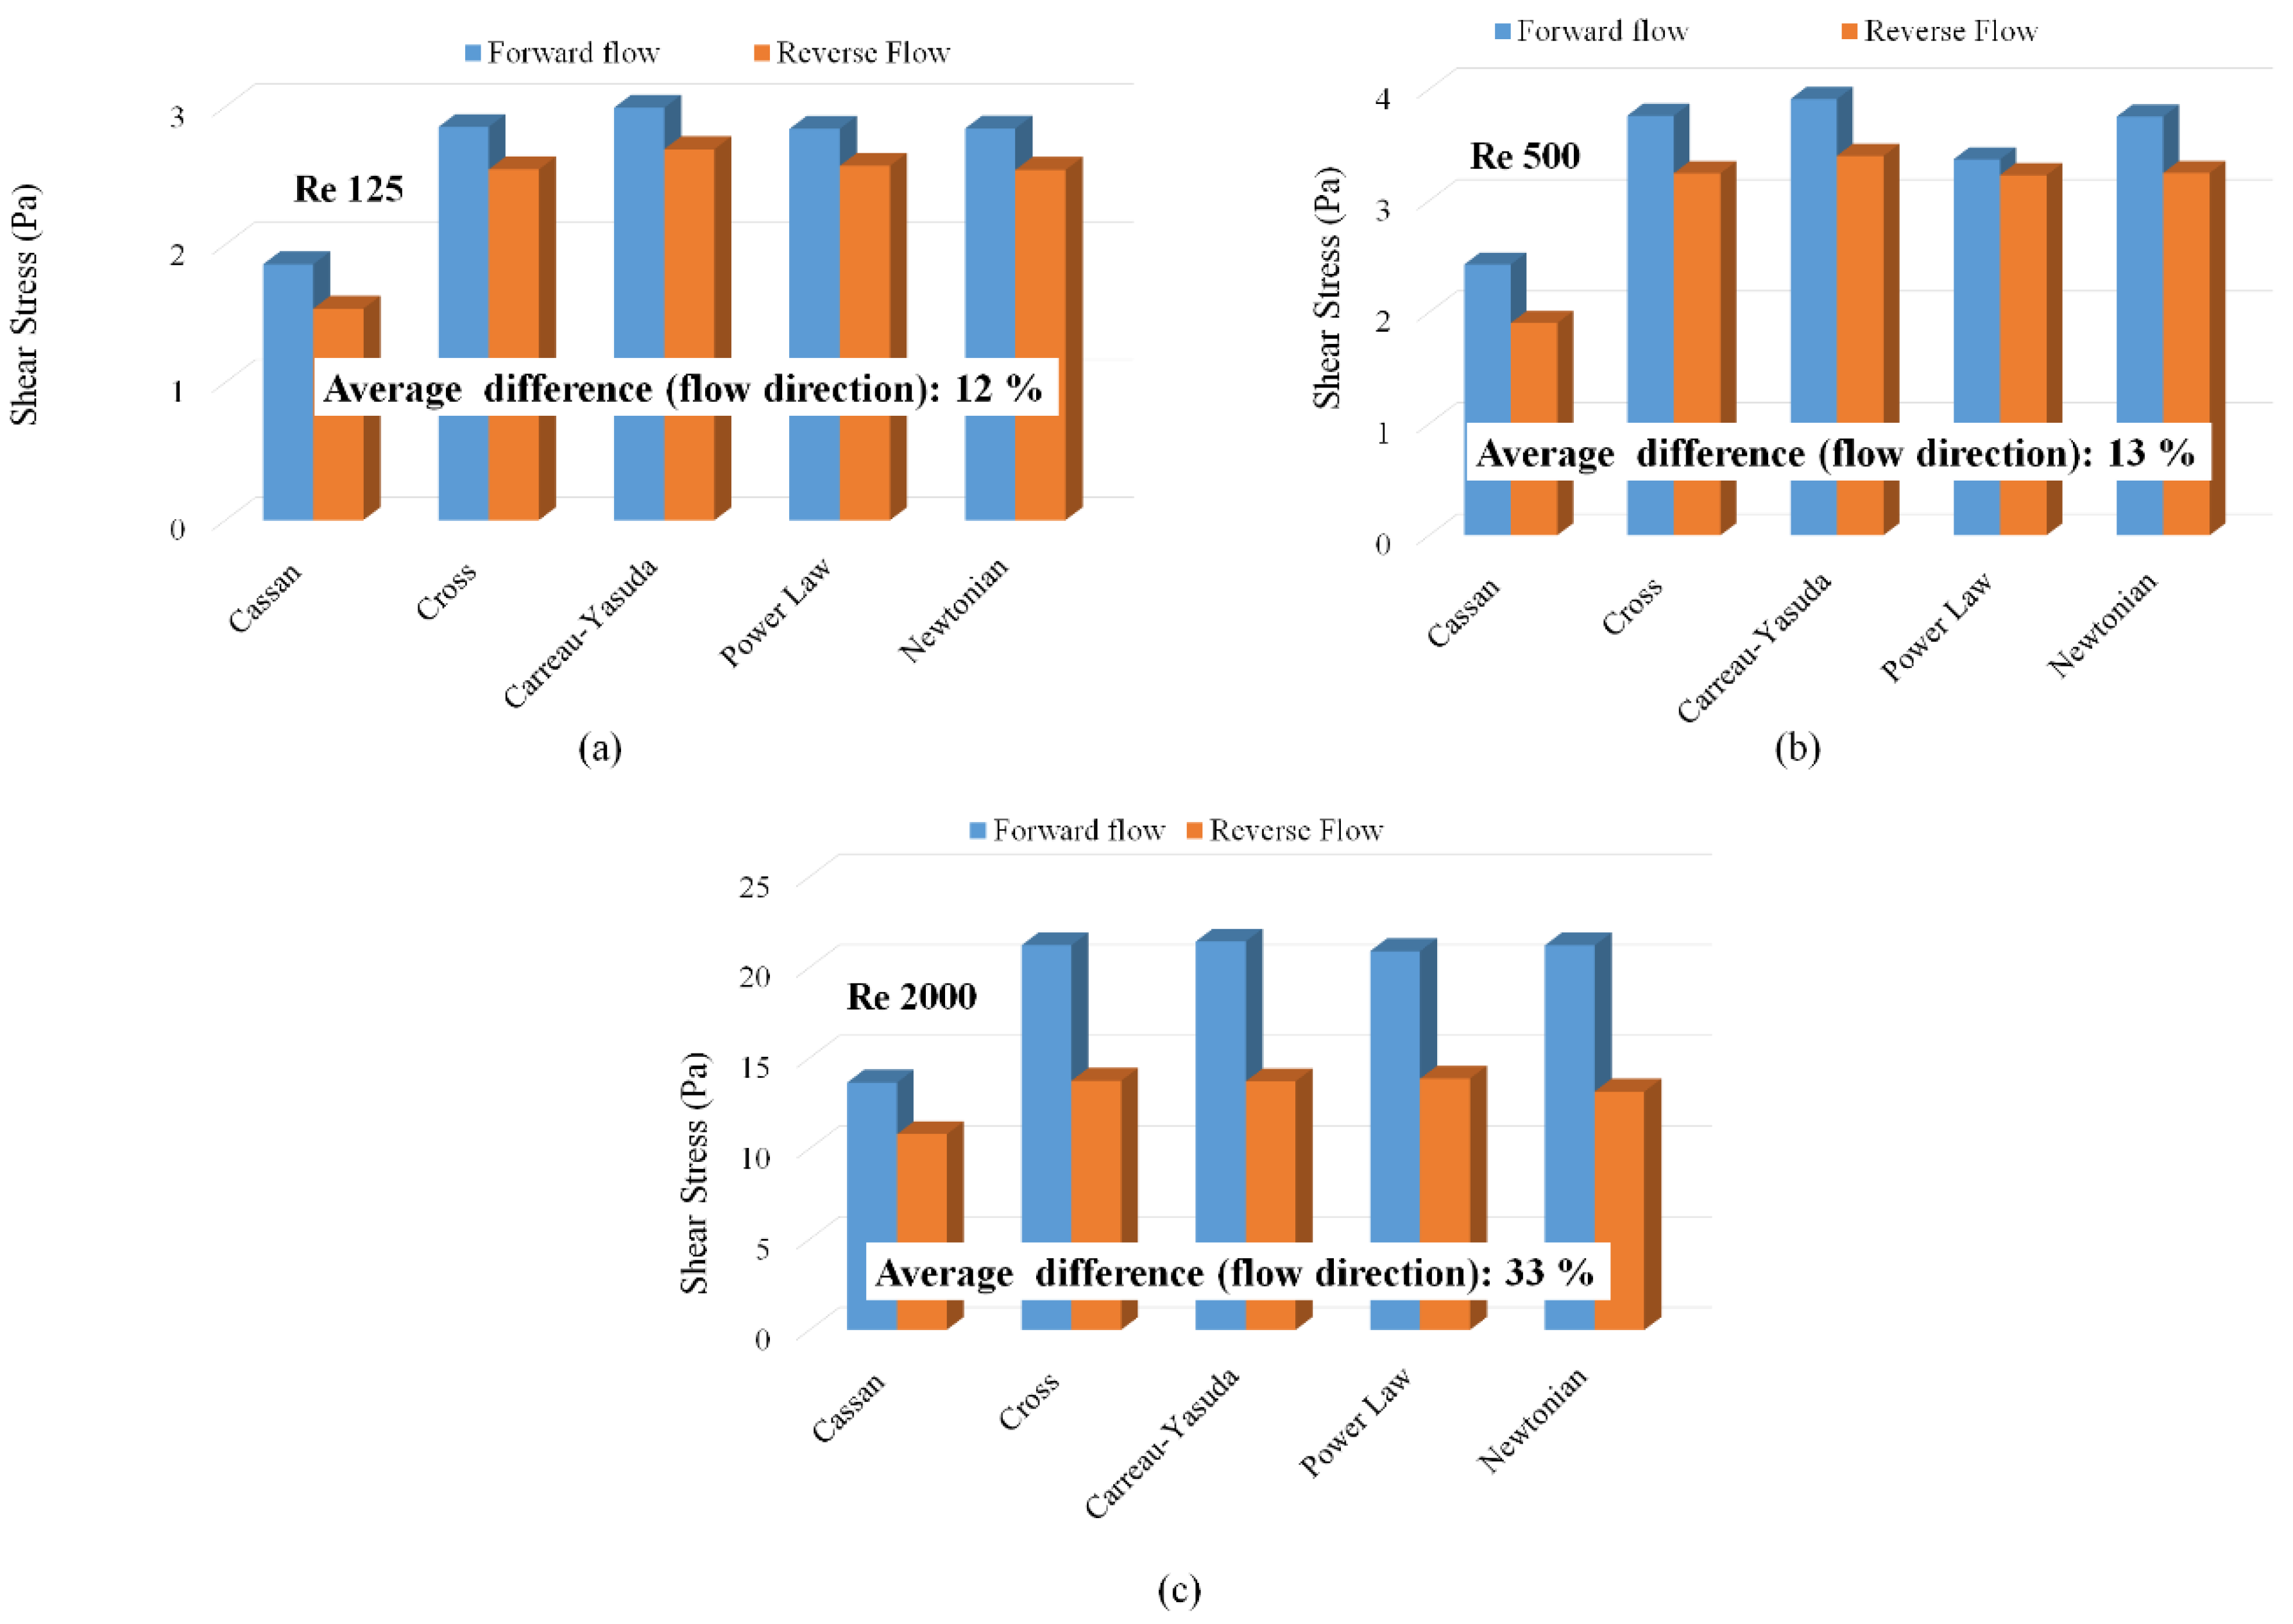
Figure 12.
(a) Eulerian and Lagrangian blood damage index predictions in FDA nozzle; (b) Strategy for relative hemolysis assessment using the simplified Lagrangian model (Eq. 11).
Figure 12.
(a) Eulerian and Lagrangian blood damage index predictions in FDA nozzle; (b) Strategy for relative hemolysis assessment using the simplified Lagrangian model (Eq. 11).
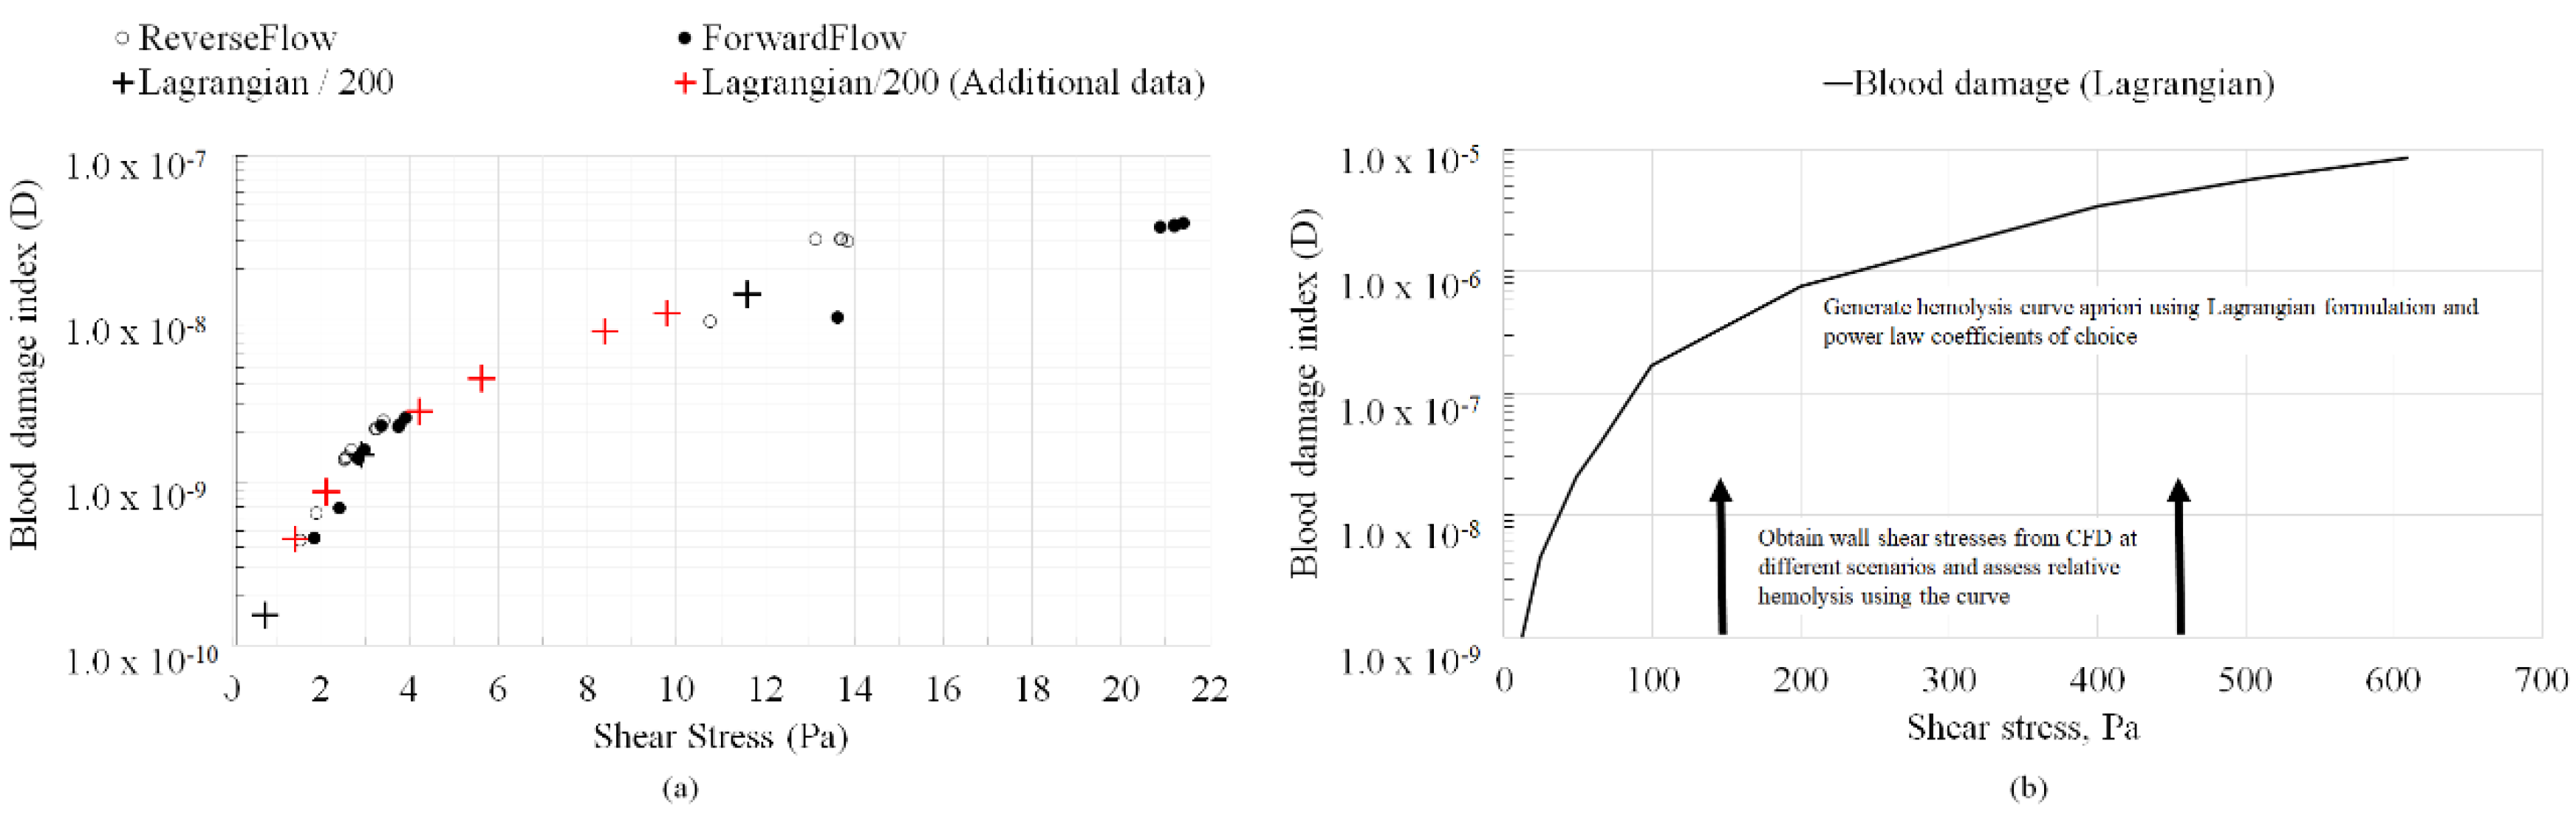

Table 1.
Viscosity (µ) versus shear rate and their coefficients utilized to evaluate non-Newtonian behavior of the fluid (blood) based on Kopernik [9].
Table 1.
Viscosity (µ) versus shear rate and their coefficients utilized to evaluate non-Newtonian behavior of the fluid (blood) based on Kopernik [9].
| Type | Viscosity Model | Constants |
| Carreau-Yasuda (CY) | ||
| Casson | ||
| Cross | ||
| Power Law | n = 0.7755 | |
| λ = 0.01467 | ||
Table 2.
Hemolysis constants associated with the blood damage index D which is expressed as a function of shear stress (τ) and exposure time (t) as:
Table 2.
Hemolysis constants associated with the blood damage index D which is expressed as a function of shear stress (τ) and exposure time (t) as:
| Model Name | Constants Source | a | b | C |
| Model I | Giersiepen et al. [10] | 0.785 | 2.416 | 3.620x10⁻⁷ |
| Model II* | Craven et al. [11], (ξ = 0.5) | 0.5 | 2.65 | 2.88x10⁻¹⁰ |
| Model III* | Craven et al. [11], (ξ = 0.75) | 0.7375 | 2.9 | 1.81x10⁻¹⁰ |
| Model IV* | Craven et al. [11], (ξ = 1.0) | 1.0 | 3.1 | 1.5x10⁻¹⁰ |
* ξ is a parametric variable employed to estimate the hemolysis constants in Craven et al. [11].
Table 3.
Summary of cases investigated.
| Geometry | Viscosity model |
Power law constants (Table 2) |
Shear stress ranges (Pa) | Average exposure time (s) ranges* |
| Straight capillary tube (hemolysis from inlet to outlet) |
Newtonian (0.002 Pa-s, 0.0063 Pa-s), Casson | Model II, III, IV | 10 - 600 | 5.8 x 10⁻³ to 93 x 10-3 |
| FDA nozzle forward flow (hemolysis from inlet to outlet across the throat only) |
Newtonian (0.0035 Pa-s), 5 Non-Newtonian (Table 1, Figure 3) | Model I | 1 - 20 | 24 x 10-3 to 386 x 10-3 |
| FDA nozzle reverse flow (hemolysis from inlet to outlet across the throat only) |
Newtonian (0.0035 Pa-s), 5 Non-Newtonian (Table 1, Figure 3) | Model I | 1 - 20 | 24 x 10-3 to 386 x 10-3 |
*Based on flow path length and inlet velocity.
Disclaimer/Publisher’s Note: The statements, opinions and data contained in all publications are solely those of the individual author(s) and contributor(s) and not of MDPI and/or the editor(s). MDPI and/or the editor(s) disclaim responsibility for any injury to people or property resulting from any ideas, methods, instructions or products referred to in the content. |
© 2025 by the authors. Licensee MDPI, Basel, Switzerland. This article is an open access article distributed under the terms and conditions of the Creative Commons Attribution (CC BY) license (http://creativecommons.org/licenses/by/4.0/).
Copyright: This open access article is published under a Creative Commons CC BY 4.0 license, which permit the free download, distribution, and reuse, provided that the author and preprint are cited in any reuse.


