Submitted:
25 July 2025
Posted:
28 July 2025
You are already at the latest version
Abstract
Peanut postharvest processing in developing regions often suffers from equipment mismatches due to lack of varietal specific engineering data. The objective of this study was to determine the physical and mechanical properties of four peanut cultivars (INIAP 380, Charapoto, Caramelo, and Rosita) grown in Manabí, Ecuador, to establish engineering parameters for design and optimization of postharvest equipment. Through standardized measurements and statistical analyses, was characterized kernel dimensions (length, equatorial diameter, mass, density, sphericity, flow properties (angle of repose), friction coefficients and rolling resistance coefficients (rubber, stainless steel, carbon steel). Key findings include: (1) 90.5% of kernels within the 6.8-10.28 mm diameter range ideal for mechanical sorting, but for accurate classification, gravimetric or densimetric methods should be employed instead of dimensional sorting (2) 33.7% lower dynamic friction on stainless steel versus rubber surfaces, and (3) Barriga de Sapo's superior sphericity (0.65) and rolling resistance (ρₑ=0.554±0.007). These results provide the first complete engineering dataset for Ecuadorian peanut varieties, enabling the design of adapted seeders, conveyors, and storage systems. The study particularly supports small-scale processors in Manabí through: (a) DEM/CFD modeling inputs, (b) evidence-based material selection (e.g., stainless steel for energy efficiency), and (c) quality control standards using density thresholds.
Keywords:
Geometric properties
; Friction properties
; Rolling resistance
; Groundnuts
1. Introduction
The peanut (Arachis hypogaea L.) is a legume native to South America, specifically the region spanning northern Argentina and southern Bolivia, where its hybrid origins have been confirmed. This crop has a global distribution and thrives in diverse habitats, including grasslands, open forests, and even temporarily flooded areas [1,2]. Peanut seeds are a valuable raw material for edible oil production, human consumption, and animal feed. Due to their nutritional and functional properties, they are widely used in the confectionery, cosmetics, and pharmaceutical industries. In Ecuador, particularly in Manabí Province and other regions worldwide, peanuts are a staple in local diets [3]. Beyond their nutritional value, peanuts offer health benefits due to their antioxidant and anti-inflammatory properties [4,5].
Globally, peanut cultivation covered 30.9 million hectares in 2023, producing 54.3 million tons of in-shell peanuts, with an average yield of 1.76 t/ha [6]. China is the world’s leading producer, accounting for 37.6% of total output, followed by India (14%), Nigeria (8.5%), and the United States (5.8%) [7].
Characterizing varietal specific engineering properties is essential for designing adapted systems. Previous studies in other regions (India, Nigeria, Turkey) have linked kernel size, density, and friction to machinery performance [8,9,10]. This research aims to fill that gap by characterizing kernel properties for four local cultivars. The physical and mechanical properties of peanuts significantly influence the design of agricultural machinery for sowing, harvesting, and post-harvest processing. For instance, seeders require dosing mechanisms with optimized cell geometry to ensure efficient planting. Post-harvest operations such as drying, roasting, grading, milling, and packaging, also depend on these properties. Peanuts with lower bulk density often indicate inferior quality, potentially due to pest infestations. Additionally, frictional properties (e.g., static coefficient of friction and angle of repose) are critical for designing discharge hoppers, paddle conveyors, and auger screws, as well as storage silos in peanut oil processing [11,12,13,14]. Olajide and Igbeka [15] report that kernel size is another key factor, as larger peanuts yield more oil and paste than smaller ones. Furthermore, physical and mechanical properties affect mechanical damage during harvesting, threshing, transportation, and storage. Extensive research has been conducted on these properties for various crops, including: rice [16], 2023), wheat [17], corn [18,19], soybeans [20,21], bambara groundnut [22,23,24], peanuts [3,4,11,25,26], walnut [27] and beans [20,28], among others.
Ecuador’s peanut production is relatively small compared to global leaders. In 2023, only 3,447 hectares were harvested, yielding 2,692 tons of in-shell peanuts, with an average productivity of 757.1 kg/ha [6]. Manabí is Ecuador’s leading peanut-producing province, where cultivation occurs primarily within family farming systems with low mechanization rates [29]. Four main peanut cultivars dominate this region: INIAP 380; Charapoto or Criollo; Caramelo or INIAP 382; and Rosita or INIAP 381 [3]. Post-harvest processing typically occurs in rural factories, where peanuts are transformed into marketable products. Research on the physical and mechanical properties of peanuts is essential for developing sustainable post-harvest technologies, aligning with UN Sustainable Development Goal 2 (Zero Hunger), which aims to end hunger, ensure food security, improve nutrition, and promote sustainable agriculture [30].
The high cost and limited accessibility of imported post-harvest machinery pose significant challenges for small-scale peanut producers in Manabí, Ecuador. This study was therefore conducted to determine the physical and mechanical properties of kernels from four locally grown peanut cultivars (INIAP 380, Charapoto, Caramelo, and Rosita). The findings will provide essential data for designing and developing affordable, locally adapted post-harvest technologies, ultimately supporting the region’s agricultural sustainability and productivity.
2. Materials and Methods
This research was conducted under controlled laboratory conditions at the Instituto de Ciencias Básicas (ICB), Universidad Técnica de Manabí, Ecuador. The following physical properties of peanut kernels were determined: dimensional parameters (length, equatorial diameter, and roundness coefficient), mass-volume relationships (mass, true density, bulk density, and porosity), mechanical properties (static and dynamic coefficients of friction, static and dynamic coefficients of rolling resistance).
2.1. Sample Preparation and Selection
Peanut kernel samples were obtained from the four cultivars in Manabí province: INIAP 380, Charapoto (Criollo), Caramelo (INIAP 382), and Rosita (INIAP 381). Certified seeds (10 kg per cultivar) were initially selected from experimental fields of the Instituto Nacional de Investigaciones Agropecuarias (INIAP) in Portoviejo, Ecuador. For property measurements, we employed a randomized sampling approach, analyzing 200 individual kernels per cultivar. This sample size ensures statistical reliability while accounting for natural variability within each peanut variety. The Figure 1 illustrates the representative kernel samples used in the study.
2.2. Methodology to Determine the Physical and Mechanical Properties
Mass (m): kernel mass was measured using an Ohaus Pioneer PA512 precision balance (capacity: 510 g; accuracy: ±0.001 g).
Length (L): measured as the maximum longitudinal dimension using a WEZU digital caliper (250 mm range; ±0.05 mm accuracy).
Equatorial diameter (ED): determined at the kernel’s widest cross-section using a Palmer caliper, with three replicate measurements per kernel.
Roundness coefficient (Cr): dimensionless roundness coefficient was calculated as:
True Density (): determined using the water displacement method following. Individual kernels were precisely weighed using the Ohaus PA512 balance, immersed in a graduated cylinder containing distilled water, the volume displacement (Vs) was recorded. True density was calculated as:
Bulk density (): determined weighing a known quantity of kernels, carefully pouring them into a graduated cylinder in layers, applying controlled tapping to achieve consistent packing. Recording the total occupied volume (Vₜ) bulk density was calculated as: .
Porosity (ε): from density measurements:
Angle of repose: was determined using the movable box method used by Akcali et al. (2006). The experimental setup consisted of a transparent acrylic box (20 × 15 cm) with one movable side wall. Once the box was filled with peanut kernels, the wall was moved horizontally, causing the grains to move or flow in direction of the horizontal axis. The angle (φ) formed between the baseline and the material flow line is related to the angle of repose of the peanut kernels. The Figure 2 shows peanut kernels inside the box before (left) moving the movable wall and after moving movable wall (right).
Coefficient of static friction (): was determined using adjustable inclined plane apparatus with interchangeable test surfaces of stainless steel, carbon steel and rubber. A single kernel was positioned longitudinally on the horizontal test surface. The plane was gradually inclined (0.5°/s) until imminent motion occurred and the tilt angle (φ) at the initiation of sliding was recorded. The static coefficient was calculated as:
Coefficient of dynamic friction (): was determined employing the same apparatus with modified procedure. The surface was inclined to 80% of the static friction angle, a standardized impulse was applied to initiate motion, the maintained sliding angle (φ’) was recorded and the dynamic coefficient of friction was calculated as:
Coefficient of static rolling resistance (): to determine the kernels were oriented crosswise on the inclined plane test surface. Plane inclination was gradually increased (0.25°/s) until rolling initiation. Critical angle () was recorded when continuous rolling commenced, coefficient of static rolling resistance was calculated as:
Coefficient of dynamic rolling resistance (): was determined with the same procedure and equipment used to determine coefficient of static rolling resistance. The surface was inclined until static threshold angle and standardized impulse was applied. Sustained rolling angle () was recorded. Dynamic coefficient was calculated as:
The experimental results were analyzed using Statgraphics Centurion 19. Analysis of variance (ANOVA) was employed to determine significant differences among the means of the experimental groups, assessing the overall variability within the dataset. Following the ANOVA, Duncan’s multiple range test, was applied to conduct pairwise comparisons and identify specific group differences. Calculations were performed at the significance level of = 0.05.
3. Results and Discussion
3.1. Physical Properties of Peanut
Mass. The Figure 3 displays the frequency histograms of kernel mass distribution for each peanut variety. Analysis of 100 kernel samples revealed that 70% of Rosita kernels fell within the 33.33–50 g range, while Charapotó showed 50% grouped between 40–53.1 g. For Barriga de Sapo, 63% of seeds clustered in the 50–75 g interval, whereas Caramelo kernels exhibited 55% distribution between 58–72 g.
The Barriga de Sapo variety exhibited the highest kernel mass (0.68 ± 0.009 g, mean ± SE), ranging from 0.33 ± 0.009 g to 1.16 ± 0.09 g with a standard deviation <0.13 g, while Rosita showed the lowest mass (0.45 ± 0.08 g). ANOVA revealed statistically significant inter-varietal differences (P<0.001, F=0.05, α=0.05), with post-hoc Duncan testing (95% CI) confirming distinct mass groupings across all varieties (Table 1).
A mass difference of 0.23 g was observed between the heaviest (Barriga de Sapo) and lightest (Rosita) varieties. These findings align with global studies. Yohanes et al. [31]reported 0.43 ± 0.08 g for Indonesian varieties, while Aydin [32] documented higher masses (2.16 ± 0.078 g) in Turkish cultivars. Comparable results were obtained by Ofori et al. [13] for five Ghanaian varieties, Kiran et al. [12] for eight Indian cultivars, and Gojiya et al. [11] for two Indian genotypes. Herrera-Suárez et al. [3] recorded a mass of 0.49 ± 0.009 g for Ecuadorian Criollo peanuts, consistent with both regional varieties and our results, suggesting this trait may be influenced by agroecological and climate conditions.
Length. Kernel length varied significantly across varieties (12.64-16.02 mm; Figure 4), with Rosita exhibiting the shortest grains and Caramelo the longest. ANOVA (α=0.05) revealed statistically significant differences in mean lengths, which were confirmed by Duncan’s test (p<0.05) for all pairwise comparisons except between Charapotó and Barriga de Sapo varieties, which showed no significant difference.
The kernel length measurements align with previous researches while demonstrating distinct varietal characteristics. Balasubramanian et al. [9] reported a broader length range (11.9–19.8 mm) in Indian varieties compared to our findings (12.64–16.02 mm), with their maximum length exceeding our largest measurement (Caramelo variety: 16.02 mm). This pattern persists in other studies: Akcali et al. [8] categorized peanut lengths at 16–22 mm, while Aydin [32] recorded 20.95 mm in Turkish cultivars and ElMasry et al. [33] reported 18.9 mm. The observed variability is consistent with findings by others authors [13,14,25], suggesting that length dimensions are strongly influenced by both genetic factors and growing conditions.
Equatorial diameter. The equatorial diameter analysis revealed significant varietal differences, with Barriga de Sapo exhibiting the largest mean diameter (9.27 mm) and Charapotó the smallest (7.69 mm). Duncan’s multiple range test (Table 2) confirmed statistically significant inter-varietal differences (p<0.05), except between Charapotó and Rosita varieties, which were not significantly distinct. These findings demonstrate clear morphological differentiation among the peanut cultivars studied.
Frequency analysis of equatorial diameters across the four peanut varieties revealed a 5-12 mm range, with 90.5% probability of diameters falling within the 6.8-10.28 mm range - the optimal size for mechanized classification systems currently used in Ecuador’s peanut industry. This finding is particularly relevant as existing processing equipment relies fundamentally on equatorial diameter for size-based sorting. Comparative studies show strong alignment with Akcali et al. [8] (7.5-11.6 mm), while Aydin [32] and ElMasry et al. [33] reported slightly larger diameters (>10.44 mm). These measurements are consistent with later findings [3,13,15]. Besides, Akcali et al. [8] demonstrated low correlation (r<0.40) between length and equatorial diameter. These authors propose that despite this, the geometry of the peanut can be characterized using the equatorial diameter.
Roundness coefficient. The roundness coefficients revealed significant varietal differences, with Barriga de Sapo (0.65 ± 0.006) and Rosita (0.61 ± 0.007) exhibiting the highest sphericity—attributed to Barriga de Sapo’s large equatorial diameter and Rosita’s short kernel length, respectively. While these values indicate moderate sphericity (non-rounded morphology), ANOVA confirmed statistically significant inter-varietal differences (p<0.05). Comparative researches show alignment with Balasubramanian et al. [9] (0.6–0.7), Araujo et al. [34] (0.64), and Ofori et al. [13] (0.65–0.77), though contrast with Fashina et al. [10] (0.35–0.39) and exceed by Aydin [32] 0.57. Notably, Bepary et al. [35] classify materials >0.60 as spherical. These peanut varieties may preferentially roll rather than slide during processing [9,11,12,13].
Pearson correlation analysis revealed no significant relationship between kernel mass and geometric dimensions in the studied varieties. This finding indicates that peanut kernels should not be classified by size when uniform mass and dimensional characteristics are required, due to substantial variability in weight relative to physical dimensions. For accurate classification, gravimetric or densimetric methods should be employed instead of dimensional sorting.
True density measurements showed significant variation among cultivars (1016.13-1055.80 kg/m³), with Barriga de Sapo (1055.80 kg/m³) and Rosita (1050.20 kg/m³) demonstrating the highest values, significantly exceeding (p<0.05) Caramelo’s minimum density (1016.13 kg/m³). All values surpassed water’s density (1000 kg/m³ at 4°C), consistent with the observed buoyancy behavior where >90% of kernels sank during hydrostatic testing.
The Duncan multiple comparison test revealed no statistically significant differences (p > 0.05) in true density among the means of four researched varieties. These results align with previous studies on peanut varieties worldwide: Aydin [32] reported 989–1088 kg/m³, El-Gamal et al. [36] found 944–1013 kg/m³, Gojiya et al. [11] documented 1003–1077 kg/m³, Kiran et al. [12] observed 859.99–1057.57 kg/m³ (eight varieties), and Muhammad et al. [37] recorded 840–1130 kg/m³. In contrast, Akcali et al. [8], reported notably lower densities (420–580 kg/m³). Similar densities occur in other kernels: Soyoye et al. [38] determined 1369 kg/m³ for corn and 1087 kg/m³ for soybean; Bepary et al. [35] measured 1138.40–1388.79 kg/m³ for rice-bean (Vigna umbellata), and Baryeh [22] reported 1285 kg/m³ for bambara groundnut (Vigna subterranea), demonstrating broader consistency in legume and cereal kernel densities.
Bulk density analysis revealed that peanut kernels exhibited values ranging from 588 to 603.4 kg/m³ across varieties, with Rosita (601.80 kg/m³) and Caramelo (603.40 kg/m³) showing the highest values, while Barriga de Sapo displayed the lowest density (588 kg/m³). This result is attributable to its larger kernel size creating greater interstitial spaces. ANOVA indicated no statistically significant differences among varieties. These findings align with previous reports on peanut cultivars: 539-581 kg/m³ [32], 443-619 kg/m³ [9], 550-920 kg/m³ [37], 598 kg/m³ [34], 606-670 kg/m³ [11], and 569.45-676.33 kg/m³ [12]. However, Akcali et al. [8] reported consistently lower values (230-280 kg/m³), mirroring their observations for true density
Density is a fundamental parameter for designing gravimetric classification machines, particularly for predicting kernels’ aerodynamic response during cleaning and grading. These density properties are equally crucial for other post-harvest equipment used in grain cleaning, transportation, handling, and storage. Both true and bulk density serve as important quality indicators, with pest-infested grains typically showing density reductions. Moreover, these properties are essential for calculating silo static capacities, determining wall pressures, and planning transport system capacities in grain storage facilities. Proper consideration of density characteristics is therefore vital throughout post-harvest system design and operation [3,12,17,38].
Porosity analysis revealed values ranging from 71.18% to 80.89% across peanut varieties, with Charapotó (80.89%) and Caramelo (73.70%) exhibiting the highest porosity levels - a critical parameter for designing grain drying and storage equipment [12]. ANOVA indicated no statistically significant differences (p > 0.05) among varieties at the 95% confidence level. These findings align with porosity ranges reported in previous studies, demonstrating consistency across different peanut cultivars and research conditions [3,32,34].
3.2. Mechanical Properties of Peanut
Angle of repose (φ). Analysis revealed significant variation among varieties, with Barriga de Sapo showing the highest value (30.5°), followed by Rosita (28.8°) and Charapotó (28.4°). While ANOVA indicated no statistically significant differences (p > 0.05). Previous studies have documented similar ranges: 24.7-27.1° [37], 22-26° [11], and 13.65-21.59° [12]. Akcali et al. [8], observed an inverse relationship between kernel size and angle of repose (26° for larger kernels vs. 29.2-36° for smaller ones), while aligning with Ofori et al. [13] who reported smaller angles for finer grains. The measured angles (28.4-30.5°) indicate excellent flowability [39], a critical parameter for designing hopper geometries in seeders and silos, determining conveyor belt widths, and optimizing inclination angles for hoppers, conveyors, and discharge chutes [12,38,40]. Lower angles of repose (<30°), as observed in this study, are particularly desirable for efficient material discharge [12].
Coefficients of friction and coefficients of rolling resistance revealed consistently higher values for static versus dynamic conditions, consistent with the greater force required to overcome initial inertia, a typical result for sliding or rolling phenomena [41]. As shown in Table 3, the Barriga de Sapo variety exhibited the highest coefficient of static friction, ( = 1.10 ± 0.01) on rubber surfaces, attributable to its larger contact area. ANOVA and Duncan’s test (p<0.05) confirmed significant differences between all three tested surfaces, reflecting their distinct roughness profiles. These findings align with fundamental tribological principles where static friction exceeds kinetic friction due to surface adhesion effects and interlocking mechanisms at rest. The results have important implications for equipment design, particularly for hopper angles and conveyor systems handling different peanut varieties.
Observed values here of the coefficients of static friction align with previous studies while highlighting material dependence variations. Gojiya et al. [11] reported wood > sheet metal > glass static friction hierarchy (0.36 ± 0.03, 0.34 ± 0.019, and 0.32 ± 0.026 respectively) for two Indian varieties, consistent with Kiran et al. [12] who observed a range of 0.20–0.44 across eight varieties on similar surfaces. This surface dependent pattern persists in Muhammad et al. [37] (0.31–0.56) and ElMasry et al. [33] (0.42–0.60), though Akcali et al. [8] recorded lower values (0.23–0.34) on metal surfaces, likely due to differing surface finishes or varietal characteristics. In other materials as corn, obtained a corn-steel coefficient of static friction of 0.545 [42].
As in the previous case, analysis of coefficient of dynamic friction revealed surface dependent variations, with rubber exhibiting the highest dynamic friction (μ_d = 0.95 ± 0.01 for Charapotó variety), followed by carbon steel and stainless steel (Table 3). ANOVA confirmed statistically significant differences between surfaces (p < 0.05), with Duncan’s test showing all pairwise comparisons were significant. The observed hierarchy (rubber > carbon steel > stainless steel) aligns with tribological principles, where softer surfaces (rubber) typically generate greater frictional resistance than harder metals, and surface roughness differences explain the variation between steel types [43]. These results emphasize the importance of contact surface selection in peanut processing equipment design to optimize material flow and minimize energy consumption.
Early studies demonstrate consistent patterns in behavior of dynamic friction coefficients across agricultural materials. Aydin [32] reported higher dynamic friction for peanuts on plywood (0.43–0.73) versus galvanized steel (0.30–0.50), establishing a surface-dependent hierarchy. This aligns with Gupta and Das [44] who found for sunflower seeds, higher dynamic friction for rubber > plywood > mild steel > galvanized iron > aluminum > stainless steel (0.304–0.593 range). Similar trends emerge in other crops: Asli-Ardeh et al. [45] documented 0.24–0.66 for paddy grains, while Chen et al. [42] reported lower values for corn-steel interactions (0.18–0.24), likely due to differences in kernel morphology and surface hardness. These studies confirm that more soft surfaces (rubber, wood) consistently generate greater frictional resistance than metals [43], with stainless steel exhibiting the lowest coefficients.
The coefficient of static rolling resistance () exhibited significant surface dependence, with rubber showing the highest values (0.554 ± 0.007 for Caramelo variety). ANOVA and Duncan’s multiple range test (α = 0.05) confirmed statistically significant differences between rubber and both steel surfaces (p < 0.05), reflecting the combined effects of surface deformability (rubber’s viscoelastic dissipation) and texture (steel’s lower adhesion). These findings align with tribological principles where compliant materials typically generate greater rolling resistance due to increased contact area and energy dissipation [43]. The varietal differences observed suggest that kernel geometry and surface roughness interact with material properties to influence initiation of rolling motion.
The coefficient of dynamic rolling resistance () exhibited surface dependent behavior consistent with fundamental tribological principles aforementioned. Rubber surfaces showed the highest rolling resistance coefficient with values of 0.385 ± 0.006 for Caramelo variety, followed by stainless steel and carbon steel. Statistical analysis revealed significant differences between surface types (p < 0.05), with rubber showing markedly higher than both steel surfaces. This hierarchy aligns with known material interactions where viscoelastic surfaces (rubber) generate greater energy dissipation during rolling than rigid metals, and surface finish variations account for differences between steel types [43].
Significance of physical and mechanical property characterization. The comprehensive determination of physical-mechanical properties in peanuts and other food kernels, including: moisture content, geometric dimensions, density, porosity, angle of repose, and static and dynamic friction and rolling coefficients are fundamental for optimizing postharvest systems. These parameters govern the performance of cleaning, sorting, drying, and conveying operations, directly impacting energy efficiency and product quality preservation. Recent advances in computational modeling further underscore their importance:
- Discrete Element Method: Relies on accurate input parameters (e.g., friction, restitution coefficients) for realistic particle interaction simulations [42].
- Artificial Intelligence (AI). Artificial intelligence systems that utilize geometric properties to develop advanced technologies for harvesting and post-harvesting of edible kernels [50].
4. Conclusions
This research provides a comprehensive characterization of the physical and mechanical properties of four peanut varieties (INIAP 380, Charapoto, Caramelo, and Rosita) grown in Ecuador, with significant implications for postharvest processing and equipment design. The key findings and their practical applications are summarized below:
Mass and dimensions: significant varietal differences were observed in kernel mass (0.45–0.68 g), length (12.64–16.02 mm), and equatorial diameter (7.69–9.27 mm). Barriga de Sapo exhibited the largest kernels, while Rosita had the smallest. These variations influence grading, sorting, and packaging efficiency.
Density and porosity: true density (1016–1056 kg/m³) and bulk density (588–603 kg/m³) were consistent with global studies, though porosity (71–81%) was higher than in some cultivars. These properties are critical for silo design, drying optimization, and pneumatic conveying.
Coefficients of friction and rolling resistance: rubber surfaces generated the highest static ( = 1.10) and dynamic ( = 0.95) friction, while stainless steel had the lowest. Rolling resistance followed the same trend (rubber > steel), with implications for hopper angles and conveyor belt materials.
Angle of repose (28–31°): Indicates excellent flowability, guiding the design of silos, seeders, and discharge systems to minimize clogging.
Author Contributions
Conceptualization, M. H-S. and O. G-C.; methodology, E. L-B.; validation, F. D-N.; formal analysis, D.E. Z-C.; investigation, D.E. Z-C. and R.X. C-M.; resources, M. H-S. and R.X. C-M.; data curation, F. D-N.; writing—original draft preparation, D.E. Z-C., M. H-S and O. G-C.; writing—review and editing, M. H-S and O. G-C.; visualization, F. D-N. and E. L-B.; supervision, M. H-S. All authors have read and agreed to the published version of the manuscript.
Funding
This research received no external funding.
Acknowledgments
The authors gratefully acknowledge the following institutions for their support: the Instituto Nacional de Investigaciones Agropecuarias (INIAP) for providing certified seeds; the Centro Interdisciplinario de Investigación para el Desarrollo Integral Regional, Unidad Oaxaca (CIIDIR-Oaxaca), the Universidad Técnica de Manabí and Universidad Central “Marta Abreu” de las Villas for laboratory facilities, technical assistance and research infrastructure.
Conflicts of Interest
The authors declare no conflicts of interest.
References
- Bertioli, D.J., J. Jenkins, J. Clevenger, O. Dudchenko, D. Gao, G. Seijo, S.C. Leal-Bertioli, L. Ren, A.D. Farmer, and M.K. Pandey, The genome sequence of segmental allotetraploid peanut Arachis hypogaea. Nat. Genet., 2019. 51(5): p. 877-884. [CrossRef]
- Bertioli, D.J., G. Seijo, F.O. Freitas, J.F. Valls, S.C. Leal-Bertioli, and M.C. Moretzsohn, An overview of peanut and its wild relatives. Plant. Genet. Resour., 2011. 9(1): p. 134-149. [CrossRef]
- Herrera-Suárez, M., R.X. Cevallos-Mera, P.J. Lucas-Meza, C.A. Sornoza-Solórzano, C.A. Montes-Rodríguez, and O. González-Cueto, Physical-mechanical properties of peanut (Arachis hypogaea l.) for the design of flat classification surfaces. Rev. Cienc. Tec. Agrop., 2022. 31(2), CU-ID: 2177/v31n2e01.
- Arya, S.S., A.R. Salve, and S. Chauhan, Peanuts as functional food: a review. J. Food Sci. Technol., 2016. 53: p. 31-41. [CrossRef]
- Kim, M.Y., H.J. Kim, Y.Y. Lee, M.H. Kim, J.Y. Lee, M.S. Kang, B.C. Koo, and B.W. Lee, Antioxidant and anti-inflammatory effects of peanut (Arachishypogaea L.) skin extracts of various cultivars in oxidative-damaged HepG2 cells and LPS-induced raw 264.7 macrophages. Food Sci. Nutr., 2021. 9(2): p. 973-984. [CrossRef]
- FAOSTAT. FAOSTAT. Crops and livestock products. 2025, accessed on: 9 April 2025; Available from: https://www.fao.org/faostat/en/#data/QCL.
- USDA. World agricultural production. Foreign agricultural service. Top countries by commodity. 2025, accessed on: April 9 2025; Available from: https://apps.fas.usda.gov/psdonline/app/index.html#/app/topCountriesByCommodity.
- Akcali, I.D., A. Ince, and E. Guzel, Selected physical properties of peanuts. Int. J. Food Prop., 2006. 9: p. 25-37. [CrossRef]
- Balasubramanian, S., R. Sharma, and V. Sardana, Studies on some engineering properties of peanut pod and kernel. J. Agric. Eng. (India), 2011. 48(2): p. 38-42. [CrossRef]
- Fashina, A.B., A. Saleh, and F.B. Akande, Some engineering properties of three selected groundnut (Arachishypogaea L.) varieties cultivated in Nigeria. . Agric. Eng. Int: CIGR Journal, 2014. 16(4): p. 267-277,.
- Gojiya, D., Studies on Physical and Engineering Characteristics of Peanut Kernel. India. Int J Nutr Sci & Food Tech, 2020. 6: p. 2-22,.
- Kiran, C.S., D. Wadikar, K.R. Reddy, and A.D. Semwal, Exploring the potential applications in post-harvest handling and processing of new groundnut (Arachis hypogaea L.) varieties based on their physicochemical properties. J. Trop. Agric., 2024. 62(2): p. 193-204,.
- Ofori, H., F. Amoah, I.K. Arah, M.-K.A. Piegu, I.A. Aidoo, and E.D.N.A. Commey, Physical properties of selected groundnut (Arachis hypogea L.) varieties and its implication to mechanical handling and processing. Afr. J. Food Sci., 2020. 14(10): p. 353-365. [CrossRef]
- Reddy, H.V. and M. Mathew, Study on physical and engineering properties of groundnut seed for planter development. J. Trop. Agric., 2021. 59(2),.
- Olajide, J. and J. Igbeka, Some physical properties of groundnut kernels. J. Food Eng., 2003. 58(2): p. 201-204. [CrossRef]
- Muchlisyiyah, J., R. Shamsudin, R.K. Basha, R. Shukri, and S. How, The effect of moisture content to the physical properties of long grain paddy (Oryza sativa). Asia-Pac. J. Sci. Technol., 2023. 29(4),.
- Dornelas, K.C., V.R. da Silva, Y.C.C. Pessoa, and J.W.B. do Nascimento, Propriedades físicas e de fluxo de produtos granulares para projeto de silo. Res. Soc. Dev., 2021. 10(10): p. e234101018754. [CrossRef]
- Chenarbon, H.A. and S. Movahhed, Assessment of physical and aerodynamic properties of corn kernel (KSC 704). J. Food Process Eng., 2021. 44(11): p. e13858. [CrossRef]
- Kruszelnicka, W., Study of selected physical-mechanical properties of corn grains important from the point of view of mechanical processing systems designing. Mater., 2021. 14(6): p. 1467. [CrossRef]
- Chung, J.H. and L.R. Verma, Determination of friction coefficients of beans and peanuts. Trans. ASABE, 1989. 32(2): p. 0745-0750. [CrossRef]
- Oliveira, J.A.V.d., P.C. Coradi, L.P.R. Teodoro, D.M. Rodrigues, P.E. Teodoro, and R.S.d. Moraes, Multivariate statistical analysis applied to physical properties of soybean seeds cultivars on the post-harvest. Acta Sci. Agron., 2024. 46: p. e63664. [CrossRef]
- Baryeh, E.A., Physical properties of bambara groundnuts. J. Food Eng., 2001. 47(4): p. 321-326. [CrossRef]
- Jideani, V.A. and A.I.O. Jideani, Physical and engineering properties of bambara groundnut seed, in Bambara groundnut: Utilization and Future Prospects, V.A. Jideani and A.I.O. Jideani, Editors. 2021, Springer International Publishing: Cham. p. 61-74.
- Nkambule, S., T. Workneh, S. Sibanda, K. Alaika, and G. Lagerwall, The effect of moisture contents on the physical properties of both bambara groundnut seeds and pods in South Africa. Afr. J. Food Agric. Nutr. Dev., 2023. 23(6): p. 23817-23834. [CrossRef]
- Kurt, C. and H. Arıoglu, Physical and mechanical properties of some peanut varieties grown in Mediterranean environment. Cercet. Agron. Moldova, 2018. LI(2(174)): p. 27-34. [CrossRef]
- Shengsheng, W., J. Jiangtao, J. Xin, and G. Lingxin, Design and experimental optimization of cleaning system for peanut harvester. INMATEH-Agricultural Engineering, 2019. 57(1): p. 243-252,.
- Khir, R., Z. Pan, G.G. Atungulu, and J.F. Thompson, Characterization of physical and aerodynamic properties of walnuts. Trans. ASABE, 2014. 57(1): p. 53-61. [CrossRef]
- Silva, L.S.d., A.J.d. Carvalho, W.d.C. Siqueira, M.d.M. Rocha, J.B. Borges, E.d.S. Barbosa, and J.A. Barbosa, Physical properties of grains of cowpea genotypes. Rev. Bras. Engen. Agríc. Ambi., 2022. 27(3): p. 216-222. [CrossRef]
- Zambrano, J.L., N.M. Palacios, D.M. Bravo, and M.J. Alava, Peanut production and its impact on Ecuador’s economy. Rev. C. Soc. , 2024. XXX(4): p. 323-338.,.
- United Nations, The 2030 agenda and the sustainable development goals: an opportunity for Latin America and the Caribbean. 2018, Santiago: Economic Commission for Latin America and the Caribbean (ECLAC).
- Yohanes, H., M.N. Alfa, E.P. Astin, K. Komariyah, L.K. Hartono, W. Puspantari, Astuti, W.E. Widodo, and W.B. Setianto, Exploring fluidization characteristics and physical-mechanical properties of Indonesian groundnuts (Arachis hypogea). AIP Conf. Proc., 2025. 3166(1). [CrossRef]
- Aydin, C., Some engineering properties of peanut and kernel. J. Food Eng., 2007. 79(3): p. 810-816. [CrossRef]
- ElMasry, G., S. Radwan, M. ElAmir, and R. ElGamal, Investigating the effect of moisture content on some properties of peanut by aid of digital image analysis. Food Bioprod. Process, 2009. 87(4): p. 273-281. [CrossRef]
- Araujo, W.D., A.L.D. Goneli, C.M.A. De Souza, A.A. Gonçalves, and H.C.B. Vilhasanti, Propriedades físicas dos grãos de amendoim durante a secagem. Rev. Bras. Eng. Agric. Ambient., 2014. 18(3): p. 279-286. [CrossRef]
- Bepary, R.H., D. Wadikar, and P. Patki, Engineering properties of rice-bean varieties from North-East India. J. Agric. Eng. (India), 2018. 55(3): p. 32-42. [CrossRef]
- El-Gamal, R.A., S.M.A. Radwan, M.S. ElAmir, and G.M.A. El-Masry Aerodynamic properties of some oilseeds crops under different moisture conditions J. Soil Sci. Agric. Eng., 2011. 2(5): p. 495-507. [CrossRef]
- Muhammad, A.I., R.K. Ahmad, and I. Lawan, Effect of moisture content on some engineering properties of groundnut pods and kernels Agric. Eng. Int. CIGR J., 2017. 19(4): p. 200-208,.
- Soyoye, B.O., O.C. Ademosun, and L.A.S. Agbetoye, Determination of some physical and mechanical properties of soybean and maize in relation to planter design Agric. Eng. Int. CIGR J. , 2018. 20(1): p. 81-89,.
- POWDERPROCESS. Ángulo de reposo: visión general. 2024, accessed on: 29 de abril 2025; Available from: https://powderprocess.net/ES/Angulo_De_Reposo.html.
- Galedar, M.N., A. Tabatabaeefar, A. Jafari, A. Sharifi, S.S. Mohtasebi, and H. Fadaei, Moisture dependent geometric and mechanical properties of wild pistachio (Pistaciavera L.) nut and kernel. Int. J. Food Prop. , 2010. 13: p. 1323-1338. [CrossRef]
- Ospina, J.E., Características físico mecánicas y análisis de calidad de granos. 2001, Bogotá: Univ. Nacional de Colombia.
- Chen, H., H. Lin, X. Song, F. Zhang, F. Dai, T. Yang, and B. Li, Study on the contact parameter calibration of the maize kernel polyhedral Discrete Element Model. Agric., 2024. 14(9): p. 1644. [CrossRef]
- Bhushan, B., Introduction to tribology. Second edition. Tribology Series. Vol. 56. 2013, Hoboken, Nueva Jersey: John Wiley & Sons, Inc.
- Gupta, R. and S. Das, Friction coefficients of sunflower seed and kernel on various structural surfaces. J. Agric. Eng. Res., 1998. 71(2): p. 175-180. [CrossRef]
- Asli-Ardeh, E.A., Y. Abbaspour-Gilandeh, and S. Shojaei, Determination of dynamic friction coefficient of paddy grains on different surfaces. Int. Agrophys., 2010. 24(2): p. 101-105,.
- Tang, H., G. Zhu, Z. Sun, C. Xu, and J. Wang, Impact damage evolution rules of maize kernel based on FEM. Biosys. Eng., 2024. 247: p. 162-174. [CrossRef]
- Tang, H., G. Zhu, Z. Wang, W. Xu, C. Xu, and J. Wang, Prediction method for maize kernel impact breakage based on high-speed camera and FEM. Powder Technol., 2024. 444: p. 120002. [CrossRef]
- Ling, J., M. Gu, W. Luo, H. Shen, Z. Hu, F. Gu, F. Wu, P. Zhang, and H. Xu, Simulation analysis and test of a cleaning device for a fresh-peanut-picking combine harvester based on Computational Fluid Dynamics–Discrete Element Method coupling. Agric., 2024. 14(9): p. 1594. [CrossRef]
- Qin, M., Y. Jin, W. Luo, F. Wu, L. Shi, F. Gu, M. Cao, and Z. Hu, Measurement and CFD-DEM simulation of suspension velocity of peanut and clay-heavy soil at harvest time. Agron., 2023. 13(7): p. 1735. [CrossRef]
- Li, Z., D. Wang, T. Zhu, Y. Tao, and C. Ni, Review of deep learning-based methods for non-destructive evaluation of agricultural products. Biosyst. Eng., 2024. 245: p. 56-83. [CrossRef]
Figure 1.
Sample of the four varieties of peanut kernels researched. A: Rosita, B: Charapoto, C: Barriga de Sapo, D: Caramelo.
Figure 1.
Sample of the four varieties of peanut kernels researched. A: Rosita, B: Charapoto, C: Barriga de Sapo, D: Caramelo.
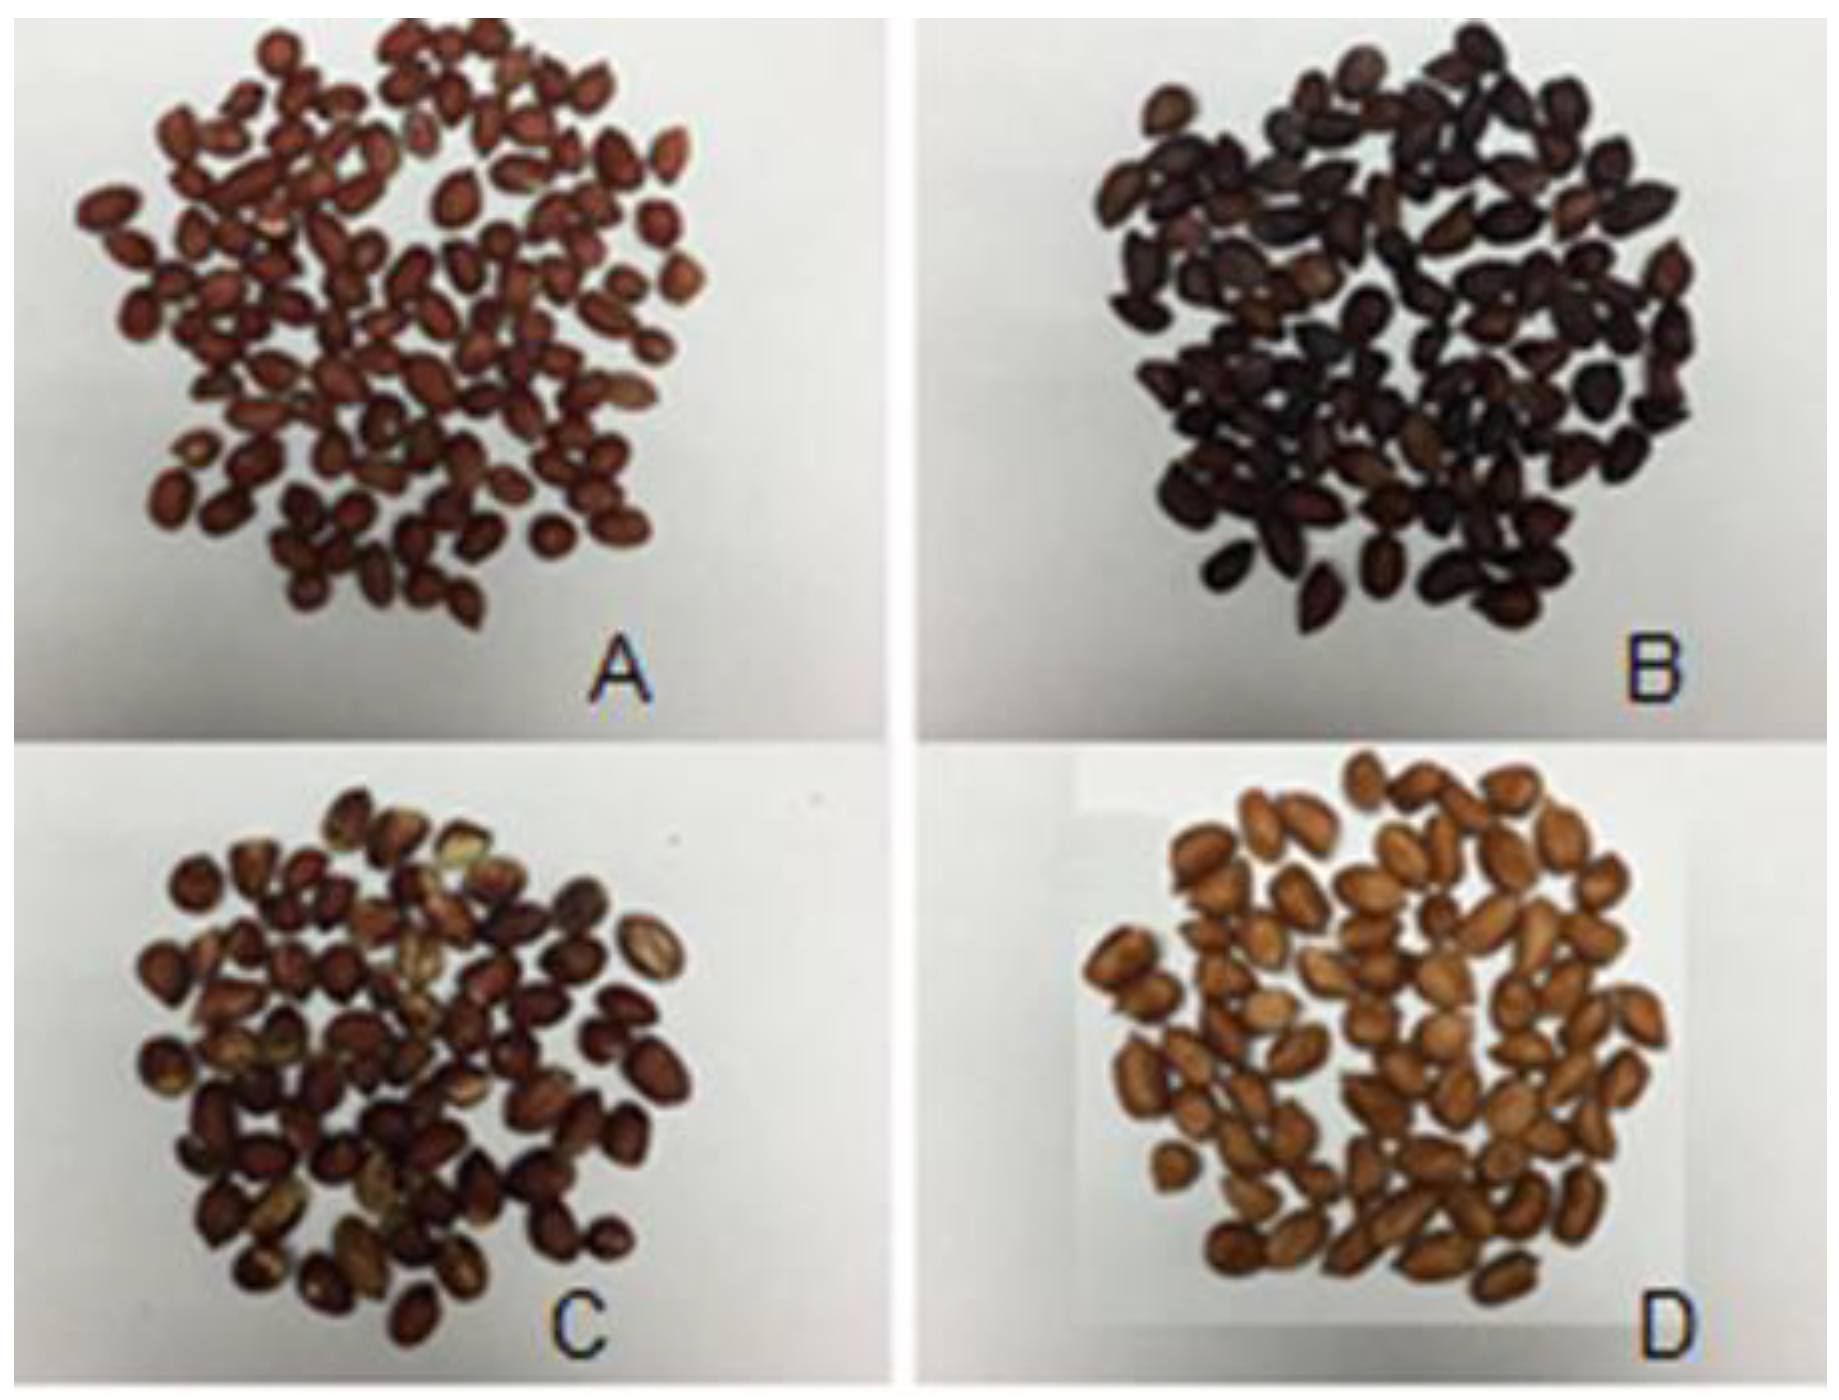
Figure 2.
Obtaining angle of repose [8].
Figure 2.
Obtaining angle of repose [8].
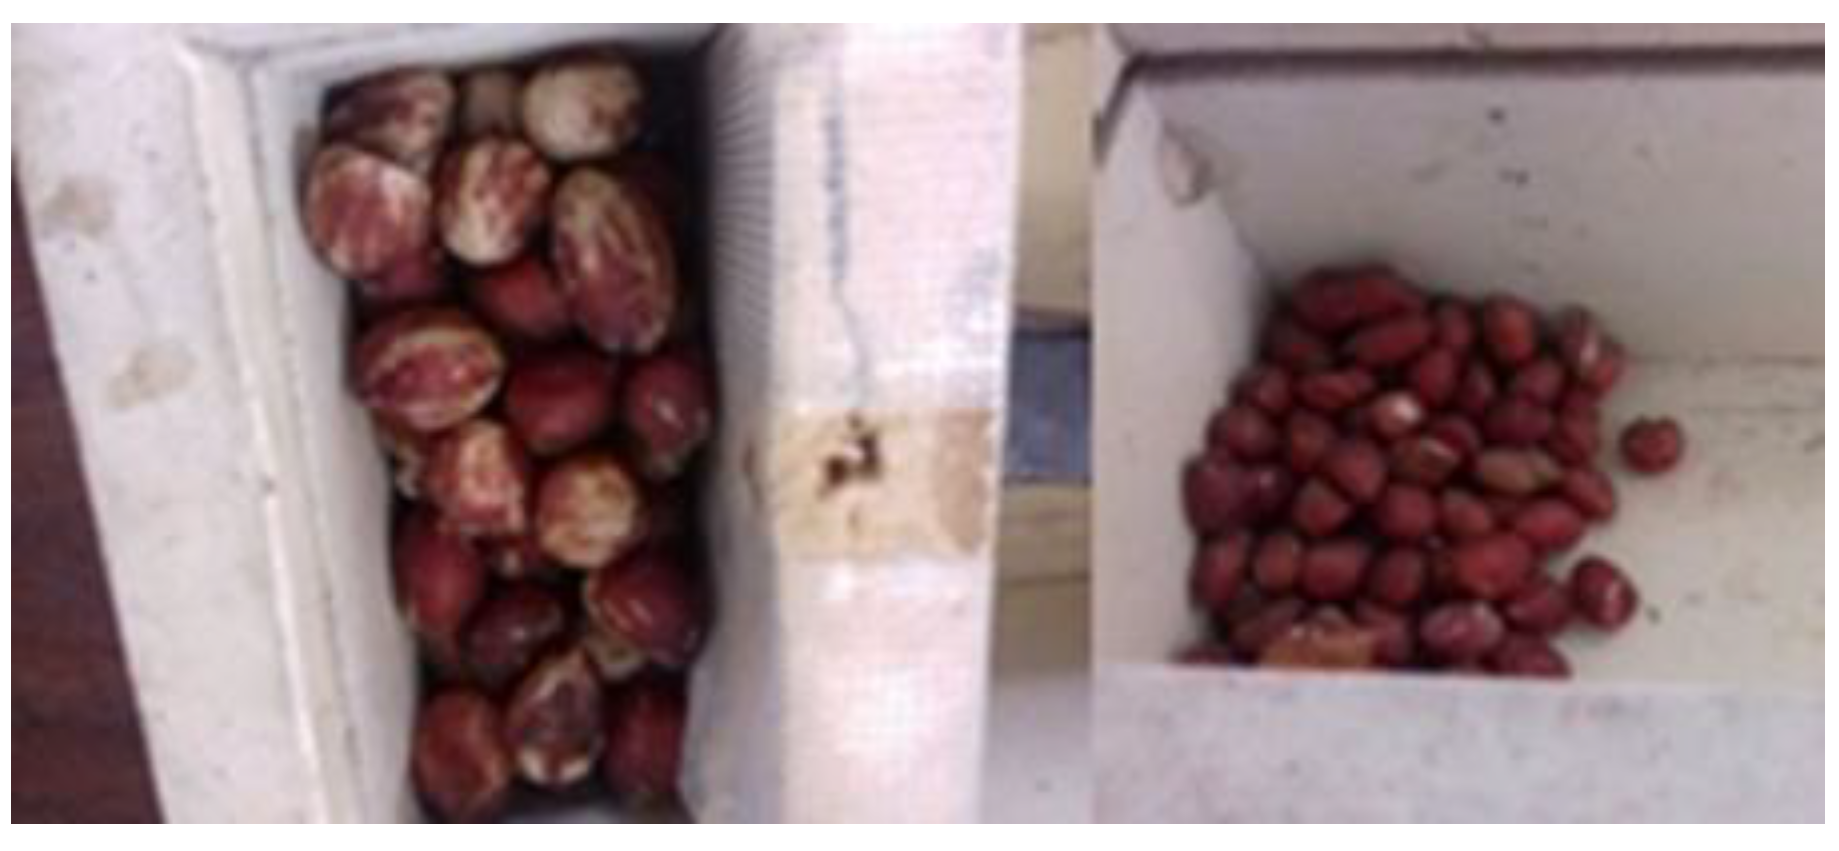
Figure 3.
Frequency histograms of mass determination of 100 peanut kernels for each variety researched.
Figure 3.
Frequency histograms of mass determination of 100 peanut kernels for each variety researched.
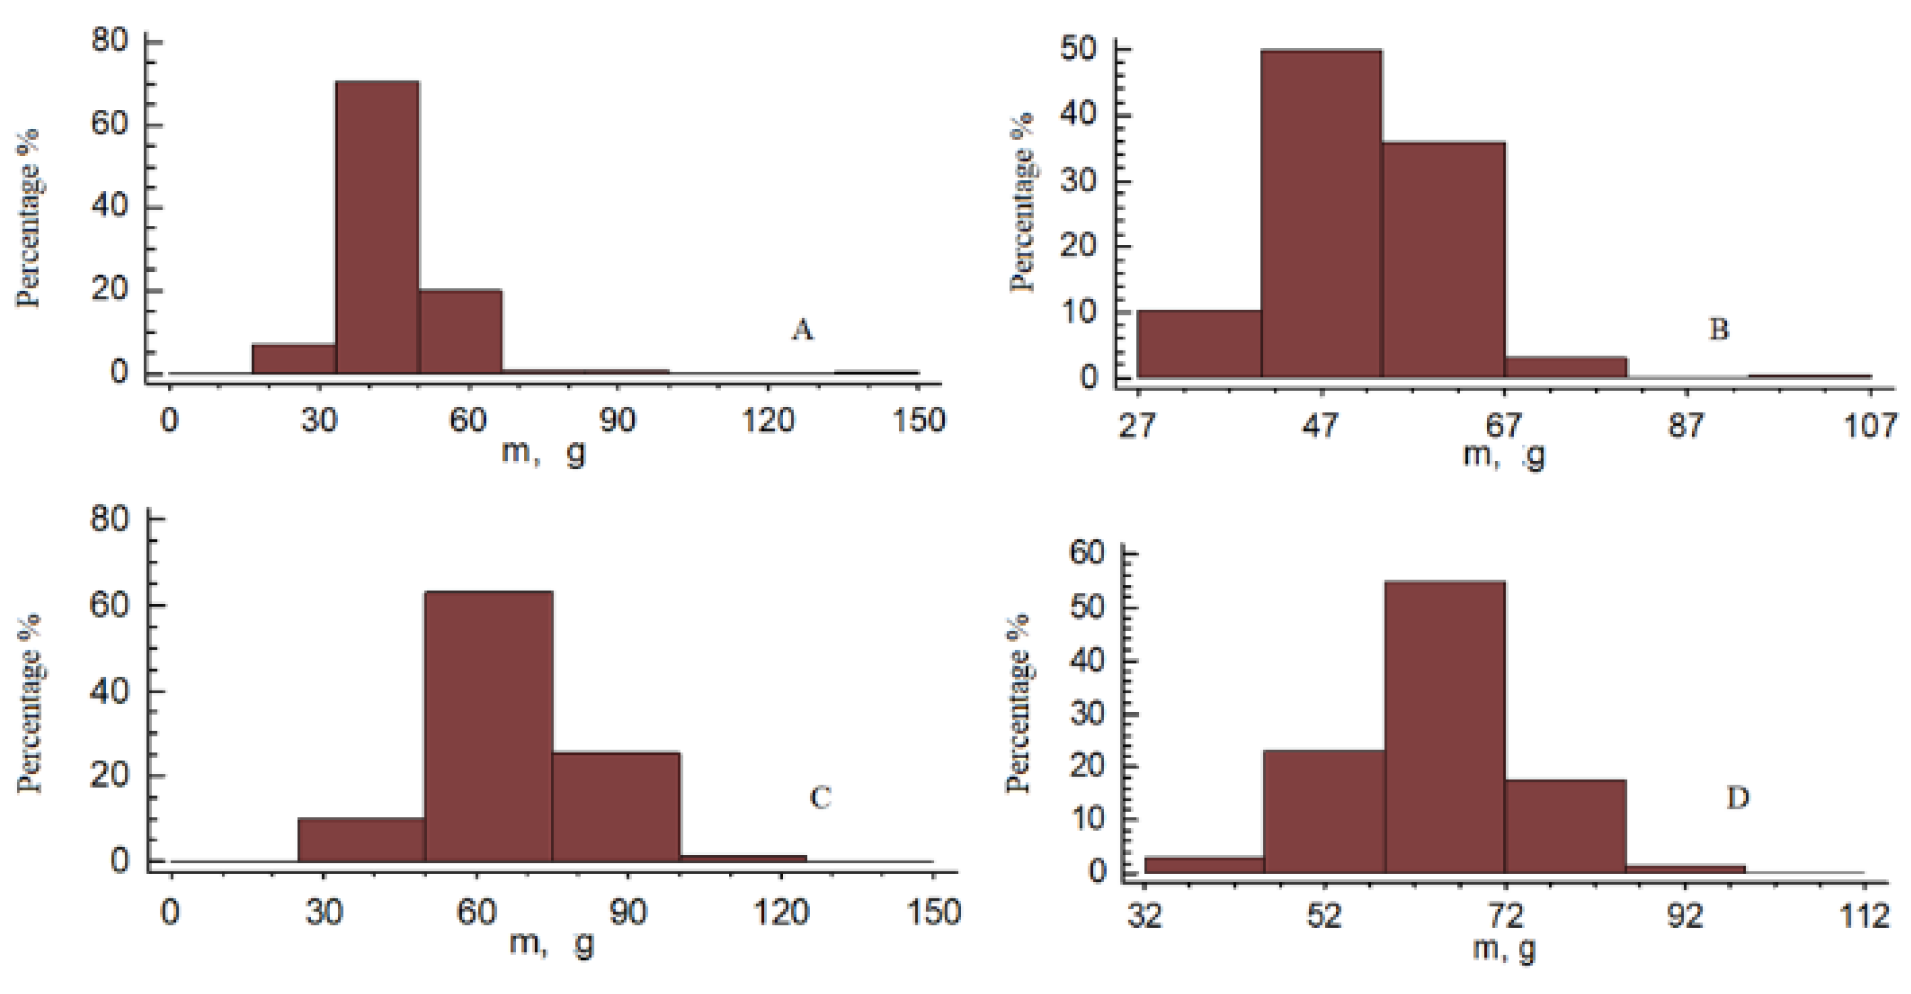
Figure 4.
Average length of the peanut kernels.
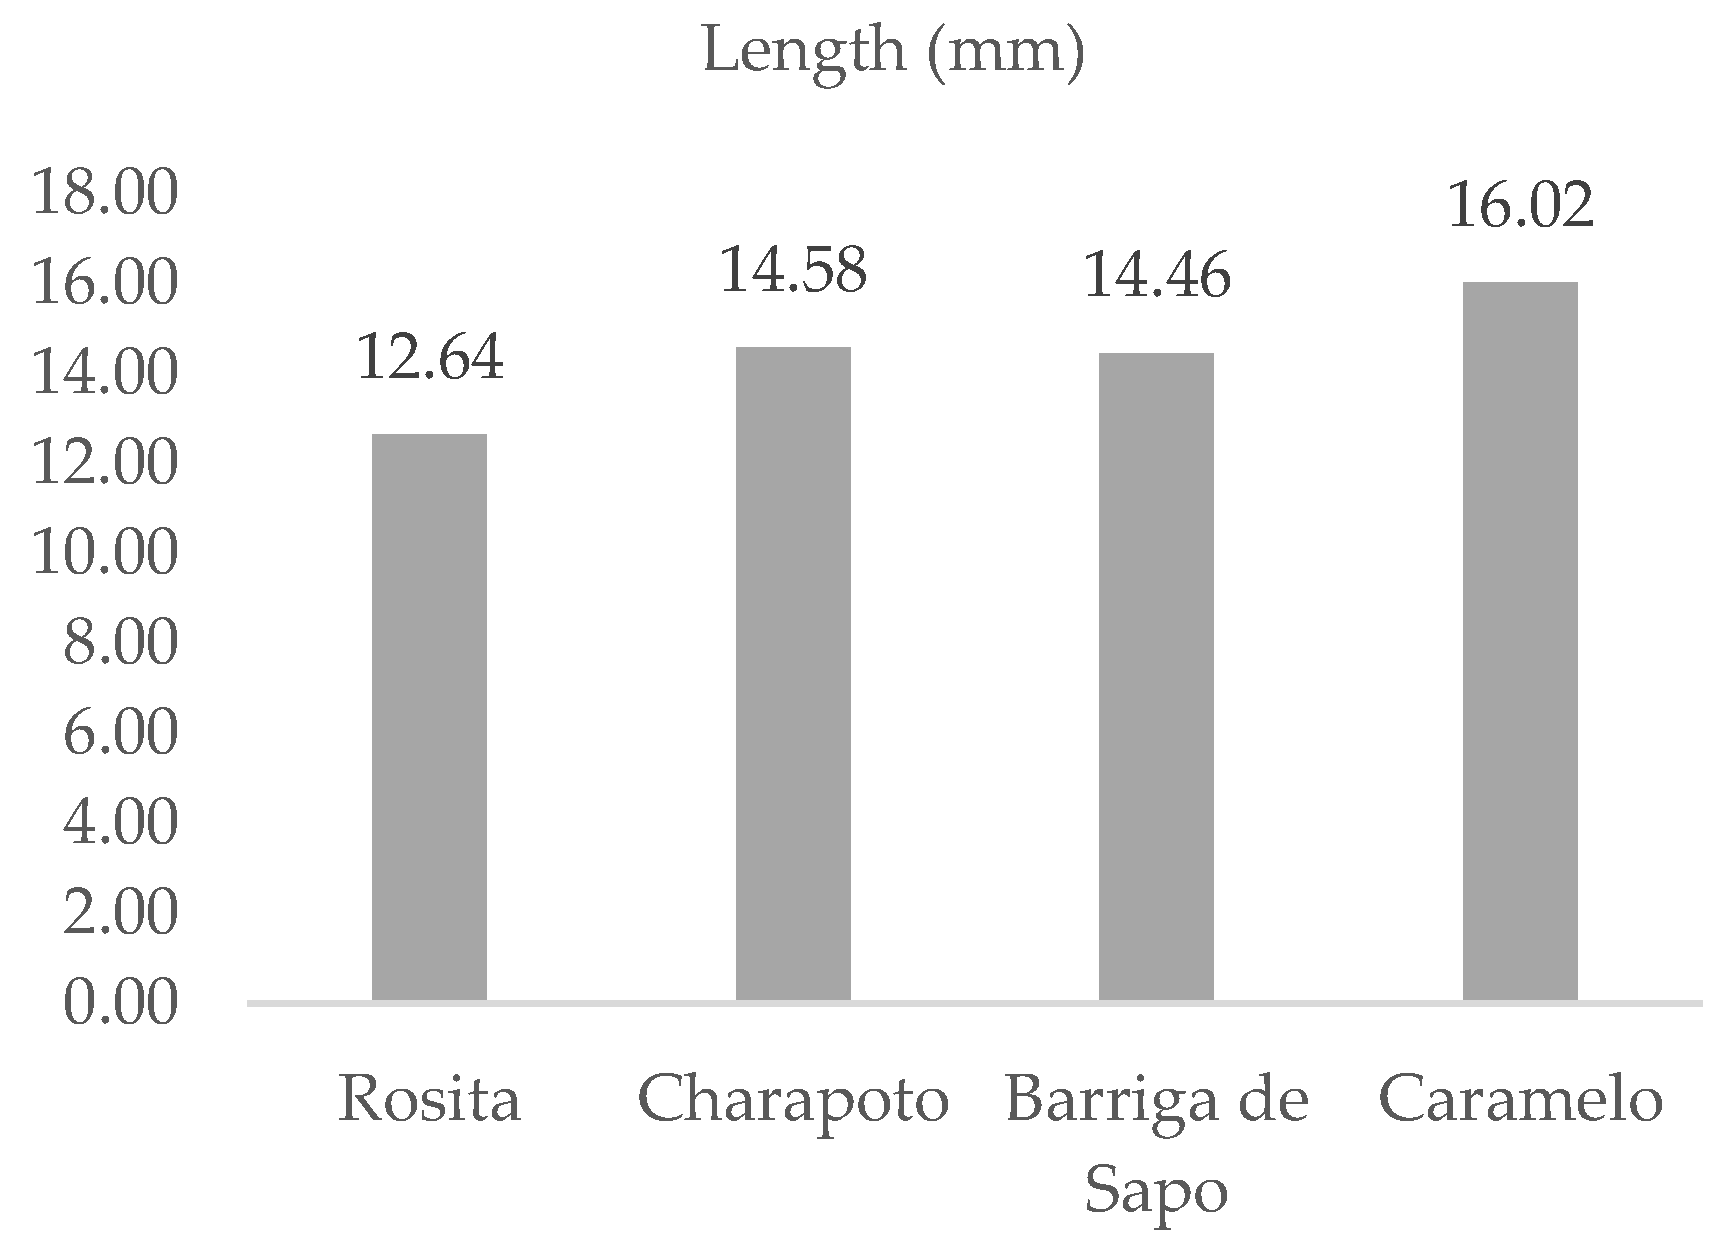

Table 1.
Multiple range Duncan test with 95% confidence interval for mass.
| Variety | Cases | Average | Homogeneous Groups |
| Rosita | 200 | 44.865 | X |
| Charapotó | 200 | 52.15 | X |
| Caramelo | 200 | 64.385 | X |
| Barriga de Sapo | 200 | 68.375 | X |
Table 2.
Multiple range Duncan test with 95% confidence interval for equatorial diameter.
| Variety | Cases | Average | Homogeneous Groups |
| Rosita | 200 | 7.6908 | X |
| Charapotó | 200 | 7.72975 | X |
| Caramelo | 200 | 8.09165 | X |
| Barriga de Sapo | 200 | 9.27265 | X |
Table 3.
Values obtained from the coefficients of friction and rolling resistance coefficient.
| Coefficient | Surface | Rosita | Caramelo | Charapotó | Barriga de Sapo |
| Stainless steel | 0,61 | 0,73 | 0,71 | 0,82 | |
| Rubber | 0,94 | 0,95 | 0,99 | 1,10 | |
| Carbon steel | 0,73 | 0,71 | 0,78 | 0,79 | |
| Stainless steel | 0,51 | 0,64 | 0,67 | 0,61 | |
| Rubber | 0,76 | 0,79 | 0,95 | 0,87 | |
| Carbon steel | 0,65 | 0,55 | 0,63 | 0,62 | |
| Stainless steel | 0,48 | 0,43 | 0,43 | 0,26 | |
| Rubber | 0,55 | 0,50 | 0,54 | 0,33 | |
| Carbon steel | 0,46 | 0,41 | 0,45 | 0,22 | |
| Stainless steel | 0,38 | 0,32 | 0,31 | 0,19 | |
| Rubber | 0,38 | 0,36 | 0,31 | 0,22 | |
| Carbon steel | 0,35 | 0,32 | 0,31 | 0,13 |
Disclaimer/Publisher’s Note: The statements, opinions and data contained in all publications are solely those of the individual author(s) and contributor(s) and not of MDPI and/or the editor(s). MDPI and/or the editor(s) disclaim responsibility for any injury to people or property resulting from any ideas, methods, instructions or products referred to in the content. |
© 2025 by the authors. Licensee MDPI, Basel, Switzerland. This article is an open access article distributed under the terms and conditions of the Creative Commons Attribution (CC BY) license (http://creativecommons.org/licenses/by/4.0/).
Copyright: This open access article is published under a Creative Commons CC BY 4.0 license, which permit the free download, distribution, and reuse, provided that the author and preprint are cited in any reuse.


