
Submitted:
01 December 2024
Posted:
02 December 2024
You are already at the latest version
Abstract
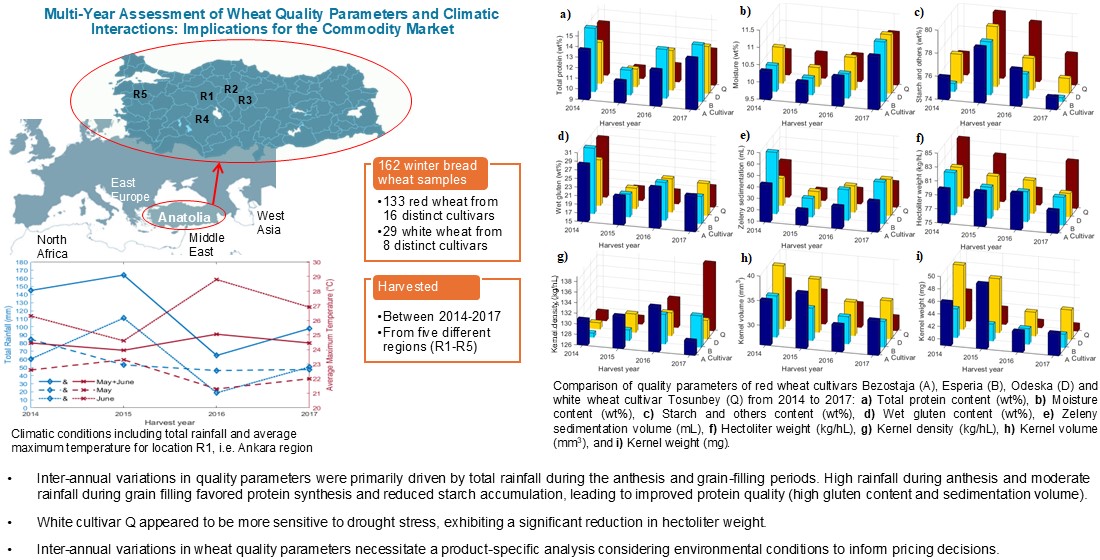
Real-time, rapid, and accurate evaluation of bread wheat (Triticum aestivum L.) quality is crucial for ensuring nutritional content, informing fair pricing in commodity markets, and promoting sustainable agricultural practices. This study investigated the inter-cultivar and inter-annual variations in quality parameters of winter bread wheat from local farmers in Central Anatolia. 162 samples from 24 cultivars, harvested across four years with distinct climatic conditions between 2014-2017, were analyzed for analytical (total protein content, wet gluten content, sedimentation volume) and physical quality parameters (hectoliter weight, Hunter color parameters, kernel dimensions, weight, volume, and density). Grain size and color were found to be unreliable indicators of protein content, with significant variations within color groups. Cultivar-specific differences were evident in protein content, gluten content, and sedimentation volume, highlighting the genetic influence on grain quality. Inter-annual variability in quality parameters was primarily driven by total rainfall during grain filling, affecting starch accumulation and grain size. Interestingly, the ratio of gluten to total protein remained relatively stable across different climatic conditions. These findings emphasize the importance of considering both cultivar-specific characteristics and environmental factors in wheat quality evaluation. Limitations of current methods necessitate the development of rapid and simultaneous multi-property measurement approaches for efficient wheat analysis.
Keywords:
Bread wheat
; quality analysis
; rainfall
; maximum temperature
; analytical parameters
; physical parameters
1. Introduction
Precise characterization of food and animal feed compositions has become paramount for ensuring accurate quality analyses that lead to fair pricing within commodity exchanges and reliable nutritional labeling for the food market. Wheat is a globally cultivated cereal with its ease of cultivation and economical costs of storage and transportation solidifying its position as an essential food source [1]. Bread wheat, Triticum aestivum L., is a staple food crop globally, accounting for approximately 95% of total wheat production [2]. It plays a crucial role in ensuring global food security and is a cornerstone of human nutrition across diverse cultures. Turkiye, particularly in Central Anatolia, is a major producer of winter wheat, cultivating both bread wheat and durum wheat, Triticum durum L., across 6-9 million hectares annually, out of a total sown area of 11 million hectares. The annual wheat production in Turkiye is approximately 20 million tons, with bread wheat constituting roughly 80% of this total [3].
The diverse range of wheat varieties, coupled with varying climatic conditions and consumer preferences, has led to a multitude of quality parameters and indexing systems worldwide, which vary from country to country. Selection of the cultivar by the farmers is primarily driven by a risk management strategy often prioritizing high-yielding varieties with desirable bread-making qualities [Fradgley et al., 2023]. Such cultivars are typically more expensive and necessitate higher input costs, particularly in terms of nitrogen fertilization, in anticipation of meeting quality standards and commanding premium market prices. Decision-making processes are frequently influenced by performance data from the previous year and peer recommendations. In the Central Anatolia region, where both red and white wheat varieties are cultivated, farmers commonly perceive red wheat to have higher protein content and superior quality, leading to a wider adoption of red varieties. However, agricultural commodities entering the market originate from diverse farmers employing varying cultivation practices. Even within a specific geographic region, differences in cultivation practices, such as fertilizer application rates, can significantly influence the protein content of the final product and there may be quality variations amongst the same variety. Farmers are keen to have their harvested wheat evaluated for quality and price as quickly as possible on commodity exchanges due to limited or costly storage options. They seek to sell their products to millers without delay. Therefore, fast and precise quality evaluation plays a crucial role in determining the market value.
Quality parameters and analysis methods used can vary internationally depending on the intended end-use of wheat. Common parameters internationally used in indexing the quality are the total protein content, wet gluten content, and Zeleny sedimentation volume. Conventional methods for measuring these parameters vary in terms of speed and cost and often involve grinding that introduces time constraints and hinders accurate assessment especially during peak purchasing periods in commodity exchange markets. Regarding protein content, Dumas method offers faster analysis, but at a higher cost compared to the Kjeldahl method [4]. Near infrared (NI) reflectance and transmittance (NIR and NIT) methods offer a combination of speed, simultaneous measurement of multiple parameters, and cost-effectiveness [4]. NI-reflectance works better with powders and requires grinding, while NI-transmission works with grains and is nondestructive. Near infrared spectroscopy (NIS) methods excel at determining the total protein content, but limitations in accurately measuring wet gluten content and Zeleny sedimentation volume restrict their standalone application, necessitating the use of the time-consuming traditional methods [5]. Lack of robust, high-throughput methods within commodity exchanges restricts the number of analyses performed, often relying solely on rapid tests for physical parameters, such as the hectoliter weight determined by near infrared methods and the weight percentage of broken grains, damaged grains, sprouted grains, shriveled grains, and grains from other cereals determined by visual inspection. These metrics fail to capture crucial aspects of flour quality relevant to buyers. Other physical parameters, color and grain size, are not directly reflected in pricing, but provide valuable insights on nutritional value for the food industry and energy consumption for the milling industry. To ensure accurate and efficient wheat quality assessment, it is imperative to elucidate the relationship between the critical quality parameters gluten content and sedimentation volume, traditionally determined through time-consuming conventional methods, and total protein content and hectoliter weight, rapidly measured using NIS methods. This knowledge is instrumental in developing reliable and expeditious methods for evaluating wheat quality.
Total protein content in wheat, comprising albumin, globulin, glutenin, gliadin, and other amino acid-containing components, while informative, is insufficient for comprehensive wheat quality assessment. Characterizing protein fractions, particularly the storage proteins gliadin and glutenin, is essential. Wet gluten analysis, involving removal of albumins and globulins with a saline solution to isolate the gluten network [6], provides an estimate of gluten content. However, residual starch and proteins can introduce inaccuracies. The quantity and composition of proteins in wheat are influenced by various factors, including climatic conditions, such as temperature and amount of rain, and soil characteristics, such as nitrogen (N) content [7]. Studies have shown that higher nitrogen application can increase the gliadin-to-glutenin ratio [7,8], although this effect is not always consistent [9,10]. Even when the ratio remains stable, the absolute quantities of gliadin and glutenin can vary significantly based on the growing conditions. Particularly nitrogen fertilization that affect the total nitrogen content during grain development [11] can influence the proportion of these proteins. Discrepancies in reported findings can be attributed to factors, such as inconsistent fertilizer utilization, limited replication to account for confounding variables, such as climatic variations, and differences in wheat cultivars [12].
Wheat quality encompass more than protein and gluten content. The sedimentation test indirectly assesses gluten characteristics by measuring gluten fraction swelling. Higher gluten quality and content are associated with higher Zeleny volumes and slower sedimentation rates [13,14] due to enhanced water absorption and gluten network formation. However, wheat quality is also influenced by interactions between proteins and other endosperm components, such as starch, minerals, and moisture, affecting overall physical and structural properties [15]. Multiple studies have consistently reported a strong positive correlation between wheat protein content, gluten content [1,16,17], and Zeleny sedimentation volume [13,14,18]. These parameters are highly interconnected with correlation coefficients often exceeding 0.96 [17]. Wheat cultivars rich in gluten, characterized by extensive and well-hydrated gluten networks, inherently exhibit elevated total protein levels and larger sedimentation volumes.
Hectoliter weight, a critical factor in wheat handling and storage, is influenced by cultivar, climatic conditions, and grain physical properties, such as shape, size, and density [17]. The relationship between hectoliter weight and protein content is inconsistent with studies reporting both positive but non-significant correlations [17,19] and negative correlations [20]. Tkachuk and Kuzina [20] observed an inverse relationship between grain moisture content and both hectoliter weight and kernel density, while kernel weight exhibited a positive correlation with moisture content. This suggests that kernel volume increases more rapidly than kernel weight with moisture uptake, leading to a decrease in density.
Grain size has been shown to influence various quality parameters of bread wheat, including protein content, Zeleny sedimentation volume, and milling efficiency-related mechanical properties, such as PSI hardness. Aydogan et al. [21] investigated the effects of grain size on six cultivars grown in Central Anatolia. Grains were separated into three size fractions using sieves with mesh sizes of 2.2, 2.5, and 2.8 mm. Larger grains within each cultivar displayed higher thousand-grain-weight, lower protein content, and higher PSI hardness suggesting a reduced resistance to milling. However, the cultivar Bezostaja was an outlier in terms of hardness. The Zeleny sedimentation volume was found to be highest in the smallest grain fraction of 2.2.-2.5 mm, suggesting a potential concentration of gliadins and glutenins in this size range compared to larger grains. While grain size can influence Zeleny sedimentation volume, the relationship is complex. Sahin et al. [22] reported an inverse relationship between protein content and grain size, but contrary to Aydogan et al. [21], they observed a positive correlation between Zeleny sedimentation volume and grain size. These findings suggest that while grain size is a relevant factor, genetic variation and environmental conditions also play significant roles in determining wheat quality.
Wheat color, a visual attribute influenced by anthocyanin and carotenoid pigments, may influence its specific applications that vary across regions and market value. Dark-colored wheat varieties, rich in antioxidants, often command premium prices in markets that prioritize nutritional value. While Central Anatolia primarily features red and white wheat cultivars, India is renowned for its diverge range of black, blue, and purple wheat varieties [23]. These unique colors, often associated with specific genetic traits, can influence the nutritional composition and sensory properties of the resulting flour. While wheat color in Anatolia is not directly incorporated into price quotations, it is used as a physical parameter in grouping cultivars for storage. Historically, wheat color assessment in Anatolia relied on subjective visual evaluation against standardized color charts. The color phenotype in wheat is primarily attributed to seed coat pigmentation, which is distinct from the endosperm, composed mainly of protein and starch. Anthocyanins present in the seed coat are known for their antioxidant properties and potential health benefits [24]. Specific glycosylated anthocyanin forms, such as cyanidin and pelargonidin, influence red and purple color, while delphinidin, peonidin, petunidin, and malvidin contribute to bluish hues in bread wheat. Carotenoids, imparting a yellow color, are more prevalent in durum wheat [25]. Although wheat color due to anthocyanidins can be a valuable quality parameter, it should be evaluated in conjunction with other factors to provide a comprehensive assessment.
Wheat quality traits exhibit differential responses to environmental factors. Protein content is primarily influenced by genotype [26]. Conversely, technological properties, such as hardness, sedimentation volume, and flour yield, are more sensitive to cultivation practices, including fertilization, irrigation, and prevailing climate [27]. Temperature was found to be not as effective on grain growth during grain filling, which determines the final grain weight and size [28,29], but found to play a crucial role in dough functionality. Moderate temperatures of 25–35 °C during this period generally enhance dough strength [30,31], but frequent heat spikes exceeding 35 °C can lead to a weakening of dough [31]. The interplay of temperature and water stress further complicates wheat quality. Excessive heat stress coupled with low soil moisture can decrease protein content [30], while accelerating the growth rate and shortening the time to maturity [32]. Water stress can reduce kernel weight [33], and conversely, excessive rainfall can promote the development of swollen grains with lower protein content and strength.
This study aimed to investigate inter-varietal and inter-annual variability in quality parameters of winter bread wheat in Central Anatolia. A total of 162 samples from 24 cultivars harvested between 2014 and 2017 were analyzed. Standardized analytical measurements were conducted to assess total protein content, wet gluten content, and Zeleny sedimentation volume. Physical analyses were performed to determine Hunter color parameters, hectoliter weight, and kernel properties, including size, volume, weight, and density. Samples were categorized by grain color, as red or white, and relationships between these parameters were explored. Further analyses focused on four specific cultivars, obtained in multiple samples from all harvest years, to investigate the effects of color group and harvest year on quality traits. The results were analyzed in the context of monthly average maximum temperature and total rainfall during the critical growth stages of anthesis and grain filling in May and June for winter bread wheat.
2. Materials and Methods
2.1. Types of Bread Wheat
Twenty-four (24) distinct winter bread wheat (Triticum aestivum L.) cultivars, favored by farmers in diverse regions of Central Anatolia, were investigated. A total of 162 samples were collected from local farmers in five regions: Ankara (R1), Kırıkkale/Çorum (R2), Yozgat (R3), Konya (R4), and Balıkesir (R5) as shown in Figure 1. These regions exhibit a continental climate characterized by cold winters and hot, dry summers. The predominant soil type is loess, a well-draining, fertile soil suitable for wheat cultivation. While Ankara, Konya, Kırıkkale, and Çorum are renowned for their agricultural sectors and wheat production, Yozgat requires irrigation due to its arid conditions. Balıkesir, primarily associated with olive production in coastal areas, also engages in wheat cultivation in its drier inland regions. The dataset comprises 133 red wheat cultivars belonging to 16 distinct cultivars and 29 white wheat cultivars encompassing 8 cultivars as shown in Figure 1. All samples originated from harvests of local farmers in 2014, 2015, 2016, and 2017 and were stored in the Food Analysis Laboratory of the Ankara Commodity Exchange. Color-categorization of bread wheat cultivars is conducted by government-affiliated breeding institutions. In this study, a systematic sample identification system was implemented using a two-part alphanumeric code, cyy. The first part (c) represents the cultivar, assigned sequentially from A to X. The second part (yy) denotes the last two digits of the harvest year (e.g., A14 for Bezostaja harvested in 2014).
2.2. Sample Preparation
Field-collected wheat samples were subjected to mechanical cleaning to remove extraneous matter and impurities from the kernels. A double-sieve system was utilized for this purpose. The top sieve possessed slots measuring 3.55 mm wide by 20.00 mm long, while the bottom sieve had slots measuring 1.00 mm wide by 20.00 mm long. Wheat grains retained between the two sieves were isolated for subsequent experimentation.
Wheat samples were utilized in both whole grain and flour forms, with bran and without bran, for the analytical and physical tests. Flour of whole wheat grains with bran was prepared by grinding using a hammer mill (Laboratory Mill 120, Perten Instruments AB, Kungens Kurva, Sweden) at ambient conditions to obtain a particle size below 0.8 mm. Flour without bran was prepared by separating the bran from the starchy white endosperm using a roller mill (Gencaslan Makine & Muhendislik, Ankara) for wet gluten analysis and a different roller mill (Laboratory Mill Sedimat, Brabender GmbH&Co. KG, Germany) for Zeleny sedimentation analysis.
2.3. Analytical Analyses
To ensure data accuracy and reproducibility, all analytical measurements were performed in duplicate. Wheat moisture and protein content were determined via near-infrared transmittance (NIT) spectroscopy using an IM 9500 instrument (Perten Instruments AB, Kungens Kurva, Sweden) based on TS EN 15948 standards. The remaining components, primarily starch with minor amounts around 3-6% of lipids, fiber, and minerals, were collectively categorized as “starch and others” in this study. NIT spectroscopy is a non-destructive technique that leverages the interaction of near-infrared light with sample molecules and bonds to quantify specific components. Its sample container accommodates approximately 800-850 g of grains.
Zeleny sedimentation analysis was employed to determine the gluten content for flour excluding bran, where accurate flour moisture content is essential. Initial weight of debranned-flour was adjusted based on moisture content to maintain a consistent dry sample weight of 2.7 g. The method leverages the swelling capacity of flour proteins in an acidic medium. A standardized flour sample prepared under specified grinding and sieving conditions is suspended in a lactic acid and propan-2-ol solution containing a dye. The suspension undergoes specific periods of resting and shaking in a Brabender sedimentation shaker instrument (Brabender GmbH & Co. KG, Daisburg, Germany) at 40 min-1 defined by the TS EN ISO 5529 standard. The resulting sediment volume reflects the gluten content in milliliters.
Gluten content of wheat flour including bran was determined via wet gluten analysis using a Perten Glutomatic 2200 instrument (Perten Instruments AB, Kungens Kurva, Sweden). Excess water in the gluten samples was removed using the Gluten Index Centrifuge 2015 (Perten Instruments AB, Kungens Kurva, Sweden) following the protocols outlined in TS EN ISO 21415-2 standards.
2.4. Physical Analyses
Physical grain properties, including hectoliter weight, single kernel weight and dimensions, and the color of flour with bran and without bran, were measured and single kernel volume and density were calculated. Hectoliter weight was assessed using NIT spectroscopy and repeated three times for accuracy. Single kernel weight and dimensions were measured with ten individual grains from each sample due to their inherent variability. Each kernel was weighed using a precision scale (XB 220 A, Precisa Gravimetrics AG, Dietikon, Switzerland). Kernel volume was calculated using the formula for an ellipsoid, V=(π/6)lwt, with length l, width w, and thickness t measured using digital calipers (Whitworth, Japan) [36,37]. This ellipsoidal approximation simplifies analysis while capturing the general wheat kernel shape [38]. Single kernel density was determined by dividing the weight of each kernel by its volume.
Color measurements were performed only on cultivars from the 2015, 2016, and 2017 harvests in grinded form with and without bran to see the effect of the outer most layer. The Hunter L-a-b color scale of each sample was determined using a colorimeter (Konica Molta CR400, Japan). The L value indicates lightness on a vertical axis ranging from 0 indicating black to 100 indicating white. The a and b axes form a plane with no numerical limits. Positive values of a represent red hues, while negative values indicate green. Positive b values correspond to yellow and negative values to blue.
2.5. Statistical Analyses
Data quality was ensured through iterative outlier detection using the Grubbs test on each dataset within a 95% confidence interval. Parameter relationships were investigated using the coefficient of determination, R² calculated in MS Excel 2010. Linear regression analysis was performed using the Trendline option and the LINEST function based on the least square method. The variability of the investigated quality parameters for each cultivar was analyzed using the coefficient of variation (CV) given by the ratio of the standard deviation of the data to its mean.
3. Results and Discussion
3.1. Analytical Analyses
A comparative analysis of the average quality parameters of 162 wheat samples from 24 different cultivars collected over multiple years is presented in Table 1. The results consistently demonstrate that red cultivars exhibit higher protein, gluten, and sedimentation volume compared to white cultivars. This empirical finding aligns with the prevailing perception amongst local farmers regarding the superior quality of red wheat based on experience with high quality red cultivars. Year-to-year fluctuations observed in the mean values and CV indicate the impact of genetic differences, cultivation practices, and environmental factors, such as climate and soil conditions. These factors underscore the complexity of wheat quality attributes and prove the general trend of red wheat superiority is not absolute for each cultivar. Table 1 indicates that the observed differences in protein content between red and white cultivars are not statistically significant showcasing a range of 11.30±1.13 - 13.78±1.25 wt% for red cultivars and 10.44±1.13 - 13.15±1.35 wt% for white cultivars over the four years. The amount of moisture found in all cultivars ranges from 10.03±0.22 to 11.18±0.23 wt% with minimal variations amongst the samples and the remaining mass constitutes mainly starch and others.
Both red and white cultivars can exhibit high or low bread wheat quality as evidenced by variations in total protein content (Figure 2a), gluten content (Figure 2b), Zeleny sedimentation volume (Figure 2c), hectoliter weight (Figure 2d), kernel (single grain) density (Figure 2e), kernel volume (Figure 2f), and kernel weight (Figure 2g). While red cultivars generally have higher protein, gluten and sedimentation levels, some white cultivars possess comparable values as demonstrated in Figure 2a-c. Sedimentation volume and wet gluten content exhibit greater variability both yearly indicating genetic differences and across the four years implying environmental influences. Cultivars with lower protein content exhibited correspondingly higher starch content. Synthesis and accumulation of starch is shown to be affected by environmental stress [39] and agronomic conditions [40] during the grain development and filling periods. The substantial starch content, the main storage substance constituting 75.04±1.34 to 79.38±1.04 wt% of the wheat grains in this study, likely influenced kernel weight [39], volume, and shape [40].
Gluten constitutes a major fraction of the total protein content alongside smaller proteins, such as albumin and globulin. Wet gluten content ranged from 19.37 to 33.64 wt% for white cultivars, with an average 27.08±3.39 wt%, and from 20.62 to 37.23 wt% for red cultivars, averaging 28.12±4.59 wt% (Table 1). While red cultivars exhibited slightly higher gluten content, consistent with the total protein percentages, the differences between red and white cultivars were not statistically significant, considering the observed variability. Contrary to expectations based on total protein content, Figure 2a revealed a higher percentage of gluten in certain cultivars with below-average total protein levels. This suggests a variable gluten fraction and potentially distinct distributions of storage proteins amongst cultivars based on environmental conditions, such as growing conditions and climate.
Zeleny sedimentation volume, a key indicator of bread-making quality, exhibited the greatest variability amongst the investigated traits shown in Table 1. Red wheat cultivars consistently outperformed white wheats in terms of sedimentation volume, with values ranging from 25.59±4.63 to 41.00±11.85 mL compared to 20.69±4.91 to 33.39±13.04 mL for white wheats across 2014-2017 (Table 1). Figure 2c revealed that certain red wheat cultivars exhibited exceptionally high sedimentation volumes, exceeding the average for the red group. White cultivars Q and R, characterized by above-average total protein and gluten content, exhibited sedimentation volumes that exceeded the average for red cultivars, suggesting potential misclassification as red wheat. This observation further underscores the notion that grain color alone is not a reliable indicator of key wheat quality traits. Red wheat cultivar C displayed an unexpected anomaly in 2014, exhibiting high total protein content but the lowest sedimentation volume amongst all red cultivars. This finding contradicts the established positive correlation between protein content and sedimentation volume [17,18]. These results highlight the complexity of factors influencing sedimentation volume beyond total protein content. The instances of high protein concentration but low sedimentation volume could be attributed to alterations in the protein fraction composition, potentially resulting from nutritional imbalances arising from varying soil, growing conditions, and climate. As expected, the white wheat cultivar T, with the lowest total protein and gluten content, exhibited the lowest sedimentation volume.
Linear regression analysis of 162 wheat samples shown in Figure 3a-b revealed moderate correlations between Zeleny sedimentation volume and total protein content with a coefficient of determination R² ≈ 0.7 and weaker correlations between wet gluten content and total protein content with R² ≈ 0.5. These findings suggest that Zeleny sedimentation volume and gluten content cannot be accurately predicted solely from total protein content, especially when using NIT spectroscopy. While NIT spectroscopy provides a rapid method for quality parameter assessment, precise calibration is essential. To achieve accurate predictions, NIT spectroscopy calibration should be based on statistical analysis of measurements from a diverse range of wheat cultivars [41,42] rather than relying on data from a single cultivar, as is often practiced in commodity exchange markets. Pojic et al. [41] reported that instrument voltage and sample and ambient temperature significantly affect NIS measurements of moisture, protein content, wet gluten content, Zeleny sedimentation volume, and deformation energy. Abeshu et al. [43] recommended using NIS only for screening and simple quality control purposes for moisture and gluten index. The limitations of NIS measurements for Zeleny sedimentation volume, wet gluten content, and total protein content are evident in Figure 3c. This figure compares the results of linear regression analysis for the entire dataset of all cultivars A-to-X versus subsets containing only red cultivars A, B, D and white cultivar Q. These cultivars were selected for data accuracy due to their high number of samples across all harvest years. Stronger correlations with higher R² between sedimentation volume and gluten content with total protein content were observed for each of these four cultivars. This contrast highlights the importance of generating cultivar-specific calibrations for NIS analysis. However, this may not be practical considering the dynamic nature of wheat cultivar usage in commercial markets, where one particular variety remains for a couple of years before being replaced by another. Figure 3c further illustrates the significant cultivar-dependent variation in R² for wet gluten content and total protein content. Sedimentation volume is influenced by both genotype and environmental factors [16]. Consistent with previous research [44], environmental conditions have a more pronounced impact on wet gluten content than on Zeleny sedimentation volume.
3.2. Physical Analyses
Physical properties of wheat kernels, including volume and weight, are found to exhibit greater variation compared to kernel density and hectoliter weight as shown in Table 1. Previous research has established that kernel size and shape can affect packing efficiency, defined as the proportion of space occupied by kernels within a given volume. Packing efficiency influences the hectoliter weight, which is a measure of bulk density affected by morphological properties of grains [45]. The observed nonproportional differences across cultivars between hectoliter weight and kernel density presented in Figure 2d-e, respectively, may be attributed to varying packing efficiencies. Measured hectoliter weights were between 77.25±0.05 kg/hL and 81.73±0.05 kg/hL, while calculated kernel density values spanned 127.73±3.23 kg/hL and 138.77±0.01 kg/hL. Hectoliter weight was found to be around 58.77-63.96 % of kernel density, with the remaining difference attributed to interstitial space between kernels as a result of inefficient packing. Petingco et al. [46] investigated the relationship between kernel size and shape factors on the packing efficiency of red winter wheat cultivars. Their findings showed a positive correlation between kernel size and packing efficiency, indicating a larger hectoliter weight for larger kernels. Similarly, shape factors, sphericity and flatness, exhibited strong positive linear relationships with packing efficiency while elongation demonstrated an inverse relationship. This indicates that rounder kernels would yield a higher bulk density, while elongated kernels would deviate more from the kernel density. Although average hectoliter weight and kernel density did not differ significantly between red and white wheat cultivars across multiple years in Table 1, cultivar-specific variations were evident in Figure 2d-e. Neither bulk nor kernel density correlated with kernel volume and weight presented in Figure 2f-g. Kernel volume and weight exhibited similar fluctuations across cultivars and years, with white wheat cultivars T exhibiting the largest values and Q the smallest. While average volume and weight did not distinguish between red and white wheat cultivars as seen in Table 1, cultivar-specific variations were evident within each year as shown in Figure 2f-g. Such more pronounced inter-year variability suggests that kernel volume and weight are more susceptible to environmental influences than other wheat quality attributes. As reported by McKenzie et al. [47] for spring wheat, protein accumulation typically precedes grain filling, mitigating the impact of heat and water stress, except under nitrogen-deficient soil conditions. Consequently, variations in weight and volume are primarily attributed to accumulation of starch during grain filling under variant environmental and agronomy conditions.
In Figure 2d red cultivars exhibited the highest hectoliter weights in 2014 ranging from 76.36 to 83.61 kg/hL with an average 80.11±1.72 kg/hL, which consistently dropped over the four years to 79.94±1.54 in 2015, to 79.47±1.47 in 2016, and to 78.58±1.5 kg/hL in 2017. Similarly, white cultivars exhibited the highest hectoliter weights in 2014, ranging from 75.95 to 84.54 kg/hL with an average 81.06±2.73 kg/hL. There is not sufficient data for white cultivars for a fair comparison between 2015 and 2017 except for Q. Cultivar Q attained the highest bulk densities in 2014 and was observed to behave similar to red cultivars until 2016 when it attained its smallest bulk density at 77.25±0.05 kg/hL and followed a totally different scenario in 2017 by reaching high values around 81.73±0.05 kg/hL. While white wheat kernels were generally found to be slightly denser than red kernels, statistical differences were not significant considering the standard errors (Table 1). Red wheat cultivars F, K, B, and I, along with white wheat cultivars Q and T, exhibited hectoliter weights exceeding the highest average for white cultivars achieved in 2014. This suggests that bulk density is not related to grain color. Despite their high density, Q and T displayed contrasting analytical properties. While Q demonstrated exceptionally high total protein, gluten, and sedimentation values, T exhibited the lowest in all. These findings suggest that a direct correlation between analytical properties and bulk density, as defined by hectoliter weight, is not evident. White cultivar V, despite its high total protein content, gluten content, and sedimentation volume, had the lightest kernel in 2014, further supporting the notion that hectoliter weight is not solely related to protein and gluten content. Tkachuk and Kuzina [20] observed that a decrease in moisture content leads to a decrease in hectoliter weight and grain density. Similarly, Baker et al. [48] showed that moisture content significantly impacted the weight, volume, and density of wheat kernels, with the most pronounced effect on density occurring above 12% moisture content. These findings suggest that grain moisture content should be considered a potential confounding factor when interpreting hectoliter weight results across different cultivars.
Table 2 displays the variation of the measured kernel length l, width w, and thickness t and calculated volume V of 162 wheat samples classified based on grain color. The average length of the kernels was measured within the range of 5.75-7.03 mm. The variation of width between 2.76-3.63 mm and thickness between 2.74-3.48 mm are also remarkable. It is known that grain size of wheat is a highly variable trait, significantly impacted by both the inherent genetic characteristics of the cultivar and the prevailing cultivation conditions, encompassing fertilization practices, climatic factors, and the incidence of diseases and pests [49]. Calculated kernel volume of all samples was in the range of 25.27-45.10 mm3 (Table 2) and the kernel weight was in the range of 35.34 mg and 50.97 mg (Table 1) with significant variation across the cultivars investigated. White cultivar T exhibited the greatest grain volume across all samples in 2014 (Figure 2e), which is the genotype possessing the lowest protein content (Figure 2a). Conversely, the other white cultivars R, Q, S, and V displayed the lowest grain volumes, yet possessed higher protein content compared to the red wheat average. There is inconsistency related to color, but the inverse relation between grain size and protein content is consistent and aligns with observations by Wang and Fu [50]. They reported an inverse association, with total protein content increasing from 14.1 wt% to 18.6 wt% as kernel size decreased, accompanied by a decline in hectoliter weight from 82.6 kg/hL to 73.5 kg/hL. Supporting this finding, Sahin et al. [22] documented a negative correlation between protein content and kernel size, whereas Aydogan et al. [21] found a positive one. These conflicting findings suggest that grain size might be more intricately linked to the abundance of filler components, such as starch within the wheat endosperm, rather than solely reflecting protein content. A diminishing percentage of total proteins with increasing kernel size and weight could imply that starch accumulation outcompetes protein deposition within the endosperm, potentially influenced by specific growth conditions.
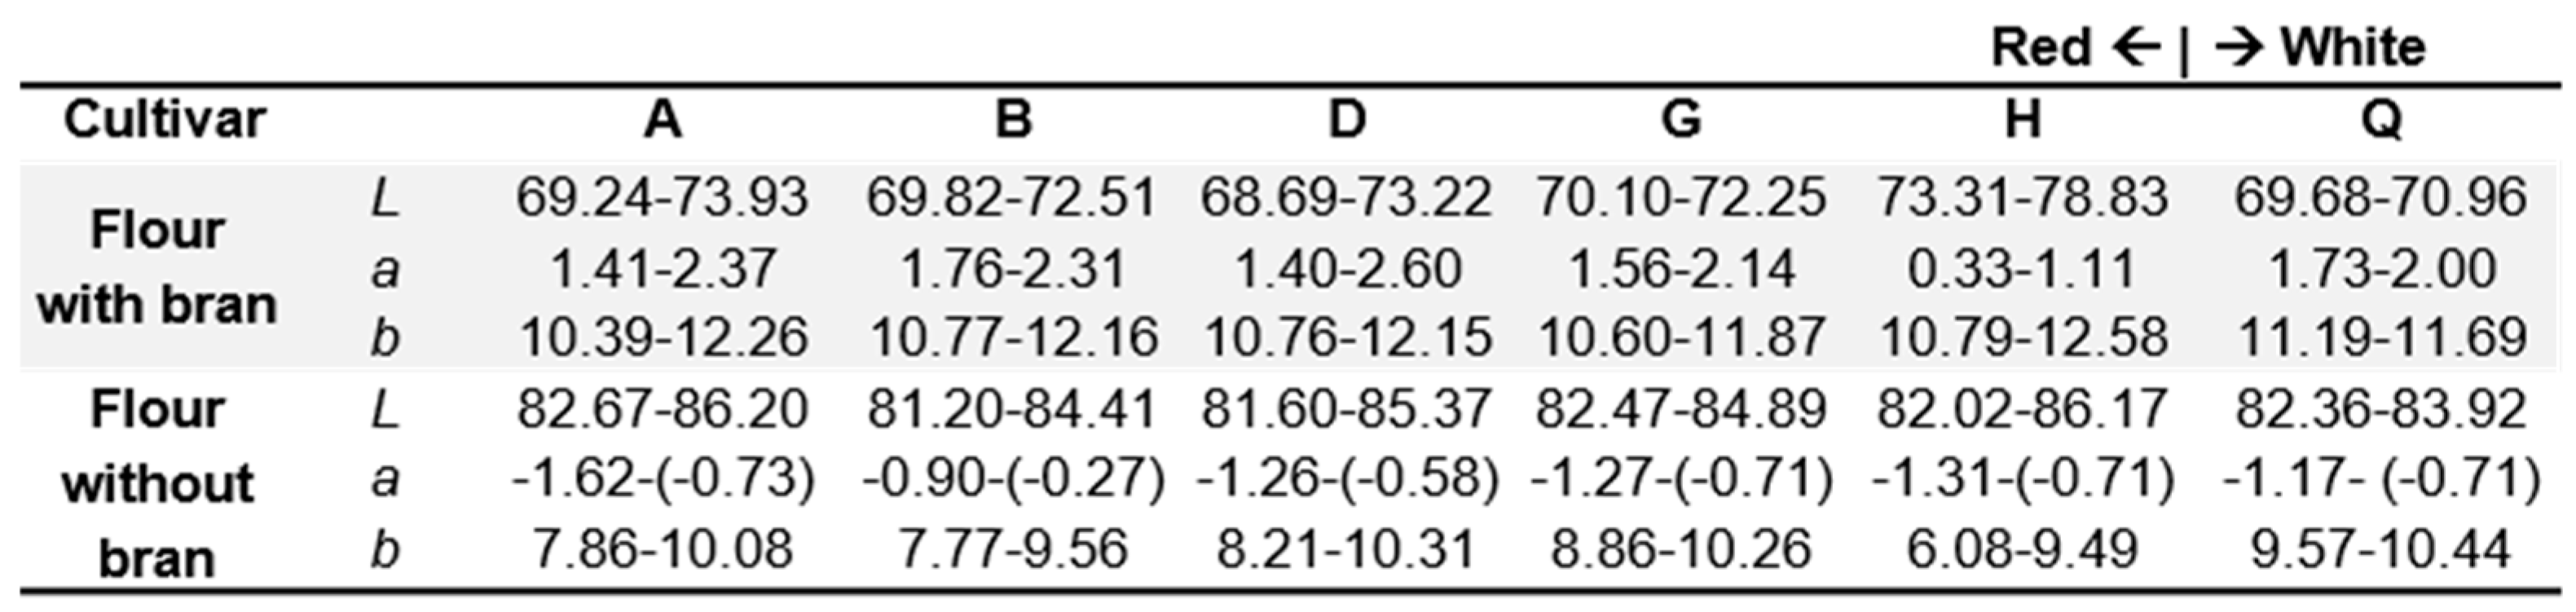
Hunter color measurements for whole wheat flour and debranned flour derived from 105 wheat samples across 6 cultivars, harvested between 2015 and 2017, are presented in Table 3. Results in Figure 4a-c show that flour with bran for all types has high redness with positive values of a particularly due to the presence of the aleurone layer, low lightness L, and high yellowness with positive b values. This is consistent with the presence of bran, which contains pigments like anthocyanins and carotenoids that contribute to a darker color. Values of a for flour without bran in all wheat cultivars was found to be negative indicating stronger green and less red color pigments associated with the bran layer. These findings support the fact that color pigments are mostly located in the outer bran layer of wheat kernels [25] and color related quality parameters can only be based on results from whole wheat flour. Based on the color groups of cultivars presented in Table 3, it is anticipated that red wheat cultivars have low lightness, high redness, and some yellowness with positive b values, while white wheat cultivars are expected to have high lightness, low redness with negative a values, and some yellowness with positive b values. Aligning with this expectation, white wheat cultivar Q displayed the highest lightness in both flour with bran and without bran (Figure 4a). Red cultivars, B and D, displayed the highest values of a in flour samples with bran and without bran (Figure 4b). Whole wheat flour derived from white wheat cultivar Q consistently exhibited significantly higher L values and significantly lower a values compared to red cultivars, as highlighted in Figure 4a-b. These differences persisted across three harvest years, suggesting a genetic basis for the reduced redness and increased lightness in cultivar Q. In contrast, b values, indicative of yellowness, exhibited greater variability within and between cultivars as shown in Figure 4c, implying a stronger influence of environmental and agronomical factors on carotenoid-based pigmentation.
No significant relation was found between redness and yellowness parameters of whole wheat flours and analytical quality parameters. Total protein content, gluten content, and sedimentation volume are parameters related to the bulk content of wheat kernels, whereas color pigments are mostly found in the bran in white and red cultivars and related to the antioxidant content as described by [24].
3.3. Analyses Based on Harvest Year and Climatic Conditions
Results of this study reveal significant inter-annual variations in various physical and chemical quality parameters of winter bread wheat cultivars in the Central Anatolia region. To understand the influence of climatic factors, average maximum temperature and total precipitation per month during the critical periods of anthesis and grain filling were investigated specifically for cultivars grown around Ankara region, R1 in Figure 1. Three red wheat cultivars, A, B, and D, and one white wheat cultivar, Q, were selected based on the availability of samples from multiple fields in R1 between 2014 and 2017. The critical period for spike growth and grain yield in spring wheat is documented to be around flowering, i.e. 20-30 days before anthesis and 7-10 days after anthesis [51]. Grain weight, which affects the yield, is assumed to be developed exclusively post-anthesis until maturity [28,29]. Typically, the anthesis and grain filling phases for winter wheat in Central Anatolia take place during the months of May and June, respectively, when the grain yield is most affected by climatic stresses [52], and mature grains are harvested around early July. Figure 5 presents the total rainfall and monthly average maximum temperature in May and June from 2014 to 2017 obtained from the Turkish State Meteorological Service [53]. Long term average temperature and total rainfall over 1991-2020 for R1 is documented as 15.1 ºC and 50.2 mm in May and 19.3 ºC and 36.6 mm in June.
3.3.1. Climatic trends
The increasing trend in average maximum temperature and the decreasing trend in total rainfall observed in Figure 5 suggest a potential warming climate in the region from 2014 to 2017. The rainfall pattern exhibits considerable inter-annual variability, with no apparent correlation to temperature fluctuations. 2015 emerged as the wettest year, characterized by peak June rainfall. Despite the highest May temperatures, the lowest June temperatures resulted in the lowest average maximum temperatures for both May and June combined. Conversely, 2016 was the driest year, with minimal rainfall in both May and June coinciding with the lowest May temperatures and highest June temperatures. 2015 experienced the lowest combined May and June temperatures, while 2016 exhibited the highest. While these extreme conditions did not significantly impact the analytical quality parameters shown in Figure 6a-e, they did influence the physical parameters shown in Figure 6f-i.
3.3.2. Wet conditions in 2014 and 2015
The years 2014 and 2015, characterized by high rainfall and lower average maximum temperatures, exhibited significantly larger kernel volumes (Figure 6h) and weights (Figure 6i) across all four cultivars compared to the warmer, drier conditions of 2016 and 2017. This trend aligns with previous research demonstrating the strong correlation between favorable climatic conditions and increased wheat yield [54,55,56,57,58,59]. The intra-annual variation in kernel weight and volume is influenced by cultivar-specific post-anthesis grain growth rates, which ultimately determine final grain weight and yield [29].
In 2015, larger kernel size and weight coincided with lower total protein and gluten content (Figure 6a, d), reduced moisture content (Figure 6b), and increased starch accumulation (Figure 6c). These findings are consistent with previous research demonstrating that water stress or heat stress during grain filling can delay leaf senescence, extending the period for photosynthesis and enhancing carbohydrate synthesis and translocation to the grain, ultimately maximizing grain-filling and yield [60,61,62,63,6465]. 2015 is marked by a warm May with sufficient rainfall of 53.1 mm, exceeding the long-term average by 6%, followed by a relatively cool, exceptionally wet June that received 110.8 mm rain, three times the long-term average. The extended post-anthesis grain-filling period under these conditions facilitated increased accumulation of starch leading to peak starch values, diluting the protein content leading to lowest protein values, as reported by Zheng et al. [66].
Conversely, in 2014, peak values for total protein content and gluten content, coupled with trough values for starch content, were observed. 2014 is characterized by exceptionally wet May and June conditions, with 84.6 mm and 60.3 mm rainfall, exceeding the long-term average by 69% and 65%, respectively. Such optimal rainfall regime likely favored protein synthesis, supporting the finding that the rate and duration of starch and protein deposition in the wheat endosperm are regulated by separate, independent mechanisms [60,64].
Consequently, the contrasting grain composition between 2014 and 2015 underscores the significant influence of environmental factors on wheat quality. 2014, a warm year with high May rainfall during anthesis and average rainfall in June during grain-filling led to better grain growth by synthesis of proteins and lower starch accumulation in the endosperm. The substantial decrease in total protein content and Zeleny sedimentation volume observed in 2015, a year with higher rainfall, specifically the highest rainfall and lowest temperatures in June, was attributed to increased starch accumulation during grain filling, diluting the total protein percentage within the endosperm.
3.3.3. Dry Conditions in 2016 and 2017
The dry conditions of 2016 had a significant impact on kernel morphology, particularly for the red cultivars. Water stress negatively impacted grain volume and weight, although the cultivars with superior water use efficiency, such as white cultivar Q and red cultivar B, were less affected [58]. Previous research has consistently shown that post-anthesis drought stress can significantly reduce grain yield and quality in wheat and other cereals [54,55,56,57,58,59]. Specifically, low May precipitation during anthesis and post-anthesis can negatively affect the development of reproductive organs in winter wheat [52], and drought stress during grain filling can disrupt the activity of sucrose-to starch converting enzymes, leading to decreased starch content and reduced yield [67]. Rharrabti et al. [65] have reported a trade-off between grain yield and protein quantity, but an increase in the nutritional protein quality with increasing yield. Starch, a polysaccharide composed of large carbohydrate molecules, such as amylose and amylopectin, has a much higher molecular weight between 1x10⁶-5x10⁸ g/mol compared to wheat proteins. Gluten, containing the large cross-linking molecules of wheat, has a molecular weight only between 2x10⁴-1x10⁵ g/mol. The 102-103 fold difference in molecular weight highlights how even a small increase in starch content can significantly impact grain weight, yield, density. These findings align with the observed minimization of kernel volume and weight during the dry conditions of 2016, particularly in June. While similar trends were observed for the white cultivar Q, the most extreme values were recorded in 2017. However, due to limited sampling of cultivar Q in location R1 during 2017 (Figure 1), these results should be interpreted with caution.
The arid conditions of 2016 significantly impacted the hectoliter weight of cultivar Q, reducing it to a minimum. In contrast, the red cultivars exhibited a more resilient response in hectoliter weight to extreme variations in kernel weight, volume, and density. This differential response aligns with previous findings [46] and suggests that white winter wheat cultivar Q may be more sensitive to drought stress. The observed slight decrease in hectoliter weight for red cultivars in 2017 is likely due to a reduction in both grain weight and volume, with the decrease in weight being more pronounced. Hectoliter weight is a complex function of grain morphological properties including kernel size, shape, weight, density, sphericity, and packing efficiency, as well as moisture content [17,45,46,49]. These parameters are all influenced by various factors, including genotype, soil conditions, fertilization, irrigation, and temperature regimes during growth and development [7,26]. Additionally, genetic factors play a role in determining yield and quality traits. However, the heritability of traits like grain yield, days to maturity, and thousand seed weight is low, limited with only one marker per trait [68], suggesting a significant influence of environmental factors rather than genetic factors. Since hectoliter weight is a cumulative property based on the morphological properties, the response of different cultivars to the same environmental stress could be different.
The proportional stability of total protein and gluten content across years suggests a relatively consistent ratio of crosslinking gluten proteins within the total protein fraction, indicating resilience to year-to-year climatic variations. This finding aligns with previous findings indicating that while total protein percentage in the kernel may vary with environmental conditions, protein content per kernel often remains relatively stable, suggesting that protein synthesis in the grain is less sensitive to environmental factors than starch synthesis [60,61,62,63,6465]. However, the total protein content of red cultivars A, B, and D exhibited a slight elevation in 2017. The dry conditions of 2017 may have limited starch accumulation (Figure 6c) [60,61,63] in these red cultivars, potentially contributing to the higher total protein percentage. Additionally, reduced sunlight intensity due to increased rainfall in 2017 compared to 2016 could have favored protein content and limited starch deposition [69]. Furthermore, enhanced nitrogen diffusion rates from the soil, possibly due to an improved fertilization performance in location R1 in 2017, may have contributed to the increase in total protein content and the significant decrease in starch content [66,67].
An examination of findings from 2015 and 2017, years with comparable average maximum temperatures but differing rainfall patterns, revealed that total protein content, sedimentation volume, and gluten content increased with reduced rainfall. This can be attributed to a reduction in starch accumulation within the endosperm under drought conditions as discussed above.
3.3.4. Cultivar Specific Indications
Across all four cultivars and years investigated in Figure 6, red wheat cultivar B consistently achieved the highest total protein content and Zeleny sedimentation volume and the lowest starch content over the four years. This finding aligns with the established reputation of cultivar B as a high-quality wheat cultivar, which achieved maximums of 15.2±1.12 wt% total protein content and 63.46±5.9 mL sedimentation volume in 2014.
The white wheat cultivar Q was consistently the heaviest and densest biomass across all years except for 2016. The unexpectedly low data point for cultivar Q in 2016 might be attributable to its excessive sensitivity to drought conditions.
4. Conclusions
This study investigated the influence of cultivar and environmental factors, specifically monthly average maximum temperature and rainfall during anthesis and grain filling periods, on analytical and physical wheat quality parameters. The relationships between grain color (red vs. white), protein content, wet gluten content, Zeleny sedimentation volume, hectoliter weight, Hunter color parameters, and kernel properties, such as dimensions, volume, weight, and density, across a diverse set of winter wheat cultivars collected between 2014 and 2017 were investigated. The results reveal several key findings:
- Significant inter-cultivar variation was observed in key quality parameters, such as Zeleny sedimentation volume, wet gluten content, total protein content, kernel weight, and volume. These pronounced differences were influenced by both genetic and environmental factors. While grain color, as red or white, was not a reliable predictor of quality, as some white cultivars outperformed red cultivars in protein content, gluten content, and sedimentation volume, specific cultivars exhibited consistent superior or inferior performance across various quality parameters.
- Color measurements proved no significant relation between redness and yellowness parameters of whole wheat flours and analytical quality parameters. Results indicated that color pigments are primarily located in the bran layer, making them less indicative of the quality of the kernel’s bulk content. Color differences observed between different wheat cultivars suggest a genetic basis for these variations, which persisted across multiple years. However, yellowness, influenced by carotenoid pigments, seems to be more susceptible to environmental factors.
- Hectoliter weight was influenced by multiple factors, including kernel dimensions, volume, weight, density, and moisture content. While environmental factors affected these parameters, the impact varied between cultivars. Cumulative of the variations in these parameters did not significantly affect the hectoliter weight of red cultivars, although insignificant reduction was observed during warmer climates due to a reduction in both grain weight and volume, with the decrease in weight being more pronounced. White cultivar Q appeared to be more sensitive to drought stress, exhibiting a significant reduction in hectoliter weight.
- Kernel volume and weight did not correlate with protein content, due to accumulation of varying amounts of starch based on environmental conditions. Inter-annual variations in quality parameters were primarily driven by total rainfall during the anthesis and grain-filling periods. High rainfall during anthesis and moderate rainfall during grain filling favored protein synthesis and reduced starch accumulation, leading to improved protein quality (high gluten content and sedimentation volume). Conversely, excessive rainfall during grain filling resulted in increased starch accumulation and diluted protein content. Environmental variations did not affect the ratio of gluten proteins to total protein, even though overall content fluctuated.
Consequently, inter-annual variations in wheat quality parameters necessitate a product-specific analysis considering environmental conditions to inform pricing decisions. While soil composition can be managed through fertilization, fluctuations in temperature and, specifically, precipitation due to changing climatic conditions can significantly influence product quality. Further research is needed to develop rapid and accurate methods for assessing wheat quality, considering the complex interplay between genetic and environmental factors. Detailed spectroscopic analysis of protein and starch components, as well as investigations into understanding the mechanisms of the relations between physical, chemical, mechanical and microstructural properties, can provide valuable insights into wheat quality.
Author Contributions
Conceptualization, Y.O. and S.O.; methodology, Y.O. and S.O.; software, Y.O. and S.O.; validation, Y.O. and S.O.; formal analysis, Y.O. and S.O.; investigation, Y.O. and S.O.; resources, Y.O. and S.O.; data curation, Y.O. and S.O.; writing—original draft preparation, Y.O. and S.O.; writing—review and editing, S.O.; visualization, S.O.; supervision, S.O.; project administration, S.O.; funding acquisition, Y.O. and S.O. All authors have read and agreed to the published version of the manuscript.
Funding
This research received no external funding.
Data Availability Statement
Research data is available on request from the authors.
Acknowledgments
The authors gratefully acknowledge the Food Analysis Laboratory of the Ankara Commodity Exchange for facilitating the completion of the analytical tests employed in this study. This research is part of a doctoral dissertation undertaken at the Institute of Science, Hacettepe University.
Conflicts of Interest
The authors declare no conflicts of interest.
References
- Bonfil, D.J.; Posner, E.S. Can bread wheat quality be determined by gluten index? J. Cereal Sci. 2012, 56, 115–118. [Google Scholar] [CrossRef]
- Peng, J.H.; Sun, D.; Nevo, E. Domestication Evolution, Genetics and Genomics in Wheat. Molecular Breeding 2011, 28, 281–301. [Google Scholar] [CrossRef]
- TurkStat. Cereals and Other Crop Products Balance Sheets. TUIK: 2023; Vol. 2024.
- Williams, P.; Sobering, D.; Antoniszyn, J. Protein Testing Methods at the Canadian Grain Commission. Proceedings of Wheat Protein Symposium, Saskatoon.
- Pawlinsky, T.; Williams, P. Prediction of Wheat Bread-Baking Functionality in Whole Kernels, Using Near Infrared Reflectance Spectroscopy. Journal of Near Infrared Spectroscopy 1998, 6, 121–127. [Google Scholar] [CrossRef]
- Shewry, P.R.; Halford, N.G.; Lafiandra, D. Genetics of Wheat Gluten Proteins. In Advances in Genetics, Hall, J.C., Dunlap, J.C., Friedmann, T., Eds. Academic Press: 2003; Vol. 49, pp. 111-184.
- Wieser, H.; Seilmeier, W. The Influence of Nitrogen Fertilisation on Quantities and Proportions of Different Protein Types in Wheat Flour. J. Sci. Food Agric. 1998, 76, 49–55. [Google Scholar] [CrossRef]
- Horvat, D.; Šimić, G.; Dvojkovic, K.; Ivić, M.; Plavšin, I.; Novoselović, D. Gluten Protein Compositional Changes in Response to Nitrogen Application Rate. Agronomy 2021, 11, 325. [Google Scholar] [CrossRef]
- Landolfi, V.; D'Auria, G.; Nicolai, M.A.; Nitride, C.; Blandino, M.; Ferranti, P. The effect of nitrogen fertilization on the expression of protein in wheat and tritordeum varieties using a proteomic approach. Food Res Int 2021, 148, 110617. [Google Scholar] [CrossRef] [PubMed]
- Zhen, S.; Deng, X.; Xu, X.; Liu, N.; Zhu, D.; Wang, Z.; Yan, Y. Effect of high-nitrogen fertilizer on gliadin and glutenin subproteomes during kernel development in wheat (Triticum aestivum L.). The Crop Journal 2020, 8, 38–52. [Google Scholar] [CrossRef]
- Triboi, E.; Martre, P.; Triboi-Blondel, A.M. Environmentally-Induced Changes in Protein Composition in Developing Grains of Wheat are Related to Changes in Total Protein Content. Journal of Experimental Botany 2003, 54, 1731–1742. [Google Scholar] [CrossRef] [PubMed]
- Wieser, H.; Koehler, P.; Scherf, K.A. Chemistry of wheat gluten proteins: Quantitative composition. Cereal Chemistry 2023, 100, 36–55. [Google Scholar] [CrossRef]
- Hruskova, M.; Famera, O. Prediction of Wheat and Flour Zeleny Sedimentation Value Using NIR Technique. Czech J Food Sci 2003, 21, 91–96. [Google Scholar] [CrossRef]
- Pasha, I.; Anjum, F.M.; Butt, M.S.; Sultan, J.I. Gluten Quality Prediction and Correlation Studies in Spring Wheats Journal of Food Quality 2007, 30, 438-449. 30. [CrossRef]
- Anjum, F.M.; Walker, C.E. Review on the Significance of Starch and Protein to Wheat Kernel Hardness. J. Sci. Food Agric. 1991, 56, 1–13. [Google Scholar] [CrossRef]
- Grausgruber, H.; Oberforster, M.; Werteker, M.; Ruckenbauer, P.; Vollmann, J. Stability of Quality Traits in Austrian-Grown Winter Wheats. Field Crops Research 2000, 66, 257–267. [Google Scholar] [CrossRef]
- Sezer, I.; Akay, H.; Mut, Z.; Arslan, H.; Ozturk, E.; Erbas Kose, O.D.; Kiremit, M.S. Effects of Different Water Table Depth and Salinity Levels on Quality Traits of Bread Wheat. Agriculture 2021, 11, 969. [Google Scholar] [CrossRef]
- Hrusková, M.; Skodova, V.; Blazek, J. Wheat sedimentation values and falling number. Czech. J. Food Sci. 2004, 22, 51–57. [Google Scholar] [CrossRef]
- Kurt Polat, P.O.; Yagdı, K. Investigations on the Relationships Between Some Quality Characteristics in a Winter Wheat Population. Turkish Journal Of Field Crops 2017, 22, 108–113. [Google Scholar] [CrossRef]
- Tkachuk, R.; Kuzina, F.D. Wheat: Relations Between Some Physical and Chemical Properties. Canadian Journal of Plant Science 1979, 59, 15–20. [Google Scholar] [CrossRef]
- Aydogan, S.; Sahin, M.; Gocmen Akcacik, A.; Yakisir, E. Effect of Different Grain Size on the Quality of Bread Wheat. Selcuk Journal of Agriculture and Food Sciences 2014, 1, 27–33. [Google Scholar]
- Sahin, M.; Gocmen Akcacik, A.; Aydogan, S.; Ozer, E. Ekmeklik Bugday Tane Boyutunun Kalite Ozellikleri Uzerine Etkisi. Anadolu Ege Tarımsal Arastirma Enstitusu Dergisi 2013, 23, 1–8. [Google Scholar]
- Mohan, D.; Tiwari, V. Influence of varying crop seasons and locations in sustaining wheat yield under two agro-climatically diverse zones of India. Field Crops Research 2016, 196, 402–408. [Google Scholar] [CrossRef]
- Garg, M.; Kaur, S.; Sharma, A.; Kumari, A.; Tiwari, V.; Sharma, S.; Kapoor, P.; Sheoran, B.; Goyal, A.; Krishania, M. Rising Demand for Healthy Foods-Anthocyanin Biofortified Colored Wheat Is a New Research Trend. Frontiers in Nutrition 2022, 9. [Google Scholar] [CrossRef] [PubMed]
- Guzman, C.; Ibba, M.I.; Alvarez, J.B.; Sissons, M.; Morris, C. Wheat Quality. In Wheat Improvement: Food Security in a Changing Climate, Reynolds, M.P., Braun, H.J., Eds. Springer International Publishing: Cham, 2022; 10.1007/978-3-030-90673-3_11pp. 177-193.
- Rozbicki, J.; Ceglińska, A.; Gozdowski, D.; Jakubczak, M.; Cacak-Pietrzak, G.; Mądry, W.; Golba, J.; Piechociński, M.; Sobczyński, G.; Studnicki, M.; et al. Influence of the Cultivar, Environment and Management on the Grain Yield and Bread-Making Quality in Winter Wheat. J. Cereal Sci. 2015, 61, 126–132. [Google Scholar] [CrossRef]
- Flagella, Z.; Giuliani, M.M.; Giuzio, L.; Volpi, C.; Masci, S. Influence of Water Deficit on Durum Wheat Storage Protein Composition and Technological Quality. European Journal of Agronomy 2010, 33, 197–207. [Google Scholar] [CrossRef]
- Asana, R.D.; Williams, R.F. Effect of Temperature Stress on Grain Development in Wheat. Aust. J. Agric. Res. 1965, 16, 1. [Google Scholar] [CrossRef]
- Sofield, I.; Evans, L.T.; Cook, M.G.; Wardlaw, I.F. Factors Influencing Rate and Duration of Grain Filling in Wheat. Australian Journal of Plant Physiology 1977, 4, 785–797. [Google Scholar] [CrossRef]
- Borghi, B.; Corbellini, M.; Ciaffi, M.; Lafiandra, D.; De Stefanis, E.; Sgrulletta, D.; Boggini, G.; Di Fonzo, N. Effects of Heat Shock During Grain Filling on Bread and Durum Wheats. Aust. J. Agric. Res. 1995, 46, 1365–1380. [Google Scholar] [CrossRef]
- Randall, P.J.; Moss, H.J. Some Effects of Temperature Regime During Grain Filling on Wheat Quality. Aust. J. Agric. Res. 1990, 41, 603–617. [Google Scholar] [CrossRef]
- Garrido-Lestache, E.; Lopez-Bellido, R.J.; Lopez-Bellido, L. Effect of N rate, Timing and Splitting and N Type on Bread-making Quality in Hard Red Spring Wheat Under Rainfed Mediterranean Conditions. Field Crops Research 2004, 85, 213–236. [Google Scholar] [CrossRef]
- Innes, P.; Blackwell, R.D. The Effect of Drought on the Water Use and Yield of Two Spring Wheat Genotypes. The Journal of Agricultural Science 1981, 96, 603–610. [Google Scholar] [CrossRef]
- Map of Europe. Availabe online: https://vemaps.com/europe-continent/eu-c-03 (accessed on 25.04.2024). (accessed on 25.04.2024).
- Map of Turkey with Provinces. Availabe online: https://vemaps.com/turkey/tr-04 (accessed on 25.04.2024). (accessed on 25.04.2024).
- Gastón, A.a.L.; Abalone, R.M.; Giner, S.A. Wheat drying kinetics. Diffusivities for sphere and ellipsoid by finite elements. Journal of Food Engineering 2002, 52, 313–322. [Google Scholar] [CrossRef]
- Markowski, M.; Żuk-Gołaszewska, K.; Kwiatkowski, D. Influence of variety on selected physical and mechanical properties of wheat. Industrial Crops and Products 2013, 47, 113–117. [Google Scholar] [CrossRef]
- Demyanchuk, A.M.; Grundas, S.; Velikanov, L.P. Identification of Wheat Morphotype and Variety Based on XRay Images of Kernels. In Advances in Agrophysical Research, Grundas, S., Stepniewski, A., Eds. IntechOpen: Rijeka, 2013; 10.5772/52236pp. 223-267.
- Zhou, Q.; Wu, X.J.; Xin, L.; Jiang, H.D.; Wang, X.; Cai, J.; Jiang, D. Waterlogging and simulated acid rain after anthesis deteriorate starch quality in wheat grain. Plant Growth Regul. 2018, 85, 257–265. [Google Scholar] [CrossRef]
- Aniskina, T.S.; Sudarikov, K.A.; Prisazhnoy, N.A.; Besaliev, I.N.; Panfilov, A.A.; Reger, N.S.; Kormilitsyna, T.; Novikova, A.A.; Gulevich, A.A.; Lebedev, S.V.; et al. Phenotyping Wheat Kernel Symmetry as a Consequence of Different Agronomic Practices. Symmetry-Basel 2024, 16, 22. [Google Scholar] [CrossRef]
- Pojic, M.; Rakic, D.; Lazic, Z. Chemometric optimization of the robustness of the near infrared spectroscopic method in wheat quality control. Talanta 2015, 131, 236–242. [Google Scholar] [CrossRef]
- Baslar, M.; Ertugay, M.F. Determination of protein and gluten quality-related parameters of wheat flour using near-infrared reflectance spectroscopy (NIRS). Turkish Journal of Agriculture and Forestry 2011, 35, 139–144. [Google Scholar] [CrossRef]
- Abeshu, Y.; Kasahun, C. Fast and non- destructive multivariate test method to predict bread wheat grain major quality parameters. International Journal of Food Properties 2024, 27, 400–410. [Google Scholar] [CrossRef]
- Rasheed, F. Tailoring the Structure-Function Relationship in Wheat Gluten Processing, Genotype and Environment Effects in Bio-Based Materials. Doctoral Thesis, Swedish University of Agricultural Sciences, Alnarp, 2015. [Google Scholar]
- Yabwalo, D.N.; Berzonsky, W.A.; Brabec, D.; Pearson, T.; Glover, K.D.; Kleinjan, J.L. Impact of grain morphology and the genotype by environment interactions on test weight of spring and winter wheat (Triticum aestivum L.). Euphytica 2018, 214, 125. [Google Scholar] [CrossRef]
- Petingco, M.C.; Casada, M.E.; Maghirang, R.G.; Thompson, S.A.; McNeill, S.G.; Montross, M.D.; Turner, A.P. Influence of Kernel Shape and Size on the Packing Ratio and Compressibility of Hard Red Wheat. Trans. ASABE 2018, 61, 1437–1448. [Google Scholar] [CrossRef]
- McKenzie, R.H.; Bremer, E.; Grant, C.A.; Johnston, A.M.; DeMulder, J.; Middleton, A.B. In-crop application effect of nitrogen fertilizer on grain protein concentration of spring wheat in the Canadian prairies. Canadian Journal of Soil Science 2006, 86, 565–572. [Google Scholar] [CrossRef]
- Baker, D.; Fifield, C.C.; Hartsing, T. Factors Related to the Flour-Yielding Capacity of Wheat. The Northwestern Miller 1965, 272, 16–18. [Google Scholar]
- Evers, A.D. Grain Size And Morphology: Implications For Quality. In Wheat Structure, Schofield, J.D., Ed. Woodhead Publishing: 1995; pp. 19-24.
- Wang, K.; Fu, B.X. Inter-Relationships Between Test Weight, Thousand Kernel Weight, Kernel Size Distribution and Their Effects on Durum Wheat Milling, Semolina Composition and Pasta Processing Quality. Foods 2020, 9, 1308. [Google Scholar] [CrossRef]
- Fischer, R.A. Number of Kernels in Wheat Crops and the Influence of Solar-Radiation and Temperature. J. Agric. Sci. 1985, 105, 447–461. [Google Scholar] [CrossRef]
- Kaya, Y. Winter Wheat Adaptation to Climate Change in Turkey. Agronomy-Basel 2021, 11, 20. [Google Scholar] [CrossRef]
- Total Rainfall and Average Maximum Temperature Data Sets. Service, T.S.M., Ed. Turkish State Meteorological Service: 2024. Total Rainfall and Average Maximum Temperature Data Sets. Service, T.S.M. (Ed.).
- Gutierrez, M.; Reynolds, M.P.; Raun, W.R.; Stone, M.L.; Klatt, A.R. Spectral Water Indices for Assessing Yield in Elite Bread Wheat Genotypes under Well-Irrigated, Water-Stressed, and High-Temperature Conditions. Crop Sci. 2010, 50, 197–214. [Google Scholar] [CrossRef]
- Kuresova, G.; Haberle, J.; Svoboda, P.; Wollnerova, J.; Moulik, M.; Chrpova, J.; Raimanova, I. Effects of Post-Anthesis Drought and Irrigation on Grain Yield, Canopy Temperature and <SUP>13</SUP>C Discrimination in Common Wheat, Spelt, and Einkorn. Agronomy-Basel 2022, 12. [Google Scholar] [CrossRef]
- Memon, H.M.U.; Sial, M.A.; Bux, H. Evaluation of Bread Wheat Genotypes for Water Stress Tolerance Using Agronomic Traits. Acta Agrobotanica 2020, 75. [Google Scholar] [CrossRef]
- Monneveux, P.; Reynolds, M.P.; Trethowan, R.; González-Santoyo, H.; Peña, R.J.; Zapata, F. Relationship between grain yield and carbon isotope discrimination in bread wheat under four water regimes. European Journal of Agronomy 2005, 22, 231–242. [Google Scholar] [CrossRef]
- Ullah, S.; Bramley, H.; Mahmood, T.; Trethowan, R. Morpho-physiological responses of diverse emmer wheat genotypes to terminal water stress. Cereal Research Communications 2022, 50, 999–1007. [Google Scholar] [CrossRef]
- Baser, I.; Sehirali, S.; Orta, H.; Erdem, T.; Erdem, Y.; Yorgancilar, Ö. Effect of different water stresses on the yield and yield components of winter wheat. Cereal Research Communications 2004, 32, 217–223. [Google Scholar] [CrossRef]
- Bhullar, S.; Jenner, C. Differential responses to high temperatures of starch and nitrogen accumulation in the grain of four cultivars of wheat. Functional Plant Biology 1985, 12, 363–375. [Google Scholar] [CrossRef]
- Campbell, C.A.; Davidson, H.R.; Winkleman, G.E. Effect of Nitrogen, Temperature, Growth Stage and Duration of Moisture Stress on Yield Components and Protein Content of Manitou Spring Wheat. Canadian Journal of Plant Science 1981, 61, 549–563. [Google Scholar] [CrossRef]
- Delmoral, L.F.G.; Boujenna, A.; Yanez, J.A.; Ramos, J.M. Forage Production, Grain-Yield, and Protein-Content in Dual-Purpose Triticale Grown for Both Grain and Forage. Agronomy Journal 1995, 87, 902–908. [Google Scholar] [CrossRef]
- Fernandez-Figares, I.; Marinetto, J.; Royo, C.; Ramos, J.M.; Garcia del Moral, L.F. Amino-Acid Composition and Protein and Carbohydrate Accumulation in the Grain of Triticale Grown under Terminal Water Stress Simulated by a Senescing Agent. J. Cereal Sci. 2000, 32, 249–258. [Google Scholar] [CrossRef]
- Jenner, C.; Ugalde, T.; Aspinall, D. The physiology of starch and protein deposition in the endosperm of wheat. Functional Plant Biology 1991, 18, 211–226. [Google Scholar] [CrossRef]
- Rharrabti, Y.; Elhani, S.; Martos-Núñez, V.; García del Moral, L.F. Protein and Lysine Content, Grain Yield, and Other Technological Traits in Durum Wheat under Mediterranean Conditions. Journal of Agricultural and Food Chemistry 2001, 49, 3802–3807. [Google Scholar] [CrossRef]
- Zheng, B.; Jiang, J.; Wang, L.; Huang, M.; Zhou, Q.; Cai, J.; Wang, X.; Dai, T.; Jiang, D. Reducing Nitrogen Rate and Increasing Plant Density Accomplished High Yields with Satisfied Grain Quality of Soft Wheat via Modifying the Free Amino Acid Supply and Storage Protein Gene Expression. Journal of Agricultural and Food Chemistry 2022, 70, 2146–2159. [Google Scholar] [CrossRef] [PubMed]
- Ullah, A.; Zhao, C.F.; Zhang, M.X.; Sun, C.J.; Liu, X.X.; Hu, J.L.; Zeeshan, M.; Zaid, A.; Dai, T.B.; Tian, Z.W. Nitrogen enhances the effect of pre-drought priming against post-anthesis drought stress by regulating starch and protein formation in wheat. Physiol. Plant. 2023, 175, 16. [Google Scholar] [CrossRef] [PubMed]
- Mwadzingeni, L.; Shimelis, H.; Rees, D.J.G.; Tsilo, T.J. Genome-wide association analysis of agronomic traits in wheat under drought-stressed and non-stressed conditions. Plos One 2017, 12, 13. [Google Scholar] [CrossRef] [PubMed]
- Wang, J.; Shi, K.; Lu, W.P.; Lu, D.L. Effects of Post-silking Shading Stress on Enzymatic Activities and Phytohormone Contents During Grain Development in Spring Maize. J. Plant Growth Regul. 2021, 40, 1060–1073. [Google Scholar] [CrossRef]
Figure 1.
Central Anatolia showing the regions of: R1. Ankara, R2. Kırıkkale/Çorum, R3. Yozgat, R4. Konya, and R5. Balıkesir (Map is modified from [34,35] and the types and number (N) of samples of bread wheat cultivars collected from each region.
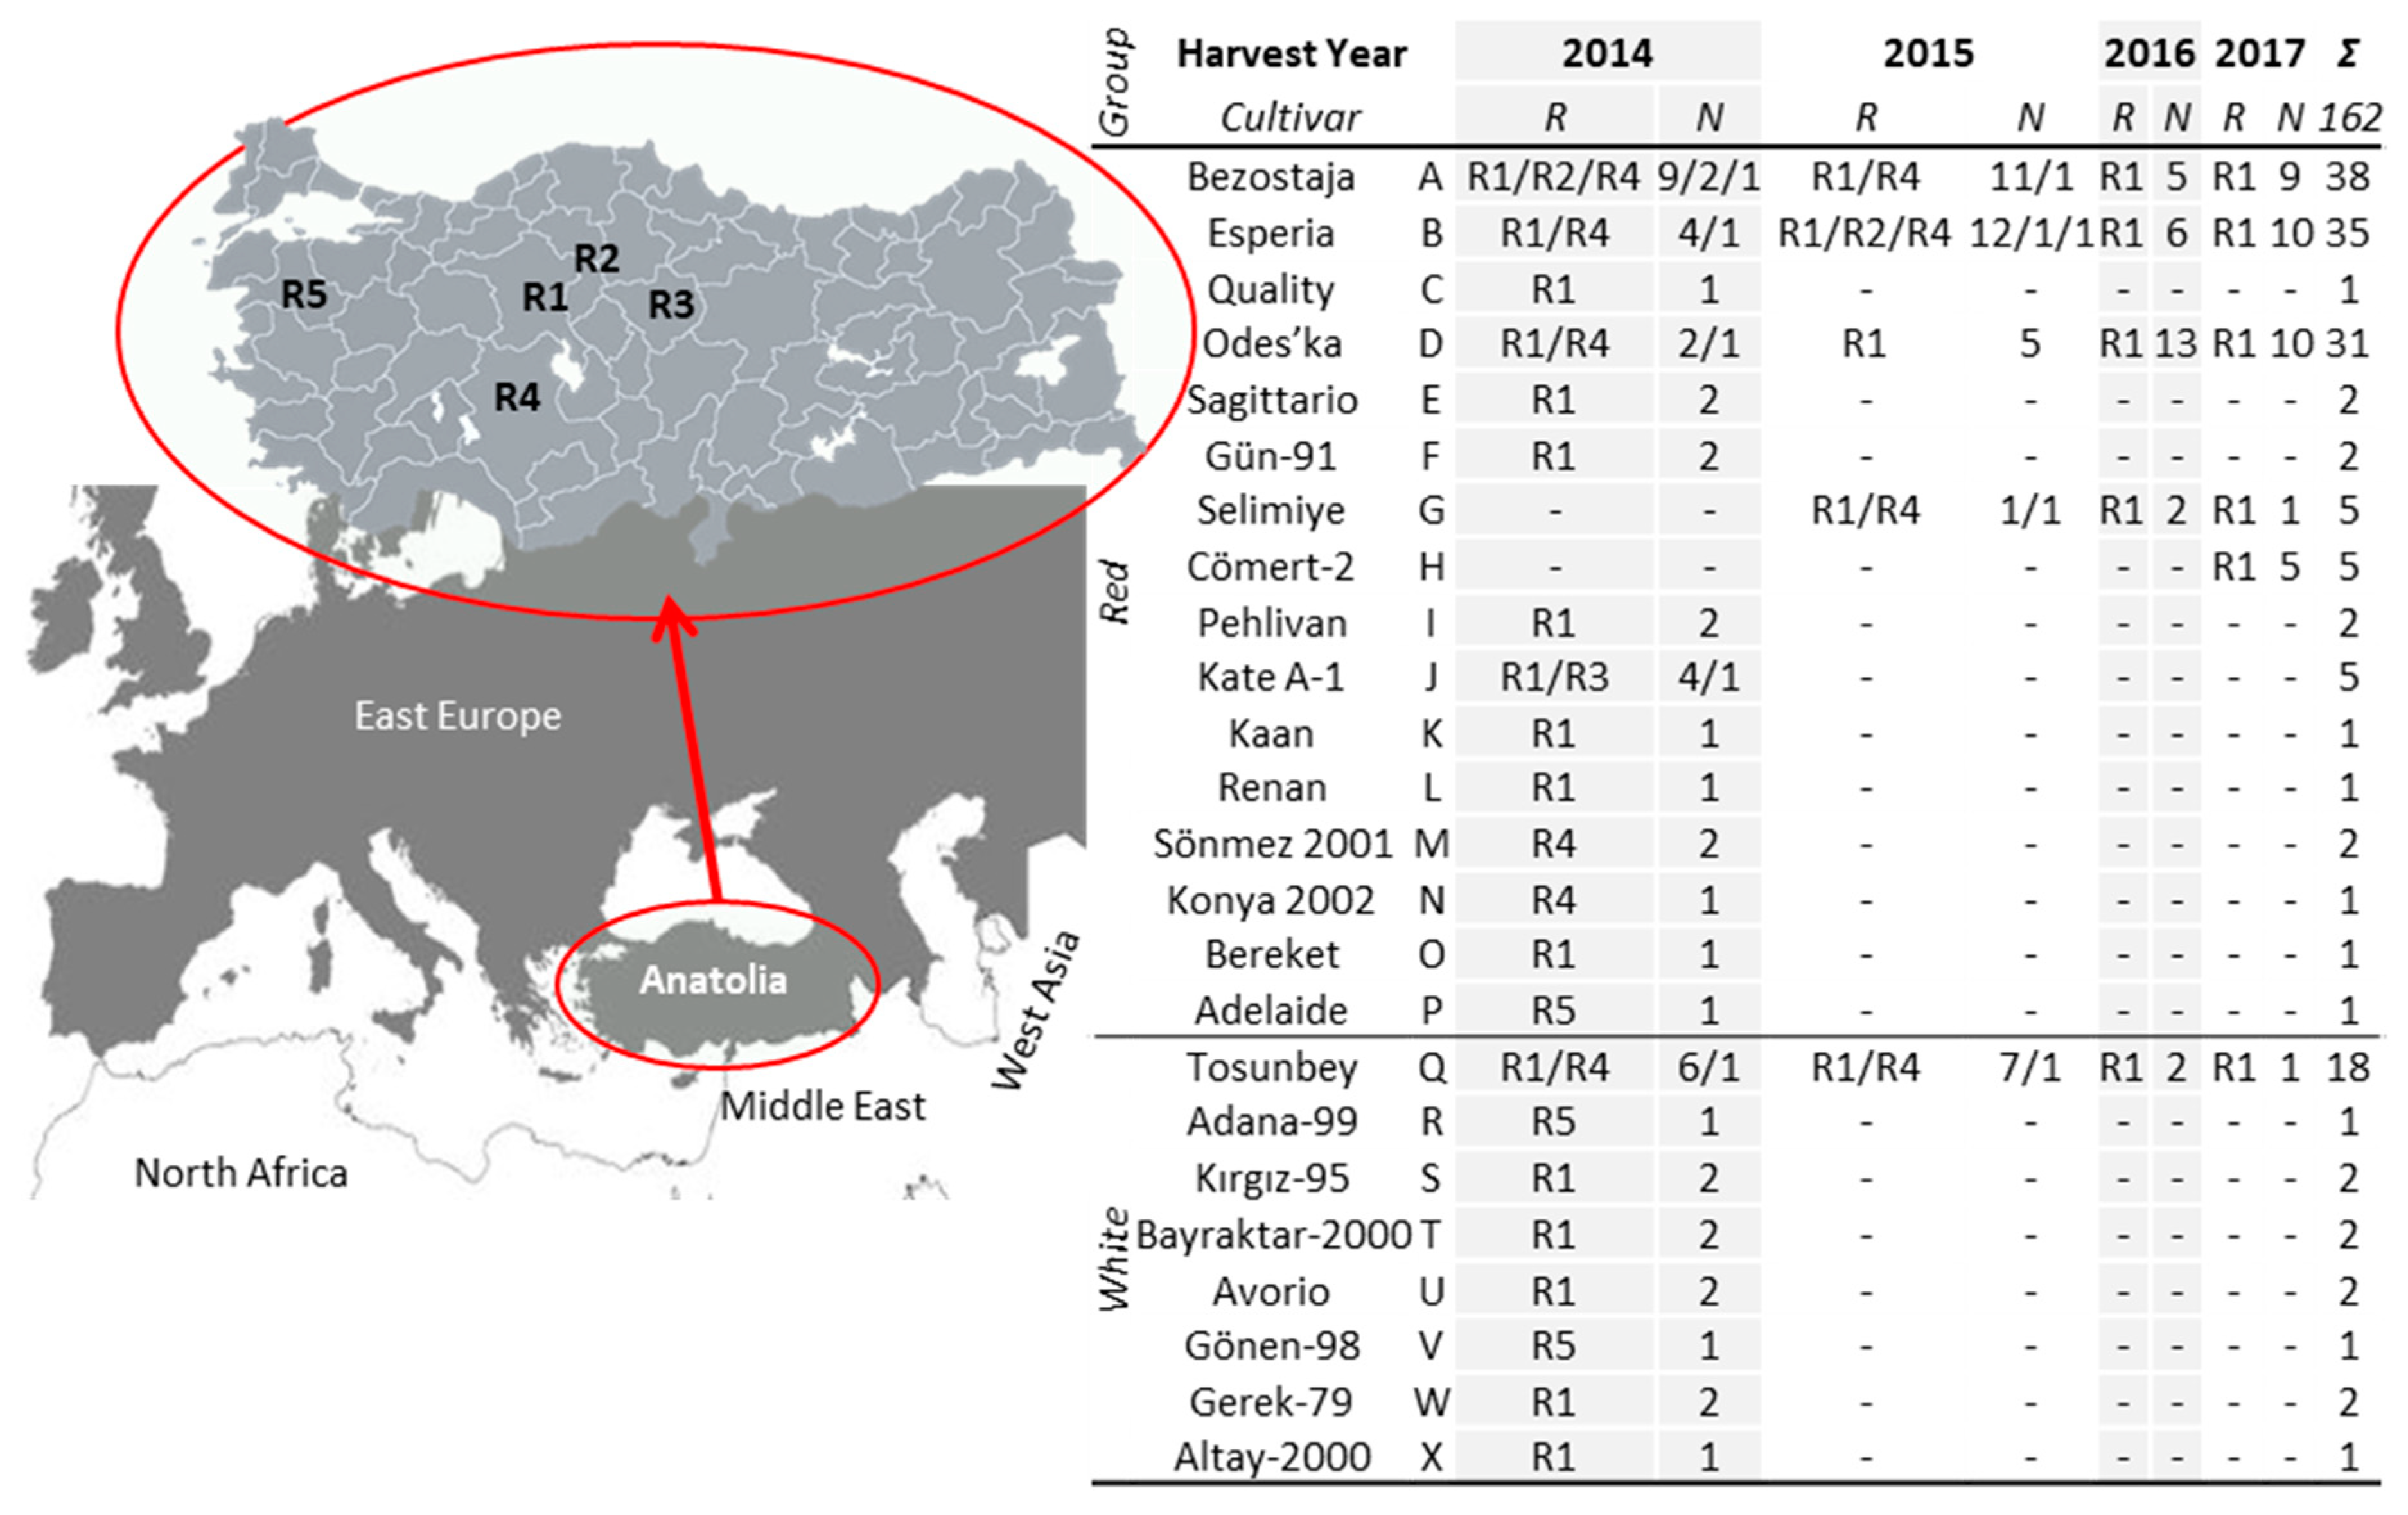
Figure 2.
a) Total protein content, b) Wet gluten content, c) Zeleny sedimentation volume, d) Hectoliter weight, e) Kernel density, f) Kernel volume, and g) Kernel weight of 24 cultivars between 2014 and 2017.
Figure 2.
a) Total protein content, b) Wet gluten content, c) Zeleny sedimentation volume, d) Hectoliter weight, e) Kernel density, f) Kernel volume, and g) Kernel weight of 24 cultivars between 2014 and 2017.
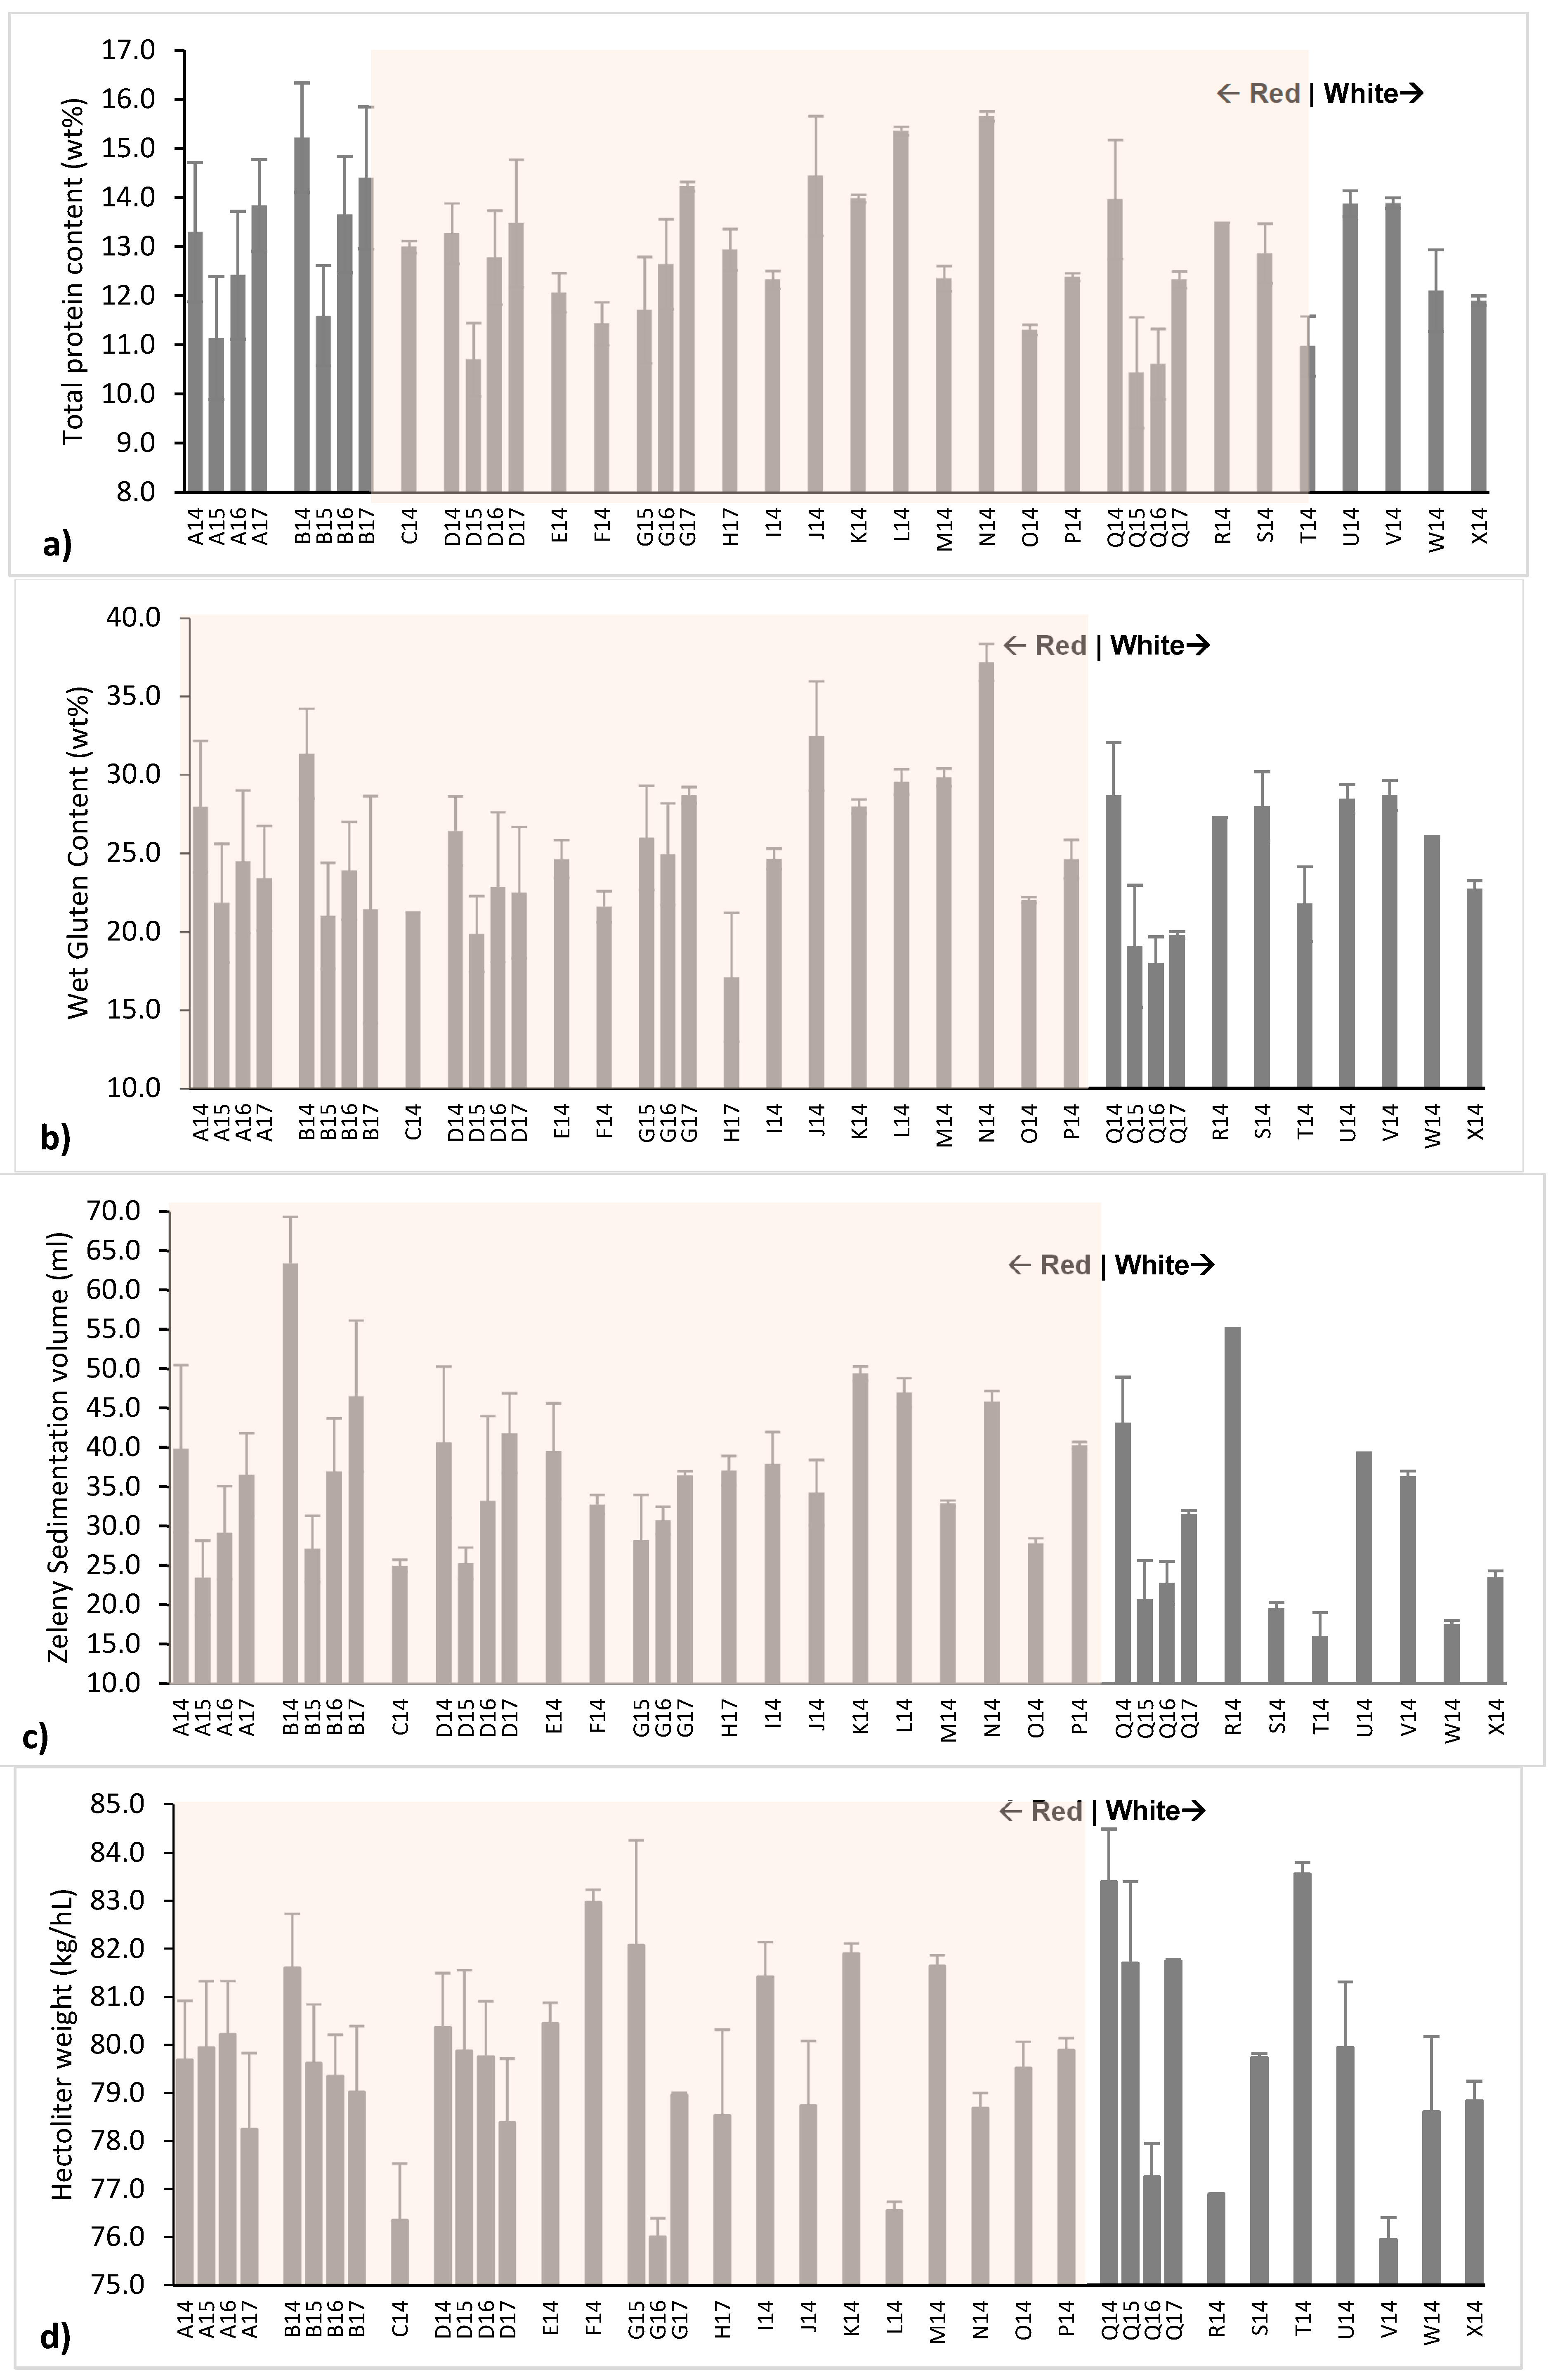
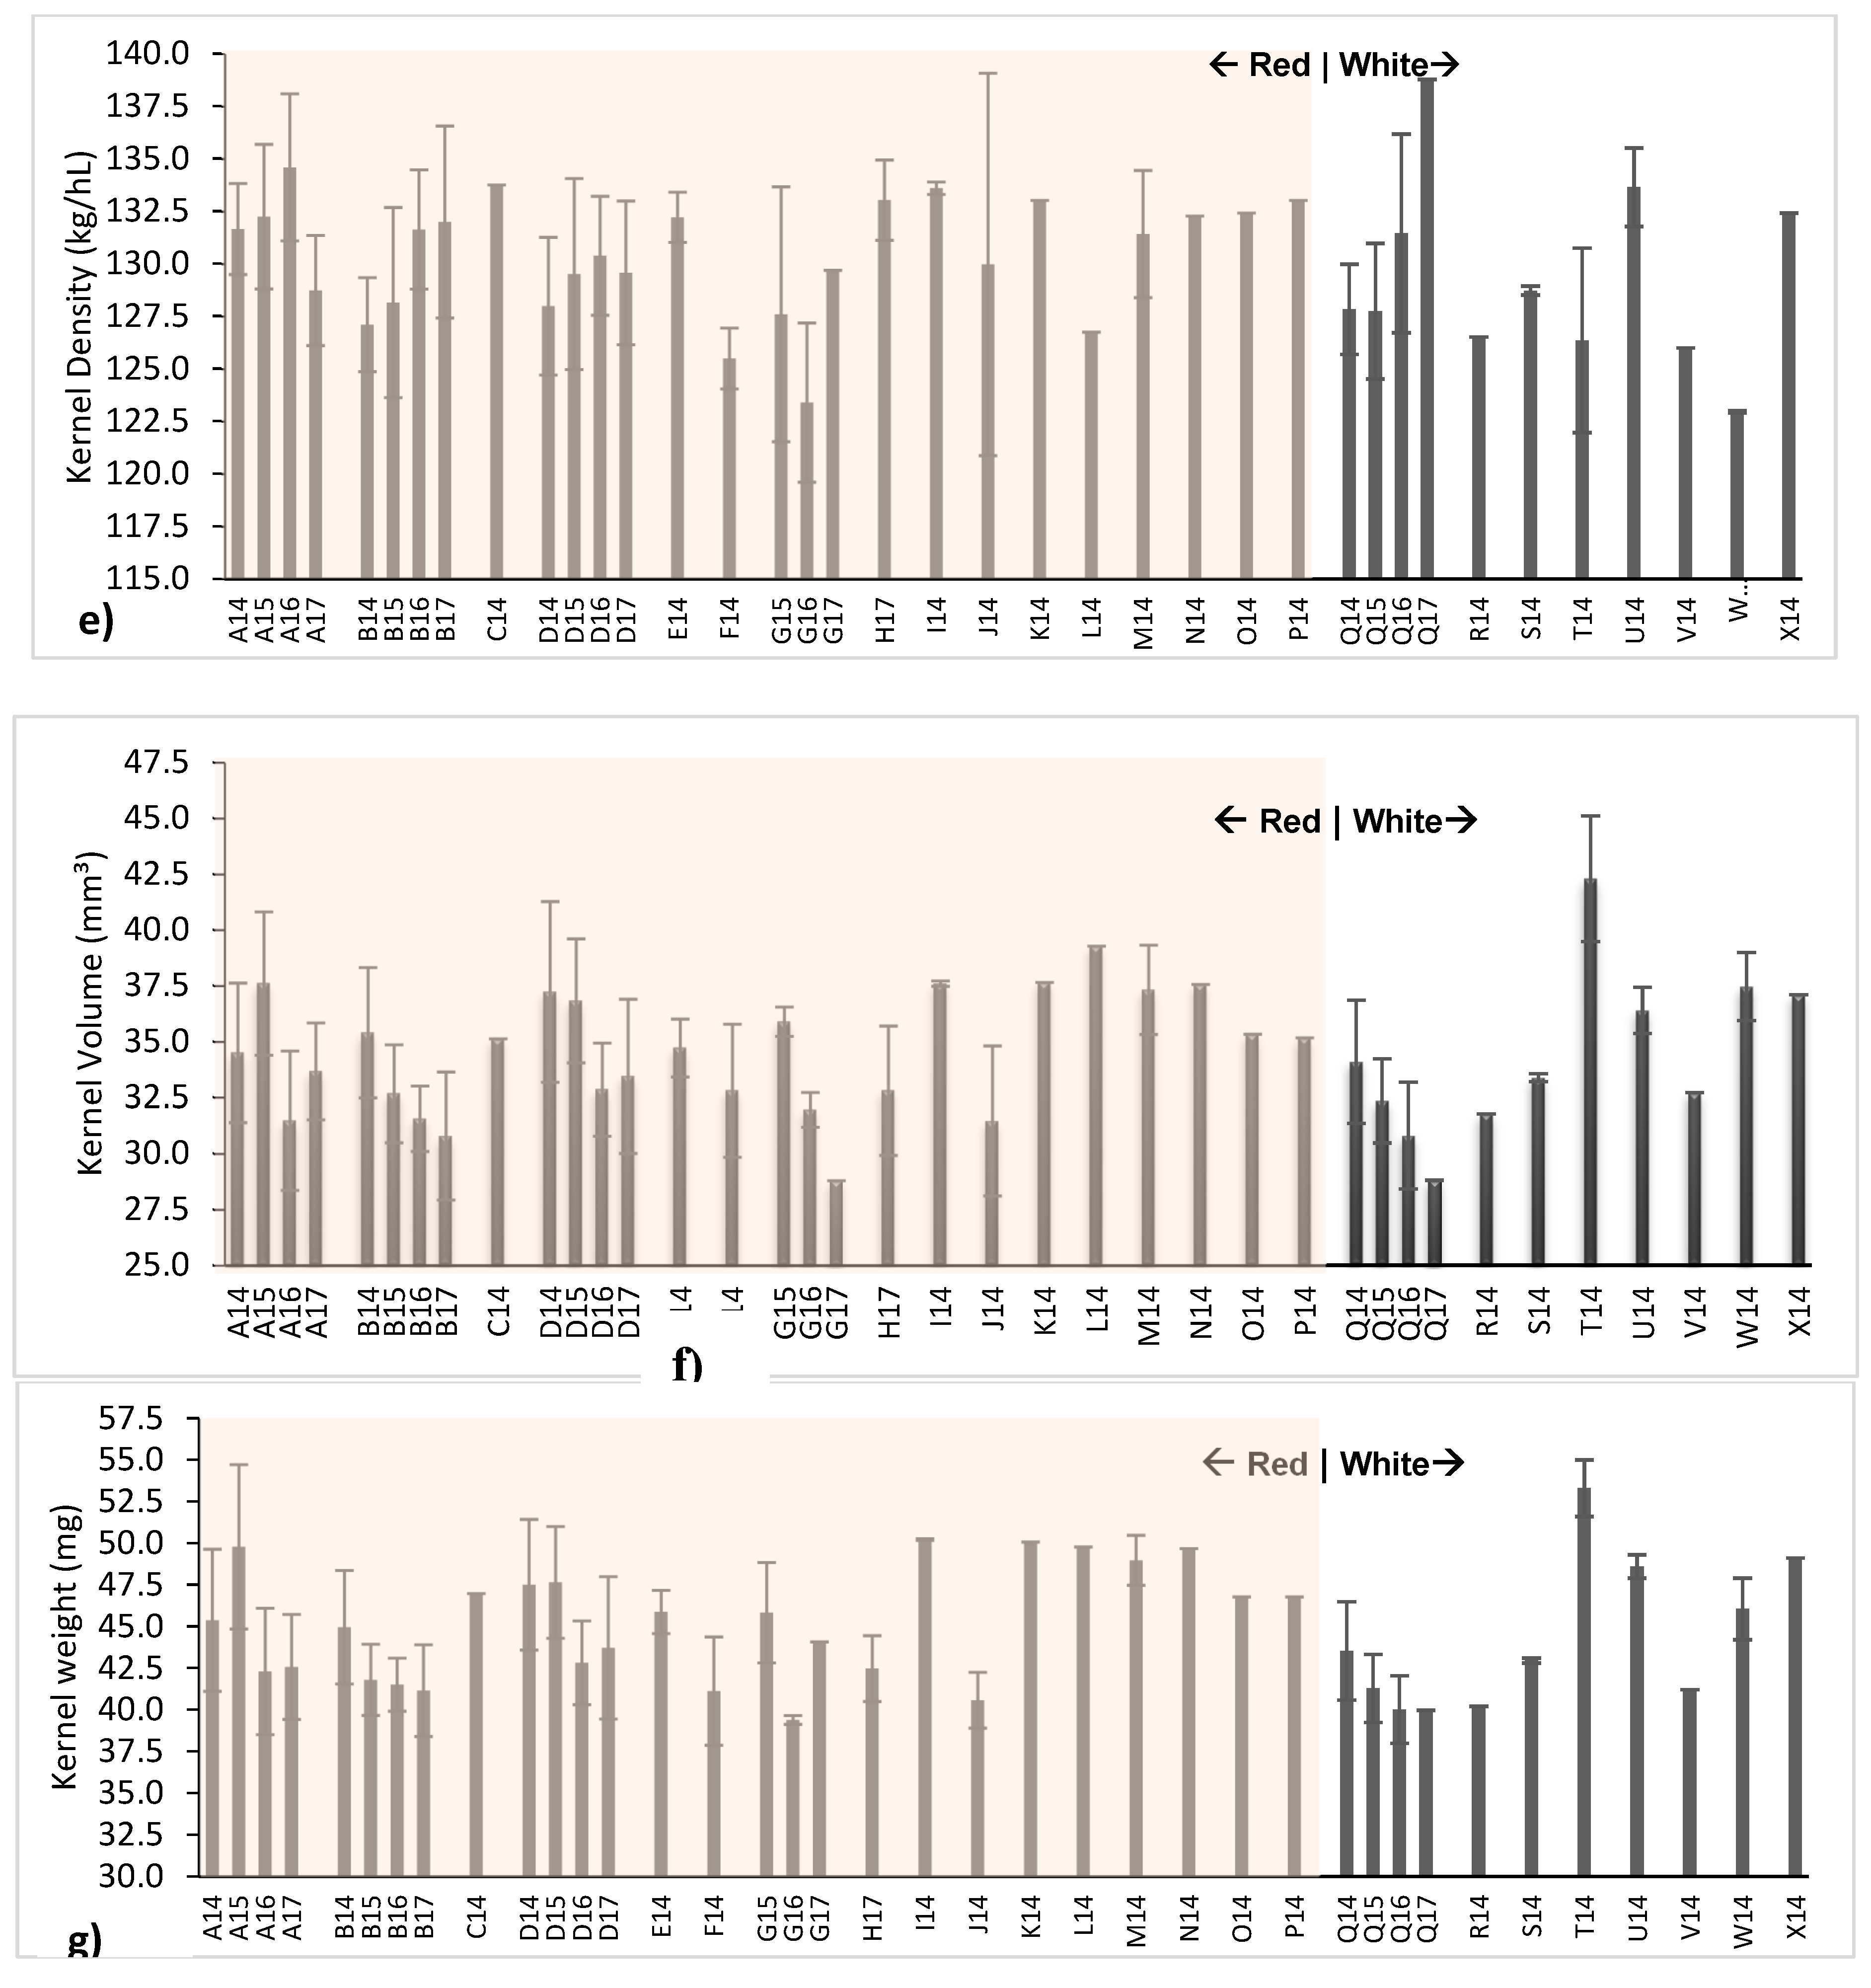
Figure 3.
Correlations between total protein content and a) Zeleny sedimentation volume, b) wet gluten content in 162 wheat samples from 24 cultivars. c) Cultivar-specific correlations between total protein content and Zeleny sedimentation volume and wet gluten content in Bezostaja (A), Esperia (B), Odeska (D), Tosunbey (Q), and all samples A-to-X harvested from 2014 to 2017.
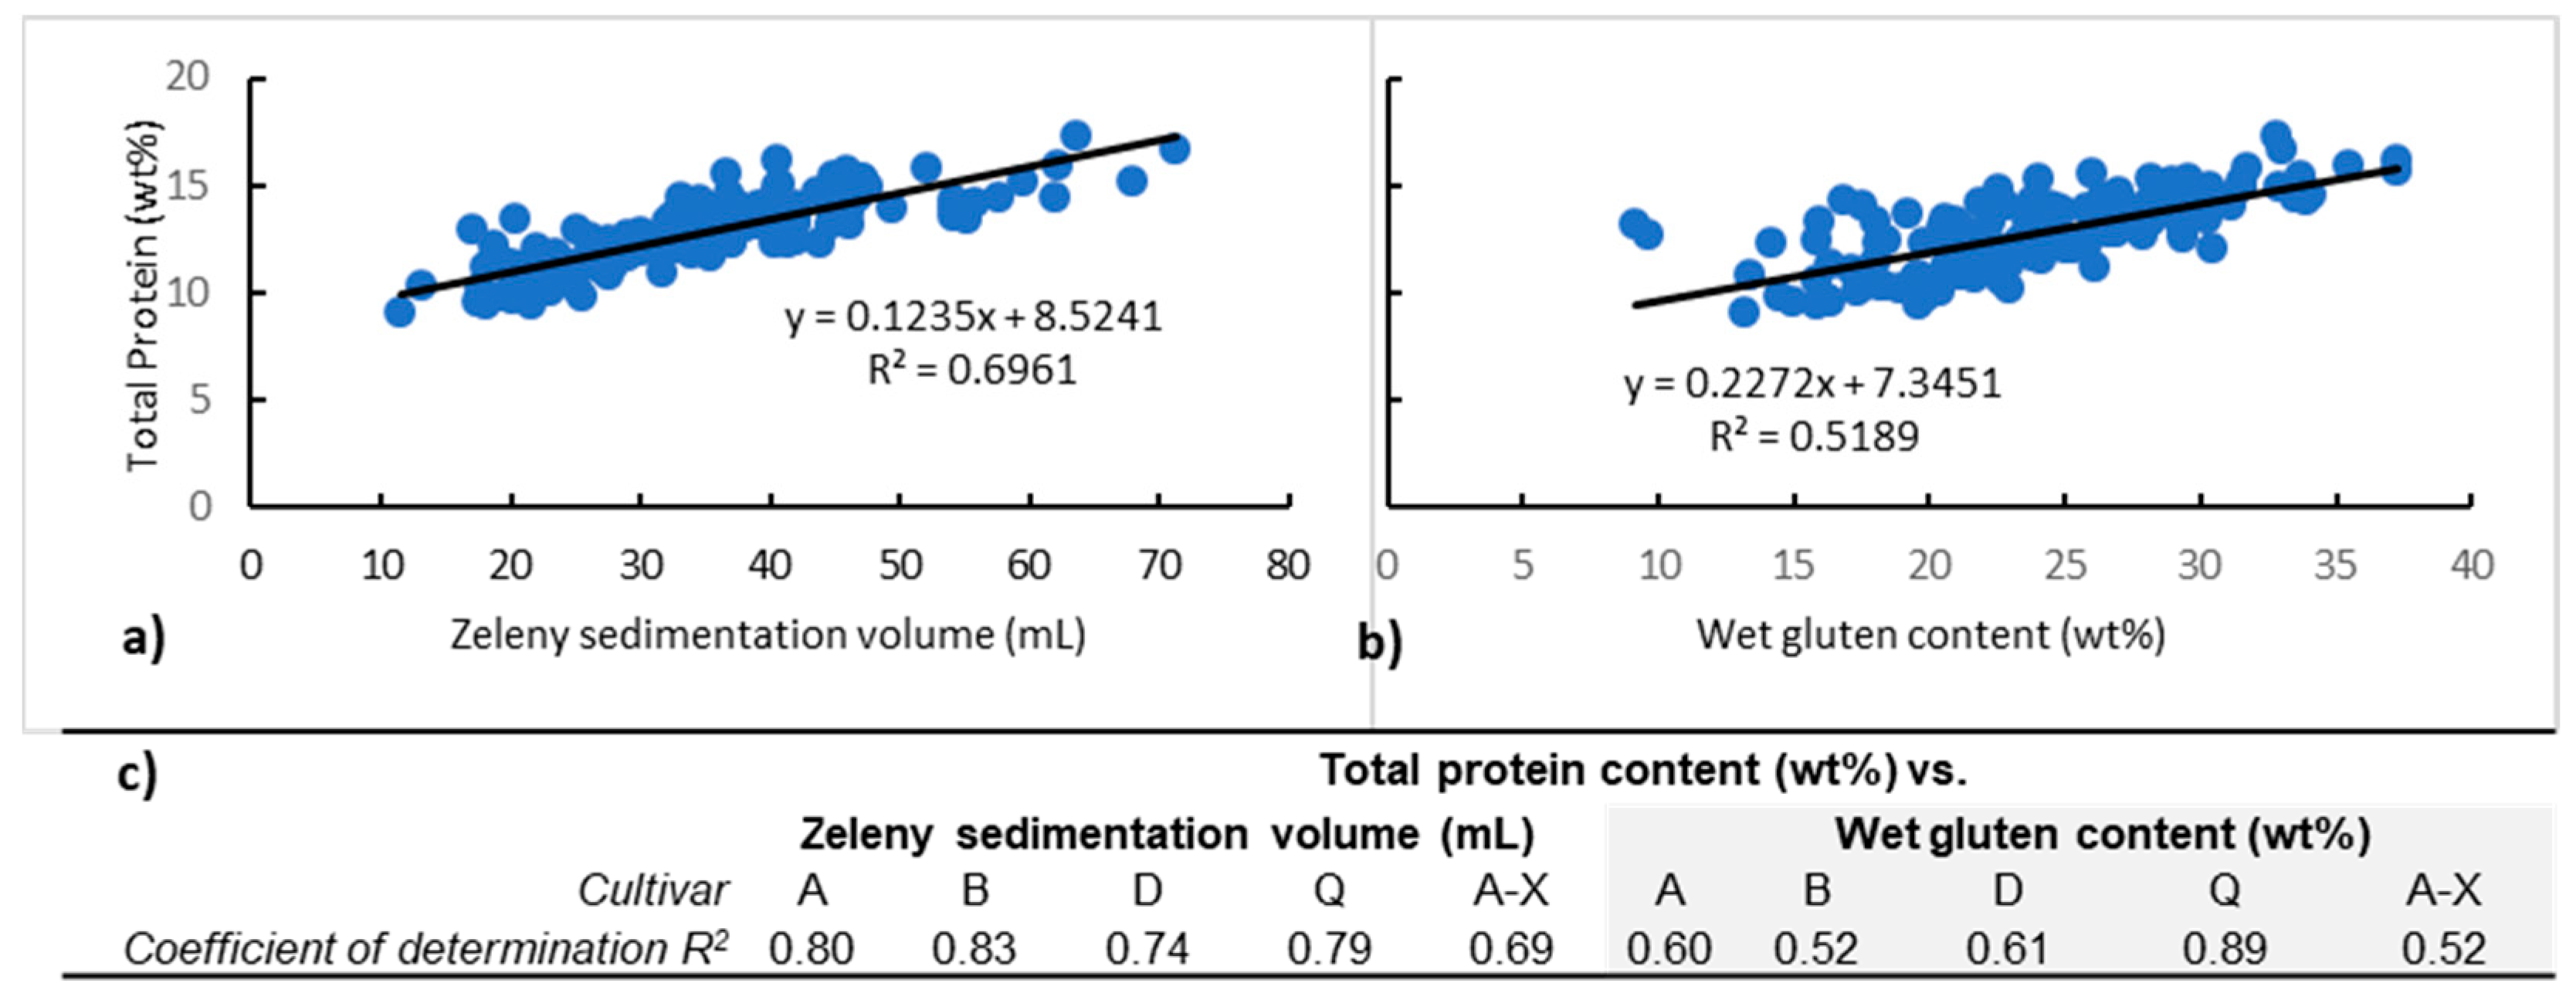
Figure 4.
a) Lightness, b) Red/green values, c) Yellow/blue values of flour with and without bran from bread wheat cultivars Bezostaja (A), Esperia (B), Odeska (D), Selimiye (G), Cömert-2 (H), and Tosunbey (Q) harvested between 2015 and 2017.
Figure 4.
a) Lightness, b) Red/green values, c) Yellow/blue values of flour with and without bran from bread wheat cultivars Bezostaja (A), Esperia (B), Odeska (D), Selimiye (G), Cömert-2 (H), and Tosunbey (Q) harvested between 2015 and 2017.
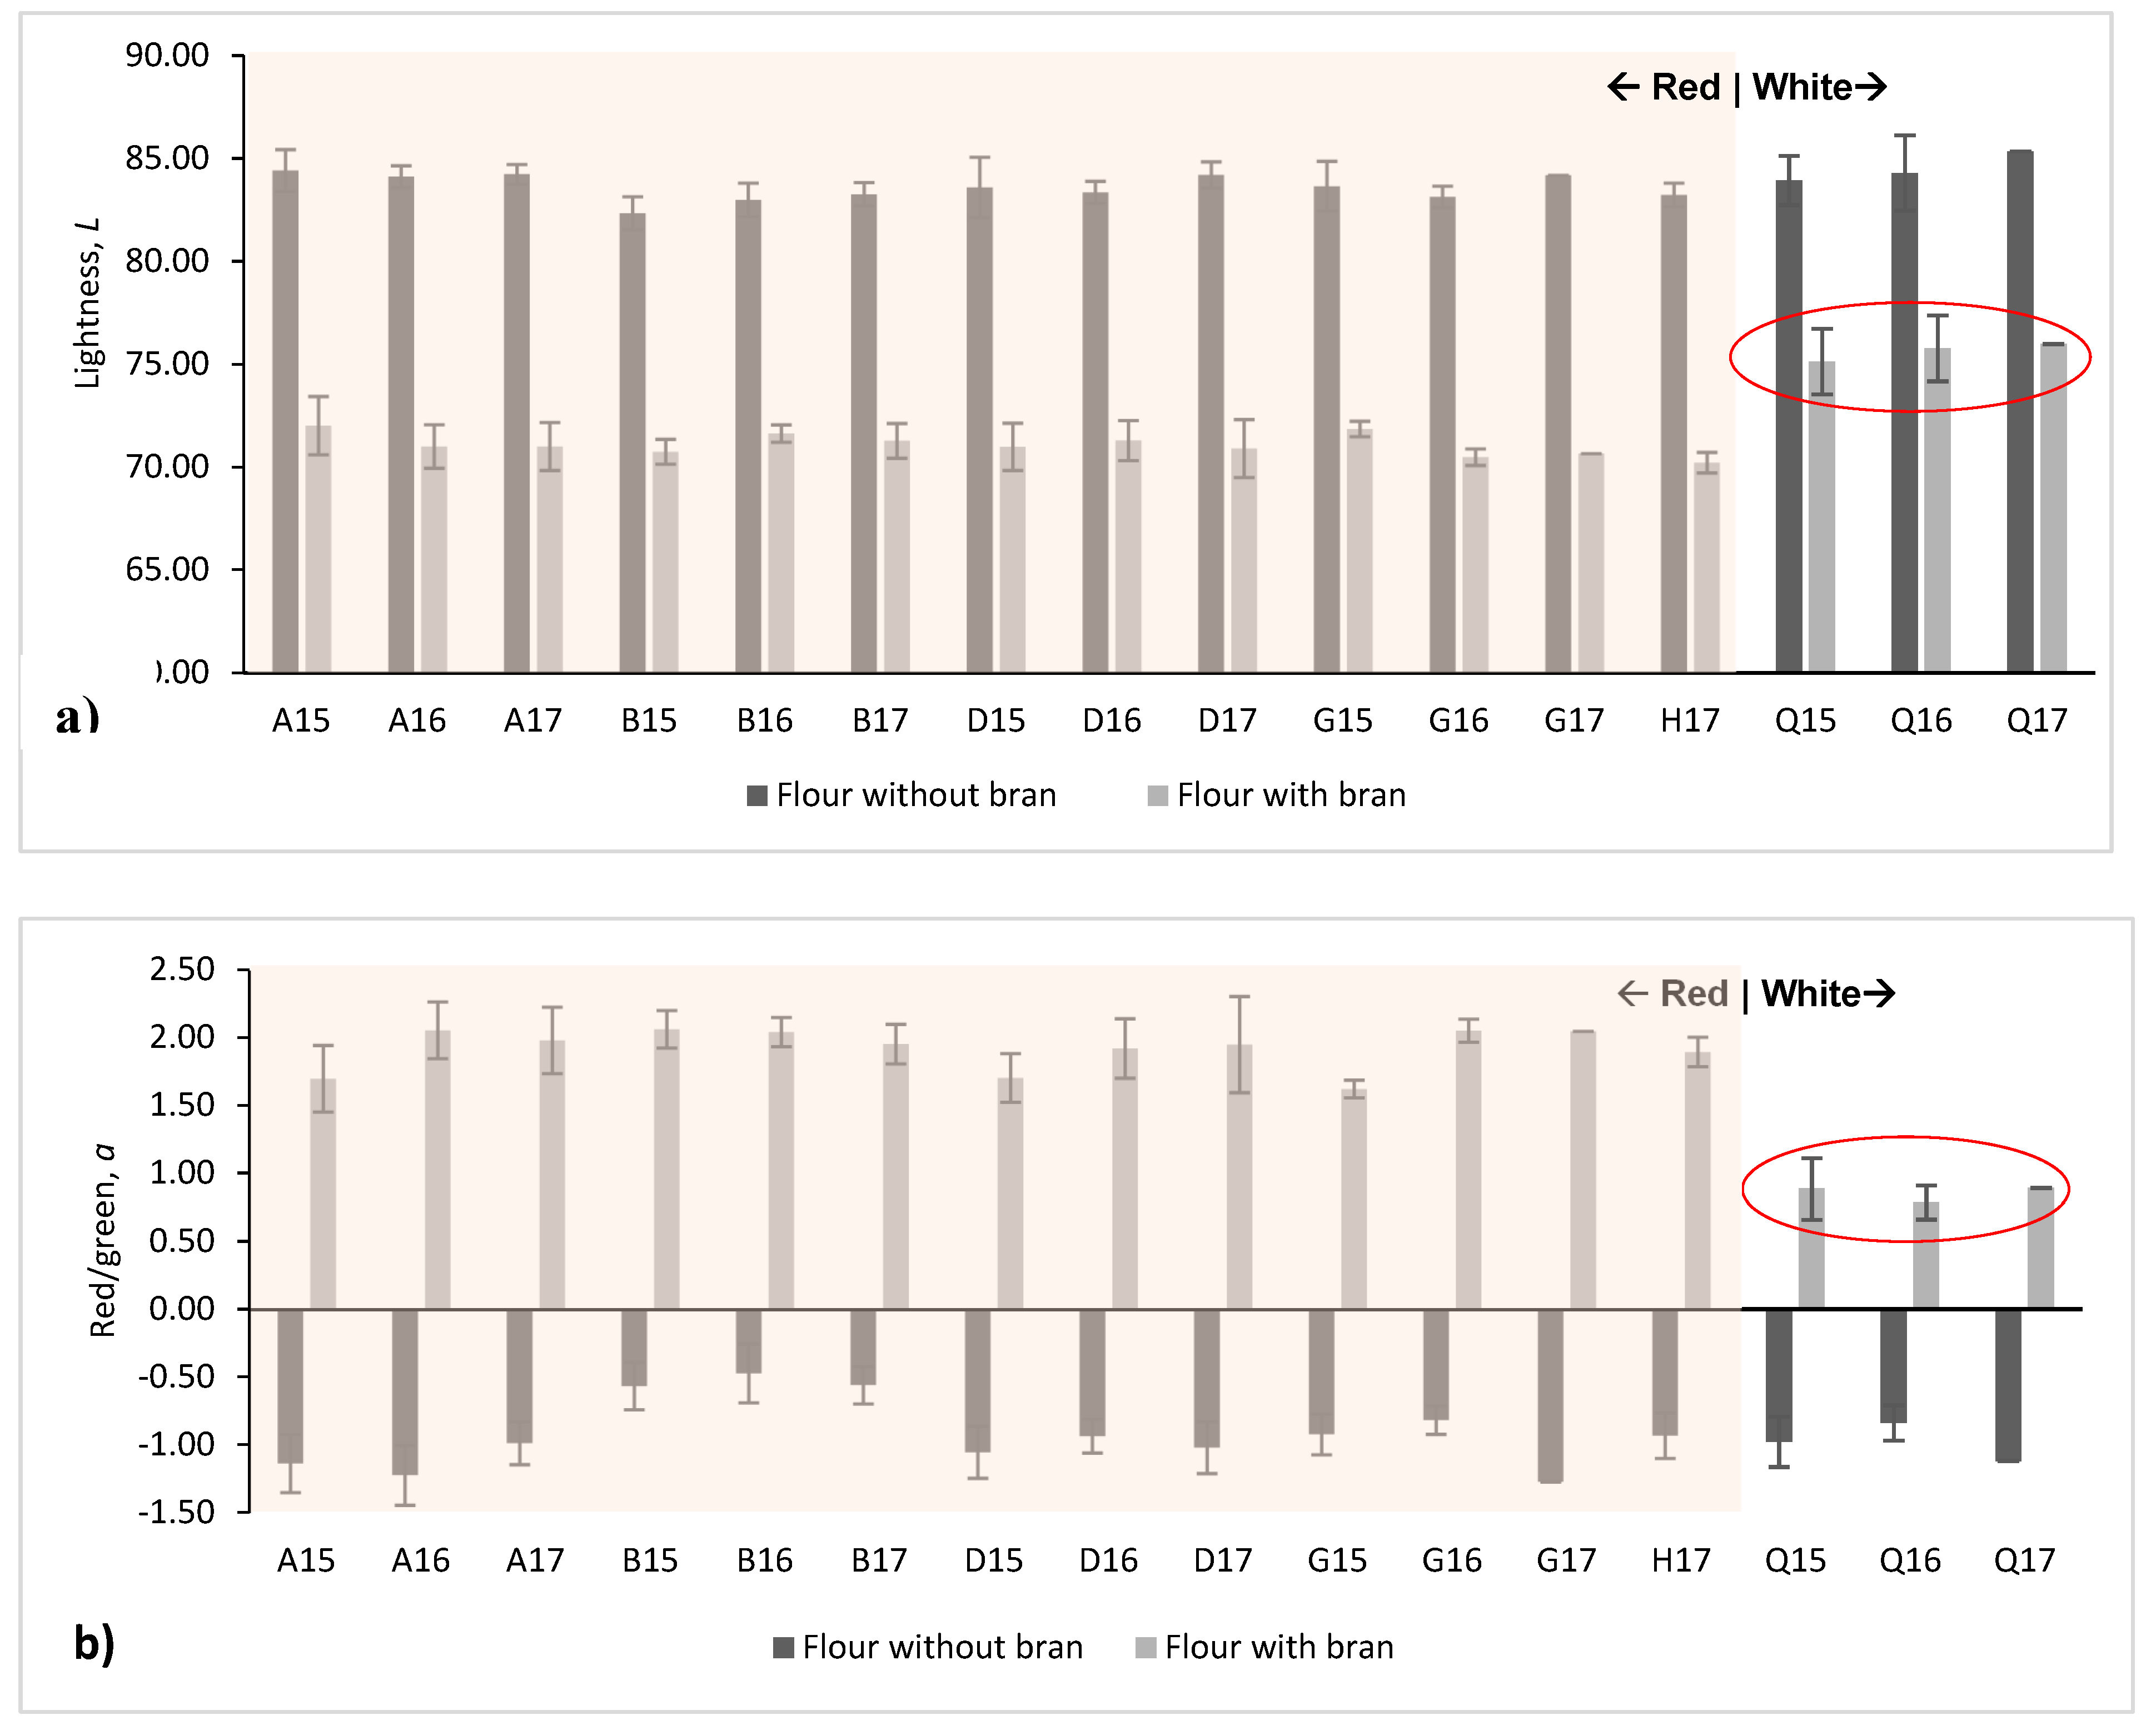
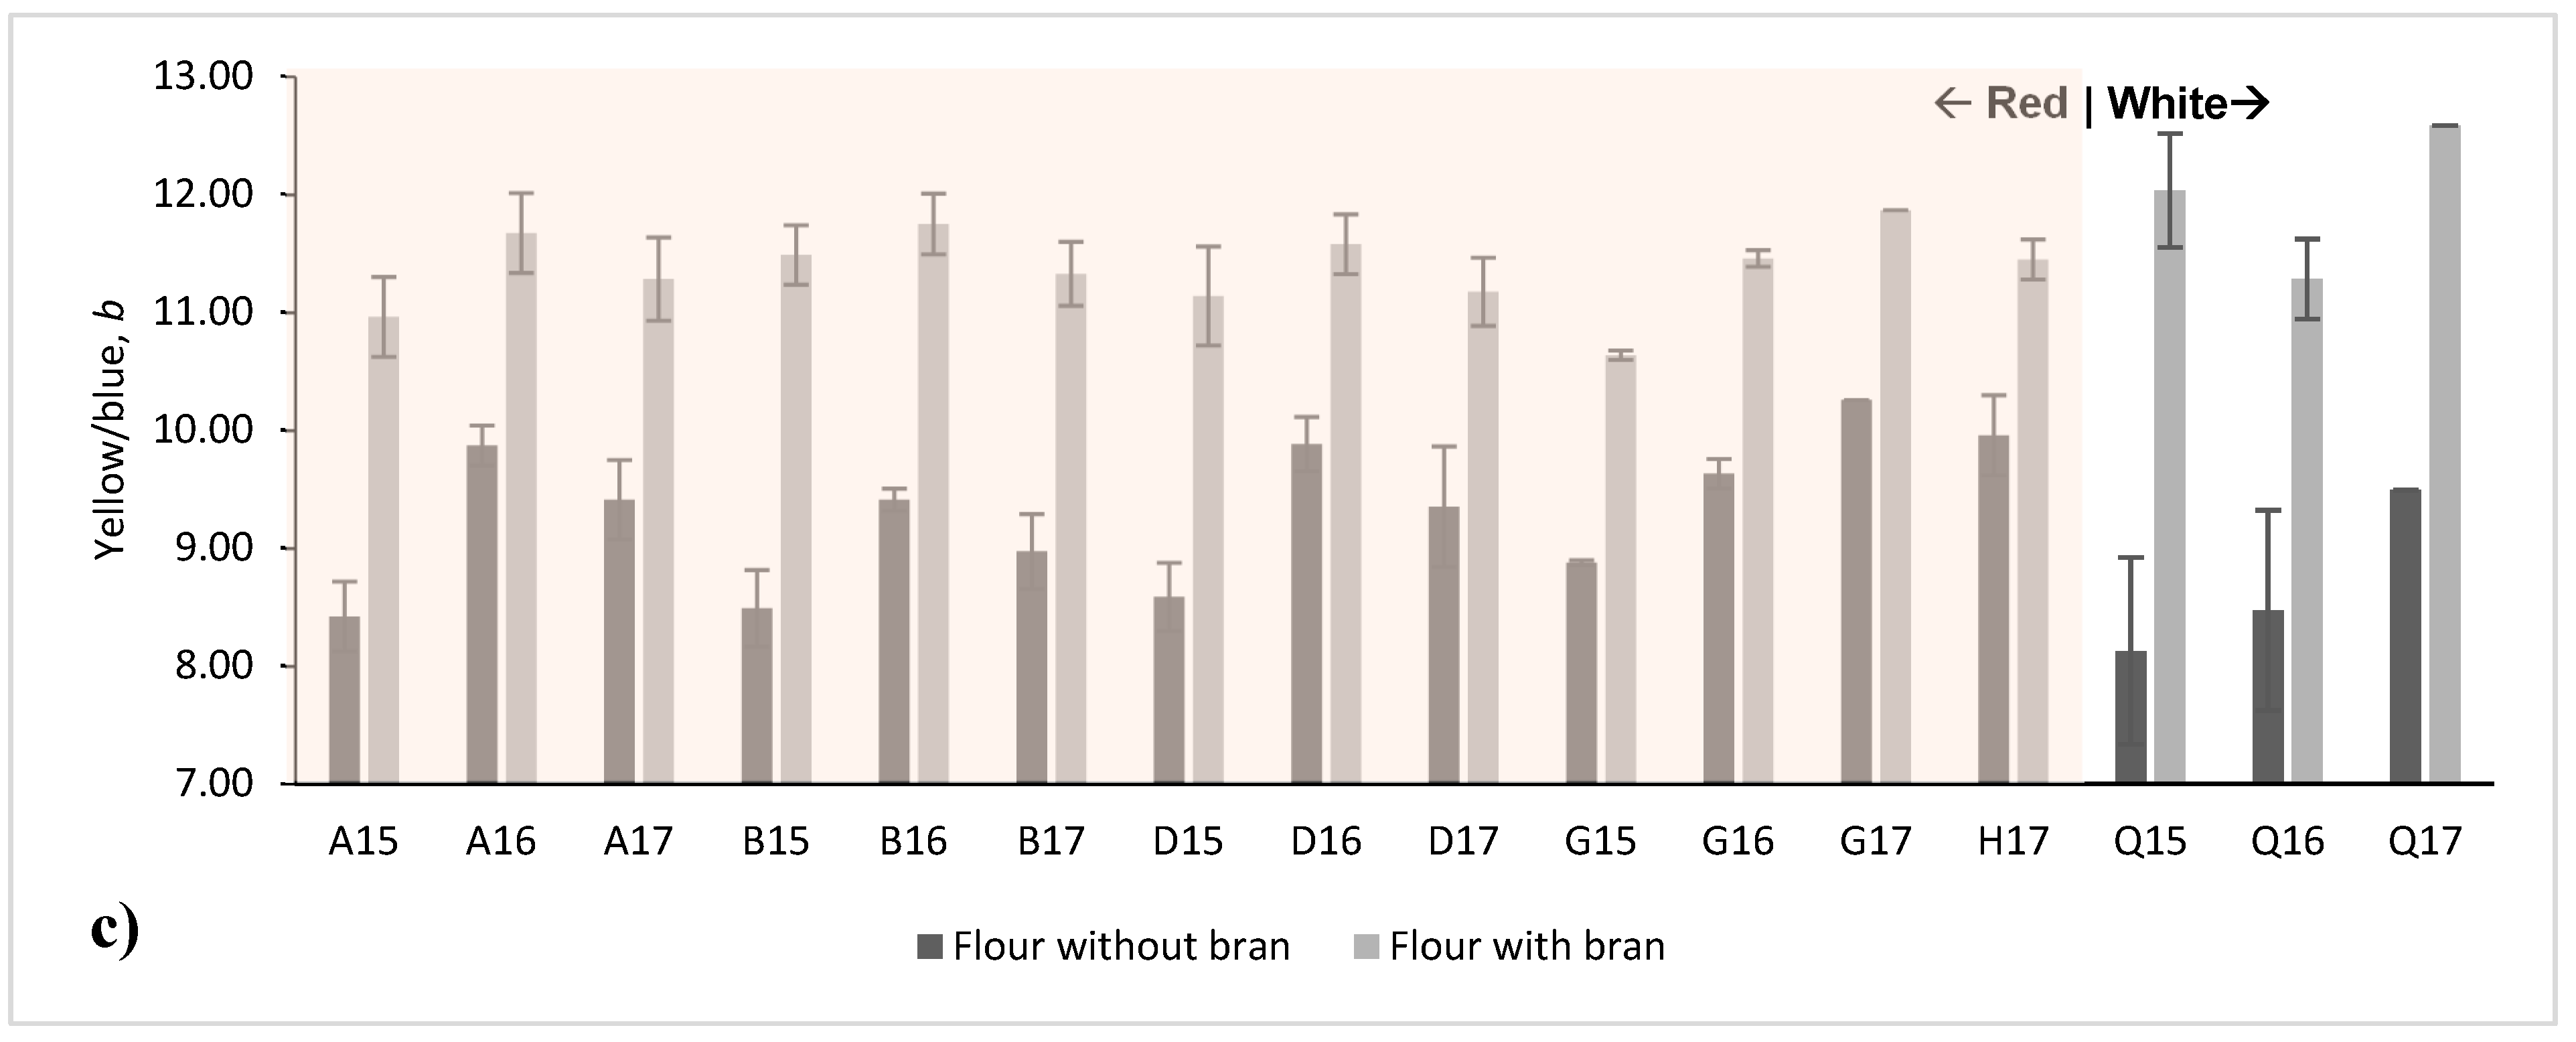
Figure 5.
Climatic conditions including total rainfall and average maximum temperature for location R1, i.e. Ankara region.
Figure 5.
Climatic conditions including total rainfall and average maximum temperature for location R1, i.e. Ankara region.
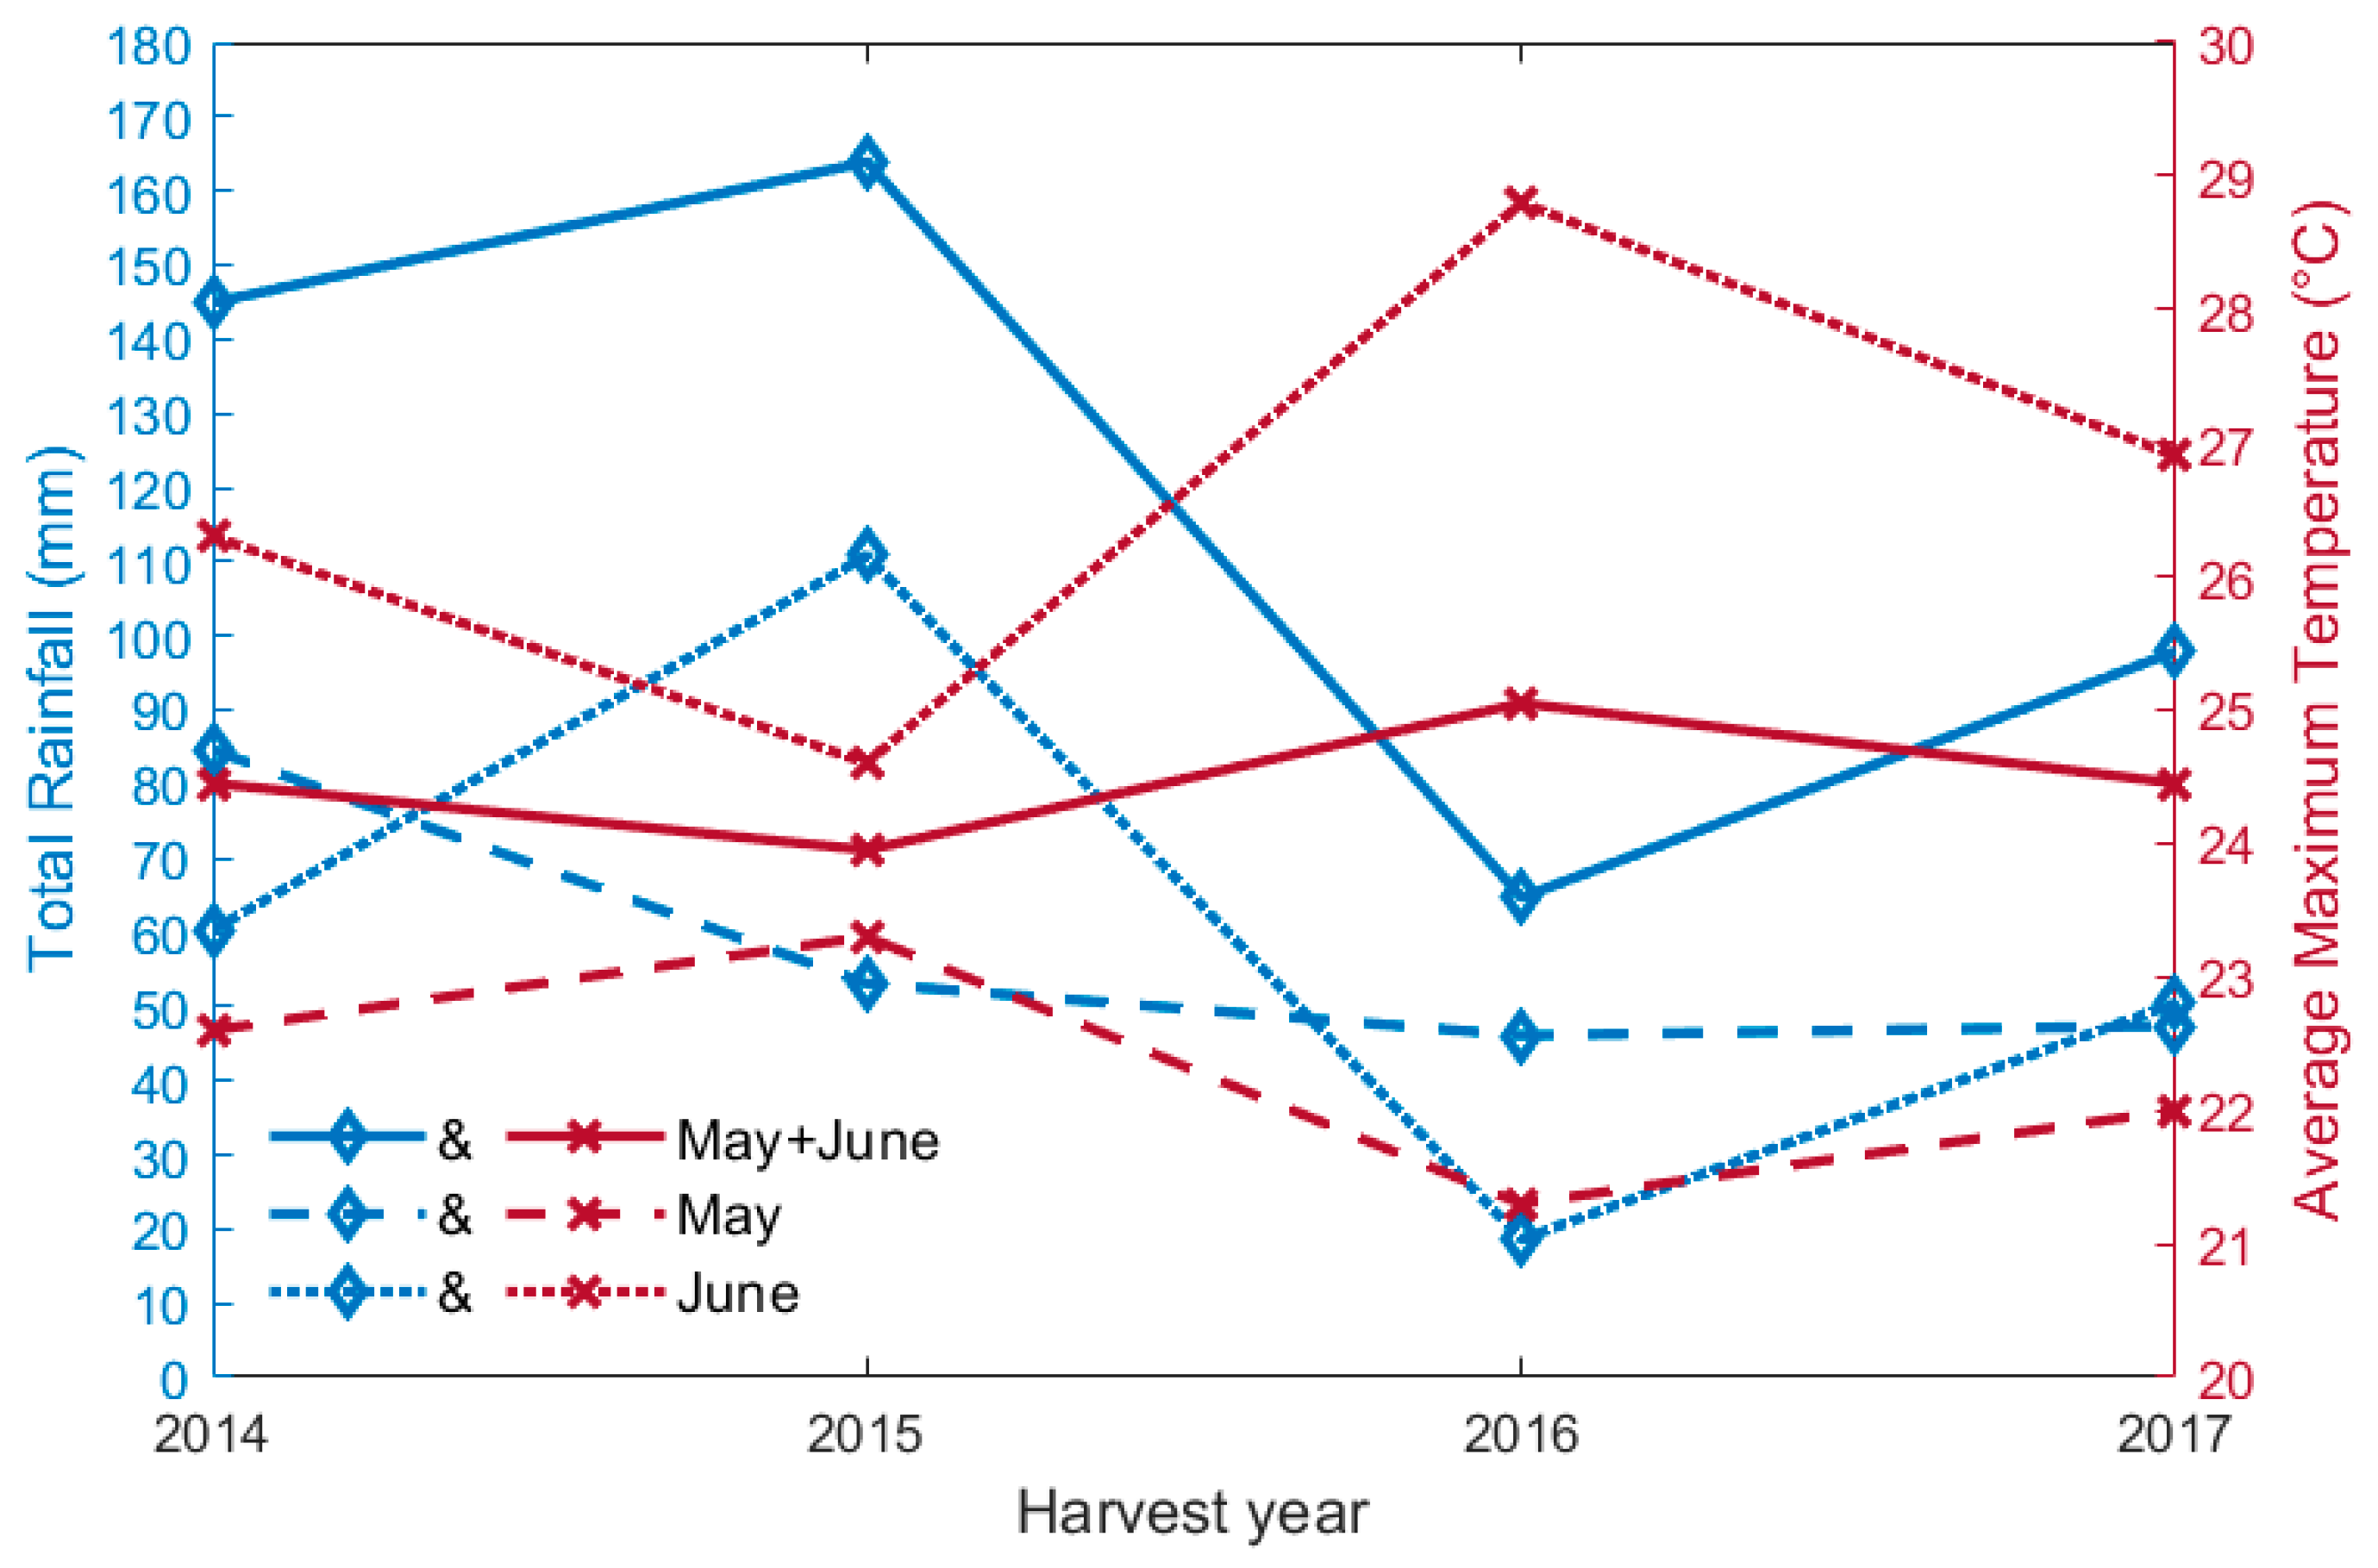
Figure 6.
Comparison of quality parameters of red wheat cultivars Bezostaja (A), Esperia (B), Odeska (D) and white wheat cultivar Tosunbey (Q) from 2014 to 2017: a) Total protein content (wt%), b) Moisture content (wt%), c) Starch and others content (wt%), d) Wet gluten content (wt%), e) Zeleny sedimentation volume (mL), f) Hectoliter weight (kg/hL), g) Kernel density (kg/hL), h) Kernel volume (mm3), and i) Kernel weight (mg).
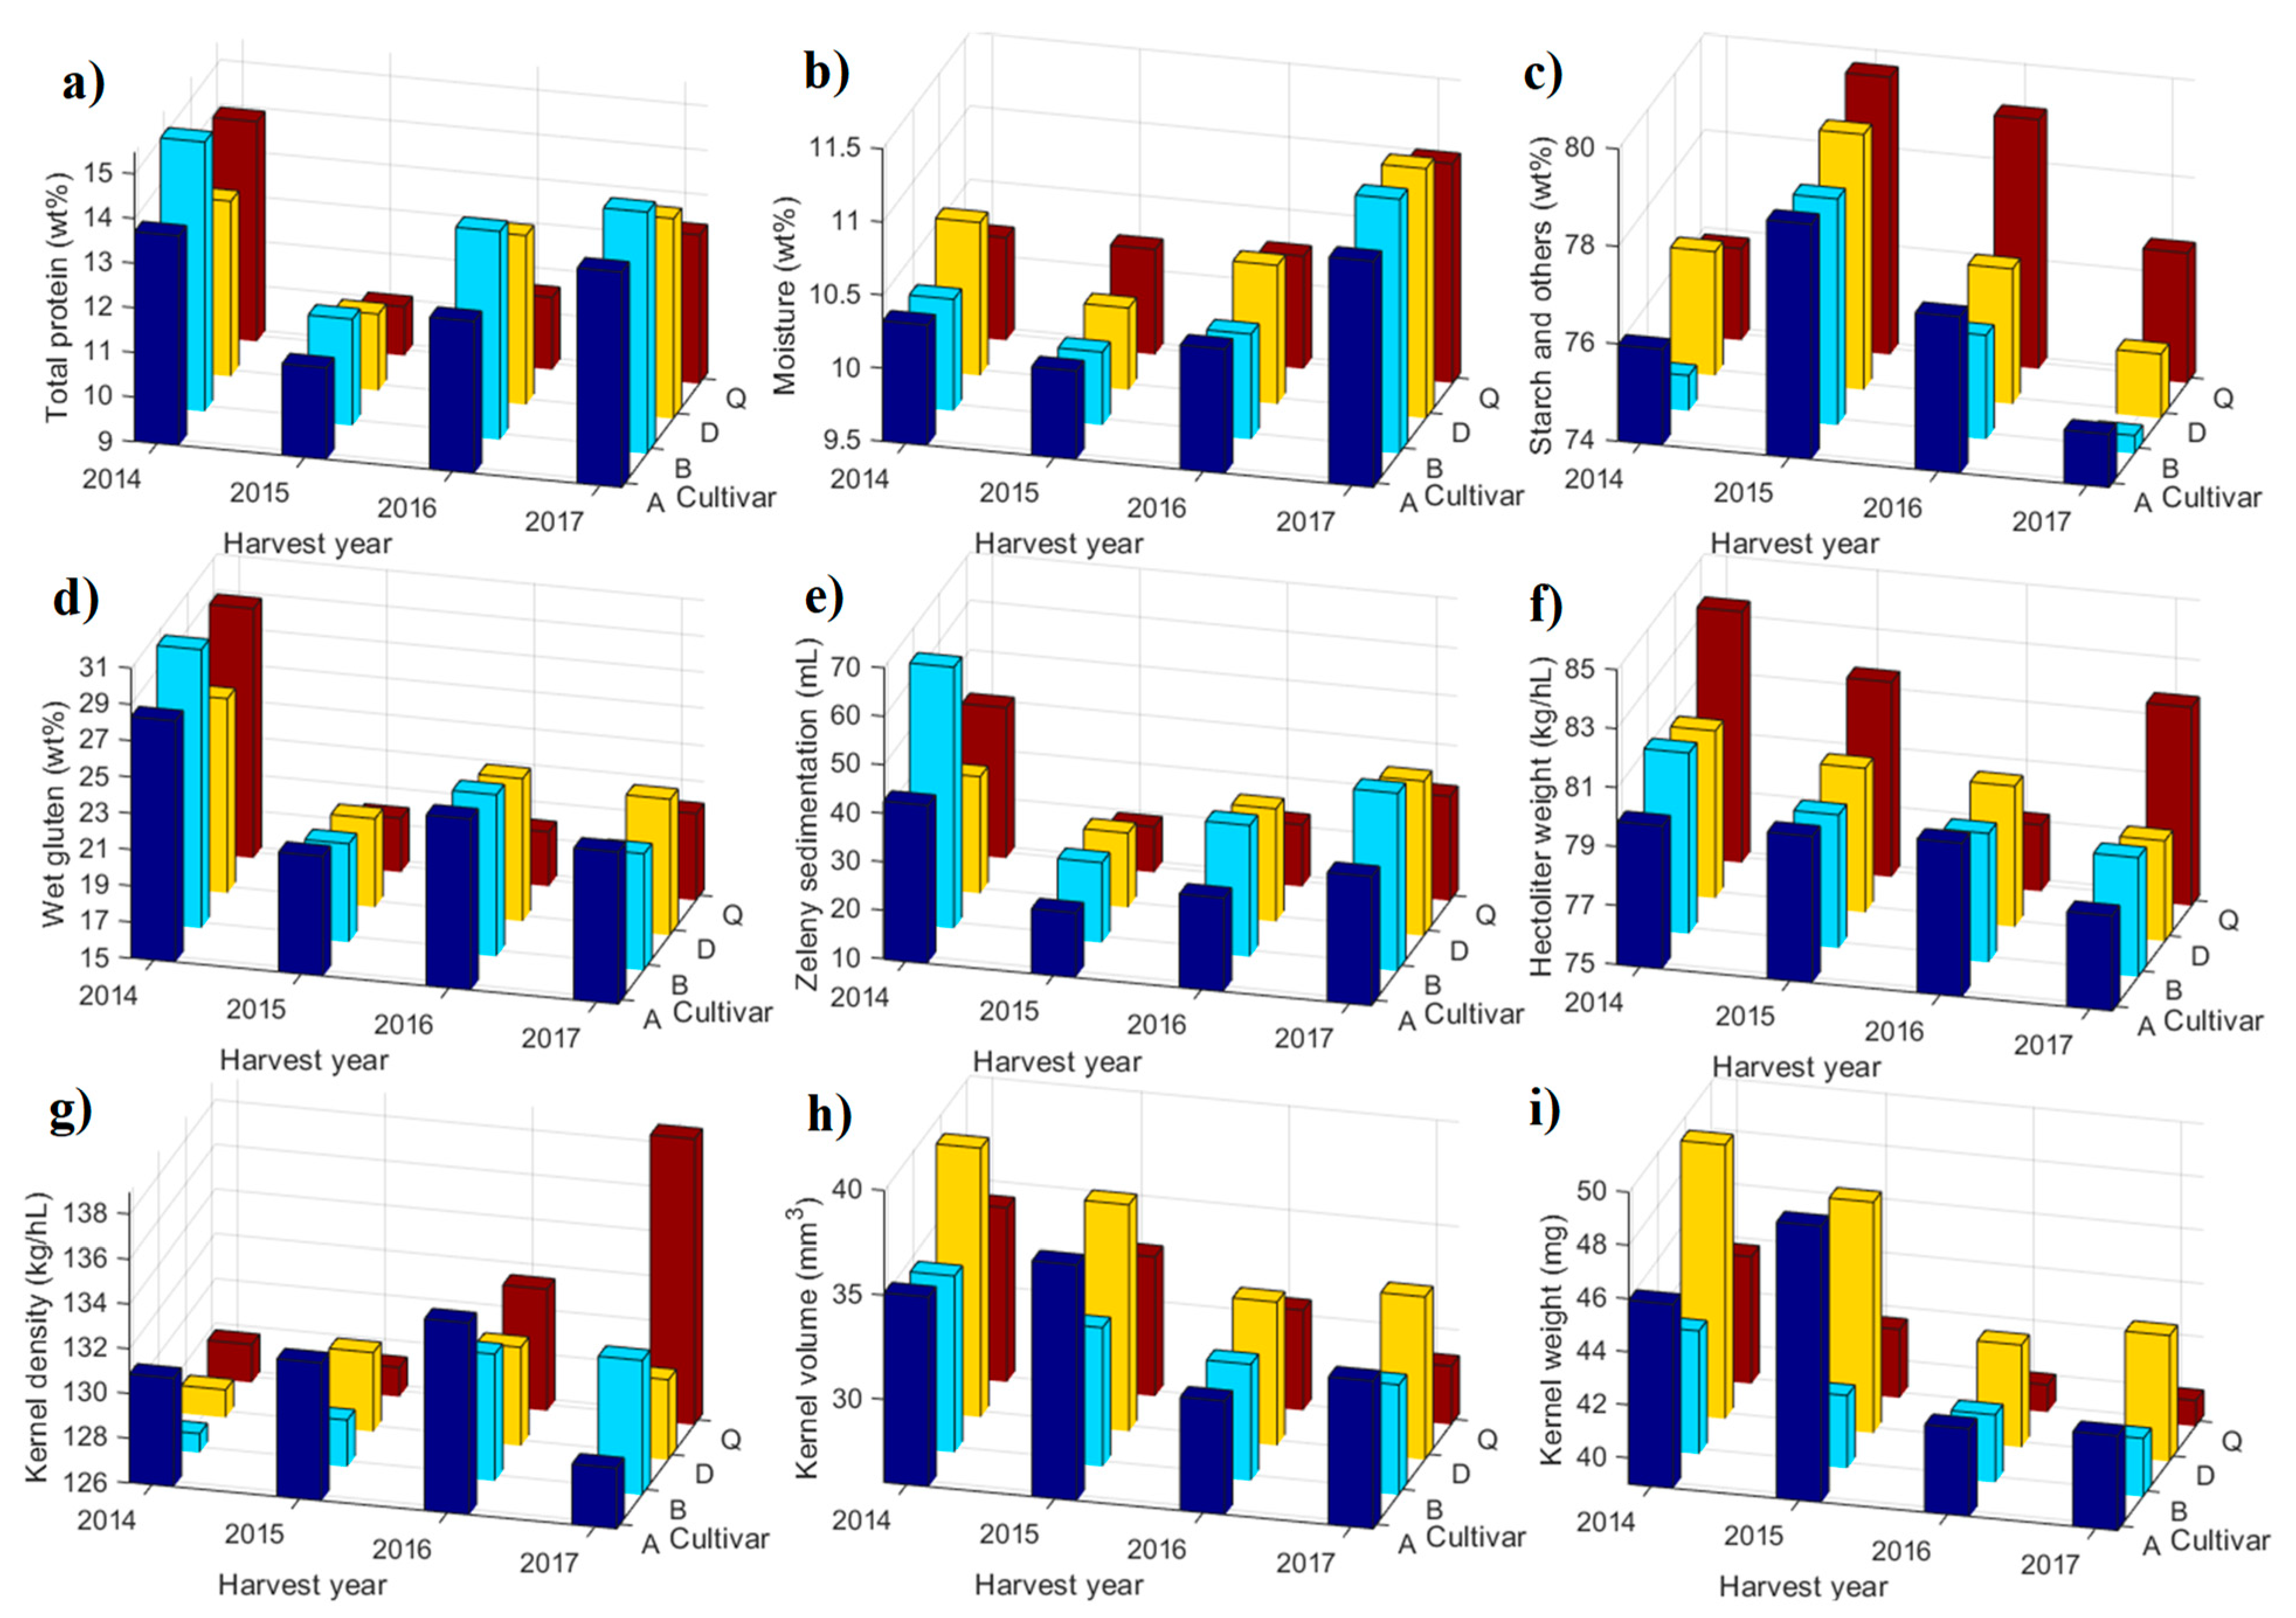

Table 1.
Mean quality parameters and coefficient of variation of 162 samples from 24 bread wheat cultivars between 2014 and 2017.
Table 1.
Mean quality parameters and coefficient of variation of 162 samples from 24 bread wheat cultivars between 2014 and 2017.
| 2014 | CV% | 2015 | CV% | 2016 | CV% | 2017 | CV% | ||
|---|---|---|---|---|---|---|---|---|---|
|
Protein Content (wt%) |
All | 13.38±1.49 | 11.14 | 11.13±1.18 | 10.60 | 12.74±1.28 | 10.05 | 13.74±1.26 | 9.17 |
| Red | 13.49±1.54 | 11.42 | 11.30±1.13 | 10.00 | 12.97±1.15 | 8.87 | 13.78±1.25 | 9.07 | |
| White | 13.15±1.35 | 10.27 | 10.44±1.13 | 10.82 | 10.62±0.72 | 6.78 | 12.33±0.17 | 1.38 | |
|
Moisture Content (wt%) |
All | 10.41±0.33 | 3.17 | 10.06± 0.22 | 2.19 | 10.36±0.25 | 2.41 | 11.17±0.22 | 1.97 |
| Red | 10.41±0.32 | 3.07 | 10.03± 0.22 | 2.19 | 10.36±0.26 | 2.51 | 11.18±0.23 | 2.06 | |
| White | 10.42±0.34 | 3.26 | 10.18± 0.13 | 1.28 | 10.27±0.00 | 0.00 | 11.00±0.00 | 0.00 | |
|
Starch and Others Content (wt%) |
All | 76.21±1.43 | 1.88 | 78.81±1.08 | 1.37 | 76.90±1.25 | 1.63 | 75.09±1.34 | 1.78 |
| Red | 76.11±1.46 | 1.92 | 78.67±1.04 | 1.32 | 76.68±1.10 | 1.43 | 75.04±1.34 | 1.79 | |
| White | 76.43±1.34 | 1.75 | 79.38±1.04 | 1.31 | 79.12±0.72 | 0.91 | 76.67±0.00 | 0.00 | |
| Wet Gluten (wt%) | All | 27.79±4.28 | 15.40 | 20.97±3.81 | 18.17 | 23.16±3.55 | 15.33 | 21.77±5.67 | 26.05 |
| Red | 28.12±4.59 | 16.32 | 21.44±3.64 | 16.98 | 23.67±3.36 | 14.20 | 21.83±5.74 | 26.29 | |
| White | 27.08±3.39 | 12.52 | 19.05±3.88 | 20.37 | 18.00±1.67 | 9.28 | 19.78±0.22 | 1.11 | |
| ZelenySedimentation volume (ml) | All | 38.60±12.74 | 33.01 | 24.63±5.08 | 20.63 | 32.39±6.62 | 20.44 | 40.74±8.51 | 20.89 |
| Red | 41.00±11.85 | 28.90 | 25.59±4.63 | 18.09 | 33.60±5.90 | 17.56 | 41.00±8.48 | 20.68 | |
| White | 33.39±13.04 | 39.05 | 20.69±4.91 | 23.73 | 22.75±2.75 | 12.09 | 31.50±0.50 | 1.59 | |
|
Hectoliter Weight (kg/hL) |
All | 80.41±2.14 | 2.66 | 80.28±1.72 | 2.14 | 79.32±1.53 | 1.92 | 78.66±1.57 | 1.99 |
| Red | 80.11±1.72 | 2.15 | 79.94±1.54 | 1.92 | 79.47±1.47 | 1.85 | 78.58±1.50 | 1.91 | |
| White | 81.06±2.73 | 3.37 | 81.70±1.70 | 2.08 | 77.25±0.05 | 0.06 | 81.73±0.05 | 0.06 | |
|
Kernel Density (102·mg/mm3 or kg/hL) |
All | 129.64±4.33 | 3.34 | 129.42±4.40 | 3.40 | 130.99±4.12 | 3.15 | 130.79±3.96 | 3.02 |
| Red | 130.42±4.44 | 3.40 | 129.83±4.54 | 3.50 | 130.96±4.13 | 3.16 | 130.56±3.77 | 2.89 | |
| White | 127.94±3.53 | 2.76 | 127.73±3.23 | 2.53 | 131.44±4.73 | 3.60 | 138.77±0.01 | 0.01 | |
|
Kernel Volume (mm3) |
All | 35.17±3.42 | 9.73 | 34.72±3.44 | 9.92 | 32.13±2.27 | 7.07 | 32.54±3.12 | 9.42 |
| Red | 35.01±3.36 | 9.60 | 35.30±3.49 | 9.89 | 32.23±2.23 | 6.91 | 32.64±3.10 | 9.32 | |
| White | 35.51±3.53 | 9.93 | 32.34±1.87 | 5.77 | 30.80±2.38 | 7.73 | 28.80±3.10 | 10.76 | |
|
Kernel Weight (mg) |
All | 45.53±4.05 | 8.89 | 44.96±5.01 | 11.15 | 42.02±2.74 | 6.52 | 42.48±3.37 | 7.94 |
| Red | 45.59±3.98 | 8.73 | 45.86±5.11 | 11.14 | 42.18±2.73 | 6.47 | 42.55±3.39 | 7.97 | |
| White | 45.39±4.19 | 9.23 | 43.94±2.05 | 4.66 | 40.02±2.02 | 5.05 | 39.97±4.63 | 11.59 |
Table 2.
Physical properties of 162 samples from 24 wheat cultivars between 2014 and 2017.
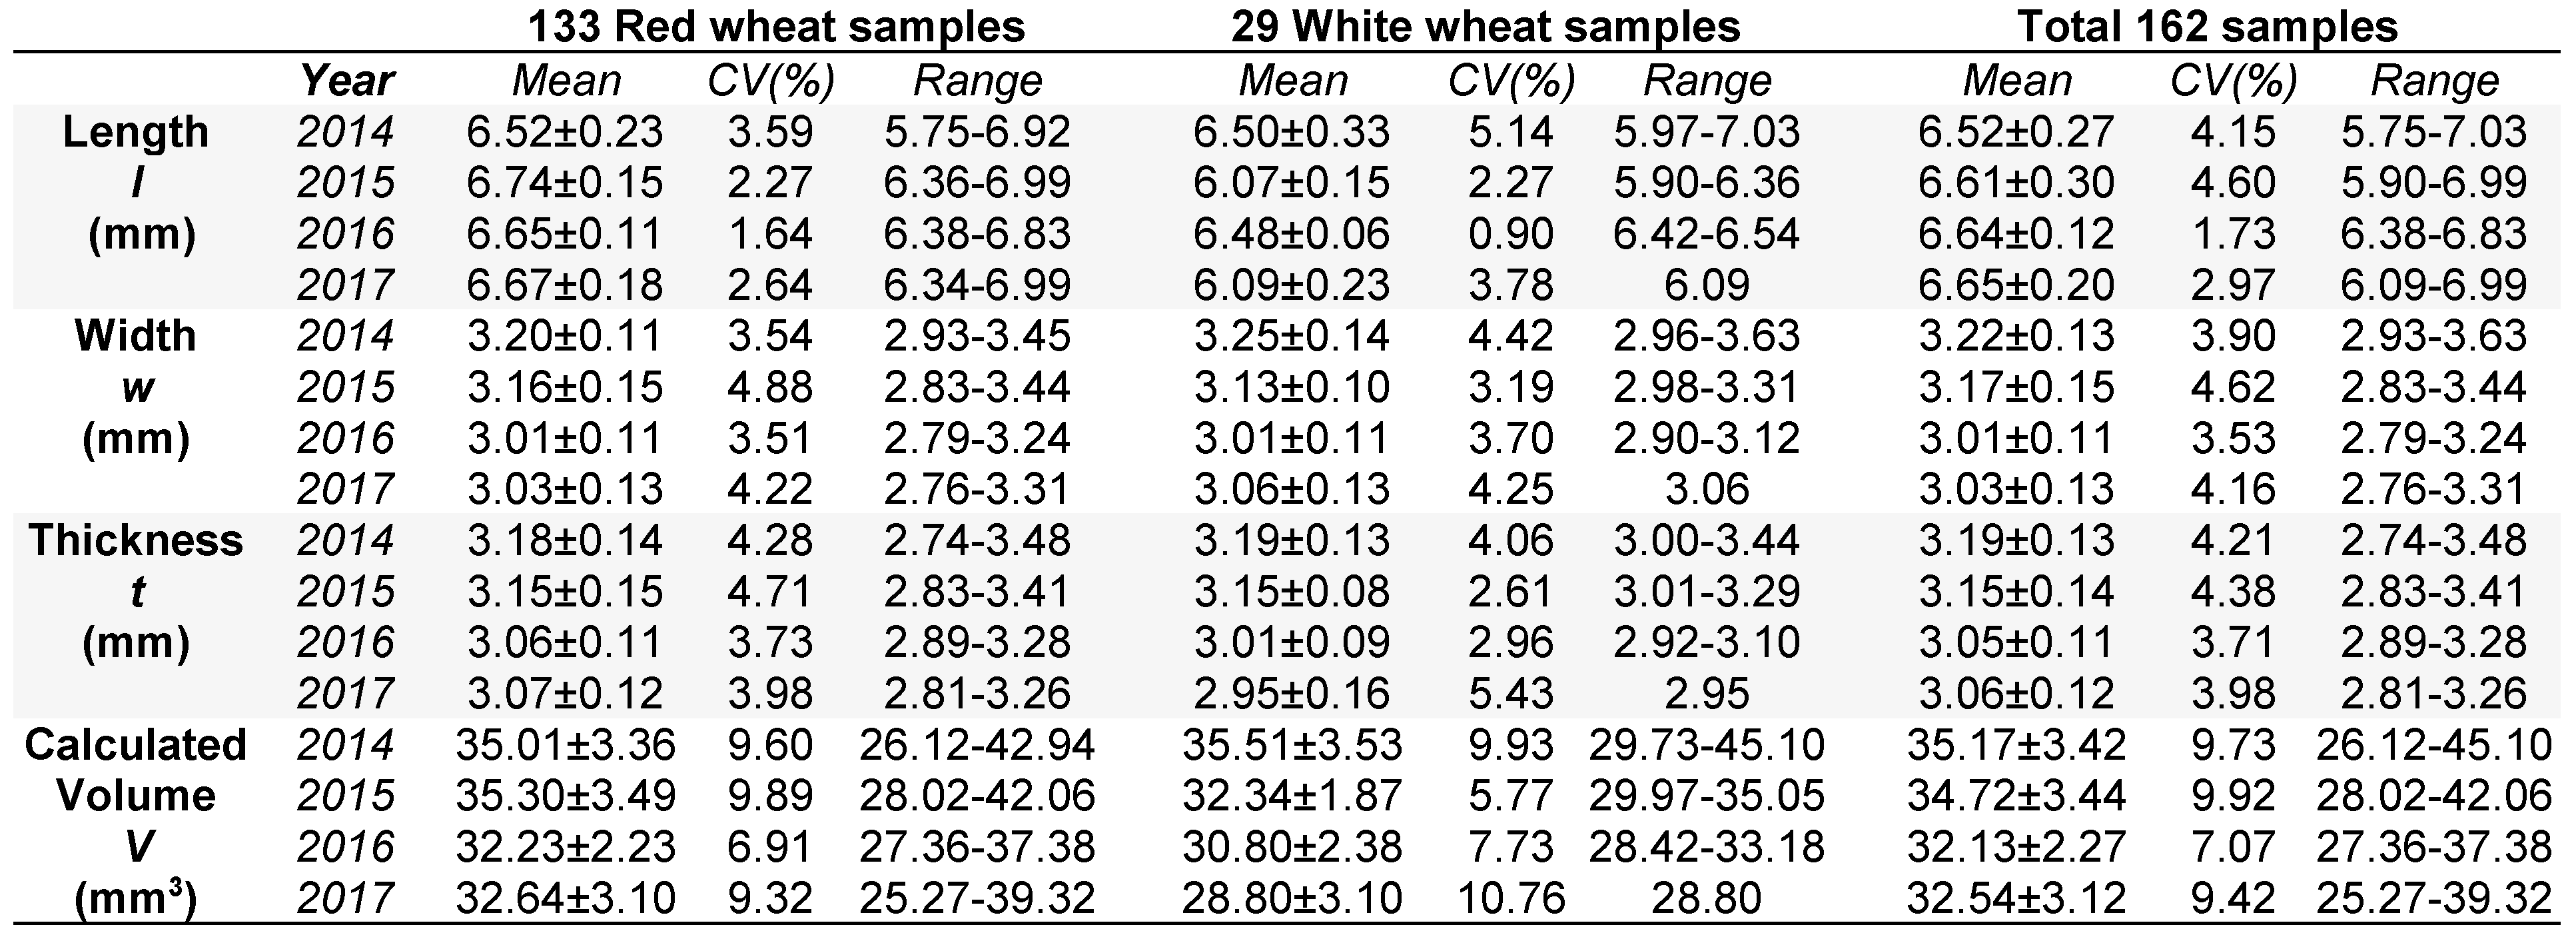 |
Table 3.
Hunter color analysis of 105 products from 6 bread wheat cultivars between 2015 and 2017.
 |
Disclaimer/Publisher’s Note: The statements, opinions and data contained in all publications are solely those of the individual author(s) and contributor(s) and not of MDPI and/or the editor(s). MDPI and/or the editor(s) disclaim responsibility for any injury to people or property resulting from any ideas, methods, instructions or products referred to in the content. |
© 2024 by the authors. Licensee MDPI, Basel, Switzerland. This article is an open access article distributed under the terms and conditions of the Creative Commons Attribution (CC BY) license (http://creativecommons.org/licenses/by/4.0/).
Copyright: This open access article is published under a Creative Commons CC BY 4.0 license, which permit the free download, distribution, and reuse, provided that the author and preprint are cited in any reuse.


