
Submitted:
23 July 2025
Posted:
25 July 2025
You are already at the latest version
Abstract
Objectives: Low- and middle-income countries are challenged by high rates of food and nutrition insecurity. Suboptimal production, distribution, availability, and affordability of nutritious foods, especially at the local level, disproportionately affect nutritionally vulnerable groups. We identified nutrient deficiencies among women, young children, and adolescents as part of the NutriShed project implemented in Ghana. Design: Using a survey design, dietary behavior was assessed by administering an interactive multi-pass 24-hour recall tool. Setting: This study was conducted in Asesewa and Takoradi, in GhanaParticipants: Survey participants were adult women (18 years and older), young children (2–5 years) and adolescents (12–18 years) living in the two communities. Main outcome measures: Data from 581 participants, comprising 187 women, 197 children, and 197 adolescents were analyzed. Estimated Average Requirements (EAR) were determined for each nutrient using data on the type and quantity of food consumed during the 24-hour period preceding the recall. The median EAR was compared to reference EAR for each nutrient. Limiting nutrients were identified based on age-sex specific cut-off reference EAR values.Results: Calcium, folic acid, and riboflavin were identified as key limiting micronutrients in the diets of women, children, and adolescents in both Asesewa and Takoradi. However, inadequacy for the three limiting nutrients was more prevalent in Asesewa than in Takoradi.Conclusions: The findings highlight the need for targeted strategies that address suboptimal diets in urban communities in Ghana. Particularly, strategies are needed to address nutrient inadequacy among women and adolescents, in Asesewa, who may be at greater risk.
Keywords:
dietary assessment
; 24-hour recall
; nutrients
; children
; adolescents
; Asesewa
; Takoradi
; Ghana
Introduction
Optimal nutrition is critical for physical growth, cognitive development, health and overall health [1]. Sub-optimal nutrition results in malnutrition and contributes to a wide range of health problems including stunting, wasting, anemia, increased susceptibility to infections, and higher rates of morbidity and mortality [2,3,4]. Additionally, malnutrition has long term adverse effects on cognitive, physical, and economic development and contributes to a multigenerational cycle of poverty and poor health[5]. Sub-optimal diet is a recognized driver of malnutrition, including micronutrient deficiency among nutritionally vulnerable populations such as women, children and adolescents. Globally, several studies have found micronutrient deficiencies among nutritionally vulnerable groups. A recent study by Stevens et al., [6] estimated that over half of preschool-aged children and two-thirds of non-pregnant women of reproductive age worldwide have micronutrient deficiencies. Another study in Bangladesh found that one third of pre-school children and nearly half of pregnant and lactating mothers were anemic [7]. The same study found that a high proportion of non-pregnant and non-lactating women were deficient in zinc (57%) and iodine (42%), while a quarter of these women were living with anemia, as well as vitamin B12 and vitamin D (21%) deficiencies[7]. Among a sample of adolescent girls in Meshenti Town in Northwest Ethiopia, the prevalence of overall micronutrient intake inadequacy was 44.4%[8]. Previous studies conducted in Ghana have also shown that the diets of young children are sub-optimal and complementary feeding does not provide sufficient nutrients to meet nutrient needs, even with breastfeeding[9]. Another study by Wegmuller et al., which was also conducted in Ghana in 2017 and corroborates the findings of the 2017 micronutrient nutrient survey found that 35.6 percent of children aged 6-59 months had anemia, 21.5 percent had iron deficiency, 12.2 percent had iron deficiency anemia, and 20.8 percent had vitamin A deficiency while among non-pregnant women, 21.7 percent were anemic, 13.7 percent were iron deficient, 8.9 percent had iron deficiency anemia, and 1.5, 53.8 and 6.9 percent were respectively vitamin A, folate and vitamin B12 deficient [10].
Extant literature indicates that women, infants, children, and adolescents, particularly those in Africa and other low- and middle-income countries are especially vulnerable to adequate nutrition [4]. For women of reproductive age, optimal nutrition is essential for reproductive health, pregnancy outcomes, and successful breastfeeding, all of which directly affect both maternal and child health. Among adolescents, adequate nutrition can help reverse early childhood growth faltering, while for adolescent girls in particular, it is critical to reduce the risk of malnutrition-related complications during pregnancy and childbirth[11]. For young children, the first 1,000 days of life—from conception to their second birthday, represent a crucial window for brain development, physical growth, and immune function, making the prevention of malnutrition during this period vital for long-term health and productivity [12]. Several studies have focused on assessing dietary diversity and nutritional status among children under five, particularly during the critical first 1,000 days [13,14]. However, the period between 2 and 5 years is also a critical period of heightened vulnerability. Children in this age group often consume diets that are insufficient to meet their macro and micronutrient requirements [15].
Dietary assessments provide valuable insights into dietary habits, nutrient intake, and nutritional status of populations, helping to identify challenges and guide the design of targeted interventions and public health policies. Accurate dietary assessments allow for the identification of nutrient status and for monitoring the progress of nutrition programs aimed at improving the health of nutritionally vulnerable population groups[16]. However, there is limited evidence on dietary behavior and nutrient intake adequacy among nutritionally vulnerable groups including women, young children and adolescents in a single study.
In this study, we assessed dietary intake among women of reproductive age (18 years and older), children (2–5 years) and adolescents (12–18 years) in two communities in Ghana – Asesewa and Takoradi, as part of the Nutrished Study (Akparibo et al., 2025)[17]. Implementation of the NutriShed Study was guided by four main objectives: (1) identify existing vulnerabilities in nutrient flows into the study communities, including the nutrients found to be under consumed amongst the local population, (2) map the flow and origin of target foods for the key limiting nutrients in the study communities, (3) understand the roles that markets play in nutrient supply and (4) develop guidance to inform policies and plans. The dietary assessment was thus the first stage of a multi-stage framework in the NutriShed study. The dietary assessment was implemented as a first step with the objective of identifying limiting nutrients in the diets of nutritionally vulnerable groups including women of reproductive age, adolescents (12-18 years) and children (2-5 years), in the study communities.
Methods
The NutriShed Study
The NutriShed Study aimed to develop and demonstrate a spatially explicit foodshed-level planning approach that will enable researchers, practitioners and decision-makers to diagnose and plan interventions to help communities ensure stable and resilient supplies of key nutrients. The NutriShed approach innovates beyond existing value chains, food environments, and foodshed methodologies by taking a holistic food systems view of nutrition security. One of the strengths of the NutriShed approach is the shift from single commodity value chains and retail environments to the range of locally relevant foods contributing to supplies of key nutrients to communities. The study was designed as a series of inter-related stages using different methodologies that are adaptable to different food system contexts (Akparibo et al., 2025)[17]. The first stage in the process integrates dietary surveys and expert consultation through a dietary assessment survey to identify specific nutritional deficiencies and priorities in the study communities. The details of the methodological approach employed for the dietary assessment are detailed in the ensuing sections.
Study Settings
The survey was conducted in two communities in Ghana: Takoradi and Asesewa (Figure 1) with two contrasting regional food systems. Takoradi is a cosmopolitan city (Sekondi-Takoradi Metropolitan) situated along the Western coast of Ghana, with limited agricultural productivity. It is the largest city in Ghana's Western Region, with a population size of 245,382 people in the 2021 Ghana Population and Housing Census (PHC). The city is a fast-expanding conurbation, sourcing its food from a wide range of sources, including internal and international trade via the Takoradi Deepwater Seaport, as well as local agricultural supplies. Asesewa, the other community, a rural area compared to Takoradi, is the district capital of the Upper Manya-Krobo District (UMKD) in the Eastern region. The town was home to about 70,676 people according to the 2021 PHC[18].
Study Participants & Sampling Procedure
The dietary assessment was conducted as a household-based cross-sectional survey in two phases. In the first phase, non-pregnant non-lactating women aged 18 years and older who were responsible for household food purchase and cooking decisions, were recruited and interviewed consecutively between 31st July and 18th September 2023 across the two study locations. In the second phase, children aged 2 - 5 years and adolescents aged 12 – 18 years were sampled and interviewed from 1st July to 15th August 2024 at both study sites. Trained field assistants, fluent in English and the local language widely spoken in the setting (either Krobo or Fante), conducted the interviews using an interviewer administered approach.
Sampling Approach
We adopted a two-stage purposive cluster sampling approach to select a target of 600 respondents in total (100 respondents each per target group, i.e., women 18 years and older, children 2 -5 years and adolescents 12 -17 years, in each of the two study communities for the dietary assessment survey. In the first stage, clusters were identified within Asesewa and Sekondi-Takoradi. In Asesewa we utilized the district assembly's administrative divisions namely community A, B, C, D and EF as clusters. In Takoradi, recruitment was conducted in communities located near the four markets selected for the NutriShed Study (see Appendix 1 in the online Supplementary material). In the second stage, we adopted a random walk method described by Gibson and Fegurson (2008)[19] to select respondents within each cluster. Starting from a centre point in each of these clusters, a direction was chosen by spinning an empty bottle at popular landmarks. The interviewer then took the direction the bottle pointed to and selected the first eligible household encountered. One participant was interviewed per household, and recruitment continued in that direction until the estimated sample size was reached. Eligibility was limited to non-pregnant women, adolescents, and children who were permanent residents of the study sites. Individuals visiting temporarily or on short stays were not eligible and were thus excluded from the study.
Consent for participation
Women and adolescents aged 18 years consented to be part of the study by signing or thumb-printing a written informed consent after the purpose, benefits and risks of participation were explained to them in a language they can understand. In some cases, in addition to the woman’s consent, consent was also obtained from the husband of the women before the women could be interviewed. For children 2-5 years and adolescents 12-17 years, parental consent and child/adolescent assent were obtianed before interviewing the children/adolescents. Also, parents/caregivers and teachers served as proxies and provided responses for children aged 2-5 years. Participation in the study was entirely voluntary. Respondents could withdraw from the study at any time or refuse to answer questions without any penalty or consequences. To compensate for the time of respondents, women received two bars of soaps valued at 20 Ghanaian cedis, while adolescents and young children were compensated with books and pens also valued at the same amount.
Data Collection
Data on the sociodemographic characteristics of the respondents (including age, household size, highest education completed, marital status, religion and employment status for women and current level of education, type of school, age, whether or not adolescent/child is fed at school and who fed them were collected during the survey. Data for the dietary assessments were collected using the 24-hour recall method aided by an electronic tablet using a face-to-face interviewing approach. We adapted and implemented the interactive 24-hour multi-pass recall method employed by Gibson and Ferguson (2008)[19] in conducting dietary assessments. The types and quantity of food eaten by the respondents were estimated using household measures, food models, volumetric cups, measuring spoons and photographic food atlas with weights.
The dietary recall interviews were conducted using the multiple pass approach. The first pass involves listing all the foods and drinks (including drinking water) consumed by the respondent during the preceding 24-hour period. In the second pass, the interviewer guides the respondent to go over each of the responses made in the first pass, in chronological order, probing more specific descriptions of all the foods and drinks consumed, including cooking methods and (where possible or relevant) brand names. The third pass involves estimating portion sizes for the reported foods and drinks. In the fourth (last) pass, the interviewer reviews the recall to ensure that all the items have been recorded correctly. Data on recall characteristics including the day of recall, alcohol intake, usual/unusual intake, and engagement in religious or personal fasting during the recall period were also collected.
Data Analysis
The characteristics of the study participants were described using frequency and percentage distributions while continuous variables such as nutrient intake were analyzed using medians. The 24-hour dietary recall data were cleaned by checking for incompleteness and inconsistencies. Each reported food that was consumed was equated to a food code in a selected database. Standardized databases used for nutrient analyses were a compilation of nutrients from the West Africa food composition table and the Research to Improve Infant Nutrition and Growth (RIING) database designed by the Department of Nutrition and Food Science, University of Ghana. These databases contain nutrient data on locally available and commonly consumed foods in Ghana. These databases generate nutrient values for both macronutrients (energy, protein, carbohydrate, fat) and micronutrients (vitamin A, thiamin, riboflavin, niacin, vitamin B6, vitamin B12, folate, pantothenic acid, vitamins C, D, E, calcium, copper, iron, magnesium, manganese, phosphorus, potassium, sodium, and zinc). All portion sizes and volumes expressed in household measures were converted into appropriate units (grams for solids and millilitres for liquids). The consumed quantities (portion sizes) of each food were then entered into a selected database and the code that is the most accurate description of each reported meal was selected in the database. This selection automatically produces nutrient and energy values commensurate with each consumed portion size and each food code translates into a unique nutrient profile which is exported to an excel spreadsheet. Mixed dishes were unpacked into individual ingredients for accurate nutrient estimation. Total intake for each specific nutrient per individual was computed by adding all generated nutrient intakes from all reported foods consumed. The Excel output was exported into STATA (Stata Corp LLC) version 17.0 for analysis. Reference Estimated Average Requirement (reference EAR) for each nutrient, appropriate for the respective age group and sex[20,21], was compared against the respondents' intake to evaluate adequacy. Intake of nutrients less than the reference EAR was interpreted as inadequate intake for each respective nutrient. The final analysis for the nutrient intake was based on complete data for all respondents who reported usual food intake and did not experience a change in their appetite due to sickness during the 24-hour dietary recall period. The final analytical sample includes 187 women, 197 adolescents and 197 children respectively (Figure 2).
Characteristics of the Study Sample
The sample for the dietary assessment was 581, comprising 187 women, 197 children aged 2-5 years) and 197 adolescents aged 12-18 years (Table 1). Among the women, 8 out of 10 were in the reproductive age group. About half of the total sample of women had some basic education while about one-third had some secondary level education with a higher proportion of women in Takoradi having some secondary education (38.04%) compared to about a quarter (25.26%) of their counterparts in Asesewa. In terms of their marital status, a little more than half of the women were married or living together with a partner in both locations at the time of the dietary assessment survey. While on the whole, a little more than two thirds of the women reported being employed at the time of the survey, about 8 in 10 of the women in Takoradi reported being employed while about 5 in 10 of those in Asesewa were employed. While women belonging to the Pentecostal Christian religious affiliation constituted highest proportion of the total sample of women, the proportion of Pentecostals was much higher in Asesewa compared to Takoradi. Among the adolescents’ sample, those aged 10 to 14 years constituted the higher proportion by location. Altogether, about half of the adolescents had incomplete or complete primary education, and this was so in Asesewa as well, but in incomplete/complete junior high school and incomplete senior high school was more common among adolescents in Takoradi. At least 8 in 10 adolescents attended public schools and a little over a quarter reported being fed at school with school feeding being more common among those in Takoradi (37.50%) compared to those in Asesewa (18.75%). Only a small percentage of the adolescents were employed at the time of the survey and at least 7 out 10 reported the source of income for their households as coming from a self-employed member of the household. Among children aged 2 to 5 years, the three-year-olds constituted the highest proportion in both locations. About 8 out 10 have ever attended school and more than half attended a private school. Additionally, more than 8 out of 10 of the children were fed at school by mostly a teacher or the child themselves except in Asesewa where about a third of the caregivers did not know who fed the children at school (Table 1).
Nutrient Gap Analysis
The results of the nutrient analysis show calcium, folic acid, and riboflavin (Vitamin B2) as limiting in the diet of women. Women in Asesewa had a lower median EAR for all the three nutrients compared to their counterparts in Takoradi (Table 2). The pattern of results among children aged 2 to 5 years was mixed (Table 3). Fat was limiting for 2- and 4-year-old males and 3- and 4-year-old females in Asesewa. Fiber was also limiting among 4-year-old females in Asesewa. Calcium was limiting among 4-year-old males in Asesewa and 2-year-old males in Takoradi while among females, 3- and 4-year-olds in Asesewa and 4- and 5-year-olds in Takoradi showed inadequacy. Folic acid was limiting among only 4-year-old females, with inadequacy being higher in Asesewa compared to Takoradi. Riboflavin inadequacy was observed among 2-year-old males, with nearly equal levels in Asesewa and Takoradi. Among females, 2-, 3- and 5-year-olds in Asesewa also recorded inadequate Riboflavin consumption. Vitamin B12 (cobalamin) was also observed to be limiting among 3-year-old females in Asesewa.
The results for adolescents show relatively more nutrients being inadequate in their diets. For example, the median energy intake among 17-year-old females in Asesewa (1233.3 kcals per day) was lower than the reference EAR (1411.0 kcal/per day) (Table 4). Protein intake was also inadequate among 15-year-old males and 18-year-old females in Asesewa. Fat intake was inadequate among all ages of adolescents except 13-year-old males and 12-, 13-, 14- and 15-year-old females. Similarly, median calcium intake was inadequate for all ages of adolescents except 18-year males. Folic acid intake was also inadequate among adolescents, particularly in Asesewa, with all ages of females except those aged 17 years reporting inadequate mean intake. Among the total sample of adolescents, riboflavin intake was inadequate in all ages of males and females except 15-year-old females. Additionally, all ages of adolescent males and females in Asesewa reported inadequacy with respect to riboflavin intake. Inadequate intake of vitamin B1 was observed among 15-year-old males and 15- and 18-year-old females in Asesewa. Cobalamin consumption was inadequate among 14–17-year-old females in Asesewa while zinc intake was inadequate among 14- to 18-year-old males in Asesewa.
Discussion
The dietary assessment aimed to identify limiting nutrients in the diets of women, children, and adolescents in Asesewa and Takoradi in Ghana. Among women, calcium, folic acid, and riboflavin emerged as the most commonly limiting nutrients. These deficiencies are especially pronounced in Asesewa, where the median EARs for these nutrients were lower than those observed among women in Takoradi. The prevalence of these micronutrient deficiencies points to poor dietary diversity or limited access to nutrient-dense foods, particularly dairy, green leafy vegetables, and fortified foods that are key sources of these micronutrients.
The findings of this study corroborate those of previous studies conducted in Ghana which has reported low intake of folic acid fortified foods among pregnant and lactating women[22], and low Nutrient Adequacy ratios (NAR) for calcium among women of reproductive age[23]. Similar trends have also been observed in other developing countries, where calcium intake among women of reproductive age tends to be insufficient [24]. Nutrition education efforts targeting women of reproductive age should not overlook promoting the consumption of milk products.
The nutritional profile among children showed a complex, age- and sex-specific pattern. Folic acid, calcium, and riboflavin intake deficiencies were also common among children, particularly among girls. Low fat and fiber intake were observed among certain groups of children while inadequate calcium intake was common among nearly all the children surveyed, especially in Asesewa. This may be indicative of broader gendered food distribution patterns or household food insecurity. Additionally, calcium inadequacy in both Asesewa and Takoradi suggests systemic issues in dietary calcium availability or consumption patterns, especially among 4-year-old males (Asesewa) and 2-year-old males (Takoradi), as well as among several female age groups in Asesewa. This pattern aligns with findings that early childhood calcium intake is often suboptimal in low-resource settings[25], and highlights the need for interventions focusing on calcium rich foods in our study communities. Folic acid and riboflavin deficiencies in select age groups further indicate gaps in vitamin B intake, potentially due to low consumption of leafy greens, legumes, and animal-based products. For example, riboflavin was inadequately consumed by most female age groups in Asesewa, suggesting gender-related dietary disparities even at an early age. Also, cobalamin was notably low among 3-year-old females in Asesewa, suggesting inadequate intake of animal-source foods.
The pattern of the results among adolescents shows multi-nutrient inadequacy, highlighting concerns about undernutrition and a lack of dietary diversity among adolescents, especially those in Asesewa, where the broadest range of nutritional inadequacies were observed. Inadequacy of specific nutrients among adolescents is also of concern. For example, low median energy intake (e.g., 1233.3 kcal/day for 17-year-old females versus an EAR of 1411 kcal/day) is concerning, as energy restriction during adolescence can impair growth, sexual maturation, and cognitive function [26]. Other nutrient inadequacies including protein, fat, and micronutrient deficiencies, including calcium, folic acid, riboflavin, vitamin B1, vitamin B12 (cobalamin), and zinc were found to be prevalent among adolescents in both study communities. These deficiencies can have long-lasting impacts. For example, inadequate calcium intake during adolescence impairs bone mineralization [27] and folic acid deficiency during adolescence, especially in females, can lead to future pregnancy complications and anemia[28]. Vitamin B deficiency, including Vitamin B1, B2 and B12, has implications for energy metabolism, nervous system function, DNA synthesis and neurological development and reflects lack of dietary diversity and low intake of cereals, diary, lean meat, and animal source foods among adolescents in the study communities. The nutritional vulnerability among adolescents as observed in this study calls for urgent nutritional interventions, including school feeding programs, micronutrient supplementation, and nutrition education tailored to the needs of adolescents. Moreover, the adolescence stage is characterized by the formation of dietary habits which often protract into adulthood and for female adolescents the concern over micronutrient deficiencies is even heightened due to the link between poor nutrition and adverse health outcomes in future progeny [29].
In sum, the salient of findings of this paper show nutritional inadequacies in both Asesewa and Takoradi, however, Asesewa is observed to be more nutritionally vulnerable compared to Sekondi-Takoradi, probably due to socioeconomic, infrastructural, or cultural factors, limiting food access and availability to residents. Additionally, women and adolescent females, in particular, face the most critical nutrient gaps, especially in micronutrients essential for reproductive health.
The findings are not without some limitations which are worth mentioning. For example, some of the children could not accurately recall what they had eaten, or the exact quantities of the foods recalled. This could have resulted in some foods being missed in the recall and hence a lower estimated intake for the various nutrients. The findings should thus be interpreted taking into consideration these limitations.
Conclusion
The findings of this study show common nutrient inadequacies – riboflavin, folic acid, and calcium deficiency across the two study communities but also highlight context specific inequities that should be addressed through policy interventions, community nutrition education, and food system improvements to increase access to diverse, nutrient-rich foods. Specific interventions can include food supplementation and fortification school feeding programs with fortified foods and improved agricultural and market access to nutrient-rich foods.
Supplementary Materials
The following supporting information can be downloaded at the website of this paper posted on Preprints.org.
References
- Rodríguez-Mañas L, Murray R, Glencorse C, et al. (2023) Good nutrition across the lifespan is foundational for healthy aging and sustainable development. Front. Nutr. 9, 1–12.
- Pelletier DL, Frongillo EA, Schroeder DG, et al. (1995) The effects of malnutrition on child mortality in developing countries. Bull. World Health Organ. 73, 443–448.
- Pelletier DL & Frongillo EA (2003) Changes in child survival are strongly associated with changes in malnutrition in developing countries. J. Nutr. 133, 107–119. American Society for Nutrition.
- World Health Organisation (2024) Malnutrition. https://www.who.int/news-room/fact-sheets/detail/malnutrition (accessed November 2024).
- Black RE, Victora CG, Walker SP, et al. (2013) Maternal and child undernutrition and overweight in low-income and middle-income countries. Lancet 382, 427–451.
- Stevens GA, Beal T, Mbuya MNN, et al. (2022) Micronutrient deficiencies among preschool-aged children and women of reproductive age worldwide: a pooled analysis of individual-level data from population-representative surveys. Lancet Glob. Heal. 10, e1590–e1599.
- Ahmed F, Prendiville N & Narayan A (2016) Micronutrient deficiencies among children and women in Bangladesh: progress and challenges. J. Nutr. Sci. 5, e46. England.
- Ayal BG, Demilew YM, Derseh HA, et al. (2022) Micronutrient intake and associated factors among school adolescent girls in Meshenti Town, Bahir Dar City Administration, Northwest Ethiopia, 2020. PLoS One 17, 1–18. Public Library of Science.
- Greffeuille V, Dass M, Fanou-Fogny N, et al. (2023) Micronutrient intake of children in Ghana and Benin: Estimated contribution of diet and nutrition programs. Matern. \& Child Nutr. 19, e13453.
- Wegmüller R, Bentil H, Wirth JP, et al. (2020) Anemia, micronutrient deficiencies, malaria, hemoglobinopathies and malnutrition in young children and non-pregnant women in Ghana: Findings from a national survey. PLoS One 15, 1–19.
- Prentice AM, Ward KA, Goldberg GR, et al. (2013) Critical windows for nutritional interventions against stunting. Am. J. Clin. Nutr. 97, 911–918. American Society for Nutrition.
- Benoist B de, McLean E, Iegli N, et al. (2008) Worldwide prevalence of anaemia 1993-2005 : WHO global database on anaemia. World Health Organization.
- Molani Gol R, Kheirouri S & Alizadeh M (2022) Association of Dietary Diversity With Growth Outcomes in Infants and Children Aged Under 5 Years: A Systematic Review. J. Nutr. Educ. Behav. 54, 65–83. United States.
- Rah JH, Akhter N, Semba RD, et al. (2010) Low dietary diversity is a predictor of child stunting in rural Bangladesh. Eur. J. Clin. Nutr. 64, 1393–1398.
- Modjadji P, Molokwane D & Ukegbu PO (2020) Dietary diversity and nutritional status of preschool children in north west province, south africa: A cross sectional study. Children 7, 1–14.
- FAO, IFAD, UNICEF, et al. (2020) The State Of Food Security And Nutrition In The World 2020. Transforming Food Systems For Affordable Healthy Diets. State Food Secur. Nutr. World 2020.
- Akparibo R, Aryeetey R, Cooper G, et al. (2025) NutriShed: A Novel Methodological Framework for Nutrition Security Planning in Urban Communities. Preprints.
- Ghana Statistical Service (2021) Ghana 2021 POPULATION AND HOUSING CENSUS GENERAL REPORT VOLUME 3A.
- Gibson RS & Ferguson EL (2008) Calculating intakes of nutrients and antinutrients. An Interact. 24-hour recall Assess. adequacy iron zinc intakes Dev. Ctries.
- of Medicine I (2006) Dietary Reference Intakes: The Essential Guide to Nutrient Requirements. [Otten JJ, Hellwig JP, Meyers LD, editors]. Washington, DC: The National Academies Press.
- Nutrient Reference Values for Australia and New Zealand Including Recommended Dietary Intakes | NHMRC. https://www.nhmrc.gov.au/about-us/publications/nutrient-reference-values-australia-and-new-zealand-including-recommended-dietary-intakes (accessed July 2025).
- Akwaa Harrison O, Ifie I, Nkwonta C, et al. (2024) Knowledge, awareness, and use of folic acid among women of childbearing age living in a peri-urban community in Ghana: a cross-sectional survey. BMC Pregnancy Childbirth 24, 1–8.
- Apprey C, Addae HY, Boateng G, et al. (2025) Dietary diversity and nutrient adequacy among women in Bosomtwe District, Ghana. Matern. Child Nutr. 21, e13757. England.
- Puwanant M, Boonrusmee S, Jaruratanasirikul S, et al. (2022) Dietary diversity and micronutrient adequacy among women of reproductive age: a cross-sectional study in Southern Thailand. BMC Nutr. 8, 1–11. BioMed Central.
- Luthringer CL, Rowe LA, Vossenaar M, et al. (2015) Regulatory Monitoring of Fortified Foods: Identifying Barriers and Good Practices. Glob. Heal. Sci. Pract. 3, 446–461. United States.
- Das JK, Salam RA, Thornburg KL, et al. (2017) Nutrition in adolescents: physiology, metabolism, and nutritional needs. Ann. N. Y. Acad. Sci. 1393, 21–33.
- Weaver CM, Gordon CM, Janz KF, et al. (2016) The National Osteoporosis Foundation’s position statement on peak bone mass development and lifestyle factors: a systematic review and implementation recommendations. Osteoporos. Int. a J. Establ. as result Coop. between Eur. Found. Osteoporos. Natl. Osteoporos. Found. USA 27, 1281–1386. England.
- World Health Organisation (2023) Micronutrients. https://www.who.int/health-topics/micronutrients#tab=tab_1 (accessed June 2025).
- Cunha C de M, Costa PRF, de Oliveira LPM, et al. (2018) Dietary patterns and cardiometabolic risk factors among adolescents: systematic review and meta-analysis. Br. J. Nutr. 119, 859–879. England.
Figure 1.
A map of Ghana showing the two study communities, Asesewa and Takoradi.
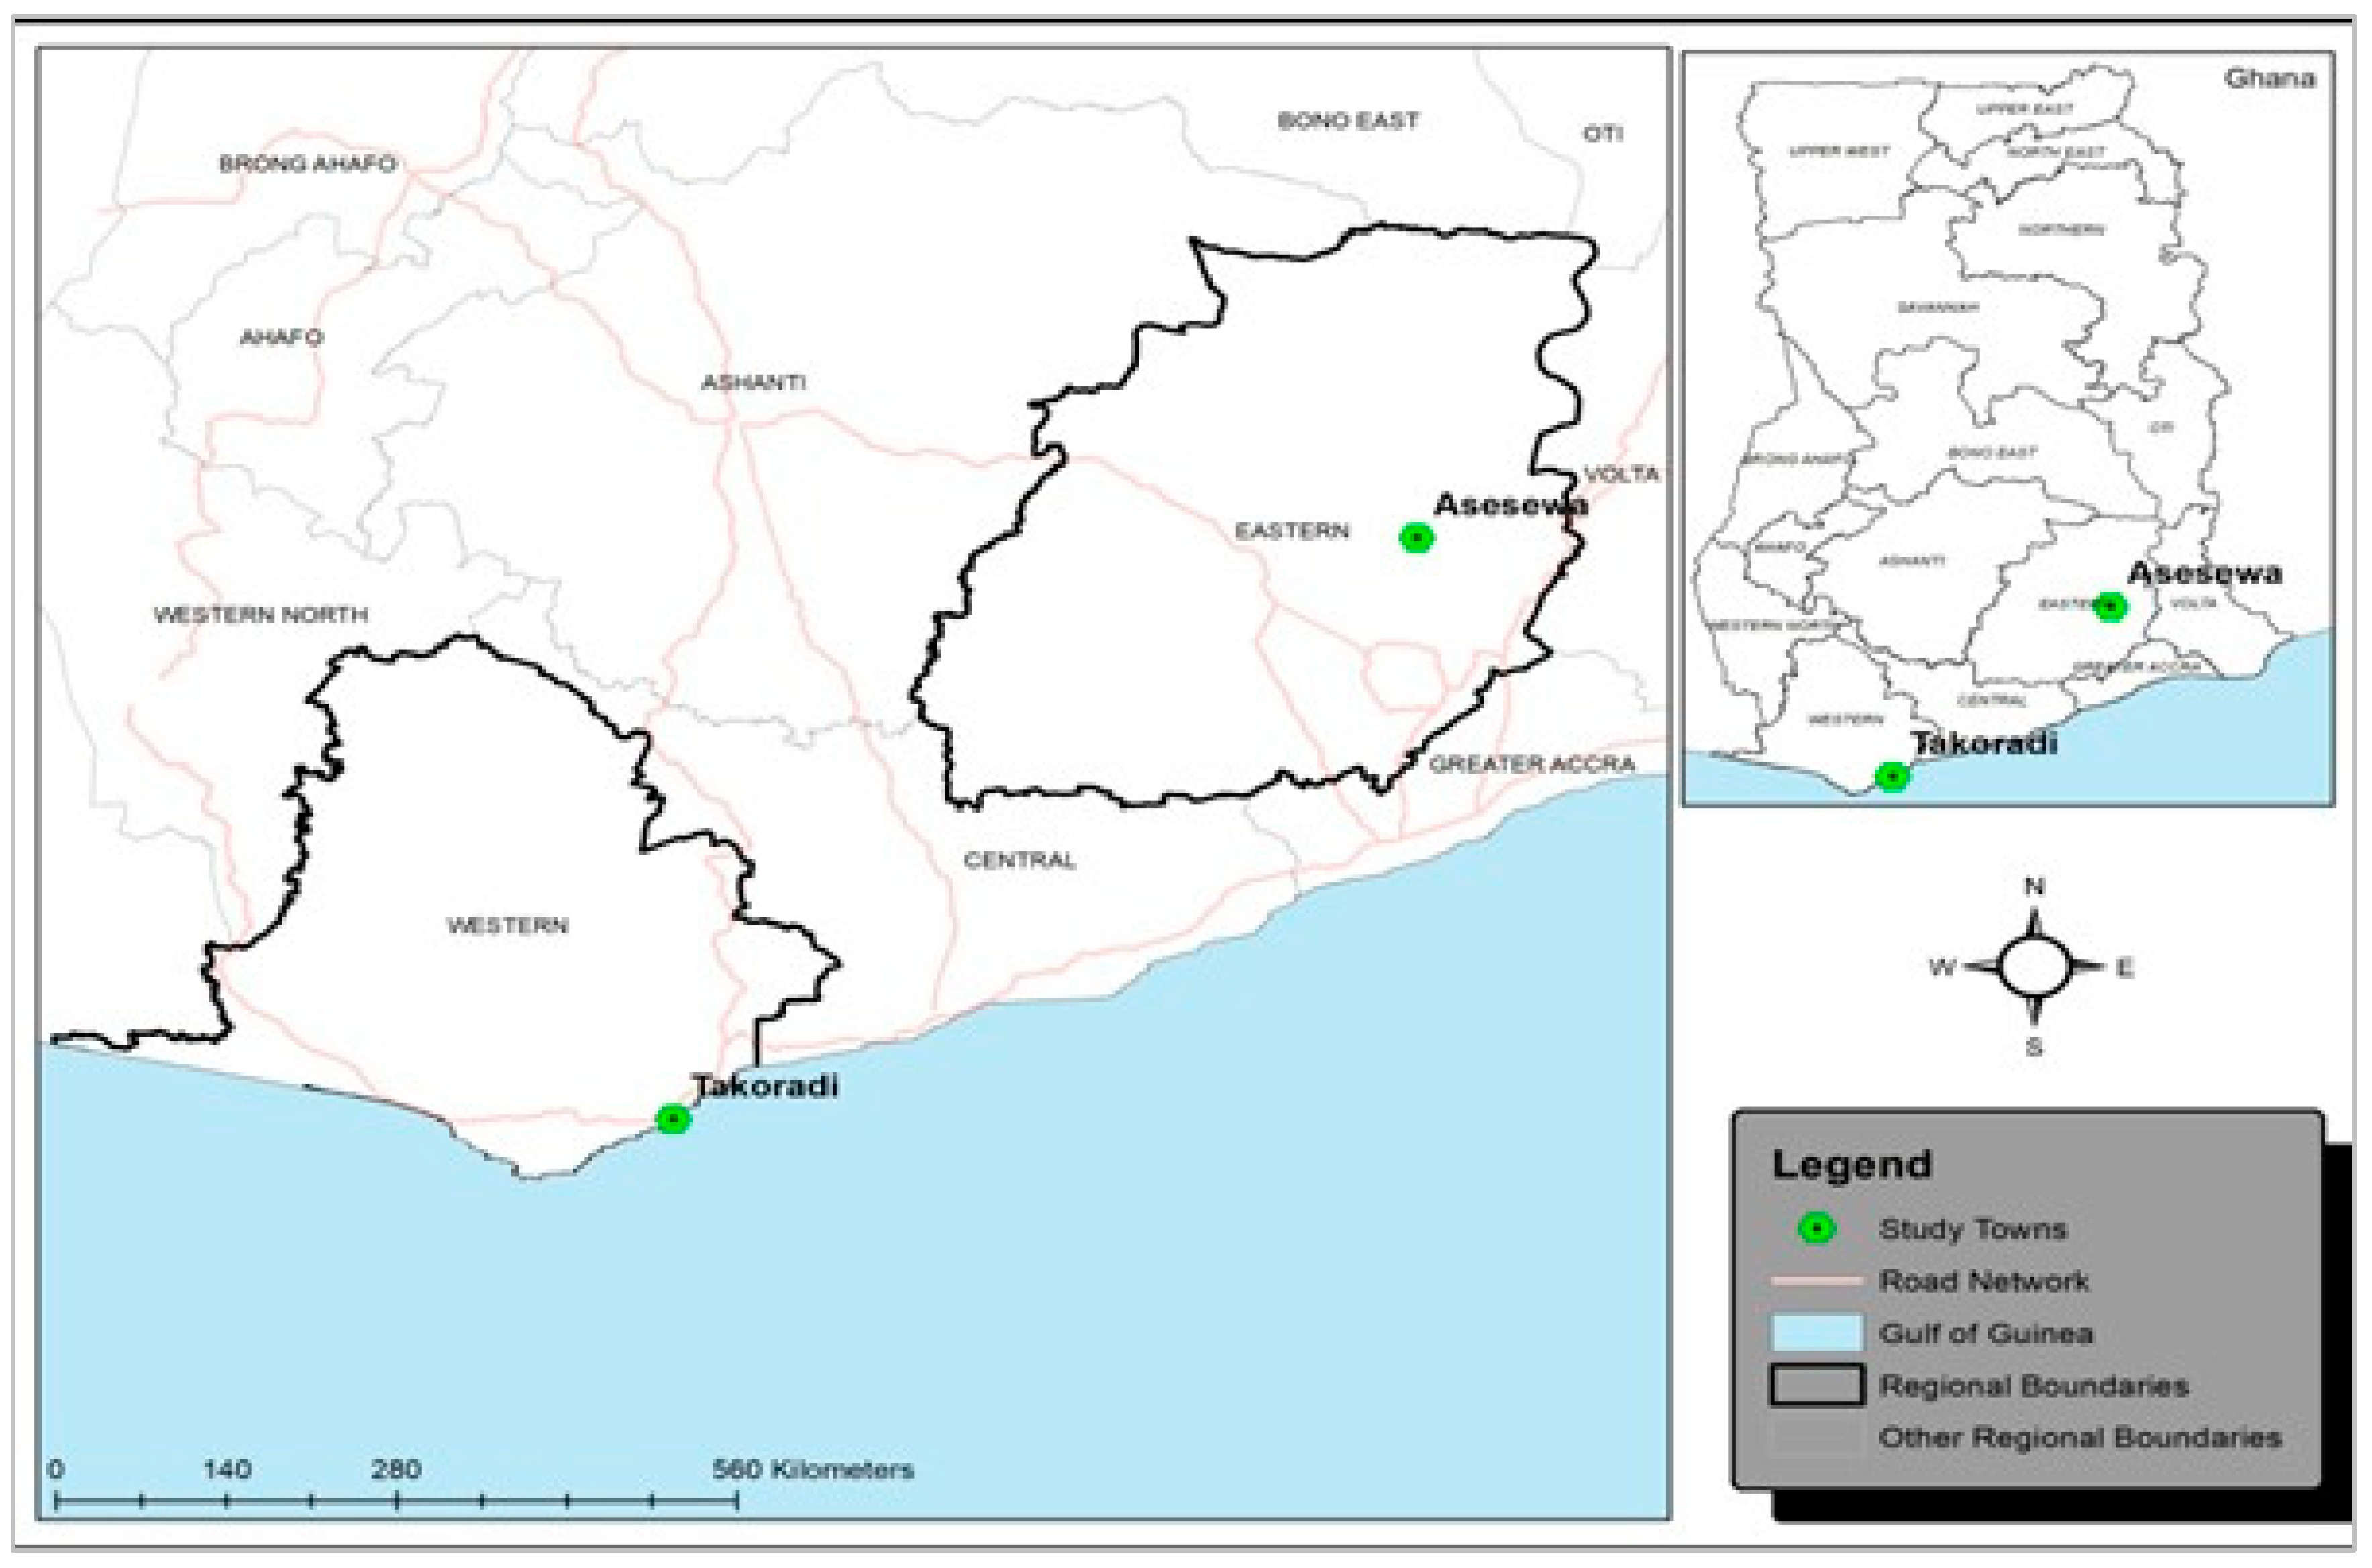
Figure 2.
Flow charts showing the selection process for the analytical sample for women (A), adolescents (B) and children for the dietary assessment analysisResults.
Figure 2.
Flow charts showing the selection process for the analytical sample for women (A), adolescents (B) and children for the dietary assessment analysisResults.
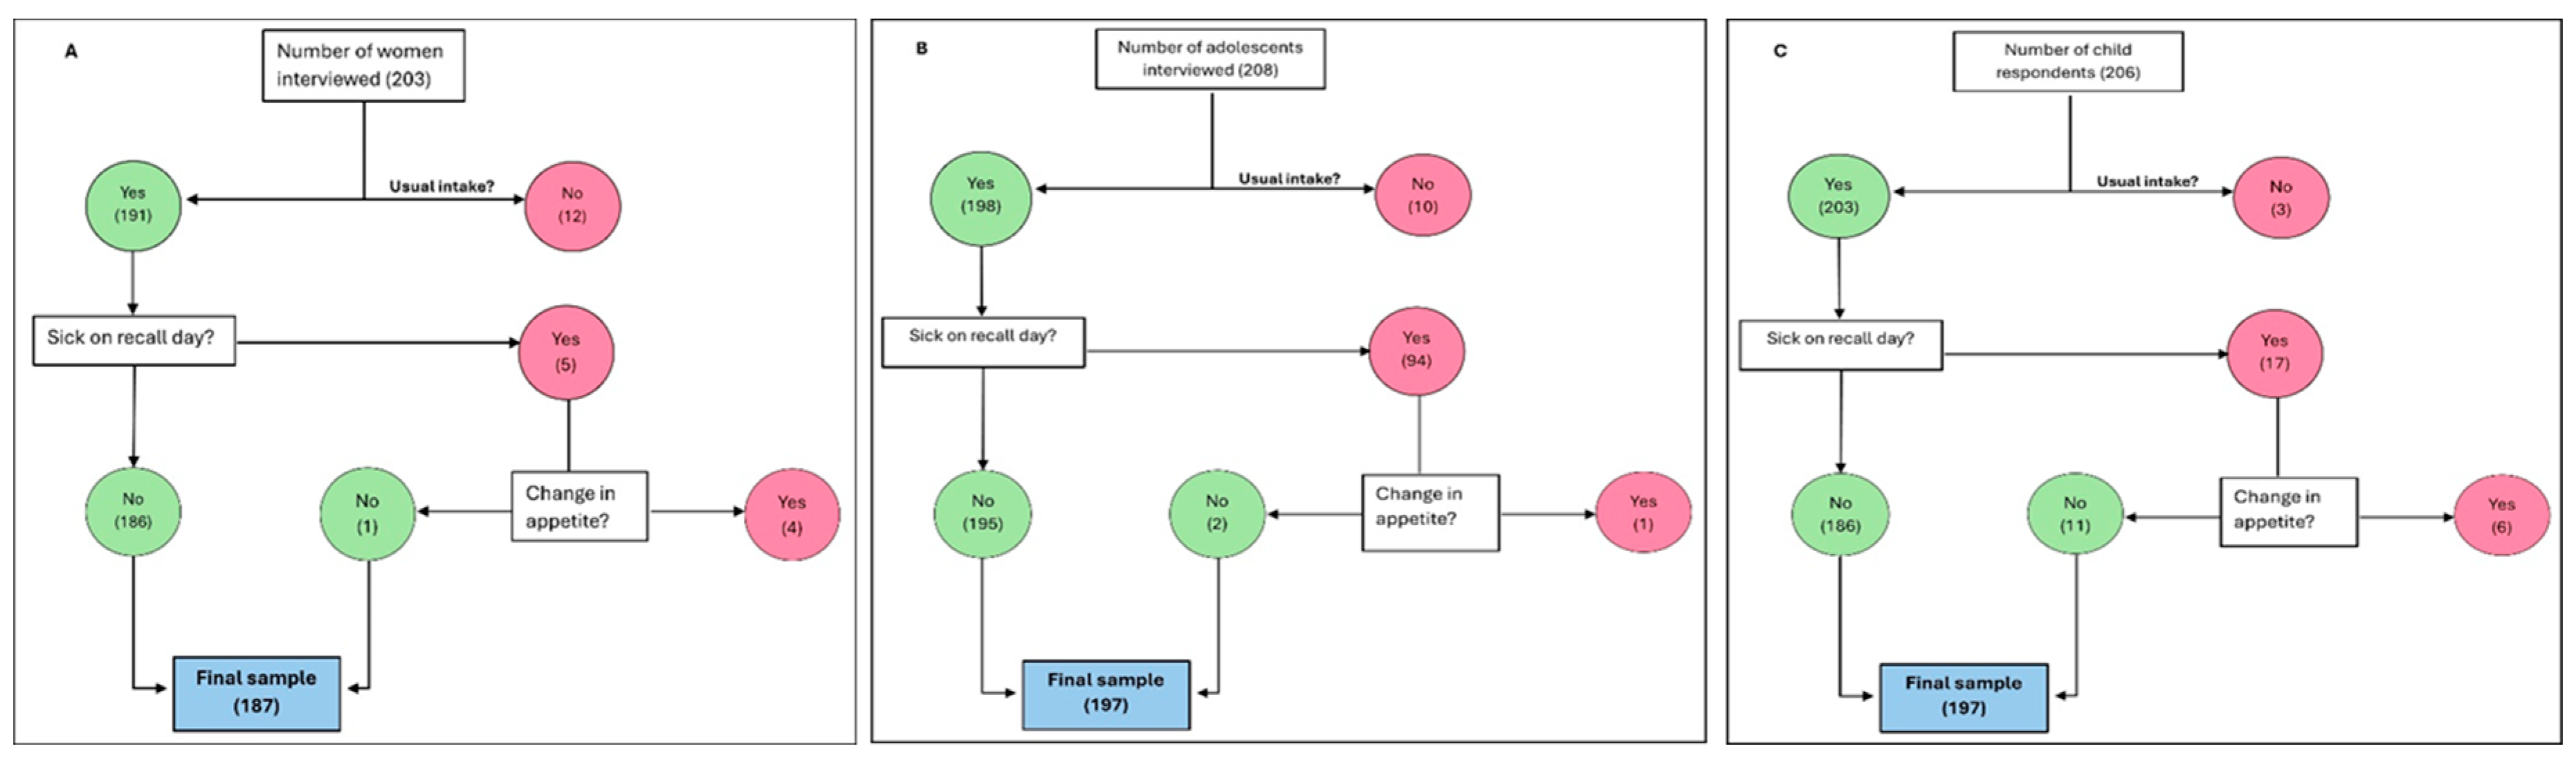

Table 1.
Distribution of study participants by socio-demographic characteristics.
| Socio-demographic characteristics | Total Sample | Asesewa | Takoradi |
| A. Women (n) | 187 | 95 | 92 |
| Age in years (Grouped)* | |||
| 18 - 49 | 88.77 | 91.58 | 85.87 |
| 49 + | 10.70 | 7.37 | 14.13 |
| Level of education | |||
| No formal education | 6.42 | 3.16 | 9.78 |
| Primary/Junior High§ | 50.27 | 56.84 | 43.48 |
| Secondary | 31.55 | 25.26 | 38.04 |
| Tertiary | 11.76 | 14.74 | 8.70 |
| Marital status | |||
| Never married | 35.83 | 32.63 | 39.13 |
| Married/Living together | 55.61 | 55.79 | 55.43 |
| Divorced/Widowed/Separated | 8.56 | 11.58 | 5.43 |
| Employment status | |||
| Employed | 68.98 | 54.74 | 83.70 |
| Unemployed | 31.02 | 45.26 | 16.30 |
| Religious affiliation | |||
| Pentecostal | 39.04 | 51.58 | 26.09 |
| Charismatic | 27.27 | 17.89 | 36.96 |
| Orthodox/Protestant | 30.48 | 29.47 | 31.52 |
| Muslim | 3.21 | 1.05 | 5.43 |
| B. Adolescents (n) | 197 | 99 | 98 |
| Age group | |||
| 10 - 14 | 62.94 | 68.69 | 57.14 |
| 15 - 19 | 37.06 | 31.31 | 42.86 |
| Highest level of education | |||
| No formal education | 2.54 | 3.03 | 2.04 |
| Incomplete primary | 29.95 | 38.38 | 21.43 |
| Completed primary | 23.35 | 37.37 | 9.18 |
| Incomplete junior high school | 12.18 | 2.02 | 22.45 |
| Complete junior high school | 19.80 | 18.18 | 21.43 |
| Incomplete senior high | 12.18 | 1.01 | 23.47 |
| Type of school** | |||
| Public | 88.54 | 85.42 | 91.67 |
| Private | 11.46 | 14.58 | 8.33 |
| Fed at school** | |||
| Yes | 28.13 | 18.75 | 37.50 |
| No | 71.88 | 81.25 | 62.50 |
| Currently employed | |||
| Yes | 2.54 | 2.02 | 3.06 |
| No | 97.46 | 97.98 | 96.94 |
| Main source of income | |||
| Monthly salary | 21.32 | 14.14 | 28.57 |
| Self-employed | 76.14 | 81.82 | 70.41 |
| Pensions | 1.52 | 3.03 | - |
| Other | 1.02 | 1.01 | 1.02 |
| C. Young Children (2 - 5 years) (n) | 197 | 100 | 97 |
| Age in years | |||
| 2 | 23.86 | 24.00 | 23.71 |
| 3 | 29.95 | 33.00 | 26.80 |
| 4 | 24.87 | 26.00 | 23.71 |
| 5 | 21.32 | 17.00 | 25.77 |
| Ever attended school | |||
| Yes | 81.22 | 79.00 | 83.51 |
| No | 18.78 | 21.00 | 16.49 |
| Type of school | |||
| Public | 34.38 | 26.58 | 41.98 |
| Private | 65.63 | 73.42 | 58.02 |
| Fed at school*** | |||
| Yes | 90.63 | 84.81 | 96.30 |
| No | 9.38 | 15.19 | 3.70 |
| Who feeds the child at school? | |||
| Child | 28.43 | 10.00 | 47.42 |
| Teacher | 40.10 | 47.00 | 32.99 |
| School cook | 4.57 | 9.00 | - |
| Older sibling | 0.51 | 1.00 | - |
| Don’t know | 26.40 | 33.00 | 19.59 |
* Excludes one woman who did not know her age ** Excludes 5 participants who had no formal education ***Excludes children who have never attended school § Completed or otherwise.
Table 2.
Nutrient analysis for women (18 years and older).
| Type of Nutrient | Reference EAR/day | Total Sample (n = 187) | Asesewa (n = 95) | Takoradi (n = 92) | |||
| Median intake | Inadequate intake (%) | Median intake | Inadequate intake (%) | Median intake | Inadequate intake (%) | ||
| Macronutrients | |||||||
| Energy (kcals) | 2200 | 2337.2 | 42.7 | 2240.2 | 47.37 | 2517.1 | 38.04 |
| Protein (g) | 37 | 70.0 | 15.0 | 68.7 | 15.8 | 74.7 | 14.1 |
| Fat* (mg) | 90 | 78.6 | 55.1 | 73.9 | 61.1 | 91.5 | 48.9 |
| Carbohydrate (g) | 100 | 267.2 | 6.4 | 270.6 | 8.4 | 258.2 | 4.4 |
| Fibre (g) | 25 | 36.8 | 24.6 | 37.7 | 23.2 | 35.2 | 26.1 |
| Micronutrients | |||||||
| Calcium (mg) | 840 | 570.3 | 72.7 | 552.1 | 72.6 | 579.2 | 72.8 |
| Iron (mg) | 8 | 18.7 | 6.4 | 18.4 | 7.4 | 18.9 | 5.4 |
| Folic acid (µg) | 320 | 257.2 | 59.4 | 240.3 | 64.2 | 291.8 | 54.4 |
| Niacin (B3) (mg) | 11 | 23.1 | 15.0 | 22.7 | 12.6 | 23.6 | 17.4 |
| Riboflavin (B2) (mg) | 0.9 | 0.8 | 63.6 | 0.7 | 72.6 | 0.8 | 54.4 |
| Thiamine (B1) (mg) | 0.9 | 1.2 | 29.4 | 1.1 | 29.5 | 1.2 | 29.4 |
| Pyridoxine (B6) (mg) | 1.1 | 2.3 | 13.4 | 2.4 | 13.7 | 2.2 | 13.0 |
| Cobalamin (B12) (ug) | 2.0 | 3.6 | 25.1 | 3.8 | 27.4 | 3.6 | 22.8 |
| Vitamin C (mg) | 30 | 121.8 | 4.3 | 131.8 | 5.3 | 113.0 | 3.3 |
| Zinc (mg) | 6.5 | 9.0 | 29.4 | 8.2 | 27.4 | 9.7 | 31.5 |
| Vitamin A (µg) | 500 | 797.9 | 28.3 | 770.0 | 31.6 | 817.5 | 25.0 |
* Reference EAR based on three long chain fatty acids combined eicosapentaenoic acid (EPA), docosahexaenoic acid (DHA) and docosapentaenoic acid (DPA) that are found predominantly in oily fish.
Table 3.
Nutrient gap analysis for children aged 2 - 5 years.
| Nutrients/Age | Males | Females | ||||||
| Reference EAR | Median Intake | Reference EAR | Median Intake | |||||
| Total | Asesewa | Takoradi | Total | Asesewa | Takoradi | |||
| Macronutrients | ||||||||
| Energy (kcals) | ||||||||
| 2 years | 1053 | 1492.0 | 1256.6 | 2078.8 | 1005 | 1451.7 | 1375.6 | 1779.5 |
| 3 years | 813 | 1724.1 | 1607.4 | 2494.2 | 766 | 1780.9 | 1010.0 | 3147.2 |
| 4 years | 861 | 1915.8 | 1619.2 | 3563.1 | 813 | 1666.5 | 1333.7 | 1845.6 |
| 5 years | 909 | 2242.9 | 2001.0 | 2436.4 | 861 | 2145.5 | 2125.8 | 2165.2 |
| Protein (g) | ||||||||
| 2 years | 12 | 37.8 | 37.8 | 36.7 | 12 | 44.6 | 31.0 | 45.5 |
| 3 years | 12 | 47.3 | 45.2 | 51.0 | 12 | 44.7 | 27.9 | 82.9 |
| 4 years | 16 | 44.3 | 39.3 | 65.3 | 16 | 48.6 | 45.3 | 51.8 |
| 5 years | 16 | 44.7 | 38.8 | 55.9 | 16 | 49.4 | 57.2 | 43.9 |
| Fat (mg) | ||||||||
| 2 years | 40 | 52.4 | 35.9 | 105.7 | 40 | 61.5 | 58.0 | 63.1 |
| 3 years | 40 | 60.0 | 53.4 | 109.3 | 40 | 73.5 | 17.3 | 168.5 |
| 4 years | 55 | 77.7 | 59.3 | 189.5 | 55 | 59.5 | 37.6 | 74.7 |
| 5 years | 55 | 58.6 | 53.2 | 94.2 | 55 | 88.8 | 87.0 | 90.9 |
| Fibre (g) | ||||||||
| 2 years | 14 | 20.3 | 22.3 | 19.6 | 14 | 24.8 | 24.0 | 25.3 |
| 3 years | 14 | 25.4 | 25.2 | 26.0 | 14 | 23.6 | 19.0 | 33.9 |
| 4 years | 18 | 28.0 | 25.0 | 34.2 | 18 | 22.5 | 13.5 | 22.7 |
| 5 years | 18 | 26.8 | 21.6 | 26.8 | 18 | 25.5 | 36.2 | 21.5 |
| Micronutrients | ||||||||
| Calcium (mg) | ||||||||
| 2 years | 360 | 379.7 | 417.3 | 357.8 | 360 | 457.1 | 367.8 | 504.4 |
| 3 years | 360 | 470.1 | 456.9 | 535.3 | 360 | 559.6 | 357.4 | 646.2 |
| 4 years | 520 | 530.9 | 441.3 | 633.1 | 520 | 406.6 | 356.9 | 475.6 |
| 5 years | 520 | 507.2 | 486.1 | 507.2 | 520 | 542.6 | 838.4 | 361.9 |
| Iron (mg) | ||||||||
| 2 years | 4 | 10.9 | 12.1 | 9.6 | 4 | 10.9 | 10.1 | 16.4 |
| 3 years | 4 | 14.0 | 12.9 | 16.1 | 4 | 14.8 | 13.9 | 19.4 |
| 4 years | 4 | 14.5 | 11.0 | 16.4 | 4 | 13.7 | 12.7 | 14.7 |
| 5 years | 4 | 13.0 | 10.5 | 15.1 | 4 | 13.2 | 19.1 | 12.3 |
| Folic acid (μg) | ||||||||
| 2 years | 120 | 166.2 | 212.5 | 127.0 | 120 | 230.0 | 167.7 | 242.6 |
| 3 years | 120 | 240.8 | 186.3 | 277.6 | 120 | 281.2 | 105.2 | 380.3 |
| 4 years | 160 | 203.9 | 179.5 | 227.8 | 160 | 152.6 | 132.4 | 157.9 |
| 5 years | 160 | 230.7 | 170.3 | 268.0 | 160 | 219.5 | 292.7 | 182.7 |
| Niacin (B3) (mg) | ||||||||
| 2 years | 5 | 10.2 | 10.2 | 10.0 | 5 | 13.1 | 11.3 | 15.2 |
| 3 years | 5 | 14.3 | 12.9 | 16.2 | 5 | 12.3 | 8.4 | 25.2 |
| 4 years | 6 | 14.5 | 13.9 | 18.5 | 6 | 12.6 | 13.9 | 10.5 |
| 5 years | 6 | 15.2 | 13.2 | 17.1 | 6 | 13.6 | 17.7 | 12.8 |
| Riboflavin (B2) (mg) | ||||||||
| 2 years | 0.4 | 0.38 | 0.38 | 0.37 | 0.4 | 0.40 | 0.35 | 0.47 |
| 3 years | 0.4 | 0.52 | 0.48 | 0.57 | 0.4 | 0.47 | 0.27 | 1.21 |
| 4 years | 0.5 | 0.55 | 0.51 | 0.82 | 0.5 | 0.49 | 0.40 | 0.53 |
| 5 years | 0.5 | 0.53 | 0.46 | 0.68 | 0.5 | 0.51 | 0.48 | 0.52 |
| Thiamine (B1) (mg) | ||||||||
| 2 years | 0.4 | 0.77 | 0.79 | 0.69 | 0.4 | 0.90 | 0.69 | 1.12 |
| 3 years | 0.4 | 1.00 | 0.98 | 1.13 | 0.4 | 1.05 | 0.67 | 1.63 |
| 4 years | 0.5 | 0.95 | 0.89 | 1.61 | 0.5 | 0.80 | 0.70 | 0.84 |
| 5 years | 0.5 | 1.09 | 0.82 | 1.10 | 0.5 | 1.18 | 1.36 | 1.10 |
| Pyridoxine (B6) (mg) | ||||||||
| 2 years | 0.4 | 1.48 | 1.38 | 1.65 | 0.4 | 1.53 | 1.48 | 1.58 |
| 3 years | 0.4 | 1.88 | 1.88 | 1.83 | 0.4 | 1.54 | 0.76 | 2.43 |
| 4 years | 0.5 | 2.32 | 2.27 | 2.61 | 0.5 | 1.59 | 1.53 | 1.65 |
| 5 years | 0.5 | 1.97 | 2.02 | 1.97 | 0.5 | 2.00 | 2.84 | 1.58 |
| Cobalamin (B12) (μg) | ||||||||
| 2 years | 0.7 | 1.41 | 1.34 | 1.81 | 0.7 | 1.30 | 0.94 | 1.90 |
| 3 years | 0.7 | 1.27 | 1.27 | 1.50 | 0.7 | 1.35 | 0.64 | 4.61 |
| 4 years | 1.0 | 1.92 | 1.56 | 3.04 | 1.0 | 1.54 | 2.92 | 1.43 |
| 5 years | 1.0 | 2.67 | 1.93 | 3.44 | 1.0 | 2.67 | 1.93 | 3.44 |
| Vitamin C (mg) | ||||||||
| 2 years | 25 | 78.58 | 67.35 | 81.50 | 25 | 74.11 | 69.41 | 78.80 |
| 3 years | 25 | 106.78 | 111.88 | 96.00 | 25 | 77.26 | 55.94 | 101.50 |
| 4 years | 25 | 125.05 | 125.05 | 129.40 | 25 | 98.51 | 80.86 | 104.51 |
| 5 years | 25 | 109.34 | 135.80 | 97.71 | 25 | 113.14 | 168.94 | 90.40 |
| Zinc (mg) | ||||||||
| 2 years | 2.5 | 4.9 | 5.4 | 4.6 | 2.5 | 6.1 | 5.1 | 7.0 |
| 3 years | 2.5 | 6.4 | 6.3 | 8.0 | 2.5 | 5.2 | 4.7 | 9.9 |
| 4 years | 3.0 | 7.0 | 6.4 | 10.0 | 3.0 | 6.7 | 4.6 | 7.9 |
| 5 years | 3.0 | 6.4 | 5.3 | 7.1 | 3.0 | 6.9 | 7.6 | 6.7 |
| Vitamin A (μg) | ||||||||
| 2 years | 210 | 710.3 | 389.1 | 1002.9 | 210 | 500.8 | 334.8 | 585.4 |
| 3 years | 210 | 750.7 | 668.4 | 1087.4 | 210 | 420.0 | 189.9 | 1448.4 |
| 4 years | 275 | 843.3 | 745.5 | 1933.6 | 275 | 680.6 | 424.1 | 691.1 |
| 5 years | 275 | 812.1 | 669.3 | 981.9 | 275 | 894.0 | 900.6 | 887.3 |
Table 4.
Nutrient gap analysis for adolescents aged 12 - 18 years.
| Nutrients/Age | Males | Females | ||||||
| Reference EAR | Median Intake | Reference EAR | Median Intake | |||||
| Total | Asesewa | Takoradi | Total | Asesewa | Takoradi | |||
| Macronutrients | ||||||||
| Energy (kcals) | ||||||||
| 12 years | 1388 | 2073.1 | 1991.7 | 2450.5 | 1244 | 2370.6 | 1942.1 | 2719.0 |
| 13 years | 1483 | 2638.5 | 2120.4 | 3766.7 | 1244 | 2241.7 | 2147.2 | 2590.6 |
| 14 years | 1579 | 2670.1 | 2173.2 | 3985.7 | 1364 | 2800.7 | 2513.1 | 3138.9 |
| 15 years | 1675 | 2245.0 | 1550.4 | 3632.2 | 1388 | 2902.5 | 1597.0 | 3354.5 |
| 16 years | 1746 | 2435.4 | 2396.7 | 2981.1 | 1411 | 2063.3 | 2016.3 | 2110.2 |
| 17 years | 1818 | 2734.6 | 2750.3 | 2734.6 | 1411 | 2078.9 | 1233.3 | 2542.3 |
| 18 years | 1842 | 2423.7 | 2423.7 | n/a | 1435 | 1896.5 | 1838.4 | 1954.6 |
| Protein (g) | ||||||||
| 12 years | 31 | 57.8 | 54.0 | 63.5 | 24 | 52.6 | 44.7 | 70.4 |
| 13 years | 31 | 61.1 | 43.0 | 86.6 | 24 | 66.2 | 58.0 | 68.3 |
| 14 years | 49 | 62.7 | 60.1 | 100.9 | 35 | 64.2 | 58.9 | 86.6 |
| 15 years | 49 | 55.7 | 31.8 | 87.6 | 35 | 66.5 | 57.6 | 83.6 |
| 16 years | 49 | 99.0 | 54.1 | 102.1 | 35 | 58.4 | 64.8 | 48.5 |
| 17 years | 49 | 69.1 | 75.9 | 58.5 | 35 | 53.8 | 41.4 | 60.6 |
| 18 years | 49 | 56.5 | 56.5 | n/a | 35 | 47.9 | 31.6 | 79.1 |
| Fat (mg) | ||||||||
| 12 years | 70 | 68.6 | 65.5 | 68.6 | 70 | 93.3 | 71.4 | 141.1 |
| 13 years | 70 | 114.8 | 85.1 | 246.7 | 70 | 71.8 | 68.9 | 90.4 |
| 14 years | 125 | 115.2 | 67.4 | 195.5 | 85 | 89.9 | 89.9 | 82.9 |
| 15 years | 125 | 95.0 | 95.0 | 184.1 | 85 | 97.6 | 20.5 | 155.5 |
| 16 years | 125 | 64.1 | 58.0 | 82.6 | 85 | 71.2 | 60.1 | 74.9 |
| 17 years | 125 | 67.4 | 51.2 | 93.2 | 85 | 81.6 | 29.7 | 100.6 |
| 18 years | 125 | 97.1 | 97.1 | n/a | 85 | 71.9 | 48.4 | 95.4 |
| Fibre (g) | ||||||||
| 12 years | 24 | 38.7 | 36.4 | 38.7 | 20 | 30.2 | 24.6 | 48.8 |
| 13 years | 24 | 36.2 | 22.8 | 41.8 | 20 | 33.5 | 33.5 | 34.4 |
| 14 years | 28 | 52.2 | 52.2 | 63.7 | 22 | 24.9 | 24.9 | 25.6 |
| 15 years | 28 | 26.4 | 14.5 | 34.1 | 22 | 48.4 | 26.6 | 66.2 |
| 16 years | 28 | 41.3 | 37.1 | 72.9 | 22 | 33.0 | 34.7 | 33.0 |
| 17 years | 28 | 45.0 | 45.0 | 43.1 | 22 | 41.2 | 29.4 | 44.3 |
| 18 years | 28 | 53.2 | 53.2 | n/a | 22 | 22.4 | 19.0 | 26.3 |
| Micronutrients | ||||||||
| Calcium (mg) | ||||||||
| 12 years | 1050 | 676.6 | 685.8 | 676.6 | 1050 | 637.4 | 418.0 | 1053.9 |
| 13 years | 1050 | 592.1 | 435.6 | 960.6 | 1050 | 575.6 | 575.6 | 735.1 |
| 14 years | 1050 | 747.2 | 747.2 | 814.6 | 1050 | 503.6 | 591.1 | 466.0 |
| 15 years | 1050 | 779.1 | 342.5 | 876.8 | 1050 | 782.4 | 394.9 | 1148.6 |
| 16 years | 1050 | 628.8 | 589.7 | 635.2 | 1050 | 593.3 | 522.0 | 623.8 |
| 17 years | 1050 | 725.8 | 995.2 | 525.0 | 1050 | 685.0 | 596.3 | 721.1 |
| 18 years | 1050 | 1178.2 | 1178.2 | n/a | 1050 | 445.7 | 232.5 | 658.8 |
| Iron (mg) | ||||||||
| 12 years | 6 | 20.1 | 19.8 | 20.1 | 6 | 20.9 | 15.1 | 28.8 |
| 13 years | 6 | 17.4 | 16.6 | 22.1 | 6 | 25.2 | 25.2 | 32.6 |
| 14 years | 8 | 19.2 | 19.2 | 17.8 | 8 | 16.1 | 7.2 | 21.5 |
| 15 years | 8 | 16.1 | 7.2 | 21.5 | 8 | 20.4 | 14.8 | 24.8 |
| 16 years | 8 | 24.9 | 19.3 | 36.2 | 8 | 16.8 | 19.1 | 15.9 |
| 17 years | 8 | 22.0 | 29.8 | 16.0 | 8 | 20.0 | 15.1 | 20.0 |
| 18 years | 8 | 27.0 | 27.0 | n/a | 8 | 14.1 | 13.0 | 15.2 |
| Folic acid (μg) | ||||||||
| 12 years | 250 | 455.7 | 504.9 | 354.7 | 250 | 327.8 | 208.5 | 635.9 |
| 13 years | 250 | 288.5 | 166.1 | 433.8 | 250 | 238.5 | 234.4 | 409.1 |
| 14 years | 330 | 421.0 | 421.0 | 464.3 | 330 | 138.1 | 134.0 | 174.8 |
| 15 years | 330 | 261.1 | 129.6 | 279.9 | 330 | 337.9 | 147.2 | 639.3 |
| 16 years | 330 | 316.0 | 243.5 | 1052.7 | 330 | 272.7 | 282.1 | 263.4 |
| 17 years | 330 | 288.3 | 347.7 | 282.6 | 330 | 471.3 | 422.7 | 471.3 |
| 18 years | 330 | 686.6 | 686.6 | n/a | 330 | 116.1 | 97.2 | 307.5 |
| Niacin (B3) (mg) | ||||||||
| 12 years | 9 | 16.3 | 17.7 | 15.0 | 9 | 19.1 | 16.3 | 21.0 |
| 13 years | 9 | 18.2 | 16.8 | 23.6 | 9 | 18.1 | 17.7 | 18.2 |
| 14 years | 12 | 21.0 | 18.8 | 33.5 | 11 | 18.7 | 18.7 | 18.5 |
| 15 years | 12 | 17.9 | 11.1 | 23.0 | 11 | 25.9 | 15.4 | 29.9 |
| 16 years | 12 | 28.4 | 23.5 | 36.0 | 11 | 17.1 | 16.2 | 18.1 |
| 17 years | 12 | 20.6 | 19.3 | 22.8 | 11 | 17.7 | 13.6 | 18.3 |
| 18 years | 12 | 20.7 | 20.7 | n/a | 11 | 13.2 | 8.7 | 24.7 |
| Riboflavin (B2) (mg) | ||||||||
| 12 years | 0.8 | 0.62 | 0.61 | 0.62 | 0.8 | 0.61 | 0.54 | 0.65 |
| 13 years | 0.8 | 0.70 | 0.60 | 0.97 | 0.8 | 0.68 | 0.67 | 0.70 |
| 14 years | 1.1 | 0.68 | 0.68 | 0.87 | 0.9 | 0.76 | 0.72 | 0.99 |
| 15 years | 1.1 | 0.75 | 0.38 | 1.14 | 0.9 | 0.90 | 0.49 | 0.92 |
| 16 years | 1.1 | 0.87 | 0.70 | 0.98 | 0.9 | 0.70 | 0.75 | 0.65 |
| 17 years | 1.1 | 0.71 | 0.79 | 0.69 | 0.9 | 0.55 | 0.40 | 0.57 |
| 18 years | 1.1 | 0.74 | 0.74 | n/a | 0.9 | 0.66 | 0.60 | 0.82 |
| Thiamine (B1) (mg) | ||||||||
| 12 years | 0.7 | 1.58 | 1.55 | 1.58 | 0.7 | 1.49 | 0.92 | 2.17 |
| 13 years | 0.7 | 1.53 | 1.27 | 2.69 | 0.7 | 1.07 | 1.04 | 1.95 |
| 14 years | 1.0 | 1.86 | 1.85 | 2.97 | 0.9 | 1.56 | 1.56 | 1.65 |
| 15 years | 1.0 | 0.96 | 0.51 | 1.66 | 0.9 | 1.38 | 0.77 | 2.18 |
| 16 years | 1.0 | 1.51 | 1.18 | 3.32 | 0.9 | 1.39 | 1.52 | 1.38 |
| 17 years | 1.0 | 1.43 | 1.84 | 1.10 | 0.9 | 1.41 | 1.16 | 1.46 |
| 18 years | 1.0 | 2.02 | 2.02 | n/a | 0.9 | 0.98 | 0.83 | 1.13 |
| Pyridoxine (B6) (mg) | ||||||||
| 12 years | 0.8 | 2.42 | 2.26 | 2.70 | 0.8 | 2.61 | 1.85 | 3.33 |
| 13 years | 0.8 | 2.28 | 1.78 | 2.66 | 0.8 | 2.51 | 2.57 | 2.42 |
| 14 years | 1.1 | 3.33 | 3.21 | 3.76 | 1.0 | 1.71 | 1.71 | 1.72 |
| 15 years | 1.1 | 2.51 | 1.65 | 2.76 | 1.0 | 3.70 | 1.90 | 4.09 |
| 16 years | 1.1 | 3.40 | 3.14 | 3.46 | 1.0 | 2.53 | 1.19 | 2.68 |
| 17 years | 1.1 | 3.20 | 3.20 | 2.86 | 1.0 | 2.18 | 1.90 | 2.49 |
| 18 years | 1.1 | 3.76 | 3.76 | n/a | 1.0 | 1.26 | 0.95 | 2.87 |
| Cobalamin (B12) (μg) | ||||||||
| 12 years | 1.5 | 1.95 | 1.71 | 2.78 | 1.5 | 2.15 | 2.07 | 2.50 |
| 13 years | 1.5 | 1.81 | 1.67 | 2.40 | 1.5 | 2.25 | 2.25 | 2.43 |
| 14 years | 2.0 | 1.77 | 1.14 | 2.26 | 2.0 | 2.09 | 1.93 | 2.41 |
| 15 years | 2.0 | 2.08 | 1.03 | 4.32 | 2.0 | 1.31 | 1.27 | 1.35 |
| 16 years | 2.0 | 2.75 | 1.76 | 2.86 | 2.0 | 2.03 | 1.05 | 3.70 |
| 17 years | 2.0 | 1.22 | 2.66 | 1.03 | 2.0 | 2.10 | 0.97 | 2.59 |
| 18 years | 2.0 | 1.24 | 1.24 | n/a | 2.0 | 2.39 | 2.71 | 2.07 |
| Vitamin C (mg) | ||||||||
| 12 years | 28 | 131.8 | 158.0 | 131.8 | 28 | 182.7 | 177.6 | 182.7 |
| 13 years | 28 | 134.3 | 129.4 | 139.2 | 28 | 155.6 | 156.6 | 152.9 |
| 14 years | 28 | 175.6 | 224.9 | 151.9 | 28 | 101.9 | 107.3 | 96.0 |
| 15 years | 28 | 138.2 | 126.5 | 147.3 | 28 | 173.7 | 92.5 | 214.6 |
| 16 years | 28 | 215.0 | 221.4 | 215.0 | 28 | 125.8 | 185.2 | 125.3 |
| 17 years | 28 | 174.7 | 174.8 | 149.7 | 28 | 132.7 | 129.1 | 132.7 |
| 18 years | 28 | 332.2 | 332.2 | n/a | 28 | 136.5 | 127.5 | 152.3 |
| Zinc (mg) | ||||||||
| 12 years | 5 | 7.9 | 8.2 | 7.6 | 5 | 8.1 | 6.1 | 9.9 |
| 13 years | 5 | 7.9 | 6.1 | 13.3 | 5 | 8.8 | 8.1 | 9.5 |
| 14 years | 11 | 9.1 | 9.1 | 14.6 | 6 | 7.7 | 7.7 | 10.2 |
| 15 years | 11 | 8.6 | 4.8 | 10.1 | 6 | 10.1 | 6.2 | 12.0 |
| 16 years | 11 | 12.4 | 7.8 | 14.3 | 6 | 7.0 | 9.5 | 6.9 |
| 17 years | 11 | 9.8 | 9.8 | 10.9 | 6 | 8.3 | 6.4 | 8.9 |
| 18 years | 11 | 9.2 | 9.2 | n/a | 6 | 5.9 | 3.9 | 11.2 |
| Vitamin A (μg) | ||||||||
| 12 years | 445 | 882.6 | 839.2 | 898.5 | 420 | 1200.1 | 785.0 | 1539.0 |
| 13 years | 445 | 1173.1 | 856.7 | 1599.8 | 420 | 882.9 | 855.9 | 882.9 |
| 14 years | 630 | 1164.4 | 1060.9 | 1225.7 | 485 | 888.7 | 747.4 | 1209.6 |
| 15 years | 630 | 1053.9 | 1053.9 | 1501.7 | 485 | 1141.5 | 621.6 | 1747.7 |
| 16 years | 630 | 732.3 | 748.6 | 679.1 | 485 | 1071.1 | 1111.4 | 1056.8 |
| 17 years | 630 | 861.5 | 744.7 | 863.6 | 485 | 1167.1 | 590.8 | 1210.8 |
| 18 years | 630 | 1271.2 | 1271.2 | n/a | 485 | 715.9 | 310.8 | 1121.0 |
n/a: Not applicable.
Disclaimer/Publisher’s Note: The statements, opinions and data contained in all publications are solely those of the individual author(s) and contributor(s) and not of MDPI and/or the editor(s). MDPI and/or the editor(s) disclaim responsibility for any injury to people or property resulting from any ideas, methods, instructions or products referred to in the content. |
© 2025 by the authors. Licensee MDPI, Basel, Switzerland. This article is an open access article distributed under the terms and conditions of the Creative Commons Attribution (CC BY) license (http://creativecommons.org/licenses/by/4.0/).
Copyright: This open access article is published under a Creative Commons CC BY 4.0 license, which permit the free download, distribution, and reuse, provided that the author and preprint are cited in any reuse.


