
Submitted:
23 July 2025
Posted:
24 July 2025
You are already at the latest version
Abstract
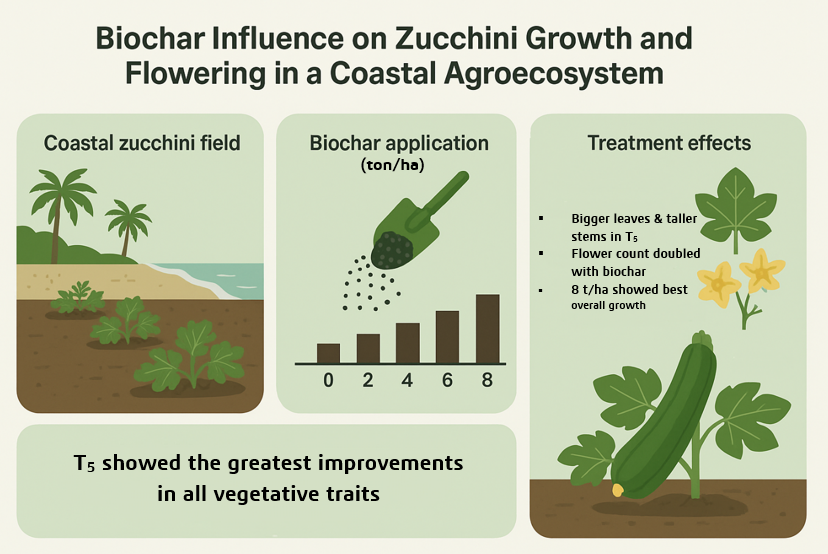
Biochar, a carbon-rich byproduct of biomass pyrolysis, has emerged as a sustainable soil amendment capable of improving soil health and plant productivity under stress-prone conditions. This study investigates the impact of wood-derived biochar on the growth and reproductive performance of zucchini (Cucurbita pepo) cultivated in a saline-prone coastal agroecosystem. Five different biochar treatments (0, 2, 4, 6, and 8 tons/ha) were used in a randomized full block design in Noakhali, Bangladesh. Key growth parameters including leaf number, petiole length, stem length, and biomass, along with reproductive traits such as male and female flower counts, were measured at 35 and 60 days after sowing. Results showed that higher biochar applications, particularly 8 tons/ha (T5), significantly enhanced all measured traits. T5 recorded the highest leaf and stem dimensions, flower production, and leaf dry weight. These improvements are attributed to biochar’s ability to enhance soil structure and nutrient availability, along with its capacity to improve water retention. The study concludes that biochar application is an effective strategy for improving zucchini productivity in saline coastal soils, offering a sustainable solution for vegetable cultivation in stress-prone agroecosystems.
Keywords:
biochar
; zucchini (Cucurbita pepo)
; coastal agroecosystem
; soil salinity
; plant growth and flowering
1. Introduction
Agriculture in coastal agroecosystems faces significant challenges due to environmental stressors such as soil salinity and nutrient depletion (Khusnur et al., 2024). These factors can severely limit crop productivity, making it essential to explore sustainable soil management practices that can enhance soil fertility and improve plant growth. One potential solution is the application of biochar (Masud et al., 2023), a carbon-rich material produced through the pyrolysis of organic biomass (Igalavithana et al., 2017). Biochar has gained increasing attention in agricultural research due to its ability to enhance soil properties. It also improves nutrient retention and support plant growth while also contributing to climate change mitigation by sequestering carbon in the soil (Lehmann & Joseph, 2015).
Zucchini (Cucurbita pepo), a widely cultivated vegetable crop, is particularly sensitive to soil conditions, with nutrient availability and salinity levels playing a crucial role in its growth and development (Machado & Serralheiro, 2017). Coastal agroecosystems, where soil salinity is a prevalent issue, often experience reduced zucchini yields due to the negative effects of high salt concentrations on seed germination, root development, eventually on overall plant health (El-Ramady et al., 2024). High salinity disrupts the plant’s ability to absorb water and essential nutrients, leading to physiological stress and stunted growth leading to poor flowering (Atta et al., 2023) Given the increasing environmental pressures in coastal regions, it is necessary to explore soil amendments that can improve zucchini resilience and productivity under saline conditions.
Biochar has been widely studied for its ability to mitigate the negative effects of soil salinity while enhancing soil structure and fertility (Lee et al., 2022, Singh Yadav et al., 2023, Antonangelo et al., 2025). Its porous structure provides a habitat for beneficial soil microorganisms improves water retention as well as reduces nutrient leaching, all of which contribute to better plant growth and increased crop yields (Kabir et al., 2023). Studies have demonstrated that biochar can enhance vegetative growth (Abdelghany et al., 2023), increase biomass accumulation (Simiele et al., 2022), and improve flowering and fruiting in various crops (Sharma et al., 2022). For instance, research has shown that biochar application in saline soils can lead to significant improvements in plant growth and fruit yield in zucchini (Khatun et al., 2023). Similarly, studies on other vegetable crops, such as tomatoes and maize, have found that biochar application promotes root development, which later enhances nutrient availability and increases overall plant performance (Zou et al., 2023). However, despite these promising findings, there remains a gap in research specifically examining the impact of biochar on zucchini growth and flowering in coastal agroecosystems.
Flowering is a critical stage in plant development (Jr. Dennis F, 2003), as it directly affects fruit set and overall yield. In zucchini, both male and female flowers are required for successful fruit production, making the balance between the two flower types an important factor in agricultural productivity. The effects of biochar on flowering have been explored in other crops, with findings suggesting that improved soil conditions resulting from biochar application can lead to enhanced flower production and better reproductive success (Sharma et al., 2022). Biochar’s ability to enhance nutrient availability, particularly phosphorus and potassium (Sun et al., 2025), plays a crucial role in flowering and fruiting processes (Simiele et al., 2022). Additionally, its water retention properties help mitigate drought stress, which is often a limiting factor during critical growth stages in coastal agroecosystems (Taverniti, 2023). However, the extent to which biochar influences the flowering patterns of zucchini, including the number of male and female flowers produced, requires further investigation.
While the benefits of biochar in improving soil fertility and plant growth have been well-documented, its effectiveness can vary depending on several factors, including the type of feedstock used, pyrolysis conditions, composition and application rates. Different biochar compositions may have varying effects on soil properties and plant responses, making it essential to determine the most suitable biochar formulations for specific agricultural conditions (Lehmann & Joseph, 2015). Furthermore, the long-term impact of biochar on soil microbial communities and nutrient cycling remains an area of ongoing research, specially in saline environments where microbial activity plays a crucial role in maintaining soil health and fertility (Jeffery et al., 2017). Understanding these dynamics is essential for developing sustainable biochar application strategies that maximize benefits for crop production in coastal agroecosystems.
Given the increasing challenges associated with coastal agriculture, the use of biochar presents a promising approach to improving zucchini growth and resilience in these environments. However, despite the existing body of research on biochar’s benefits, there is a need for more targeted studies that specifically examine its influence on zucchini growth and flowering dynamics. This study aims to address this gap by evaluating the effects of biochar application on key growth parameters, including leaf number, petiole length, stem length and biomass accumulation, as well as reproductive traits such as the number of male and female flowers.
By assessing different biochar treatment levels, this research seeks to provide valuable insights into optimizing zucchini cultivation in saline-prone coastal agroecosystems. It is hypothesized that biochar application will enhance zucchini growth and flowering by improving soil conditions and increasing nutrient availability. The findings of this study will contribute to a deeper understanding of biochar’s role in sustainable agriculture and offer practical recommendations for farmers seeking to improve crop productivity in challenging coastal environments.
2. Materials and Methods
2.1. Site of the Experiment
The research was conducted in the Agriculture research field of Noakhali Science and Technology University, Noakhali, Bangladesh during the period December 2023 to March 2024.
2.2. Plant Materials
The seeds of Squash of F1 hybrid was collected. Seeds were soaked in water a day before sowing and sown on 1 January 2024. Seeds were sown using the dibbling method maintain the spacing of 1 m × 1 m. 2-3 seeds were placed in each hole. Later thinned to one seedling per hole.
2.3. Design of Experiments and Treatments
One factor experiment was performed in Randomized Complete Block Design (RCBD). The experiment consisted on five treatments. Different doses of biochar were applied i.e T1 =0 ton/ha (control), T2=2 ton/ha, T3=4 ton/ha, T4=6 ton/ha, T5=8 ton/ha. The size of each experimental plot was 2m × 2m(4m2) with five holes. In each hole one germinated seedling was kept. Therefore, five seedlings were grown in each plot. The net area of field experiment was 104 m2(8m × 13m). Space kept between each block and plot as well as around the field was 0.5m.
2.4. Preparation of Land
The field was prepared by ploughing and cross-ploughing followed by laddering on December 25th, 2023. Large clods were broken into smaller pieces with a spade. The corners of the land were spaded well. Weeds and stubbles were removed from the field. The beds were prepared by using spade, hoe and then labeling. Various fertilizers and cow dung were to improve the fertility status of soil. Recommended dose was Urea (335kg/ha), Tsp(335kg/ha), Mop(288kg/ha), Gypsum(192kg/ha), MgO(4.8kg/ha), Borax(3.8kg/ha), Zn(4.8kg/ha). These were applied during land preparation.
2.5. Biochar Application
Wood biochar was used in this experiment. The biochar was crushed into powder. The recommended dose of biochar (T1 =0 ton/ha (control), T2=2 ton/ha, T3=4 ton/ha, T4=6 ton/ha, T5=8 ton/ha) was applied in the treatments of this experiment. The soil was mixed properly after application of biochar using spade.
2.6. Crop Management
2.6.1. Intercultural Operation
Gap filling was done by healthy seedlings. Weeding was done several times during plant growth. Irrigation were given to supply adequate soil moisture.
2.6.2. Pest and Disease Management
As the season was expired extreme disease and pest attack occurred. Aphid attacked several times. Mosaic was also observed on the leaves. Insecticides Imidachlorprid, Acitamiprid was sprayed. Soapy water was used as well. Hand picking of insects was done and infested plant were removed.
2.6.3. Methods of Data Collection
Data were collected directly from the field experiment at 35 and 60 days after sowing. Three plants were selected randomly from each plot and data was recorded. Seven growth and yield related parameters such as number of leaf, length of petiole, length of leaf, width of leaf, length of stem, number of male flowers and number of female flowers were measured.
2.7. Statistical Analysis
Data analysis was conducted using IBM SPSS Statistics (version 26), while graphical representations were created with Microsoft Excel (2019). A one-way analysis of variance (ANOVA) was employed to assess the effects of biochar treatments. Where appropriate, Welch’s ANOVA was used in place of the standard ANOVA to account for violations of the assumption of homogeneity of variances. Post-hoc comparisons were performed using Tukey’s Honestly Significant Difference (HSD) test to identify statistically significant differences between treatment means. Statistical significance was set at p < 0.05. All results are reported as mean values ± standard error of the mean (SEM).
3. Results
3.1. Leaf Number
The analysis of leaf number at both 35 and 60 days post-planting revealed significant differences among the biochar treatments (Figure 1). At 35 days, the mean leaf number ranged from 5.11 in treatments T1 and T2 to 6.56 in treatment T5. At 60 days, treatment T5 again exhibited the highest mean leaf number at 20.44, while treatments T1 and T2 had the lowest at 13.78. Despite the Welch ANOVA revealing moderate significance (p = 0.003), a post hoc analysis via the Games-Howell test indicated no significant differences among treatments, implying that observed treatment variations may lack statistical robustness.
3.2. Petiole Length
Petiole length measurements at 35 and 60 days demonstrated significant increases with higher biochar treatments (Figure 2). At 35 days, petiole length increased significantly from 16.02 cm in T1 to 22.83 cm in T5. The trend continued at 60 days, where treatment T5 exhibited the longest petiole length at 30.49 cm, compared to the lowest length of 22.24 cm in T1. The Welch ANOVA results were highly significant (p < 0.000), indicating that different treatments significantly influenced petiole length. Post hoc analysis confirmed that T5 had significantly longer petioles than all other treatments, while T4 also showed significant differences when compared to T1, T2, and T3.
3.3. Leaf Length
The leaf length at 35 days showed a significant increase from 12.74 cm in T1 to 14.83 cm in T5, while at 60 days, the length increased significantly from 20.53 cm in T1 to 29.58 cm in T5 (Figure 3). The analysis indicated a strong treatment effect, with the Welch ANOVA results for leaf length being highly significant at both growth stages (p < 0.000). Post hoc analysis revealed that T5 consistently had the longest leaf lengths, significantly differing from all other treatments at both time points. T4 also exhibited significant differences compared to T1, T2, and T3, indicating enhanced leaf growth associated with higher biochar applications.
3.4. Leaf Width
Leaf width measurements indicated that at 35 days, the highest width was recorded in treatment T4 at 15.22 cm, while T5 showed a slightly lower width of 13.57 cm (Figure 4). At 60 days, treatment T5 exhibited the greatest leaf width at 29.77 cm, significantly higher than the 22.90 cm recorded for T1. The Welch ANOVA analysis yielded a p-value of less than 0.05 for leaf width at 60 days, suggesting significant differences among treatments. The post hoc analysis demonstrated that while T5 had the widest leaves, T4 also performed well at both growth stages.
3.5. Stem Length
Stem length assessments at 35 days showed a notable increase from 1.97 cm in T1 to 3.96 cm in T5. By 60 days, stem lengths reached a maximum of 24.50 cm in T5, while T1 exhibited the lowest stem length at 15.30 cm (Figure 5). The Welch ANOVA indicated highly significant differences (p < 0.000) across the treatments, confirming the positive influence of biochar on stem length. Post hoc tests indicated that treatment T5 produced significantly longer stems than all other treatments, further highlighting the benefit of higher biochar application on zucchini growth.
3.6. Number of Male Flowers
The number of male flowers was positively influenced by biochar treatments, with T1 producing an average of 5.22 male flowers and T5 yielding 9.56 flowers (Figure 6). Significant variations across treatments were shown by the Welch ANOVA findings (p < 0.000). Thus it confirms the effectiveness of biochar in enhancing flowering. Post hoc analysis indicated that treatment T5 significantly outperformed all other treatments, particularly T1, T2, and T3, suggesting that improved vegetative growth led to better flowering outcomes.
3.7. Number of Female Flowers
Similar trends were observed in the number of female flowers, where treatment T5 produced an average of 5.22 female flowers, significantly higher than the 2.33 flowers recorded in T1 (Figure 7). The Welch ANOVA results were highly significant (p < 0.000), indicating that biochar treatments effectively influenced female flower production. Post hoc tests confirmed that T5 significantly differed from all other treatments, reinforcing the notion that increased biochar applications promote flowering in zucchini.
3.8. Dry Weight of Leaves
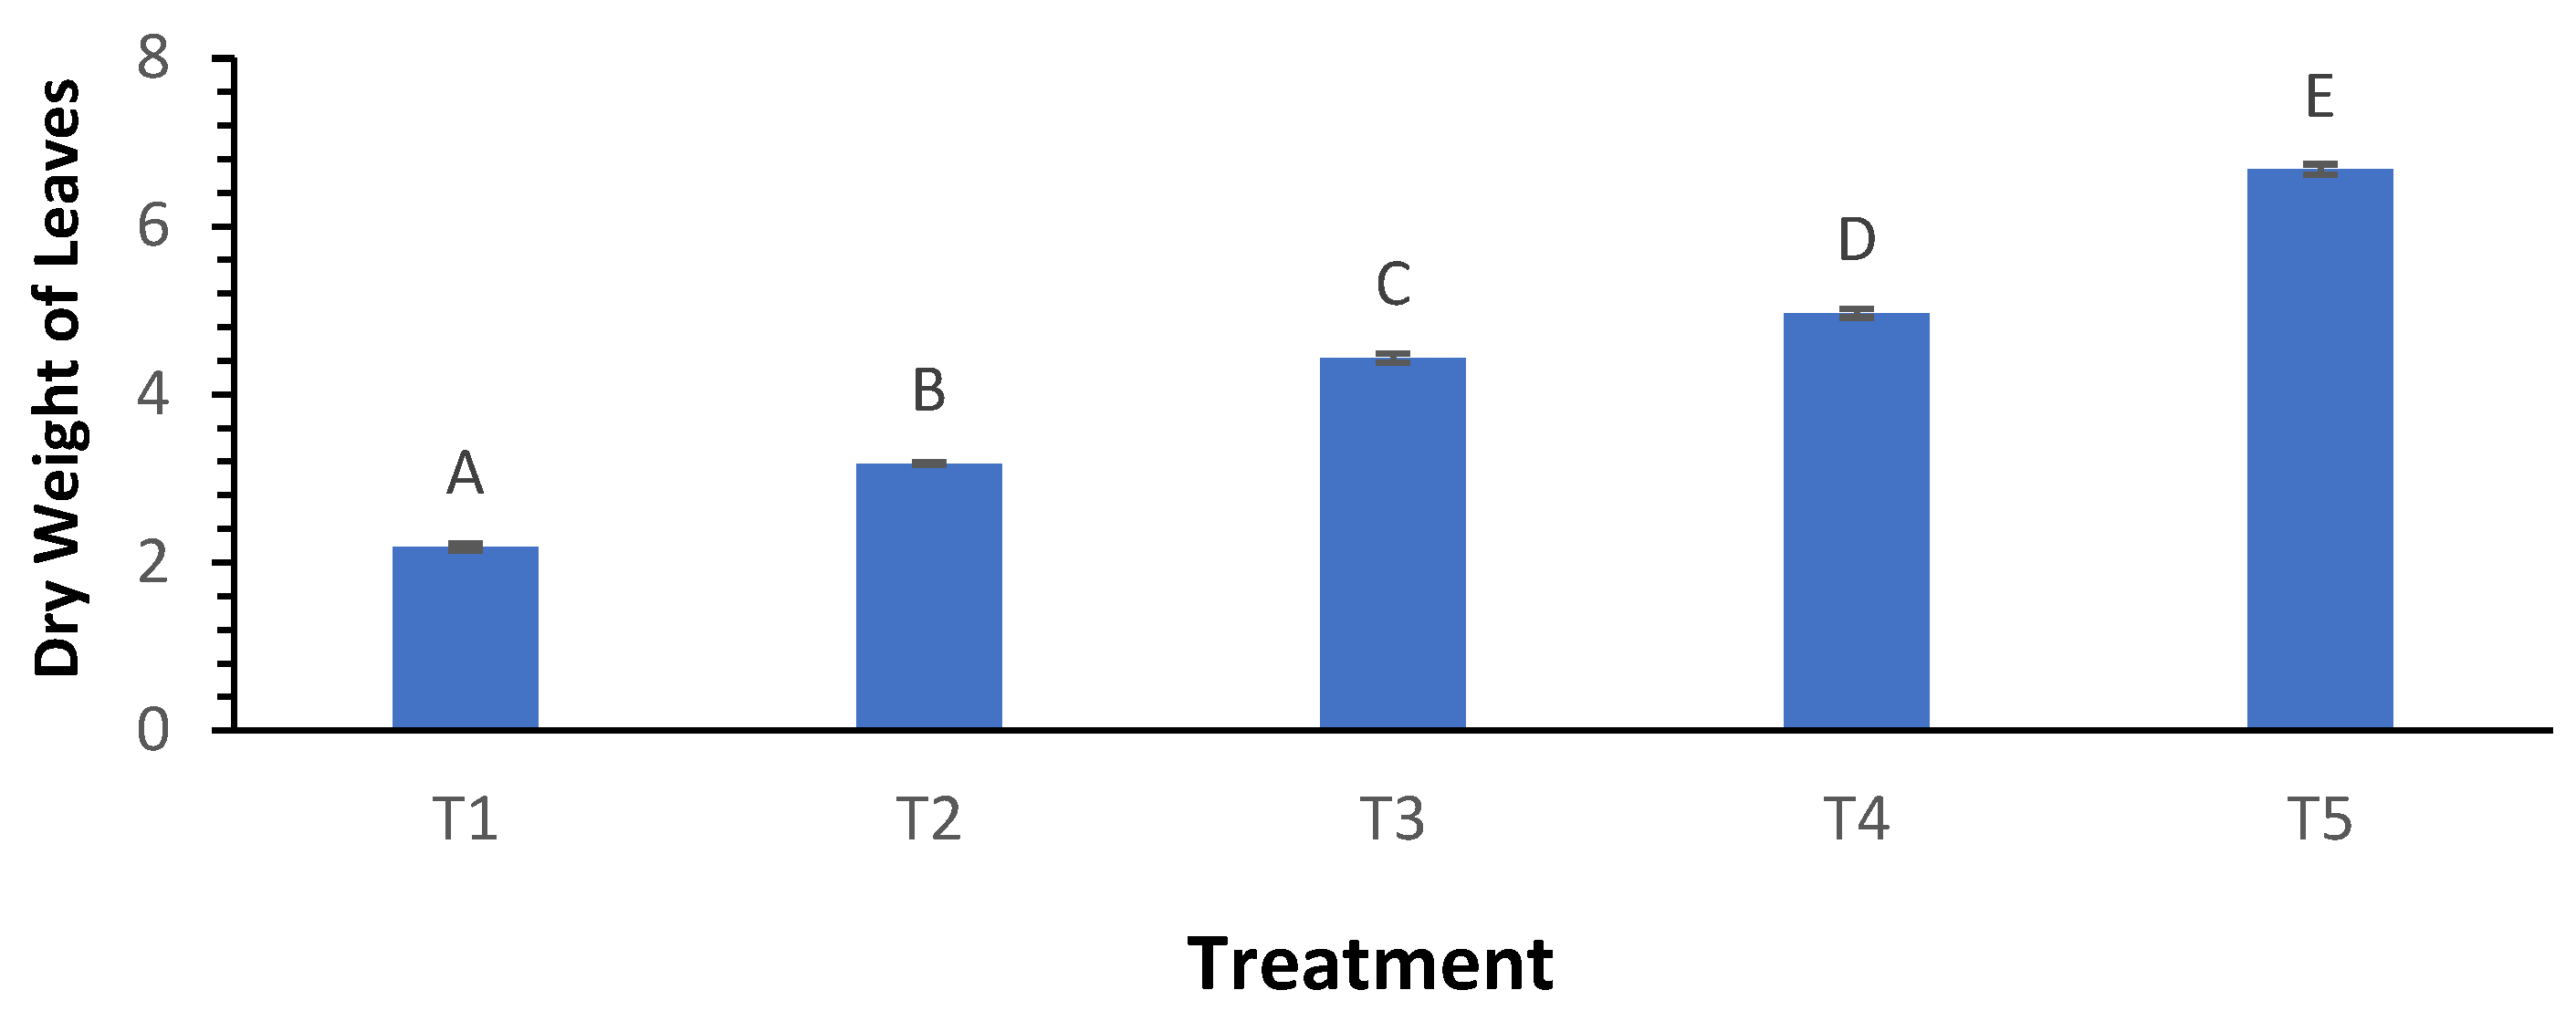
The dry weight of leaves was considerably influenced by biochar treatments, with T1 exhibiting the lowest dry weight at 2.19 g and T5 achieving the highest at 6.68 g (Figure 8). The Welch ANOVA results confirmed significant differences across treatments (p < 0.000), indicating that higher biochar levels corresponded with greater biomass accumulation. Post hoc analysis indicated that T5 significantly differed from all other treatments, highlighting the positive impact of biochar on leaf dry weight and overall plant biomass.
4. Discussion
4.1. Vegetative Growth Parameters
Biochar application led to an increase in leaf number, petiole length, leaf length, and leaf width, with treatment T5 exhibiting the highest values across all measured parameters. The positive impact of biochar on leaf development can be attributed to its ability to improve soil structure, enhance microbial activity, and increase nutrient availability, particularly nitrogen and phosphorus (Mukherjee & Lal, 2013). Although the Welch ANOVA results indicated moderate significance for leaf number, the overall trend suggests that biochar improves vegetative growth by promoting cell expansion and leaf development, as observed in prior studies on cucurbit species (Agegnehu et al., 2016).
Petiole length and leaf dimensions showed significant increases with higher biochar levels, reinforcing the notion that biochar enhances plant vigor. The increase in petiole and leaf sizes in treatments T4 and T5 is consistent with findings by Laird et al. (2010), who reported that biochar amendments improve water-holding capacity and nutrient exchange, thereby supporting optimal leaf expansion. The significant differences observed in post hoc analysis further suggest that beyond a certain biochar threshold, plants exhibit superior vegetative growth due to improved soil aeration and moisture retention (Xie et al., 2013).
4.2. Stem Length and Structural Development
Stem length followed a similar pattern, with the highest values recorded in T5 at both 35 and 60 days. The significant impact of biochar on stem elongation aligns with previous research indicating that biochar improves root zone aeration and enhances nutrient uptake, leading to more robust plant architecture (Jeffery et al., 2017). Increased stem length in higher biochar treatments may also be linked to improved auxin signaling and cell division, as suggested by Wang et al. (2016), who reported similar findings in biochar-amended vegetable crops.
4.3. Flowering and Reproductive Performance
The number of male and female flowers significantly increased with biochar application, with T5 producing the highest flower counts. These findings corroborate previous studies showing that biochar promotes reproductive success by enhancing soil fertility and microbial symbiosis (Biederman & Harpole, 2013). Increased flowering in biochar-treated plants is likely due to improved phosphorus availability, which plays a crucial role in flower induction and reproductive growth (Glaser et al., 2002). The significant differences observed in post hoc tests further suggest that higher biochar levels create optimal soil conditions for reproductive development, similar to results reported in tomato and cucumber studies (Kammann et al., 2015).
4.4. Biomass Accumulation
Dry leaf weight was significantly higher in biochar-treated plants, with T5 exhibiting the greatest biomass accumulation. This finding aligns with previous research demonstrating that biochar enhances carbon sequestration, organic matter retention, and nutrient cycling, all of which contribute to increased plant biomass (Spokas et al., 2012). The positive correlation between biochar application and dry weight suggests that improved soil conditions support higher photosynthetic efficiency, leading to greater energy allocation toward biomass production (Schmidt et al., 2014).
5. Conclusion
This study clearly demonstrates that biochar amendments substantially enhance both vegetative growth and reproductive performance in zucchini cultivated within coastal agroecosystems prone to salinity stress. Higher biochar application rates, especially at 8 tons per hectare (T5), significantly improved leaf number, petiole and leaf dimensions, stem length, flowering (male and female flowers), and biomass accumulation. These enhancements are primarily attributable to biochar’s capacity to enhance soil structure, nutrient availability, water retention, and microbial activity. These findings theoretically enhance the knowledge of biochar’s intricate involvement in alleviating the negative impacts of saline soils on plant physiological processes. In salt-sensitive crops like zucchini, biochar supports increased plant vigor and reproductive success by encouraging nutrient uptake, cell expansion as well as improved soil aeration. This advances our understanding of how plants and soil interact under environmental stress. From a practical standpoint, this study provides useful information for managing agriculture sustainably along the coast. Incorporating biochar at optimized rates can serve as a cost-effective soil amendment to improve zucchini growth and production in challenging saline environments. This can reduce dependence on chemical fertilizers along with promoting soil health and increasing crop resilience, thereby supporting farmers in improving productivity and sustainability. Future research should focus on the long-term effects of biochar on soil microbial dynamics and nutrient cycling in saline conditions to refine application strategies further. Overall, this study emphasizes the potential of biochar as a sustainable tool for enhancing agricultural productivity and environmental resilience in coastal agroecosystems.
Contributions of the Authors
Md. Touhidul Islam Sourav: Conceptualization, performing field experiment, data collection, data analysis, manuscript writing, Rofiqul Islam Nayem: Conceptualization, data collection, data analysis, manuscript writing, Mohammad Nuruzzaman: Supervision, Review of Manuscript.
Competing interests
The authors have declared that no competing interests exist
References
- Abdelghany, A. E., Dou, Z., Alashram, M. G., Eltohamy, K. M., Elrys, A. S., Liu, X., Wu, Y., Cheng, M., Fan, J., & Zhang, F. (2023). The joint application of biochar and nitrogen enhances fruit yield, quality and water-nitrogen productivity of water-stressed greenhouse tomato under drip fertigation. Agricultural Water Management, 290, 108605. [CrossRef]
- Agegnehu, G., Nelson, P. N., & Bird, M. I. (2016). The role of biochar and compost in improving soil quality and crop performance: A review. Applied Soil Ecology, 105, 1-29.
- Amin, A. E.-E. A. Z., & Eissa, M. A. (2017). Biochar effects on nitrogen and phosphorus use efficiencies of zucchini plants grown in a calcareous sandy soil. Journal of Soil Science and Plant Nutrition, 17(4), 912–921. [CrossRef]
- Antonangelo, J. A., Sun, X., & Eufrade-Junior, H. de J. (2025). Biochar impact on soil health and tree-based crops: a review. Biochar, 7(1). [CrossRef]
- ARTi. (2024, July 22). A Boost to Soil Vitality: How Biochar Supports Mycorrhizal Networks. ARTi. https://www.arti.com/a-boost-to-soil-vitality-how-biochar-supports-mycorrhizal-networks/.
- Ashrafuzzaman, M., Artemi, C., Santos, F. D., & Schmidt, L. (2022). Current and Future Salinity Intrusion in the South-Western Coastal Region of Bangladesh. Spanish Journal of Soil Science, 12. [CrossRef]
- Atta, K., Mondal, S., Shouvik Gorai, Singh, A., Kumari, A., Ghosh, T. K., Roy, A., Suryakant Hembram, Gaikwad, D. J., Mondal, S. S., Bhattacharya, S., Uday Chand Jha, & Jespersen, D. (2023). Impacts of salinity stress on crop plants: improving salt tolerance through genetic and molecular dissection. Frontiers in Plant Science, 14. [CrossRef]
- A. Peñaranda, Payan, M. C., Garrido, D., P. Gómez, & M. Jamilena. (2007). Production of fruits with attached flowers in zucchini squash is correlated with the arrest of maturation of female flowers. The Journal of Horticultural Science and Biotechnology, 82(4), 579–584. [CrossRef]
- Biederman, L. A., & Harpole, W. S. (2013). Biochar and its effects on plant productivity and nutrient cycling: A meta-analysis. GCB Bioenergy, 5(2), 202-214.
- Bolan, S., Sharma, S., Mukherjee, S., Kumar, M., Ch. Srinivasa Rao, K.C. Nataraj, Singh, G., Ajayan Vinu, Bhowmik, A., Sharma, H., El-Naggar, A., Chang, S. X., Hou, D., Jörg Rinklebe, Wang, H., Kadambot H.M. Siddique, Abbott, L. K., Kirkham, M. B., & Bolan, N. (2024). Biochar modulating soil biological health: A review. Science of the Total Environment, 914, 169585–169585.
- Das, S., & Islam, A. (2018). EFFECTS OF SALINITY ON GERMINATION AND SEEDLING GROWTH OF LENTIL (LENS CULINARIS MEDIK) VARIETIES IN BANGLADESH. Barishal University Journal Part, 1(1&2), 141–151.
- Chiaranunt, P., & White, J. F. (2023). Plant Beneficial Bacteria and Their Potential Applications in Vertical Farming Systems. Plants, 12(2), 400. [CrossRef]
- Cucurbita pepo - Zucchini. (2023). Gardenia. https://www.gardenia.net/plant/cucurbita-pepo-zucchini.
- Cong, M., Hu, Y., Sun, X., Yan, H., Yu, G., Tang, G., Chen, S.-H., Wang, X., & Hu, J. (2023). Long-term effects of biochar application on the growth and physiological characteristics of maize. Frontiers in Plant Science, 14. [CrossRef]
- Dey, S., Purakayastha, T. J., Sarkar, B., Rinklebe, J., Kumar, S., Chakraborty, R., Datta, A., Lal, K., & Shivay, Y. S. (2023). Enhancing cation and anion exchange capacity of rice straw biochar by chemical modification for increased plant nutrient retention. Science of the Total Environment, 886, 163681.
- El-Ramady, H., József Prokisch, Mansour, H., Bayoumi, Y. A., Shalaby, T. A., Veres, S., & Brevik, E. C. (2024). Review of Crop Response to Soil Salinity Stress: Possible Approaches from Leaching to Nano-Management. Soil Systems, 8(1), 11–11. [CrossRef]
- Glaser, B., Lehmann, J., & Zech, W. (2002). Ameliorating physical and chemical properties of highly weathered soils in the tropics with biochar. Biology and Fertility of Soils, 35(4), 219-230.
- Hiba Ghazouani, Ibrahimi, K., Roua Amami, Sondes Helaoui, Iteb Boughattas, Sabri Kanzari, Milham, P., Sabah Ansar, & Sher, F. (2023). Integrative effect of activated biochar to reduce water stress impact and enhance antioxidant capacity in crops. The Science of the Total Environment, 905, 166950–166950. [CrossRef]
- Hossain, M. Z., Bahar, M. M., Sarkar, B., Donne, S. W., Ok, Y. S., Palansooriya, K. N., Kirkham, M. B., Chowdhury, S., & Bolan, N. (2020). Biochar and its importance on nutrient dynamics in soil and plant. Biochar, 2(4), 379–420. [CrossRef]
- Hu, Y., Sun, B., Wu, S., Feng, H., Gao, M., Zhang, B., & Liu, Y. (2021). After-effects of straw and straw-derived biochar application on crop growth, yield, and soil properties in wheat (Triticum aestivum L.) -maize (Zea mays L.) rotations: A four-year field experiment. Science of the Total Environment, 780, 146560. [CrossRef]
- Igalavithana, A., Ok, Y., Niazi, N., Rizwan, M., Al-Wabel, M., Usman, A., Moon, D., & Lee, S. (2017). Effect of Corn Residue Biochar on the Hydraulic Properties of Sandy Loam Soil. Sustainability, 9(2), 266. [CrossRef]
- Jia, J., Li, B., Chen, Z., Xie, Z., & Xiong, Z. (2012). Effects of biochar application on vegetable production and emissions of N2O and CH4. Soil Science and Plant Nutrition, 58(4), 503–509. [CrossRef]
- Jr. Dennis F. (2003, January 1). Flowering, pollination and fruit set and development. [CrossRef]
- Jeffery, S., Verheijen, F. G., van der Velde, M., & Bastos, A. C. (2017). A quantitative review of the effects of biochar application on soil fertility, plant growth, and nutrient cycling. Plant and Soil, 395(1-2), 1-23.
- Kabir, E., Kim, K.-H., & Kwon, E. E. (2023). Biochar as a tool for the improvement of soil and environment. Frontiers in Environmental Science, 11. [CrossRef]
- Kammann, C. I., Linsel, S., Gößling, J. W., & Koyro, H. W. (2015). Influence of biochar on drought tolerance in Chenopodium quinoa Willd and its interaction with plant salt tolerance. Frontiers in Plant Science, 6, 583.
- Khatun, M., Hossain, M., & Jagadish Chandra Joardar. (2023). BIOCHAR AS A POTENTIAL SOIL CONDITIONER IN SALINE PRONE COASTAL AREA OF BANGLADESH. Khulna University Studies, Special Issue ISFMRT, 1–10. [CrossRef]
- Khanam, M., Nawal, N., Hasanuzzaman, M., Karim, M., & Rahman, A. (2022). Response of Biochar on Growth and Yield of Aman Rice Under Salt Stress. Bangladesh Agronomy Journal, 25(1), 105–113. [CrossRef]
- Khusnur Jahan Shapna, Li, J., Kabir, M. H., Salam, M. A., Saifullah Khandker, & Hossain, M. L. (2024). Strengthening adaptation in coastal Bangladesh: community-based approaches for sustainable agriculture and water management. Disaster Prevention and Resilience, 3(2). [CrossRef]
- Laird, D. A., Fleming, P., Wang, B., Horton, R., & Karlen, D. L. (2010). Biochar impact on nutrient leaching from a Midwestern agricultural soil. Geoderma, 158(3-4), 436-442.
- Lee, X., Yang, F., Xing, Y., Huang, Y., Xu, L., Liu, Z., Holtzman, R., Kan, I., Li, Y., Zhang, L., & Zhou, H. (2022). Use of biochar to manage soil salts and water: Effects and mechanisms. CATENA, 211, 106018–106018. [CrossRef]
- Lehmann, J., & Joseph, S. (2015). Biochar for environmental management: An introduction. Routledge.
- Machado, R., & Serralheiro, R. (2017). Soil Salinity: Effect on Vegetable Crop Growth. Management Practices to Prevent and Mitigate Soil Salinization. Horticulturae, 3(2), 30. [CrossRef]
- Masud, M. A. A., Shin, W. S., Sarker, A., Septian, A., Das, K., Deepo, D. M., Iqbal, M. A., Islam, A. R. M. T., & Malafaia, G. (2023). A critical review of sustainable application of biochar for green remediation: Research uncertainty and future directions. Science of the Total Environment, 904, 166813. [CrossRef]
- Mukherjee, A., & Lal, R. (2013). Biochar impacts on soil physical properties and greenhouse gas emissions. Agronomy, 3(2), 313-339.
- Naeem, M. B., Jahan, S., Rashid, A., Shah, A. A., Raja, V., & El-Sheikh, M. A. (2024). Improving maize yield and drought tolerance in field conditions through activated biochar application. Scientific Reports, 14(1). [CrossRef]
- Nair, V. D., Nair, P. K. R., Dari, B., Freitas, A. M., Chatterjee, N., & Pinheiro, F. M. (2017). Biochar in the Agroecosystem–Climate-Change–Sustainability Nexus. Frontiers in Plant Science, 8. [CrossRef]
- Nayem, R. I., Sourav, Md. T. I., & Nuruzzaman, M. (2025). A comparative analysis of biochar’s role in enhancing late-season growth and yield of cruciferous vegetables in coastal Bangladesh. [CrossRef]
- Rofiqul Islam Nayem, Jannatul Ferdous Choity, & Nuruzzaman, M. (2024). Impact of Biochar on Growth and Productivity of Broccoli in Coastal areas. Journal of the Bangladesh Agricultural University, 22(4), 432–442. [CrossRef]
- Schmidt, H. P., Taylor, P., & Kammann, C. (2014). Biochar in agriculture – A systematic review of 26 global field trials. Agriculture, 4(2), 320-337.
- Sheffield, S. B., Hoefer, T. A., & Petersen, J. E. (2024). Biochar has positive but distinct impacts on root, shoot, and fruit production in beans, tomatoes, and willows. Frontiers in Sustainable Food Systems, 8. [CrossRef]
- Simiele, M., Argentino, O., Baronti, S., Scippa, G. S., Chiatante, D., Terzaghi, M., & Montagnoli, A. (2022). Biochar Enhances Plant Growth, Fruit Yield, and Antioxidant Content of Cherry Tomato (Solanum lycopersicum L.) in a Soilless Substrate. Agriculture, 12(8), 1135. [CrossRef]
- Singh Yadav, S. P., Bhandari, S., Bhatta, D., Poudel, A., Bhattarai, S., Yadav, P., Ghimire, N., Paudel, P., Paudel, P., Shrestha, J., & Oli, B. (2023). Biochar application: A sustainable approach to improve soil health. Journal of Agriculture and Food Research, 11, 100498. [CrossRef]
- Sun, M., Fan, S. X., & Zhang, N. (2025). Effects of biochar combined with the application of plant ash and effective microorganisms on the soil in the vegetable facility. Scientific Reports, 15(1). [CrossRef]
- Spokas, K. A., Novak, J. M., & Stewart, C. E. (2012). Qualitative analysis of volatile organic compounds on biochar. Chemosphere, 85(5), 869-882.
- Taverniti, D. (2023, May 13). Biochar Water Retention and Soil Benefits - CharGrow. CharGrow. https://char-grow.com/biochar-water-retention-and-soil-benefits.
- Uçarlı, C. (2020). Effects of Salinity on Seed Germination and Early Seedling Stage. In www.intechopen.com. IntechOpen. https://www.intechopen.com/chapters/73200 (Original work published 2020).
- Wang, J., Xiong, Z., & Kuzyakov, Y. (2016). Biochar stability in soil: Meta-analysis of decomposition and priming effects. GCB Bioenergy, 8(3), 512-523.
- Xie, T., Reddy, K. R., Wang, C., & Yargicoglu, E. (2013). Effects of biochar amendment on soil microbial activity and nutrient availability. Environmental Science & Technology, 47(19), 11256-11263.
- Yordanova, M., Petrova, V., & Nikolova, T. (2020). The effects of biochar on the growth and yield of zucchini (Cucurbita pepo var. Giraumontia Filov). Scientific Papers. Series B, Horticulture, 64(2).
- Zou, Z., Mi, W., Li, X., Hu, Q., Zhang, L., Zhang, L., Fu, J., Li, Z., Han, W., & Yan, P. (2023). Biochar application method influences root growth of tea (Camellia sinensis L.) by altering soil biochemical properties. Scientia Horticulturae, 315, 111960–111960. [CrossRef]
Figure 1.
Influence of varying wood biochar application rates on leaf count at 35 and 60 DAS. Treatments: T1 = Control, T2 = 2 t/ha, T3 = 4 t/ha, T4 = 6 t/ha, T5 = 8 t/ha. Results represent mean values of three replicates ± SEM. Distinct letters (A, B, C, D) denote statistically significant differences (p < 0.05) compared to the control.
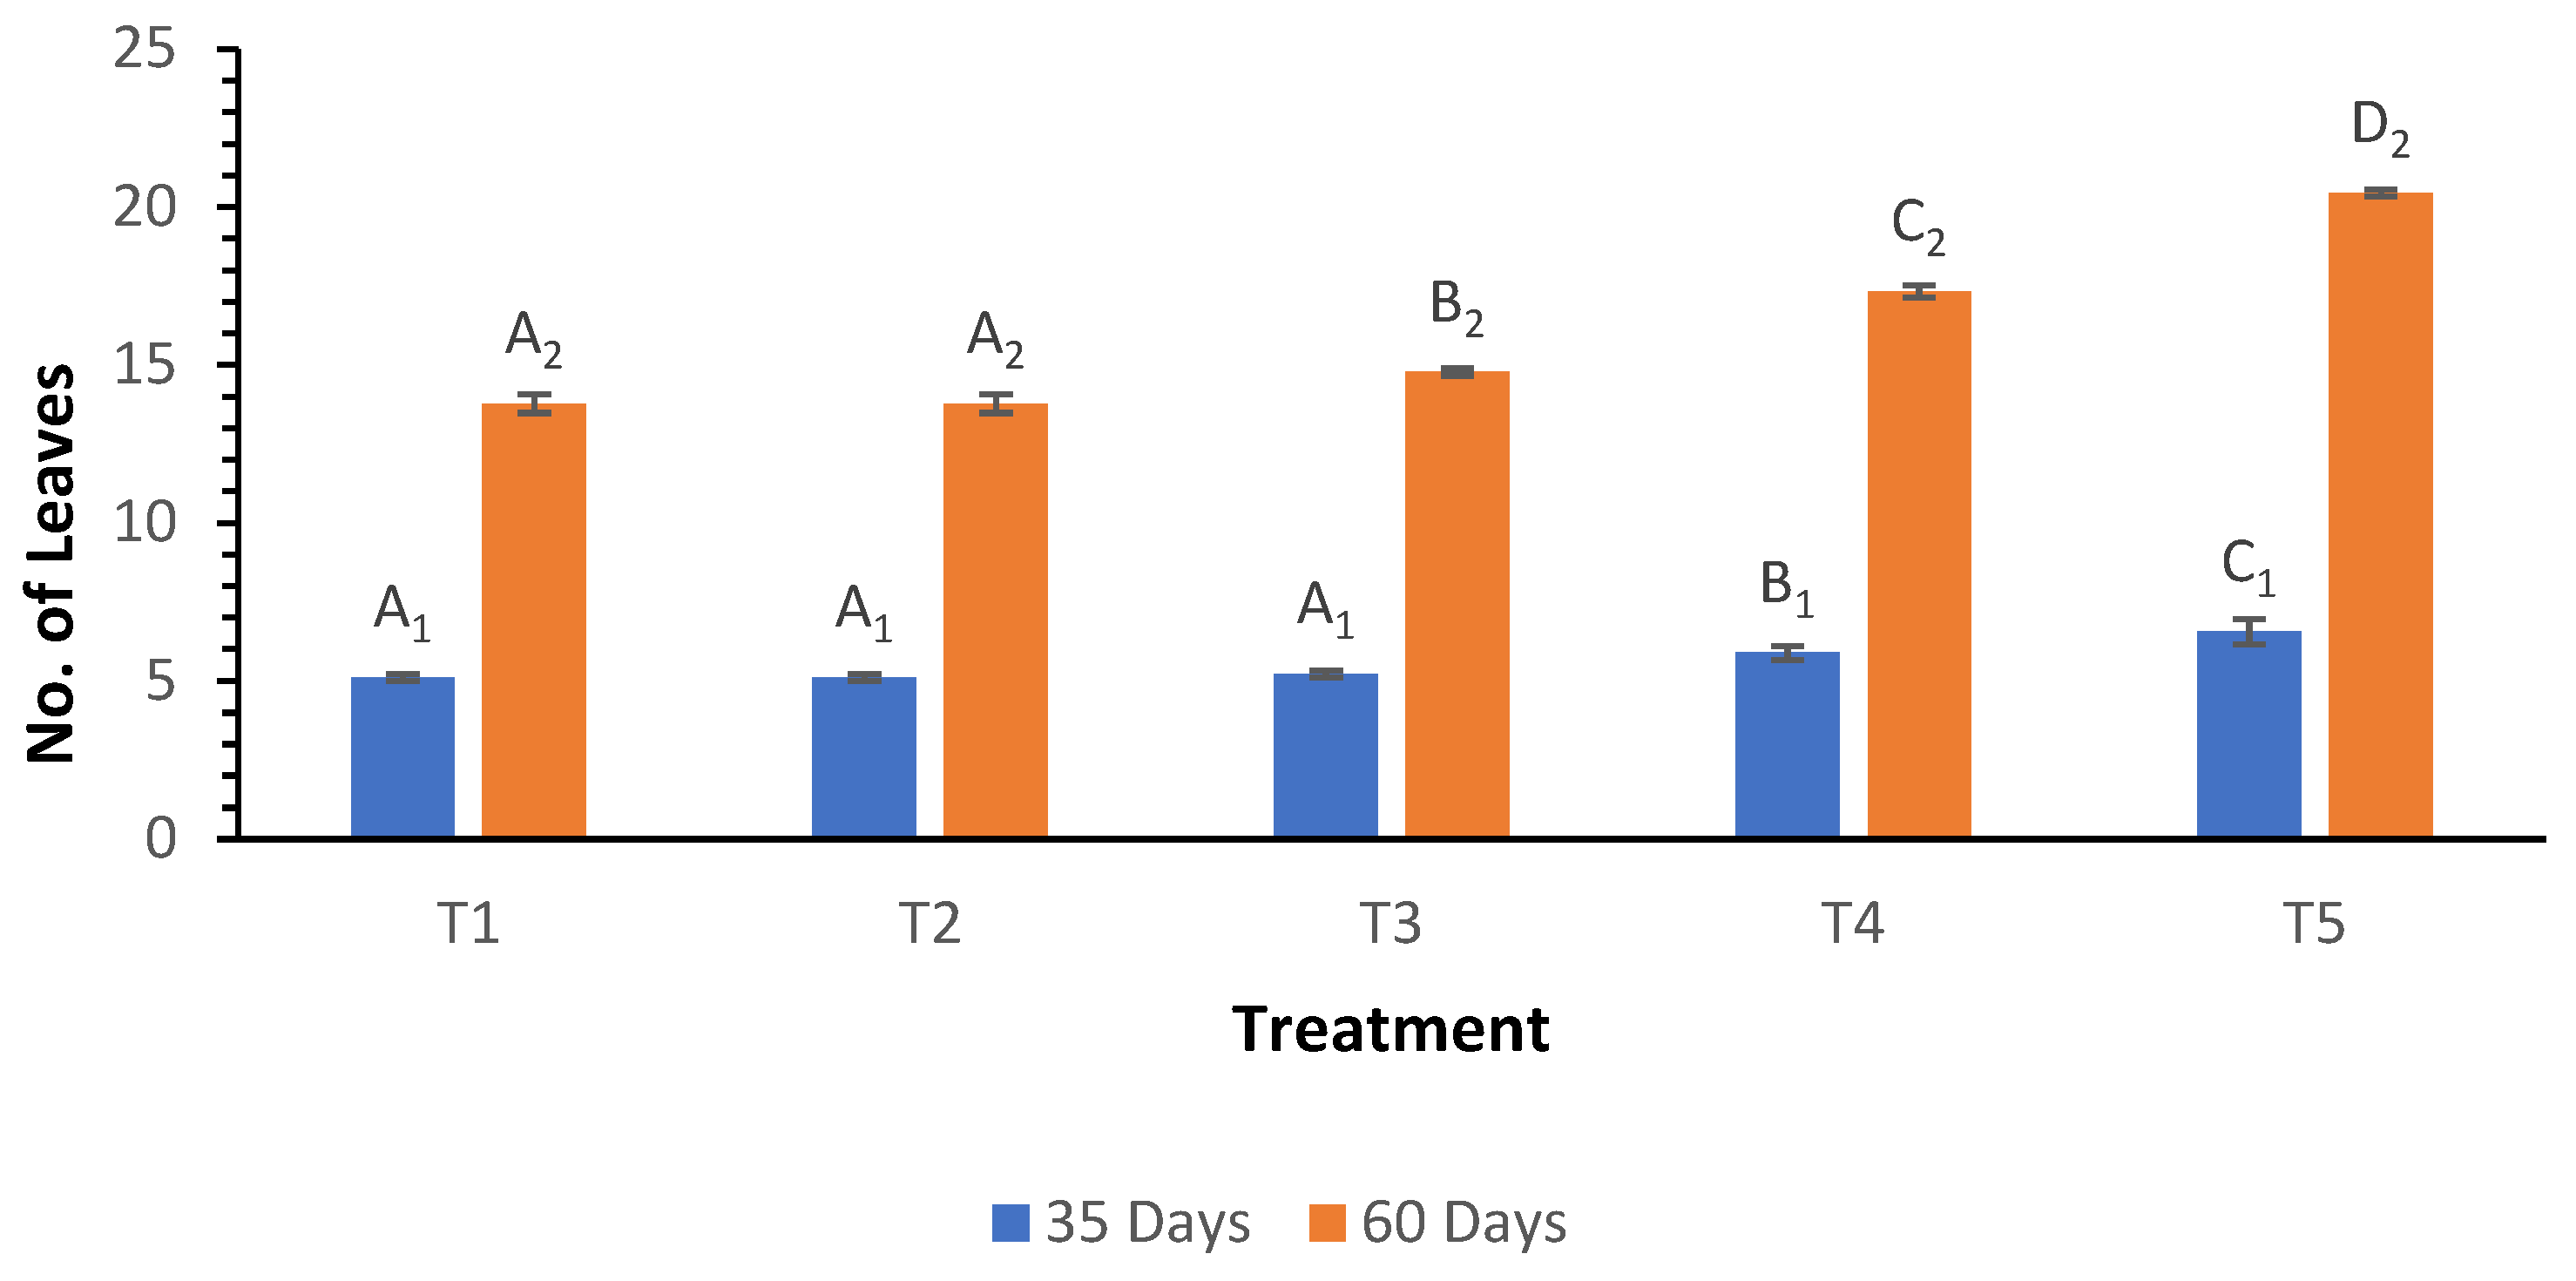
Figure 2.
Influence of varying wood biochar application rates on petiole length at 35 and 60 DAS. Treatments: T1 = Control, T2 = 2 t/ha, T3 = 4 t/ha, T4 = 6 t/ha, T5 = 8 t/ha. Results represent mean values of three replicates ± SEM. Distinct letters (A, B, C, D) denote statistically significant differences (p < 0.05) compared to the control.
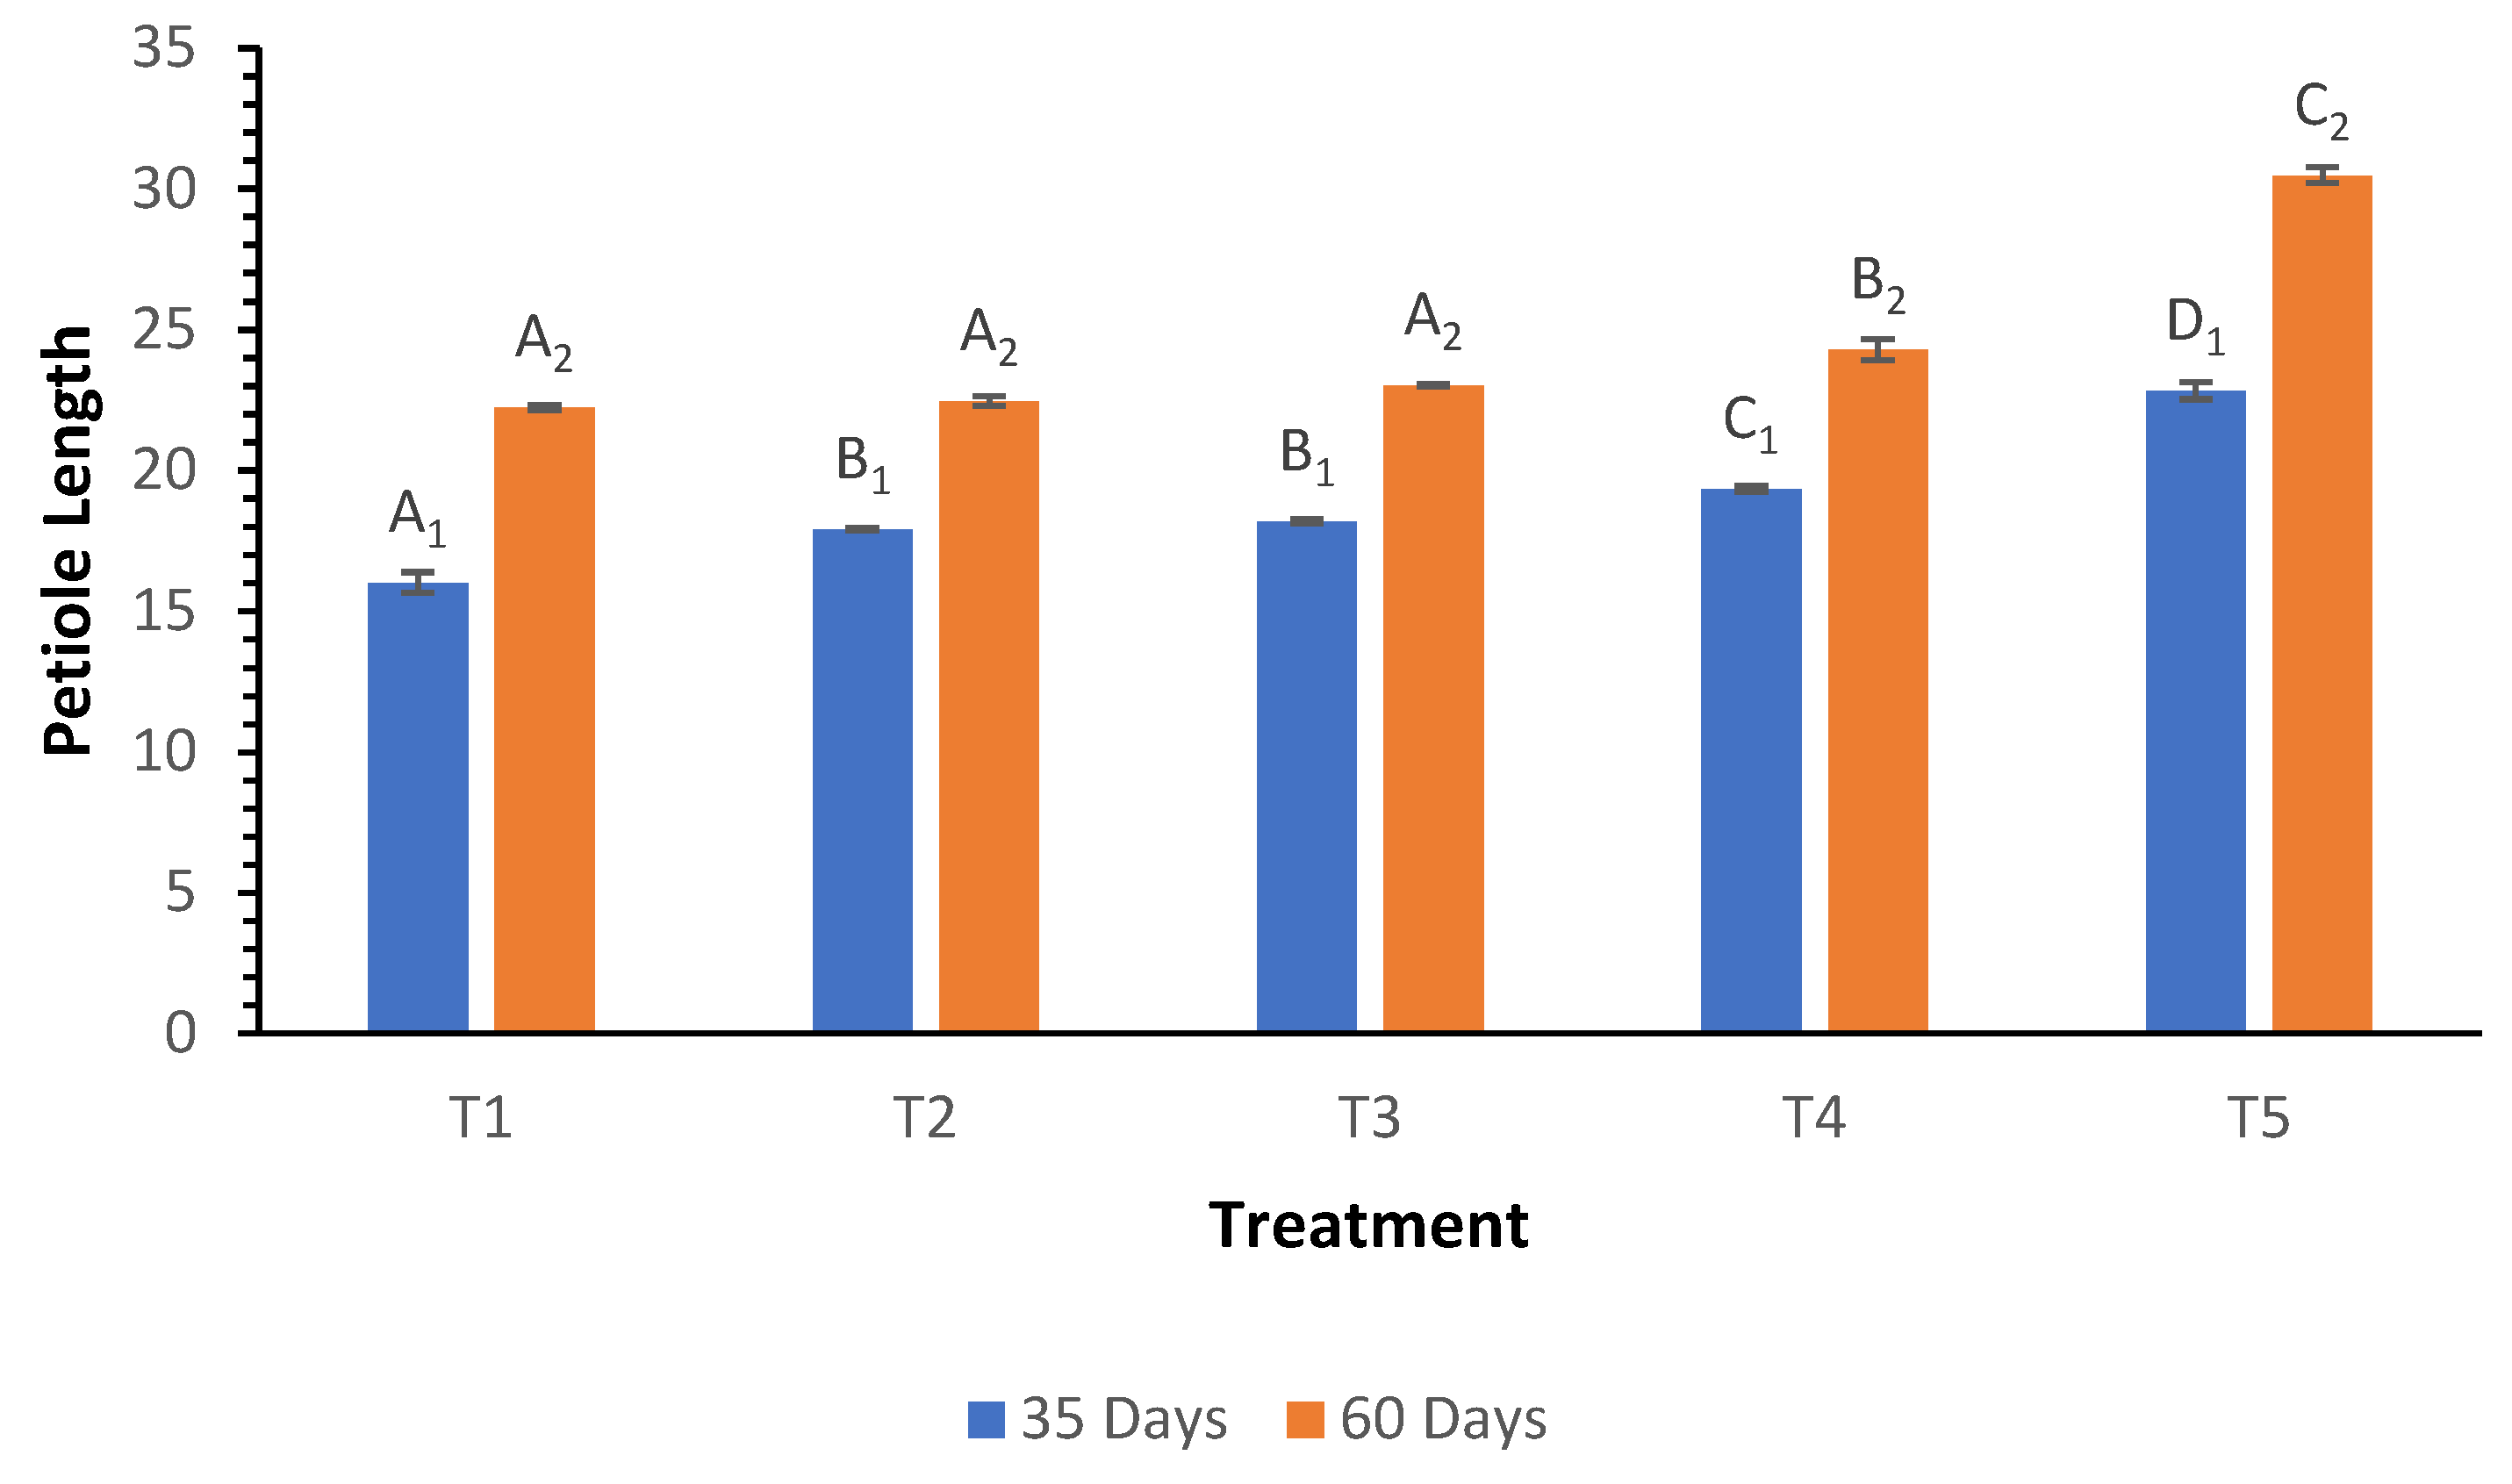
Figure 3.
Influence of varying wood biochar application rates on leaf length at 35 and 60 DAS. Treatments: T1 = Control, T2 = 2 t/ha, T3 = 4 t/ha, T4 = 6 t/ha, T5 = 8 t/ha. Results represent mean values of three replicates ± SEM. Distinct letters (A, B, C, D) denote statistically significant differences (p < 0.05) compared to the control.
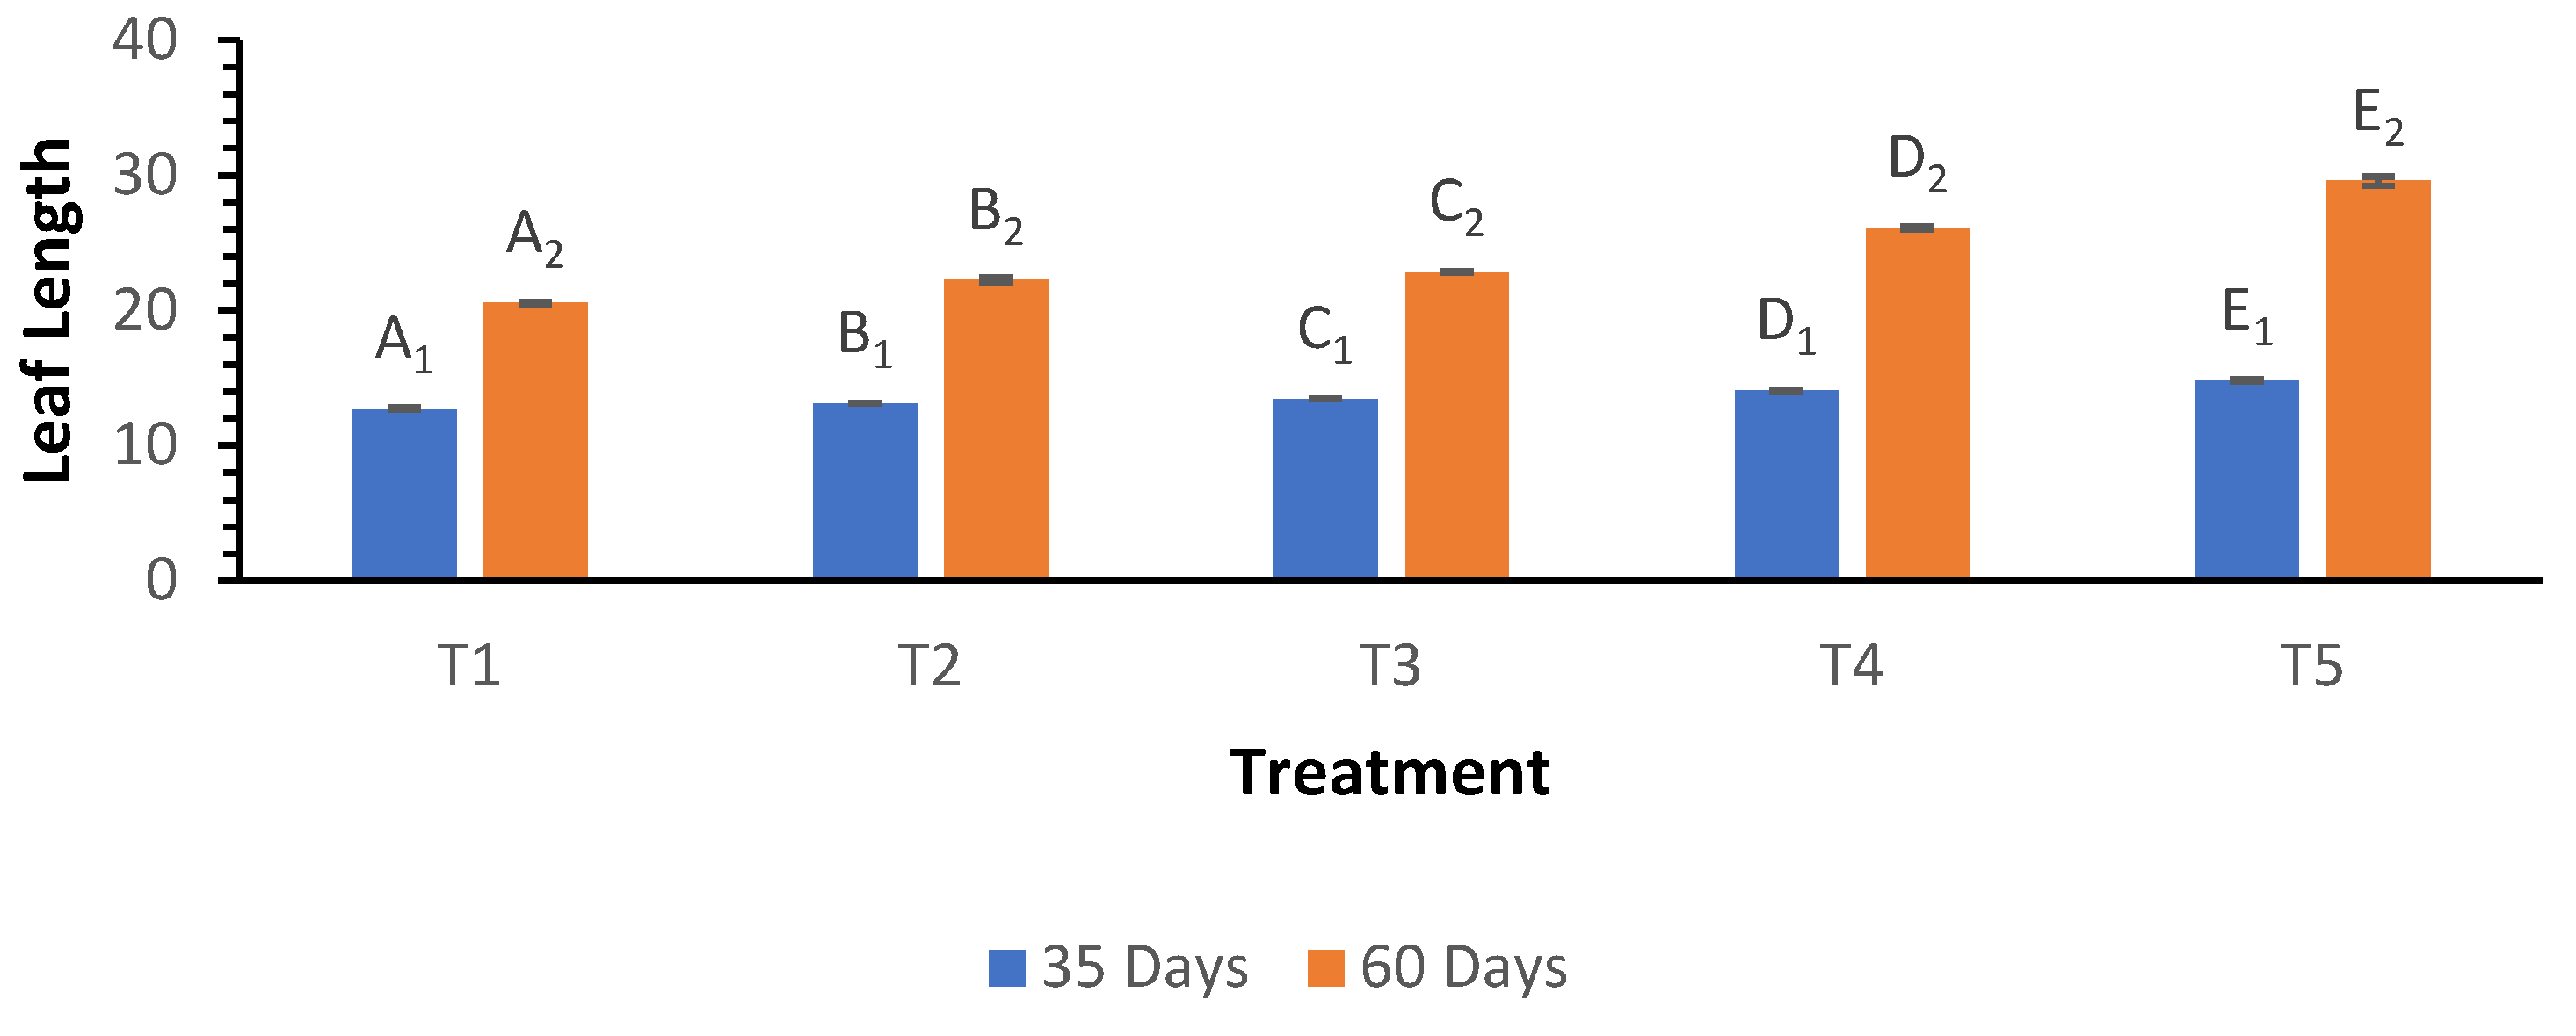
Figure 4.
Influence of varying wood biochar application rates on leaf width at 35 and 60 DAS. Treatments: T1 = Control, T2 = 2 t/ha, T3 = 4 t/ha, T4 = 6 t/ha, T5 = 8 t/ha. Results represent mean values of three replicates ± SEM. Distinct letters (A, B, C, D) denote statistically significant differences (p < 0.05) compared to the control.
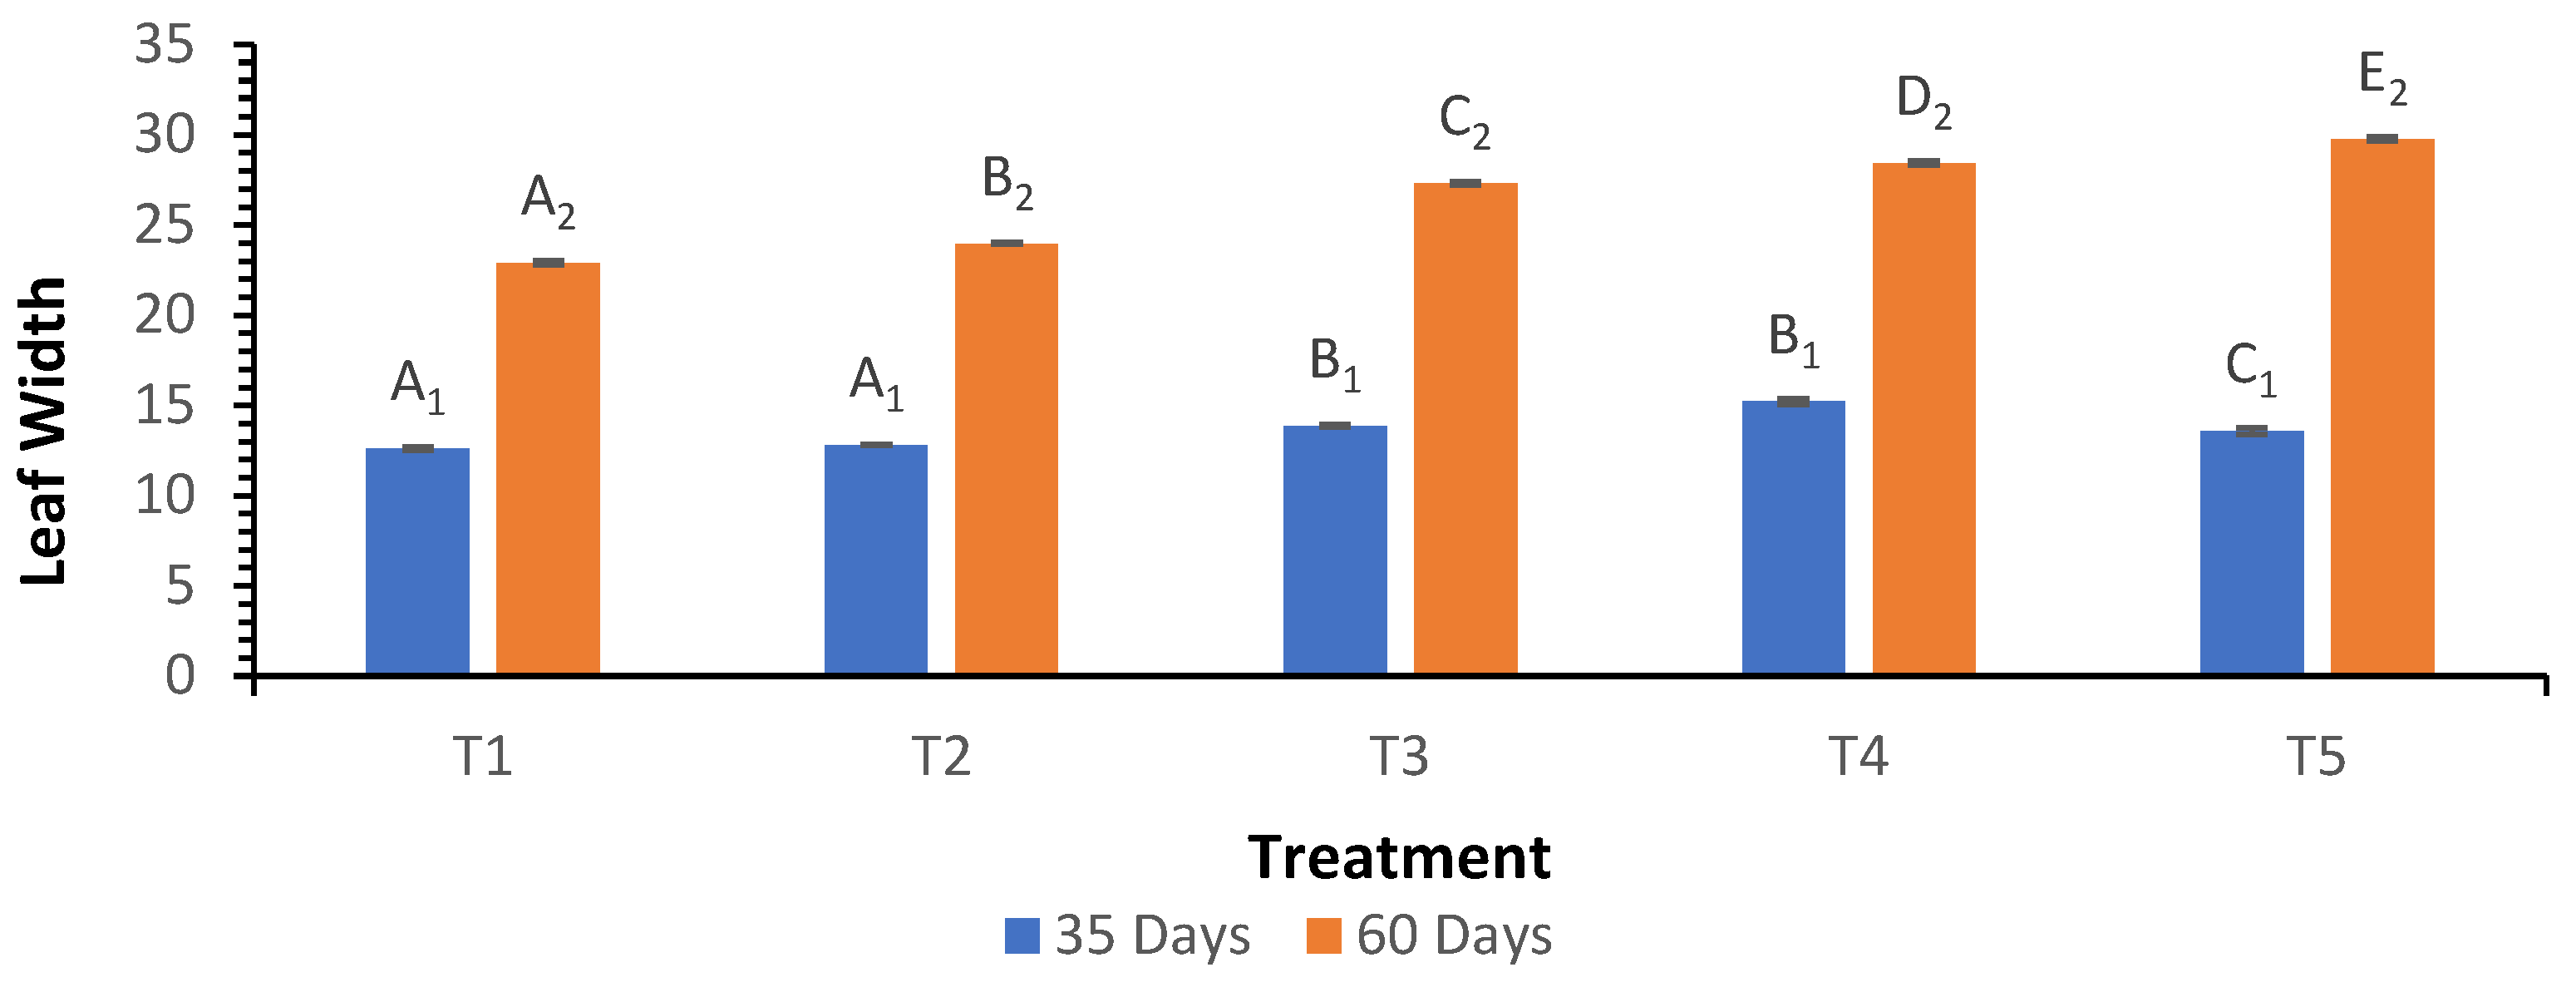
Figure 5.
Influence of varying wood biochar application rates on stem length at 35 and 60 DAS. Treatments: T1 = Control, T2 = 2 t/ha, T3 = 4 t/ha, T4 = 6 t/ha, T5 = 8 t/ha. Results represent mean values of three replicates ± SEM. Distinct letters (A, B, C, D) denote statistically significant differences (p < 0.05) compared to the control.
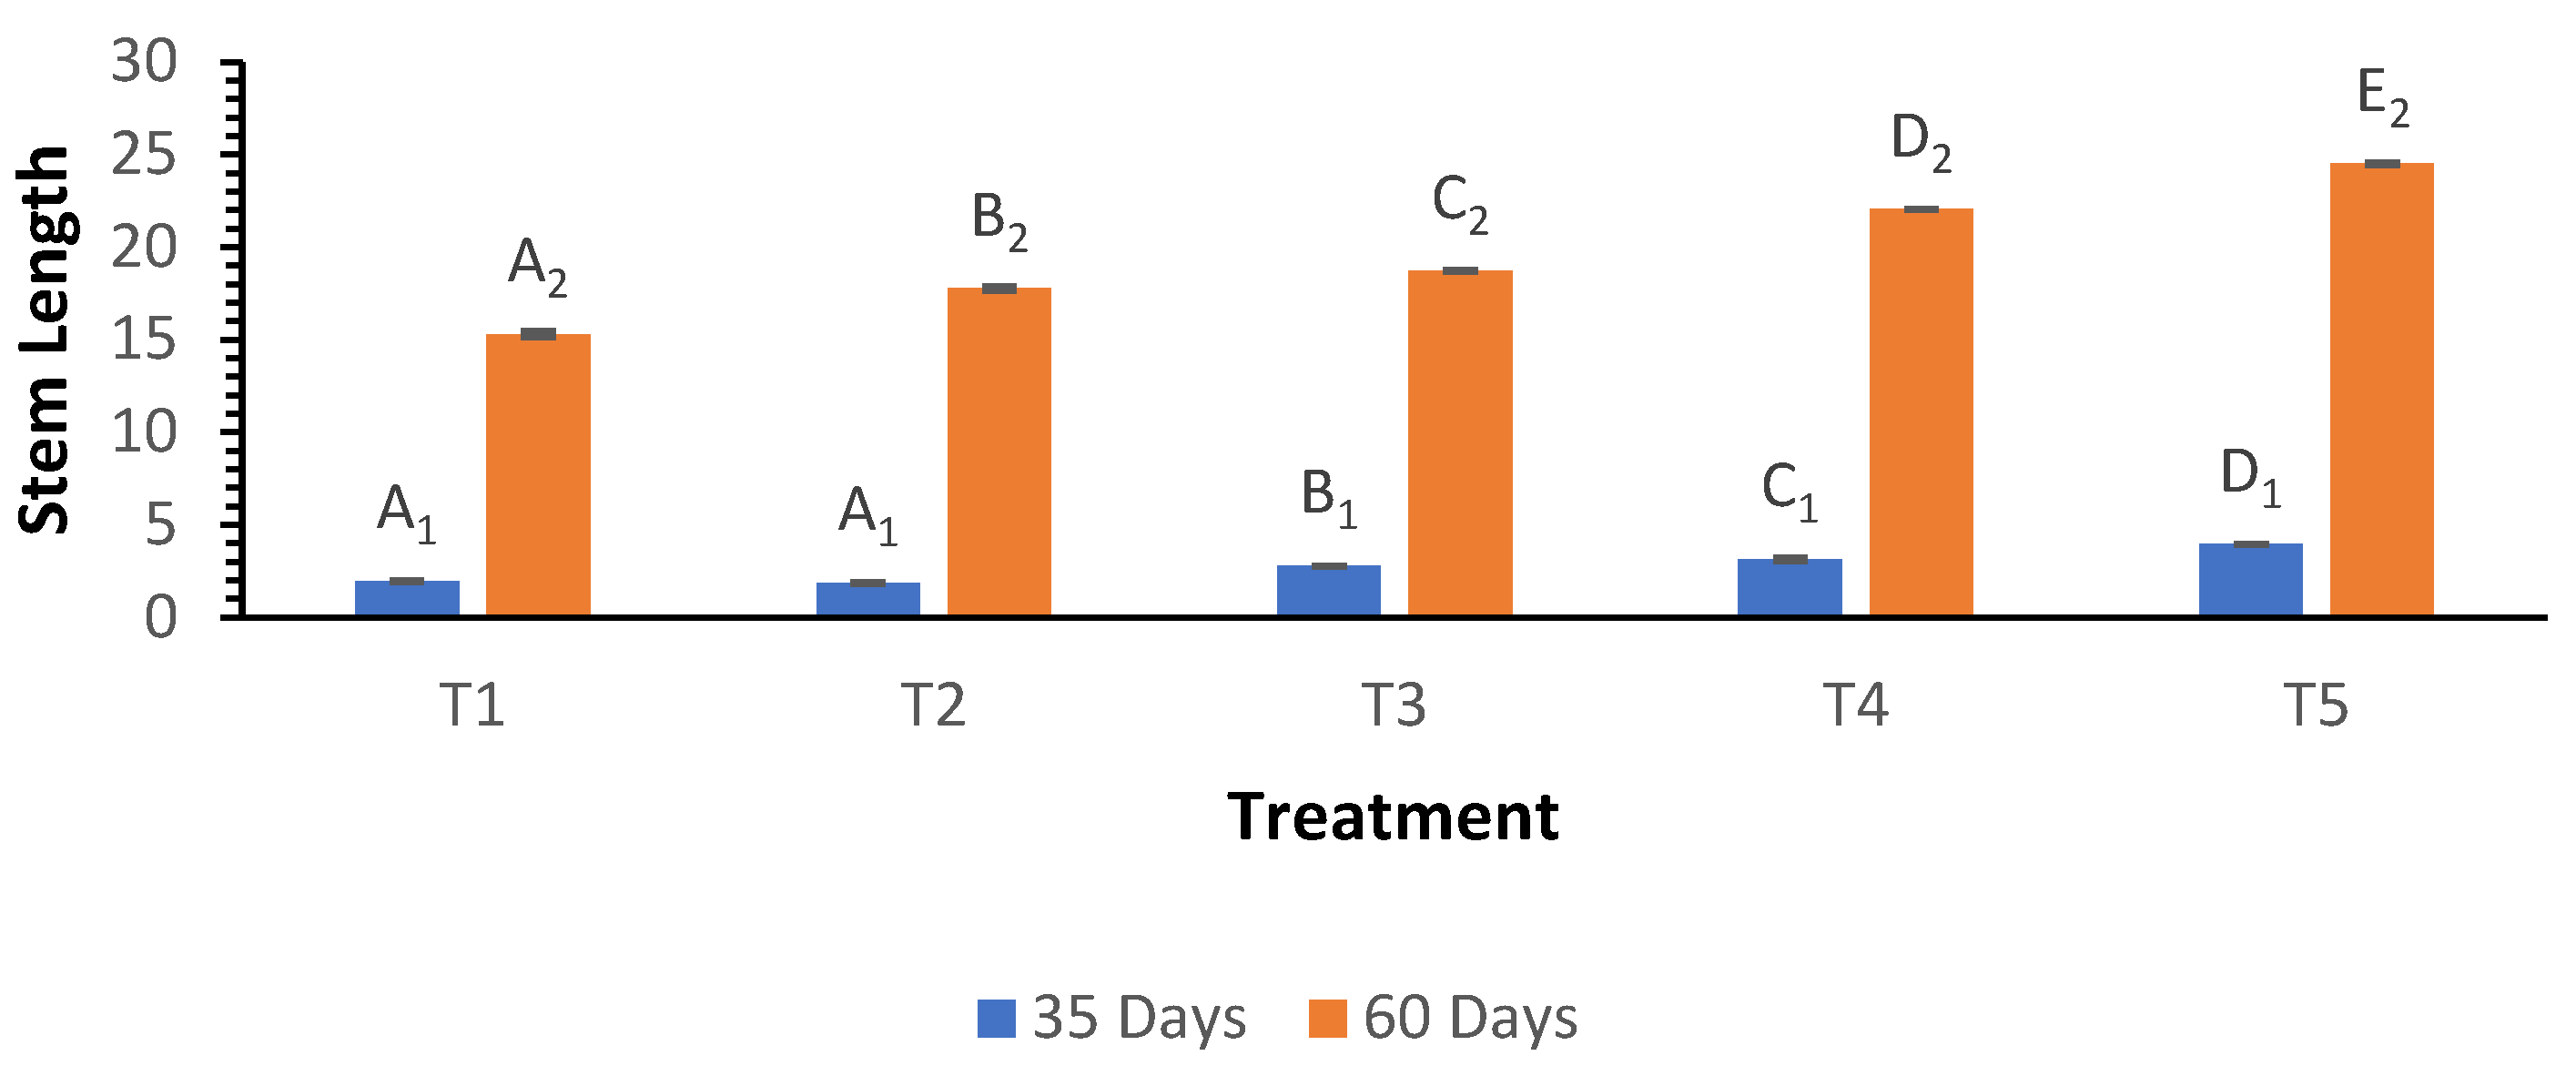
Figure 6.
Influence of varying wood biochar application rates on the number of male flowers. Treatments: T1 = Control, T2 = 2 t/ha, T3 = 4 t/ha, T4 = 6 t/ha, T5 = 8 t/ha. Results represent mean values of three replicates ± SEM. Distinct letters (A, B, C, D) denote statistically significant differences (p < 0.05) compared to the control.
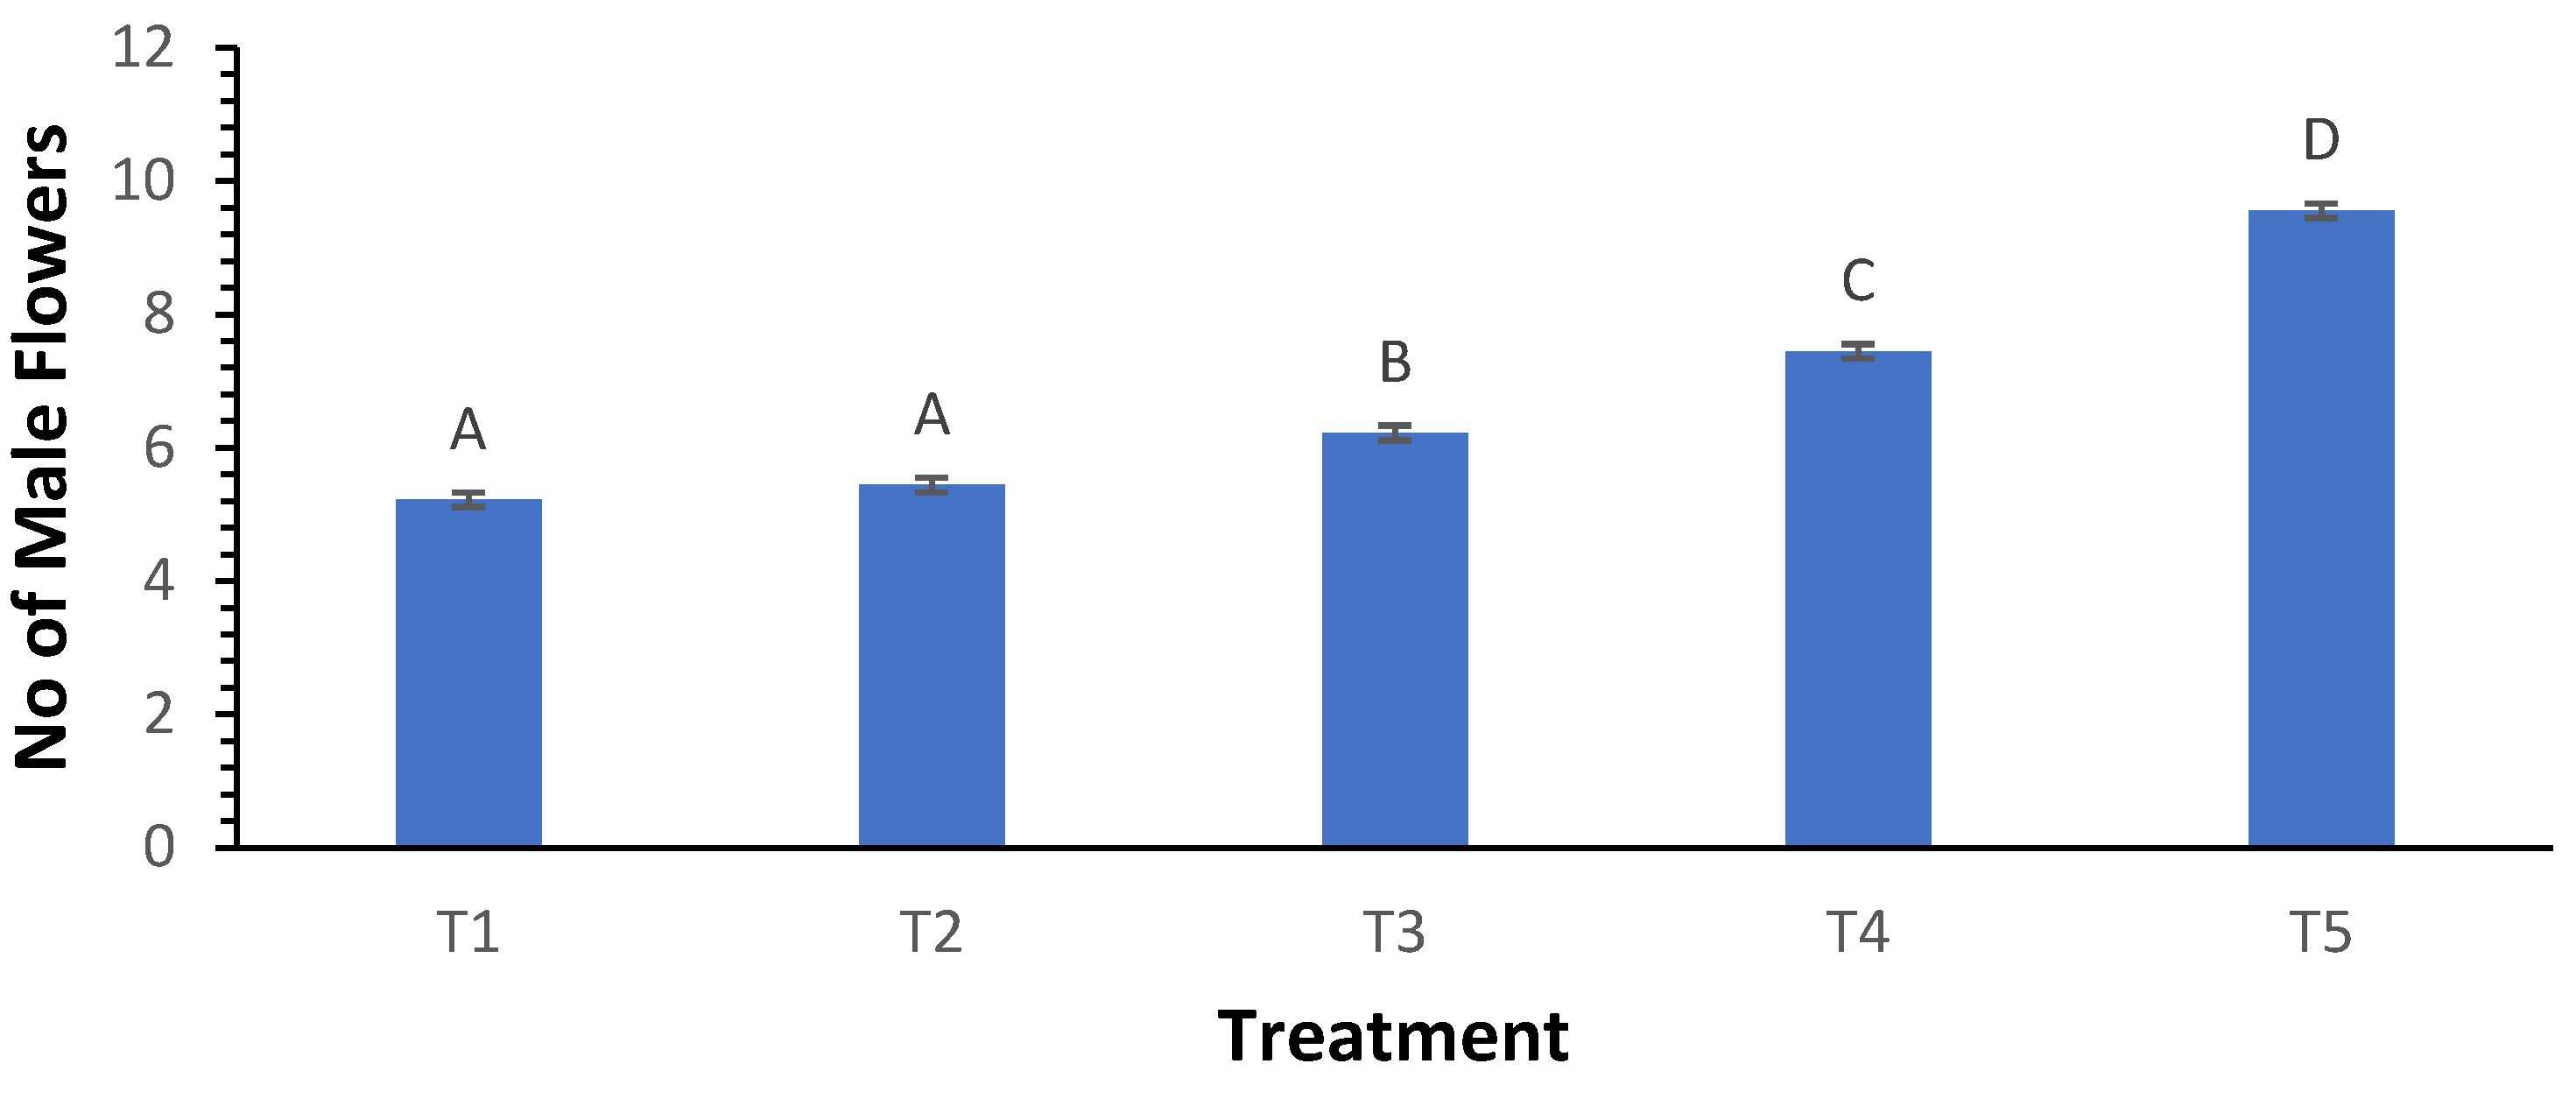
Figure 7.
Influence of varying wood biochar application rates on the number of female flowers. Treatments: T1 = Control, T2 = 2 t/ha, T3 = 4 t/ha, T4 = 6 t/ha, T5 = 8 t/ha. Results represent mean values of three replicates ± SEM. Distinct letters (A, B, C, D) denote statistically significant differences (p < 0.05) compared to the control.
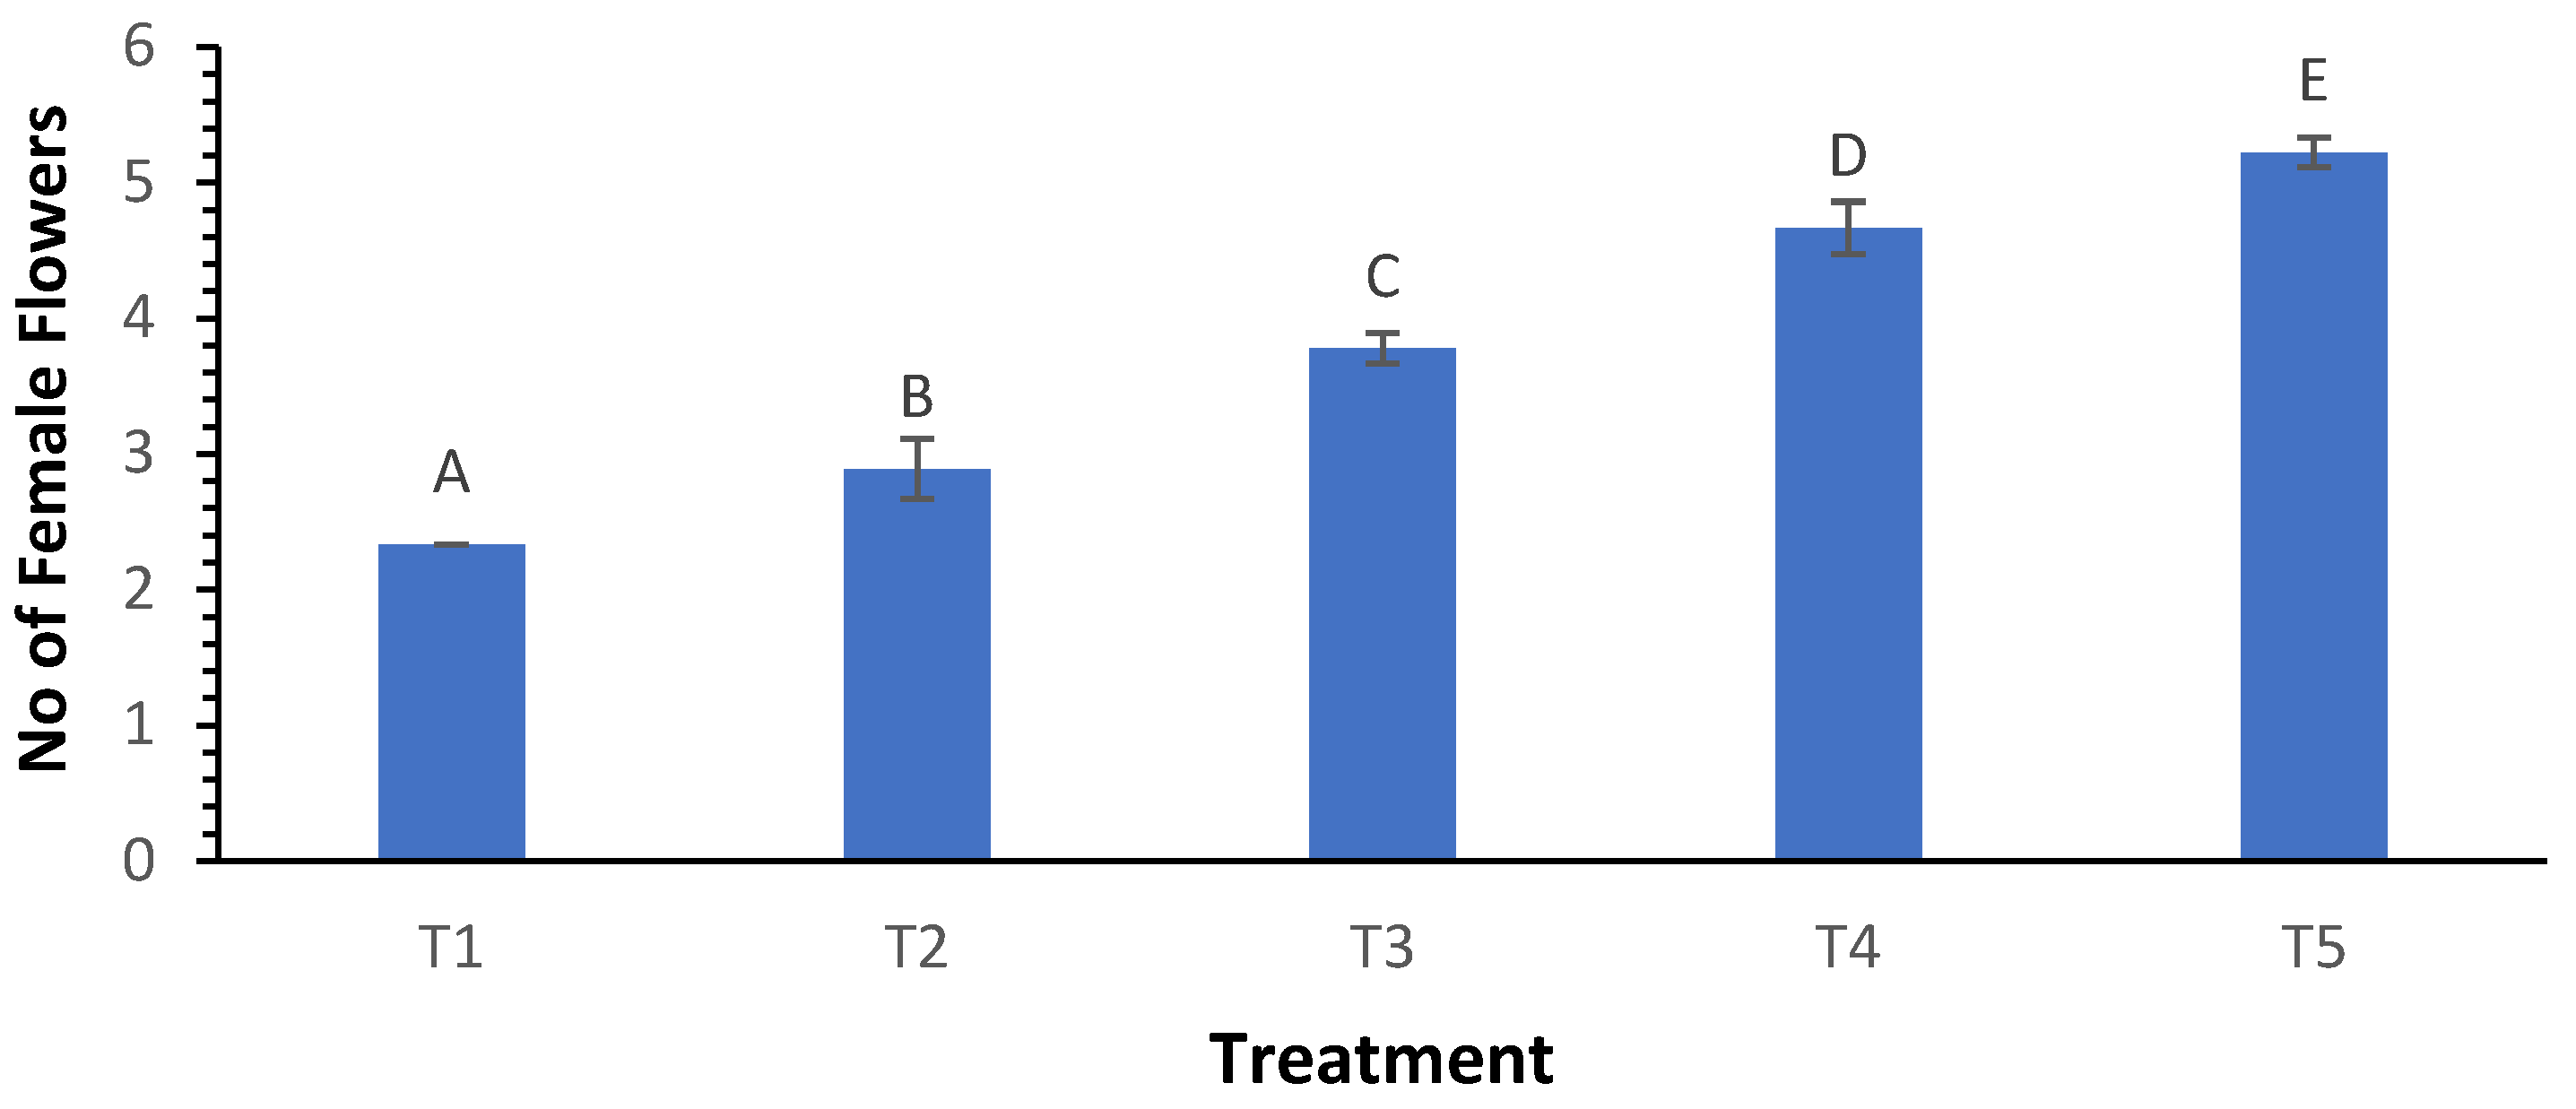
Figure 8.
Influence of varying wood biochar application rates on dry weight of leaves. Treatments: T1 = Control, T2 = 2 t/ha, T3 = 4 t/ha, T4 = 6 t/ha, T5 = 8 t/ha. Results represent mean values of three replicates ± SEM. Distinct letters (A, B, C, D) denote statistically significant differences (p < 0.05) compared to the control.
Disclaimer/Publisher’s Note: The statements, opinions and data contained in all publications are solely those of the individual author(s) and contributor(s) and not of MDPI and/or the editor(s). MDPI and/or the editor(s) disclaim responsibility for any injury to people or property resulting from any ideas, methods, instructions or products referred to in the content. |
© 2025 by the authors. Licensee MDPI, Basel, Switzerland. This article is an open access article distributed under the terms and conditions of the Creative Commons Attribution (CC BY) license (http://creativecommons.org/licenses/by/4.0/).
Copyright: This open access article is published under a Creative Commons CC BY 4.0 license, which permit the free download, distribution, and reuse, provided that the author and preprint are cited in any reuse.


