
Submitted:
22 July 2025
Posted:
25 July 2025
You are already at the latest version
Abstract
This research investigates the quantitative associations between GDP together with GDP squared while integrating energy consumption and financial accessibility and urbanization to analyze their joint effects on the Load Capacity Factor (LCF) in the United States using an ARDL bounds testing technique within the LCC hypothesis framework. The examination utilizes time series data from 1996 to 2022 to test variable stationarity using several unit root assessments. The results from ARDL demonstrate economic growth together with financial accessibility create positive influences on LCF thus supporting environmental sustainability over longer periods. Moreover, environmental quality becomes worse as economies grow and energy usage increases and rapid urbanization during short-term periods. Multiple confirmation tests including FMOLS, DOLS and CCR techniques together with various diagnostic evaluations enhance the research validity. The study confirms environmental degradation occurs due to urban expansion alongside temporary economic growth and increasing electricity needs based on carbon-intensive fuels which generate pollutants while speeding up world temperature increases. Furthermore, the study utilized ARIMA method to estimate LCF economic trend between 2023 and 2040. These outcomes emphasize the necessity of exploring the simultaneous relationships between economic advancement and energy usage and urban growth patterns in environmental governance in USA.
Keywords:
load capacity factor
; financial accessibility
; energy consumption
; machine learning
; United States
1. Introduction
The term "environmental sustainability"
has gained prominence worldwide due to the escalating concerns posed by global
warming in the 21st century. The actions of humans, manufacturing, agriculture,
and transportation continue to emit substantial amounts of contaminants that
adversely impact the natural world, despite greater understanding of the need
to address climate change (Bekun, 2024; Voumik et al., 2023a). The rationale
for addressing greenhouse gas (GHG) emissions is receiving increasing worldwide
interest. This phenomenon is not exclusive to established countries but is also
prevalent across all major developing nations, which contribute significantly
to world’s GHG (Shoha et al., 2024; Ozcan et al., 2024). The United States
accounts for the largest share of global carbon dioxide (CO2)
emissions which substantially boost the total GHG in the environment. As the
main driver of climate change patterns this country demonstrates why its
environmental-friendly projects and emissions reduction measures remain vital
(Isik et al.,2024; Kurniawati et al., 2025). Moreover, the nation contributed
13.3% to worldwide GDP while having 4.21% of world population in 2024 (WDI,
2024). According to BP (2024) the United States produced 5,416 metric tons of
CO2 in 2020 illustrating nearly 16% of global pollution. From 1990
to 2022, the country had varied fluctuations in CO2 emissions.
Notwithstanding the dominant policy issues of the 2020s, the nation's CO2
profile remained affected by technology innovations and an increasing shift to
renewable energies (Dogan et al.,2024). Despite the US economy's expansion over
the past three decades, the US is confronting major ecological issues (Koondhar
et al.,2018). The United States' current and future technical prospects,
together with its commitment to establishing ecological sustainability with its
2050 net-zero emissions target, hinge on the availability of viable solutions
to this dilemma. The increasing trend of CO2 emissions in the USA is
inherently connected to the region's economic development (Caglar et al.,2021).
The study investigates environmental challenges that stem from expanding
economic activity and urbanization along with increasing energy demand
throughout the United States. Limited research exists to understand how
combined sustainability efforts affect ecological load capacity. To create
successful data-driven environmental policies we must understand how different
factors connect with each other.
Government officials have increasingly focused on
the unfavorable impacts of monetary growth programs on the current ecosystem in
the past decade. The International Energy Agency (IEA) recently released a
report stating that achieving global carbon neutrality by 2050 would
necessitate a significant overhaul of the worldwide power mechanisms in order
to slowly phase out reliance on conventional fossil fuels and simultaneously
deploy cutting-edge alternative energy supplies in significant quantities (IEA,
2021). Since 1974, the United States' usage of energy has been rising
gradually, but the growth in overall usage has lagged behind that of overall
production. From January to July 2024, U.S. energy consumption exceeded that of
the corresponding time in 1974 by 32%, or 13.2 quads (EIA, 2024). Additionally,
the United States mostly depends on fossil fuels, considering around 95% of its
transportation energy, while renewable sources contribute merely around 5%
(EIA,2022). Besides, financial development is essential for nations to sustain
the general well-being of diverse societal segments (Ashiq & Mushtaq,
2020). In 2023, the real GDP of the USA rose by 2.5 percent relative to 2022
(Satatista, 2024a). During the third quarter of 2024 the U.S. GDP displayed growth
of 2.8 percent when compared to the GDP numbers from the second quarter of 2024
(Statista, 2024b). Multiple nations are discovering that their economic growth
is becoming unsustainable as industrialization keeps growing (Debnath et
al.,2024). Nevertheless, a limited number of scholars have identified financial
accessibility (FA) as a contributing factor to the spike in the LCF. Countries
that are developing are encountering global hurdles in their pursuit of climate
action goals (Raihan et al.,2024i; Urbee et al., 2025). Financial access has
significantly increased the cost and availability of financial services over
the past 20 years and is crucial to economic progress, but we must also
consider its ecological consequences (Shabir, 2024). Financial accessibility
(FA) can affect CO2 emissions from energy outputs by shaping local
financial decisions (Shen et al.,2024). In addition to having a major influence
on power infrastructures and CO2 emissions, FA is a key regulation
tool influencing national GDP growth (Yu et al.,2022; Dogan & Pata, 2022).
Moreover, the alternative perspective posits that improved access to financial
services alleviates constraints on credit and stimulates business activity,
resulting in increased use of energy and elevated CO2 emissions,
which subsequently exacerbate global warming (Gok, 2020; Le et al.,2020; Abbasi
& Riaz, 2016). The extent of urbanization in the United States shows that
in 2015, around 82.7 percent of the overall population in the USA resided in
urban regions. Moreover, forecasts predict that the analogous figure in 2050
will reach 87.4 percent (Korhonen,2024).
This paper incorporated the unique factor LCF as a
proxy for ecological sustainability, which is a more significant element in
this domain. The ecological system evaluation through EFP focuses exclusively
on demand aspects while excluding supply aspects from the analysis (Adebayo et
al., 2024). A group of researchers (Fareed et al.,2021; Ali et al.,2023)
analyzed environmental condition through the application of LCF to achieve
exact environmental data. The condition of ecosystem sustainability exists when
LCF exceeds one value but ecological decline happens when LCF is less than one
(Siche et al.,2010; Gharbi et al., 2025). Therefore, the sustainability
threshold level is 1. Thus, our research substantially enhances the existing
body of contemporary literature in multiple aspects. Primarily, from a U.S.
perspective, it tackles the predominantly unexamined domain of financial
accessibility and energy consumption, rendering it unique. This study seeks to
explore the links between LCF, access to finance, and energy use, providing
pertinent data for the formulation of green policies. Secondly, the study
employs the distinctive factor LCF as a substitute of biodiversity quality in
the USA. This analysis examines trends and principal research domains related
to long-term GDP growth, energy usage, financial accessibility, and
urbanization in the USA's LCF. A detailed study of the LCF structure within the
USA context will deliver fresh understanding for researchers and increase the
existing academic understanding. By conducting the first extensive literature
review on the LCF we establish the following research goals: What effects
result from energy usage and FA on USA's LCF? What relationship exists between
GDP and URBA toward shaping the LCF? By acknowledging these factors, regulators
and strategists may enhance the promotion of ecologically ethical behavior.
Further research in this domain is crucial for establishing a conducive and
healthy environment, especially given the increasing fascination in urban
sustainability and heightened public knowledge of ecological concerns. This
research utilized the ARDL technique to study how selected factors affect the
LCF by assessing new data between 1990 and 2018. The reliability assessment for
these findings used three methodology approaches including FMOLS, DOLS, and CCR
methods. The findings present essential advice to USA lawmakers along with
officials from other countries to pursue Sustainable Development Goals by
building responsible financial development while improving environmental
quality through an integrated approach.
The following framework specifies the relevant
aspects of the investigation. The literature review in Section 2 contains an extensive evaluation of
existing academic works. This study subdivides into three parts portraying
topics and methodology before presenting findings and discussions and finally
delivering conclusion and policy suggestions.
2. Literature Review
Multiple studies investigated the effects that
financial accessibility combined with energy use and urbanization and GDP
growth have on the LCF. Research into the ARDL approach has grown numerous but
most examinations have analyzed the implication of population growth and
globalization on worldwide situations. Various researchers have studied how ICT
utilization relates to globalization and GDP expansion as they impact LCF. The
analysis of ecosystem damage in the United States as a modern topic lacks full
research examination because it developed recently. Previous research studies
were used by this inquiry to make crucial choices about variables and research
methods. The following part will handle specified inquiries.
Recently, there has been a notable spike in
scholarly and public concern regarding the detrimental effects of economic
expansion. The publication of the correlation between GDP development and
environmental problems across various regions heightened the growing concern.
An increase in financial status will facilitate the extension of the LCF,
enhance the ecological condition, and sustain the LCF curves (Pang et
al.,2024b; Dai et al.,2024). Very recently, Ridwan et al.(2024a) conducted
research to study ecological effects of urbanization rates and natural resource
access with the service sector to evaluate EKC hypothesis in six SAARC
countries. According to the DKSE methodology they show that GDP minimizes CO2
emissions at both time intervals. From 1972 to 2021 Voumik et al.(2023b)
analyzed the effect of population growth together with GDP and FDI and
increased green energy use on CO2 emissions in Kenya. The ARDL
approach confirmed GDP growth is directly linked to lowering CO2
emissions levels. Several researchers such as Awan et al.(2022) studied
Malaysia whereas Onofrei et al.(2022) studied EU countries and Ahmad et al.
(2024a) examined China to prove that environmental conditions suffer from
advanced economic development. Conversely, Using the ARDL methodology Solarin
et al.(2021) recorded that Nigeria's economic development first deteriorated
environmental quality before it produced lasting enhancements between 1977 and
2016. An analysis by Nathaniel et al.(2020) studied how GDP growth affects
environmental performance in the CIVETS countries. By adopting the AMG
estimator, they came to the conclusion that ecosystems are not negatively
impacted by GDP growth. In a similar vein, Jahanger et al.(2023) in top SDGs
nation, Sultana et al.(2023) across next-11 countries and Raihan et al.(2023a)
within China found the favorable implication of economic growth on the natural
health.
The heightened consumption of energy and economic
expansion has been observed to precipitate elevated CO2 emissions
across various countries globally. Renewable energies are well acknowledged for
their capacity to reduce CO2 emissions and foster an equitable
planet (Raihan et al.,2024a; Raihan et al.,2024f). Bilgili et al.(2024) analyze
the influence and efficacy of R&D on energy conservation and sources
regarding CO2 emissions in Europe from 1990 to 2021. The MMQR
technique confirms that energy use elevates CO2 emissions from lower
to higher quantiles. Tukhtamurodov et al.(2024) analyze the implication of FDI,
GDP growth, trade openness, use of energy, and green power on CO2
emissions in BRICS regions. This study utilizes the panel ARDL model and
concludes that, in the short term, clean energy adversely affects CO2
emissions. The unfavorable connection within ENU and natural health was
demonstrated by several scholars such as Nosheen et al.(2021) in Asian
economies, Zhang and Zhang (2021) within China and Qiao et al.(2024) within UK.
In contrast, Rahman et al.(2023a) examine the influence of industrialization
and green power on the EFP of the ten most populous nations from 1990 to 2020.
They employ ARDL, PMG, and MMQR regression techniques, revealing that the
utilization of clean energy greatly minimizes the EFP. Moreover, Ridwan et
al.(2023) explored the influence of alternative and natural energy resources on
France's environment from 1990 to 2021. Utilizing FMOLS estimations, they
reveal an inverse link within CO2 emissions and both nuclear and
clean energy resources. Therefore, through the provision of research-based
knowledge, the global community can combat global warming and pursue cheap,
renewable energy options (Islam et al.,2023).
Very little research exists which investigates how
financial affordability factors into ecological sustainability promotion. These
research efforts fail to directly tackle or link access to finance with
environmental degradation. Li et al. (2024) analyze the correlation between FA
and CO2 emissions in China. The Engle-Granger econometric method
analyzes a simulation, revealing a correlation between reduced CO2
emissions and monetary expansion. Renzhi and Baek (2020) conducted an analysis
of CO2 emission changes that resulted from FA throughout 103
nations. Annual records between 2004 and 2014 support their findings using GMM
analysis which demonstrates how financial integration creates CO2
emission reductions. Furthermore, financial inclusion can serve as a
significant mechanism to reduce the adverse consequences of GDP expansion by
enhancing ecological awareness (Ogede et al.,2023). In opposite, Ridwan et
al.(2024c) examine the influence of AI and financial accessibility on fostering
a green ecosystem in G-7 nations by evaluating the LCC hypothesis from 2010 to
2022. The study employs the MMQR and determines that financial progress has a
crucial positive link with the LCF. Le et al.(2020) assess the influence of FA
on CO2 emissions in Asia from 2004 to 2014. Principal component
analysis constructs three indicators of financial accessibility. The DKSE
technique indicates that financial integration seems to have resulted in
increased CO2 emissions in the region. A study by Shahzadi et
al.(2023) investigated how growth funding affected nature from 1997 to 2021 in
G-7 nations. Analysis using the Panel ARDL model showed FA leads to positive
and considerable implications on CO2 emissions in the extended
timeframe. In a similar vein, Raihan et al.(2024d), Qin et al.(2021), and
Mehmood (2022) found unfavorable association between FA and environment
quality.
Urbanization is considered a principal factor in
environmental loss, thus attracting significant focus in both theoretical and
practical studies (Raihan et al.,2024g). The levels of urbanization are
increasing in developing nations, yet they seem to be greatest in advanced
nations (Rahman et al.,2023b; Sadorsky,2014). Shiam et al.(2024) checked the
implication of AI innovation, GDP, and URBA on the EFP in the Nordic region
from 1990 to 2020. They observed that URBA has a positive link with the EFP in
both time periods, employing the STIRPAT model and ARDL framework. Fang et al.
(2024) examine the link between urbanization and ecological sustainability
utilizing the frequency domain causality method. In Thailand, the ARDL
estimator shows that URBA reduces the LCF. Moreover, Shaikh et al. (2024)
explored the consequences of trade liberalization, GDP development, FDI
inflows, and urbanization on the ecosystem in selected South Asian regions from
1990 to 2022. The CS-ARDL models indicate that urbanization elevates CO2
emissions by 0.429%. Similarly the negative influence of urbanization on the
ecosystem was also observed by Kakar et al.(2024) within South Asian countries,
Malik et al.(2024) within Pakistan and Raihan et al.(2022a) within China.
Akther et al.(2024) study how private AI investment and URBAtogether with GDP
influence biodiversity health in the USA from 1990 to 2019. The ARDL-bound test
indicates a favorable correlation between URBA and LCF, thereby fostering
sustainability on earth. The NARDL analytical method utilized by Khan et al.
(2023) established that URBA generates positive environmental outcomes over
extended periods for India. Addai et al. (2022) examined the effect of URBA on
Eastern European countries' EFP throughout 1998Q4 to 2017Q4. The CCE
estimator's application showed that urbanization does not consistently lead to
environmental deterioration.
Our literature review has demonstrated that only a
limited number of investigations specifically investigate the LLC hypothesis in
the USA, taking into accounts the effects of financial accessibility, economic
growth, urbanization, and clean energy utilization. Multiple examinations have
investigated the LLC hypothesis in developing nations; however, their analyses
have been narrow and neglected to consider additional industries. It is prudent
to examine the LLC hypothesis, given that the USA is a burgeoning region with
unique environmental characteristics. The deficiency in understanding how
financial inclusion and power use can be utilized in order to preserve the
ecological health of the USA constitutes deficiencies in study. Further study
is necessary to identify and cultivate novel possibilities for energy
efficiency utilization and equitable funding that can assist the selected
region in attaining the SDGs. By overcoming the understanding and execution
discrepancies, addressing the study's gap would enable the use of novel
approaches to tackle environmental challenges across various locations.
3. Methodology
3.1. Data and Variables
This investigation analyzed data to assess the
implication of various selected variables on the USA's LCF from 1990 to 2022.
The United States garnered consideration due to its environmental issues,
economic stability background, and data availability. The World Development
Index (WDI) provides the data for GDP, GDP2, energy consumption, and
urbanization statistics. In this context, we regard LCF as a dependent variable
derived from GFN, employed as a proxy for ecological sustainability.
Conversely, financial inclusion data is sourced from reputable entities such as
the IMF. Additionally, we identified access to finance, energy consumption, and
urbanization as the policy components for our study.

Table 1.
Sources and Description of Data.
| Variables | Description | Logarithmic Form | Unit of Measurement | Source |
| LCF | Load Capacity Factor | LLCF | Gha per person | GFN |
| GDP | Gross Domestic Product | LGDP | GDP per capita (current US$) | WDI |
| GDP2 | GDP Square | LGDP2 | GDP per capita (current US$) | WDI |
| ENU | Energy use | LENU | Energy use (kg of oil equivalent per capita) | WDI |
| LFA | Financial Accessibility | LFA | Financial Accessibility Index | IMF |
| LURBA | LURBA | LURBA | Urban Population (% of total ) | WDI |
3.2. Theoretical Framework
The LCC hypothesis depends on the LCF indicator to
assess biological supply versus anthropogenic need for assets (Pata &
Ertugrul,2023). The economic growth in GDP follows a U-shaped curve according
to research and stands as the principal driving force. The connection between
GDP and ecological effects has shown a U-shaped pattern (Pata & Tanriover,
2023). The link demonstrates that ecological health stands as a vital factor
showing resources usage increases as GDP expands together with private income
progression (Degirmenci & Aydin, 2024). We substituted the LCF with
traditional CO2 emissions or EFP for ecosystem degradation
assessment in our study. Equation (1) is used for the LCC theory:
In this instance, the variable for wealth is
expressed by GDP and GDP squared, but additional factors’ influencing the LCF
is. Equation (2) aims to offer a comprehensive
perspective on the elements influencing the LCF by incorporating additional
pertinent aspects, including urbanization, financial accessibility, GDP, and
energy use.
Equation (2) features LCF as the load capacity
factor together with economic growth measured by GDP and energy consumption
through ENU along with the factors of access to finances represented by FA and
urbanization shown by URBA. The statistical model behind equation (3) has its
justification presented earlier.
Logarithmic multiplication effectively strengthens
volatility, making it an extremely useful modification for integrating wide
ranges in scientific and economic study. Equation (4) demonstrates the
logarithmic values of the variables.
Here, within the parameter range of to, the coefficients of the research variables are
listed.
4. Empirical Methods
At the outset of the investigation, we conducted
unit root tests to ascertain stationarity. We subsequently adopted the ARDL
bound test to investigate the connection between LCF and other exogenous
factors in the USA, given the characteristics of the time series data. We also
employed the FMOLS, DOLS, and CCR methodologies to ensure robustness. In the
end, following a comprehensive estimation process, we identified the most
effective and accurate econometric approach.
4.1. Unit Root Test
One must first verify data stability before
conducting analyses of possible period connections. Understanding unit root
properties in variables is essential because stationary properties require
additional explanatory factors to avoid producing incorrect results (Nelson
& Plosser, 1982; Engle & Granger, 1987; Polcyn et al.,2023). The paper
used Dickey-Fuller Generalized Least Squares developed by Elliot et al. (1992),
Phillips-Perron by Phillips & Perron (1988), and Augmented Dickey-Fuller by
Dickey & Fuller (1979) as unit root tests to analyze data stationarity.
People widely favor the ADF test for its ability to address serial
autocorrelation (Dickey & Fuller, 1981). The implementation of these
techniques plays a crucial role in preventing incorrect regression results from
unstable qualities to stabilize and strengthen the model performance.
4.2. ARDL Simulation
The ARDL limits test by Pesaran et al. (2001)
determines variable interconnectivity after establishing that all variables
become stationary when examined at their first differenced form. Once
stationary conditions and co-integration criteria are established it becomes
crucial to review temporal influences in the ARDL model framework. Through ARDL
simulation researchers can achieve precise temporal reflection and calculate
both long-run and short-run coefficients which analyze complex parameter
relationships and their effects (Raihan et al.,2024e; Abir,2024). This method
is advantageous even with a low sample size, as it yields consistent and
accurate projections despite the scarcity of data points (Voumik et al.,2023c;
Ridwan et al.,2024e; Tanchangya et al.,2024b). We employ the ARDL bound
assessment to investigate the enduring relationships among the selected
variables, as outlined below:
Two alternative hypotheses emerge to demonstrate
either the absence or existence of cointegration. If F-statistics values
surpass the highest critical value then it implies long-term parameter
correlation. When the F-statistic remains below the established minimum value
the null hypothesis becomes valid (Ahmad et al.,2024b). A test outcome is
inconclusive when F-statistic values lie between the pre-established minimum
and maximum thresholds. The alternative hypothesis and null hypothesis appear
in Equations (6) and (7) respectively.
The symbols H0 and H1 served to represent the null
hypothesis and alternative hypothesis respectively. The study evaluated the
error correction model (ECM) through identification of long-term relationships
while investigating short-term exogenous factor dynamics and short-term
adjustment rates to long-term rates (Luqman et al.,2021). The ARDL framework
includes the ECM as described in Equation (8).
Here, represents the coefficient of the ECT.
4.3. Robustness Check
To assess the robustness of the ARDL findings, we
employed the FMOLS test (Phillips and Hansen, 1990), the CCR test (Park, 1992),
and the DOLS test (Stock and Watson, 1993). The FMOLS method effectively
mitigates endogeneity, autoregressive concerns, and errors arising from biased
samples (Narayan & Narayan, 2005). By comparing the intrinsic indicator to
independent variables in levels, leads, and lags, the DOLS estimator can
effectively handle different stages of integration. This approach enables the
inclusion of different parts in the cointegrated framework (Dogan & Seker,
2016). Moreover, the CCR approach uses the stationary component of a linked
framework to convert numeric data, maintaining the cointegrating relationship
that the cointegration model established (Pattak et al.,2023). This strategy
decouples error terms in cointegrating models from zero-regularity independent
parameters, leading to successful prediction (Ridwan & Hossain, 2024).
4.4. Diagnostic Test
The Lagrange Multiplier (LM) test combined with
Jarque-Bera (1987) and Breusch-Pagan-Godfrey (1979) are three tests used for
time series analysis to verify model assumptions and stability. The normality
of residuals gets validated through the Jarque-Bera test and serial correlation
in residuals gets detected by the Lagrange Multiplier test to prevent mistaken
estimations. The Breusch-Pagan-Godfrey test shows heteroscedasticity which
implies that residuals persistently change their variance level. The short-term
coefficient stability assessment relies on the CUSUMSQ approach while the CUSUM
technique evaluates long-term coefficients stability (Brown et al.,1975).
4.5. Machine Learning Approach
This research used Machine Learning (ML) and the
ARIMA (AutoRegressive Integrated Moving Average) model to evaluate and forecast
time-series data. Time-series forecasting utilizes machine learning at an
advanced level, employing a variety of algorithms to classify distinct time
series and generate valuable predictions, whereas ARIMA represents a more
specialized collection of statistical methods designed for forecasting and
providing insights into time-series phenomena. The ARIMA model operates by
identifying patterns in the data, differencing it to achieve stationarity, and
then adding an autoregressive (AR) component together with a moving average
(MA) component to the forecasts. ARIMA, being one of the most effective time
series models for identifying linear temporal relationships, has been used to
predict the EFP of the United States. The models were trained subsequent to
data preprocessing, conducting unit root tests using the Augmented
Dickey-Fuller test, and choosing ARIMA parameters based on the ACF and PACF
plots. This offers significant insight into forthcoming sustainability trends,
since the trained ARIMA (1,1,1) model is then used to project ecological
footprint values from 2023 to 2040.
5. Results and Discussions
Table 2 presents numerous major statistical metrics, including observation, mean,
maximum, minimum, and standard deviation, providing a comprehensive examination
of the data. The descriptive statistics for the USA about the six factors
(LLCF, LGDP, LGDPSQ, LENU, LFA, and LURBA) are offered, encompassing a total of
32 observations. The table indicates that all selected variables exhibited a
positive mean, except for LLCF and LFA, whereas LGDP2 recorded the
greatest mean and LLCF has the lowest one. Moreover, the calculated standard
deviations for all factors are relatively small, suggesting a close clustering
of data points around the mean with negligible periodic fluctuation. Moreover,
it is clear that LLCF has the lowest value, while LGDP2 has the
highest value.
The stationarity tests for the log-transformed
factors appear in Table 3 both at the
initial and first difference stages. Analysis results confirm that access to
finance and urbanization exist in a state of stationary I(0) within the data.
The LFA coefficient shows significance at 5% in the ADF, P-P, and DF-GLS tests
but the LURBA displays significance at 1% in every test. The tests revealed
that LCF along with GDP and GDP squared and energy consumption showed
non-stationarity at the I(0) level until they became stationary after first
differencing I(I). The next phase will require the ARDL methodology due to the
different order of integration discovered during testing.
The study performed an ARDL bounds test analysis to verify the co-integrative relationships between its chosen variables. The results from Table 4 demonstrate that no co-integration exists between the chosen factors at a 1% significance point level. The results of the conducted F-test produced a value of 6.09182 which exceeded the specified threshold. A substantial co-integrating relationship exists between model variables according to this assessment. The framework demonstrates quick adjustment abilities when exposed to typical stochastic disturbances through these characteristics. Research indicates that LCF in the United States responds to changes in all monitored variables.
The subsequent phase entails the assessment of long-term relationships between variables following the confirmation of cointegration through the bound testing procedure. The dynamic ARDL approach is implemented in Table 5 to determine the impact of LGDP, LGDP2, LENU, LFA, and LURBA on LLCF in the USA, taking into account both short-term and long-term effects. The research suggests that the environmental carrying capacity of the United States decreases in tandem with economic growth over both short-term and long-term periods. According to our research findings (Atasoy et al., 2022b), the continuous loss of natural ecosystem features is a consequence of financial expansion. Theoretical findings are generated by the analysis due to the fact that the United States maintains an economy that is steadily expanding and heavily reliant on harmful fossil fuels. The results of Table 5 indicate that a 1% increase in GDP results in a 0.354% decrease in LCF over the long term and a 0.345% decrease in the short term. Several researchers, such as Atasoy et al. (2022a) from the United States, Raihan et al. (2024c) from the G-7 nations, Raihan et al. (2023b) from Malaysia, Shahbaz et al. (2019) from Vietnam, Ibrahim et al. (2024) from the USA, and Ridwan et al. (2024f) from the BIMSTEC region, have corroborated our findings. Conversely, Guo et al. (2024), Balcilar et al. (2018), and Destek et al. (2020) asserted that GDP has a beneficial impact on the welfare of the ecosystem. Maduka et al. (2022) further posited that the implementation of sustainable practices, methodologies, and technical innovations may be indicative of the improvement in ecological circumstances in conjunction with economic growth, which would lead to a reduction in environmental damage. Nevertheless, Jin et al. (2023) determined that the relationship between GDP and LCF exhibited a U-shaped pattern as GDP increased. 0.145% short-term and 0.307% long-term effects on LCF are generated by a single unit increase in GDP2. The statistical tests confirm that both LGDP and LGDP2 have positive effects on atmospheric pressure, as their coefficients are both statistically significant and positive. The recently proposed LCC hypothesis, which depicts the conditions in the United States, is substantiated by research data. Emerging research (Ayad et al., 2024; Tanchangya et al., 2024c; Ridwan, 2023) has established a correlation between continued GDP expansion and improved ecological development. This is achieved through the financing of both pollution control and resource management approaches, as well as the enhancement of ecological efficiency.
By contrast, the LENU coefficients exhibit an antithetical relationship with the LLCF. According to their forecast, LLCF will decrease by 0.278% over time and by 0.401% immediately for each 1% increase in LENU. In addition, the results are statistically significant at 1% in each instance, indicating that the United States' increased electricity consumption, particularly from carbon-based fuels, significantly contributes to greenhouse gas (GHG) pollution and manufacturing contaminants, resulting in ecological damage. Raihan et al. (2024b), Nguyen et al. (2021), and Mohsin et al. (2023) advocate for this conclusion. A few exceptions are examined by scholars, including Fareed et al. (2022) and Nejat et al. (2015), who conclude that power consumption is not environmentally detrimental. A positive correlation between LCF and FA is confirmed by statistical findings, which are evident in both short and long-term analyses. Results suggest that the United States' ecosystem is enriched by its access to financial institutions. The results of the analysis indicate that a one percent increase in FA results in a 0.037% increase in long-term LCF growth and a 0.561% increase in short-term LCF growth. Access to financing is a critical element in the development of sustainable finance, as it promotes financial growth and promotes a more environmentally friendly future (Tanchangya et al., 2024a). Similar findings were also demonstrated by Ali et al. (2021), Liu et al. (2021), and Usman et al. (2021). However, Raihan et al. (2024h) in Bangladesh, Ridwan et al. (2024d) in the USA, and Hussain et al. (2024) in Asia have all found that increased access to finance has a detrimental effect on natural health by increasing manufacturing activities and purchasing patterns.
Based on the negative and statistically significant URBA coefficients that are valid for both short-term and long-term measurements, environmental quality is adversely affected by LURBA increases. A 1% increase in URBA results in a 0.229% decrease in long-term LCF values and a 0.231% decrease in short-term LCF values. The analysis results indicate that the relationship between LURBA and LCF is statistically significant at 5% in long-term data and at 1% in short-term data. These conclusions are corroborated by research conducted by Hossain et al. (2024) in the Nordic region, as well as by numerous scholars, such as Raihan et al. (2022b) in the United States, Voumik and Ridwan (2023) in Argentina, Ridwan et al. (2024b) in the United States, and Van and Bao (2018) in Vietnam. Our argument was challenged by Ramzan et al. (2024) and Balsalobre-Lorente et al. (2021), who demonstrated that urbanization can have a beneficial impact on ecosystems. Additionally, the results of the analysis conducted by Haseeb et al. (2018) and Chen et al. (2022) indicate that urbanization has no impact on the environmental condition.
Table 5.
Results of ARDL short-run and Long-run.
| VARIABLES | LR | SR |
| LGDP | -0.354***(0.2981) | |
| LGDP2 | 0.307***(0.2087) | |
| LENU | -0.278***(0.4345) | |
| LFA | 0.037***(0.3476) | |
| LURBA | -0.229**(0.3021) | |
| D.LGDP | -0.345***(0.0717) | |
| D.LGDP2 | 0.145**(0.8713) | |
| D.LENU | -0.401***(0.0216) | |
| D.LFA | 0.561***(0.1357) | |
| D.LURBA | -0.231**(0.1067) | |
| ECT (Speed Adjustment) | -0.551***(0.0198) | |
| Constant | 10.167***(15.1782) | |
| R-square | 0.9861 | |
Several complementary approaches called DOLS and FMOLS and CCR assist in confirming the reliability and robustness of ARDL model findings. Results from Table 6 validate the findings obtained through the ARDL procedure. The LGDP coefficient shown in FMOLS alongside CCR produces 1% statistical significance but DOLS model shows significance at 5% level. The environmental effects of LGDP growth become evident through statistical increases of 0.232% in FMOLS while DOLS rises by 0.249% simultaneously with LLCF experiencing a 0.239% decrease. An increase of 1% in LGDP squared directly leads to 0.234%, 0.241% and 0.254% increases in LLCF using all analysis models. The estimated significance level reaches 1% in FMOLS, 10% in DOLS while the CCR provides 5% significance. During the FMOLS procedure a 1% increase in LENU led to a simultaneous reduction in LLCF totals amounting to 0.321%, 0.378% and 0.236% respectively. The significant coefficient stands at 1% in all inspected situations. An increase in LFA by 1% results in LLCF growth of 0.054%, 0.047% and 0.065% through the application of three evaluation methods. The tests reveal that the coefficient achieves significance at 5% throughout every evaluation. A 1% increase of LURBA produces negative effects on FMOLS by 0.172% and on DOLS by 0.270% and on CCR by 0.065%. The DOLS and CCR procedures identify a 1% significant value yet FMOLS shows a 5% significant outcome. The results from ARDL show parallel outcomes with the varying reactions observed.
The Figure 1 shows ARIMA model projections for the LCF in the United States between 2023 and 2040. The blue line represents actual Load Capacity Factor data from 1990 to 2022 which initially shows a downward trend until the mid-2000s before recovering gradually with significant peaks by 2020. According to the red dashed line which represents forecasted values the LCF will stabilize just above 0.51 during the forecast period. Without major policy interventions or structural changes the nation will probably sustain its current environmental sustainability level while failing to achieve meaningful advancements.
The diagnostic testing outcomes are shown in Table 7. The results from the tests demonstrate that both diagnostic methods prove ineffective thus keeping the null hypothesis intact. The p-value 0.1876 from the Jarque-Bera test verifies a normal distribution exists in residuals. According to the Lagrange Multiplier evaluation the residuals show no presence of serial correlation because the p-value reached 0.5067. The residuals show no heteroscedasticity according to the Breusch-Pagan-Godfrey assessment which produced a p-value of 0.2098.
Likewise, the CUSUM and CUSUM-SQ tests are utilized to identify structural reliability in residuals over both extended and short time frames. The results are inside the necessary thresholds, with the CUSUM-SQ plot consistently aligning with the essential line, as illustrated in the subsequent Figure 2. At the 5% significance level, this suggests that the variables are coherent and appropriately conveyed.
6. Conclusion and Policy Recommendation
This paper investigates the dynamic effects of GDP, GDP squared, energy utilization, financial accessibility, and urbanization on the LCF in the United States. Utilizing time series data from 1996 to 2022, the analysis implements the ARDL bounds testing methodology within the LCC hypothesis. Initially, we conducted numerous unit root tests, such as the ADF, P-P, and DF-GLS methods, to verify the stationarity of the factors. The ARDL simulation results indicate that the long-term economic expansion and financial accessibility have a positive impact on LCF, thereby fostering a sustainable environment in the United States. In contrast, the results suggested that the quality of the environment in the United States is negatively impacted by short-term economic growth, increased energy consumption, and an expanding urban population.. Additionally, we employ a variety of tests, including FMOLS, DOLS, and the CCR technique, to verify the results. Additionally, we conduct numerous diagnostic assessments to ensure the dataset's consistency. The investigation demonstrates that urbanization, in conjunction with transient monetary growth and increasing power consumption, frequently requires carbon-based fuels. These fuels contribute to ecological degradation by releasing additional contaminants and exacerbating global warming and resource depletion. In light of these factors, this comprehensive investigation provides pertinent information regarding the dynamics of access to finance, GDP expansion, electricity consumption, urbanization, and LCF in the United States. This information serves as a solid foundation for the development of responsible laws and strategies, as well as environmental preservation plans.
In order to enhance the LCF and encourage a sustainable ecosystem, the United States government should prioritize the promotion of equitable monetary expansion and the mitigation of the detrimental effects of urbanization and energy consumption. Policies should promote the financial accessibility of green investments, such as renewable energy projects, by providing incentives such as low-interest financing, tax rebates, and grants for eco-friendly initiatives. Industries such as renewable energy, energy-efficient technologies, and sustainable infrastructure should be prioritized in order to align economic expansion with green development strategies. The government must reduce its dependence on carbon-based fuels by investing in renewable energy alternatives and promoting energy efficiency through stricter regulations and incentives for businesses and consumers in order to address energy consumption. In order to prevent further environmental degradation, urbanization should be managed with sustainable practices, including the integration of green spaces, the promotion of public transportation, and the investment in smart city technologies. This all-encompassing strategy will guarantee that the long-term environmental objectives are in alignment with financial accessibility, economic development, and energy utilization, thereby enhancing the LCF and promoting ecological preservation.
This research offers important findings about how economic development links to energy use, financial access, urban development and environmental sustainability in the United States yet contains multiple constraints. The analysis uses only national-level aggregate data which may obscure significant regional differences and local environmental patterns. The LCF acts as a helpful measure for ecological sustainability but fails to represent all aspects of environmental decline including biodiversity reduction and water contamination. The ARDL and ARIMA models applied in this analysis operate on linear principles which may fail to capture any nonlinear interactions or threshold effects between the variables. The study's dependence on historical data restricts its capacity to foresee future policy changes as well as technological advancements or climate events. The study includes robustness checks with FMOLS, DOLS, and CCR methods but findings continue to depend on variable selection criteria and long-term forecast accuracy. Further studies could expand on these areas.
Data availability
Available on request
References
- Abbasi, F., & Riaz, K. (2016). CO2 emissions and financial development in an emerging economy: An augmented VAR approach. Energy Policy, 90, 102–114. [CrossRef]
- Abir, Shake Ibna, (2024) “Parameter Estimation for Stroke Patients Using Brain CT Perfusion Imaging with Deep Temporal Convolutional Neural Network,” Masters Theses & Specialist Projects, Paper 3755.
- Addai, K., Serener, B. & Kirikkaleli, D. Empirical analysis of the relationship among urbanization, economic growth and ecological footprint: evidence from Eastern Europe. Environ Sci Pollut Res 29, 27749–27760 (2022). [CrossRef]
- Adebayo, T.S., Samour, A. Renewable energy, fiscal policy and load capacity factor in BRICS countries: novel findings from panel nonlinear ARDL model. Environ Dev Sustain 26, 4365–4389 (2024). [CrossRef]
- Ahmad, S., Raihan, A., & Ridwan, M. (2024a). Role of economy, technology, and renewable energy toward carbon neutrality in China. Journal of Economy and Technology. [CrossRef]
- Ahmad, S., Raihan, A., & Ridwan, M. (2024b). Pakistan's trade relations with BRICS countries: trends, export-import intensity, and comparative advantage. Frontiers of Finance, 2(2). [CrossRef]
- Akhter, A., Al Shiam, S. A., Ridwan, M., Abir, S. I., Shoha, S., Nayeem, M. B., ... & Bibi, R. (2024) Assessing the Impact of Private Investment in AI and Financial Globalization on Load Capacity Factor: Evidence from United States. [CrossRef]
- Al Shiam, S. A., Ridwan, M., Hasan, M. M., Akhter, A., Arefeen, S. S., Hossain, M. S., ... & Shoha, S. (2024). Analyzing the Nexus between AI Innovation and Ecological Footprint in Nordic Region: Impact of Banking Development and Stock Market Capitalization using Panel ARDL method. [CrossRef]
- Ali, E. B., Opoku-Mensah, E., Ofori, E. K., & Agbozo, E. (2023). Load capacity factor and carbon emissions: assessing environmental quality among MINT nations through technology, debt, and green energy. Journal of Cleaner Production, 428, 139282. [CrossRef]
- Ali, M., Hashmi, S. H., Nazir, M. R., Bilal, A., & Nazir, M. I. (2021). Does financial inclusion enhance economic growth? Empirical evidence from the IsDB member countries. International Journal of Finance & Economics, 26(4), 5235–5258. [CrossRef]
- Ashiq M, Mushtaq U (2020) The convergence of crowd funding and Zakat System in India: an integrated approach for human welfare. Ihtifaz: Journal of Islamic Economics, Finance, and Banking 3(1):27–36. [CrossRef]
- Atasoy, F. G., Atasoy, M., Raihan, A., Ridwan, M., Tanchangya, T., Rahman, J., ... & Al Jubayed, A. (2022b). An Econometric Investigation of How the Usage of Non-Renewable Energy Resources Affects the Load Capacity Factor in the United States. Journal of Environmental and Energy Economics, 1(2), 32-44. [CrossRef]
- Atasoy, F. G., Atasoy, M., Raihan, A., Ridwan, M., Tanchangya, T., Rahman, J., ... & Al Jubayed, A. (2022a). Factors Affecting the Ecological Footprint in The United States: The Influences of Natural Resources, Economic Conditions, Renewable Energy Sources, and Advancements in Technology. Journal of Environmental and Energy Economics, 1(1), 35-52. [CrossRef]
- Awan, A., Sadiq, M., Hassan, S. T., Khan, I., & Khan, N. H. (2022). Combined nonlinear effects of urbanization and economic growth on CO2 emissions in Malaysia. An application of QARDL and KRLS. Urban Climate, 46, 101342. [CrossRef]
- Ayad, H., Djedaiet, A. Does the unemployment rate matter for environmental issues in the G7 nations? New testing for the environmental Phillips curve using the load capacity factor. Environ Dev Sustain (2024). [CrossRef]
- Bala, S., Ulfat, T. J., Hossain, H., Al Absy, M. S. M., Ridwan, M., Ridzuan, A. R., & KP, J. M. (2025). From Energy Diversity to Environmental Resilience: The Role of Government Efficiency in Shaping Ecological Footprint in Bangladesh. International Journal of Energy Economics and Policy, 15(4), 189-203. [CrossRef]
- Balcilar, M., Ozdemir, Z. A., Ozdemir, H., & Shahbaz, M. (2018). Carbon dioxide emissions, energy consumption and economic growth: The historical decomposition evidence from G-7 countries. Work Pap.
- Balsalobre-Lorente D, Driha OM, Halkos G, Mishra S (2021) Influence of growth and urbanization on CO2 emissions: The moderating effect of foreign direct investment on energy use in BRICS. Sustain Dev 30(1):227–240. [CrossRef]
- Bekun FV. Race to carbon neutrality in South Africa: what role does environmental technological innovation play? Appl Energy. 2024;354: 122212. [CrossRef]
- Bilgili, F., Balsalobre-Lorente, D., Kuşkaya, S., Alnour, M., Önderol, S., & Hoque, M. E. (2024). Are research and development on energy efficiency and energy sources effective in the level of CO2 emissions? Fresh evidence from EU data. Environment, Development and Sustainability, 26(9), 24183-24219. [CrossRef]
- BP.(2024) Statistical Review of World Energy. 2020. Available at https://www.bp.com/content/dam/bp/business-sites/en/global/corporate/pdfs/energy-economics/statistical-review/bp-stats-review-2020-full-report.pdf. Accessed 10 Jan 2024.
- Breusch, T. S., & Pagan, A. R. (1979). A simple test for heteroscedasticity and random coefficient variation. Econometrica: Journal of the econometric society, 1287-1294. [CrossRef]
- Brown, R. L., Durbin, J., & Evans, J. M. (1975). Techniques for testing the constancy of regression relationships over time. Journal of the Royal Statistical Society Series B: Statistical Methodology, 37(2), 149-163. [CrossRef]
- Caglar, A. E., Yavuz, E., Mert, M., & Kilic, E. (2022). The ecological footprint facing asymmetric natural resources challenges: evidence from the USA. Environmental Science and Pollution Research, 1-14. [CrossRef]
- Chen H, Tackie EA, Ahakwa I, Musah M, Salakpi A, Alfred M, Atingabili S (2022) Does energy consumption, economic growth, urbanization, and population growth influence carbon emissions in the BRICS? Evidence from panel models robust to cross-sectional dependence and slope heterogeneity. Environ Sci Pollut Res 29(25):37598–37616. [CrossRef]
- Dai, J., Ahmed, Z., Alvarado, R., & Ahmad, M. (2024). Assessing the nexus between human capital, green energy, and load capacity factor: policymaking for achieving sustainable development goals. Gondwana Research, 129, 452-464. [CrossRef]
- Debnath, B., Taha, M. R., Siraj, M. T., Jahin, M. F., Ovi, S. I., Bari, A. B. M. M., Islam, A. R. M. T., & Raihan, A. (2024). A grey approach to assess the challenges to adopting sustainable production practices in the apparel manufacturing industry: Implications for sustainability. Results in Engineering, 22, 102006. [CrossRef]
- Degirmenci, T., & Aydin, M. (2024). Testing the load capacity curve hypothesis with green innovation, green tax, green energy, and technological diffusion: A novel approach to Kyoto protocol. Sustainable Development. [CrossRef]
- Destek, M.A., Shahbaz, M., Okumus, I. et al. The relationship between economic growth and carbon emissions in G-7 countries: evidence from time-varying parameters with a long history. Environ Sci Pollut Res 27, 29100–29117 (2020). [CrossRef]
- Dickey, D. A., & Fuller, W. A. (1981). Likelihood ratio statistics for autoregressive time series with a unit root. Econometrica: journal of the Econometric Society, 1057-1072. [CrossRef]
- Dicky DA, Fuller WA (1979) Distribution of the estimators for autoregressive time series with a unit root. J Am Stat Assoc 74:427–431.
- Dogan, E., & Seker, F. (2016). The influence of real output, renewable and non-renewable energy, trade and financial development on carbon emissions in the top renewable energy countries. Renewable and Sustainable Energy Reviews, 60, 1074-1085. [CrossRef]
- Dogan, E., Mohammed, K.S., Khan, Z. et al. Analyzing the nexus between environmental sustainability and clean energy for the USA. Environ Sci Pollut Res 31, 27789–27803 (2024). [CrossRef]
- EIA (2022) TOTAL ENERGY. https://www.eia.gov/totalenergy/data/monthly/index.php#consumption. Accessed 12 Aug 2022.
- EIA. (2024). U.S. energy production has increased faster than energy consumption over the past 50 years. Available at: https://www.eia.gov/todayinenergy/detail.php?id=63544#:~:text=U.S.%20energy%20consumption%20has%20increased,the%20same%20period%20in%201974.
- Elliott, G., Rothenberg, T. J., & Stock, J. H. (1992). Efficient tests for an autoregressive unit root.
- Engle, R. F., & Granger, C. W. (1987). Co-integration and error correction: representation, estimation, and testing. Econometrica: journal of the Econometric Society, 251-276. [CrossRef]
- Fang, Z., Wang, T., & Yang, C. (2024). Nexus among natural resources, environmental sustainability, and political risk: Testing the load capacity factor curve hypothesis. Resources Policy, 90, 104791. [CrossRef]
- Fareed, Z., Rehman, M. A., Adebayo, T. S., Wang, Y., Ahmad, M., & Shahzad, F. (2022). Financial inclusion and the environmental deterioration in Eurozone: The moderating role of innovation activity. Technology in Society, 69(101961), 101961. [CrossRef]
- Fareed, Z., Salem, S., Adebayo, T. S., Pata, U. K., & Shahzad, F. (2021). Role of export diversification and renewable energy on the load capacity factor in Indonesia: a Fourier quantile causality approach. Frontiers in Environmental Science, 5(4): 434–448. [CrossRef]
- Gharbi, I., Rahman, M. H., Muryani, M., Esquivias, M. A., & Ridwan, M. (2025). Exploring the influence of financial development, renewable energy, and tourism on environmental sustainability in Tunisia. Discover Sustainability, 6(1), 127. [CrossRef]
- Gök, A. (2020). The role of financial development on carbon emissions: a meta regression analysis. Environmental Science and Pollution Research, 27(11), 11618–11636. [CrossRef]
- Guo, X., Shi, R., & Ren, D. (2024). Reduce carbon emissions efficiently: The influencing factors and decoupling relationships of carbon emission from high-energy consumption and high-emission industries in China. Energy & Environment, 35(3), 1416-1433. [CrossRef]
- Hasan, M., & Sifat, A. I. (2025). Influencers’ impact on consumer engagement and sales conversion on social media: Facebook vs Instagram. American Journal of Economics and Business Innovation (AJEBI), 4(1), 20-30. [CrossRef]
- Haseeb A, Xia E, Danish BMA, Abbas K (2018) Financial development, globalization, and CO2 emission in the presence of EKC: evidence from BRICS countries. Environ Sci Pollut Res 25(31):31283–31296. [CrossRef]
- Hossain, M. S., Ridwan, M., Akhter, A., Nayeem, M. B., Choudhury, M. T. H., Asrafuzzaman, M., & Shoha, S. (2024). Exploring the LCC Hypothesis in the Nordic Region: The Role of AI Innovation, Environmental Taxes, and Financial Accessibility via Panel ARDL. [CrossRef]
- Hussain, S., Ahmad, T., Ullah, S., Rehman, A. U., & Shahzad, S. J. H. (2024). Financial inclusion and carbon emissions in Asia: Implications for environmental sustainability. Economic and Political Studies, 12(1), 88-104. [CrossRef]
- Ibrahim, S. S., Samour, A., Almassri, H., & Kurowska-Pysz, J. (2024). Renewable energy, financial globalization and load capacity factor in the US: Ecological neutrality in the context of natural resources. Geological Journal, 59(11), 3017-3032. [CrossRef]
- IEA. (2021). Net Zero by 2050. IEA, Paris. Available at https://www.iea.org/reports/net-zero-by-2050.
- Işık, C., Ongan, S., Ozdemir, D., Jabeen, G., Sharif, A., Alvarado, R., ... & Rehman, A. (2024). Renewable energy, climate policy uncertainty, industrial production, domestic exports/re-exports, and CO2 emissions in the USA: a SVAR approach. Gondwana Research, 127, 156-164. [CrossRef]
- Islam, S., Raihan, A., Ridwan, M., Rahman, M. S., Paul, A., Karmakar, S., ... & Al Jubayed, A. (2023). The influences of financial development, economic growth, energy price, and foreign direct investment on renewable energy consumption in the BRICS. Journal of Environmental and Energy Economics, 2(2), 17-28. [CrossRef]
- Jahanger, A., Ogwu, S. O., Onwe, J. C., & Awan, A. (2023). The prominence of technological innovation and renewable energy for the ecological sustainability in top SDGs nations: Insights from the load capacity factor. Gondwana Research, 129, 381-397. [CrossRef]
- Jarque, C. M., & Bera, A. K. (1987). A test for normality of observations and regression residuals. International Statistical Review/Revue Internationale de Statistique, 163-172. [CrossRef]
- Jin X, Ahmed Z, Pata UK, Kartal MT, Erdogan S (2023) Do investments in green energy, energy efficiency, and nuclear energy R&D improve the load capacity factor? An augmented ARDL approach. Geosci Front 101646. [CrossRef]
- Kakar, A., Khan, A., & Khan, A. (2024). Analyzing the role of governance, ICT, and urbanization on environment in South Asian countries. Journal of the Knowledge Economy, 15(1), 2682-2703.
- Khan, Y., Khan, M. A., & Zafar, S. (2023). Dynamic linkages among energy consumption, urbanization and ecological footprint: empirical evidence from NARDL approach. Management of Environmental Quality: An International Journal, 34(6), 1534-1554. [CrossRef]
- Koondhar, M. A., Qiu, L., Li, H., Liu, W., & He, G. (2018). A nexus between air pollution, energy consumption and growth of economy: a comparative study between the USA and China-based on the ARDL bound testing approach. Agricultural Economics/Zemědělská Ekonomika, 64(6). [CrossRef]
- Korhonen. V . (2024). Forecast on urbanization in the United States 2000-2050. Available at: https://www.statista.com/statistics/678561/urbanization-in-the-united-states/.
- Kurniawati, T., Rahmizal, M., Ridwan, M., Aspy, N. N., Mahjabin, T., Eleais, M., & Ridzuan, A. R. (2025). Reassessing the Load Capacity Curve Hypothesis in ASEAN-5: Exploring Energy Intensity, Trade, and Financial Inclusion with Advanced Econometric Techniques. International Journal of Energy Economics and Policy, 15(2), 195-208. [CrossRef]
- Le, T. H., Le, H. C., & Taghizadeh-Hesary, F. (2020). Does financial inclusion impact CO2 emissions? Evidence from Asia. Finance Research Letters, 34, 101451. [CrossRef]
- Li, Q., Zhao, M., Hei, P., Li, F., & Zhang, K. (2024). Driving sustainable development: Exploring the Nexus of financial inclusion, green mobility, and CO2 emissions in China's natural resource landscape. Resources Policy, 89, 104656. [CrossRef]
- Liu, N., Hong, C., & Sohail, M. T. (2021). Does financial inclusion and education limit CO2 emissions in China? A new perspective. Environmental Science and Pollution Research, 1, 1–8. [CrossRef]
- Luqman, M., Li, Y., Khan, S. U. D., & Ahmad, N. (2021). Quantile nexus between human development, energy production, and economic growth: the role of corruption in the case of Pakistan. Environmental Science and Pollution Research, 28(43), 61460-61476. [CrossRef]
- Maduka, A. C., Ogwu, S. O., & Ekesiobi, C. S. (2022). Assessing the moderating effect of institutional quality on economic growth—carbon emission nexus in Nigeria. Environmental Science and Pollution Research, 29(43), 64924–64938. [CrossRef]
- Malik, M. U., Rehman, Z. U., Sharif, A., & Anwar, A. (2024). Impact of transportation infrastructure and urbanization on environmental pollution: evidence from novel wavelet quantile correlation approach. Environmental Science and Pollution Research, 31(2), 3014-3030. [CrossRef]
- Mehmood, U. (2022). Examining the role of financial inclusion towards CO2 emissions: presenting the role of renewable energy and globalization in the context of EKC. Environmental Science and Pollution Research, 29(11), 15946-15954. [CrossRef]
- Mohsin M, Naseem S, Zia-ur-Rehman M, Baig SA, Salamat S (2023) The crypto-trade volume, GDP, energy use, and environmental degradation sustainability: an analysis of the top 20 crypto-trader countries. Int J Financ Econ 28(1):651–667.
- Narayan, P. K., & Narayan, S. (2005). Estimating income and price elasticities of imports for Fiji in a cointegration framework. Economic Modelling, 22(3), 423–438. [CrossRef]
- Nathaniel, S., Nwodo, O., Sharma, G. et al. Renewable energy, urbanization, and ecological footprint linkage in CIVETS. Environ Sci Pollut Res 27, 19616–19629 (2020). [CrossRef]
- Nejat, P., Jomehzadeh, F., Taheri, M. M., Gohari, M., & Majid, M. Z. A. (2015). A global review of energy consumption, CO2 emissions and policy in the residential sector (with an overview of the top ten CO2 emitting countries). Renewable and sustainable energy reviews, 43, 843-862.
- Nelson, C. R., & Plosser, C. R. (1982). Trends and random walks in macroeconmic time series: some evidence and implications. Journal of monetary economics, 10(2), 139-162.
- Nguyen, A. T., Lu, S. H., & Nguyen, P. T. T. (2021). Validating and forecasting carbon emissions in the framework of the environmental Kuznets curve: the case of Vietnam. Energies, 14(11), 3144. [CrossRef]
- Nosheen M, Iqbal J, Khan HU (2021) Analyzing the linkage among CO2 emissions, economic growth, tourism, and energy consumption in the Asian economies. Environ Sci Pollut Res 28:16707–16719.
- Ogede, J. S., & Tiamiyu, H. O. (2023). Does financial inclusion moderate CO2 emissions in sub-Saharan Africa? Evidence from panel data analysis. Studia Universitatis Vasile Goldiș Arad, Seria Științe Economice, 33(3), 21-36. [CrossRef]
- Onofrei, M., Vatamanu, A. F., & Cigu, E. (2022). The relationship between economic growth and CO2 emissions in EU countries: A cointegration analysis. Frontiers in Environmental Science, 10, 934885. [CrossRef]
- Pang, X., Fatima, S., Yağiş, O., Haseeb, M., & Hossain, M. E. (2024b). Assessing the load capacity curve hypothesis considering the green energy transition, banking sector expansion, and import price of crude oil in the United States. Natural Resource Modeling, 37(4), e12413. [CrossRef]
- Park JY (1992) Canonical cointegrating regressions. Econometrica 60:119–143. [CrossRef]
- Pata, U. K., & Ertugrul, H. M. (2023). Do the Kyoto Protocol, geopolitical risks, human capital and natural resources affect the sustainability limit? A new environmental approach based on the LCC hypothesis. Resources Policy, 81, 103352. [CrossRef]
- Pata, U. K., & Tanriover, B. (2023). Is the load capacity curve hypothesis valid for the top ten tourism destinations?. Sustainability, 15(2), 960. [CrossRef]
- Pattak, D. C., Tahrim, F., Salehi, M., Voumik, L. C., Akter, S., Ridwan, M., ... & Zimon, G. (2023). The driving factors of Italy’s CO2 emissions based on the STIRPAT model: ARDL, FMOLS, DOLS, and CCR approaches. Energies, 16(15), 5845. [CrossRef]
- Pesaran, M. H., Shin, Y., & Smith, R. J. (2001). Bounds testing approaches to the analysis of level relationships. Journal of Applied Econometrics, 16(3), 289-326. [CrossRef]
- Phillips PB, Perron P (1988) Testing for a unit root in time series regression. Biometrika 75:335–346.
- Phillips PCB, Hansen BE (1990) Statistical inference in instrumental variables regression with I (1) processes. Rev Econ Stud 57:99–125. [CrossRef]
- Polcyn, J., Voumik, L. C., Ridwan, M., Ray, S., & Vovk, V. (2023). Evaluating the influences of health expenditure, energy consumption, and environmental pollution on life expectancy in Asia. International Journal of Environmental Research and Public Health, 20(5), 4000. [CrossRef]
- Qiao, Q., Eskandari, H., Saadatmand, H., & Sahraei, M. A. (2024). An interpretable multi-stage forecasting framework for energy consumption and CO2 emissions for the transportation sector. Energy, 286, 129499. [CrossRef]
- Qin, L., Raheem, S., Murshed, M., Miao, X., Khan, Z., & Kirikkaleli, D. (2021). Does financial inclusion limit carbon dioxide emissions? Analyzing the role of globalization and renewable electricity output. Sustainable Development, 29(6), 1138-1154. [CrossRef]
- Rahman, J., Foisal, M. Z. U., Mohajan, B., Rafi, A. H., Islam, S., & Paul, A. (2023b)Nexus Between Agriculture, Industrialization, Imports, and Carbon Emissions in Bangladesh.
- Rahman, J., Rahman, H., Islam, N., Tanchangya, T., Ridwan, M., & Ali, M. (2025). Regulatory Landscape of Blockchain Assets: Analyzing the Drivers of NFT and Cryptocurrency Regulation. BenchCouncil Transactions on Benchmarks, Standards and Evaluations, 100214. [CrossRef]
- Rahman, M. M., Khan, Z., Khan, S., & Abbas, S. (2023a). Disaggregated energy consumption, industrialization, total population, and ecological footprint nexus: evidence from the world’s top 10 most populous countries. Environmental Science and Pollution Research, 30(56), 119069-119083.
- Raihan, A., Al Hasnat, M., Rahman, S. M., Ridwan, M., Rahman, M. M., Islam, M. T., ... & Bari, A. M. (2025). Recent advancements in alternative energies, technological innovations, and optimization strategies for seaport decarbonization. Innovation and green development, 4(3), 100252. [CrossRef]
- Raihan, A., Atasoy, F. G., Atasoy, M., Ridwan, M., & Paul, A. (2022b). The role of green energy, globalization, urbanization, and economic growth toward environmental sustainability in the United States. Journal of Environmental and Energy Economics, 1(2), 8-17. [CrossRef]
- Raihan, A., Atasoy, F. G., Coskun, M. B., Tanchangya, T., Rahman, J., Ridwan, M., ... & Yer, H. (2024i). Fintech adoption and sustainable deployment of natural resources: Evidence from mineral management in Brazil. Resources Policy, 99, 105411. [CrossRef]
- Raihan, A., Bala, S., Akther, A., Ridwan, M., Eleais, M., & Chakma, P. (2024c). Advancing environmental sustainability in the G-7: The impact of the digital economy, technological innovation, and financial accessibility using panel ARDL approach. Journal of Economy and Technology. [CrossRef]
- Raihan, A., Hasan, M. A., Voumik, L. C., Pattak, D. C., Akter, S., & Ridwan, M. (2024b). Sustainability in Vietnam: Examining Economic Growth, Energy, Innovation, Agriculture, and Forests' Impact on CO2 Emissions. World Development Sustainability, 100164. [CrossRef]
- Raihan, A., Rahman, J., Tanchangtya, T., Ridwan, M., & Islam, S. (2024e). An overview of the recent development and prospects of renewable energy in Italy. Renewable and Sustainable Energy, 2(2), 0008. [CrossRef]
- Raihan, A., Rahman, J., Tanchangya, T. et al. Influences of economy, energy, finance, and natural resources on carbon emissions in Bangladesh. Carbon Res. 3, 71 (2024h). [CrossRef]
- Raihan, A., Rahman, J., Tanchangya, T., Ridwan, M., Rahman, M. S., & Islam, S. (2024f). A review of the current situation and challenges facing Egyptian renewable energy technology. Journal of Technology Innovations and Energy, 3(3), 29-52. [CrossRef]
- Raihan, A., Rahman, S. M., Ridwan, M., & Sarker, T. (2025). FinTech Adoption and Its Influence on Sustainable Mineral Resource Management in the United States. Resources, 14(6), 101. [CrossRef]
- Raihan, A., Ridwan, M., & Rahman, M. S. (2024g). An exploration of the latest developments, obstacles, and potential future pathways for climate-smart agriculture. Climate Smart Agriculture, 100020. [CrossRef]
- Raihan, A., Ridwan, M., Tanchangya, T., Rahman, J., & Ahmad, S. (2023a). Environmental Effects of China's Nuclear Energy within the Framework of Environmental Kuznets Curve and Pollution Haven Hypothesis. Journal of Environmental and Energy Economics, 2(1), 1-12. [CrossRef]
- Raihan, A., Tanchangya, T., Rahman, J., & Ridwan, M. (2024a). The Influence of Agriculture, Renewable Energy, International Trade, and Economic Growth on India's Environmental Sustainability. Journal of Environmental and Energy Economics, 37-53. [CrossRef]
- Raihan, A., Tanchangya, T., Rahman, J., Ridwan, M., & Ahmad, S. (2022a). The influence of Information and Communication Technologies, Renewable Energies and Urbanization toward Environmental Sustainability in China. Journal of Environmental and Energy Economics, 1(1), 11-23. [CrossRef]
- Raihan, A., Voumik, L. C., Ridwan, M., Akter, S., Ridzuan, A. R., Wahjoedi, ... & Ismail, N. A. (2024d). Indonesia’s Path to Sustainability: Exploring the Intersections of Ecological Footprint, Technology, Global Trade, Financial Development and Renewable Energy. In Opportunities and Risks in AI for Business Development: Volume 1 (pp. 1-13). Cham: Springer Nature Switzerland.
- Raihan, A., Voumik, L. C., Ridwan, M., Ridzuan, A. R., Jaaffar, A. H., & Yusoff, N. Y. M. (2023b). From growth to green: navigating the complexities of economic development, energy sources, health spending, and carbon emissions in Malaysia. Energy Reports, 10, 4318-4331. [CrossRef]
- Ramzan, M., Razi, U., Usman, M., Sarwar, S., Talan, A., & Mundi, H. S. (2024). Role of nuclear energy, geothermal energy, agriculture, and urbanization in environmental stewardship. Gondwana Research, 125, 150-167.
- Renzhi N, Baek YJ (2020) Can financial inclusion be an effective mitigation measure? evidence from panel data analysis of the environmental Kuznets curve. Financ Res Lett 37. [CrossRef]
- Ridwan, M. (2023). Unveiling the powerhouse: Exploring the dynamic relationship between globalization, urbanization, and economic growth in Bangladesh through an innovative ARDL approach.
- Ridwan, M. R., & Hossain, M. I. H. I. (2024). Does trade liberalization policy accelerate foreign direct investment in Bangladesh?: An empirical investigation.
- Ridwan, M., Akther, A., Al Absy, M. S. M., Tahsin, M. S., Ridzuan, A. R., Yagis, O., & Mukhtar, K. J. (2024e). The Role of Tourism, Technological Innovation, and Globalization in Driving Energy Demand in Major Tourist Regions. International Journal of Energy Economics and Policy, 14(6), 675-689. [CrossRef]
- Ridwan, M., Akther, A., Tamim, M.A. et al. Environmental health in BIMSTEC: the roles of forestry, urbanization, and financial access using LCC theory, DKSE, and quantile regression. Discov Sustain 5, 429 (2024f). [CrossRef]
- Ridwan, M., Al Jubayed, A., Kayser, K. A., Ahmed, M. E., Chowdhury, R. R., Hassan, M. R., ... & Kanij, H. N. (2025). Examine the Role of Political Stability and Education Toward Green Economy: An Empirical Evidence for Bangladesh. Environment, Innovation and Management, 1, 2550011. [CrossRef]
- Ridwan, M., Aspy, N. N., Bala, S., Hossain, M. E., Akther, A., Eleais, M., & Esquivias, M. A. (2024d). Determinants of environmental sustainability in the United States: analyzing the role of financial development and stock market capitalization using LCC framework. Discover Sustainability, 5(1), 319. [CrossRef]
- Ridwan, M., Bala, S., Al Shiam, S. A., Akhter, A., Asrafuzzaman, M., Shochona, S. A., ... & Shoha, S. (2024b). Leveraging AI for a Greener Future: Exploring the Economic and Financial Impacts on Sustainable Environment in the United States. [CrossRef]
- Ridwan, M., Bala, S., Al Shiam, S. A., Akhter, A., Hasan, M. M., Asrafuzzaman, M., ... & Bibi, R. (2024c). Leveraging AI for Promoting Sustainable Environments in G-7: The Impact of Financial Development and Digital Economy via MMQR Approach. [CrossRef]
- Ridwan, M., Raihan, A., Ahmad, S., Karmakar, S., & Paul, P. (2023). Environmental sustainability in France: The role of alternative and nuclear energy, natural resources, and government spending. Journal of Environmental and Energy Economics, 2(2), 1-16. [CrossRef]
- Ridwan, M., Urbee, A. J., Voumik, L. C., Das, M. K., Rashid, M., & Esquivias, M. A. (2024a). Investigating the environmental Kuznets curve hypothesis with urbanization, industrialization, and service sector for six South Asian Countries: Fresh evidence from Driscoll Kraay standard error. Research in Globalization, 8, 100223. [CrossRef]
- Sadorsky P (2014) The effect of urbanization on CO2 emissions in emerging economies. Energy Econ 41:147–153. [CrossRef]
- Shabir, M. Does Financial Inclusion Promote Environmental Sustainability: Analyzing the Role of Technological Innovation and Economic Globalization. J Knowl Econ 15, 19–46 (2024). [CrossRef]
- Shahbaz, M., Haouas, I., & Van Hoang, T. H. (2019). Economic growth and environmental degradation in Vietnam: is the environmental Kuznets curve a complete picture?. Emerging Markets Review, 38, 197-218. [CrossRef]
- Shahzadi, H. N., Sheikh, S. M., Sadiq, A., & Rahman, S. U. (2023). Effect of Financial Development, Economic Growth on Environment Pollution: Evidence from G-7 based ARDL Cointegration Approach. Pakistan Journal of Humanities and Social Sciences, 11(1), 68-79. [CrossRef]
- Shaikh, S. S., Amin, N., & Song, H. (2024). Carbon dynamics: A holistic analysis of FDI, trade liberalization, urbanization, economic growth, and effects on CO2 emissions in South Asia. Energy & Environment, 0958305X241291005. [CrossRef]
- Shoha, S., Al Shiam, S. A., Abir, S. I., Saha, D., Bala, S., Dolon, M. S. A., ... & Bibi, R.(2024) Towards Carbon Neutrality: The Impact of Private AI Investment and Financial Development in the United States–An Empirical Study Using the STIRPAT Model.
- Shourov, M. A. H., Hassan, M. R., Al Jubayed, A., Jalal, M. M., Debnath, A., & Giri, A. K. (2025). Artificial Intelligence and the Next-Gen Supply Chain: Energy-Economy Linkages in the United States. Innovations in Environmental Economics, 1(1), 39-55.
- Siche R, Pereira L, Agostinho F, Ortega E (2010) Convergence of ecological footprint and energy analysis as a sustainability indicator of countries: Peru as case study. Commun Nonlinear Sci Numer Simul 15(10):3182–3192.
- Solarin, S.A., Nathaniel, S.P., Bekun, F.V. et al. Towards achieving environmental sustainability: environmental quality versus economic growth in a developing economy on ecological footprint via dynamic simulations of ARDL. Environ Sci Pollut Res 28, 17942–17959 (2021). [CrossRef]
- Statista. (2024a). U.S. real GDP growth rate 1990-2023. Available at: https://www.statista.com/statistics/188165/annual-gdp-growth-of-the-united-states-since-1990/.
- Statista. (2024b). U.S. real GDP growth by quarter Q2 2013- Q2 2024. Available at: https://www.statista.com/statistics/188185/percent-change-from-preceding-period-in-real-gdp-in-the-us/.
- Stock JH, Watson MW (1993) A simple estimator of cointegrating vectors in higher-order integrated systems. Econometrica 61:783–820. [CrossRef]
- Sultana, T., Hossain, M. S., Voumik, L. C., & Raihan, A. (2023). Does globalization escalate the carbon emissions? Empirical evidence from selected next-11 countries. Energy Reports, 10, 86-98. [CrossRef]
- Tanchangya, T., Raihan, A., Rahman, J., Ridwan, M., & Islam, N. (2024a). A bibliometric analysis of the relationship between corporate social responsibility (CSR) and firm performance in Bangladesh. Frontiers of Finance, 2(2). [CrossRef]
- Tipon Tanchangya, A. R., Rahman, J., & Ridwan, M. (2024b). A Review of Deep Learning Applications for Sustainable Water Resource Management.
- Tipon Tanchangya, M. R., Raihan, A., Khayruzzaman, M. S. R., Rahman, J., Foisal, M. Z. U., Babla Mohajan, A. P., ... & Islam, S.(2024c). Nexus Between Financial Development and Renewable Energy Usage in Bangladesh.
- Tukhtamurodov, A., Sobirov, Y., Toshalieva, S., Ibrayimova, D., & Feruz, M. (2024). Determinants of CO2 emissions in the BRICS. A dynamic Panel ARDL approach. In BIO Web of Conferences (Vol. 82, p. 06002). EDP Sciences.
- Urbee, A. J., Hasan, M. A., Ridwan, M., & Dewan, M. F. (2025). Adaptation and Resilience in the Face of Climate-Induced Migration: Exploring Coping Strategies in the Urban Economy of Barishal Metropolitan City. Environment, Innovation and Management, 1, 2550005.
- Usman, M., Makhdum, M. S. A., & Kousar, R. (2021). Does financial inclusion, renewable and non-renewable energy utilization accelerate ecological footprints and economic growth? Fresh evidence from 15 highest emitting countries. Sustainable Cities and Society, 65, 102590. [CrossRef]
- Van, D. T. B., & Bao, H. H. G. (2018). The role of globalization on carbon dioxide emission in Vietnam incorporating industrialization, urbanization, gross domestic product per capita and energy use. International Journal of Energy Economics and Policy, 8(6), 275-283.
- Voumik, L. C., & Ridwan, M. (2023). Impact of FDI, industrialization, and education on the environment in Argentina: ARDL approach. Heliyon, 9(1). [CrossRef]
- Voumik, L. C., Akter, S., Ridwan, M., Ridzuan, A. R., Pujiati, A., Handayani, B. D., ... & Razak, M. I. M. (2023a). Exploring the factors behind renewable energy consumption in Indonesia: Analyzing the impact of corruption and innovation using ARDL model. International Journal of Energy Economics and Policy, 13(5), 115-125. [CrossRef]
- Voumik, L. C., Rahman, M. H., Rahman, M. M., Ridwan, M., Akter, S., & Raihan, A. (2023c). Toward a sustainable future: Examining the interconnectedness among Foreign Direct Investment (FDI), urbanization, trade openness, economic growth, and energy usage in Australia. Regional Sustainability, 4(4), 405-415. [CrossRef]
- Voumik, L. C., Ridwan, M., Rahman, M. H., & Raihan, A. (2023b). An investigation into the primary causes of carbon dioxide releases in Kenya: Does renewable energy matter to reduce carbon emission?. Renewable Energy Focus, 47, 100491. [CrossRef]
- WDI. (2024) World Bank Indicators. Available at: https://databank.worldbank.org/source/world-development-indicators. Accessed 12 Apr 2024.
- Yu H, Wei Wei, Li J, Li Y (2022) The impact of green digital finance on energy resources and climate change mitigation in carbon neutrality: case of 60 economies. Resour Policy 103116. [CrossRef]
- Zare, Z., Sifat, A. I., & Karatas, M. (2025). A Review of data analytics and machine learning for personalization in tech sector marketing. Journal of soft computing and decision analytics, 3(1), 92-111.
- Zhang J, Zhang Y (2021) Tourism, economic growth, energy consumption, and CO2 emissions in China. Tour Econ 27(5):1060–1080.
Figure 1.
Forecasting value of LCF from 2023 to 2040.
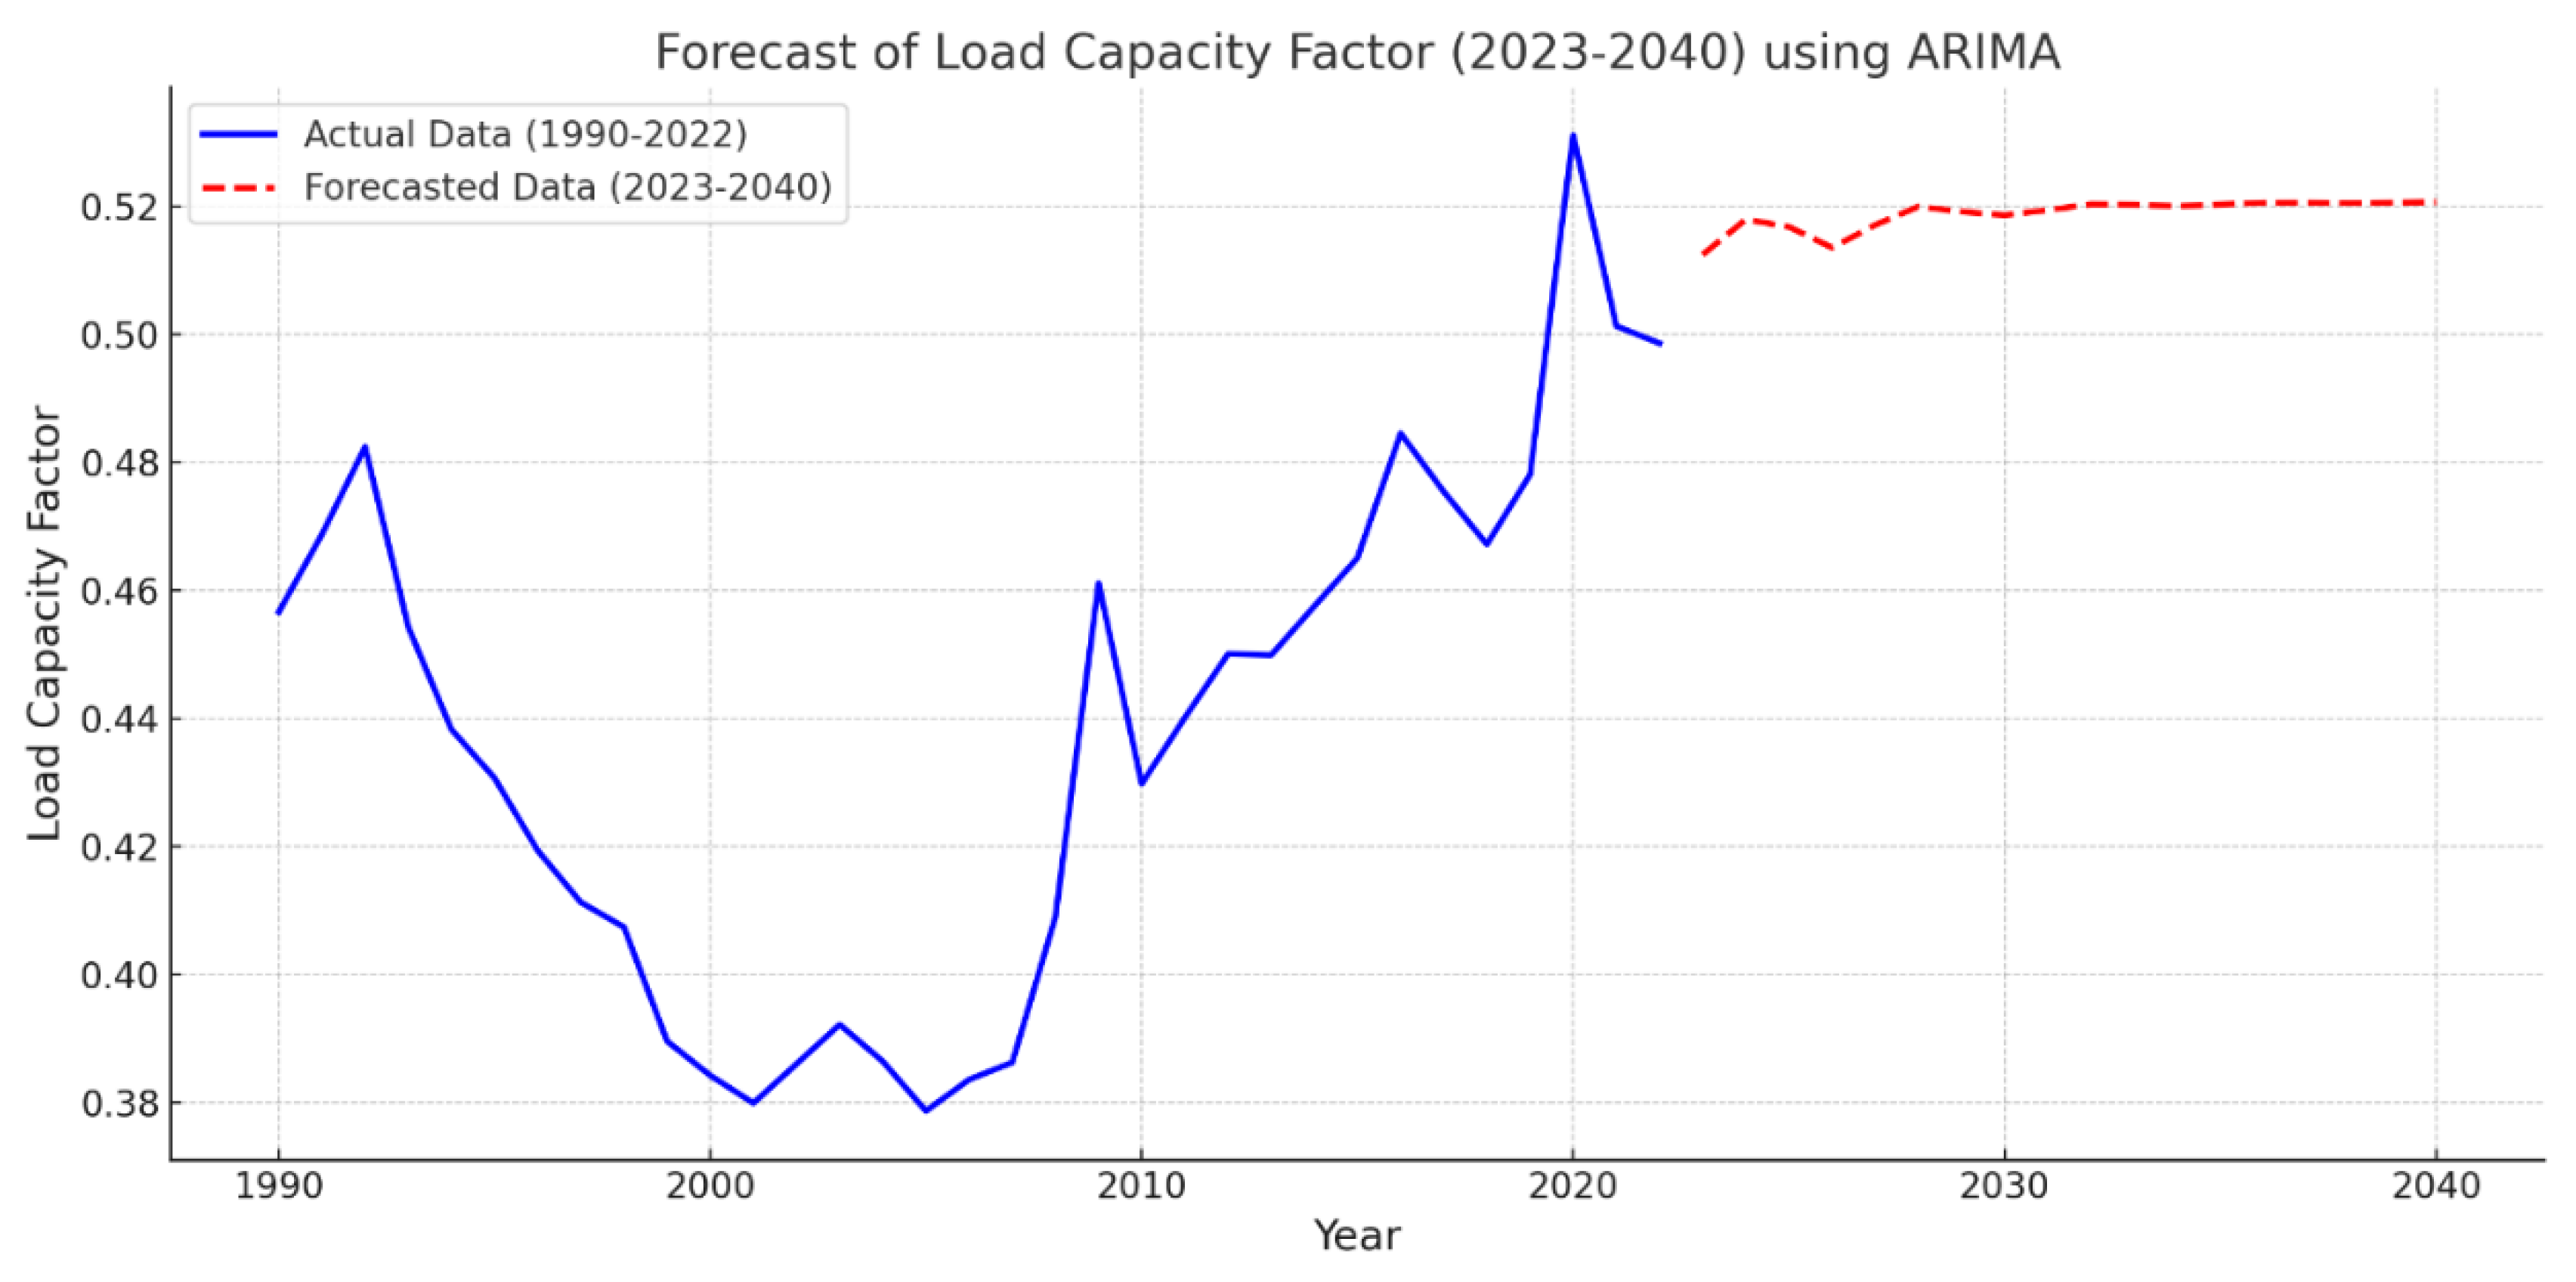
Figure 2.
CUSUM and CUSUMSQ test.
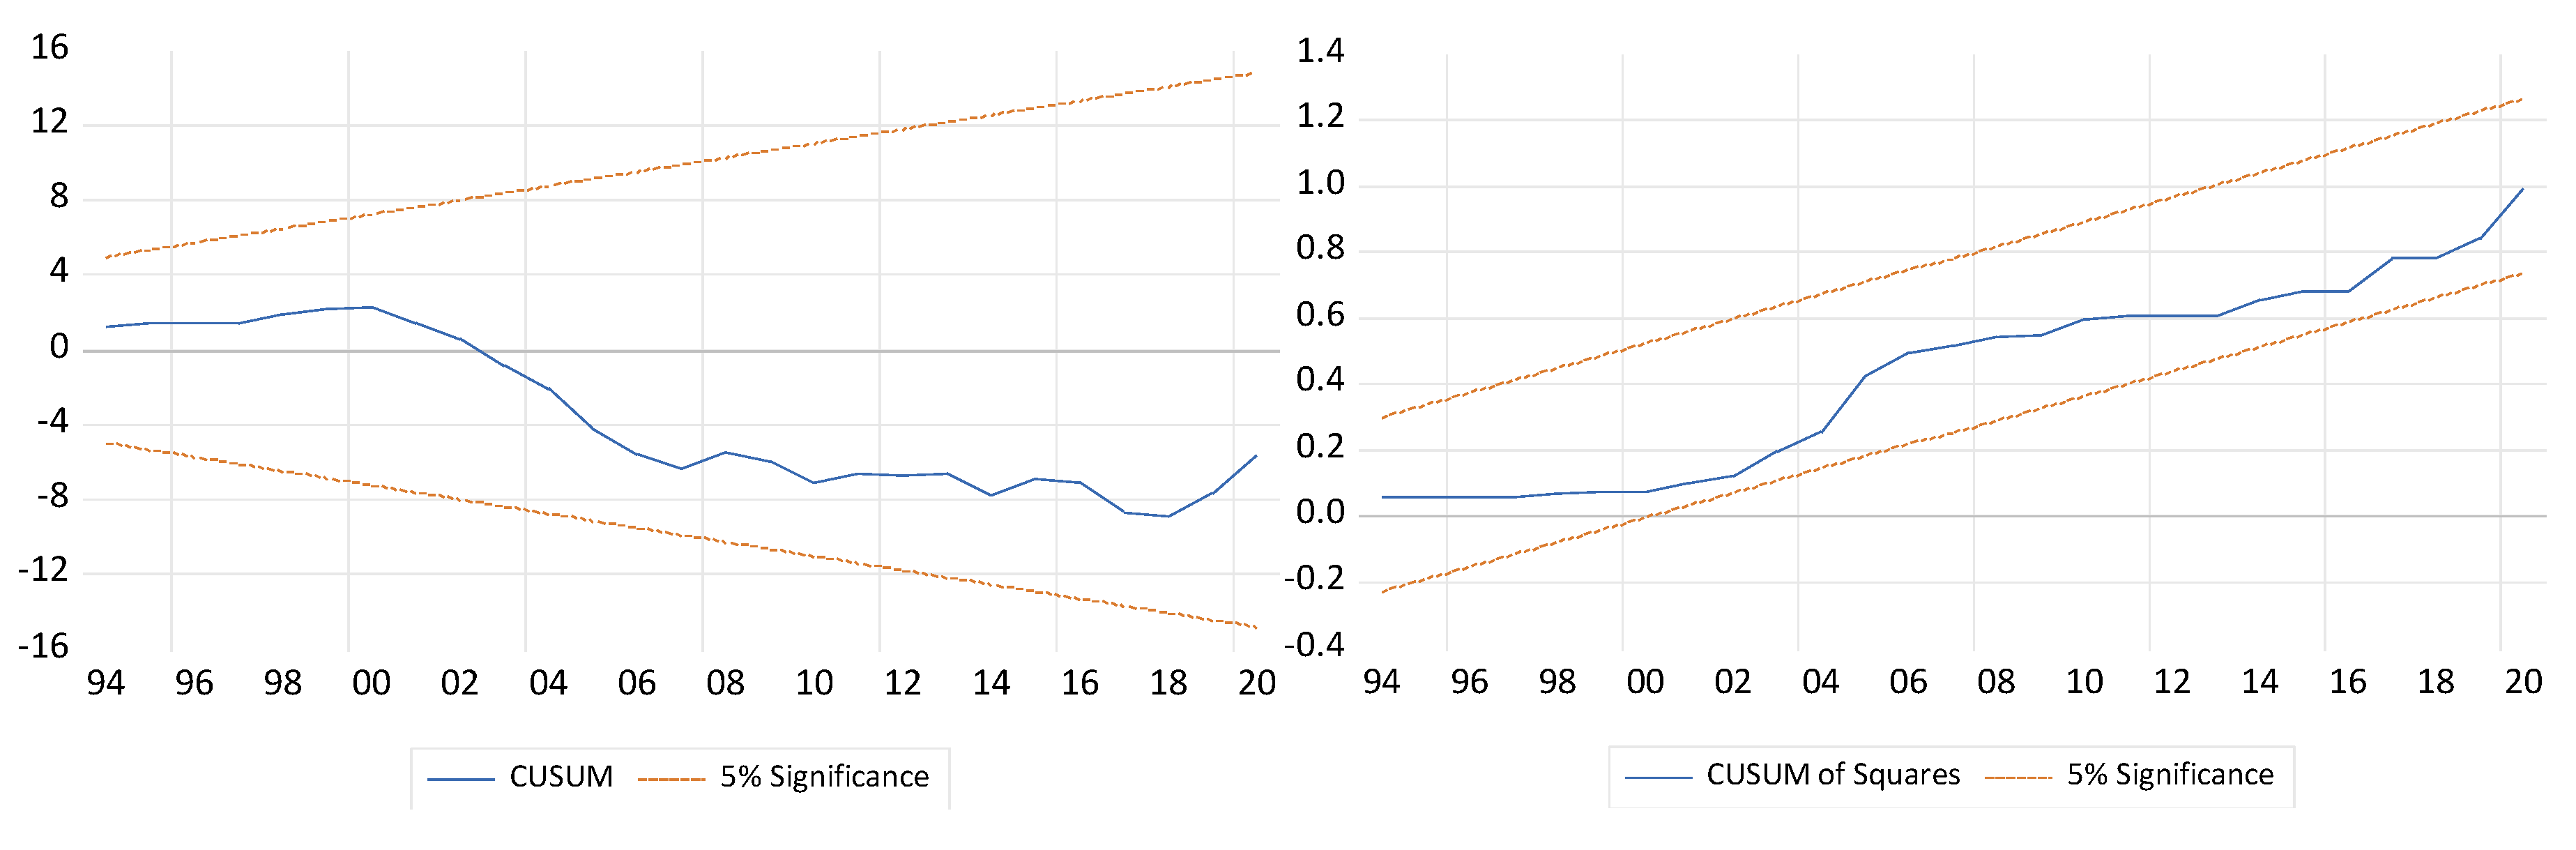
Table 2.
Descriptive statistics of Variables.
| Variable | Obs | Mean | Std. Dev. | Min | Max |
| T | 32 | 2005.5 | 9.381 | 1990 | 2021 |
| LLCF | 32 | -.835 | .094 | -.971 | -.633 |
| LGDP | 32 | 10.644 | .319 | 10.081 | 11.159 |
| LGDP2 | 32 | 113.392 | 6.761 | 101.63 | 124.532 |
| ENU | 33 | 1.876 | .333 | 1.411 | 2.398 |
| LFA | 32 | -.129 | .033 | -.183 | -.065 |
| LURBA | 32 | 4.378 | .027 | 4.321 | 4.417 |
Table 3.
Results of Unit root test.
| Variables | ADF | P-P | DF-GLS | Decision | |||
| I(0) | I(1) | I(0) | I(1) | I(0) | I(1) | ||
| LLCF | -0.355 | -4.245*** | -0.489 | -4.273*** | -1.285 | -4.145*** | I(1) |
| LGDP | -0.560 | -4.341*** | -0.306 | -4.908*** | -1.165 | -3.067*** | I(1) |
| LGDP2 | -0.376 | -4.815*** | -0.654 | -4.745*** | -1.031 | -4.634** | I(1) |
| LENU | -2.056 | -4.134*** | -1.068 | -3.716*** | -2.761 | -4.076*** | I(1) |
| LFA | -3.871** | -4.071*** | -3.703** | -4.021*** | -3.771** | -4.052*** | I(0) |
| LURBA | -5.871*** | -4.032*** | -3.055** | -4.094*** | -3.372** | -3.712*** | I(0) |
Table 4.
Results of ARDL Bound test.
| Test Statistic | Value | Signif. | I(0) | I(1) |
| F-statistic | 6.09182 | 10% | 2.08 | 3.01 |
| K=5 | 6% | 2.39 | 3.38 | |
| 2.50% | 2.70 | 3.73 | ||
| 1% | 3.06 | 4.15 |
Table 6.
Robustness Check.
| Variables | FMOLS | DOLS | CCR |
| LCF dependent | |||
| LGDP | -0.232***(0.2074) | -0.249**(0.1024) | -0.239***(0.0182) |
| LGDP2 | 0.234***(0.0243) | 0.241*(0.0234) | 0.254**(0.1205) |
| LENU | -0.321***(0.2014) | -0.378***(0.2014) | -0.236***(0.2034) |
| LFA | 0.054**(0.0723) | 0.047**(0.4201) | 0.065**(0.2055) |
| LURBA | -0.172**(0.0729) | -0.270***(0.2601) | -0.065***(0.3411) |
| C | 10.723**(4.0437) | 10.291**(4.0451) | 10.652**(7.8929) |
| R-squared | 0.9101 | 0.9424 | 0.9691 |
Table 7.
The findings of diagnostic tests.
| Diagnostic tests | Coefficient | p-value | Decision |
| Jarque-Bera test | 0.24569 | 0.1876 | Residuals are normally distributed |
| Lagrange Multiplier test | 0.13765 | 0.5067 | No serial correlation |
| Breusch-Pagan-Godfrey test | 1.19098 | 0.2098 | No heteroscedasticity |
Disclaimer/Publisher’s Note: The statements, opinions and data contained in all publications are solely those of the individual author(s) and contributor(s) and not of MDPI and/or the editor(s). MDPI and/or the editor(s) disclaim responsibility for any injury to people or property resulting from any ideas, methods, instructions or products referred to in the content. |
© 2025 by the authors. Licensee MDPI, Basel, Switzerland. This article is an open access article distributed under the terms and conditions of the Creative Commons Attribution (CC BY) license (http://creativecommons.org/licenses/by/4.0/).
Copyright: This open access article is published under a Creative Commons CC BY 4.0 license, which permit the free download, distribution, and reuse, provided that the author and preprint are cited in any reuse.


