
Submitted:
22 July 2025
Posted:
23 July 2025
You are already at the latest version
Abstract
The Tibetan Plateau's lakes, serving as critical water towers for over two billion people, exhibit divergent responses to climate change that remain poorly quantified. This study develops a deep learning framework integrating Synthetic Aperture Radar (SAR) altimetry from Sentinel-3A with bias-corrected CMIP6 (Coupled Model Intercomparison Project Phase 6) climate projections under Shared Socioeconomic Pathways (SSP) scenarios (SSP2-4.5 and SSP5-8.5, adjusted via quantile mapping) to predict lake-level changes across eight Tibetan Plateau (TP) lakes. Using a Feed-Forward Neural Network (FFNN) optimized via Bayesian optimization using the Optuna framework, we achieve robust water level projections (mean validation R² = 0.861) and attribute drivers through SHapley Additive exPlanations (SHAP) analysis. Results reveal a stark north-south divergence: glacier-fed northern lakes like Migriggyangzham will rise by +13.27 m under SSP5-8.5 due to meltwater inputs (temperature SHAP value = 0.41), consistent with the early (melt-dominated) phase of the IPCC’s ‘peak water’ framework. In comparison, evaporation-dominated southern lakes such as Langacuo face irreversible desiccation (−5.03 m by 2100) as evaporative demand surpasses precipitation gains. Transitional western lakes exhibit "peak water" inflection points (e.g., Lumajang Dong's 2060 maximum) signaling cryospheric buffer loss. These projections, validated through rigorous quantile mapping and rolling-window cross-validation, provide the first process-aware assessment of TP Lake vulnerabilities, informing adaptation strategies under the Sustainable Development Goals (SDGs) for water security (SDG 6) and climate action (SDG 13). The methodological framework establishes a transferable paradigm for monitoring high-altitude freshwater systems globally.
Keywords:
Tibetan Plateau
; climate change
; lake level changes
; feed-forward neural network
; SHapley Additive exPlanations
1. Introduction
The Tibetan Plateau, often called the Earth’s “third pole,” hosts one of the largest freshwater reserves and serves as the source of major river systems, supplying water to over 2 billion people across Asia [1,2].
Its lakes are critical components of the regional hydrosphere, with water level variations exerting a strong influence on the Plateau’s hydrological cycle [3,4]. Satellite observations have documented a 25% expansion in total lake area, along with an average water level rise of approximately 4 meters since the 1970s, adding nearly 170 gigatons of water [5]. However, this expansion contrasts sharply with the drying trends seen in southern basins [6]. While northern and western lakes are primarily rising due to accelerated glacial melt, southern lakes like Langacuo are shrinking due to increased evaporation (Gholami and Zhang, 2025a). These divergent patterns reflect complex interactions between glacial retreat, evolving precipitation regimes, and intensifying evaporative demand.
The TP has warmed at 0.34°C per decade (1961–2020)—twice the global average—with CMIP6 projections indicating further warming of 2.6–4.8°C by 2100 under SSP2-4.5 and SSP5-8.5 scenarios [7,8]. Precipitation trends are spatially asymmetric, with northern regions moistening (+3.07% per decade) while southeastern areas aridify due to rising evaporative demand [9]. These changes are exacerbated by accelerating glacial melt (projected losses of 22–36% by 2099; [8] and evaporation increases (2.7–2.9 mm decade-1; Yang, Ye and Wang, 2025), creating complex feedbacks that existing linear models fail to capture (Merrifield et al., 2023; Zhang et al., 2011).
Recent advances in satellite altimetry have significantly enhanced our capacity to monitor these changes, with Sentinel-3A’s SAR offering unprecedented precision in high-altitude water level measurements [10,11]. However, critical knowledge gaps persist in translating these observational records into predictive frameworks capable of anticipating future hydrological regimes. Three fundamental limitations constrain current understanding: first, the predominant reliance on linear climate models [12] that fail to capture nonlinear cryosphere-hydrosphere feedbacks. Second, while broad spatial patterns in lake changes have been identified, notably, expansion in the north versus contraction in the south [6,13,14] —existing studies rarely quantify how specific climatic drivers (temperature, precipitation, evaporation) differentially influence these regional responses; and third, the absence of robust methodologies to forecast when critical thresholds such as “peak water” in glacier-fed systems might occur.
This study addresses these gaps by developing a novel modeling framework that integrates multi-source satellite altimetry with explainable artificial intelligence. Our approach combines threshold-based retracking of Sentinel-3A Level 1/2 SAR data, bias-corrected CMIP6 projections (SSP2-4.5 and SSP5-8.5), and a process-aware deep learning model to achieve three main objectives: (1) quantify the relative contributions of temperature, precipitation, evaporation, and runoff to historical water level variations across northern, southern, western, and eastern lakes; (2) forecast future lake-level changes under CMIP6 scenarios (SSP2-4.5, SSP5-8.5); and (3) identify critical inflection points in hydrological regimes through SHAP value analysis.
The scientific significance of this work extends beyond observational documentation to establish a predictive paradigm for high-altitude hydrology. By moving from correlation-based analyses to mechanism-driven forecasting, we provide the first comprehensive assessment of when and how TP lakes will transition between climate-driven regimes. Our findings carry immediate implications for sustainable water management across Asia, particularly in addressing the United Nations SDGs related to clean water access (SDG 6) and climate action (SDG 13). Furthermore, the methodological framework developed here offers a transferable approach for monitoring vulnerable freshwater systems in other high-mountain regions experiencing rapid environmental change.
2. Materials and Methods
2.1. Data Sources and Preprocessing
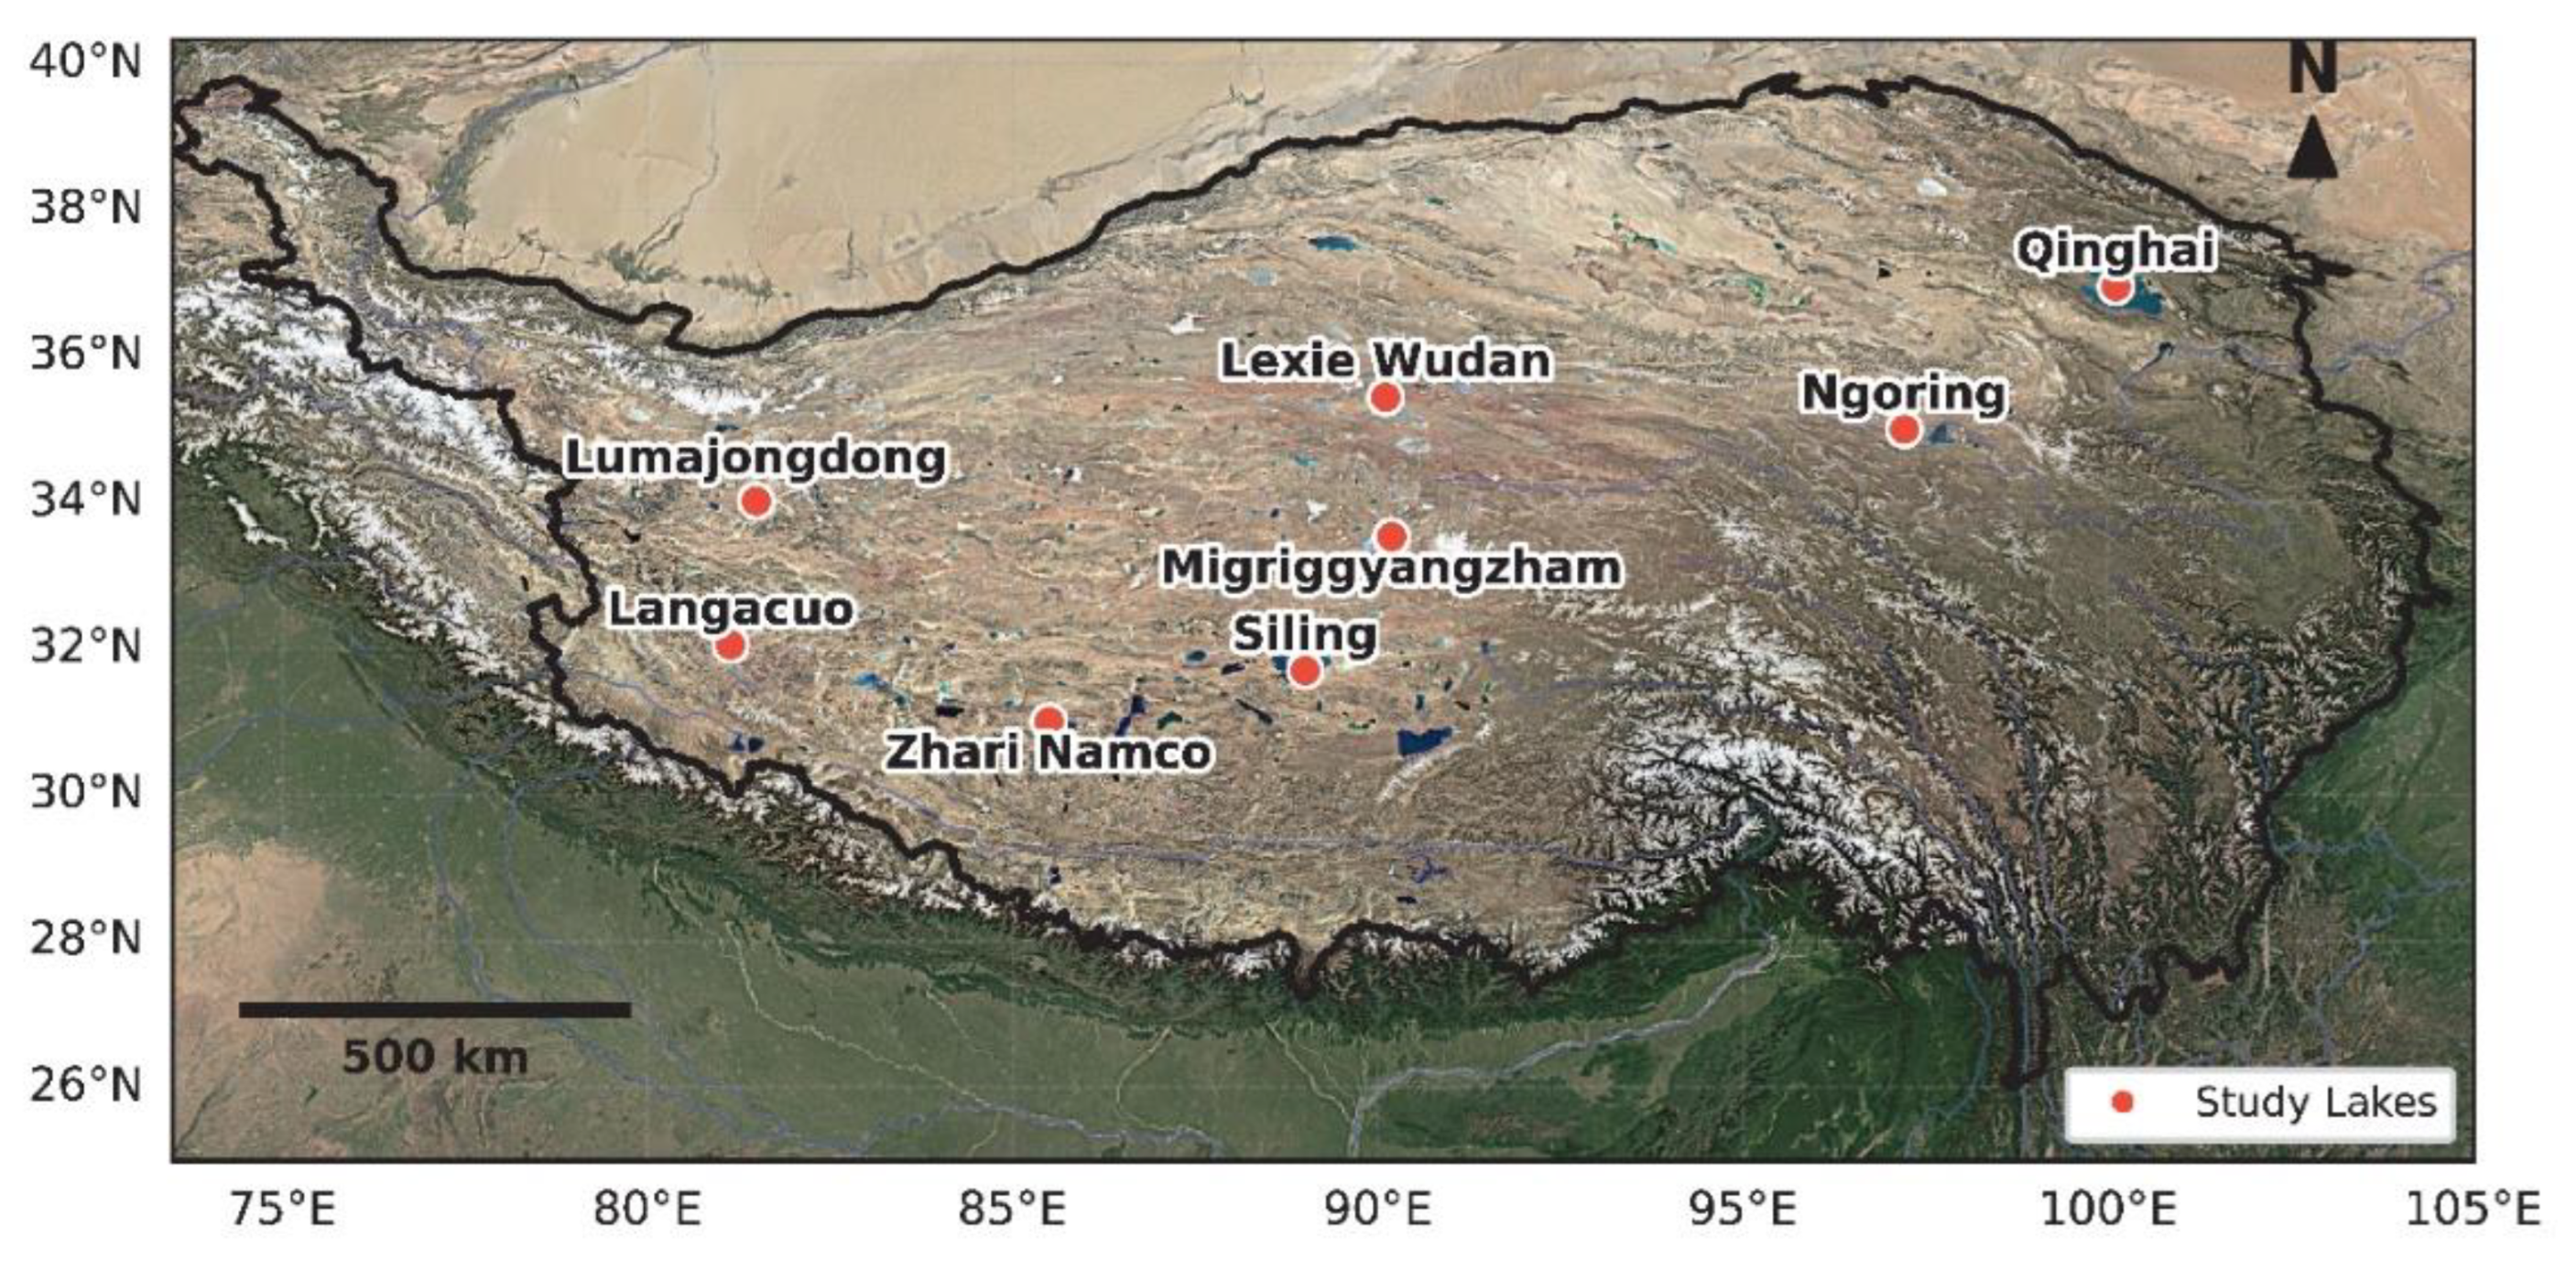
This study focused on eight TP lakes with sufficient temporal coverage (Supplementary Table S1) for robust model training.
Figure 1.
Study Area and Lakes Analyzed for Water Level Changes in the TP.
Water level measurements were derived from Sentinel-3A altimetry data processed through threshold-based sub-waveform retracking, as detailed in our previous work [15]. To establish a comprehensive baseline and capture long-term variability essential for deep learning applications, the Sentinel-3A records were extended using historical datasets from the DAHITI and Hydroweb databases (1992–2016). All time series were harmonized using Quantile Delta Mapping (QDM) to ensure consistency across datasets, achieving strong agreement (R² = 0.94-1.00 across lakes).
Historical climate data were obtained from Fifth Generation European Centre for Medium-Range Weather Forecasts Reanalysis (ERA5), with the extraction period aligned to match the available water data for each lake (ranging from 1992 to 2024). Future climate projections (2024–2100) were derived from an ensemble of CMIP6 models under SSP2-4.5 and SSP5-8.5 from five CMIP6 models including Chinese Academy of Sciences Earth System Model version 2 (CAS-ESM2), Community Earth System Model version 2 (CESM2), Flexible Global Ocean–Atmosphere–Land System Model, finite-volume version 3, low resolution (FGOALS-f3-L), Flexible Global Ocean–Atmosphere–Land System Model, grid-point version 3 (FGOALS-g3), and Max Planck Institute Earth System Model version 1.2, high resolution (MPI_ESM1-2-HR). These models were selected not only for their CMIP6 Tier 1 priority status and participation in ScenarioMIP experiments, but also for their documented skill in simulating high-altitude climate dynamics [16,17]. CMIP6 models exhibit significant variability in their ability to simulate different climatic variables, and there is no single model that best represents all variables. To solve this, Climatic variables that show the best performance across the models, based on their statistical metrics, were selected, similar to Merrifield et al. (2023) [18]. To address systematic biases, QDM was applied to the historical period (1940–2014), while Empirical Quantile Mapping (EQM) was used for future scenarios (2015–2100), ensuring consistency with observed climatology (Supplementary Figures S1–S8). This was validated through split-sample testing (1940-2000 training, 2000-2014 validation).
2.2. Deep Learning Framework
A fully connected feed-forward neural network was implemented to model the nonlinear relationships between climate drivers and lake-level dynamics across the Tibetan Plateau. A feed-forward neural network was chosen for its balance of predictive accuracy and computational efficiency, particularly suited to the moderate-length (8–30 years) lake-level time series. Unlike LSTMs, the FFNN effectively captures hydrological memory through lagged inputs without overfitting, while offering robust generalization across diverse lake systems and climate scenarios.
The architecture incorporated an input layer (60 nodes) receiving 12-month lagged climate variables and autocorrelated water levels, followed by two hidden layers with rectified linear unit (ReLU) activation. Dropout regularization and L2 weight decay were applied to prevent overfitting. The Adam optimizer dynamically adjusted learning rates during training, with hyperparameters optimized via 500 trials of Bayesian optimization (Optuna framework). The output layer generates water level predictions through a single linear node, enabling direct comparison with observational records.
2.3. Model Validation and Interpretation
The study implemented rolling window cross-validation (RWCV) to evaluate model performance while preserving hydrological time dependencies. For each lake, the neural network was trained on progressively expanding temporal windows and validated on subsequent periods, with window sizes adapted to individual lake characteristics (record length and response timescales). Validation metrics—coefficient of determination (R²), mean absolute error (MAE), and root mean square error (RMSE)—were computed per segment and aggregated to assess overall performance.
2.4. Mechanistic Attribution of Hydrological Trends Using Explainable AI
Mechanistic drivers of lake water level variations were analyzed using explainable machine learning approaches combining Random Forest (RF) regression and SHAP. The analysis was conducted separately for historical (ERA5) and future (CMIP6 RCP8.5) periods to identify shifting hydrological controls.
The RF model, implemented using scikit-learn’s RandomForestRegressor with random_state=42, was tuned for each lake using 3-fold TimeSeriesSplit cross-validation with grid search, optimizing mean squared error across parameters including number of trees (100–300), maximum depth (5–20), minimum samples per split (2–5), minimum samples per leaf (1–3), and feature sampling (sqrt, log2). Feature importance scores identified key drivers of water-level changes. SHAP values were computed using the TreeExplainer method, with the mean of the training dataset as the baseline, using all data per lake due to small sample sizes. Dependence and interaction plots explored nonlinear interactions, revealing, for example, how precipitation and temperature influence water levels [19].
2.5. Scenario Analysis and Uncertainty Quantification
The uncertainty quantification framework employed in this study includes: (1) scenario uncertainty, assessed through comparative analysis of SSP2-4.5 and SSP5-8.5 projections using bootstrapped confidence intervals and trend diagnostics (e.g., Kendall’s τ); (2) nonlinear temporal dynamics, identified via pre/post-2050 R² shifts and the detection of hydrological regime transitions such as the “peak water” effect; and (3) variance decomposition, using percentile-based spread analysis to disentangle internal variability from emission pathway dependencies. This tripartite framework enables robust attribution of projection uncertainty, tailored to diverse lake typologies and dominant hydrological processes.
3. Results
3.1. Evaluation of CMIP6 Model Performance
The evaluation of five CMIP6 models demonstrated notable variability in their ability to simulate key climatic variables across the TPlakes. For temperature, MPI-ESM1-2-HR consistently outperformed other models in most lakes, achieving high Nash-Sutcliffe Efficiency (NSE) and correlation coefficient (R) values. For evaporation, CESM2 emerged as the top performer, while FGOALS-f3-L showed the best relative accuracy for runoff, though with generally lower metrics. Among the models, CAS-ESM2 and MPI-ESM1-2-HR excelled for specific lakes, such as Langacuo and Siling, respectively. A detailed breakdown of performance metrics, including NSE and R values for each model, lake, and variable, is provided in Supplementary Figures S9 and S10.
3.2. Hydrological Projections Under Climate Scenarios
The Tibetan Plateau’s lakes exhibit spatially divergent responses to climate forcing, governed by the interplay of cryospheric meltwater inputs, evaporative demand, and precipitation variability. These responses delineate four distinct hydrological regimes: glacier-dominated northern lakes, evaporation-controlled southern lakes, transitional western lakes, and precipitation-evaporation balanced eastern lakes.
Migriggyangzham Lake, a glacier-fed system in the northern Tibetan Plateau, is projected to experience significant water level increases by 2100, rising by 9.3 m under SSP2-4.5 and 13.6 m under SSP5-8.5, a 1.5x faster rise under high emissions (Figure 2A). These trends, driven by glacial melt, align with the early melt-dominated phase of the IPCC’s “peak water” framework. Historically, water levels rose at 0.53 m year⁻¹, driven by glacial runoff (SHAP = 0.30) and warming temperatures (SHAP = 0.27), with precipitation (SHAP = 0.23) and evaporation (SHAP = 0.20) as secondary contributors (Supplementary Figure S12). On warmer days (>0°C, 36% of days), runoff averaged 0.28 mm day⁻¹, 1.5 times the baseline. Future Projections: Compared to Lexie Wudan’s more modest rises (+6.4 m under SSP2-4.5, +8.3 m under SSP5-8.5), driven by weaker glacial inputs and stronger precipitation (Figure 2B), Migriggyangzham’s larger increases reflect greater reliance on glacial melt (SHAP = 0.41 vs. 0.36 in SSP2-4.5; Supplementary Figures S11 and S12). Under SSP5-8.5, intensified warming (0.07°C year⁻¹ vs. 0.03°C year⁻¹ in SSP2-4.5) accelerates meltwater surges. Evaporation rises in both scenarios (0.8–0.9 mm year⁻¹), posing future risks, while precipitation plays a minor role, increasing significantly only under SSP5-8.5 (1.2 mm year⁻¹). Runoff’s influence declines sharply (23–53% reduction in SHAP importance by 2100 under SSP5-8.5) as glacial reserves diminish. Nonlinear Dynamics: SHAP analysis shows that high runoff events contribute less to sustained water level increases as glaciers shrink, indicated by negative SHAP values (Supplementary Figures S11 and S12, showing declining runoff contributions). This suggests a transient water surplus followed by potential declines post-2100, highlighting the need to monitor glacial dynamics for future water management.
Lexie Wudan Lake, a northern glacier-fed system on the Tibetan Plateau, is projected to experience significant water level increases by 2100, rising by 6.4 m under SSP2-4.5 and 8.3 m under SSP5-8.5 (Figure 3B). These trends are driven by temperature-mediated glacial melt, with a SHAP value of 0.39 (comparable to Migriggyangzham’s 0.41), initially outweighing evaporative losses. Historically, water levels rose steadily, inferred from regional trends, driven primarily by glacial runoff (SHAP= 0.29) and warming temperatures (SHAP = 0.28), with precipitation (SHAP = 0.24) and evaporation (SHAP = 0.19) as secondary contributors (Supplementary Figures S13 and S14). On warmer days (>0°C, ~35% of days), runoff averaged ~0.36 mm day⁻¹, well above baseline levels
Compared to Migriggyangzham’s larger rises, Lexie Wudan’s more modest increases reflect weaker glacial inputs and stronger precipitation contributions (SHAP = 0.39 vs. 0.41 for temperature; Supplementary Figure S4). Under SSP5-8.5, intensified warming (0.07°C year⁻¹ vs. ~0.03°C year⁻¹ in SSP2-4.5) accelerates glacial melt, driving a 1.3x faster rise. Precipitation increases significantly, especially under SSP5-8.5 (2.55 mm year⁻¹ vs. Migriggyangzham’s 1.09 mm year⁻¹), with high precipitation events (0.4 mm day⁻¹) boosting water inputs. Evaporation remains stable under SSP5-8.5 or slightly decreases under SSP2-4.5 (0.73 mm year⁻¹), supporting water retention. Runoff shows no sustained increase, with a slight decline on warmer days under SSP5-8.5 (~3.65 mm year⁻¹), and its influence decreases by 20–40% in SHAP importance by 2100, signaling glacial depletion.
SHAP analysis reveals that high runoff events contribute less to sustained water level increases as glaciers shrink (Figure 4, showing declining runoff contributions). Stronger precipitation under SSP5-8.5 partially offsets this decline, suggesting a prolonged melt phase but potential post-2100 reductions. These trends highlight the need for integrated monitoring of glacial and precipitation dynamics for future water management.
Conversely, southern lakes exhibit a spectrum of evaporation-dominated responses, from aridification to transient stability. Langacuo exemplifies the most extreme decline (−5.03 m under SSP5-8.5 by 2100), with evaporation’s influence (SHAP = 0.31) overwhelming precipitation inputs (Supplementary Figures S15 and S16)—a transition marked by irreversible negative post-2050 R² values (−0.63). Under SSP2-4.5, significant warming (0.022 °C year-1, total: +1.495 °C) and increased evaporation (0.73 mm year-1) support this shift. Precipitation shows no significant trend, while runoff declines significantly (−2.55 mm year-1). Notably, 43.3% of days experience temperatures above 0 °C, and runoff on these days shows a strong downward trend (−0.116 mm day-1, p = 0.0054). Under the more extreme SSP5-8.5, warming intensifies (+0.075 °C year-1) with continued evaporation increases (+0.73 mm year-1) and no significant change in precipitation. Runoff again declines significantly (−1.82 mm year-1), with a steeper drop during warm days—defined as days with temperatures above 0 °C—which account for 45.8% of days that experience temperatures above 0 °C.
Siling exhibits transitional behavior: an initial rapid rise (+4.12 m under SSP5-8.5) peaks mid-century (2060–2080) before declining as glacial buffers deplete (Figure 3C). This “delay-then-decline” trajectory, distinct from Langacuo’s immediate desiccation, reflects residual cryospheric inputs that temporarily mitigate evaporation’s dominance (runoff SHAP = 0.202 under SSP2-4.5; Supplementary Figures S17 and S18), aligning with IPCC projections of heterogeneous responses in semi-arid, glacier-fed systems [20]. Under SSP2-4.5, significant warming (0.018 °C year-1), increasing evaporation (0.365 mm year-1), and runoff decline (monthly: −2.92 mm year-1) occur, while precipitation remains non-significant. Under SSP5-8.5, stronger warming (0.052 °C year-1), increased precipitation (3.65 mm year-1), rising evaporation (1.46 mm year-1), and modest runoff gains (0.365 mm year-1) are observed. Runoff above 0 °C rises (4.38 mm year-1) on 56.8% of days exceeding 0 °C, with top 10% precipitation events yielding 0.443 mm day-1 and warm–wet events 0.304 mm day-1. The summer temperature–runoff correlation is 0.1509, and the cold-day precipitation–runoff correlation is −0.0047. This pattern supports SHAP’s indication of temporary melt-driven gains followed by post-peak decline as glacial reserves diminish [21].
Zhari Namco exhibits muted growth in water level (+3.81 m under SSP5-8.5), where evaporative demand (SHAP = 0.308) partially offsets precipitation gains (Supplementary Figures S19 and S20). Under SSP2-4.5 (a rise of 0.47 meters), significant warming (0.022 °C year-1) and rising evaporation (0.365 mm year-1) occur, with non-significant increasing precipitation and runoff. Under SSP5-8.5, stronger warming (0.059 °C year-1), significant precipitation increases (1.46 mm year-1, p = 0.0007), and significant evaporation rise (1.095 mm year-1) are observed, while runoff remains non-significant. Low precipitation–runoff correlations (SSP2-4.5: 0.2421; SSP5-8.5: 0.3123) and weak runoff response above 0 °C validate SHAP’s emphasis on evaporation’s dominant role. Significant JJA (June–August) evaporation (SSP5-8.5) confirms this pattern, consistent with IPCC projections for semi-arid systems (IPCC, 2021, Chapter 10).
Compared to Langacuo’s immediate desiccation, Siling’s transitional melt-driven buffering and Zhari Namco’s muted gains illustrate the diverse but ultimately evaporation-dominated pathways expected for southern TP lakes. These contrasting trajectories—abrupt decline, delay-then-decline, and partial offsetting—underscore the urgency for proactive water governance to manage post-glacial hydrological shifts (Wang et al., 2018).
Western transitional lakes, exemplified by Lumajang Dong, exhibit an inflectional “peak water” trajectory—rising until mid-century before declining, reflecting the progressive loss of cryospheric buffering. Under SSP2-4.5, lake levels increase by +3.10 m by 2060 and then stabilize; under SSP5-8.5, stronger early warming causes a lower, earlier peak (+1.17 m), followed by a decline of −1.93 m by 2100. This divergence reflects the shrinking contribution of glacial meltwater: SHAP analysis shows runoff importance drops by 56–58% in SSP5-8.5 compared to historical conditions (Supplementary Figures S21 and S22).
Intensified warming (+3.88 °C), increased precipitation (+1.88 mm year-1), and elevated runoff (+1.82 mm year-1) under SSP5-8.5 initially sustain lake levels, but continued glacial retreat and enhanced evaporation reverse the trend. Although historical trends are statistically insignificant, runoff above 0 °C nearly doubles—supporting SHAP’s attribution of cryospheric inputs (SHAP = 0.282).
In contrast, Jieze—located at lower elevation—follows a precipitation-driven regime. Despite limited data, lake level increases (+0.5 m) align with positive precipitation anomalies. SHAP ranks precipitation as the dominant driver, with weak interactions (e.g., precipitation–evaporation: 0.037). Historical warming and runoff trends are non-significant (p > 0.3), yet runoff still increases by 2.2–2.4× on warmer days, reinforcing precipitation’s direct control over lake levels.
Eastern lakes, including Qinghai and Ngoring, exhibit divergent responses mediated by morphometry. Qinghai Lake, with its large storage capacity, resists drying, rising +4.77 m under SSP5-8.5, while Ngoring Lake declines by −1.8 m as evaporative demand (SHAP = 0.308) outpaces precipitation. These contrasts highlight the role of lake-specific attributes in modulating climate impacts. SHAP analysis shows water level gains (+4.77 m under SSP5-8.5; ~ +3.0 m under SSP2-4.5, scaled), driven by temperature (SHAP = 0.386) via glacial melt (Supplementary Figures S23 and S24). Under SSP2-4.5, significant warming (0.027°C year-1, p<0.0001; total: +2.0822°C) and evaporation (1.82 mm year-1, p<0.0001) occur, with non-significant precipitation and runoff. Under SSP5-8.5, warming (0.057°C year-1, p<0.0001; total: +4.3657°C) and evaporation (2.19 mm year-1, p<0.0001) increase, with significant precipitation (1.46 mm year-1) and runoff (1.095 mm year-1, p=0.0018). Runoff above 0°C trends upward (6.935 mm year-1, p=0.0536) for 62.9% of days exceeding 0 °C.
For Ngoring, SHAP analysis indicates a decline (-1.8 m under SSP5-8.5; ~ -1.0 m under SSP2-4.5), driven by evaporation (SHAP = 0.308) (Supplementary Figures S25 and S26). Under SSP2-4.5, significant evaporation (1.09 mm year-1, p<0.0001) and modest warming (0.007°C year-1, p=0.0209) occur, with non-significant precipitation and runoff. Under SSP5-8.5, stronger warming (0.042°C year-1, p<0.0001; total: +3.1956°C), evaporation (2.92 mm year-1, p<0.0001), and precipitation (1.46 mm year-1, p<0.0001) occur, with non-significant runoff.
Uncertainty partitioning revealed distinct patterns across lake typologies and emission scenarios. Glacier-fed lakes exhibited greater sensitivity to emission pathways, with scenario uncertainty contributing 16–23% of total projection variance, reflecting the emission-driven nature of glacial melt. Confidence intervals (95%) ranged from ±1.55 m (Langacuo) to ±9.02 m (Siling Co), positively correlated with cryospheric connectivity. In contrast, evaporation-dominated lakes showed high internal variability (88–99% of variance), driven by stochastic precipitation and evaporation processes, indicating their dependence on unpredictable atmospheric dynamics.Temporal analysis identified critical hydrological thresholds. For example, Lumajang Dong Lake exhibits a mid-century “peak water” transition (~2060) under SSP5-8.5, shifting from melt-driven gains to evaporative declines, while Langacuo’s post-2050 aridification trend (negative R² = −0.63) signals irreversible drying. These nonlinear responses, amplified under high-emission scenarios due to temperature-driven evaporation, highlight the robustness of our deep learning framework in capturing complex hydrological dynamics. These findings inform risk-based planning by quantifying scenario and internal variability across diverse lake systems.
4. Discussion
The divergent hydrological futures of TP lakes underscore the interplay of cryospheric, thermodynamic, and morphometric controls under climate change.
Our findings, synthesized from deep learning models and CMIP6 scenarios, highlight four distinct hydrological futures—northern expansion, southern aridification, western transitional peaks, and eastern morphometry-controlled variability—while emphasizing the urgency of spatially tailored adaptation strategies.
- Divergent Hydrological Regimes and Climatic Drivers
- (a) Northern Glacier-Fed Lakes
Northern TPlakes exhibit a clear transition from historically balanced runoff–temperature regimes to temperature-dominated systems under climate change. SHAP analysis reveals that while runoff historically sustained water levels in lakes Lexie Wudan and Migriggyangzham (Supplementary Figures S11 and S12), its influence declines sharply by 2100 under SSP5-8.5—by 23% and 53%, respectively—as glacial reserves are depleted. Temperature emerges as the dominant driver, fueling significant water-level rises of +8.35 m and +13.58 m, respectively, through intensified melt—consistent with the IPCC’s “peak water” framework (IPCC, 2023). These projections align with recent basin-scale modeling by Xu et al. (2024), who found that northern TP lakes will experience the most dramatic water-level increases (+10 to +21 m under SSP5-8.5), driven primarily by temperature-mediated processes (e.g., glacier melt and net precipitation) as runoff contributions plateau (7–15% by 2100)[22]. Notably, the relationship between runoff intensity and water level response becomes nonlinear in late-century projections. While moderate runoff maintains positive hydrological impacts, extreme meltwater events demonstrate diminishing returns, a pattern consistent with Xu et al.’s (2024) findings of declining glacier meltwater efficacy as storage capacities are exhausted. This threshold behavior, likely tied to modified drainage efficiency during glacial system degradation, has critical implications for predicting inflection points in lake-level trajectories.
- (b) Southern Evaporation-Dominated Lakes
Southern TPlakes are undergoing a fundamental hydrological shift from precipitation-influenced to evaporation-dominated regimes under climate change. SHAP analysis reveals that Langacuo’s dominant driver transitions from precipitation (historical SHAP Supplementary Figures S15 and S16) to evaporation (SSP5-8.5). This transition drives substantial water loss (−5.03 m by 2100), signaling the onset of long-term desiccation consistent with IPCC projections for high-altitude aridification under high-emission scenarios.
While Zhari Namco and Siling Lake do not yet exhibit outright drying, both reflect the same directional shift. In Zhari Namco, net water gains slow dramatically as evaporation surpasses runoff in influence, whereas Siling’s initial melt-driven rise peaks mid-century before entering a decline phase under SSP5-8.5. These patterns underscore a shared vulnerability: even lakes not currently shrinking are approaching critical thresholds where evaporative losses may soon outpace natural inputs. The findings emphasize the need for proactive water governance in anticipation of post-glacial hydrological transitions. This aligns with studies on aridification in warming regions, where shallow basins lack buffering capacity against evaporative stress 9.
- (c) Western Transitional Lakes
Western TPlakes, such as Lumajang Dong and Jieze, exhibit transitional hydrological behaviors shaped by altitude and cryospheric influences. Lumajang Dong Lake, situated at a higher elevation, has historically relied on glacial runoff and temperature to sustain its water levels. Under SSP5-8.5, projections indicate a mid-century inflection point (~2060), where both temperature and evaporation peak, while the influence of runoff declines by 56%—marking the onset of glacial depletion. This dual threshold—enhanced melt followed by evaporative dominance—captures the “peak water” phenomenon observed in glacier-fed basins, consistent with global cryospheric trends.
In contrast, lower-altitude Jieze Lake exhibits stronger dependence on precipitation and weaker glacial buffering, making it more vulnerable to rainfall variability. Although limited historical data restrict precise modeling, its morphometric profile and catchment characteristics suggest heightened hydrological sensitivity to changing precipitation patterns under climate forcing.
Together, these lakes illustrate how elevation and glacial influence modulate climate responses across the western Plateau. High-altitude systems like Lumajang Dong may benefit temporarily from melt-driven surpluses but face long-term sustainability risks as evaporative losses intensify. Lower-altitude lakes such as Jieze are likely to experience more immediate impacts from altered rainfall regimes. These findings support altitude-specific management approaches: glacial monitoring and storage optimization for high-elevation lakes, and precipitation-adaptive planning for lower-elevation systems. These transitional behaviors mirror global “peak water” trajectories but with shorter timescales, demanding urgent adaptive planning.
- (d) Eastern Morphometry-Controlled Lakes
Eastern TP lakes exhibit divergent hydrological responses under climate change, largely shaped by basin morphometry and storage capacity. Our SHAP analysis reveals that Qinghai Lake—with its vast storage capacity and glacial catchment—exhibits resilience to warming, gaining +4.77 m under SSP5-8.5 and +3.0 m under SSP2-4.5, driven primarily by temperature (SHAP = 0.386). This aligns with Wang et al. (2025), who project Qinghai’s water level to rise by 2050 due to increased precipitation (76.5% contribution) and a regional “evaporation paradox”—where warming reduces evaporation in cold climates due to suppressed surface-atmosphere temperature gradients. This phenomenon, widely observed across the TP [23,24], allows Qinghai to buffer evaporative losses despite rising temperatures.
In contrast, Ngoring Lake’s shallower basin and lower storage capacity render it more vulnerable. By 2100, it experiences a decline of 1.8 m under SSP5-8.5, as evaporation becomes the dominant driver (SHAP = 0.308), surpassing both precipitation and residual glacial inputs. SHAP analysis reveals that the transition from precipitation-runoff-driven dynamics to evaporation-controlled regimes occurs earlier and more strongly in Ngoring, highlighting the role of local geomorphology in mediating climate impacts. Tong et al. (2023) confirm that larger lakes like Qinghai are more resilient to evaporative stress, while smaller basins are vulnerable to drying [25].
This eastward contrast underscores a broader pattern: while some large lakes may temporarily gain water through enhanced melt, others will enter long-term decline as temperature-driven evaporation overwhelms limited inputs. These findings emphasize the need for lake-specific adaptation strategies tailored to morphometric vulnerability and future emission pathways. This dichotomy underscores how lake-specific attributes modulate climate impacts, a factor often overlooked in regional models.
4.1. Implications for Ecosystems and Water Security
The divergent hydrological futures of TP lakes—northern expansion, southern aridification, western transitional peaks, and eastern lake shape-driven variability—carry profound ecological and socio-economic consequences. As Asia’s “Third Pole,” the TP serves as a critical water source for over two billion people, making these changes a sentinel for global water security challenges under climate change. Southern lake desiccation, driven by dominant evaporative, threatens biodiversity through habitat contraction. For instance, Ophiocordyceps sinensis, a keystone species and vital economic resource, faces significant habitat loss, with upward distribution shifts and net losses of 4–19% under various climate scenarios [26]. Chen et al. (2025) project further declines in its production under high-emission scenarios (SSP5-8.5), threatening local economies reliant on its harvest [27]. Additionally, drying wetlands may endanger migratory species, exacerbating biodiversity loss. In contrast, northern lake expansion, driven by glacial melt, enhances water storage but increases flood risks. Xu et al. (2024) estimate that by 2100, even under a low-emissions scenario (SSP2-4.5), approximately 10,000 km² of grasslands, wetlands, and croplands will be submerged, disrupting habitats and potentially benefiting waterfowl through new wetland formation, though flood-related damages may offset these gains [22].
These findings have direct implications for the SDGs. For SDG 6 (Water Security), northern regions require infrastructure to manage meltwater surges and reduce flood risks, while southern basins need strategies to mitigate evaporation and desiccation, such as artificial recharge systems. Xu et al. (2024) underscore the need for such region-specific adaptation strategies, highlighting the potential submersion of critical infrastructure and the importance of proactive water governance. Regarding SDG 13 (Climate Action), mitigation of greenhouse gas emissions under lower-emission scenarios like SSP2-4.5 is shown to reduce aridification and sustain glacial inputs more effectively than high-emission scenarios like SSP5-8.5. This is reflected in less severe water level declines for lakes like Ngoring under SSP2-4.5 compared to SSP5-8.5, as projected in this study. By addressing these emerging challenges, this research underscores the urgency of implementing region-specific adaptation strategies to safeguard Asia’s “Third Pole” and contributes to the global discourse on managing high-altitude freshwater systems under climate change.
4.2. Future Research Directions
To advance the resilience of high-altitude hydrological systems, future research should address critical gaps identified in this study:
Groundwater Interactions: Investigating aquifer-lake exchanges, particularly in evaporation-dominated southern lakes like Langacuo, is essential to quantify groundwater’s role in buffering desiccation. Methods such as isotopic tracing or geophysical surveys, could inform conservation strategies to sustain lake levels.
Sediment Dynamics: Modeling soil erosion and sedimentation processes in southern basins, using remote sensing or sediment core analysis, will refine projections of lake bathymetry changes. These changes, particularly in shallow lakes, could exacerbate evaporation rates and reduce water storage capacity.
Low-Emission Scenarios: Exploring SSP1-2.6 scenarios will quantify mitigation benefits for vulnerable systems, building on the reduced desiccation observed under SSP2-4.5. Ensemble modeling with CMIP6 projections could support global climate action efforts under SDG 13.
Socio-Economic Modeling: Linking hydrological shifts to economic outcomes, such as flood impacts in northern lakes like Migriggyangzham or biodiversity losses in southern systems, will strengthen adaptation frameworks. Integrating hydrological projections with cost-benefit analyses or stakeholder surveys could quantify impacts on pastoralist livelihoods and infrastructure.
These directions, tailored to the Tibetan Plateau’s divergent hydrological regimes, enhance the transferability of our deep learning framework to other high-altitude regions. They provide a roadmap for advancing global water security and climate resilience, aligning with the priorities of SDG 6 and SDG 13.
5. Conclusions
This study provides a pioneering assessment of TP lake responses to climate change, revealing four distinct hydrological futures: northern glacier-fed expansion, southern evaporation-driven aridification, western elevation-dependent transitional peaks, and eastern morphometry-controlled variability. By integrating threshold-retracked Sentinel-3A altimetry, bias-corrected CMIP6 projections, and a Bayesian-optimized deep learning model with explainable AI, we elucidate the nonlinear interplay of temperature, evaporation, precipitation, and runoff. Northern lakes benefit temporarily from intensified glacial melt but face increasing vulnerability as runoff diminishes, consistent with the IPCC’s “peak water” framework. Southern lakes undergo irreversible desiccation due to dominant evaporative losses, while western lakes exhibit mid-century transitions from melt-driven gains to evaporative declines. Eastern lakes highlight the role of basin morphometry, with larger systems buffering losses compared to shallower ones. These findings position the TP as a sentinel of global cryospheric and hydrological change, with accelerated timelines for peak water and aridification compared to global trends. Uncertainties—driven by emission scenario dependence in glacier-fed systems and high internal variability in evaporation-dominated lakes due to stochastic atmospheric processes—underscore the need for ensemble-based risk assessments and expanded monitoring, particularly in data-scarce western regions. The methodological framework, combining satellite altimetry with explainable AI, offers a transferable paradigm for forecasting high-altitude lake dynamics worldwide, addressing critical gaps in nonlinear cryosphere-hydrosphere modeling. For water security (SDG 6) and climate action (SDG 13), these projections demand urgent, region-specific strategies: flood management and storage optimization for northern and high-altitude western lakes, evaporation mitigation (e.g., artificial recharge) for southern basins, and morphometry-informed conservation for eastern systems. Lower-emission pathways (e.g., SSP2-4.5) mitigate desiccation and sustain glacial inputs compared to high-emission scenarios, highlighting the value of climate mitigation. Future research should incorporate groundwater interactions, sediment dynamics, and socio-economic impacts to refine resilience strategies. As Asia’s “Third Pole” faces accelerating hydrological shifts, this study provides a critical foundation for safeguarding water resources and ecosystems in a warming world.
Supplementary Materials
The following supporting information can be downloaded at the website of this paper posted on Preprints.org. Table S1: Temporal Coverage of Lake Water Level Data Used in the Study. Figures S1–S8: Quantile-Quantile (Q-Q) Plots for Bias Correction of Climate Variables for the Eight Study Lakes (Langacuo, Lumajang Dong, Migriggyangzham, Qinghai, Zhari Namco, Siling, Ngoring, Lexie Wudan). Figure S9: Performance Evaluation of CMIP6 Models Using Nash-Sutcliffe Efficiency Metric Across Study Lakes. Figure S10: Intercomparison of CMIP6 Model Correlations with Observed Climate Variables Across Study Lakes. Figures S11–S18: Comparison of Feature Importance Across Scenarios for the Eight Study Lakes (Migriggyangzham, Lexie Wudan, Langacuo, Siling, Zhari Namco, Lumajang Dong, Qinghai, Ngoring). Figures S19–S26: SHAP Value Distributions Showing the Influence of Key Climate Variables on Water Levels for the Eight Study Lakes Across Scenarios: (A) Historical Observations, (B) SSP2-4.5, (C) SSP5-8.5.
Author Contributions
Atefeh. Gholami.; Conceptualization, Methodology, Formal analysis, Data curation, Investigation, Software, Writing – original draft, Wen. Zhang.; Supervision, Conceptualization, Methodology, Resources, Writing – review & editing.
Funding
the National Natural Science Foundation of China, grant number 41975118, funded this research.
Data Availability Statement
The data supporting the results reported in this study are derived from multiple publicly available sources. Water level measurements were obtained from Sentinel-3A Synthetic Aperture Radar (SAR) altimetry data, accessible through the Copernicus Open Access Hub (https://scihub.copernicus.eu/), and extended using historical datasets from the Database for Hydrological Time Series of Inland Waters (DAHITI, https://dahiti.dgfi.tum.de/) and Hydroweb (http://hydroweb.theia-land.fr/). Historical climate data were sourced from the Fifth Generation European Centre for Medium-Range Weather Forecasts Reanalysis (ERA5), available at https://cds.climate.copernicus.eu/. Future climate projections were derived from the Coupled Model Intercomparison Project Phase 6 (CMIP6) dataset, accessible via the Earth System Grid Federation (https://esgf-node.llnl.gov/projects/cmip6/).
Acknowledgments
In this section, you can acknowledge any support given which is not covered by the author contribution or funding sections. This may include administrative and technical support, or donations in kind (e.g., materials used for experiments). Where GenAI has been used for purposes such as generating text, data, or graphics, or for study design, data collection, analysis, or interpretation of data, please add “During the preparation of this manuscript/study, the author(s) used [tool name, version information] for the purposes of [description of use]. The authors have reviewed and edited the output and take full responsibility for the content of this publication.”
Conflicts of Interest
The authors gratefully acknowledge the support of the National Natural Science Foundation of China [No. 41975118] and the University of Chinese Academy of Sciences. We would also like to express our sincere thanks to the anonymous referees for their helpful and constructive comments, which improved the quality of this manuscript.
References
- Xue, Y.; Ma, Y.; Li, Q. Land–Climate Interaction over the Tibetan Plateau. 2018.
- Pastorino, P.; Elia, A.C.; Pizzul, E.; Bertoli, M.; Renzi, M.; Prearo, M. The old and the new on threats to high-mountain lakes in the Alps: A comprehensive examination with future research directions. Ecol. Indic. 2024, 160. [Google Scholar] [CrossRef]
- Woolway, R.I.; Kraemer, B.M.; Lenters, J.D.; Merchant, C.J.; O’rEilly, C.M.; Sharma, S. Global lake responses to climate change. Nat. Rev. Earth Environ. 2020, 1, 388–403. [Google Scholar] [CrossRef]
- Zhang, X.; Kurbaniyazov, A.; Kirillin, G. Changing Pattern of Water Level Trends in Eurasian Endorheic Lakes as a Response to the Recent Climate Variability. Remote. Sens. 2021, 13, 3705. [Google Scholar] [CrossRef]
- Zhang, G.; Mengmeng, W.; Tao, Z.; Wenfeng, C. Progress in Remote Sensing Monitoring of Lake Area, Water Level, and Volume Changes on the Tibetan Plateau. National Remote Sensing Bulletin 2022, 26, 115–125. [Google Scholar] [CrossRef]
- Zhang, G.; Yao, T.; Shum, C.K.; Yi, S.; Yang, K.; Xie, H.; Feng, W.; Bolch, T.; Wang, L.; Behrangi, A.; et al. Lake volume and groundwater storage variations in Tibetan Plateau's endorheic basin. Geophys. Res. Lett. 2017, 44, 5550–5560. [Google Scholar] [CrossRef]
- Zhao, Y.; Zhou, T.; Zhang, W.; Li, J. Change in Precipitation over the Tibetan Plateau Projected by Weighted CMIP6 Models. Adv. Atmospheric Sci. 2022, 39, 1133–1150. [Google Scholar] [CrossRef]
- Yang, F.; Ye, A.; Wang, Y. Enhanced Spatial Dry–Wet Contrast in the Future of the Qinghai–Tibet Plateau. Hydrological Processes 2025, 39, e70087. [Google Scholar] [CrossRef]
- Yu, Y.; You, Q.; Zhang, Y.; Jin, Z.; Kang, S.; Zhai, P. Integrated warm-wet trends over the Tibetan Plateau in recent decades. J. Hydrol. 2024, 639. [Google Scholar] [CrossRef]
- Biancamaria, S.; Frappart, F.; Leleu, A.-S.; Marieu, V.; Blumstein, D.; Desjonquères, J.-D.; Boy, F.; Sottolichio, A.; Valle-Levinson, A. Satellite radar altimetry water elevations performance over a 200 m wide river: Evaluation over the Garonne River. Adv. Space Res. 2017, 59, 128–146. [Google Scholar] [CrossRef]
- Jiang, L.; Nielsen, K.; Andersen, O.B.; Bauer-Gottwein, P. Monitoring recent lake level variations on the Tibetan Plateau using CryoSat-2 SARIn mode data. J. Hydrol. 2017, 544, 109–124. [Google Scholar] [CrossRef]
- Zhang, G.; Xie, H.; Duan, S.; Tian, M.; Yi, D. Water level variation of Lake Qinghai from satellite and in situ measurements under climate change. J. Appl. Remote. Sens. 2011, 5, 053532–053532. [Google Scholar] [CrossRef]
- Song, C.; Huang, B.; Ke, L.; Richards, K.S. Seasonal and abrupt changes in the water level of closed lakes on the Tibetan Plateau and implications for climate impacts. J. Hydrol. 2014, 514, 131–144. [Google Scholar] [CrossRef]
- Chen, J.; Duan, Z. Monitoring Spatial-Temporal Variations of Lake Level in Western China Using ICESat-1 and CryoSat-2 Satellite Altimetry. Remote. Sens. 2022, 14, 5709. [Google Scholar] [CrossRef]
- Gholami, A.; Zhang, W. High Altitude Hydrology: The Impacts of Climate Change on Tibetan Plateau Water Levels Using Satellite Altimetry and ERA5 Data. Preprints 2025. [CrossRef]
- Zhu, Y.-Y.; Yang, S. Evaluation of CMIP6 for historical temperature and precipitation over the Tibetan Plateau and its comparison with CMIP5. Adv. Clim. Chang. Res. 2020, 11, 239–251. [Google Scholar] [CrossRef]
- Cui, T.; Li, C.; Tian, F. Evaluation of Temperature and Precipitation Simulations in CMIP6 Models Over the Tibetan Plateau. Earth Space Sci. 2021, 8. [Google Scholar] [CrossRef]
- Merrifield, A.L.; Brunner, L.; Lorenz, R.; Humphrey, V.; Knutti, R. Climate model Selection by Independence, Performance, and Spread (ClimSIPS v1.0.1) for regional applications. Geosci. Model Dev. 2023, 16, 4715–4747. [Google Scholar] [CrossRef]
- Lundberg, S. A Unified Approach to Interpreting Model Predictions. arXiv:1705.07874 2017.
- Ocean, Cryosphere and Sea Level Change. Climate Change 2021 – The Physical Science Basis: Working Group I Contribution to the Sixth Assessment Report of the Intergovernmental Panel on Climate Change; Intergovernmental Panel on Climate Change, (IPCC), Ed.; Cambridge University Press: Cambridge, 2023; ISBN 978-1-00-915788-9. [Google Scholar]
- Linking Global to Regional Climate Change. Climate Change 2021 – The Physical Science Basis: Working Group I Contribution to the Sixth Assessment Report of the Intergovernmental Panel on Climate Change; Intergovernmental Panel on Climate Change, (IPCC), Ed.; Cambridge University Press: Cambridge, 2023; ISBN 978-1-00-915788-9. [Google Scholar]
- Xu, F.; Zhang, G.; Woolway, R.I.; Yang, K.; Wada, Y.; Wang, J.; Crétaux, J.-F. Widespread societal and ecological impacts from projected Tibetan Plateau lake expansion. Nat. Geosci. 2024, 17, 516–523. [Google Scholar] [CrossRef]
- Ma, Y.-J.; Li, X.-Y.; Liu, L.; Yang, X.-F.; Wu, X.-C.; Wang, P.; Lin, H.; Zhang, G.-H.; Miao, C.-Y. Evapotranspiration and its dominant controls along an elevation gradient in the Qinghai Lake watershed, northeast Qinghai-Tibet Plateau. J. Hydrol. 2019, 575, 257–268. [Google Scholar] [CrossRef]
- Wang, H.; Liu, J.; Luo, Z.; Nazli, S.; Shi, L. Hydrologic response and prediction of future water level changes in Qinghai Lake of Tibet Plateau, China. J. Hydrol. Reg. Stud. 2025, 57. [Google Scholar] [CrossRef]
- Tong, Y.; Feng, L.; Wang, X.; Pi, X.; Xu, W.; Woolway, R.I. Global lakes are warming slower than surface air temperature due to accelerated evaporation. Nat. Water 2023, 1, 929–940. [Google Scholar] [CrossRef]
- Yan, Y.; Li, Y.; Wang, W.-J.; He, J.-S.; Yang, R.-H.; Wu, H.-J.; Wang, X.-L.; Jiao, L.; Tang, Z.; Yao, Y.-J. Range shifts in response to climate change of Ophiocordyceps sinensis, a fungus endemic to the Tibetan Plateau. Biol. Conserv. 2017, 206, 143–150. [Google Scholar] [CrossRef]
- Chen, L.; Teng, H.; Chen, S.; Zhou, Y.; Wan, D.; Shi, Z. Future Habitat Shifts and Economic Implications for Ophiocordyceps sinensis Under Climate Change. Ecol. Evol. 2025, 15, e71327. [Google Scholar] [CrossRef] [PubMed]
Figure 2.
Projected Water Level Changes in Northern Lakes: Migriggyangzham Lake (A); Lexie Wudan Lake (B).
Figure 2.
Projected Water Level Changes in Northern Lakes: Migriggyangzham Lake (A); Lexie Wudan Lake (B).
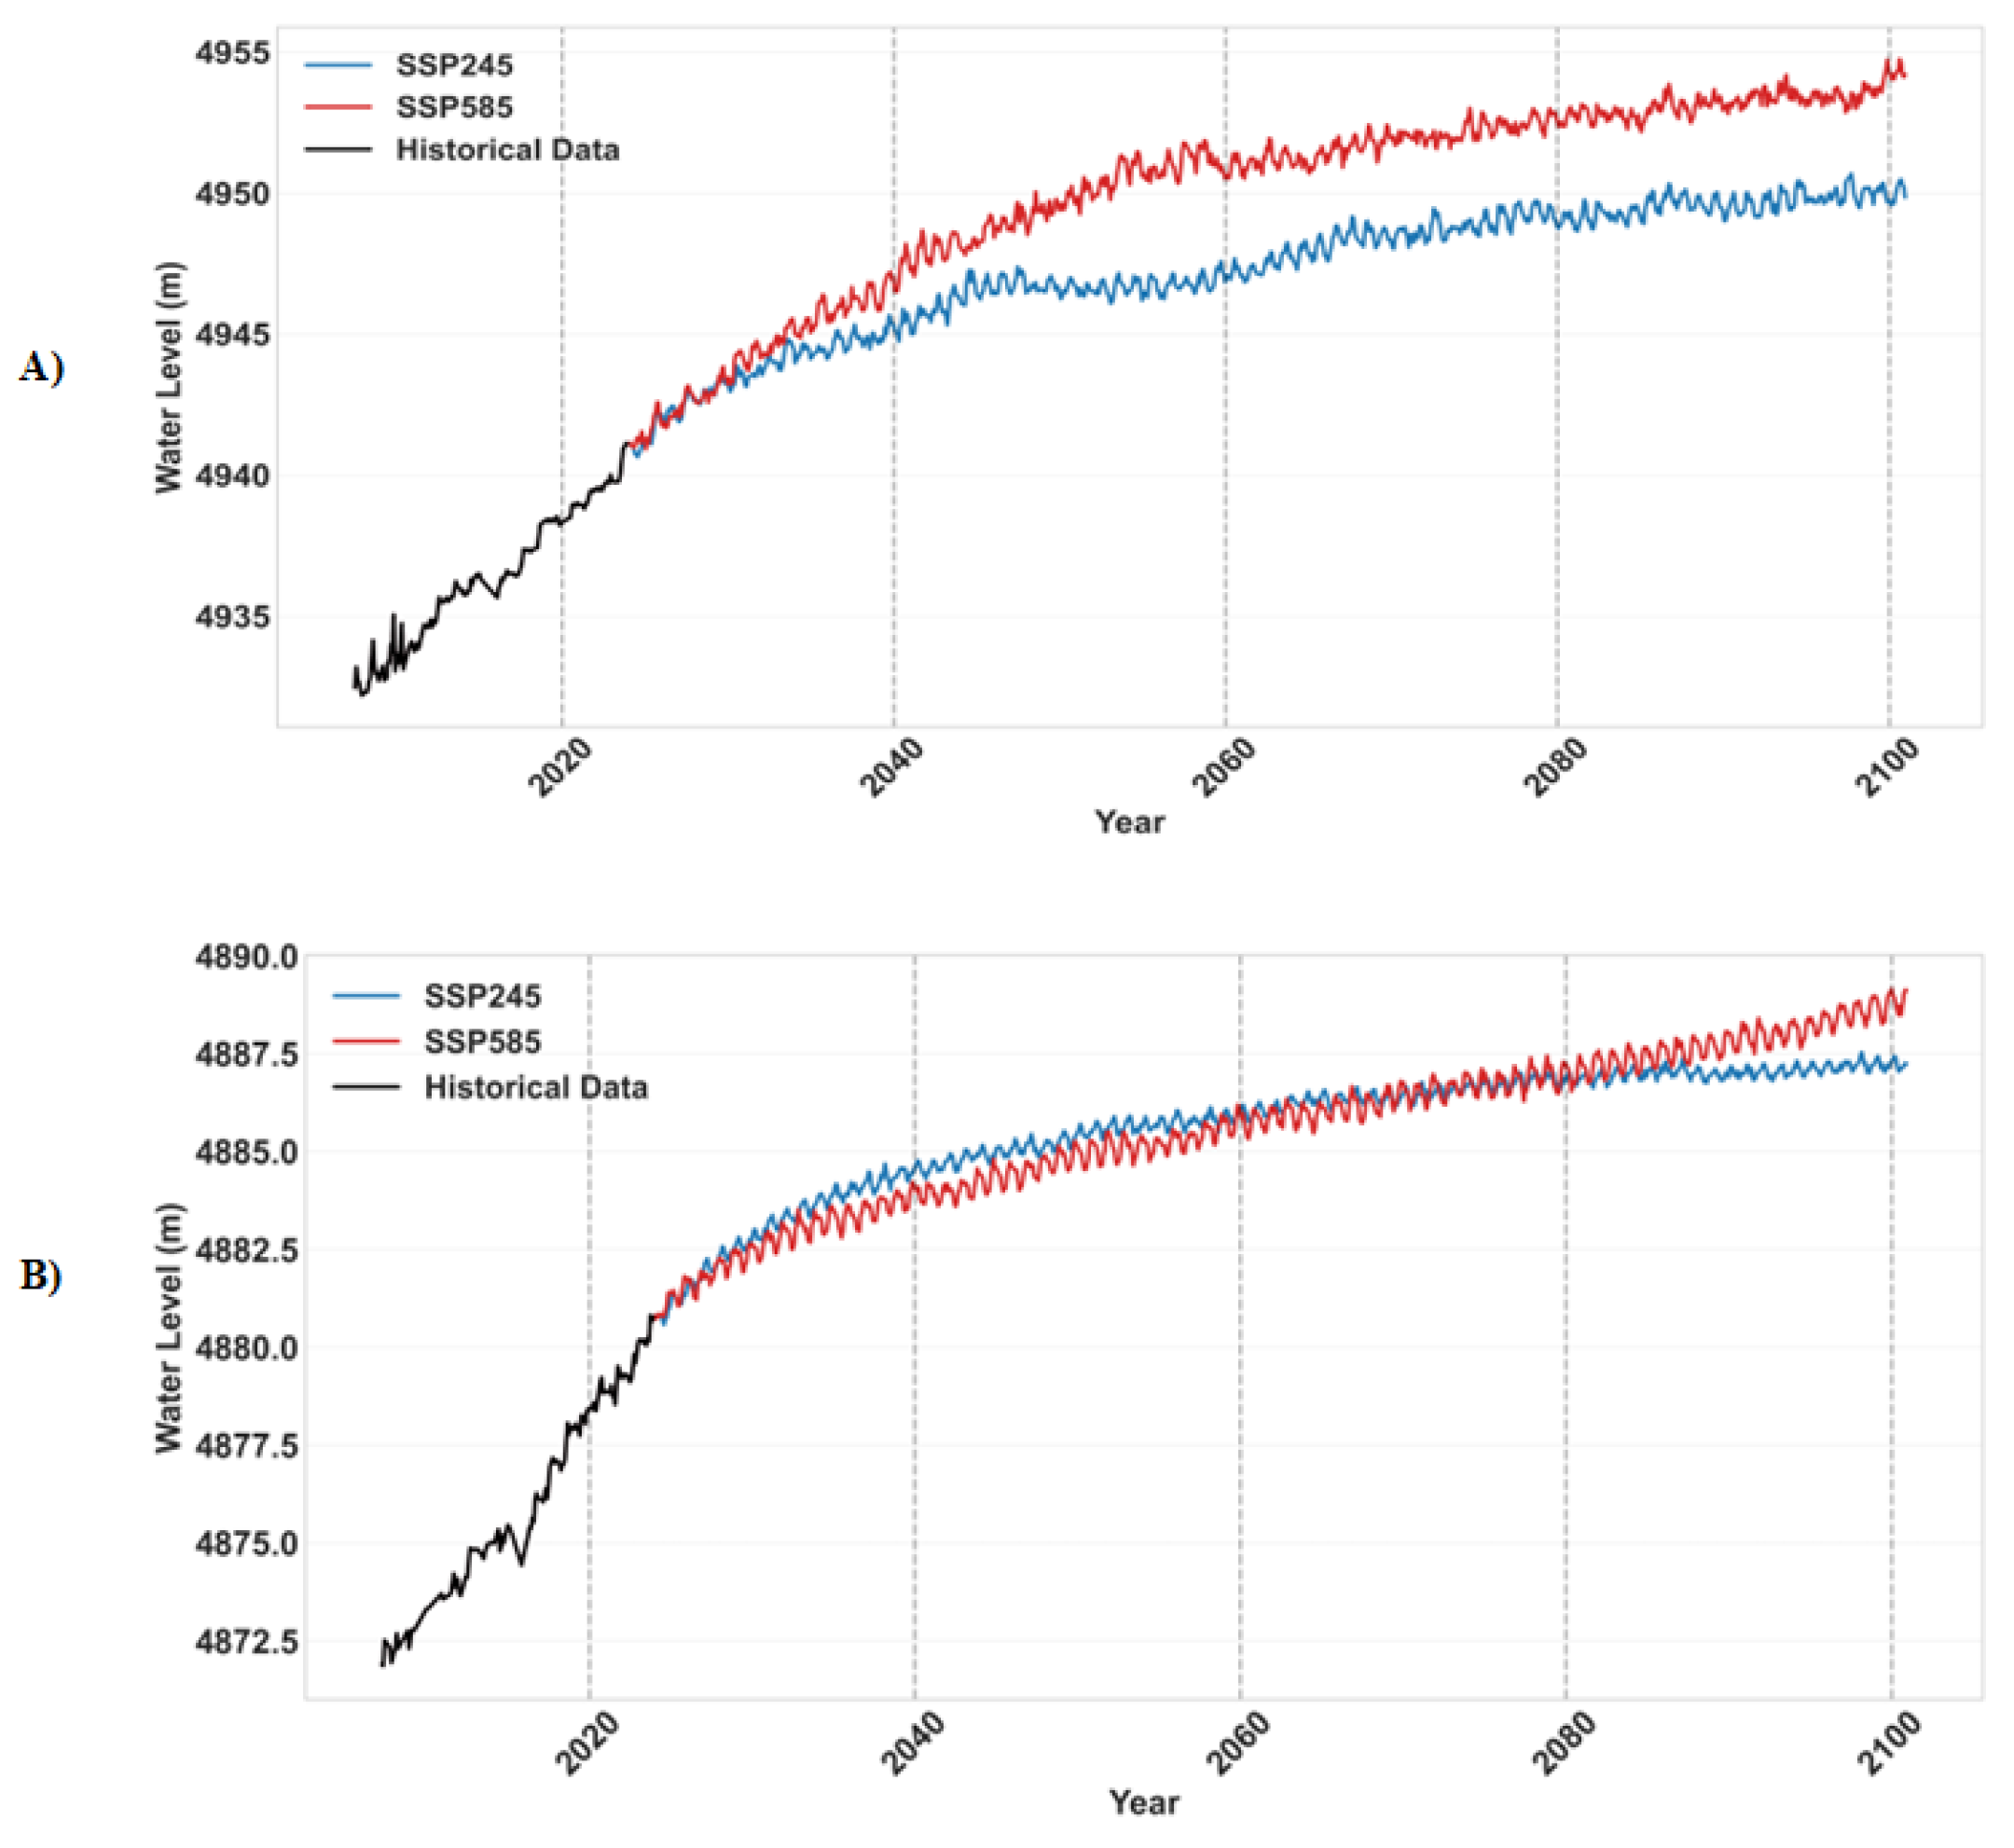
Figure 3.
Projected Water Level Changes in Southern Lakes: Langacuo (A); Zhari Namco (B); Siling (C).
Figure 3.
Projected Water Level Changes in Southern Lakes: Langacuo (A); Zhari Namco (B); Siling (C).
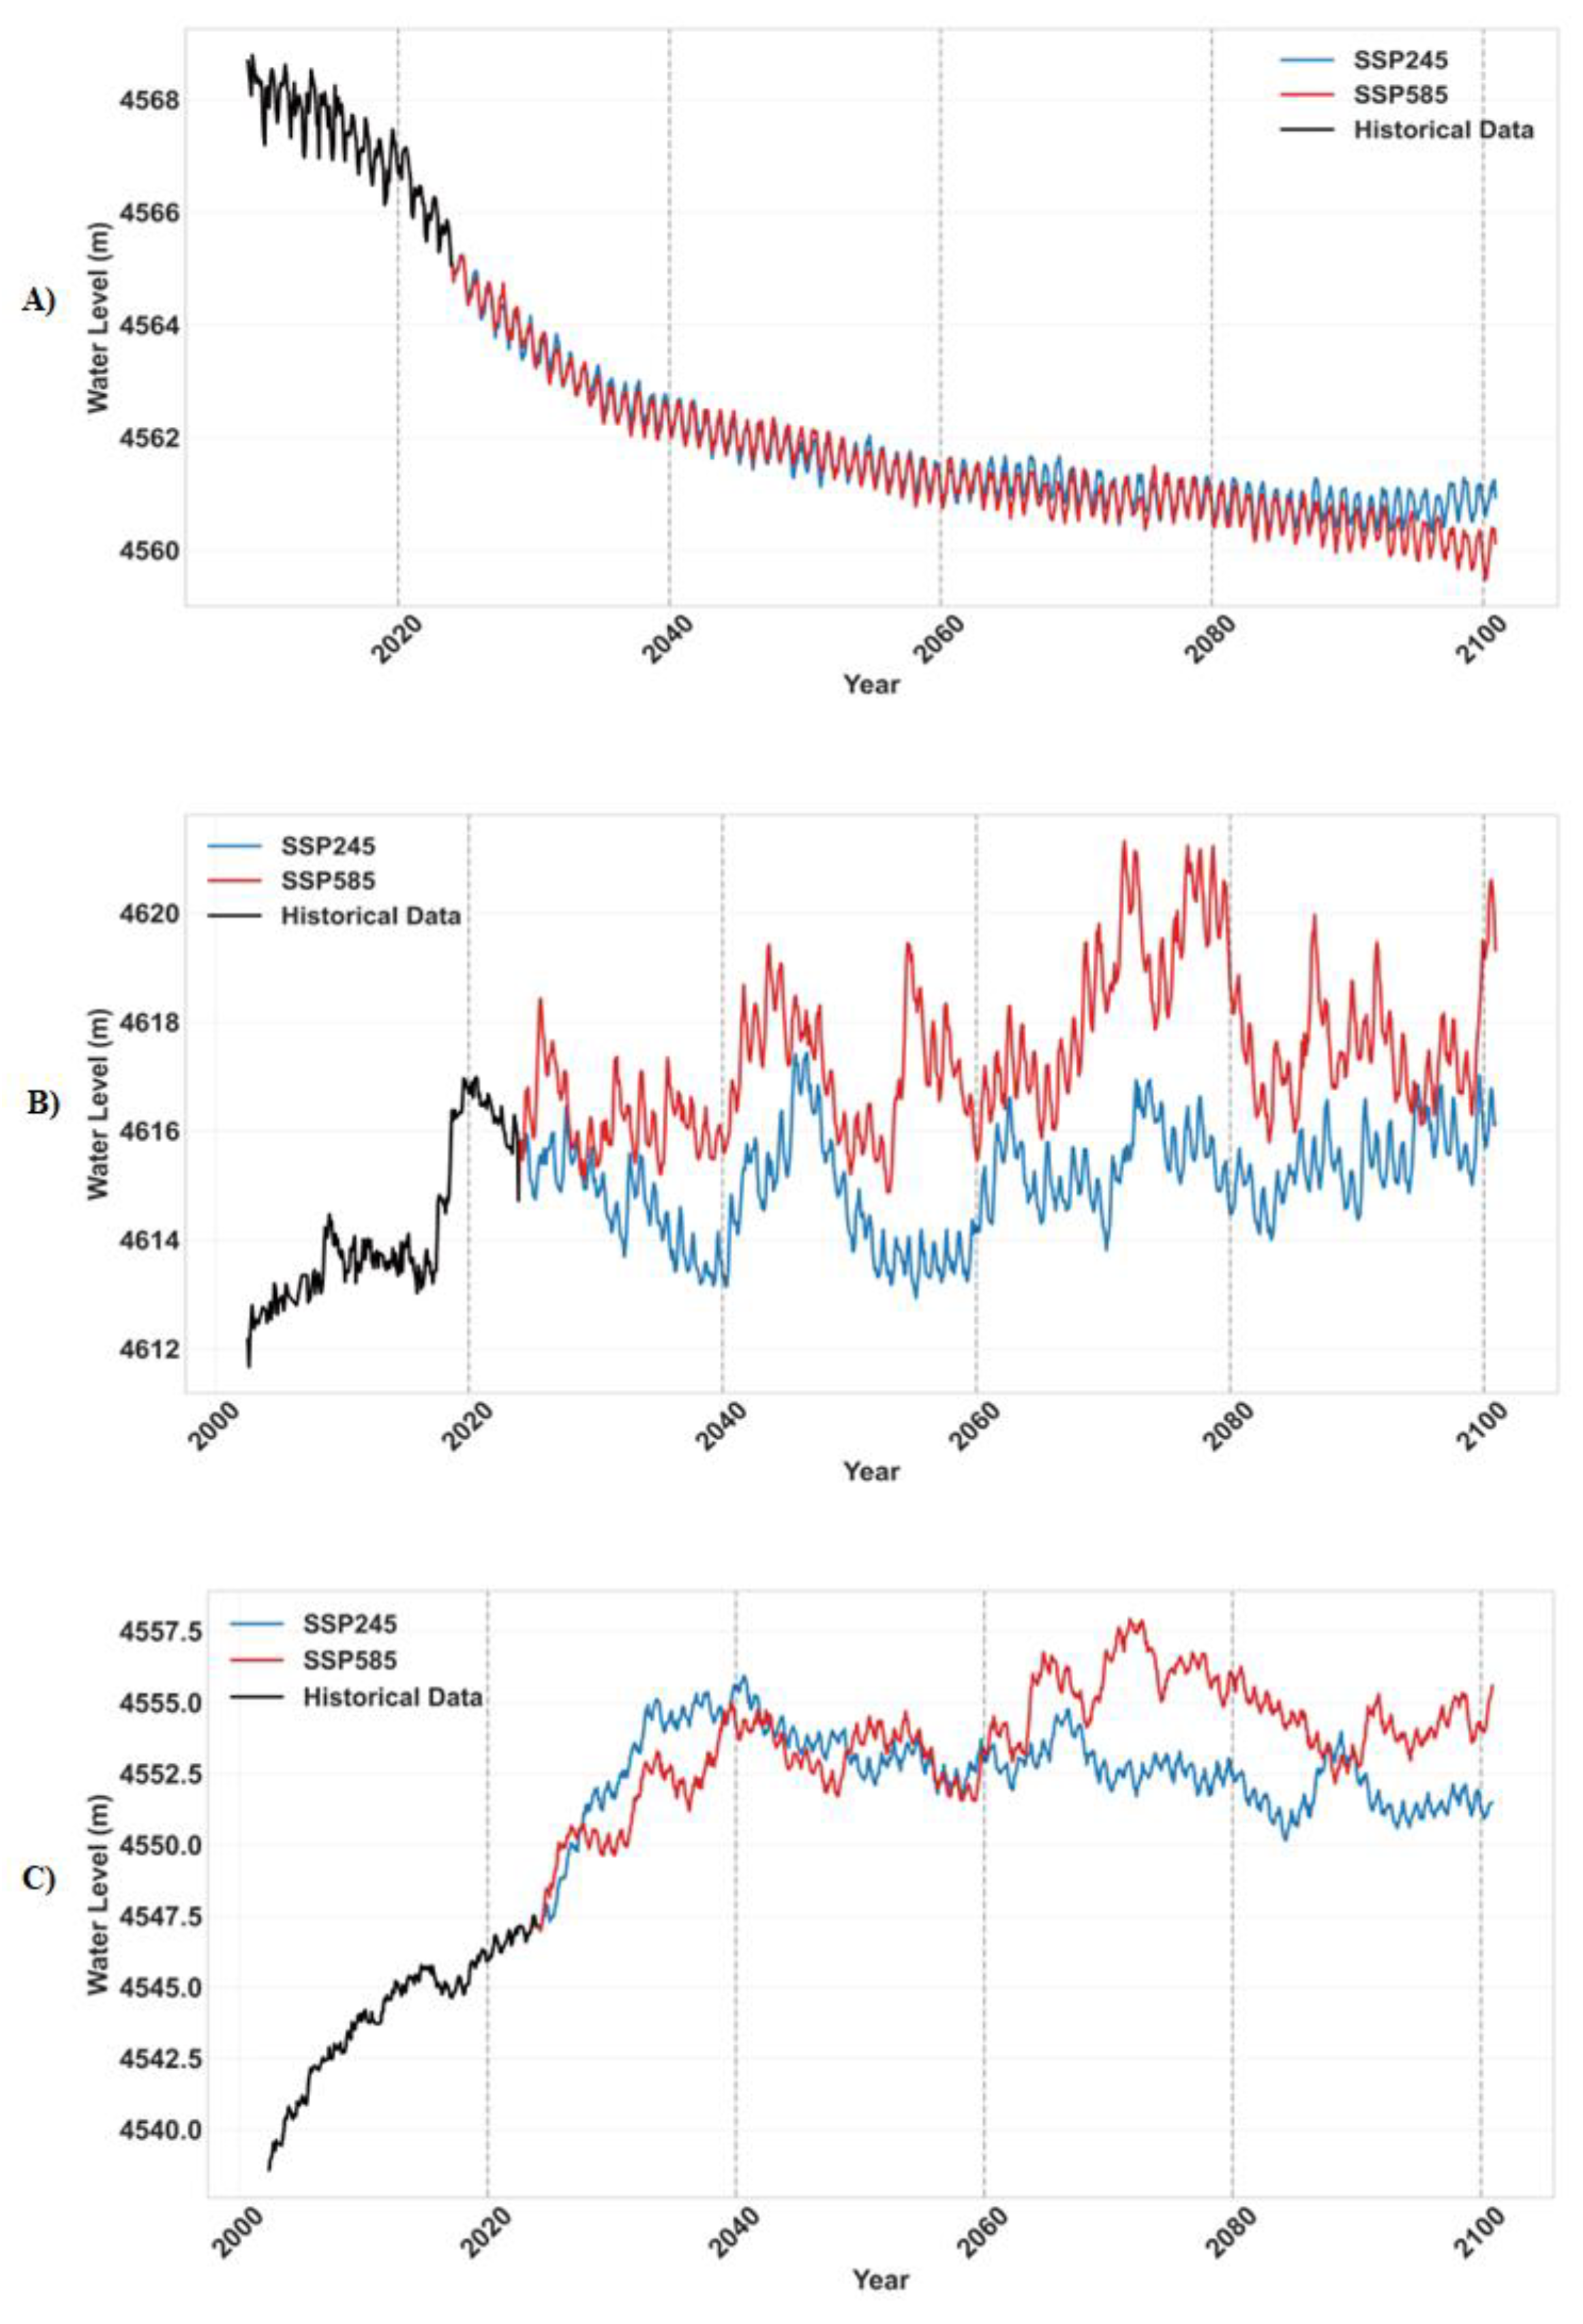
Figure 4.
Projected Water Level Changes in Western Lakes (Lumajang Dong Lake).
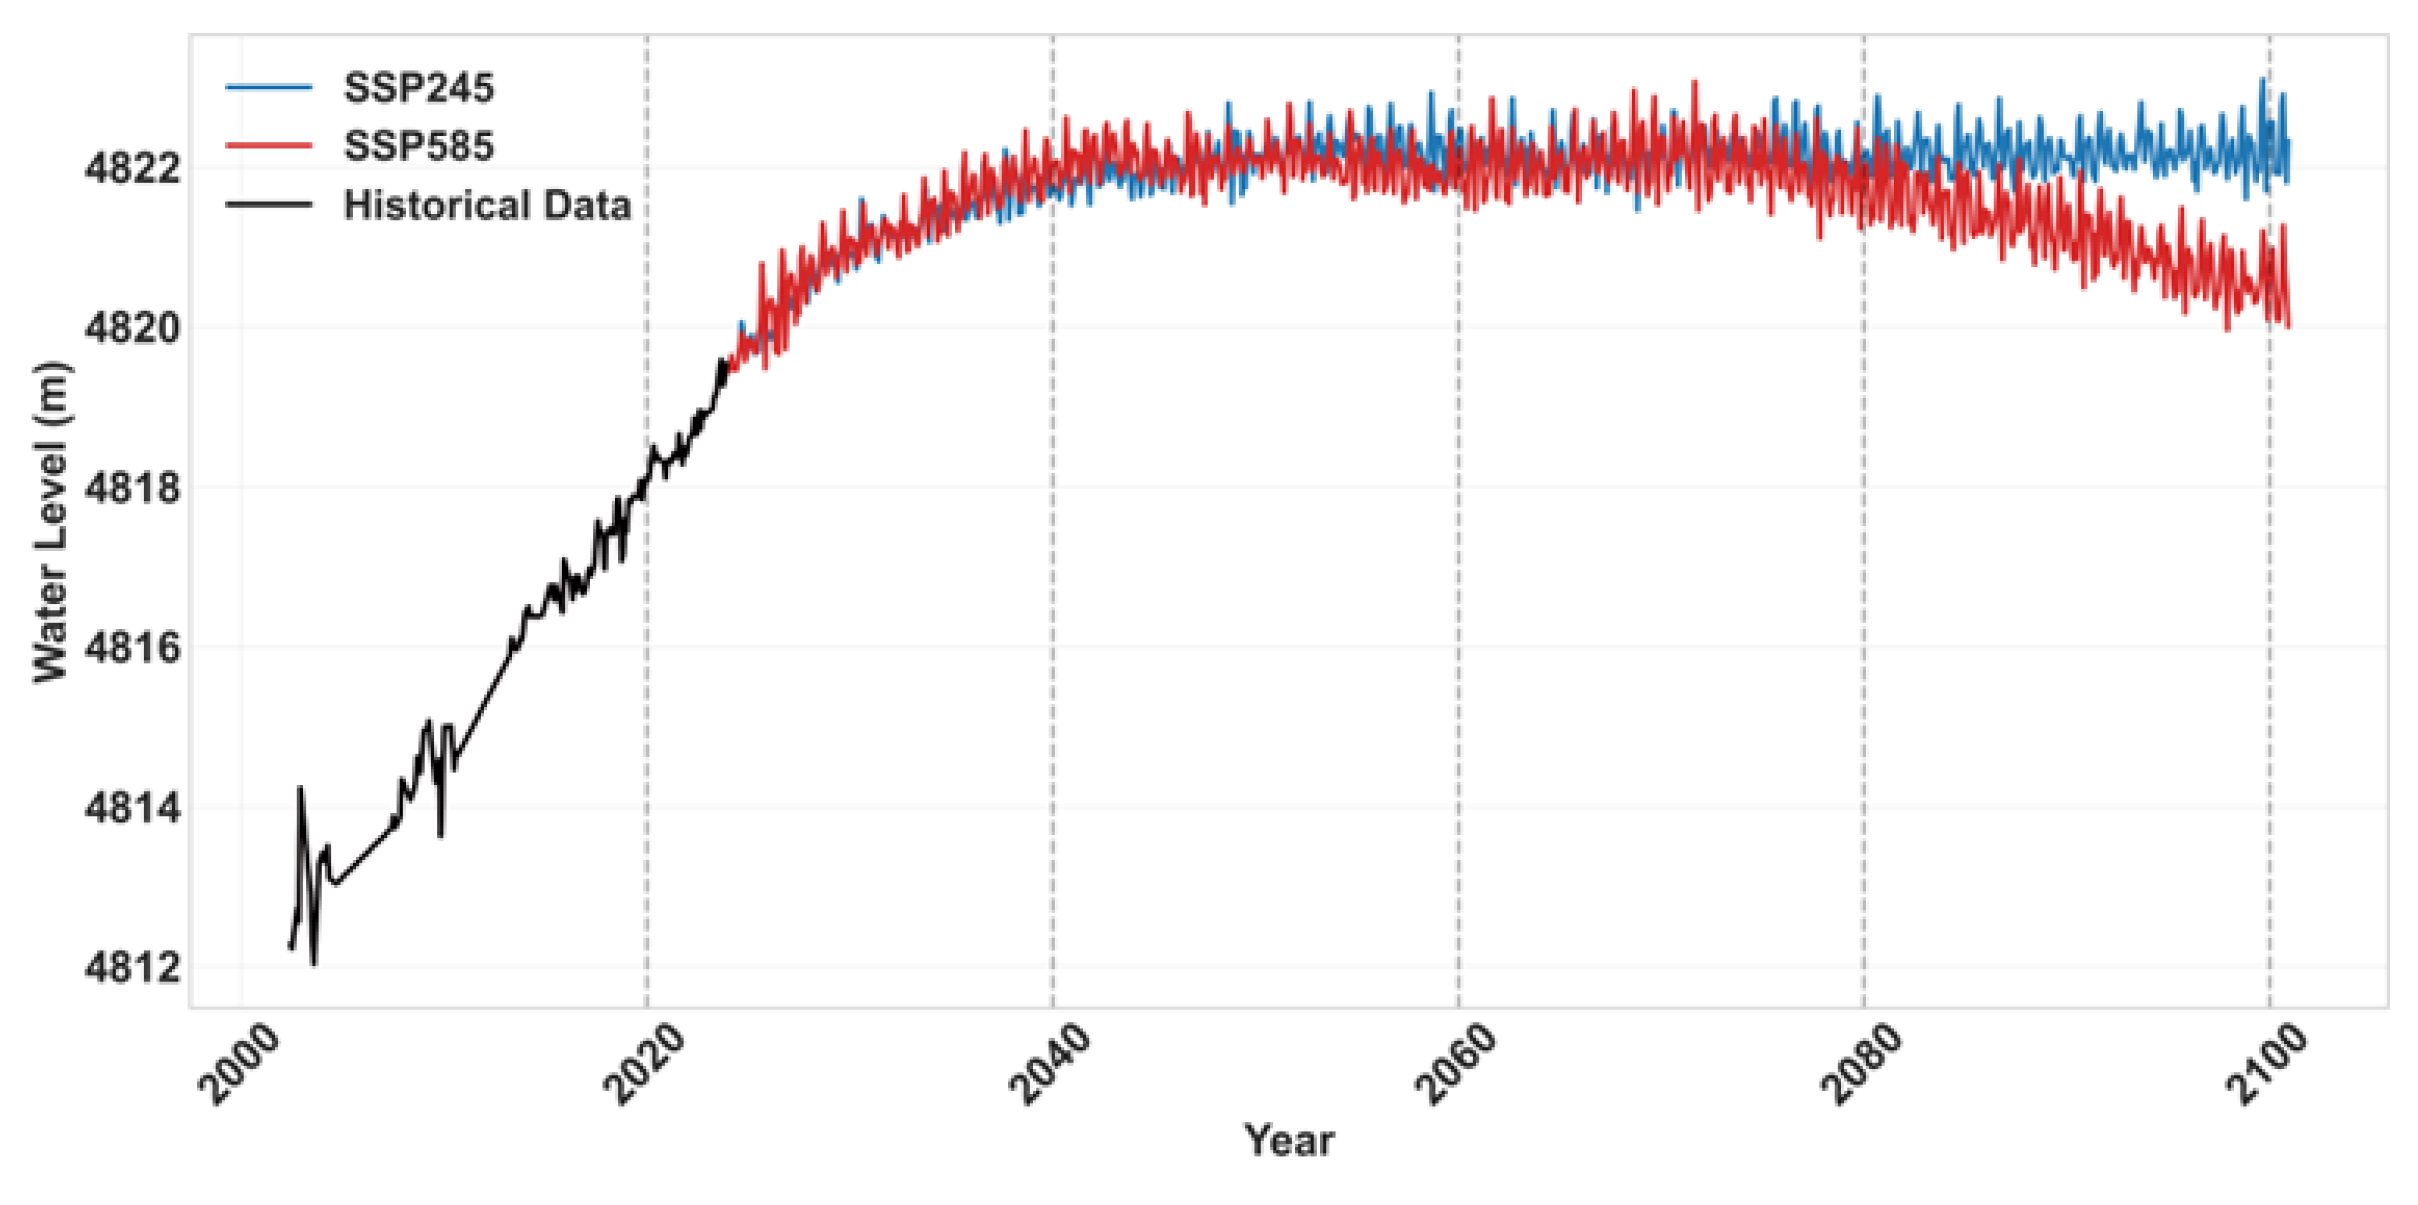
Figure 5.
Projected Water Level Changes in Eastern Lakes: Qingha Lake(A) Ngoring Lake(B).
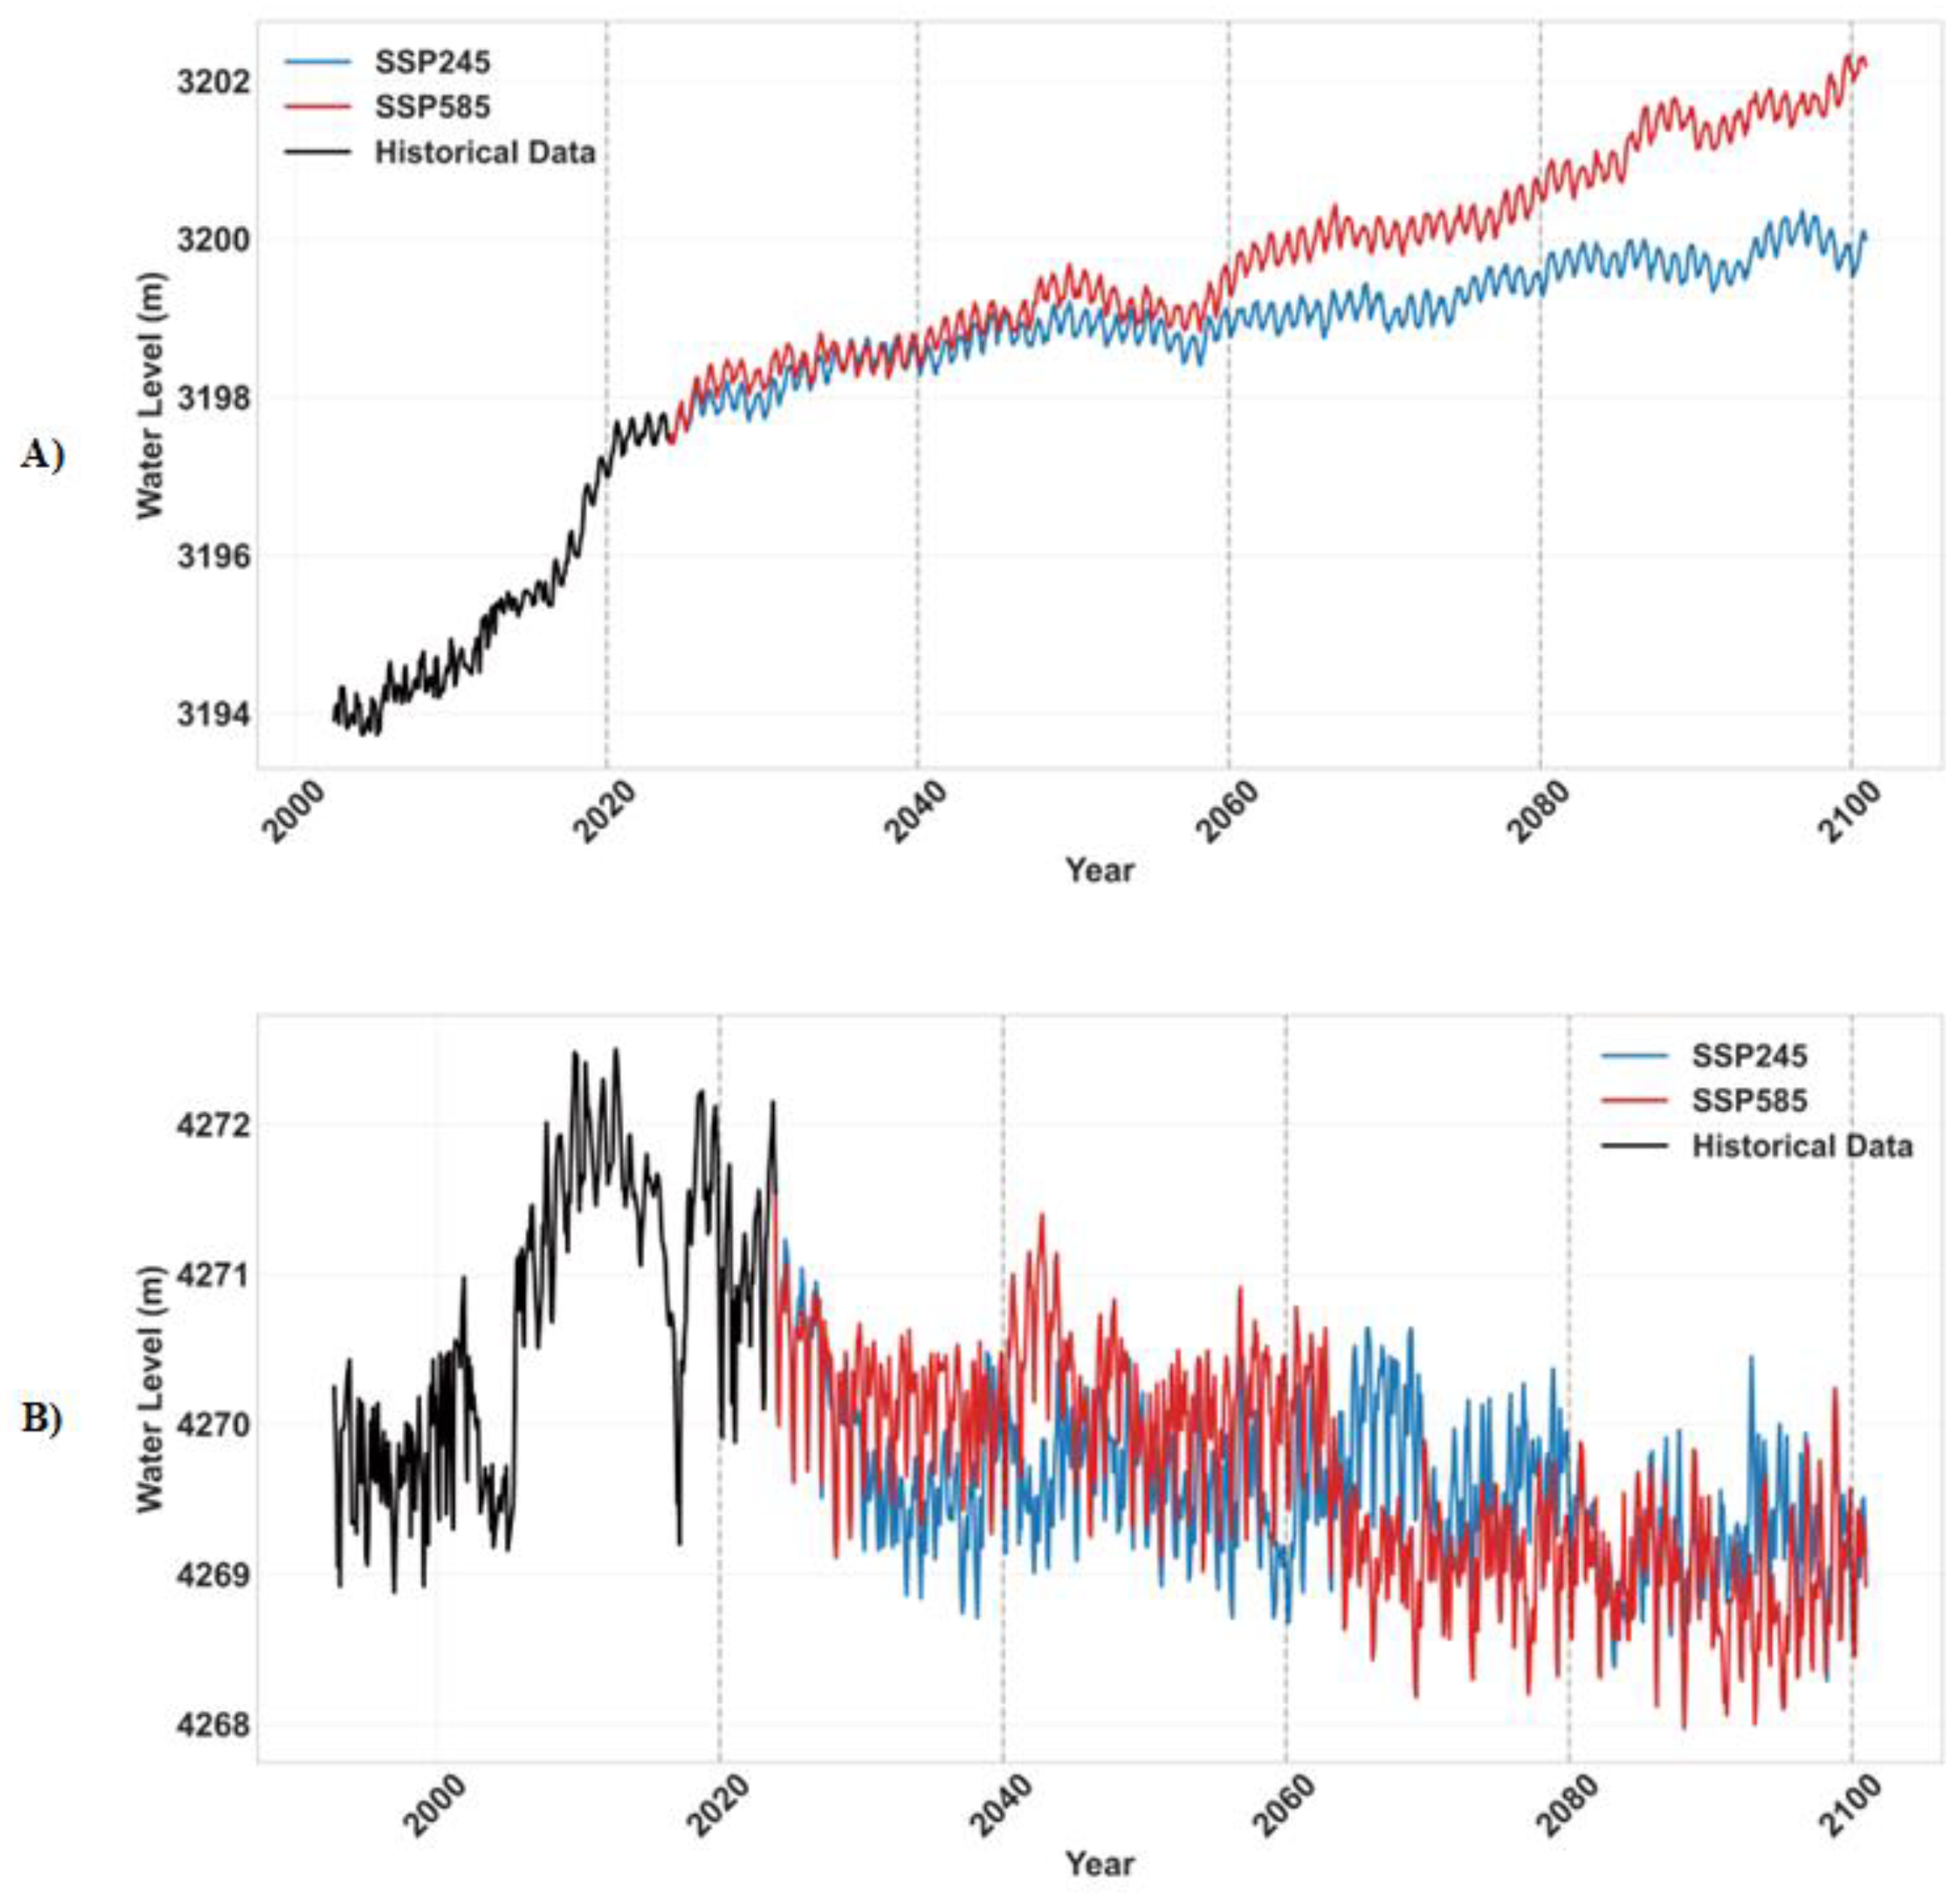

Table 1.
Performance Improvements of CMIP6 Simulations after Bias Correction using QDM and EQM across TPLakes.
Table 1.
Performance Improvements of CMIP6 Simulations after Bias Correction using QDM and EQM across TPLakes.
| Lake | Variable | RMSE Reduction (%) | Extreme Event Improvement (95th %ile, %) |
|---|---|---|---|
| Lexie Wudan | Runoff | 11.4% | 90.3% |
| Precipitation | 17.7% | 97% | |
| Temperature | 34.6% | 90.6% | |
| Evaporation | 38.0% | 98.30% | |
| Lumajang Dong | Runoff | 47.89% | 88.5% |
| Precipitation | 13.6% | 64.5% | |
| Temperature | 26.94% | 66.7% | |
| Evaporation | 0.81% | 81.8% | |
| Zhari Namco | Precipitation | 30.5% | 96.5 |
| temperature | 26.6% | 95.2% | |
| evaporation | 19.0% | 98.6% | |
| Runoff | 17.1% | 85.9% | |
| Langacuo | Precipitation | 10.3% | 87.5% |
| temperature | 19.6% | 74.5% | |
| evaporation | 14.3% | 11.2% | |
| Runoff | 20.8% | 99.3% | |
| Ngoring | precipitation | 4.8% | 79.2% |
| temperature | 12.9% | 98.8% | |
| evaporation | 13.4% | 98.3% | |
| Runoff | 1.1% | 93.4% | |
| Siling | precipitation | 49.0% | 94.8% |
| temperature | 30.4% | 96.3% | |
| evaporation | 43.0% | 100.0% | |
| Runoff | 0.6% | 78.9% | |
| Qinghai | precipitation | 7.1% | 96.2% |
| temperature | 47.2% | 91.0% | |
| evaporation | 2.6% | 98.9% | |
| Runoff | 19.7% | 96.2% | |
| Migriggyangzham | precipitation | 15.2% | 84.3% |
| temperature | 6.6% | 89.3% | |
| evaporation | 1.8% | 100.0% | |
| Runoff | 3.8% | 94.5% |
Disclaimer/Publisher’s Note: The statements, opinions and data contained in all publications are solely those of the individual author(s) and contributor(s) and not of MDPI and/or the editor(s). MDPI and/or the editor(s) disclaim responsibility for any injury to people or property resulting from any ideas, methods, instructions or products referred to in the content. |
© 2025 by the authors. Licensee MDPI, Basel, Switzerland. This article is an open access article distributed under the terms and conditions of the Creative Commons Attribution (CC BY) license (http://creativecommons.org/licenses/by/4.0/).
Copyright: This open access article is published under a Creative Commons CC BY 4.0 license, which permit the free download, distribution, and reuse, provided that the author and preprint are cited in any reuse.


