
Submitted:
05 July 2025
Posted:
07 July 2025
You are already at the latest version
Abstract
The Tibetan Plateau plays a vital role in regional hydrology and provides freshwater to over a billion people. However, the region is increasingly impacted by climate change. This study presents a novel assessment of historical climate-driven hydrological changes by analyzing variations in lake water levels from 2016 to 2024. For the first time, we integrate Sentinel-3A satellite altimetry with ERA5 climate reanalysis data to investigate the effects of temperature, precipitation, and runoff on lake dynamics. Additionally, advanced sub-waveform retracking techniques, which were applied to overcome the challenges of radar retrieval, improved the accuracy of water level estimation. Our results, validated against the DAHITI and Hydroweb databases, confirmed high reliability, with correlation coefficients greater than 0.9. This research indicates a general trend of rising water levels in 9 of the 10 lakes (average increase of ±0.3569 m y⁻¹), driven mainly by runoff and glacial melt. Our results highlight a consistent rise in the northern and eastern regions due to stable precipitation and runoff patterns, while southern lakes show water loss due to increased evaporation under rising temperatures. The lakes of the western TP showed altitude-dependent variability. Lakes at higher altitudes benefit from glacial meltwater, while those at lower altitudes rely more on precipitation and are more sensitive to rainfall changes. We used the Random Forest (RF) machine learning model with SHapley Additive exPlanations (SHAP) to quantify the contributions of individual climate variables. This study is the first large-scale high-resolution evaluation of climate-driven lake level changes on the Plateau, and it will provide useful information for regional water resource management.
Keywords:
Tibetan plateau
; climate change
; water level
; random forest
; SHAP analysis
1. Introduction
The TP is the source of major river systems and provides water for billions of people around the globe [1,2]. Its extensive glaciers significantly influence water quantity and quality. However, climate change accelerates glacier melting, and this balance is in danger [3]. Tibetan lakes are sensitive to environmental changes. They cover about 47,000 km² in 2018, which represents over half of China’s total lake area and nearly 2% of lakes globally [4,5]. Since human activity is minimal in this region, the lakes serve as effective indicators of climate-driven hydrological change [6,7]. Understanding these changes is essential for achieving Sustainable Development Goals, particularly those related to water management (Goal 6) and climate action (Goal 13) [8,9].
The research shows that the surface air temperature on the TP has risen by 1.8°C over the past 50 years, which is approximately 1.5 times higher than global average warming rate [10]. The rapid warming is increasing evaporation and changing the rainfall patterns, which is disrupting the natural water cycle [11]. Some areas experience reduced precipitation or variations in wet and dry seasons, with uneven rainfall distribution across regions [8,9].
Between 1970 and 2018, the number of lakes increased by 32%, and their total area grew by 25%. Over this period, lake water levels rose by over 4 meters on average, with a total volume increase of approximately 170 gigatons [4]. These changes highlight that monitoring water levels in the TP is essential for understanding hydrological shifts and their broader environmental impacts.
In situ gauges provide accurate water level measurements, but in many remote regions, they are sparse and may miss regional variations [12,13].
Satellite radar altimetry can mitigate these difficulties in monitoring lake water levels in remote and extensive regions. This technique was initially developed for the open ocean and has recently been adapted for inland water bodies. This makes it a suitable choice for water level monitoring. Sentinel-3A’s instruments, such as such as the Synthetic Aperture Radar Altimeter (SRAL) and the Sea and Land Surface Temperature Radiometer (SLSTR), advance both spatial and temporal resolution. Therefore, we can accurately monitor changes in lake water levels over time using Sentinel-3A [14].
In coastal areas, non-aquatic features can distort waveforms when they are within the radar footprint. This leads to waveforms that differ from the normal ocean model (Brown model) [15,16]. The emitted waveforms, upon reflection, can be seen as compositions of multiple smaller waveforms called subwaveforms [17]. To better understand these complex waveforms, various retracking methods have been developed[18]. The research demonstrates that, among these methods, the threshold algorithm has been especially effective. This algorithm defines a specific power level within the radar waveform to differentiate the water surface from nearby land reflections. This increases the accuracy of water level retrieval and hydrological assessments [19,20].
Previous studies in this area mostly focused on seasonal water level changes using meteorological station data or satellite-based temperature analysis through basic correlation analysis between water levels and climate variables [21,22]. While basic correlation analysis may give some information, it is not strong enough to capture the complex, nonlinear relationships between climate drivers and hydrological responses [23]. Meteorological data often has limited spatial coverage and may not fully capture the regional climate variations. Additionally, many studies rely on Moderate Resolution Imaging Spectroradiometer Land Surface Temperature (MODIS LST) data, which differ from air temperature due to surface-atmosphere interactions and have a limited temporal range beginning in 2000 [24,25].
This study overcomes these limitations via methodological advances. First, we employed Sentinel-3A radar altimetry and subwaveform retracking techniques to refine the estimation of water levels of TP lakes. This approach overcomes the limitations of standard retracking methods, especially in complex lake environments. Second, we employ Fifth Generation European Centre for Medium-Range Weather Forecasts (ECMWF) Atmospheric Reanalysis of the Global Climate data (ERA5) [26], which consist of climate variables of air temperature, rainfall, and evaporation at a high spatial and temporal resolution and covering a long period (dating back to 1940). Compared to ground station data and MODIS products, ERA5 data have better spatial and temporal coverage, making them highly applicable to measure climate effects in remote and sparse data areas. The reliability of ERA5 in China, including the TP, has been validated in recent studies [27], supporting that it can be used in hydrological studies. Third, moving beyond traditional correlation analyses, we integrate a Random Forest (RF) machine-learning model with SHAP (SHapley Additive exPlanations) to quantify the nonlinear and interdependent effects of climate drivers on lake water levels. This study pioneers the integration of Sentinel-3A subwaveform retracking, ERA5 reanalysis, and SHAP-based machine learning to quantify nonlinear climate impacts on TP lake levels at a regional scale. We grouped the lakes into Eastern, Western, Northern, and Southern regions based on their geographic locations. This classification facilitates the detection of spatial heterogeneity in climate–lake interactions, revealing regional differences in hydrological drivers (i.e., runoff, precipitation, and evaporation patterns) that have been overlooked in past studies.
2. Materials and Methods
2.1. Study Area
The TP covers approximately 2.5 million square kilometers and has an average altitude of 4,500 m [28]. It is bordered by the Himalayas in the south, Kunlun in the north, Qilian to the northeast, and Hengduan Mountains toward the east and southeast [29]. The plateau contains high-altitude steppe interspersed with mountain ranges and large brackish lakes.
Annual precipitation ranges from 100 to 300 mm, mostly in the form of hail. Grasslands dominate the southern and eastern borders [33]. This plateau holds the densest concentration of glaciers in Earth’s mid- and low-latitude regions, covering roughly 104,850 km². The largest glacier cover is in the Himalayas, amounting to 34,660 km². According to the second Chinese glacier inventory (2015), the glacier area across China decreased by nearly 17.2% as compared to the first glacier inventory (in the early 2000s) [30]. Using satellite stereo imagery, the glacier mass loss from 2006 to 2016 is estimated at -16.3 ± 3.5 gigatonnes annually [31]. Thus, it can be considered an appropriate area to study the effect of climate change on hydrological systems. The findings significantly contribute to knowledge about emerging water resources.
2.2. Altimetry Data Acquisition
Sentinel-3A was launched on February 16, 2016, under the GMES initiative (Global Monitoring for Environment and Security), which is jointly managed by the European Space Agency (ESA) and European Organisation for the Exploitation of Meteorological Satellites (EUMETSAT). One of its key instruments, SRAL, is essential for monitoring water levels in inland areas.
SRAL operates only in SAR mode and has a high along-track resolution of about 300 meters. It uses multi-look tracking and high pulse repetition frequencies. Its accuracy is improved by other onboard tools, such as a microwave radiometer that corrects for wet tropospheric delays, and instruments that provide precise orbital positioning [34]. This study analyzed altimetry data from Sentinel-3A’s Level-1 (SR_1_SRA) and Level-2 (SR_2_LAN) datasets, covering the period from May 2016 to March 2024. These datasets provide large spatial and temporal coverage of lakes in the TP, supporting comprehensive evaluations of water level dynamics. Figure 2 shows the locations of the lakes selected for this study, along with the ground tracks of the Sentinel-3A satellite.
2.3. DAHITI and Hydroweb Data:
Time-series lake-level data, using radar altimetry techniques tailored to inland water bodies, were gathered from two publicly accessible databases. The Hydrological Time-Series of Inland Waters (DAHITI), which the German Geodetic Research Institute runs [36], and the Hydroweb database, which was developed by the Laboratory for Space Geophysics and Oceanography Studies (LEGOS) are two datasets that are used for comparative analyses [37].
2.4. ERA5 Data Integration:
The ERA5 reanalysis dataset was produced by ECMWF. It was employed to analyze key climatic variables such as precipitation, temperature, evaporation, and runoff [26]. ERA5 provides monthly averaged data from 1940 to the present, which aligns with the monthly frequency of Sentinel-3 altimetry data. This alignment enables us to conduct reliable trend analysis in response to climate change.
The ERA5 dataset provides climate data from 1940 until now, consisting of monthly averaged data with spatial resolution at 0.25° × 0.25° (roughly at 30 km at the equator), making it a good option for detailed climate monitoring at a regional scale [26]. We extracted ERA5 data for the TP by defining the latitude and longitude boundaries of the lakes.
2.5. Fundamentals of Satellite Radar Altimetry and Subwaveform Retracking
Satellite radar altimetry works by sending signals to the earth’s surface and measuring the round-trip travel time of the reflected signal. This helps measure the distance between the satellite and the ground, which is important for figuring out water levels [38,39]. The distance between the satellite and the surface can be calculated using the following formula:
where C is the speed of light and is the round-trip time of the radar pulse [38].
On homogeneous surfaces such as oceans, waveforms are relatively simple, but over inland water bodies with complex terrain, reflections from surrounding features can distort the signal. To account for this distortion, the waveforms must undergo post-processing or “retracking” to identify the correct gate, known as the “retracked gate,” for accurate delay calculation.
The retracked correction, denoted as , is calculated using the formula:
where is the retracked gate, is the nominal gate, C is the speed of light, and τ is the gate width [39].
Once the retracked correction is applied, along with other media and geophysical corrections, water level variations can be estimated. The final sea surface height (SSH) is given by:
where and include corrections for factors such as ionospheric, dry atmospheric, and wet atmospheric effects, as well as sea state bias, tidal effects, and dynamic atmospheric corrections [40].
When there are multiple reflections, such as those over inland water bodies, a threshold retracking algorithm is used to extract meaningful subwaveforms. Building on the approach of Davis [42] and other prior studies (e.g., Villadsen et al., 2016)[43], this study applies an adaptive threshold retracking algorithm that adjusts to lake-specific waveform variability. Thresholds ranging from 10% to 90% of the maximum amplitude were iteratively tested to account for lake-specific waveform variability, ensuring optimal retracking accuracy [15]. Lower thresholds (10%–30%) were effective for lakes with complex shorelines or variable surface conditions, while higher thresholds (70%–90%) optimized retrievals for lakes with uniform surfaces [43]. The rationale behind this approach was not to find a universal optimal threshold, but to identify the most suitable sub-waveform segment for each lake, ensuring accurate water level retrieval despite differences in morphology, clutter, and signal strength. Equations 5–8 describe the mathematical underpinning of the retracker, including crucial factors such as amplitude, average waveform power, threshold level, and the retracked gate. Key formulas include [44]:
Amplitude of waveform (A):
Where:
, is the waveform power at gate k,
= = 4 is the number of gates affected by aliasing at the beginning and end of the waveform,
N is the total number of bins in the waveform.
Average waveform power ():
Where:
, denotes the waveform power at the first five gates.
, represents the thermal noise level.
Threshold level (Th):
Where:
q is the threshold value (e.g., 0.1 for 10% of the maximum amplitude).
Retracked gate ():
Where:
k is the first gate where the waveform power exceeds the threshold Th,
and are the waveform powers at gates k and k−1, respectively.
First, all meaningful subwaveforms were identified and retracked, and then the final water level was calculated by averaging the retracking corrections across all subwaveforms. This mean-based approach was especially effective when dealing with situations where there were multiple subwaveforms. It helped reduce errors that could occur due to waveform contamination near the shore[44]. Thresholds ranging from 10% to 90% were tested, with the optimal threshold selected based on the highest correlation with DAHITI reference data [15]. For lakes with multiple ground tracks, the track with the retrieved trend closest to DAHITI was selected for reporting in Table 1, ensuring consistency with the reference dataset
2.6. Fitting the Model and Outlier Rejection
To enhance the lake water level time series and identify outliers, we employ a model (trend) designed to capture both permanent and periodic (seasonal) fluctuations in the lake’s water level. This model also accounts for the acceleration of changes in water level. Using the linear least squares parametric adjustment method (LLSPA), the model—consisting of linear, quadratic, and trigonometric terms—was estimated and fitted to the time series, as described in Equation 8:
where is time, T is the annual period, and a, b, c, d, and e are coefficients estimated using LLSPA [45]. Water level measurements from various satellite passes were combined into a unified time series to improve the data quality. The median water level for each satellite pass was calculated to decrease the influence of outliers enhancing the robustness of the time series. This approach improved data quality before applying the LLSPA model (Equation 8)[44].
2.7. Validation Approach
Since in situ measurement data are available for only a limited number of high-altitude lakes on the TP, we validated Sentinel-3A-derived water levels using a multi-step approach that incorporates both gauge data and corresponding water level values extracted from the DAHITI and Hydroweb databases. For Zhari Namco (May 2016–October 2017) and Jieze Lake (October 2020–August 2021), in situ gauge data from the National Tibetan Plateau Data Center (TPDC) were used. To address vertical inconsistencies between satellite altimetry data (referenced to WGS84) and gauge data, datum conversion was applied following the validation method of Duan and Chen (2022)[46], focusing on relative rather than absolute changes. The agreement between the altimetry-derived water levels and in situ gauge measurements from TPDC was quantified using the Pearson correlation coefficient (R) [46,47,48], with strong temporal consistency observed for both lakes (R = 0.89 for Zhari Namco and R = 0.94 for Jieze Lake).
As noted earlier, ground based lake level observations are limited within the study region. Nevertheless, satellite altimetry products such as DAHITI and Hydroweb provide useful supplementary datasets for assessing the quality of satellite-derived water levels. Previous studies have shown that DAHITI lake level data are reliable, with reported accuracy typically within 30 cm across various lakes [49,50]. In our study, DAHITI water levels showed strong agreement with in situ gauge data at both Zhari Namco and Jieze Lake, with correlation values of 0.98 and 0.90, respectively, consistent with findings from previous studies [50,51]. These results suggest that DAHITI can serve as a reasonable reference for evaluating water level changes in high-altitude lakes, especially where in situ data are unavailable. Therefore, while acknowledging the limitations, comparisons between Sentinel-3A and DAHITI-derived trends offer valuable insights. For lakes without in situ measurements, monthly water level variations were compared with corresponding values from the DAHITI and Hydroweb datasets. Due to differences in vertical reference systems and data processing methods, absolute water levels were not directly compared. Instead, linear trend analysis was used to evaluate consistency between our estimates and the reference datasets. This trend-based approach helped reduce the impact of datum mismatches and follows the methodology described by Chen and Duan (2022)[52]. Validation was based on both Pearson correlation coefficients and the similarity of trend behavior between our results and those from DAHITI and Hydroweb.
2.8. Bias Correction of ERA5 Data
To address systematic biases in ERA5 precipitation data over the TP’s complex topography, both ERA5 and Multi-Source Weighted-Ensemble Precipitation (MSWEP) datasets were regridded to a common 0.1° resolution using conservative remapping to ensure spatial consistency. We then implemented a two-stage bias correction approach, using the MSWEP dataset as the reference. For the period through November 2020, we applied empirical quantile mapping to align ERA5 precipitation distributions with MSWEP by matching their cumulative distribution functions at each grid cell. For post-2020 data where MSWEP was unavailable, we employed Quantile Delta Mapping (QDM), which preserves ERA5’s climate change signal while applying bias corrections derived from historical quantile relationships (1980-2020). Temperature data through 2024 were similarly corrected using QDM to adjust both mean and extreme values while maintaining model-driven variability.
The corrected datasets were rigorously validated against MSWEP for precipitation using multiple statistical metrics, including the Kling-Gupta Efficiency (KGE), coefficient of determination (R²), and Mean Absolute Error (MAE). This validation demonstrated substantial improvements, with precipitation data showing median KGE values of 0.95 (range: 0.90-0.99) and bias reductions exceeding 96% across all study sites. Temperature corrections were equally effective, achieving median KGE > 0.99 and reducing MAE to 0.33 K. Complete validation metrics are provided in Supplementary Tables S1 and S2. The use of MSWEP as our validation reference, rather than direct observations, was necessitated by data scarcity in this remote region but is justified by MSWEP’s demonstrated performance in high-altitude environments and its incorporation of multiple observational data sources.
2.9. Feature Importance and SHAP Analysis
We employed RF with SHAP analysis to explore how climatic variables affected lake-level variation in the period 2016–2024 [53,54]. Bias-corrected ERA5 reanalysis data were pre-processed using z-score outlier detection, interpolation, and min-max scaling for features [55]. Finally, min-max scaling [56] was applied to normalize the data. We then trained a RF model and obtained feature importance scores to determine which climatic factors were the most influential in affecting changes in water level. The RF model, implemented using scikit-learn’s RandomForestRegressor with random_state=42, was tuned for each lake using 3-fold TimeSeriesSplit cross-validation with grid search, optimizing mean squared error across parameters including number of trees (100–300), maximum depth (5–20), minimum samples per split (2–5), minimum samples per leaf (1–3), and feature sampling (sqrt, log2). The lake-specific optimal hyperparameters are provided in Supplementary Table S3. Feature importance scores identified key drivers of water-level changes. SHAP values were computed using the TreeExplainer method, with the mean of the training dataset as the baseline, using all data per lake due to small sample sizes. De-pendence and interaction plots explored nonlinear interactions, revealing, for example, how precipitation and temperature influence water levels based on regional geology [54].
3. Results
3.1. Evaluation of Sentinel-3A Water Level Estimates: Comparison of Level-2 Retracking Methods and Threshold-Based Subwaveform Retracking on Level-1 Data
The comparison of retracking methods suggested these methods have different performances depending on the lake. The study tested standard retrackers like Offset Center of Gravity (OCOG), Maximum Likelihood Estimator (MLE) Tracker, Sea-Ice retracker, Ocean retracker, and Ice-Sheet retracker, along with a subwaveform retracker that uses threshold techniques. Next, the obtained water levels were validated using the DAHITI and Hydroweb databases. Based on the Offset Center of Gravity method [57], the OCOG retracker performed better for inland water level estimates than most standard retrackers used in radar altimetry missions [58]. Our results align with this previous finding, where the OCOG retracker performed well over the majority of cases, nine of the 10 lakes. This means OCOG is generally a reliable method for estimating water levels in inland water bodies. However, in the case of Zhari Namco, the Ocean retracker performed better than the others. This shows that factors like the lake’s terrain, water surface roughness, and lake morphology strongly influence the choice of the optimal retracking algorithm. It highlights the need to choose retracking techniques that are tailored to each lake’s specific environment [59,60].
The threshold-based subwaveform retracking method significantly improved water level estimates, showing very high trend agreement with reference datasets (R-value up to 0.994). In all cases, the threshold-based retrackers performed as well as, or better than, the standard retrackers (e.g., OCOG, Ocean). In Migriggyangzham, the highest agreement (R = 0.994) was achieved by applying the optimal threshold (90%), demonstrating the method’s ability to optimize inland waveforms when different thresholds are applied, effectively resolving them.
The correlation between the retrieved water surfaces and the DAHITI database shows that the proposed subwaveform method can achieve a good agreement, particularly for complicated waveforms that are common for radar over inland water bodies (Table 1). The study thus confirms that merging the approaches of threshold-based retracking with traditional Level-2 retracking techniques presents a comprehensive solution for accurate water level measurement across diverse lake environments (Detailed performance metrics for all retracking methods across all lakes are provided in Supplementary Tables S4-S16).
3.2. Water Level Trends Across the TP (2016–2024)
The evaluation of water level fluctuations from 2016 to 2024 indicates an overall increase. However, there is notable spatio-temporal variability across the TP, reflecting the region’s complex hydrological dynamics. The results are consistent with those of Jiang et al. (2017), who also observed rising lake levels using CryoSat-2 data. This consistency confirms the reliability of the observed upward trends across various observation periods and datasets. Nine of the studied lakes experienced consistent increases, with an average rise of approximately 0.3416 m yr⁻¹. The largest increases were recorded in Migriggyangzham Lake and Lexie Wudan Lake, with rises of 0.5259 m yr⁻¹ and 0.5153 m yr⁻¹, respectively. In contrast, Qinghai Lake—the largest lake on the TP—showed a more modest increase of 0.3201 m yr⁻¹. Similarly, other lakes displayed positive trends in water levels: Zhari Namco (0.3774 m yr⁻¹), Hoh Xil Lake (0.3577 m yr⁻¹), Siling Lake (0.3529 m yr⁻¹), Lumajang Dong (0.3028 m yr⁻¹), Jieze (0.2954 m yr⁻¹), and Ngoring (0.0277 m yr⁻¹) (Figure 3).
These results show a clear and significant shift in water levels across the TP, highlighting ongoing changes in the region’s hydrological system—likely driven by climate variability and increased glacier melt contributions. A contrasting trend was observed in Langacuo Lake. This lake located in the southern part of the plateau, experienced declining water levels at an annual rate of -0.2423 m.yr¹, making it the only exception to the overall positive trend. The observed decrease in Lake Langacuo aligns with the findings of Zhang et al. [4], who also reported declines in lake water levels across the southern TP. This decrease underscores the spatial variability of water level responses across the plateau, reflecting the complex and region-specific nature of its hydrological processes.
Regionally, lakes in the northern TP exhibited the largest increases in water level, with particular lakes showing significant growth rates over the observational period. This is in line with the findings of Fang et al. [62] who reported a tendency for lakes in the inner and northern regions of the plateau to experience rising water levels. In the southern region, the trends were more mixed and heterogeneous, with most lakes either stable or increasing in water levels, with Langacuo Lake being the only lake to show a marked decline in water level. The lakes in the eastern and western regions also showed moderate increases in water levels.
The observed variability underscores the complex and region-specific characteristics of hydrological processes on the TP. Understanding these dynamics is crucial for water resource management and climate adaptation efforts in high-altitude, climate-sensitive regions.
3.3. Geographic Grouping and Hydrological Dynamics of TP Lakes and Climate Influence
3.3.1. Eastern Lakes (Ngoring, Qinghai)
On the eastern TP, the drivers of water level rise differ between Qinghai and Ngoring Lakes. In Ngoring Lake, runoff (~ 0.4) from snowmelt and rainfall is the primary contributor, with precipitation playing a supporting role (Figure 4-(B)) driving water level changes and show a significant increasing trend (+1.14 mm yr⁻¹, p = 0.011), largely influenced by temperature thresholds. When temperatures exceed 0°C (34.7% of observations), runoff rises to 1.2 times the baseline, and at >5°C, it increases to 1.3 times. This occurs despite a non-significant warming trend (+0.07°C yr⁻¹, p = 0.091), indicating that even short warm periods can trigger runoff increases. Evaporation shows no significant trend (+0.38 mm yr⁻¹, p = 0.637) and does not offset runoff gains. These patterns suggest that episodic warming induces snowmelt, the primary driver of runoff, while precipitation plays a secondary role. The interaction between temperature thresholds and snowmelt underlies the observed runoff increase, altering Ngoring’s water balance.
Qinghai Lake demonstrates balanced evaporation-temperature control, with SHAP values ranking evaporation (~0.3) marginally above precipitation, temperature and runoff (Figure 4-(A)). This aligns with Fu et al. (2021)[63], who showed that evaporation accounts for approximately 70% of water losses, exceeding contributions from precipitation and runoff. Despite this substantial evaporative loss, lake levels have continued to rise, suggesting a finely tuned hydrological balance. On days above 5°C (36.4% of the period), runoff increases to 0.90 mm day-1—1.7 times the baseline (0.51 mm day-1)—and on days above 10°C, it reaches 1.11 mm day-1, 2.2 times higher (r = 0.57, p < 0.001). These increases occur despite an insignificant precipitation trend (-0.67 mm yr⁻¹, p = 0.717). This indicates that while Ngoring’s rise is driven by consistent runoff, Qinghai’s increase depends on limited evaporation and episodic temperature-driven runoff, with precipitation playing a minor role in both cases. A summary of the hydrological drivers, climate thresholds, and statistical trends for Ngoring and Qinghai Lakes is provided in Supplementary Table S17.
3.3.2. Western Lakes (Lumajang Dong, Jieze)
Both Lumajang Dong and Jieze Lakes, located on the western TP with an altitude difference of approximately 300 meters (Lumajang Dong being higher), exhibit short-term hydrological sensitivity to climate extremes, despite showing no significant long-term trends in temperature, precipitation, evaporation, or runoff (Theil-Sen, p > 0.05). This suggests that episodic events, rather than gradual trends, dominate water-level fluctuations. At Lumajang Dong, runoff and precipitation emerge as the most influential factors (Figure 5-(A)), with precipitation–evaporation interactions (SHAP interaction strength: 0.186) reflecting the influence of snowmelt and glacial dynamics. Nonlinear runoff responses are observed within the temperature range of -7°C to +7°C. On days above 0°C (34.0% of observations), runoff nearly doubles (2.2× 0.0208 mm day-1 vs. baseline ~0.01 mm day-1), and on days above 5°C (17.9%), it increases further—though less markedly than at Jieze. Weak summer warming (+0.0416°C yr⁻¹, p = 0.924) and negative precipitation–runoff correlations (e.g., -0.2755 on warm days) suggest that glacial melt is driven by short-lived temperature spikes, with high precipitation events contributing little to runoff (0.0134 mm day-1).
In contrast, Jieze, at lower elevation, exhibits rising water levels indicative of a positive water balance, likely due to more frequent warm conditions. Precipitation shows the highest SHAP contribution to water level changes, followed by runoff, evaporation, and temperature (Figure 5-(B))—highlighting its role as both a direct input and a driver of runoff. Runoff ranks highest in feature importance and shows minimal interaction effects (precipitation–evaporation: 0.037; evaporation–runoff: 0.036). On days above 0°C (36.2%), runoff increases 2.2×, and on days above 5°C (26.6%), it rises by 2.4× (0.19 vs. 0.08 mm day-1), further amplified during warm-wet episodes (0.1943 mm day-1). High precipitation events (top 10%, 0.3153 mm day-1, 3.9× baseline) significantly boost water levels. A minor decrease in evaporation (-0.19 mm yr⁻¹, p = 0.982) supports net water accumulation. The absence of significant trends (e.g., Jieze: precipitation 0.15 mm yr⁻¹, p = 0.97; runoff -0.32 mm yr⁻¹, p = 0.390; temperature -0.03°C yr⁻¹, p = 0.30; Lumajang Dong: precipitation -0.79 mm yr⁻¹, p = 0.536) reinforces the dominant role of episodic melt and precipitation events. Elevation critically shapes each lake’s distinct hydrological response to climate extremes. Table S.17 in the Supplementary Materials summarizes the key hydrological drivers, climate thresholds, and trend analyses for Lumajang Dong and Jieze Lakes.
3.3.3. Southern Lakes (Zhari Namco, Siling, Langacuo)
Increased evaporation due to regional warming, combined with changes in glacial meltwater contributions (Figure 6), has led to varied hydrological responses among southern Tibetan lakes. While overall temperature trends are modest (Zhari Namco: +0.034°C yr⁻¹, p = 0.578; Siling: +0.024°C yr⁻¹, p = 0.677; Langacuo: +0.036°C yr⁻¹, p = 0.718), summer warming is significant at Zhari Namco (+0.88°C yr⁻¹, p < 0.001) and Langacuo (+0.81°C yr⁻¹, p = 0.044). Despite similar warming, lake-level trends vary: Zhari Namco and Siling are rising, while Langacuo is declining.
Zhari Namco’s rise supported by a more stable hydrological response to warming. Runoff increases 2.2-fold on days above 0°C, which occur frequently (43.1% of the time), providing consistent meltwater input. SHAP analysis identifies a relatively high and critical temperature threshold (~9.4°C), which is associated with a significant boost in runoff, reinforcing the role of sustained warm conditions in maintaining the lake’s inflow. A similar finding is reported by Zhu et al. [64], who quantitatively analyzed changes in Zhari Namco’s water storage and found that glacial meltwater accounts for 52.9% of the lake’s increase in water volume.
For Siling Lake, SHAP values indicate that runoff (≈0.45) is the most important driver, followed by precipitation, temperature, and evaporation (Figure 6-(B)). Runoff plays a dominant role in controlling water level changes and exhibits a statistically significant increasing trend in annual runoff (Theil-Sen slope: 1.13 mm yr⁻¹, p = 0.011), coinciding with a marked rise in lake water levels. This suggests that runoff is a primary driver of the lake’s expansion, particularly under specific thermal and hydrometeorological conditions. Runoff notably intensifies during warmer periods, with an average of 0.3844 mm day-1 on days when temperatures exceed 0°C—accounting for 28.3% of the observational record. During heatwave events, defined as days exceeding 5°C (16.1% of the time series), runoff reaches 0.3844 mm day-1, which is approximately 2.2 times greater than the baseline value of 0.19 mm day-1. Seasonal analyses further reveal significant runoff increases in winter (DJF; slope: 0.0450 mm day-1, p = 0.0009) and autumn (SON; slope: 0.0722 mm day-1, p = 0.0035), likely driven by temperature-induced melt and warm-wet episodes. Notably, during events characterized by temperatures above 0°C and precipitation exceeding the seasonal median, runoff averages 0.3844 mm day-1. These findings indicate that short-term, high-intensity melt and precipitation events—potentially coupled with reduced outflow or enhanced basin retention—contribute substantially to the lake’s rising water levels, despite only moderate increases in annual runoff. These findings are consistent with Liping et al. (2019) [65] who emphasized the role of glacial and snowmelt, enhanced by westerly precipitation, in sustaining Siling’s growth.
In contrast, Langacuo illustrates a clear negative water balance despite experiencing similar warming trends. SHAP analysis ranks temperature, precipitation, runoff, and evaporation as key influencing factors (Figure 6-(C)). However, rising summer temperatures (+0.81 °C yr⁻¹, p = 0.044) correspond to increased evaporation, particularly during June–August (+0.19 mm day-1, p = 0.053), with annual trends also positive (+1.09 mm yr⁻¹, p = 0.62). Runoff exhibits a slightly negative but statistically insignificant trend (−0.36 mm yr⁻¹, p = 0.890), and warm days (>5 °C) occur only 22.8% of the time, limiting meltwater inputs. Although these warmer days increase runoff by a factor of 2.3, the frequency of such events is insufficient to counterbalance the elevated evaporation rates. Furthermore, a relatively weak correlation between temperature and runoff (r = 0.43), along with an insignificant precipitation trend (+1.46 mm yr⁻¹, p = 0.844), suggests limited capacity for hydrological compensation. Langacuo’s declining water levels likely reflect a diminished glacial reservoir and increasing evaporative losses, with episodic melt events proving inadequate to sustain lake levels under a warming regime. The hydrological drivers, critical climate thresholds, and statistical trends for Zhari Namco, Siling, and Langacuo Lakes are summarized in Table S.17 in the Supplementary Materials
3.3.4. Northern Lakes (Lexie Wudan, Hoh Xil, Migriggyangzham)
Northern TP lakes (Lexie Wudan, Hoh Xil, Migriggyangzham) experience rapid water level rises (0.5153 m yr-1 , 0.3577 m yr-1, 0.5259 m yr-1), driven primarily by glacial melt (Figure 7-(A), Figure 7-(B), and Figure 7-(C), respectively). These trends align with IPCC findings linking rising lake levels to accelerated glacial retreat, which contributed 41% of the global sea-level rise from 1901 to 2018 [4,66].
Hoh Xil Lake exemplifies a system in delicate hydrological balance. Although the long-term runoff trend is negative (−0.0436 mm yr⁻¹, p = 0.145), the lake continues to rise, with a net increase in water level of approximately +0.3577 m yr⁻¹. SHAP analysis identifies evaporation as the dominant limiting factor (importance score: 0.32), yet warm episodes redistribute available energy from evaporation to meltwater runoff, evidenced by a negative runoff–evaporation correlation (r = −0.10). Days exceeding 0°C (17.9% of observations) are associated with a 2.2-fold increase in runoff (1.63 vs. 0.70 mm day⁻¹), while rare but extreme >5°C days (2.1%) amplify runoff by 2.7 times. Additionally, rainfall events show a stronger correlation with runoff (r = 0.41) than snow (r = 0.15), with the most intense precipitation events generating up to 1.85 mm day⁻¹ (2.6 times the baseline). SHAP ranks the importance of hydrometeorological drivers in the following order: evaporation > temperature > precipitation > runoff, indicating that intermittent warm and wet episodes are sufficient to sustain the lake’s expansion despite overall declining runoff.
Lexie Wudan Lake demonstrates a rapid increase in water level that is not matched by a significant warming trend (+0.038°C yr⁻¹, p = 0.619). Nevertheless, threshold-dependent glacial melt processes play a decisive role: runoff increases by 2.2 times during days above 0°C (0.97 vs. 0.44 mm day⁻¹) and by 2.4 times during >5°C days (1.07 mm day⁻¹). A seasonal decline in winter evaporation (−0.04 mm day⁻¹, p = 0.058) further favors positive water balance, allowing meltwater contributions to dominate lake inflows.
Migriggyangzham Lake demonstrates a notable increase in water level, rising at a rate of +0.5259 m yr⁻¹, despite the absence of significant warming trends (−0.026°C yr⁻¹, p = 0.803) and stable runoff conditions (+0.052 mm yr⁻¹, p = 0.883). SHAP analysis indicates that temperature threshold exceedances are a critical driver of runoff dynamics. Specifically, 36.3% of days with temperatures above 0°C contribute to a 1.5-fold increase in runoff (0.28 vs. 0.19 mm day⁻¹, r = 0.5505), while days exceeding 5°C (20.4% of the time) are associated with a 1.6-fold increase (0.29 mm day⁻¹). Although the overall temperature trend is statistically insignificant, seasonal summer warming (+0.6348°C yr⁻¹, p = 0.1891) appears to enhance meltwater production. Concurrently, a reduction in annual evaporation (−1.25 mm yr⁻¹, p = 0.663), particularly during winter (December–February: −0.03 mm yr⁻¹, p = 0.3503), supports greater water retention. These synergistic effects—temperature-triggered melt events and decreased evaporative loss—explain why Migriggyangzham Lake exhibits a more pronounced rise than Hoh Xil. Ultimately, the lake’s rapid expansion is sustained by glacial melt processes triggered by thermal thresholds, while reduced evaporation further shifts the hydrological balance toward sustained water level rise. A comprehensive summary of the hydrological drivers, climate thresholds, and trend statistics for Lexie Wudan, Hoh Xil, and Migriggyangzham Lakes is provided in Table S.17 in the Supplementary Materials.
4. Discussion
The results of the SHAP analysis serve as a powerful quantitative and robust assessment of the contributions of specific climate drivers to the observed changes in water levels across the TP. This approach offer a significant advancement over correlation-based approaches used in previous research, as it provides a stronger examination of hydrological dynamics through data-driven techniques [67,68].
SHAP analysis confirmed that runoff from glacial melt and precipitation is the main factor affecting water levels in the northern and western regions. This is consistent with Liping et al. (2019) [65], who attributed lake expansion (2000–2013) to glacier meltwater. The analysis further underscores the primacy of runoff, which is intensified by temperature thresholds that induce episodic melt pulses, even in the absence of sustained warming trends. For example, the rapid water level increase observed in Migriggyangzham Lake reflects its sensitivity to warm days, where reduced evaporation enhances water retention. This response is closely linked to meltwater input from the nearby Geladandong ice caps, one of the major glacier systems in the Yangtze River Source Region. These glaciers have experienced substantial and accelerating mass loss over recent decades [69]. Zhu et al. (2024) document extreme glacier melt (22–48 mm w.e., March–April 2022) on central TP glaciers, driven by long-term warming (0.34–0.37°C/decade) and high shortwave radiation, amplified by atmospheric circulation changes such as the northward shift of westerlies. This supports our findings of glacier melt as a primary driver of lake level increases, highlighting the role of climate-driven glacier retreat in TP lake expansion [70]. Temperature plays a dual role in regulating hydrological processes in western TP (TP) lakes by simultaneously enhancing both runoff and evaporation, with elevation critically influencing their relative magnitudes. In Jieze Lake (~4,500 m), runoff increases by approximately 2.2 times to 0.1760 mm day⁻¹ when temperatures exceed 0 °C, primarily driven by glacier melt and precipitation within the 4,200–4,500 m elevation band. Evaporation during warm periods reaches ~0.006 mm day⁻¹, modestly offsetting the runoff gains (see Section 3.3.2). At Lumajang Dong Lake (~4,900 m), runoff increases to approximately 0.0208 mm day⁻¹ above 0 °C, fueled by intensified glacier melt at higher elevations. However, evaporation rates of ~0.008 mm day⁻¹ substantially counterbalance these inflows. This pattern reflects the complex interplay between cryospheric and atmospheric processes in the TP, consistent with Liping et al. (2019)[65], who noted warming’s amplifying effect on melt relative to evaporative losses in western basins. As warming progresses, increased evaporation alongside diminished glacial contributions due to retreat may shift the hydrological balance toward net water loss, emphasizing the need for elevation-specific water management strategies. Recent regional studies support these observations. Pepin et al. (2022)[9], reported that elevation-dependent warming (EDW) in the TP is relatively weak compared to other mountain systems, due to the region’s unique atmospheric and surface energy dynamics. Their gridded analysis revealed weaker EDW signals in the TP compared to mountain systems like the Alps or Rockies, likely due to the complex interactions among temperature, precipitation, and atmospheric circulation patterns [9,31].
Eastern lakes, Ngoring and Qinghai, exhibit contrasting dynamics. Ngoring’s runoff-dominated regime, fueled by snowmelt, underscores the importance of temperature-driven melt, even in the absence of strong warming trends. Qinghai, conversely, is governed by evaporation, as Fu et al. (2021) [63] noted, with episodic runoff boosts offsetting significant water losses. This dichotomy reflects regional climatic influences, with westerly-driven precipitation supporting Ngoring and arid conditions constraining Qinghai. SHAP’s ability to disentangle these drivers highlights the need for tailored management: Ngoring may sustain growth short-term, but Qinghai’s evaporation sensitivity demands strategies to mitigate water loss.
Southern lakes—Zhari Namco, Siling, and Langacuo—reveal a spectrum of responses to warming and glacial retreat. Zhari Namco’s stability, driven by frequent melt events, aligns with Zhu et al. (2010)[64], who attributed significant water gains to glacial melt., as Liping et al. (2019) [65]observed. Langacuo’s decline, however, stems from evaporation’s dominance, outpacing infrequent melt inputs and limited precipitation, positioning it near a hydrological tipping point. These contrasts underscore the southern Plateau’s vulnerability: while glacial melt sustains some lakes, warming-induced evaporation threatens others, particularly those with depleted glacial reserves. The observed decline in southern lakes aligns with the negative mass balances of glaciers in the southern Hindu Kush-Himalaya (HMA) region, where reduced glacial meltwater and intensified evaporation compound water loss [31]. The regional dichotomy between monsoon-fed (southern) and westerly-fed (northern) lakes further underscores the spatial variability in climate responses [21].
Using advanced satellite altimetry and ERA5 data provides a reliable framework for tracking lake level changes, with SHAP enhancing mechanistic understanding. These findings offer valuable insights for developing water management policies and climate adaptation strategies, particularly in ecologically sensitive and high-altitude regions facing similar challenges.
4.1. Synthesis of Hydrological Drivers
This study found that water level changes across the TP are driven by a dynamic interplay of climate variables, with notable regional differences. In the northern and eastern regions, glacial meltwater and precipitation contribute to rising lake levels, with runoff amplified by temperature thresholds.
In contrast, southern lakes like Langacuo experience declines due to evaporative losses outpacing inflows, while western lakes benefit from reduced evaporation. Precipitation plays a critical role in maintaining water levels in lower-altitude lakes like Jieze, where glacial influence is less dominant. This complex interaction highlights the plateau’s vulnerability to climatic variability.
4.2. Validation and Methodological Limitations
The extracted water levels showed strong trend correlation (R > 0.9 for most lakes) with DAHITI/Hydroweb, confirming the methods’ as Chen and Duan (2022) [52] similarly found. DAHITI and Hydroweb datasets, validated globally, typically have errors less than 30 cm [49,50,52]. However, their reliance on multi-sensor radar altimetry introduces variations. Differences in sensor characteristics, temporal coverage, and processing methods can contribute to minor inconsistencies relative to the extracted estimates. These challenges informed the decision to avoid direct comparisons of absolute water levels in this study. Instead, a uniform linear model was applied to assess trends and ensure consistency between the datasets, a method consistent with Chen and Duan [52].
Several sources of uncertainty were identified during validation. The lack of in situ gauge data for high elevation lakes represents a significant limitation, as ground based measurements would provide a direct means of verifying altimetry derived water levels. Waveform interference near shorelines during retrievals may introduce small errors [71]. To address this issue, a mean-based retracking approach was implemented, enhancing retrieval accuracy.
Despite these challenges, the high correlation coefficients observed reinforce the reliability of the study’s methodology. The consistent agreement between trends from the DAHITI and Hydroweb databases and the extracted water levels validates the robustness of the retrieval methods. The validation approach adopted here aligns with that of Chen and Duan [52], who also utilized the DAHITI database for trend validation. Given DAHITI’s demonstrated accuracy, it served as a reliable reference, thereby reinforcing the credibility of the derived lake level estimates.
The generalizability of our findings is constrained by the dataset’s spatial scope. Our sample of 10 lakes, selected to span diverse hydrological and geographical conditions, includes endorheic lakes (e.g., Siling), driven by precipitation and evaporation, and exorheic lakes (e.g., Lumajang Dong), influenced by inflow and outflow. However, this sample does not fully capture the TP’s hydrological heterogeneity, particularly smaller glacial-fed, saline, or peripheral lakes. Expanding future studies to include a broader, more systematic lake selection across climatic and altitudinal gradients, leveraging upcoming SWOT altimetry data, would enhance representativeness and generalizability.
ERA5 reanalysis data offers high spatial and temporal resolution and has demonstrated strong performance in representing temperature patterns over the TP [72]. However, it has limitations, particularly in representing precipitation in regions with complex topography. In areas such as the eastern periphery of the Plateau and the Sichuan Basin, ERA5 may underestimate precipitation intensity—especially during extreme events—and overestimate the frequency of light rainfall. These biases may result in underestimating precipitation’s influence on lake-level dynamics, especially in low-altitude or precipitation-sensitive basins [73,74]. Quantile mapping with MSWEP mitigated biases, but residual uncertainties remain. SHAP’s focus on relative contributions, however, ensures robust interpretations, aligning with hydrological modeling practices.
4.3. Research Gaps and Future Directions
Our analysis of TP lake-level changes from 2016 to 2024 offers valuable insights into regional hydrological variability but also reveals critical research gaps that warrant further investigation. First, while our 10-lake sample covers diverse hydrological conditions, it does not fully represent the TP’s spatial heterogeneity (Section 4.2). Future studies should expand the scope to include smaller glacial-fed or saline lakes, which could provide a more comprehensive understanding of regional dynamics. Second, our reliance on ERA5 runoff data did not account for groundwater contributions, a key factor in lake storage. Integrating GRACE observations or hydrological models could help quantify groundwater’s role in future assessments. Third, the observed regional variability in lake-level trends, such as the rise of northern lakes (e.g., Migriggyangzham) due to glacial melt and the decline of southern lakes (e.g., Langacuo) due to enhanced evaporation (Section 3.2), highlights the need for scenario-based projections (e.g., CMIP6 SSP2-4.5, SSP5-8.5) to assess future hydrological risks under climate change. Fourth, the scarcity of in situ data remains a major validation challenge, limiting the accuracy of altimetry-based estimates. Ground-based measurements should be prioritized to improve dataset reliability and support robust conclusions. Addressing these gaps will enable region-specific water management strategies, particularly for vulnerable southern lakes and expanding northern ones.
Beyond these research needs, the broader implications of climate-driven lake-level changes must be considered. While rising water levels in northern and central TP lakes may temporarily enhance water availability, long-term risks, such as glacier retreat and erratic precipitation, could exacerbate water stress, particularly in the already declining southern lakes. Furthermore, ecosystem disruptions, including wetland submergence and habitat alteration [75], underscore the urgency of adaptive water resource management. Future studies should prioritize ecological impact assessments and develop sustainable frameworks to mitigate risks in this fragile region.
5. Conclusions
This study demonstrates the complex impacts of climate change on TP lake hydrology, revealing significant regional variability. Increases in glacial melt and precipitation have contributed to rising water levels in the northern and western regions. Conversely, in the southern part of the plateau (e.g., Langacuo), a change in the balance between evaporation and temperature has resulted in declining water levels. By integrating Sentinel-3A altimetry with ERA5 climate reanalysis and SHAP-based machine learning, we quantified the nonlinear interactions of climatic drivers (temperature, runoff, evaporation) at regional scales, revealing threshold-dependent responses critical for hydrological stability. These findings underscore the urgency of region-specific water management strategies: protecting vulnerable southern lakes from water loss while addressing the risks of unregulated expansion in northern basins. The methodological advances demonstrated here, particularly the fusion of subwaveform retracking, reanalysis data, and explainable ML, provide a scalable framework for monitoring climate-driven hydrological changes in high-altitude regions globally. Future efforts should prioritize adaptive policies that account for the TP’s evolving water balance, ensuring ecosystem resilience and sustainable resource use under projected climate scenarios.
Supplementary Materials
The following supporting information can be downloaded at the website of this paper posted on Preprints.org. Table S1: Temperature bias correction metrics after Quantile Delta Mapping (QDM) for ERA5 data. Table S2: Precipitation bias correction metrics after QDM for ERA5 data. Table S3: Optimized Random Forest hyperparameters for each study lake. Table S4–S16: Performance evaluation of water level retrieval methods for TP lakes (Qinghai, Siling, Lexie Wudan, Lumajang Dong, Zhari Namco, Ngoring, Langacuo, Jieze, Migriggyangzham, Hoh Xil) across various ground tracks, including statistical comparison against DAHITI. Table S17: Trend analysis summary for climatic and hydrological variables (temperature, precipitation, evaporation, runoff) across TP lakes.
Author Contributions
Atefeh. Gholami.; Conceptualization, Methodology, Formal analysis, Data curation, Investigation, Software, Writing – original draft, Wen. Zhang.; Supervision, Conceptualization, Methodology, Resources, Writing – review & editing.
Funding
the National Natural Science Foundation of China, grant number 41975118, funded this research.
Data Availability Statement
The Sentinel-3A altimetry data used for water level retrieval in this study are freely available from the ESA Copernicus Open Access Hub at https://scihub.copernicus.eu/. ERA5 climate variables (temperature, precipitation, evaporation, runoff) were obtained from the Copernicus Climate Data Store (CDS) at https://cds.climate.copernicus.eu/. In situ water level measurements for Zhari Namco and Jieze lakes are accessible via the TPDC at https://data.tpdc.ac.cn/. No new data were created that are restricted by privacy or ethical concerns.
Acknowledgments
The authors gratefully acknowledge the support of the National Natural Science Foundation of China [No. 41975118] and the University of Chinese Academy of Sciences. We would also like to express our sincere thanks to Dr. Shirzad Roohi for his valuable guidance and insightful discussions during the development of this work. We also thank the anonymous referees for their helpful and constructive comments, which improved the quality of this manuscript.
Conflicts of Interest
The authors declare that they have no known competing financial interests or personal relationships that could have appeared to influence the work reported in this paper.
References
- Pastorino, P.; Elia, A.C.; Pizzul, E.; Bertoli, M.; Renzi, M.; Prearo, M. The Old and the New on Threats to High-Mountain Lakes in the Alps: A Comprehensive Examination with Future Research Directions. Ecological Indicators 2024, 160, 111812. [Google Scholar] [CrossRef]
- Xue, Y.; Ma, Y.; Li, Q. Land–Climate Interaction over the Tibetan Plateau. 2018.
- National Research Council Himalayan Glaciers: Climate Change, Water Resources, and Water Security; National Academies Press, 2012; ISBN 0-309-26099-X.
- Zhang, G.; Yao, T.; Xie, H.; Yang, K.; Zhu, L.; Shum, C.K.; Bolch, T.; Yi, S.; Allen, S.; Jiang, L.; et al. Response of Tibetan Plateau Lakes to Climate Change: Trends, Patterns, and Mechanisms. Earth-Science Reviews 2020, 208, 103269. [Google Scholar] [CrossRef]
- Zhang GuoQing, Z.G.; Yao TanDong, Y.T.; Chen WenFeng, C.W.; Zheng GuoXiong, Z.G.; Shum, C.; Yang Kun, Y.K.; Piao ShiLong, P.S.; Sheng YongWei, S.Y.; Yi Shuang, Y.S.; Li JunLi, L.J. Regional Differences of Lake Evolution across China during 1960s-2015 and Its Natural and Anthropogenic Causes. 2019.
- Woolway, R.I.; Kraemer, B.M.; Lenters, J.D.; Merchant, C.J.; O’Reilly, C.M.; Sharma, S. Global Lake Responses to Climate Change. Nature Reviews Earth & Environment 2020, 1, 388–403. [Google Scholar]
- Zhang, X.; Kurbaniyazov, A.; Kirillin, G. Changing Pattern of Water Level Trends in Eurasian Endorheic Lakes as a Response to the Recent Climate Variability. Remote Sensing 2021, 13. [Google Scholar] [CrossRef]
- Houghton, J.T. Climate Change 1995: The Science of Climate Change: Contribution of Working Group I to the Second Assessment Report of the Intergovernmental Panel on Climate Change; Cambridge University Press, 1996; Vol. 2; ISBN 0-521-56436-0.
- Pepin, N.; Arnone, E.; Gobiet, A.; Haslinger, K.; Kotlarski, S.; Notarnicola, C.; Palazzi, E.; Seibert, P.; Serafin, S.; Schöner, W. Climate Changes and Their Elevational Patterns in the Mountains of the World. Reviews of Geophysics 2022, 60, e2020RG000730. [Google Scholar] [CrossRef]
- Kuang, X.; Jiao, J.J. Review on Climate Change on the Tibetan Plateau during the Last Half Century. Journal of Geophysical Research: Atmospheres 2016, 121, 3979–4007. [Google Scholar] [CrossRef]
- Allan, R.P.; Barlow, M.; Byrne, M.P.; Cherchi, A.; Douville, H.; Fowler, H.J.; Gan, T.Y.; Pendergrass, A.G.; Rosenfeld, D.; Swann, A.L. Advances in Understanding Large-scale Responses of the Water Cycle to Climate Change. Annals of the New York Academy of Sciences 2020, 1472, 49–75. [Google Scholar] [CrossRef] [PubMed]
- Biancamaria, S.; Andreadis, K.M.; Durand, M.; Clark, E.A.; Rodriguez, E.; Mognard, N.M.; Alsdorf, D.E.; Lettenmaier, D.P.; Oudin, Y. Preliminary Characterization of SWOT Hydrology Error Budget and Global Capabilities. IEEE Journal of Selected Topics in Applied Earth Observations and Remote Sensing 2009, 3, 6–19. [Google Scholar] [CrossRef]
- Shiklomanov, A.I.; Lammers, R.B.; Vörösmarty, C.J. Widespread Decline in Hydrological Monitoring Threatens pan-Arctic Research. Eos, Transactions American Geophysical Union 2002, 83, 13–17. [Google Scholar] [CrossRef]
- Lee, H.; Durand, M.; Jung, H.C.; Alsdorf, D.; Shum, C.; Sheng, Y. Characterization of Surface Water Storage Changes in Arctic Lakes Using Simulated SWOT Measurements. International Journal of Remote Sensing 2010, 31, 3931–3953. [Google Scholar] [CrossRef]
- Agar, P.; Roohi, S.; Voosoghi, B.; Amini, A.; Poreh, D. Sea Surface Height Estimation from Improved Modified, and Decontaminated Sub-Waveform Retracking Methods over Coastal Areas. Remote Sensing 2023, 15, 804. [Google Scholar] [CrossRef]
- Anzenhofer, M.; Shum, C.; Rentsh, M. Coastal Altimetry and Applications. Ohio State University Geodetic Science and Surveying Tech. Rep 1999, 464, 36. [Google Scholar]
- Jinyum, G.; Cheiway, H.; Xiaotao, C.; Yuting, L. Improved Threshold Retracker for Satellite Altimeter Waveform Retracking over Coastal Sea. Progress in Natural Science 2006, 16, 732–738. [Google Scholar] [CrossRef]
- Ganguly, D.; Chander, S.; Desai, S.; Chauhan, P. A Subwaveform-Based Retracker for Multipeak Waveforms: A Case Study over Ukai Dam/Reservoir. Marine Geodesy 2015, 38, 581–596. [Google Scholar] [CrossRef]
- Guo, J.; Chang, X.; Gao, Y.; Sun, J.; Hwang, C. Lake Level Variations Monitored with Satellite Altimetry Waveform Retracking. IEEE journal of selected topics in applied earth observations and remote sensing 2009, 2, 80–86. [Google Scholar] [CrossRef]
- Memarian Sorkhabi, O.; Asgari, J.; Amiri-Simkooei, A. Wavelet Decomposition and Deep Learning of Altimetry Waveform Retracking for Lake Urmia Water Level Survey. Marine Georesources & Geotechnology 2022, 40, 361–369. [Google Scholar]
- Lei, Y.; Yang, K.; Wang, B.; Sheng, Y.; Bird, B.W.; Zhang, G.; Tian, L. Response of Inland Lake Dynamics over the Tibetan Plateau to Climate Change. Climatic Change 2014, 125, 281–290. [Google Scholar] [CrossRef]
- Zhang, G.; Xie, H.; Duan, S.; Tian, M.; Yi, D. Water Level Variation of Lake Qinghai from Satellite and in Situ Measurements under Climate Change. Journal of Applied Remote Sensing 2011, 5, 053532–053532. [Google Scholar] [CrossRef]
- León, F.P.; Heizmann, M. Strategies to Detect Non-Linear Similarities by Means of Correlation Methods. Intelligent Robots and Computer Vision XX: Algorithms, Techniques, and Active Vision 2001, 4572, 513–524. [Google Scholar]
- Guo, D.; Sun, J.; Yang, K.; Pepin, N.; Xu, Y. Revisiting Recent Elevation-dependent Warming on the Tibetan Plateau Using Satellite-based Data Sets. Journal of Geophysical Research: Atmospheres 2019, 124, 8511–8521. [Google Scholar] [CrossRef]
- Pepin, N.; Deng, H.; Zhang, H.; Zhang, F.; Kang, S.; Yao, T. An Examination of Temperature Trends at High Elevations across the Tibetan Plateau: The Use of MODIS LST to Understand Patterns of Elevation-dependent Warming. Journal of Geophysical Research: Atmospheres 2019, 124, 5738–5756. [Google Scholar] [CrossRef]
- Hersbach, H.; Bell, B.; Berrisford, P.; Hirahara, S.; Horányi, A.; Muñoz-Sabater, J.; Nicolas, J.; Peubey, C.; Radu, R.; Schepers, D. The ERA5 Global Reanalysis. Quarterly Journal of the Royal Meteorological Society 2020, 146, 1999–2049. [Google Scholar] [CrossRef]
- Sun, Y.; Yang, F.; Liu, M.; Li, Z.; Gong, X.; Wang, Y. Evaluation of the Weighted Mean Temperature over China Using Multiple Reanalysis Data and Radiosonde. Atmospheric Research 2023, 285, 106664. [Google Scholar] [CrossRef]
- Zhang, X. China’s Tibet; CICC, 2004; ISBN 7-5085-0608-1.
- Yang, Q.; Zheng, D. Tibetan Geography; CICC, 2004; ISBN 7-5085-0665-0.
- Guo, W.; Liu, S.; Xu, J.; Wu, L.; Shangguan, D.; Yao, X.; Wei, J.; Bao, W.; Yu, P.; Liu, Q. The Second Chinese Glacier Inventory: Data, Methods and Results. Journal of Glaciology 2015, 61, 357–372. [Google Scholar] [CrossRef]
- Brun, F.; Berthier, E.; Wagnon, P.; Kääb, A.; Treichler, D. A Spatially Resolved Estimate of High Mountain Asia Glacier Mass Balances from 2000 to 2016. Nature geoscience 2017, 10, 668–673. [Google Scholar] [CrossRef]
- Hou, P.; Weidman, R.P.; Liu, Q.; Li, H.; Duan, L.; Zhang, X.; Liu, F.; Gao, Y.; Xu, J.; Li, H. Recent Water-Level Fluctuations, Future Trends and Their Eco-Environmental Impacts on Lake Qinghai. Journal of Environmental Management 2023, 333, 117461. [Google Scholar] [CrossRef]
- Zhang, Y.; Zhao, L.; Xie, C.; Wu, T.; Wu, X.; Yang, G.; Yang, S.; Wang, W.; Pang, Q.; Liu, G.; et al. Permafrost Characteristics and Potential Influencing Factors in the Lake Regions of Hoh Xil, Qinghai-Tibet Plateau. Geoderma 2023, 437, 116572. [Google Scholar] [CrossRef]
- Cong, L.; Wang, Y.; Zhang, X.; Chen, T.; Gao, D.; An, F. Radiocarbon and Luminescence Dating of Lacustrine Sediments in Zhari Namco, Southern Tibetan Plateau. Frontiers in Earth Science 2021, 9, 640172. [Google Scholar] [CrossRef]
- Lei, Y.; Yao, T.; Sheng, Y.; Yang, K.; Yang, W.; Li, S.; Zhou, J.; Jiang, Y.; Yu, Y. Unprecedented Lake Expansion in 2017–2018 on the Tibetan Plateau: Processes and Environmental Impacts. Journal of Hydrology 2023, 619, 129333. [Google Scholar] [CrossRef]
- Schwatke, C.; Dettmering, D.; Bosch, W.; Seitz, F. DAHITI–an Innovative Approach for Estimating Water Level Time Series over Inland Waters Using Multi-Mission Satellite Altimetry. Hydrology and Earth System Sciences 2015, 19, 4345–4364. [Google Scholar] [CrossRef]
- Yue, H.; Liu, Y.; Wei, J. Dynamic Change and Spatial Analysis of Great Lakes in China Based on Hydroweb and Landsat Data. Arabian Journal of Geosciences 2021, 14, 149. [Google Scholar] [CrossRef]
- Chelton, D.; Ries, J.; Haines, B.; Fu, L.; Callahan, P. Satellite Altimetry and Earth Sciences. (L.-L. Fu & A. Cazenave, Eds.). Academic Press, International Geophysics series 2001, 69, 1–1131. [Google Scholar]
- Fu, L.-L.; Cazenave, A. Satellite Altimetry and Earth Sciences: A Handbook of Techniques and Applications; Elsevier, 2000; ISBN 0-08-051658-0.
- Arabsahebi, R.; Voosoghi, B.; Tourian, M.J. The Inflection-Point Retracking Algorithm: Improved Jason-2 Sea Surface Heights in the Strait of Hormuz. Marine Geodesy 2018, 41, 331–352. [Google Scholar] [CrossRef]
- Fernandes, M.J.; Lázaro, C. Independent Assessment of Sentinel-3A Wet Tropospheric Correction over the Open and Coastal Ocean. Remote Sensing 2018, 10, 484. [Google Scholar] [CrossRef]
- Davis, C.H. The Effect of Sub-Surface Volume Scattering on the Accuracy of Ice-Sheet Altimeter Retracking Algorithms.; IEEE, 1993; pp. 1053–1057.
- Villadsen, H.; Deng, X.; Andersen, O.B.; Stenseng, L.; Nielsen, K.; Knudsen, P. Improved Inland Water Levels from SAR Altimetry Using Novel Empirical and Physical Retrackers. Journal of Hydrology 2016, 537, 234–247. [Google Scholar] [CrossRef]
- Roohi, S. Performance Evaluation of Different Satellite Radar Altimetry Missions for Monitoring Inland Water Bodies. 2017.
- Roohi, S. Capability of Pulse-Limited Satellite Radar Altimetry to Monitor Inland Water Bodies. 2015.
- Chen, J.; Duan, Z. Monitoring Spatial-Temporal Variations of Lake Level in Western China Using ICESat-1 and CryoSat-2 Satellite Altimetry. Remote Sensing 2022, 14, 5709. [Google Scholar] [CrossRef]
- Duan, Z.; Bastiaanssen, W. Estimating Water Volume Variations in Lakes and Reservoirs from Four Operational Satellite Altimetry Databases and Satellite Imagery Data. Remote Sensing of Environment 2013, 134, 403–416. [Google Scholar] [CrossRef]
- Song, C.; Ye, Q.; Sheng, Y.; Gong, T. Combined ICESat and CryoSat-2 Altimetry for Accessing Water Level Dynamics of Tibetan Lakes over 2003–2014. Water 2015, 7, 4685–4700. [Google Scholar] [CrossRef]
- Busker, T.; de Roo, A.; Gelati, E.; Schwatke, C.; Adamovic, M.; Bisselink, B.; Pekel, J.-F.; Cottam, A. A Global Lake and Reservoir Volume Analysis Using a Surface Water Dataset and Satellite Altimetry. Hydrology and Earth System Sciences 2019, 23, 669–690. [Google Scholar] [CrossRef]
- Liu, Z.; Yao, Z.; Wang, R. Evaluation and Validation of CryoSat-2-Derived Water Levels Using in Situ Lake Data from China. Remote Sensing 2019, 11, 899. [Google Scholar] [CrossRef]
- Sun, M.; Guo, J.; Yuan, J.; Liu, X.; Wang, H.; Li, C. Detecting Lake Level Change from 1992 to 2019 of Zhari Namco in Tibet Using Altimetry Data of TOPEX/Poseidon and Jason-1/2/3 Missions. Frontiers in Earth Science 2021, 9, 640553. [Google Scholar] [CrossRef]
- Chen, J.; Duan, Z. Monitoring Spatial-Temporal Variations of Lake Level in Western China Using ICESat-1 and CryoSat-2 Satellite Altimetry. Remote Sensing 2022, 14. [Google Scholar] [CrossRef]
- Breiman, L. Random Forests. Machine learning 2001, 45, 5–32. [Google Scholar] [CrossRef]
- Lundberg, S. A Unified Approach to Interpreting Model Predictions. arXiv preprint arXiv:, arXiv:1705.07874 2017.
- Iglewicz, B.; Hoaglin, D.C. Volume 16: How to Detect and Handle Outliers; Quality Press, 1993; ISBN 0-87389-260-7.
- Pedregosa, F.; Varoquaux, G.; Gramfort, A.; Michel, V.; Thirion, B.; Grisel, O.; Blondel, M.; Prettenhofer, P.; Weiss, R.; Dubourg, V. Scikit-Learn: Machine Learning in Python. the Journal of machine Learning research 2011, 12, 2825–2830. [Google Scholar]
- Wingham, D.; Rapley, C.; Griffiths, H. New Techniques in Satellite Altimeter Tracking Systems.; 1986; Vol. 86, pp. 1339–1344.
- Frappart, F.; Calmant, S.; Cauhopé, M.; Seyler, F.; Cazenave, A. Preliminary Results of ENVISAT RA-2-Derived Water Levels Validation over the Amazon Basin. Remote Sensing of Environment 2006, 100, 252–264. [Google Scholar] [CrossRef]
- Gao, Q.; Makhoul, E.; Escorihuela, M.J.; Zribi, M.; Quintana Seguí, P.; García, P.; Roca, M. Analysis of Retrackers’ Performances and Water Level Retrieval over the Ebro River Basin Using Sentinel-3. Remote Sensing 2019, 11, 718. [Google Scholar] [CrossRef]
- Troitskaya, Y.I.; Rybushkina, G.; Soustova, I.; Balandina, G.; Lebedev, S.; Kostyanoi, A.; Panyutin, A.; Filina, L. Satellite Altimetry of Inland Water Bodies. Water Resources 2012, 39, 184–199. [Google Scholar] [CrossRef]
- Jiang, L.; Nielsen, K.; Andersen, O.B.; Bauer-Gottwein, P. Monitoring Recent Lake Level Variations on the Tibetan Plateau Using CryoSat-2 SARIn Mode Data. Journal of Hydrology 2017, 544, 109–124. [Google Scholar] [CrossRef]
- Fang, Y.; Cheng, W.; Zhang, Y.; Wang, N.; Zhao, S.; Zhou, C.; Chen, X.; Bao, A. Changes in Inland Lakes on the Tibetan Plateau over the Past 40 Years. Journal of Geographical Sciences 2016, 26, 415–438. [Google Scholar] [CrossRef]
- Fu, C.; Wu, H.; Zhu, Z.; Song, C.; Xue, B.; Wu, H.; Ji, Z.; Dong, L. Exploring the Potential Factors on the Striking Water Level Variation of the Two Largest Semi-Arid-Region Lakes in Northeastern Asia. Catena 2021, 198, 105037. [Google Scholar] [CrossRef]
- Zhu, L.; Xie, M.; Wu, Y. Quantitative Analysis of Lake Area Variations and the Influence Factors from 1971 to 2004 in the Nam Co Basin of the Tibetan Plateau. Chinese Science Bulletin 2010, 55, 1294–1303. [Google Scholar] [CrossRef]
- Liping, Z.; Guoqing, Z.; Ruimin, Y.; Chong, L.; Kun, Y.; Baojin, Q.; Boping, H. Lake Variations on Tibetan Plateau of Recent 40 Years and Future Changing Tendency. Bulletin of Chinese Academy of Sciences (Chinese Version) 2019, 34, 1254–1263. [Google Scholar]
- Ocean, Cryosphere and Sea Level Change. Climate Change 2021 – The Physical Science Basis: Working Group I Contribution to the Sixth Assessment Report of the Intergovernmental Panel on Climate Change; Intergovernmental Panel on Climate Change, (IPCC), Ed.; Cambridge University Press: Cambridge, 2023; ISBN 978-1-00-915788-9. [Google Scholar]
- Li, X.; Long, D.; Scanlon, B.R.; Mann, M.E.; Li, X.; Tian, F.; Sun, Z.; Wang, G. Climate Change Threatens Terrestrial Water Storage over the Tibetan Plateau. Nature Climate Change 2022, 12, 801–807. [Google Scholar] [CrossRef]
- Zhang, G.; Yao, T.; Xie, H.; Yang, K.; Zhu, L.; Shum, C.K.; Bolch, T.; Yi, S.; Allen, S.; Jiang, L.; et al. Response of Tibetan Plateau Lakes to Climate Change: Trends, Patterns, and Mechanisms. Earth-Science Reviews 2020, 208, 103269. [Google Scholar] [CrossRef]
- King, O.; Bhattacharya, A.; Bolch, T. The Presence and Influence of Glacier Surging around the Geladandong Ice Caps, North East Tibetan Plateau. Advances in Climate Change Research 2021, 12, 299–312. [Google Scholar] [CrossRef]
- Zhu, F.; Zhu, M.; Yang, W.; Wang, Z.; Guo, Y.; Yao, T. Drivers of the Extreme Early Spring Glacier Melt of 2022 on the Central Tibetan Plateau. Earth and Space Science 2024, 11, e2023EA003297. [Google Scholar] [CrossRef]
- Altés, A.; Cornara, F.; Renard, M. Next Generation Gravity Mission (NGGM): Mission Analysis Report; Tech. rep., NGGM-DEM-TEC-TNO-01, Deimos, 2010.
- Peng, Y.; Duan, A.; Zhang, C.; Tang, B.; Zhao, X. Evaluation of the Surface Air Temperature over the Tibetan Plateau among Different Reanalysis Datasets. Frontiers in Environmental Science 2023, 11, 1152129. [Google Scholar] [CrossRef]
- Hu, X.; Yuan, W. Evaluation of ERA5 Precipitation over the Eastern Periphery of the Tibetan Plateau from the Perspective of Regional Rainfall Events. International Journal of Climatology 2021, 41, 2625–2637. [Google Scholar] [CrossRef]
- Lavers, D.A.; Simmons, A.; Vamborg, F.; Rodwell, M.J. An Evaluation of ERA5 Precipitation for Climate Monitoring. Quarterly Journal of the Royal Meteorological Society 2022, 148, 3152–3165. [Google Scholar] [CrossRef]
- Braun de Torrez, E.C.; Frock, C.F.; Boone IV, W.W.; Sovie, A.R.; McCleery, R.A. Seasick: Why Value Ecosystems Severely Threatened by Sea-Level Rise? Estuaries and Coasts 2021, 44, 899–910. [Google Scholar] [CrossRef]
Figure 1.
Study Area and Lakes Analyzed for Water Level Changes in the TP.
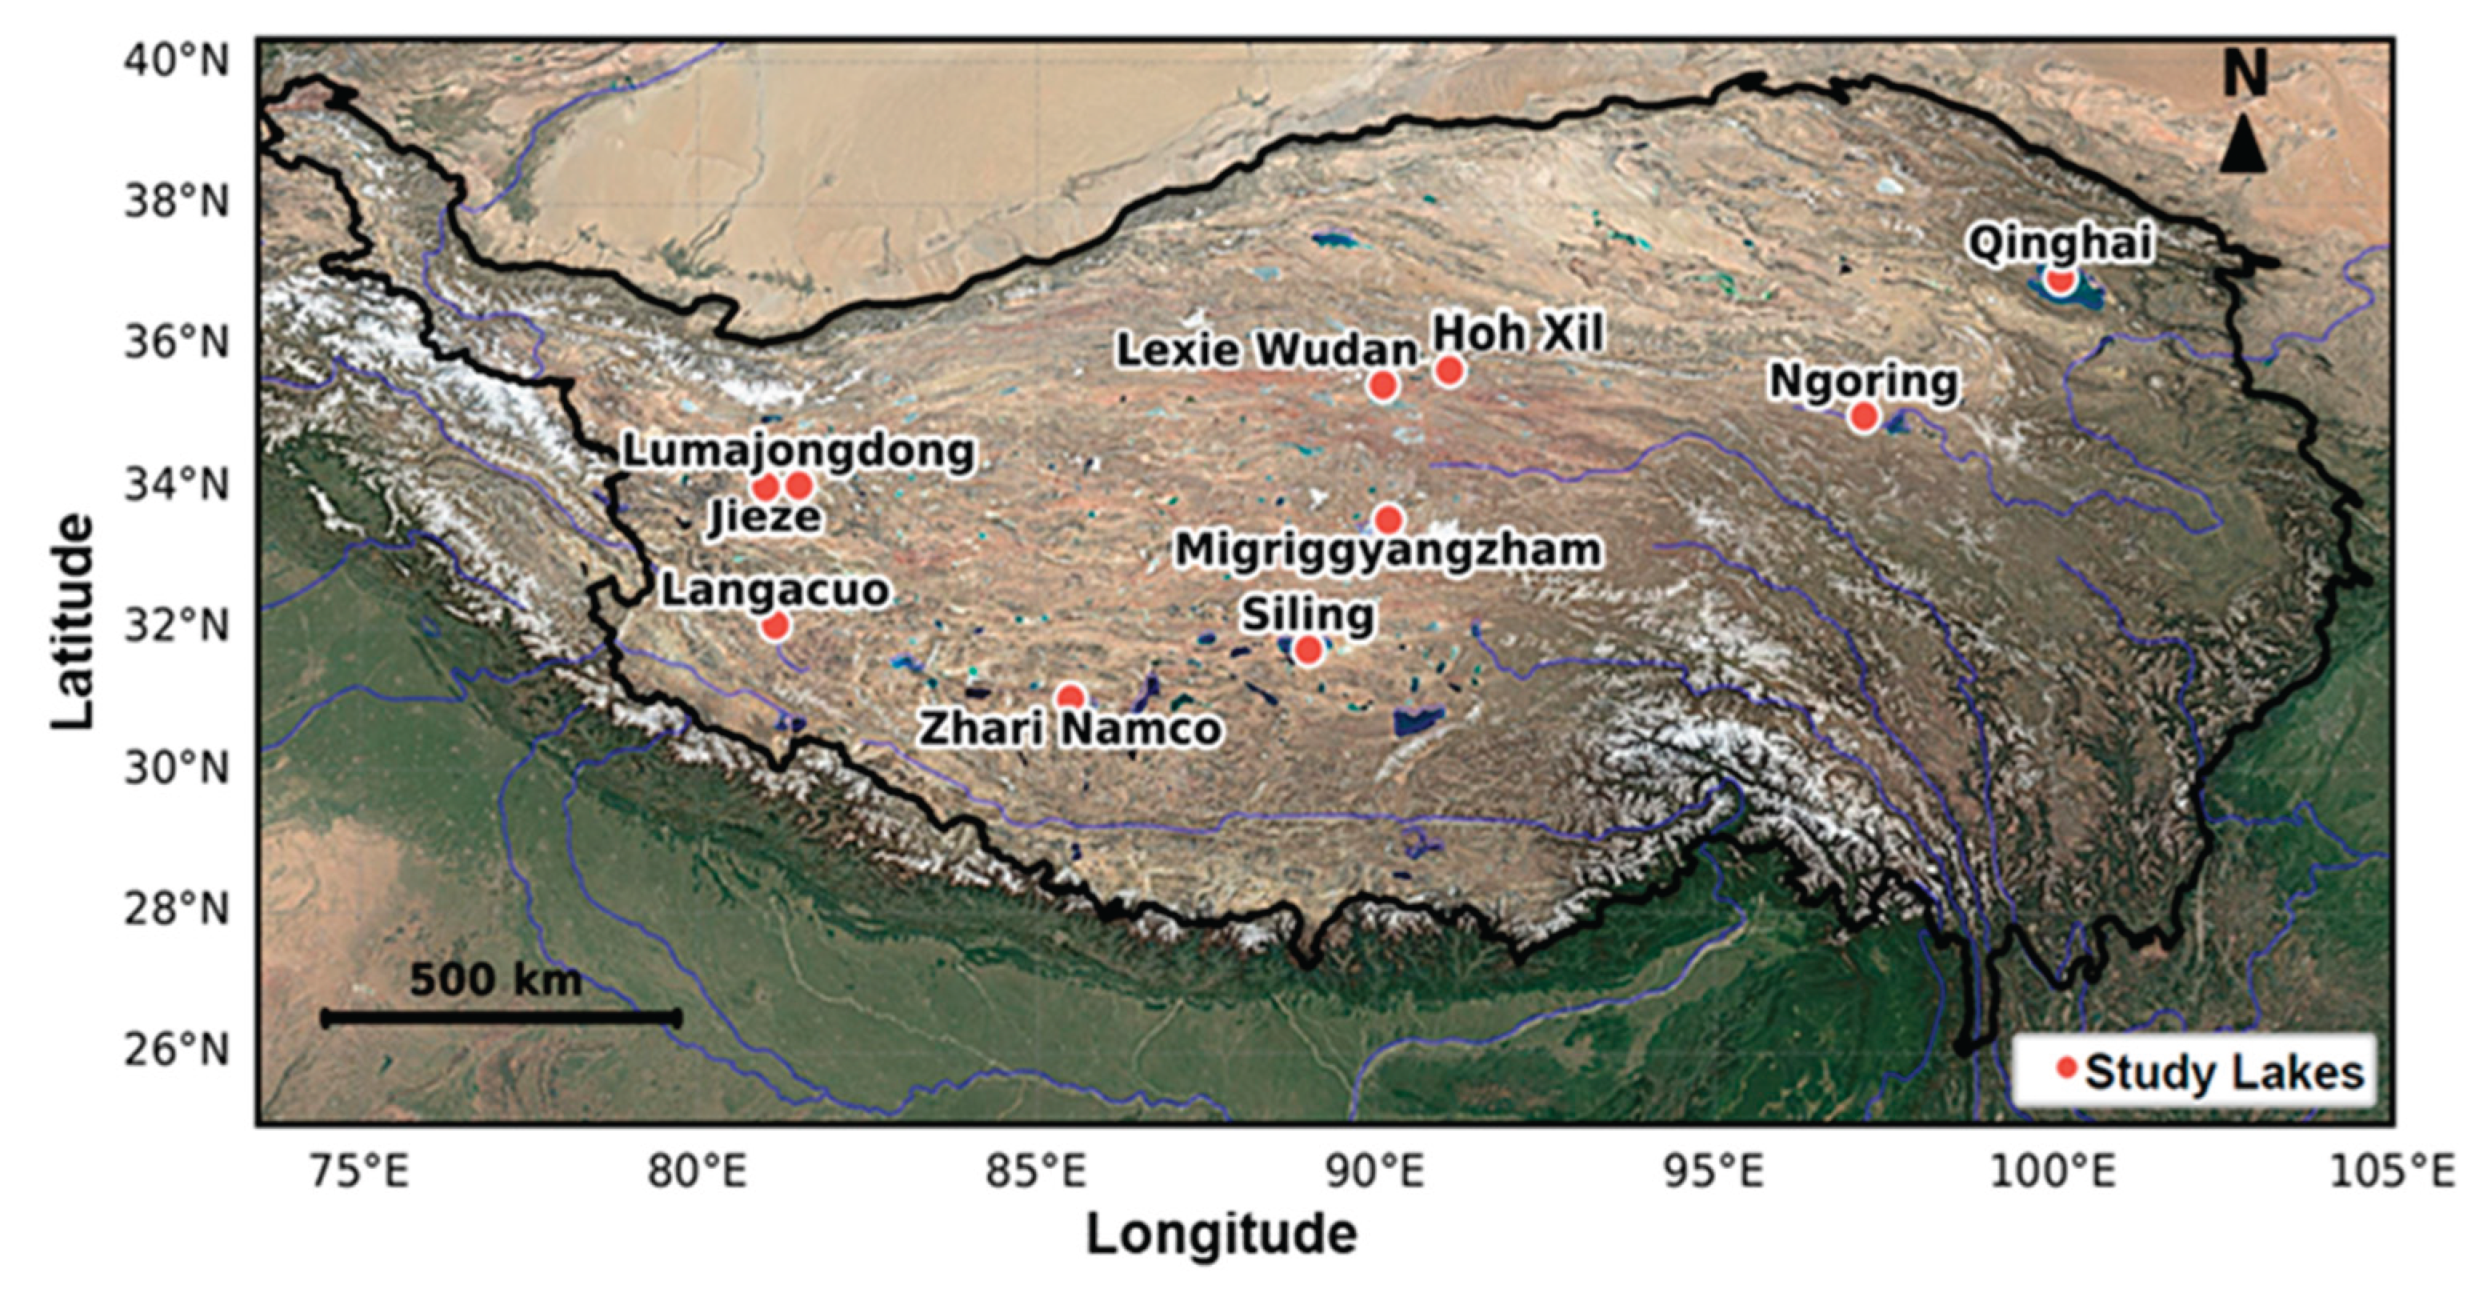
Figure 2.
Sentinel-3A ground tracks and the lakes location.
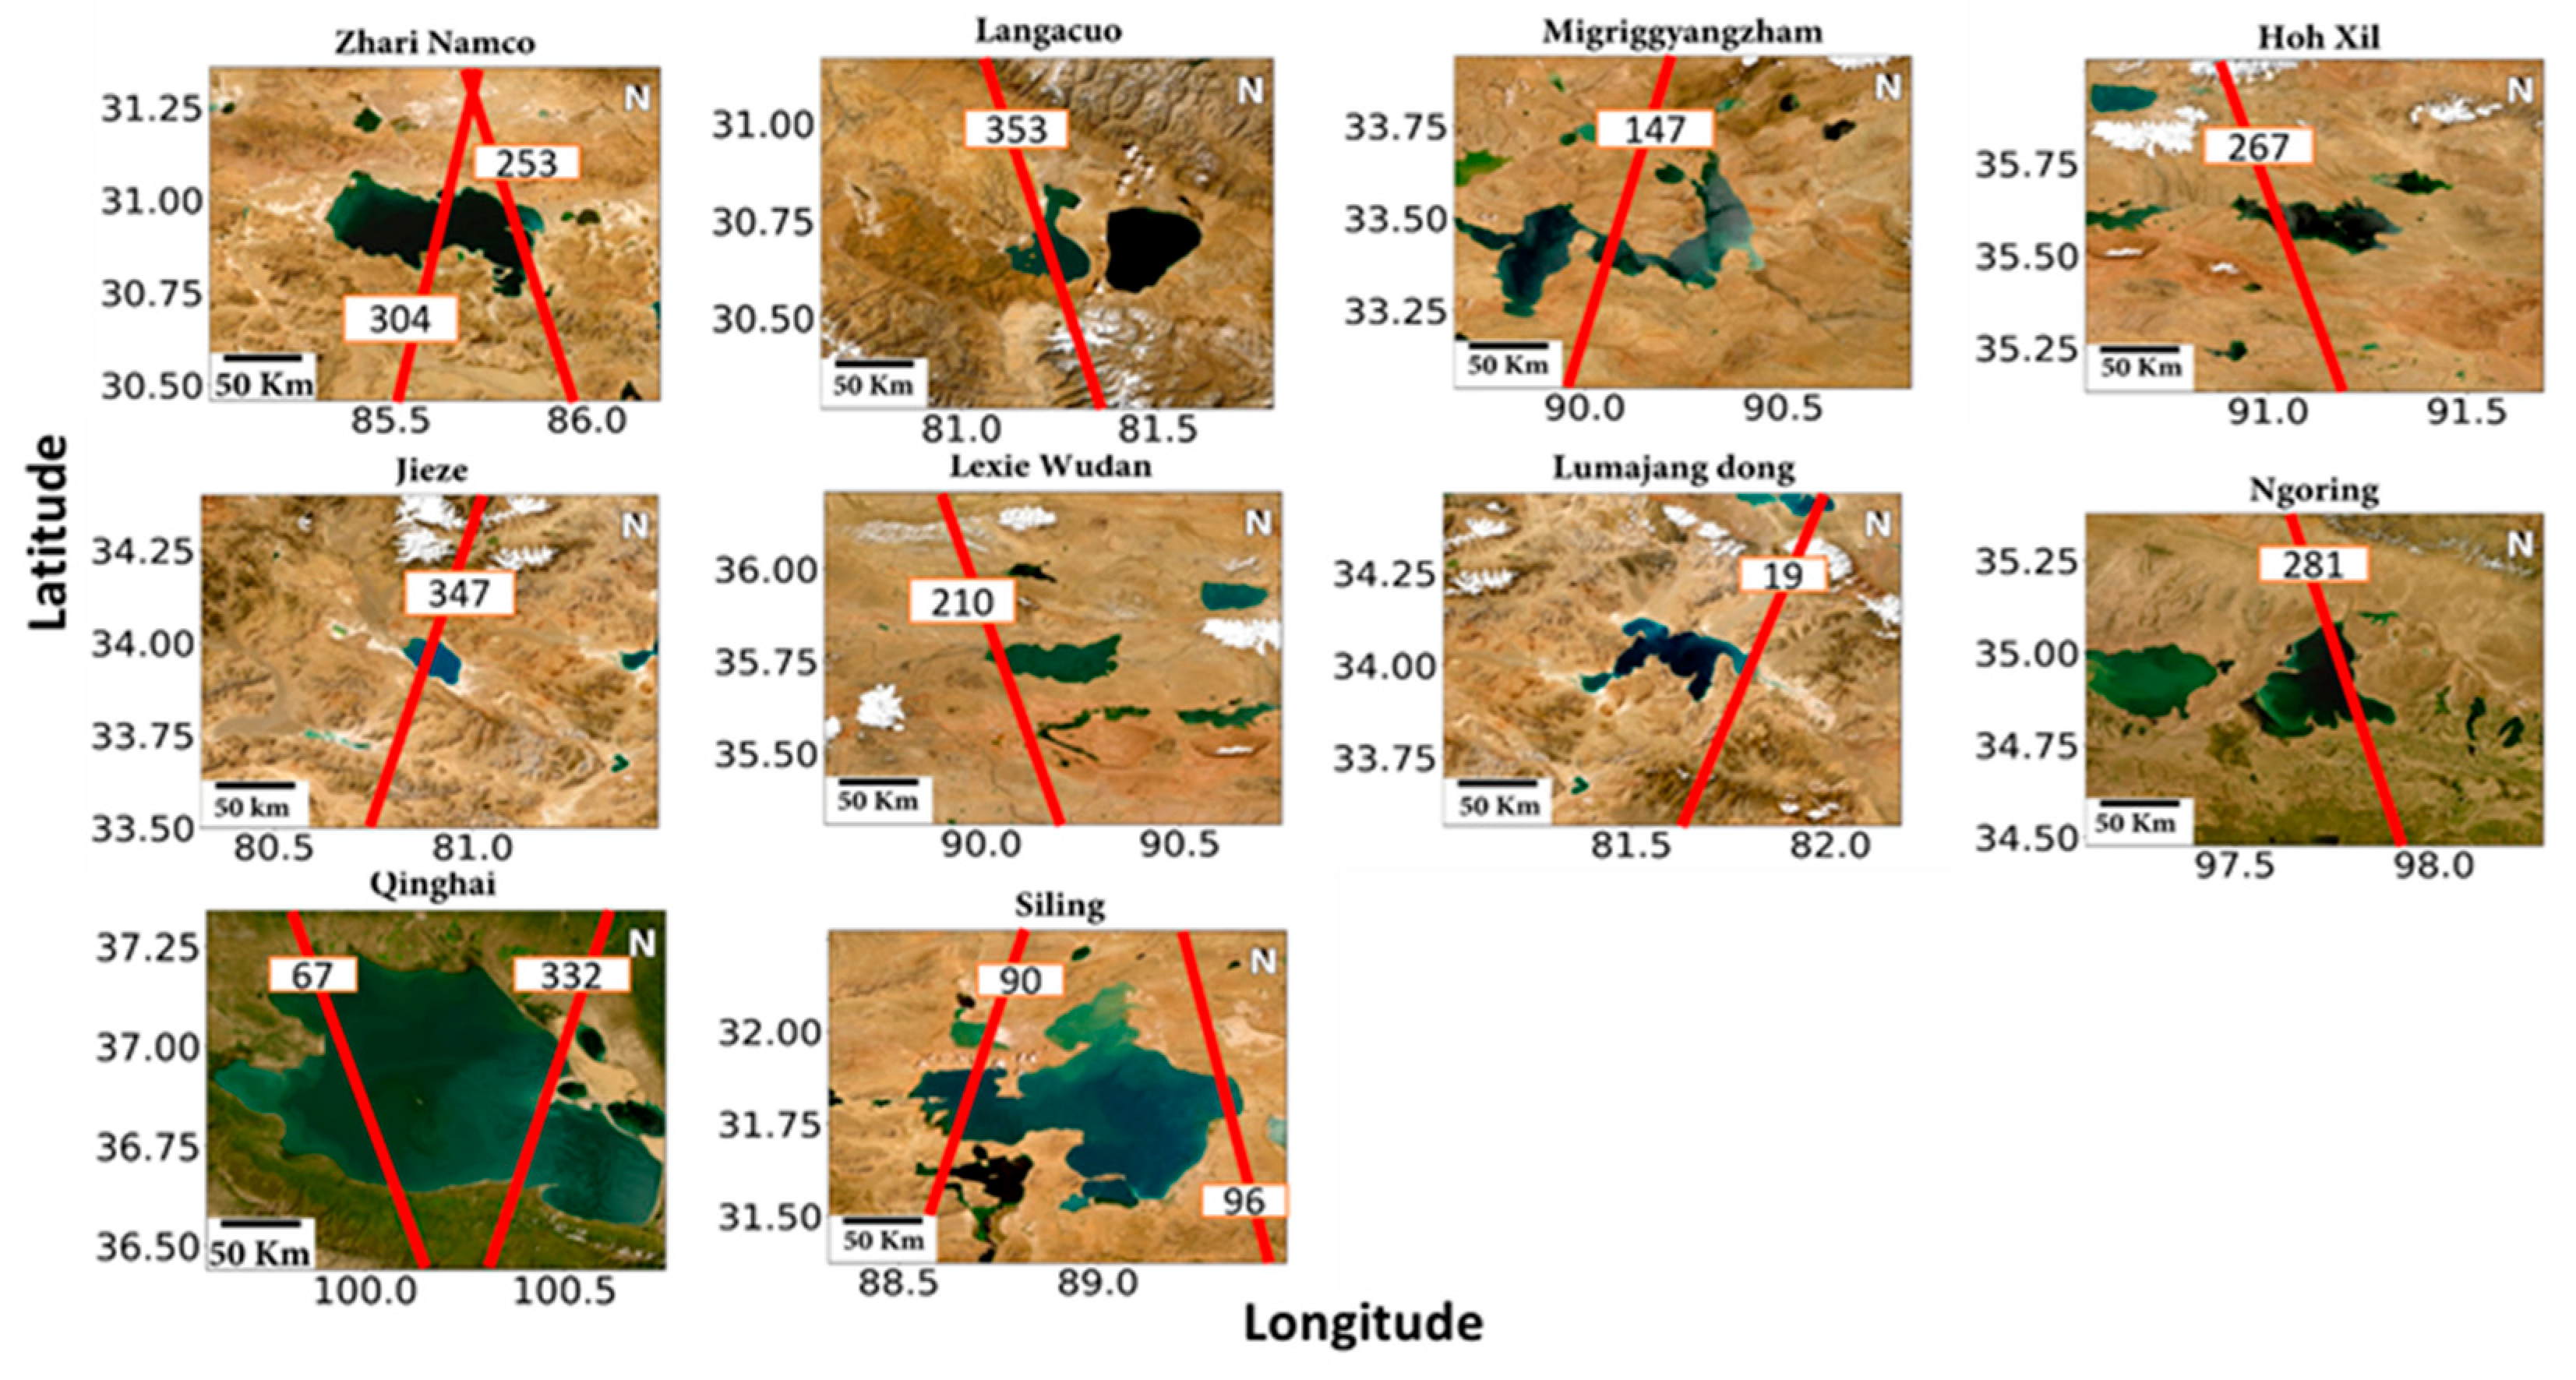
Figure 3.
Dynamics of lakes’ water level changes in the Dynamics of lake water level changes in the TP (2016–2024), with bars indicating trends (m yr⁻¹).
Figure 3.
Dynamics of lakes’ water level changes in the Dynamics of lake water level changes in the TP (2016–2024), with bars indicating trends (m yr⁻¹).
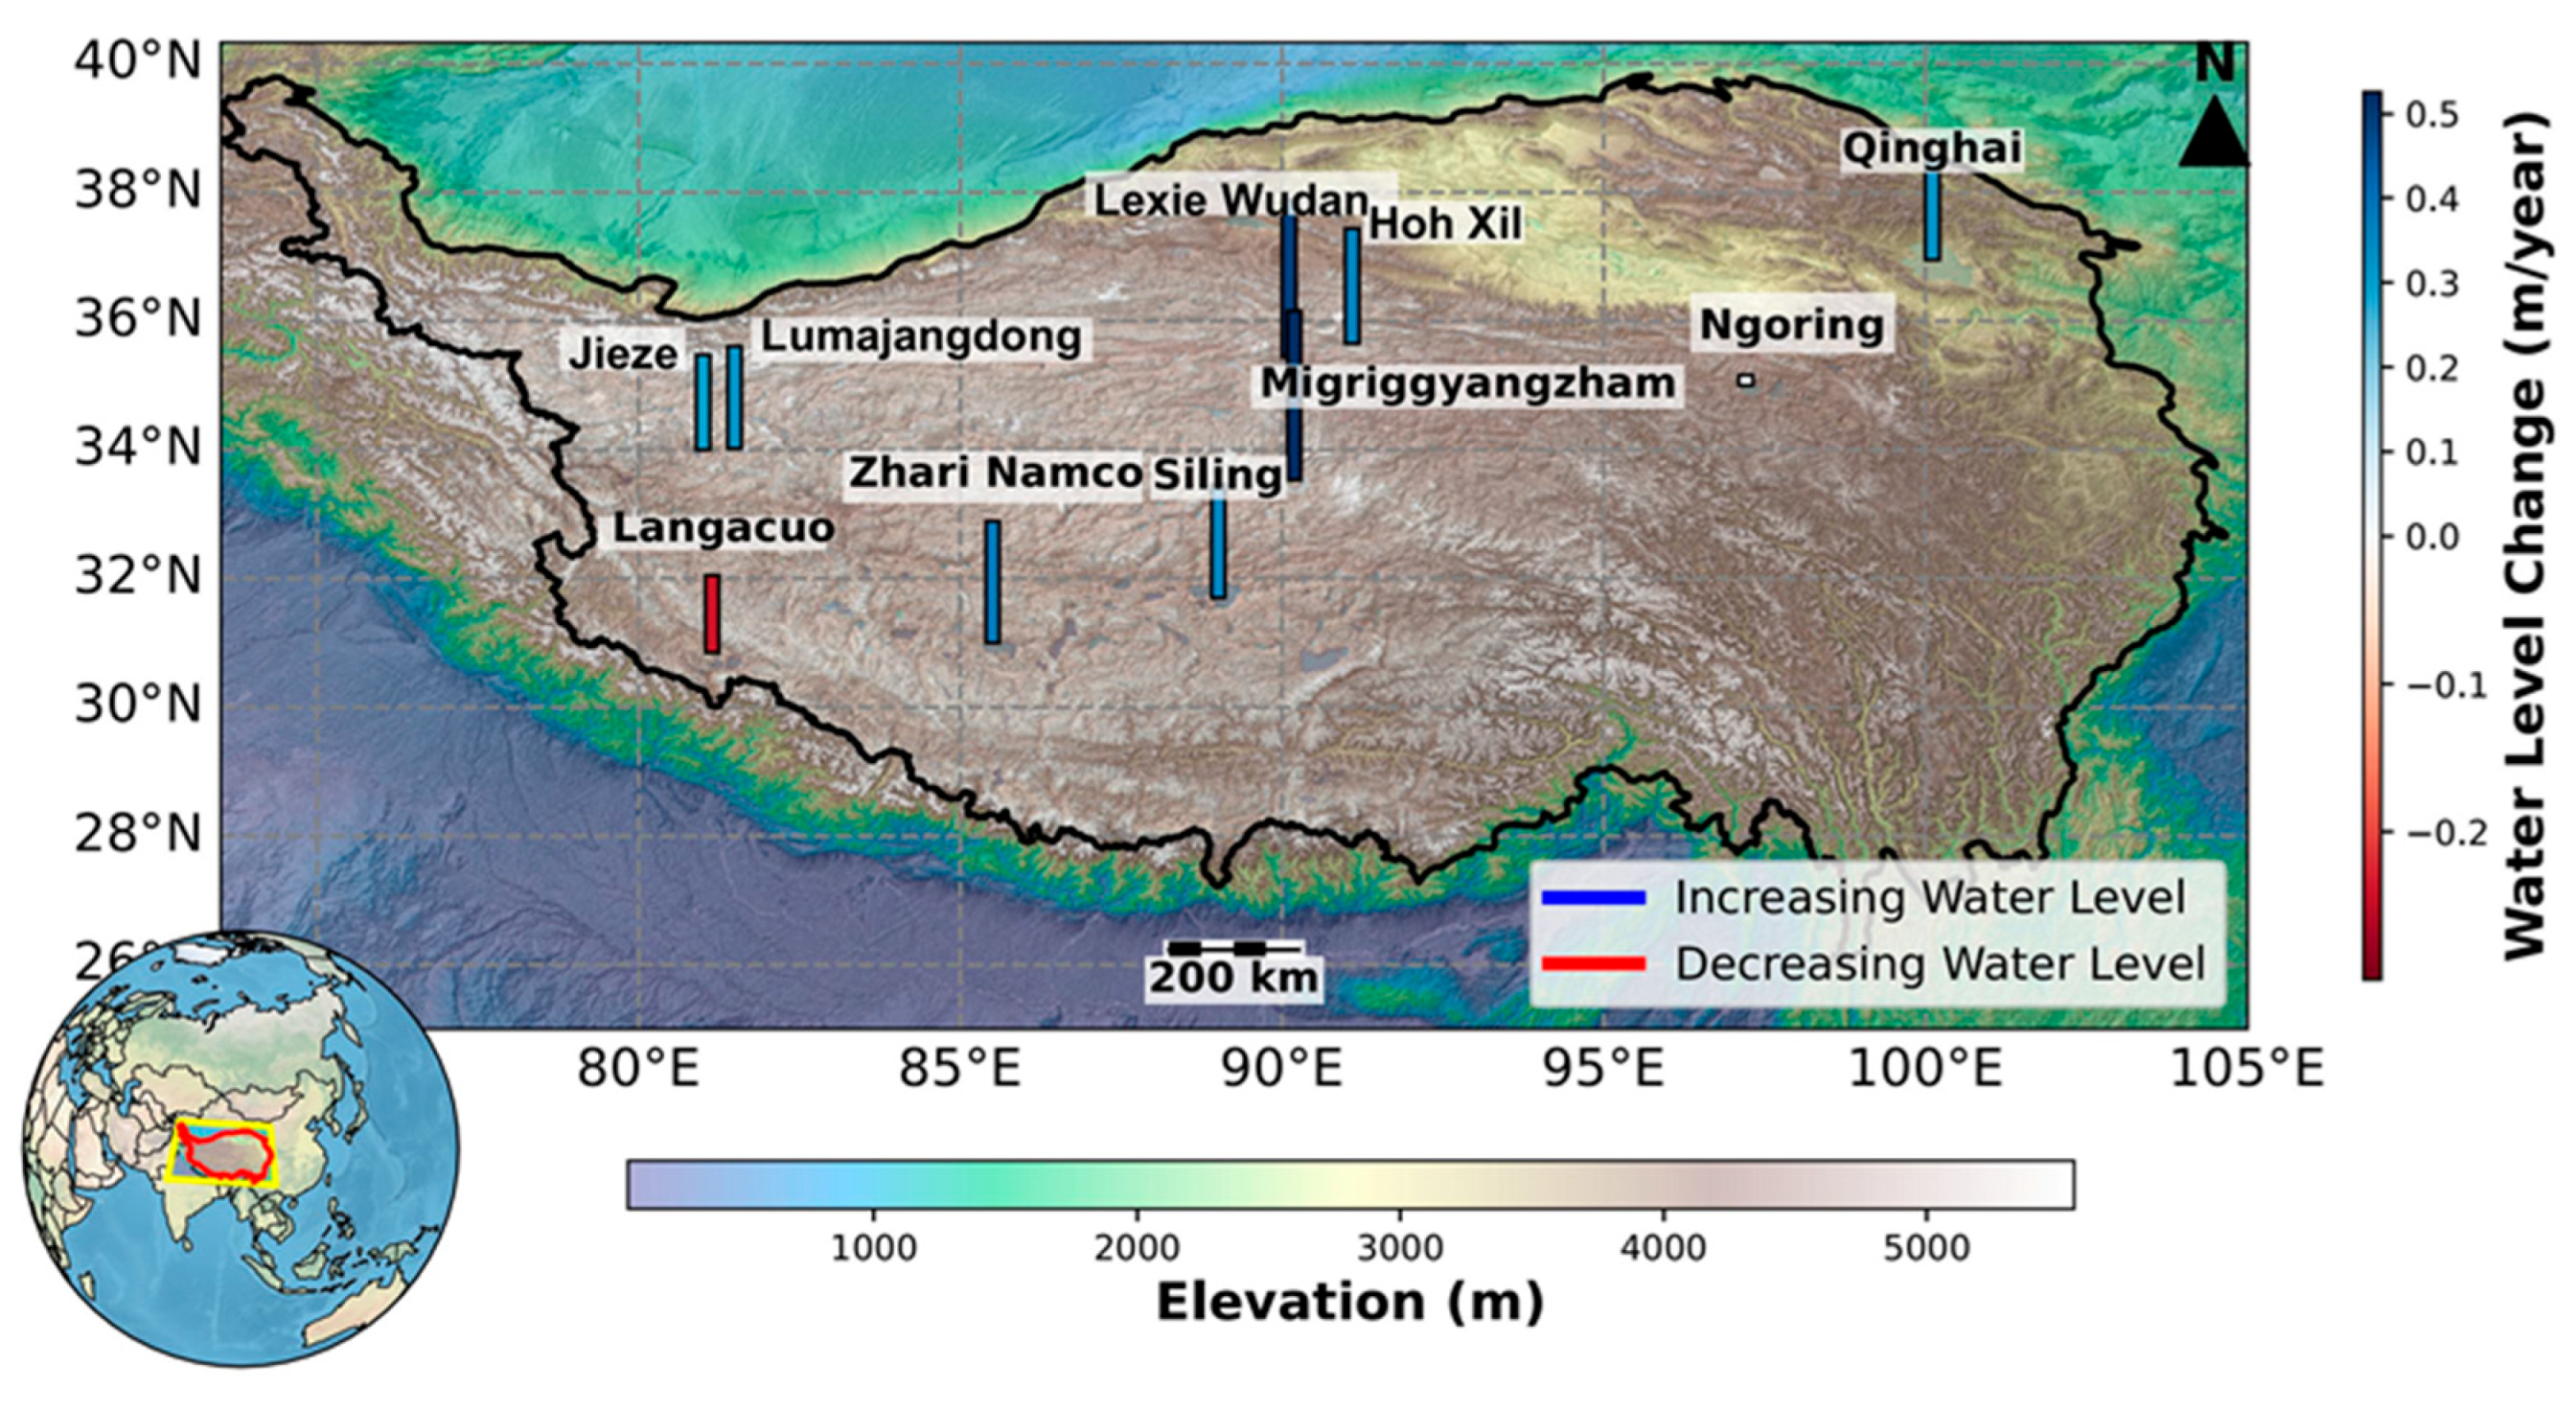
Figure 4.
Hydrological driver analysis for Qinghai Lake (A) and Ngoring Lake (B). Left: Feature importance rankings from RF regression, showing the relative contribution of each climate variable to lake level changes. Right: SHAP summary plots illustrating the directional impact of variables (red = higher values increase water levels; blue = lower values decrease them).
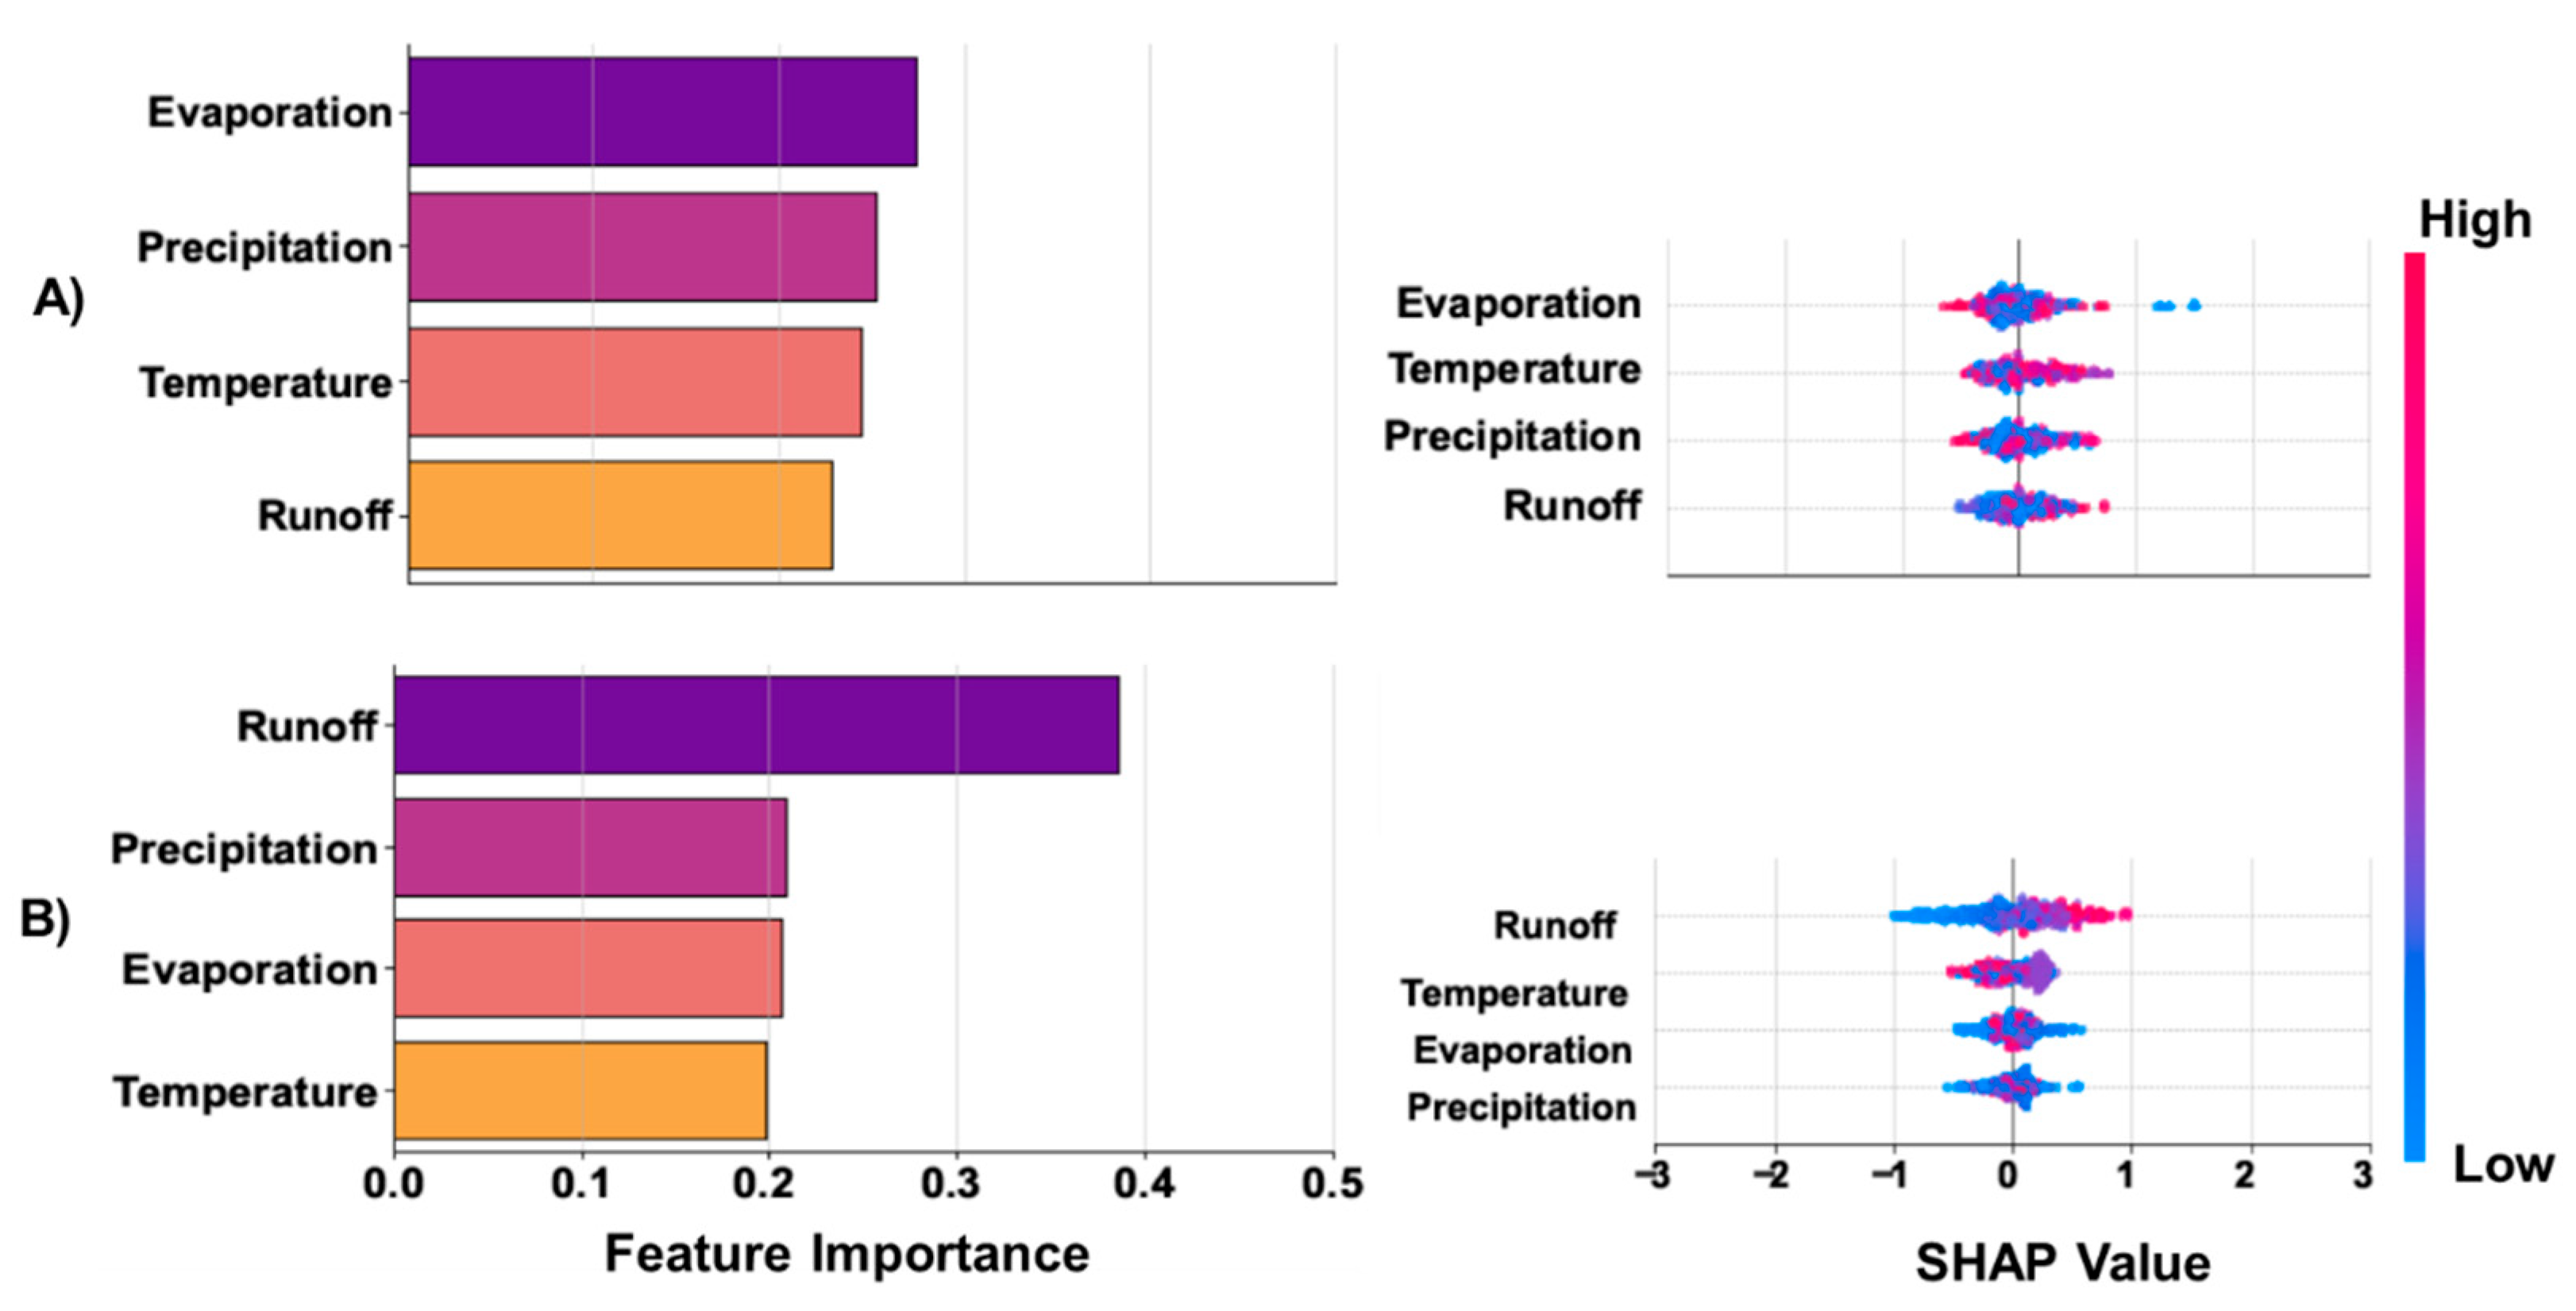
Figure 5.
Hydrological driver analysis for Lumajang Dong Lake (A) and Jieze Lake (B). Left: Feature importance rankings from RF regression, showing the relative contribution of each climate variable to lake level changes. Right: SHAP summary plots illustrating the directional impact of variables (red = higher values increase water levels; blue = lower values decrease them).
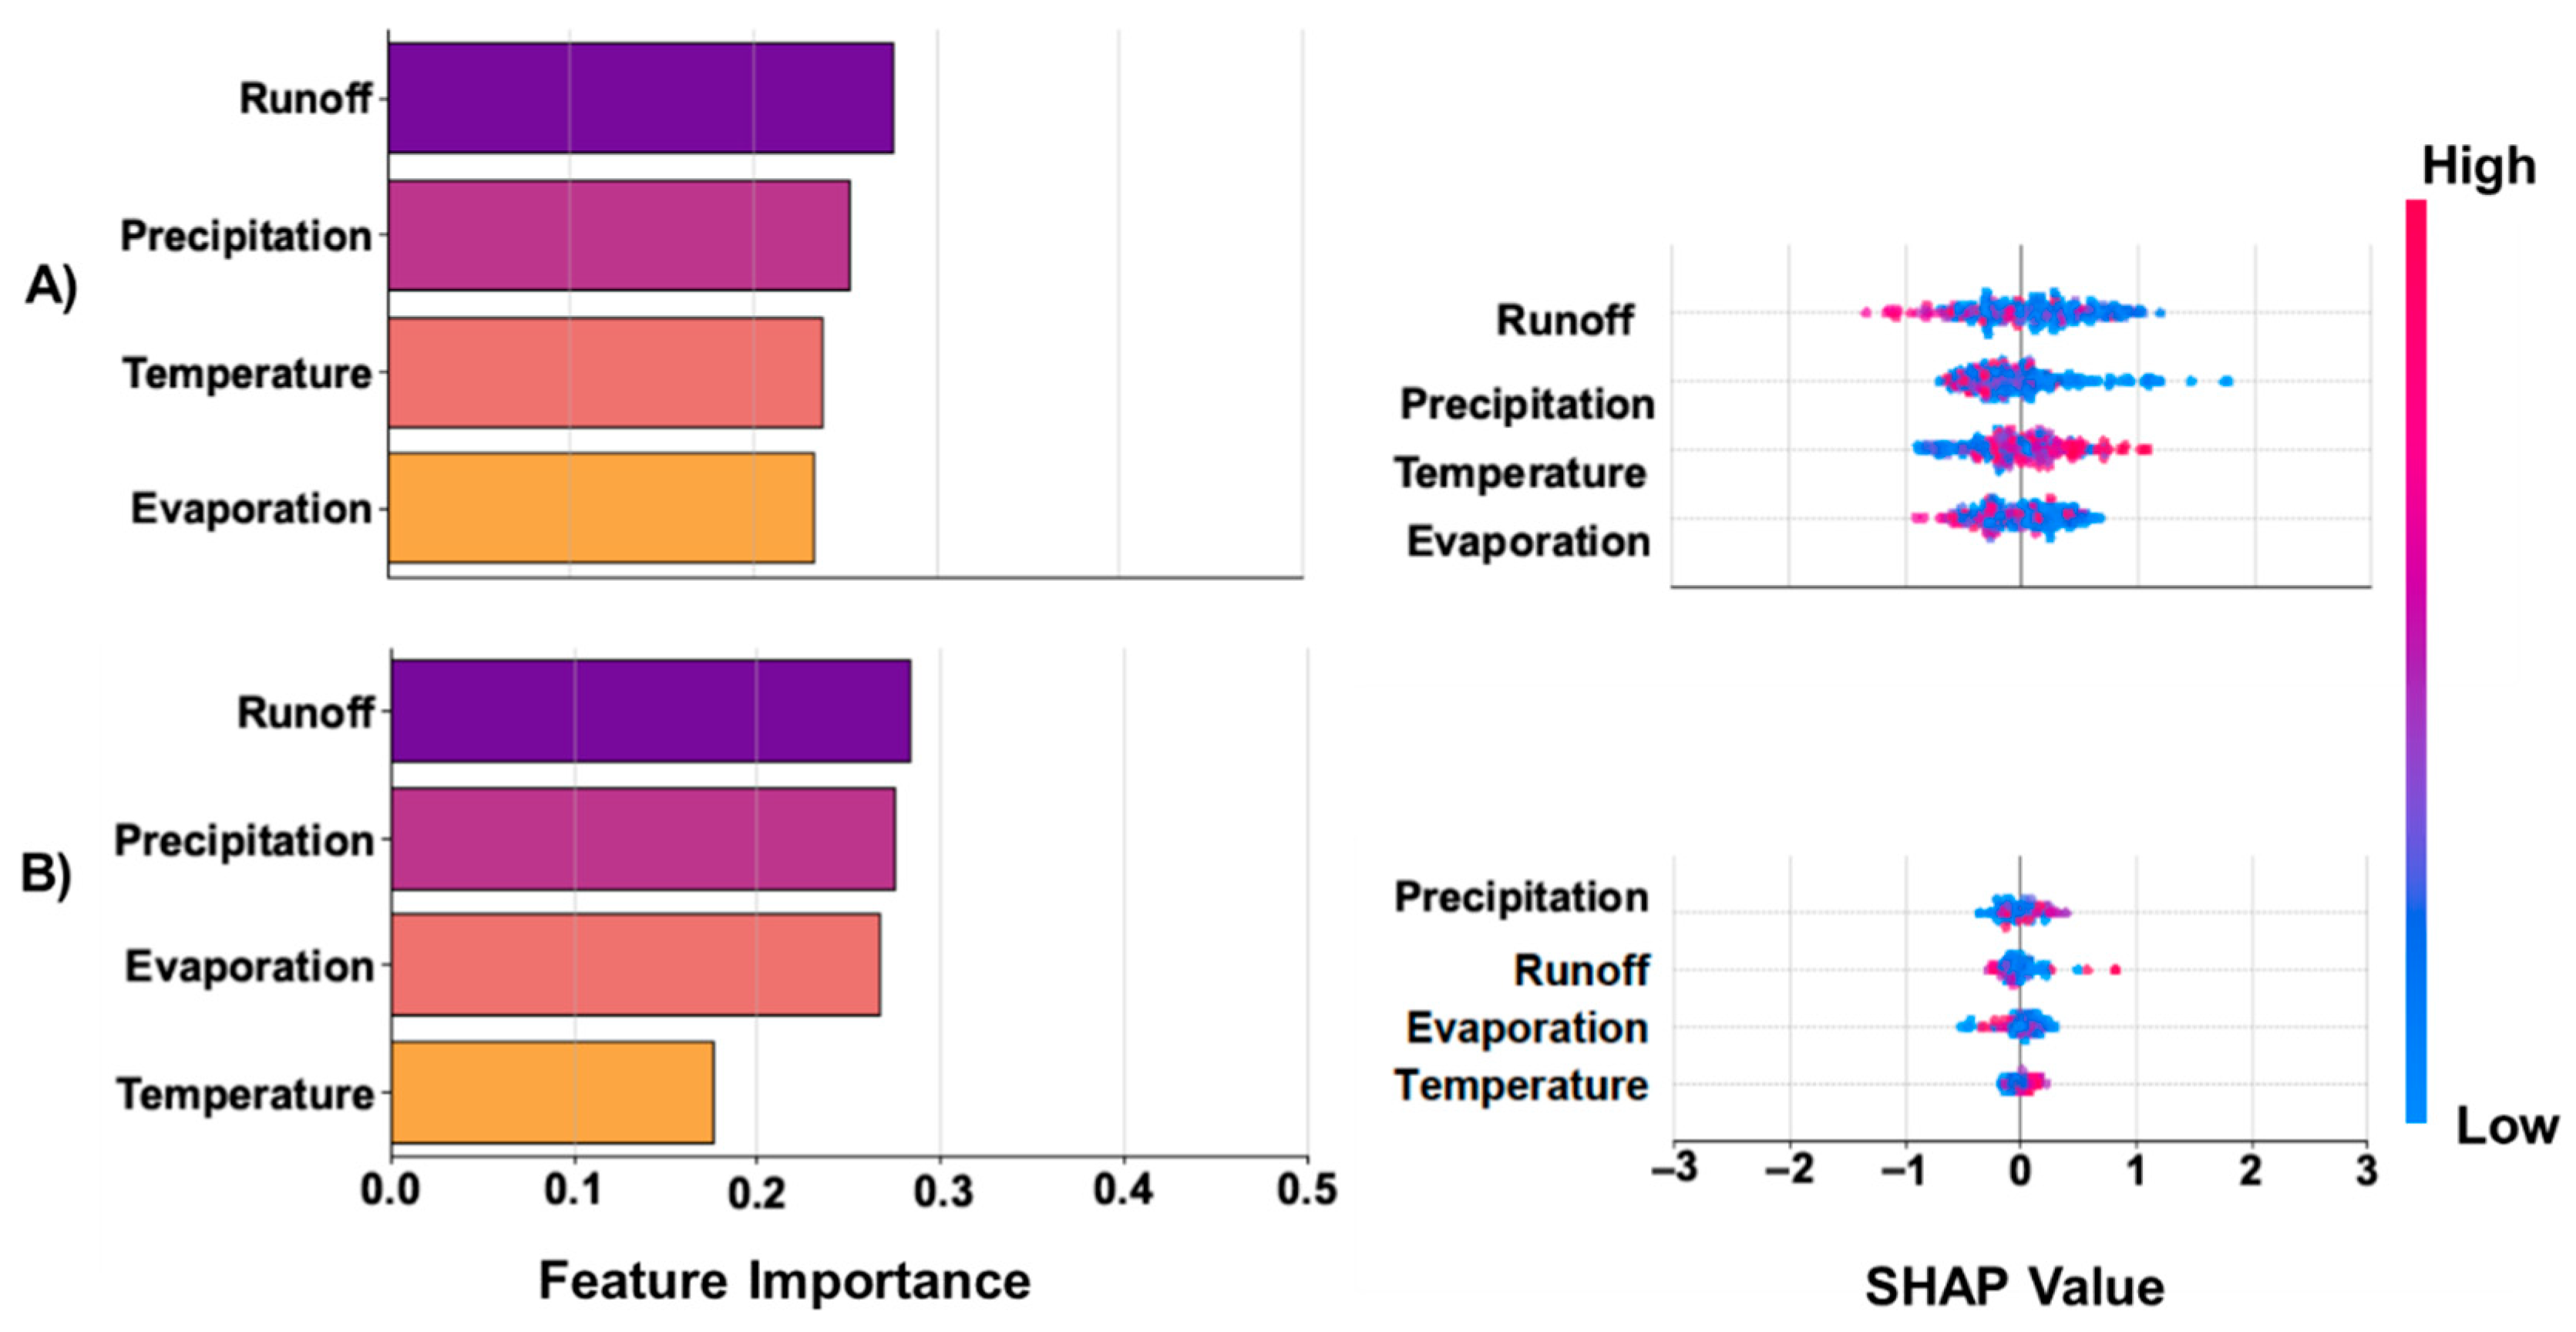
Figure 6.
Hydrological driver analysis for Zhari Namco (A), Siling (B), and Langacuo Lake (C). Left: Feature importance rankings from RF regression, showing the relative contribution of each climate variable to lake level changes. Right: SHAP summary plots illustrating the directional impact of variables (red = higher values increase water levels; blue = lower values decrease them).
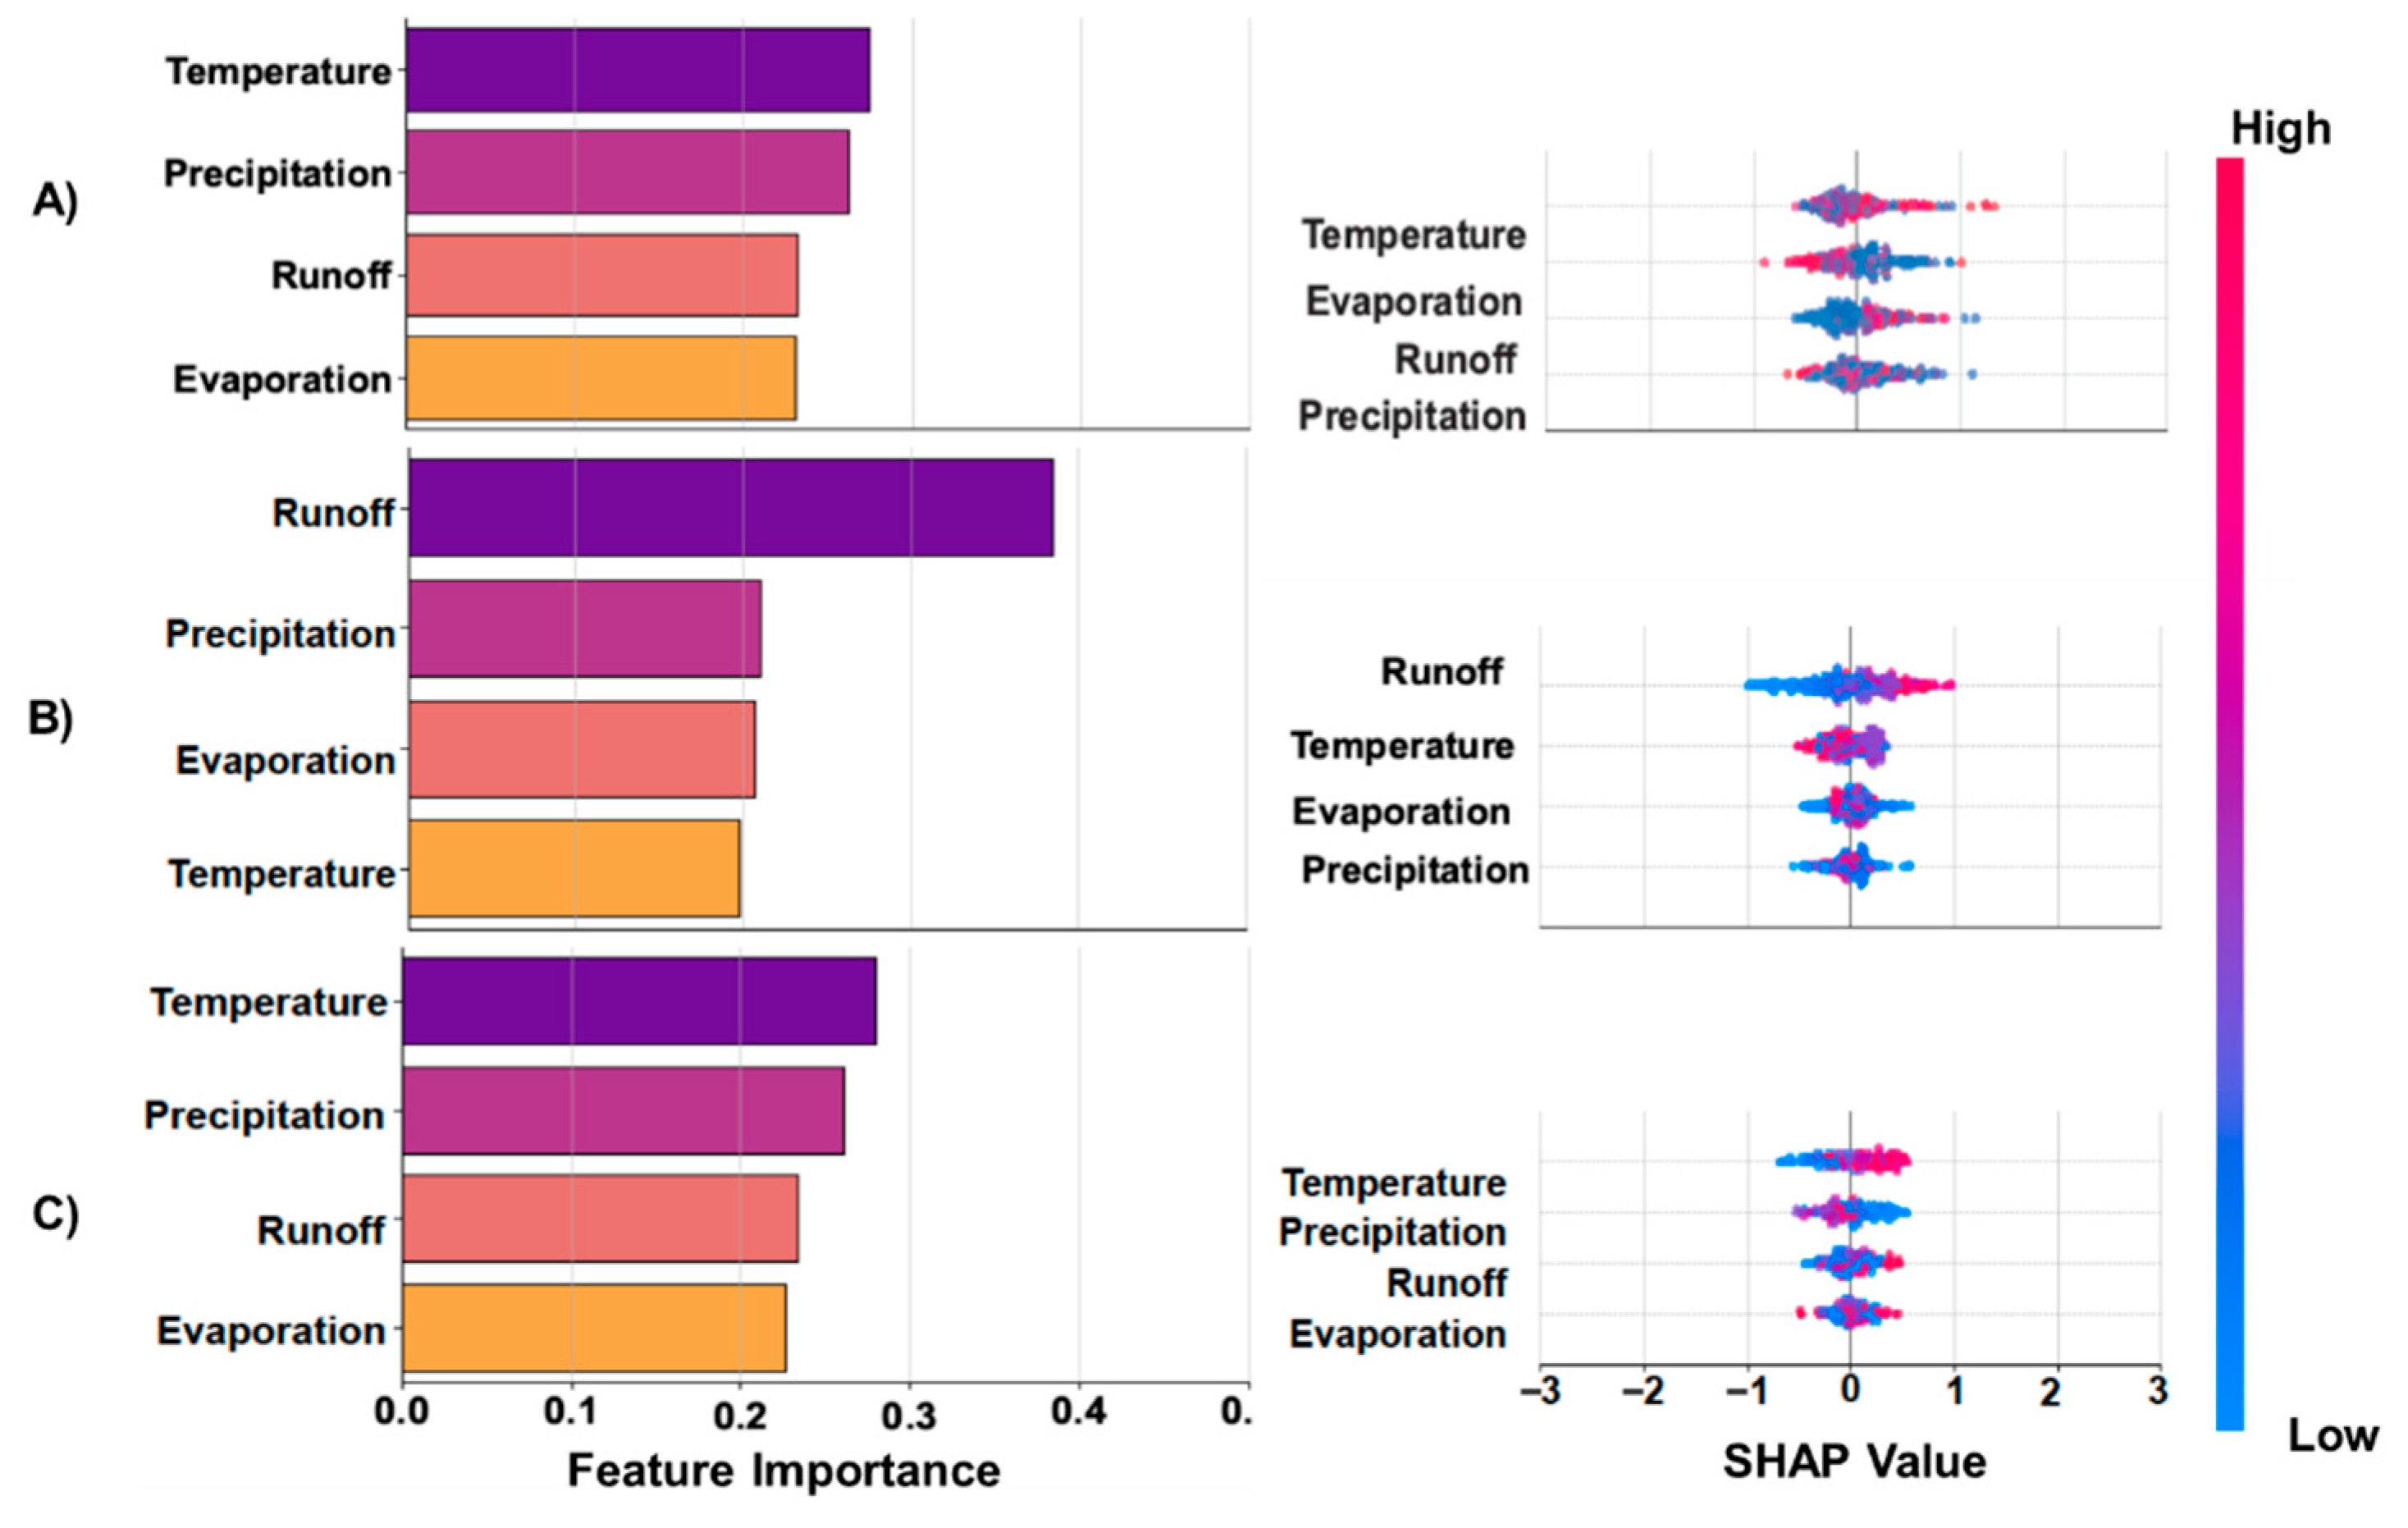
Figure 7.
Hydrological driver analysis for Lexie Wudan Lake (A) Hoh Xil Lake (B), and Migriggyangzham Lake (C). Left: Feature importance rankings from RF regression, showing the relative contribu-tion of each climate variable to lake level changes. Right: SHAP summary plots illustrating the directional impact of variables (red = higher values increase water levels; blue = lower values decrease them).
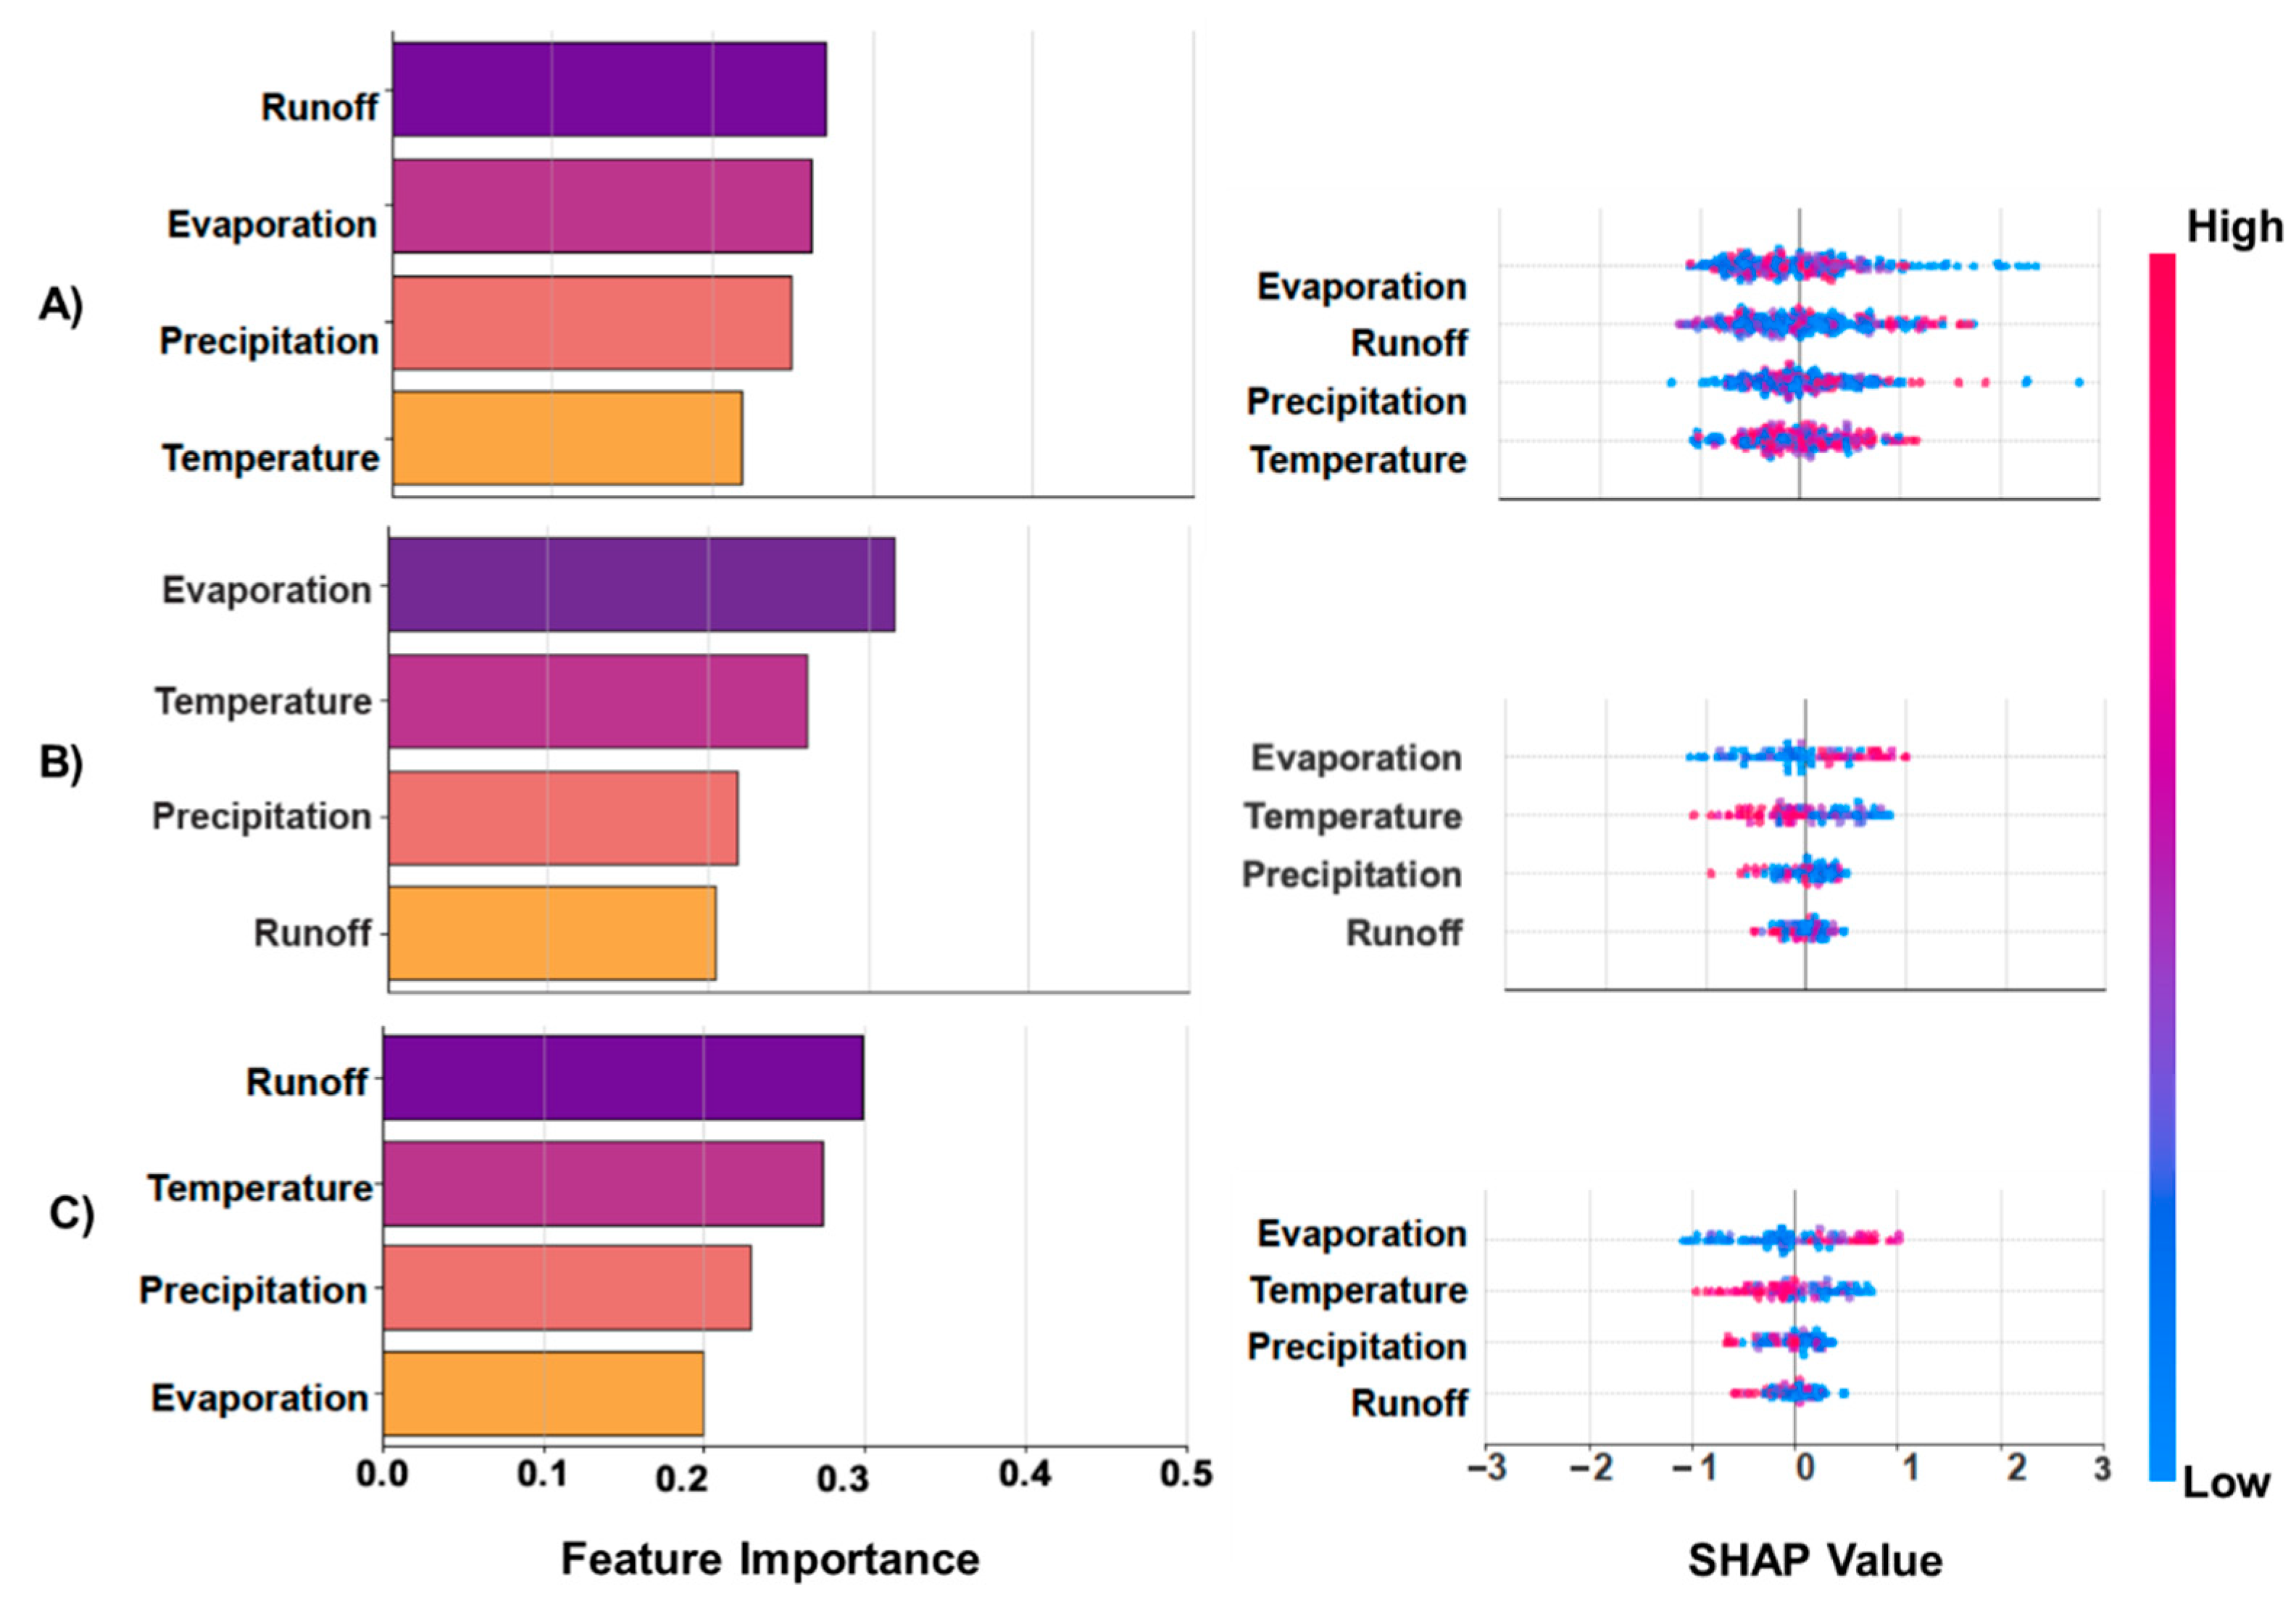

Table 1.
Evaluation of water level changes across 10 lakes (2016–2024), based on comparison with DAHITI reference data.
Table 1.
Evaluation of water level changes across 10 lakes (2016–2024), based on comparison with DAHITI reference data.
| Lake Name | Method | R |
Retrieved Trend (m yr-1) |
Difference in Trend (m yr-1) between DAHITI and Our Estimation |
Combined Score |
| Qinghai | Threshold_20 | 0.9983 | 0.3201 | 0.0003 | 0.9980 |
| OCOG | 0.9892 | 0.3136 | 0.0065 | 0.9827 | |
| Lexie Wudan | Threshold_10 | 0.9839 | 0.5153 | 0.0092 | 0.9747 |
| OCOG | 0.8980 | 0.5020 | 0.0225 | 0.8755 | |
| Lumajang dong | Threshold_60 | 0.9210 | 0.3028 | 0.0005 | 0.9205 |
| OCOG | 0.9110 | 0.2894 | 0.0139 | 0.8971 | |
| Zhari Namco | Threshold_30 | 0.9953 | 0.3774 | 0.0013 | 0.9940 |
| Ocean | 0.9891 | 0.3811 | 0.0178 | 0.9713 | |
| Ngoring | Threshold_60 | 0.9357 | 0.0277 | 0.0187 | 0.9170 |
| OCOG | 0.6854 | 0.0195 | 0.0105 | 0.6749 | |
| Hohxil | Threshold_40 | 0.9826 | 0.3577 | 0.0141 | 0.9685 |
| OCOG | 0.9879 | 0.3690 | 0.0254 | 0.9625 | |
| Jieze | Threshold_30 | 0.9780 | 0.2954 | 0.0060 | 0.9720 |
| OCOG | 0.9670 | 0.2788 | 0.0226 | 0.9444 | |
| Migriggyangzham | Threshold_90 | 0.9940 | 0.5259 | 0.0155 | 0.9785 |
| OCOG | 0.9928 | 0.4961 | 0.0453 | 0.9475 | |
| Langacuo | Threshold_30 | 0.9801 | -0.2423 | 0.0104 | 0.9697 |
| OCOG | 0.9642 | -0.2432 | 0.0113 | 0.9529 | |
| Siling | Threshold_20 | 0.9962 | 0.3529 | 0.0005 | 0.9957 |
| OCOG | 0.9954 | 0.3561 | 0.0026 | 0.9928 |
* Combined Score = R – (Δ slope vs DAHITI), where R is the Pearson correlation coefficient and Δ slope is the trend difference (m yr⁻¹). Higher scores indicate better agreement with DAHITI.
Disclaimer/Publisher’s Note: The statements, opinions and data contained in all publications are solely those of the individual author(s) and contributor(s) and not of MDPI and/or the editor(s). MDPI and/or the editor(s) disclaim responsibility for any injury to people or property resulting from any ideas, methods, instructions or products referred to in the content. |
© 2025 by the authors. Licensee MDPI, Basel, Switzerland. This article is an open access article distributed under the terms and conditions of the Creative Commons Attribution (CC BY) license (http://creativecommons.org/licenses/by/4.0/).
Copyright: This open access article is published under a Creative Commons CC BY 4.0 license, which permit the free download, distribution, and reuse, provided that the author and preprint are cited in any reuse.


