Submitted:
25 February 2025
Posted:
25 February 2025
You are already at the latest version
Abstract
The dramatic expansion of lake areas on the Changtang Plateau (CTP) since the late 1990s has attracted significant attention, as it contrasts sharply with the global decline in natural lake water storage during the same period. This study investigates the mechanisms behind lake area changes on the CTP by combining glacier change information obtained from the Google Earth Engine (GEE) platform with atmospheric circulation patterns derived from the ERA5 reanalysis dataset. Results indicate that the lake area on the CTP over the past six decades (1960–2020) exhibited three distinct phases: (1) a period of slow expansion from the 1960s to the 1980s; (2) a contraction phase from the 1980s to the late 1990s; and (3) a period of rapid expansion from the late 1990s to 2020. Further analysis revealed that the limited number of glaciers on the CTP significantly affected only a small fraction of glacial lakes near the southern part of the CTP (r = -0.65, p < 0.05). However, this effect is insufficient to explain the extensive expansion of lakes on CTP, particularly since most lakes are not located near glaciers. Instead, the expansion of lakes on the CTP is primarily attributed to anomalous increases in precipitation (r = 0.74, p < 0.01) caused by atmospheric circulation anomalies. This is evidenced by the enhanced Indian summer monsoon, which transports anomalous moisture from the Arabian Sea to the southwestern TP, leading to increased specific humidity at 500 hPa over the CTP during summer. Concurrently, the weakening of the westerly jet stream enhances moisture convergence, further contributing to increased summer precipitation. By integrating glacier change data with atmospheric circulation analysis, this study demonstrates that the extensive lake expansion on the CTP is driven primarily by precipitation anomalies rather than glacial melt. These findings provide valuable insights for future ecological safety planning and sustainable development in the region.
Keywords:
Changtang Plateau (CTP)
; Lake area
; Glacier surface area
; Atmospheric circulation
; ERA5 reanalysis
1. Introduction
The Tibetan Plateau (TP), renowned as the "roof of the world," plays a pivotal role owing to its considerable elevation and vast expanse [1,2]. The high elevation of the TP results in a climate that significantly differs from that of adjacent regions at similar latitudes. The TP is the source of several of the major rivers in Asia, including the Yangtze River, Yellow River, Lantsang River, Nu River, the Ganges River, and Indus River [3,4,5]. The TP supplies varying proportions of runoff to these rivers, which in turn provide freshwater to downstream Asian countries. Given the TP 's capacity for water supply, it is often referred to as the "Asian Water Tower " [6] or “Towering Asian Spring” [7].
The TP boasts approximately 1,400 lakes with areas exceeding 1 km², and about 70% of the total lake area is concentrated in the endorheic basins of its central region, known as the Changtang Plateau (CTP) [8,9]. Over the period from 1992 to 2020, global natural lake water storage has experienced statistically significant declines [10]. The CTP, characterized by its harsh natural climate and minimal human activity, hosts lakes that are almost entirely natural. In contrast, previous studies have revealed a significant and rapid expansion of lake areas on the CTP from the late 1990s to the present [11]. This contrasting trend raises a critical scientific question: What specific factors are driving the rapid expansion of CTP lakes amidst the global decline in lake water storage? Understanding these drivers is essential for predicting future hydrological changes and their ecological and socio-economic impacts.
Numerous studies have investigated lake changes on the CTP. Li et al. [12] attributed the expansion of CTP lakes to increased precipitation and glacial meltwater. Zhang et al. [13] conducted a quantitative water mass budget analysis for the entire CTP, revealing that increased net precipitation contributes the majority of water supply (74%) to lake volume expansion, a conclusion consistent with Lei et al. [14]. Song et al. [3] examined the relationship between lake levels and glacial meltwater on the CTP, finding that the rates of change in non-glacier-fed lakes were as high as those in glacier-fed lakes across the plateau. The results suggest that lake expansion is primarily driven by changes in precipitation and evapotranspiration. However, due to the scarcity of observational data, comprehensive quantitative studies of lake hydrological processes remain challenging. Zhu et al. [15] conducted a quantitative study of Nam Co, the largest endorheic lake on the CTP, and found that glacial meltwater is the primary driver of its expansion. Similarly, Lei et al. [16] demonstrated the dominant role of glacial meltwater in the expansion of lake in the central CTP. These conflicting results highlight the ongoing controversy regarding the primary drivers of lake expansion on the CTP. Furthermore, recent studies indicate that by 2100, the continued expansion of lake areas in the CTP may result in the merging or reorganization of lake basins, threatening local infrastructure and ecological security[17]. Therefore, it is imperative to investigate the mechanisms behind the differences in lake area changes in the CTP compared to global patterns to develop timely and effective preventive measures against ecological threats and associated economic losses.
One of the main reasons for the ongoing controversy is the limited availability of high-resolution observations of lake and climatic variables. To address these gaps, this study combines high-temporal-resolution remote sensing data with ERA5 reanalysis data to analyze the correlations between lake expansion and factors such as precipitation anomalies and glacial meltwater, while also investigating the role of atmospheric circulation patterns. By integrating these factors, we aim to provide a comprehensive analysis of the mechanisms driving lake expansion in the CTP.
This study offers several novel contributions to the field. First, the use of high-temporal-resolution remote sensing data allows for a more accurate and dynamic assessment of lake and glacier changes, overcoming the limitations of previous studies that relied on low-resolution datasets. Second, the integration of ERA5 reanalysis data provides a detailed understanding of atmospheric circulation patterns, enabling a more robust analysis of climatic drivers. These methodological advancements not only clarify the primary factors behind lake expansion in the CTP but also enhance our understanding of regional hydrological responses to global climate change. Furthermore, the findings have practical implications for ecological safety planning and sustainable development in the region, where continued lake expansion may pose risks to local infrastructure and ecosystems. By addressing these critical issues, this study provides a scientific basis for mitigating potential ecological and economic threats.
2. Materials and Methods
2.1. Study Area
The CTP (29°39′57″-38°39′51″N; 78°38′53″-93°38′43″E), depicted in Figure 1, is a vast endorheic basin located in central TP, with an average elevation exceeding 4,800 m and an area of approximately 590,000 km². It hosts a significant portion of the lakes on the TP, encompassing about 70% of the total lake area [8]. Additionally, it contains over 5,000 glaciers covering an area of roughly 7,069 km² [18]. Based on the HydroSHEDS data product [19], the CTP is further subdivided into 17 sub-basins. According to the coefficient of variation (CV) of precipitation in each sub-basin related to lake expansion, these sub-basins are ranked from largest to smallest and labeled as R01 to R17 (See section 3.1). The harsh natural environment and sparse human presence characterize the plateau, which hosts only four long-term meteorological stations: Gaize, Shenzha, Bange, and Anduo, with the latter three clustered in the southeastern corner. Notably, there is a complete absence of long-term meteorological stations in the middle and northern parts of the CTP.
2.2. Materials
2.2.1. Lake Area Data
Numerous scholars have compiled and processed imagery from the high-water season (June to November) and early aerial photography-derived topographic maps to create annual datasets of lake areas for the TP. This study systematically collated all available long-term datasets [20,21,22], obtaining a comprehensive dataset containing 172 lakes within the CTP with relatively complete time series information (1960-2020), with each lake having missing data for less than 5% of the total years, ensuring the highest temporal continuity. The spatial distribution of these lakes is shown in Figure 1.

2.2.2. Glacier Data
This study compiles and analyzes imagery data obtained from various satellites in the Landsat series, specifically Landsat 4 (operating from 1982 to 1993 with the Thematic Mapper, TM), Landsat 5 (1984 to 2012, also equipped with TM), Landsat 7 (1999 to 2021, Enhanced Thematic Mapper Plus, ETM+), and Landsat 8 (2013 to 2020, Operational Land Imager/Thermal Infrared Sensor, OLI/TIRS), for the purpose of assessing glacial areas on the CTP. The spatial resolution of the images employed in this study is 30 meters. Owing to the significant striping artifacts in Landsat 7 imagery, resulting from the malfunction of the ETM+ sensor after 2003, our analysis exclusively utilized Landsat 7 images captured prior to this date. During the rigorous process of image quality control, it was observed that, as of early June, the seasonal snow cover on glaciers within the Chinese Tian Shan Plateau (CTP) had not yet fully melted. To ensure the accuracy and temporal consistency of our glacier data with the lake area dataset, we strictly selected images from July and August that exhibited less than 20% cloud cover and no cloud obstructions over the glaciers for subsequent glacier information extraction. This extraction process was conducted on the Google Earth Engine (GEE) platform, harnessing its extensive imagery database and powerful computational resources. Notably, the quality limitations inherent in the available imagery restrict the availability of high-quality monitoring results from the 1970s and 1980s.
2.2.3. Reanalysis Data
Given that summer precipitation accounts for approximately 70% of the total annual precipitation on the CTP [23]. Due to the sparse and uneven distribution of meteorological stations on the CTP, we utilized the reanalysis data (ERA5) provided by the European Centre for Medium-Range Weather Forecasts (ECMWF), covering the summer (JJA) period from 1960 to 2020. Specific climatic variables included are specific humidity, u/v-component of wind, total precipitation, 2m temperature, surface runoff, and evaporation. The dataset spans 1960-2020 with a spatial resolution of 0.25°×0.25° and covers the atmospheric layer from 500 hPa to 200 hPa.
2.3. Methods
2.3.1. Ratio Threshold Method
The Band Ratio Threshold Method, as shown in Equation (1), is used. This method is a commonly employed multi-band digital image enhancement technique, where the ratio of the gray values of two bands highlights the slope changes in the spectral curves of surface features, thereby enhancing subtle differences in spectral characteristics. The threshold selection is based on interactive manual determination for each image, with optimal values concentrated in the 1.8-2.0 range. Areas with ratios exceeding this threshold are considered glaciated. Liu et al. [24] used this method in the completion of the Second Glacier Inventory of China.
where represents the gray value of the red band, represents the gray value of the shortwave infrared band, corresponding to band 3 and band 5 of the TM/ETM+ sensor and band 4 and band 6 of the OLI sensor, respectively.
2.3.2. Mutations Test
The Cumulative Anomaly Test, also known as Cumulative Deviation [25,26], shown in Equation (2), is employed to identify phases of change. This study uses both methods to analyze and determine the years of phase transitions in climatic variables (e.g., precipitation) and lake area.
whererepresents the cumulative anomaly,is the annual value of the variable, is the multi-year average of the variable
2.3.3. Climatic Diagnosis
To diagnose the changes in atmospheric circulation before and after abrupt years, this study calculated the vertically integrated water vapor flux as shown in Equation (3), its divergence as shown in Equation (4).
where , represent the vertically integrated water vapor flux, its divergence, and the boundary moisture budget, , , , , denote the lowest and highest integration levels, gravitational acceleration, meridional wind component and zonal wind component, respectively.
2.3.4. Correlation Analysis and Composite Analysis
This study employed composite analysis to investigate the differences in the atmospheric circulation background fields between two periods before and after lake changes, as well as the possible mechanisms behind these changes. Additionally, Pearson correlation analysis and Student's t-test were used for climatic statistical analysis and climatic diagnostic analysis.
2.3.5. Coefficient of Variation
The Coefficient of Variation (CV) is a commonly used metric for measuring the relative variability of a variable and reflects the degree of dispersion in the data. In this study, the CV of precipitation is used to reasonably rank the sub-basins of CTP. A higher CV indicates greater data fluctuation and a larger deviation from the mean, implying stronger variability and more pronounced climate change in the region. Conversely, a lower CV suggests smaller data variability, indicating more regular and stable climatic conditions in the region. For a given time series, the CV is calculated using the Equation (5):
where represents the standard deviation of the variable during the study period,represents the mean of the variable during the study period.
3. Results
This section may be divided by subheadings. It should provide a concise and precise description of the experimental results, their interpretation, as well as the experimental conclusions that can be drawn.
3.1. Relationship Between Lake Area Change and Precipitation Anomaly
Initially, this study investigated the changes in total lake area on the CTP and their correlation with the cumulative anomaly of regional average summer precipitation (29°N to 38°N, 81°E to 92°E). As illustrated in Figure 2a, the lake area on the CTP over the past six decades (1960–2020) exhibited three distinct phases: (1) a period of slow expansion from the 1960s to the 1980s, during which the lake area increased at a rate of 34.25 km²/yr, reaching 21,773.96 km² by the 1980s; (2) a contraction period from the 1980s to the late 1990s, characterized by a significant decrease in lake area at a rate of -287.16 km²/yr; and (3) a period of rapid expansion from the late 1990s to 2020, with the lake area increasing at a rate of 410.26 km²/yr and reaching 28,000 km² by 2020. Figure 2b reveals a significant positive correlation between the total lake area and the cumulative anomaly of summer precipitation (r = 0.74, p < 0.01), with a notable turning point occurring at the end of the 20th century. Additionally, abrupt declines in precipitation were observed in 1997/98, 2009/10, and 2015/16.
Subsequently, we examined the correlation between the total lake area within each of the 17 sub-basins and the corresponding regional average summer precipitation (Figure 3). Based on the coefficient of variation (CV) of summer precipitation since the late 1990s, the 17 sub-basins were classified into two groups: R01–R09, characterized by higher CV values (ranging from 15.04 to 22.35), and R10–R17, with lower CV values (ranging from 10.26 to 14.10). This classification reflects the greater variability in precipitation within the R01–R09 sub-basins during the lake expansion period (Figure 3c), compared to the relatively stable precipitation patterns in the R10–R17 sub-basins (Figure 3d). Spatially, the R01–R09 sub-basins are predominantly distributed in the western CTP, while the R10–R17 sub-basins are mainly located in the eastern CTP. The underlying causes of this spatial heterogeneity will be discussed in detail later.
As shown in Figure 3a–b, the changes in lake area within each sub-basin over the past 60 years also followed three distinct phases: (1) a period of slow growth from the 1960s to the 1980s, (2) a contraction period from the 1980s to the mid/late 1990s, and (3) a period of rapid expansion from the late 1990s to 2020, consistent with the overall trend observed for the entire CTP. Figure 3c–d further demonstrates that the turning points in summer precipitation primarily occurred in the late 1990s for the other sub-basins. Moreover, sharp declines in summer precipitation were observed across the sub-basins in 1997/98, 2009/10, and 2015/16, aligning with the overall precipitation trends on the CTP. Previous studies have attributed these abrupt declines to extreme El Niño events [27,28].
In summary, we provide a more nuanced understanding by examining the spatial heterogeneity at the sub-basin scale. We not only confirm the widespread trend of rapid lake expansion beginning in the late 1990s but also reveal a distinct spatial pattern of decreasing variability in summer precipitation from the west to the east.
3.2. Relationship Between Glacier Area and Lake Area Change
As shown in Figure 4, we select seven regions for glacier area monitoring based on the distribution of glaciers on the CTP and the correlation between the area of each lake and the summer precipitation in its corresponding sub-basin. Spatially, as shown in the red dashed rectangular in Figure 4, CTP is divided into southeastern, southern, southwestern, northwestern, middle, northeastern and eastern.
However, it should be noted that due to the influences of lake depth characteristics, basin surface conditions, and groundwater discharge, the correlation results between lake area and summer precipitation exhibit a heterogeneous response, specifically manifested in variations in the magnitude of correlation coefficients [3]. But, due to the current lack of observational data in these areas, it is not possible to conduct individual assessments of the underlying causes. So, in order to facilitate further analysis, we have simplified the lakes' responses to precipitation into two categories: positive correlation (R > 0) and negative correlation (R < 0) (Figure 4).
We first examined the changes in the area of glaciers at their final melting stages (June, July, August). The results (Figure 5) indicate that glacier surface area changes on the CTP can be categorized into two distinct trends over the entire period of study.
Specifically, over the past several decades, the glacier surface area on the northeastern CTP (Figure 5a) increased from 20.43 km² to 30.25 km², at a rate of +0.33 km² per year (R² = 0.45, p < 0.01). The northwestern CTP (Figure 5b) increased from 379.34 km² to 390.64 km², at a rate of +0.45 km² per year (R² = 0.01, p > 0.05). Similarly, in the southwestern region (Figure 5c), the glacier surface area expanded significantly from 163.9 km² to 222.19 km², at a rate of +2.16 km² per year (R² = 0.53, p < 0.05).
In contrast, the southeastern region (Figure 5d) experienced a slight decline in glacier surface area, from 69.26 km² to 66.3 km², at a rate of -0.1 km² per year (R² = 0.00, p > 0.05). The southern region (Figure 5e) showed a more pronounced decrease, with glacier surface area shrinking from 85.4 km² to 75.08 km², at a rate of -0.32 km² per year (R² = 0.38, p < 0.05). The middle region (Figure 5f) also exhibited a decline, with glacier surface area decreasing from 236.92 km² to 219.68 km², at a rate of -0.64 km² per year (R² = 0.02, p > 0.05). The most significant reduction was observed in the eastern region (Figure 5g), where glacier surface area decreased from 436.55 km² to 392.79 km², at a rate of -1.29 km² per year (R² = 0.54, p < 0.05).
Then, we investigated the correlation between glacier area and lake area. Given that glacial meltwater primarily replenishes nearby lakes, we focused on lakes in close proximity to the selected glacier regions. The results indicate that glaciers in the northwestern (Figure 5b), southwestern (Figure 5c), southeastern (Figure 5d), and middle (Figure 5f) regions of the CTP show no significant positive correlations with their respective nearby lakes: Woerba Tso (r = 0.18, p > 0.05), Cangmu Tso (r = 0.37, p > 0.05), Yueqia Tso (r = 0.10, p > 0.05), and Noname Lake (r = -0.34, p > 0.05). However, a significant positive correlation was observed between the glacier in the northeastern region (Figure 5a) and Lake Ayakumu (r = 0.35, p < 0.05). Notably, a significant negative correlation was found between the glacier in the southern region (Figure 5e) and Xuru Tso (r = -0.65, p < 0.05). In contrast, no significant negative correlation was detected between the glacier in the eastern region (Figure 5g) and Linggo Co (r = -0.24, p > 0.05).
In summary, while glacier changes exhibit regional variability across the CTP, they are unlikely to be the dominant driver of the widespread lake expansion observed on the plateau. The limited and region-specific correlations between glacier area and lake area suggest that glacial meltwater plays a secondary role in influencing lake dynamics. Instead, other factors, such as precipitation changes or surface runoff may be more critical in driving the observed lake expansion. Detailed discussions on these potential mechanisms will be presented in the following section.
4. Discussion
4.1. Minimal Contribution of Glacier Meltwater to Extensive Lake Expansion
As illustrated in Figure 4, the distribution of glaciers on the CTP is relatively sparse, with most glaciers being small in size. In contrast, lakes on the CTP are widely distributed, and many of them are not adjacent to glaciers. Given that glacier meltwater primarily replenishes nearby glacier-fed lakes, we investigated the relationship between glacier and lake area changes across seven regions of the CTP. However, our results reveal that a significant negative correlation between glacier and lake areas is only observed in the southern CTP. Moreover, more than half of the lakes located near or connected to glaciers exhibit a positive correlation with glacier area changes. This suggests that glacier meltwater contributes to the expansion of some glacier-fed lakes in specific regions but has minimal impact on the majority of lakes across the CTP. For lakes that are not adjacent to glaciers or are located far from them, the contribution of glacier meltwater is even more negligible. In summary, changes in glacier area on the CTP do not align well with the widespread lake expansion observed across the plateau, consistent with previous findings [29]. Therefore, glacier meltwater is not the primary driver of the extensive lake expansion phenomenon on the CTP.
In the previous section, an anomalous decline in lake area was observed in the R15 sub-basin (Figure 3b). Previous studies have attributed this phenomenon to the dike burst of Zonag Lake [10,12,30]. Additionally, we identified 17 lakes whose area changes exhibited a negative correlation with summer precipitation, as indicated by the blue polygons in Figure 4c. This suggests that the response of these lakes to precipitation is not as pronounced as expected.
By examining the spatial distribution of the 17 lakes that exhibit a negative correlation, it is observed that two of them are located within the R07 sub-basin. As mentioned in the previous section, the R07 sub-basin is situated in the northeastern part of the CTP, where the precipitation CV is the highest in the eastern part of the plateau. Monitoring results of glacier area in this region also indicate a trend of glacier expansion, which aligns with the expansion of the lakes. Therefore, no significant response relationship between glaciers and lakes was observed. As shown in Figure 1, the R07 sub-basin has a relatively low altitude, with an average elevation of 2000 m, which is substantially lower than the average altitude of the CTP, which is around 4000 m. Consequently, the climate characteristics and changes in the R07 region differ markedly from those in most other sub-basins of the CTP. This region appears to be more sensitive to climatic and hydrological changes, and further research, integrating additional observational data, is needed to identify the specific driving factors behind the lake changes in this area.
Among the 17 lakes, 9 are located in the southeastern part of CTP (R13: Siling Co Basin and R11: Nam Co Basin). Previous studies [15,31] on the quantitative water balance of lakes in the Nam Co Basin have indicated that glaciers contribute significantly to the lake dynamics in this region. However, quantitative research conducted by Liu et al. [32] in the Siling Co Basin suggests that glaciers have a minimal contribution to the changes in lakes within this basin. Instead, the primary drivers of lake changes are likely related to human activities. Previous studies have confirmed that extensive road construction across the river channels in the Siling Co Basin [17] has disrupted the hydrological connectivity between Siling Co and surrounding lakes, complicating efforts to identify the underlying mechanisms driving changes in lake areas within this basin. As for the remaining six lakes, due to the lack of relevant observational data, specific research into the causes of these anomalous changes has yet to be conducted.
4.2. Driving Mechanisms of CTP Lake Expansion: Dominance of Atmospheric Circulation
Based on the findings from the preceding sections, we have excluded glacier meltwater as the dominant factor in the extensive expansion of lakes on the CTP. Consequently, given the significant positive correlation between lake area and summer precipitation reported in the results of Section 3, it is evident that summer precipitation on the CTP has likely been one of the main drivers behind the rapid expansion of most lakes within the basin in recent decades. Previous studies have shown that precipitation changes in some regions may be in line with regional circulation changes [10]. So the significant increase of summer precipitation over the CTP may be related to the change of large-scale atmospheric circulation [14], this section delves deeper into why summer precipitation has increased suddenly and identifies the sources of this moisture. The results for summer precipitation in the section 3 reveal that significant shifts in summer precipitation occurred around 1998/1999. Consequently, the past 60 years are divided into two periods: 1960-1998 and 1999-2020, hereafter referred to as the "lower (1960-1998) and higher (1999-2020) rainfall periods," respectively, for convenience.
Water vapor is an important factor for precipitation, while changes in atmospheric humidity significantly influence precipitation. Research indicates that in the past 60 years, there has been a significant positive correlation between summer precipitation and specific humidity at 500 hPa over the CTP (r = 0.92, p < 0.01, Figure 6a). Additionally, it is evident that the 500 hPa summer specific humidity over the CTP exhibited two distinct periods of change: a declining trend from the 1960s to the mid-to-late 1990s, followed by an increasing trend from the mid-to-late 1990s to 2020. This corresponds well with the trends observed in the higher and lower rainfall periods.
Further analysis of the spatial distribution of 500 hpa summer specific humidity during the higher and lower rainfall periods using composite analysis (Figure 6b) reveals that summer specific humidity significantly increased in most regions during the higher rainfall period compared to the lower rainfall period, except for the periphery of TP. The increase in summer specific humidity over the CTP was the most pronounced. In addition, we can clearly observe that there is a significant spatial difference in the increase of summer specific humidity over the CTP: from west to east, the degree of increase in specific humidity gradually decreases. This effectively explains the reason for the two classifications of summer precipitation oscillation amplitude presented in Section 3 (Figure 3c, 3d).
The increase in summer specific humidity from the surface to the mid-troposphere is primarily due to enhanced atmospheric moisture conditions, influenced mainly by moisture sources. To investigate the sources of moisture contributing to increased atmospheric moisture during the higher rainfall period in the CTP, we employed the Eulerian method for moisture budget analysis. We calculated the summer vertically integrated water vapor flux and its divergence form the 500 hPa to 200 hPa layer. Composite analysis was then used to examine the differences in moisture sources between the higher and lower rainfall periods. Results indicate that the summer vertical integration of water vapor flux divergence from 500 hPa to 200 hPa shows that during periods of higher rainfall, there has been significantly stronger water vapor convergence over the CTP (Figure 6d). The primary source of this moisture anomaly is an increase in water vapor from the southwest, originating from the Arabian Sea (Figure 6c). This indicates that the increase in summer specific humidity over the CTP during periods of higher rainfall has been primarily due to the strengthening of the Indian summer monsoon. Additionally, numerous previous studies on the water vapor transport processes and sources in the TP indicate that the southwestern moisture source from the Arabian Sea, primarily dominated by the Indian summer monsoon, serves as a major pathway for water vapor [33,34,35,36,37,38]. These findings further support the reliability of previous studies.
Additionally, the westerlies is also a dominant driver of the TP, and the trend of wetting on the TP is mainly dominated by the East Asian subtropical westerly jet (EASWJ) and the variation of water vapor [14,39]. EASWJ, a critical circulation system affecting China, plays a crucial role in the atmospheric circulation of the mid and lower troposphere. To quantify the and intensity of the EASWJ during summer over the past 60 years, this study defines indices for the intensity of the EASWJ. The activity range of the EASWJ is determined as 30°N to 55°N and 80°E to 140°E. The jet intensity index is defined as the magnitude of the maximum zonal wind speed at 200 hPa, averaged longitudinally in activity range.
Research indicates that changes in the intensity of the westerly jet can be categorized into an anomalously strong phase from the 1960s to the mid-1990s and an anomalously weak phase from the mid-1990s to the 2020s. Analysis of the jet intensity in relation to the zonal wind at 500 hPa (Figure 7a) and specific humidity at 500 hPa (Figure 7b) shows that during periods of anomalously strong jet intensity, the 500 hPa zonal wind also exhibits strong anomalies, while both 500 hPa specific humidity and precipitation are anomalously weak. Conversely, during periods of anomalously weak jet intensity, the opposite trends are observed. Notably, the periods of anomalously strong and weak jet intensity align with the lower (1960-1998) and higher (1999-2020) rainfall periods on the CTP, respectively.
In summary, the significant increase in 500 hPa summer specific humidity in the mid-to-late 1990s, concurrent with the anomalously weak intensity of the EASWJ, resulted in a weaker zonal wind at 500 hPa over the CTP during summer. This led to increased convergence of water vapor over the CTP, culminating in more summer precipitation and the formation of the higher rainfall period, which drove the rapid expansion of lakes in the CTP.
In addition to changes in atmospheric circulation, the unique topography of the CTP is a significant factor distinguishing it from other lake basins. The endorheic topography of the basin offers exceptional water storage capacity, preventing increased precipitation in the CTP from flowing out as runoff and thereby minimizing the lakes' net loss. Increased precipitation, whether from sub-surface or surface runoff, creating favorable conditions for significant lake expansion. Beyond the water retention capacity provided by the topography, studies indicate that the complex topography of the TP results in a significant underestimation of precipitation in the region [40]. Consequently, total summer precipitation on the CTP may significantly exceed the values presented in this study, suggesting that its contribution to lake expansion could be substantially greater than reported. Thus, the contribution of unique topographic factors to the wetting of the CTP is significant and should not be overlooked. Future research should provide additional topographic data to enhance the understanding of driving mechanisms.
4.3. Contrasting Drivers of Lake Expansion on the CTP and Global Lake Decline: A Comparative Analysis
The decline in global natural lake water storage (LWS) is primarily attributed to direct human activities, followed by changes in temperature-and-potential evapotranspiration (PET) [10]. Therefore, this section will focuse on comparing these three factors during the lake expansion period on the CTP (corresponding to the second linear regression line in each subplot of Figure 8) to elucidate the reasons for the differences between lake expansion on the CTP and the global decline in natural LWS.
First, the CTP is one of the most remote and least human-influenced regions on Earth, largely due to its harsh natural environment and extreme climatic conditions. As one of China's three major uninhabited zones, the CTP is characterized by high altitudes (averaging over 4,500 meters), low temperatures, and limited accessibility, which have historically restricted human settlement and economic activities. The region's sparse population and minimal infrastructure development further contribute to its pristine state, with human activities such as agriculture, industry, and urbanization being virtually absent. Consequently, the influence of direct human activities on its ecosystems is negligible. Therefore, the significant difference in human activity impacts may be the primary reason why lake changes on the CTP differ from the global decline in natural LWS during the same period.
Next, we analyzed the changes in temperature-and-PET on the CTP. Both temperature (Figure 8a) and PET (Figure 8b) exhibit a persistent increasing trend during the lake expansion periods. Although PET shows a slight decline during some expansion phases, its average value during these periods remains significantly higher than during shrinkage periods. Notably, no significant differences were observed between the trends in temperature-and-PET on the CTP and the drivers of global natural LWS decline. However, it is important to highlight that the role of PET in lake water balance is rarely discussed in the existing literature. Despite the similar trends in temperature-and-PET between the CTP and global natural lakes, the contribution of these factors to lake water balance on the CTP is relatively limited. This is primarily due to the region's consistently cold climate and extended lake ice cover periods, which are significantly longer than those of other natural lakes globally. As a result, whether temperature-and-PET inhibit or promote lake water balance on the CTP, their overall impact remains relatively small [41]. Therefore, we can reasonably infer that the influence of temperature-and-PET on lakes in the CTP is much less than that on regions of global natural LWS.
Finally, we examined summer precipitation and surface runoff during the lake expansion period on the CTP. The results show that both summer precipitation (Figure 8c) and surface runoff (Figure 8d) exhibit a consistent increasing trend during the expansion phase. Combined with our analysis of glacier changes, we conclude that increased precipitation is the primary driver of enhanced surface runoff. Synthesizing these findings, we reasonably infer that the increase in summer precipitation and surface runoff, coupled with the minimal influence of human activities and the limited impact of temperature and PET on water loss, collectively explain the significant lake expansion on the CTP amidst the global decline in natural LWS.
Given the previous results showing that the precipitation variability in the western CTP is greater than in the eastern part during the lake expansion period. So, in addition to analyzing the overall interannual climate in the CTP, we further investigate the spatial variability of air temperature, PET, precipitation, and surface runoff during the lake expansion period (higher rainfall period).
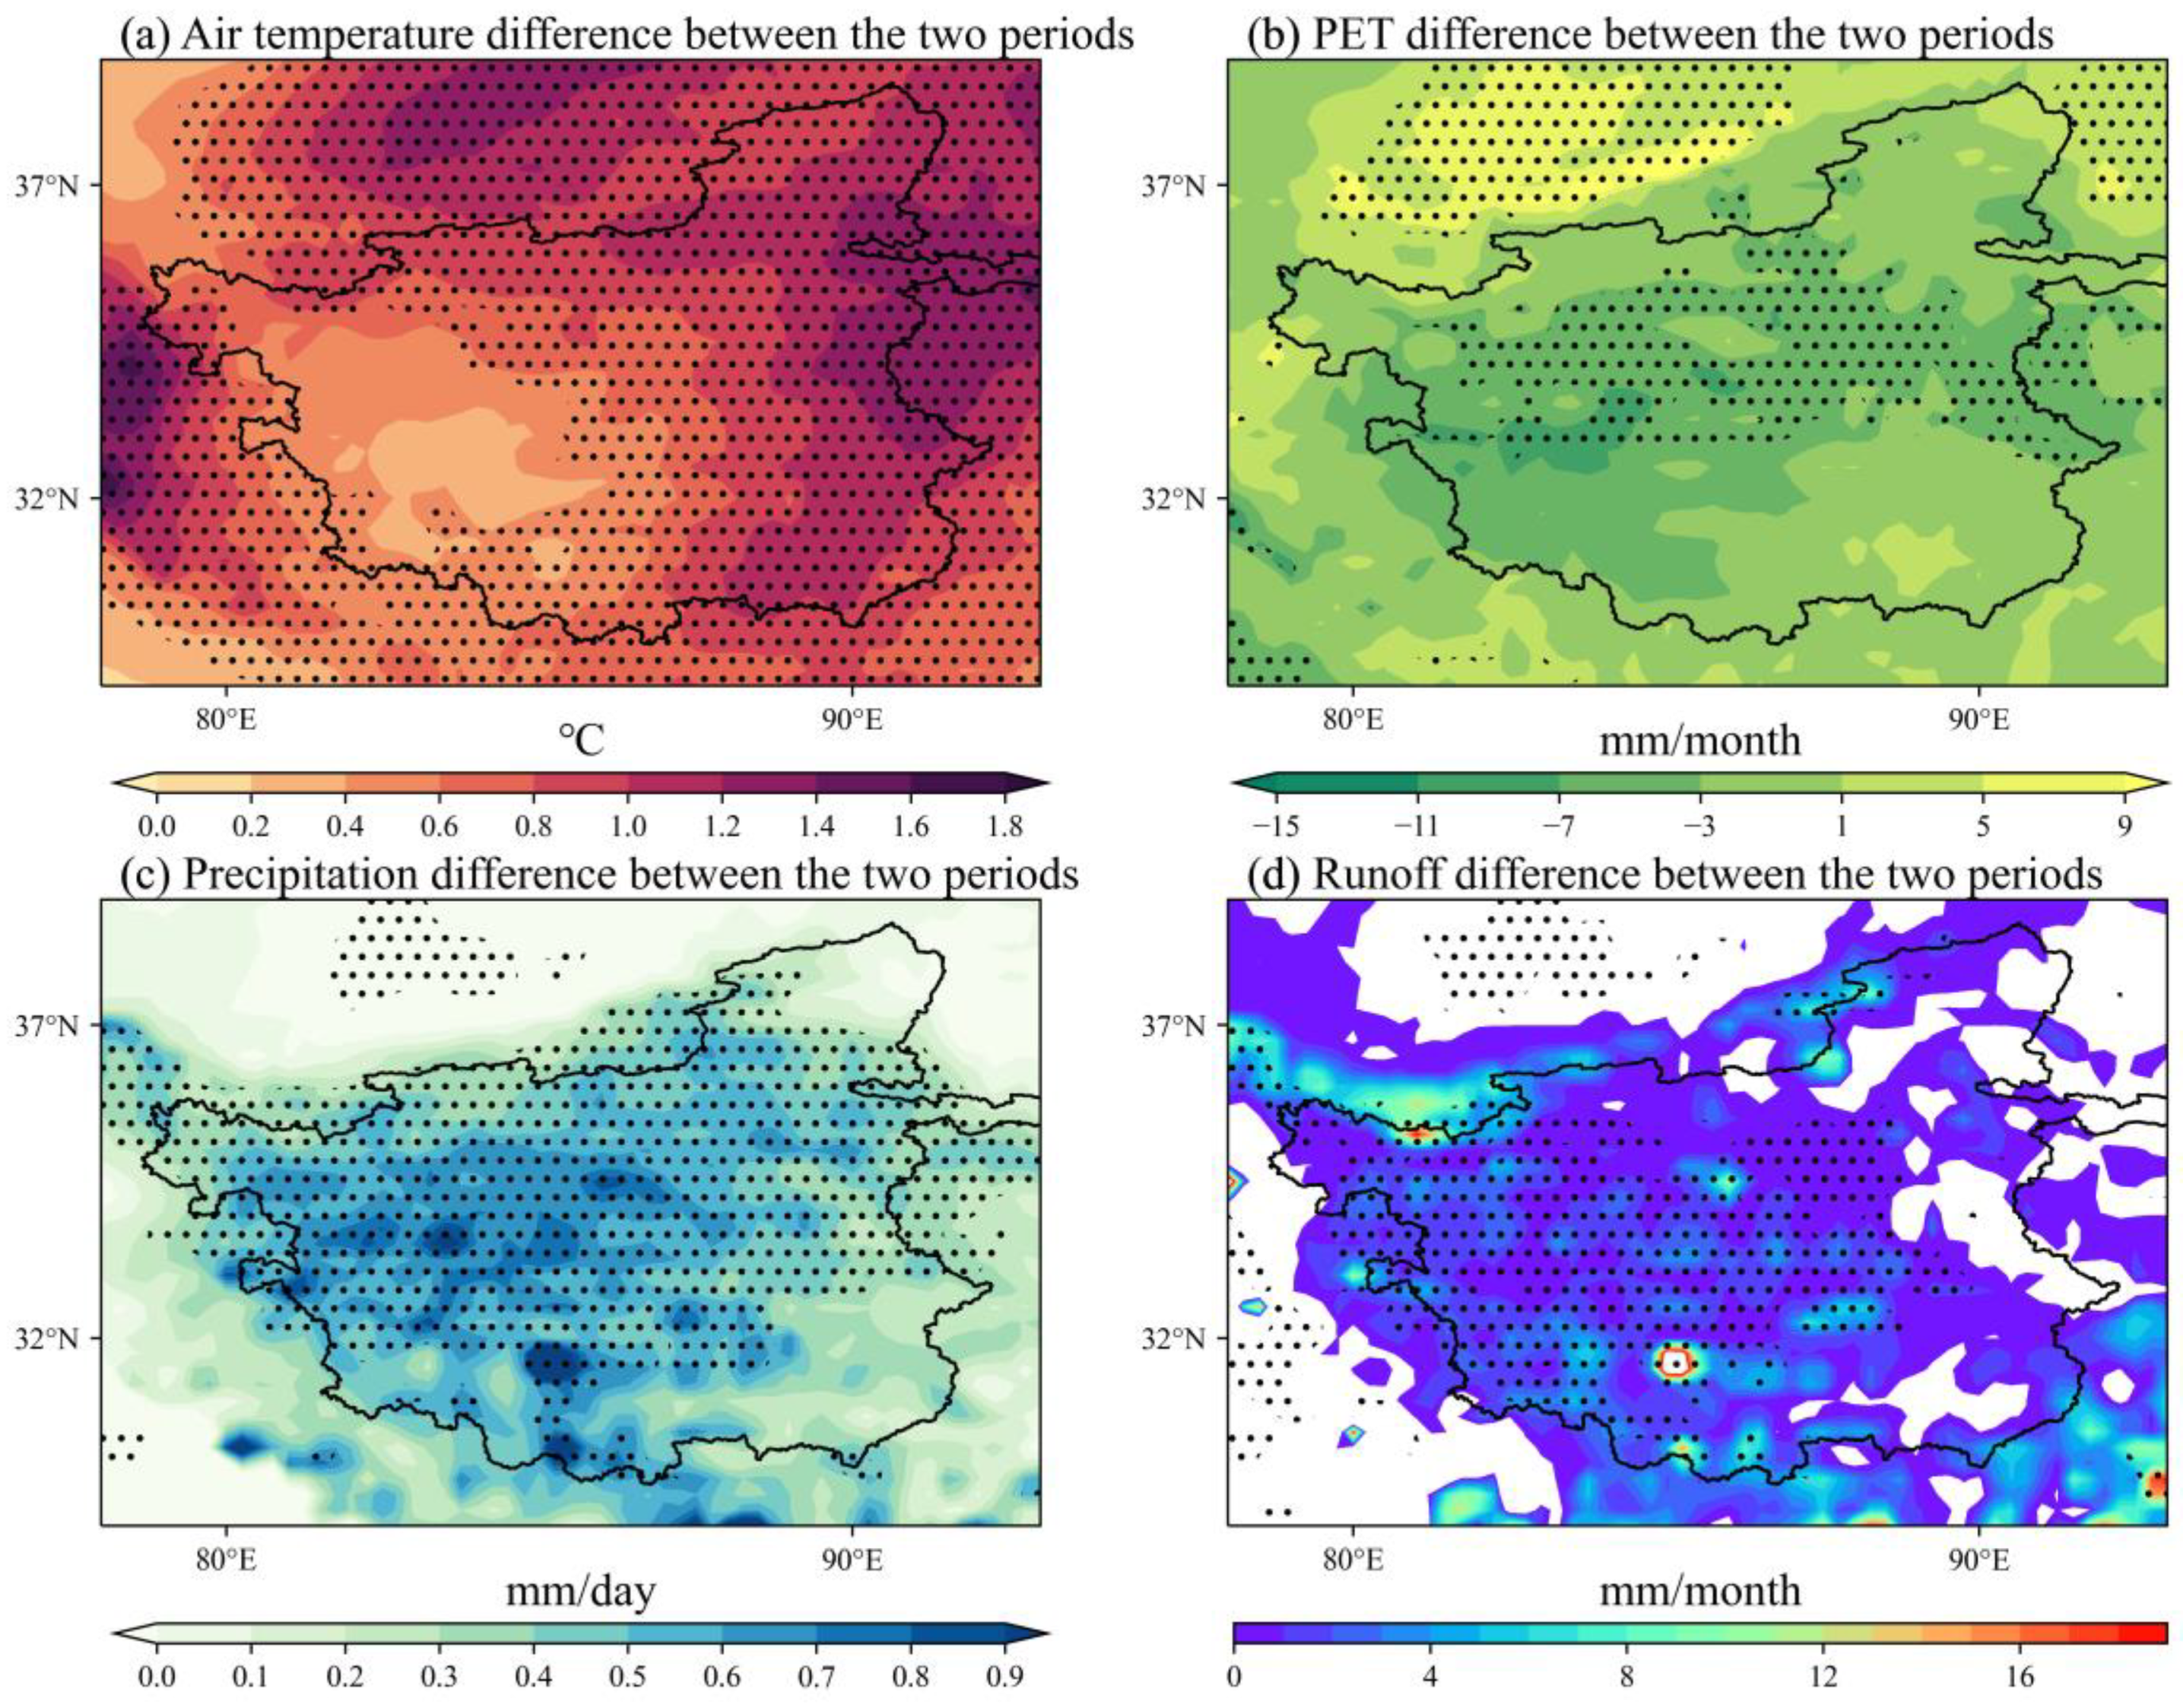
During the lake expansion period, summer precipitation (Figure 9c) exhibited a distinct spatial pattern, with a greater increase in the western CTP compared to the eastern CTP. This finding aligns with the earlier classification based on the coefficient of variation (CV) of precipitation, further validating the higher variability in the western sub-basins (R01–R09). Concurrently, the western CTP experienced a smaller temperature increase (Figure 9a) than the eastern region. This spatial contrast in precipitation and temperature changes has led to a more pronounced increase in humidity in the western CTP, providing a plausible explanation for the observed expansion of glaciers in the northwestern and southwestern regions over the past few decades. Additionally, the spatial pattern of surface runoff changes (Figure 9d) closely mirrors that of precipitation, strongly supporting the conclusion that surface runoff is primarily driven by precipitation. In contrast, no significant spatial pattern was observed for PET changes (Figure 9b) during this period.
In summary, despite the spatial heterogeneity in temperature, precipitation, and surface runoff changes across the CTP, the entire region exhibits a consistent trend of warming and wetting, with no areas showing drying or cooling trends. This pattern is consistent with the broader context of global climate change. The observed spatial differences in climatic factors highlight the complex interplay between temperature, precipitation, and hydrological processes on the CTP. These findings underscore the importance of considering spatial heterogeneity when studying climate-driven environmental changes in high-altitude regions.
5. Conclusions
This study identifies a three-phase pattern in lake area changes: slight expansion from 1960 to 1980, rapid shrinkage from 1980 to 1997/98, and dramatic expansion from 1998 to 2020. Notably, the expansion during the third phase is in stark contrast to the global trend of declining natural LSW during the same period. Then, we combined remote sensing images to assess changes in glacier area and used reanalysis data to explore why the changes in lake areas on the CTP exhibit trends opposite to those of global natural lake water storage.
The results indicate that glaciers in the western and northeastern CTP are advancing, contributing little to the expansion of lakes in the watershed. In contrast, glaciers in other areas are retreating to varying degrees, with only glaciers in the southern sub-basin having a significant contribution to the surrounding lakes, while the glaciers in the remaining sub-basins show minimal impact on their nearby lakes. In conclusion, the limited number of glaciers in the CTP and their relatively small retreat are insufficient to account for the extensive lake expansion observed in the region.
During the same period of global natural LWS decline, the expansion of lakes on the CTP can primarily be attributed to minimal human activity and the low impact of evapotranspiration on lake water loss. Meanwhile, the significant increase in summer precipitation, which in turn leads to increased surface runoff, is the primary driver of widespread lake expansion in the CTP. This specific driving process is evidenced by the enhanced Indian Summer Monsoon, which brings anomalous moisture from the Arabian Sea to the southwestern Tibetan Plateau, increasing specific humidity at 500 hPa over the CTP during summer. Simultaneously, the weakening of the westerly jet stream facilitates greater moisture convergence, ultimately resulting in increased summer precipitation.
Due to data limitations, particularly the lack of reliable glacier mass balance observations and constraints in the spatial and temporal distribution of lake and meteorological data, the heterogeneous responses of individual lakes in this study could not be thoroughly investigated. We recommend strengthening the observational network on the CTP to enable more detailed quantitative studies of individual lake water balances in the future. This study provides a reasonable explanation for the divergence in lake water storage changes between the CTP and global natural LWS trends, offering valuable insights for future ecological safety planning and development in the region.
Author Contributions
Conceptualization, D.Z. and Y.P.; methodology, D.Z.; software, D.Z.; validation, J.H., Y.N. and Z.Z.; formal analysis, D.Z.; investigation, C.J.; resources, Y.P.; data curation, D.Z.; writing—original draft preparation, D.Z.; writing—review and editing, Y.P.; visualization, D.Z.; supervision, Y.P.; project administration, Y.P; funding acquisition, Y.P. All authors have read and agreed to the published version of the manuscript.
Funding
This research was supported by the National Natural Science Foundation of China (Grant Nos. 42171160).
Institutional Review Board Statement
Not applicable.
Informed Consent Statement
Not applicable.
Data Availability Statement
The original lake area data presented in the study are openly available in A Big Earth Data Platform for Three Poles (http://poles.tpdc.ac.cn/en/) and scientific data (https://www.nature.com/sdata/). The ERA5 reanalysis data were provided by ECMWF (https://cds.climate.copernicus.eu/). The HydroSHEDS database can be found in website: https://www.hydrosheds.org/.
Acknowledgments
We thank the USGS for providing the Landsat data (https://earthexplorer.usgs.gov/) and the Google Earth Engine provide data processing support (https://earthengine.google.com/).
Conflicts of Interest
The authors declare no conflicts of interest.
References
- Da, W.; Rana, S.K.; Bawa, K.; Kunte, K.; Wang, Z. Roof of the world: Home and border in the genomic era. Mol Ecol Resour. 2023. [Google Scholar] [CrossRef]
- Qiu, J. China: The third pole. Nature. 2008, 454, 393–397. [Google Scholar] [CrossRef]
- Song, C.; Huang, B.; Richards, K.; Ke, L.; Hien Phan, V. Accelerated lake expansion on the Tibetan Plateau in the 2000s: Induced by glacial melting or other processes? Water Resour Res. 2014, 50, 3170–3186. [Google Scholar] [CrossRef]
- Pritchard, H.D. Asia’s shrinking glaciers protect large populations from drought stress. Nature. 2019, 569, 649–654. [Google Scholar] [CrossRef]
- Xiang, L.; Wang, H.; Steffen, H.; Wu, P.; Jia, L.; Jiang, L.; Shen, Q. Groundwater storage changes in the Tibetan Plateau and adjacent areas revealed from GRACE satellite gravity data. Earth Planet Sci Lett. 2016, 449, 228–239. [Google Scholar] [CrossRef]
- Yao, T.; Bolch, T.; Chen, D.; Gao, J.; Immerzeel, W.; Piao, S.; Su, F.; Thompson, L.; Wada, Y.; Wang, L. The imbalance of the Asian water tower. Nat. Rev. Earth Environ. 2022, 3, 618–632. [Google Scholar] [CrossRef]
- Tian, F.; Nan, Y.; Ni, G.; Yang, L.; Tang, Q.; Grey, D. Is the Tibetan Plateau really a water tower? Hydrol. Processes. 2024, 38, e15103. [Google Scholar] [CrossRef]
- Chen, W.; Liu, Y.; Zhang, G.; Yang, K.; Zhou, T.; Wang, J.; Shum, C.K. What Controls Lake Contraction and Then Expansion in Tibetan Plateau’s Endorheic Basin Over the Past Half Century? Geophys. Res. Lett. 2022, 49. [Google Scholar] [CrossRef]
- Immerzeel, W.W.; Lutz, A.F.; Andrade, M.; Bahl, A.; Biemans, H.; Bolch, T.; Hyde, S.; Brumby, S.; Davies, B.; Elmore, A. Importance and vulnerability of the world’s water towers. Nature. 2020, 577, 364–369. [Google Scholar] [CrossRef]
- Yao, F.; Livneh, B.; Rajagopalan, B.; Wang, J.; Crétaux, J.-F.; Wada, Y.; Berge-Nguyen, M. Satellites reveal widespread decline in global lake water storage. Science. 2023, 380, 743–749. [Google Scholar] [CrossRef]
- Zhang, G.; Luo, W.; Chen, W.; Zheng, G. A robust but variable lake expansion on the Tibetan Plateau. Sci. Bull. 2019, 64, 1306–1309. [Google Scholar] [CrossRef]
- Li, M.; Weng, B.; Yan, D.; Bi, W.; Wang, H. Variation trends and attribution analysis of lakes in the Qiangtang Plateau, the Endorheic Basin of the Tibetan Plateau. Sci. Total Environ. 2022, 837, 155595. [Google Scholar] [CrossRef] [PubMed]
- Zhang, G.; Yao, T.; Shum, C.; Yi, S.; Yang, K.; Xie, H.; Feng, W.; Bolch, T.; Wang, L.; Behrangi, A. Lake volume and groundwater storage variations in Tibetan Plateau's endorheic basin. Geophys. Res. Lett. 2017, 44, 5550–5560. [Google Scholar] [CrossRef]
- Lei, Y.; Yang, K.; Wang, B.; Sheng, Y.; Bird, B.W.; Zhang, G.; Tian, L. Response of inland lake dynamics over the Tibetan Plateau to climate change. Clim Change. 2014, 125, 281–290. [Google Scholar] [CrossRef]
- Zhu, L.; Xie, M.; Wu, Y. Quantitative analysis of lake area variations and the influence factors from 1971 to 2004 in the Nam Co basin of the Tibetan Plateau. Chinese Sci. Bull. 2010, 55, 1294–1303. [Google Scholar] [CrossRef]
- YB, L.; CL, Y.; WC, W.; YW, S.; JL, L.; Lei, Y. Glacier mass loss induced the rapid growth of Linggo Co on the central Tibetan Plateau. J. Glaciol. 2012, 58, 177–184. [Google Scholar] [CrossRef]
- Xu, F.; Zhang, G.; Woolway, R.I.; Yang, K.; Wada, Y.; Wang, J.; Crétaux, J.-F. Widespread societal and ecological impacts from projected Tibetan Plateau lake expansion. Nat. Geosci. 2024, 1–8. [Google Scholar] [CrossRef]
- Guo, W.; Liu, S.; Xu, J.; Wu, L.; Shangguan, D.; Yao, X.; Wei, J.; Bao, W.; Yu, P.; Liu, Q.; et al. The second Chinese glacier inventory: data, methods and results. J. Glaciol. 2015, 61, 357–372. [Google Scholar] [CrossRef]
- Lehner, B.; Grill, G. Global river hydrography and network routing: baseline data and new approaches to study the world's large river systems. Hydrol. Processes. 2013, 27, 2171–2186. [Google Scholar] [CrossRef]
- Guoqing, Z. China lake dataset (1960s-2020). 2019. [CrossRef]
- Zhao, R.; Fu, P.; Zhou, Y.; Xiao, X.; Grebby, S.; Zhang, G.; Dong, J. Annual 30-m big Lake Maps of the Tibetan Plateau in 1991–2018. Sci Data. 2022, 9. [Google Scholar] [CrossRef]
- Zhang, G.; Yao, T.; Chen, W.; Zheng, G.; Shum, C.; Yang, K.; Piao, S.; Sheng, Y.; Yi, S.; Li, J. Regional differences of lake evolution across China during 1960s–2015 and its natural and anthropogenic causes. Remote Sens Environ. 2019, 221, 386–404. [Google Scholar] [CrossRef]
- Sun, J.; Yang, K.; Guo, W.; Wang, Y.; He, J.; Lu, H. Why Has the Inner Tibetan Plateau Become Wetter since the Mid-1990s? J. Clim. 2020, 33, 8507–8522. [Google Scholar] [CrossRef]
- Liu, S.; Yao, X.; Guo, W.; Xu, J.; Shangguan, D.; Wei, J.; Bao, W.; Wu, L. The contemporary glaciers in China based on the Second Chinese Glacier Inventory. Acta Geogr Sin 2015, 70, 3–16. [Google Scholar] [CrossRef]
- Li, H.; Wang, X.; Choy, S.; Wu, S.; Jiang, C.; Zhang, J.; Qiu, C.; Li, L.; Zhang, K. A new cumulative anomaly-based model for the detection of heavy precipitation using GNSS-derived tropospheric products. IEEE Trans Geosci Remote Sens. 2021, 60, 1–18. [Google Scholar] [CrossRef]
- Lozowski, E.; Charlton, R.; Nguyen, C.; Wilson, J. The use of cumulative monthly mean temperature anomalies in the analysis of local interannual climate variability. J. Clim. 1989, 1059–1068. [Google Scholar] [CrossRef]
- Lei, Y.; Zhu, Y.; Wang, B.; Yao, T.; Yang, K.; Zhang, X.; Zhai, J.; Ma, N. Extreme lake level changes on the Tibetan Plateau associated with the 2015/2016 El Niño. Geophys. Res. Lett. 2019, 46, 5889–5898. [Google Scholar] [CrossRef]
- Zhang, G.; Yao, T.; Xie, H.; Yang, K.; Zhu, L.; Shum, C.K.; Bolch, T.; Yi, S.; Allen, S.; Jiang, L.; et al. Response of Tibetan Plateau lakes to climate change: Trends, patterns, and mechanisms. Earth-Sci. Rev. 2020, 208. [Google Scholar] [CrossRef]
- Lei, Y.; Yang, K. The cause of rapid lake expansion in the Tibetan Plateau: climate wetting or warming? WIREs Water. 2017, 4, e1236. [Google Scholar] [CrossRef]
- Liu, W.-h.; Xie, C.-w.; Zhao, L.; Wu, T.-h.; Wang, W.; Zhang, Y.-x.; Yang, G.-q.; Zhu, X.-f.; Yue, G.-y. Dynamic changes in lakes in the Hoh Xil region before and after the 2011 outburst of Zonag Lake. J Mt Sci. 2019, 16, 1098–1110. [Google Scholar] [CrossRef]
- Wang, X.; Siegert, F.; Zhou, A.-g.; Franke, J. Glacier and glacial lake changes and their relationship in the context of climate change, Central Tibetan Plateau 1972–2010. Glob Planet Change. 2013, 111, 246–257. [Google Scholar] [CrossRef]
- LIU, L.; JIANG, L.; XIANG, L.; WANG, H.; SUN, Y.; XU, H. The effect of glacier melting on lake volume change in the Siling Co basin (5Z2), Tibetan Plateau. Chin. J. Geophys. 2019, 62, 1603–1612. [Google Scholar] [CrossRef]
- Chen, B.; Xu, X.-D.; Yang, S.; Zhang, W. On the origin and destination of atmospheric moisture and air mass over the Tibetan Plateau. Theor Appl Climatol. 2012, 110, 423–435. [Google Scholar] [CrossRef]
- TIAN, L.; YAO, T.; NUMAGUTI, A. Rainfall stable isotope fluctuation and the water vapor transport process in the southern Qinghai-Tibet Plateau monsoon. Sci China D. 2001, 31, 215–220. [Google Scholar] [CrossRef]
- Xu, K.; Zhong, L.; Ma, Y.; Zou, M.; Huang, Z. A study on the water vapor transport trend and water vapor source of the Tibetan Plateau. Theor Appl Climatol. 2020, 140, 1031–1042. [Google Scholar] [CrossRef]
- Xinru, X.; Qinglong, Y.; Yuntao, B.; Xianhong, M. The connection between the precipitation and water vapor transport over Qinghai-Tibetan Plateau in summer based on the multiple datasets. Plateau Meteorology. 2018, 37, 78–92. [Google Scholar] [CrossRef]
- Li, Y.; Su, F.; Chen, D.; Tang, Q. Atmospheric water transport to the endorheic Tibetan Plateau and its effect on the hydrological status in the region. J. Geophys. Res.:Atmos. 2019, 124, 12864–12881. [Google Scholar] [CrossRef]
- Hu, L.; Xiaoduo, P. An Overview of Research Methods on Water Vapor Transport and Sources in the Tibetan Plateau. Advances in Earth Science 2022, 37, 1025. [Google Scholar] [CrossRef]
- Gao, Y.; Cuo, L.; Zhang, Y. Changes in moisture flux over the Tibetan Plateau during 1979–2011 and possible mechanisms. J. Clim. 2014, 27, 1876–1893. [Google Scholar] [CrossRef]
- Wortmann, M.; Bolch, T.; Menz, C.; Tong, J.; Krysanova, V. Comparison and correction of high-mountain precipitation data based on glacio-hydrological modeling in the Tarim River headwaters (High Asia). J Hydrometeorol. 2018, 19, 777–801. [Google Scholar] [CrossRef]
- Qiao, B.; Zhu, L.; Yang, R. Temporal-spatial differences in lake water storage changes and their links to climate change throughout the Tibetan Plateau. Remote Sens Environ. 2019, 222, 232–243. [Google Scholar] [CrossRef]
Figure 1.
The location of the Changtang Plateau (CTP). Bold black solid lines denote the division of the CTP into 17 sub-basins. Red polygons denote locations of lakes, blue lines denote rivers and blue-white polygons denote glacier distribution. Black triangles denote locations of meteorological stations on CTP.
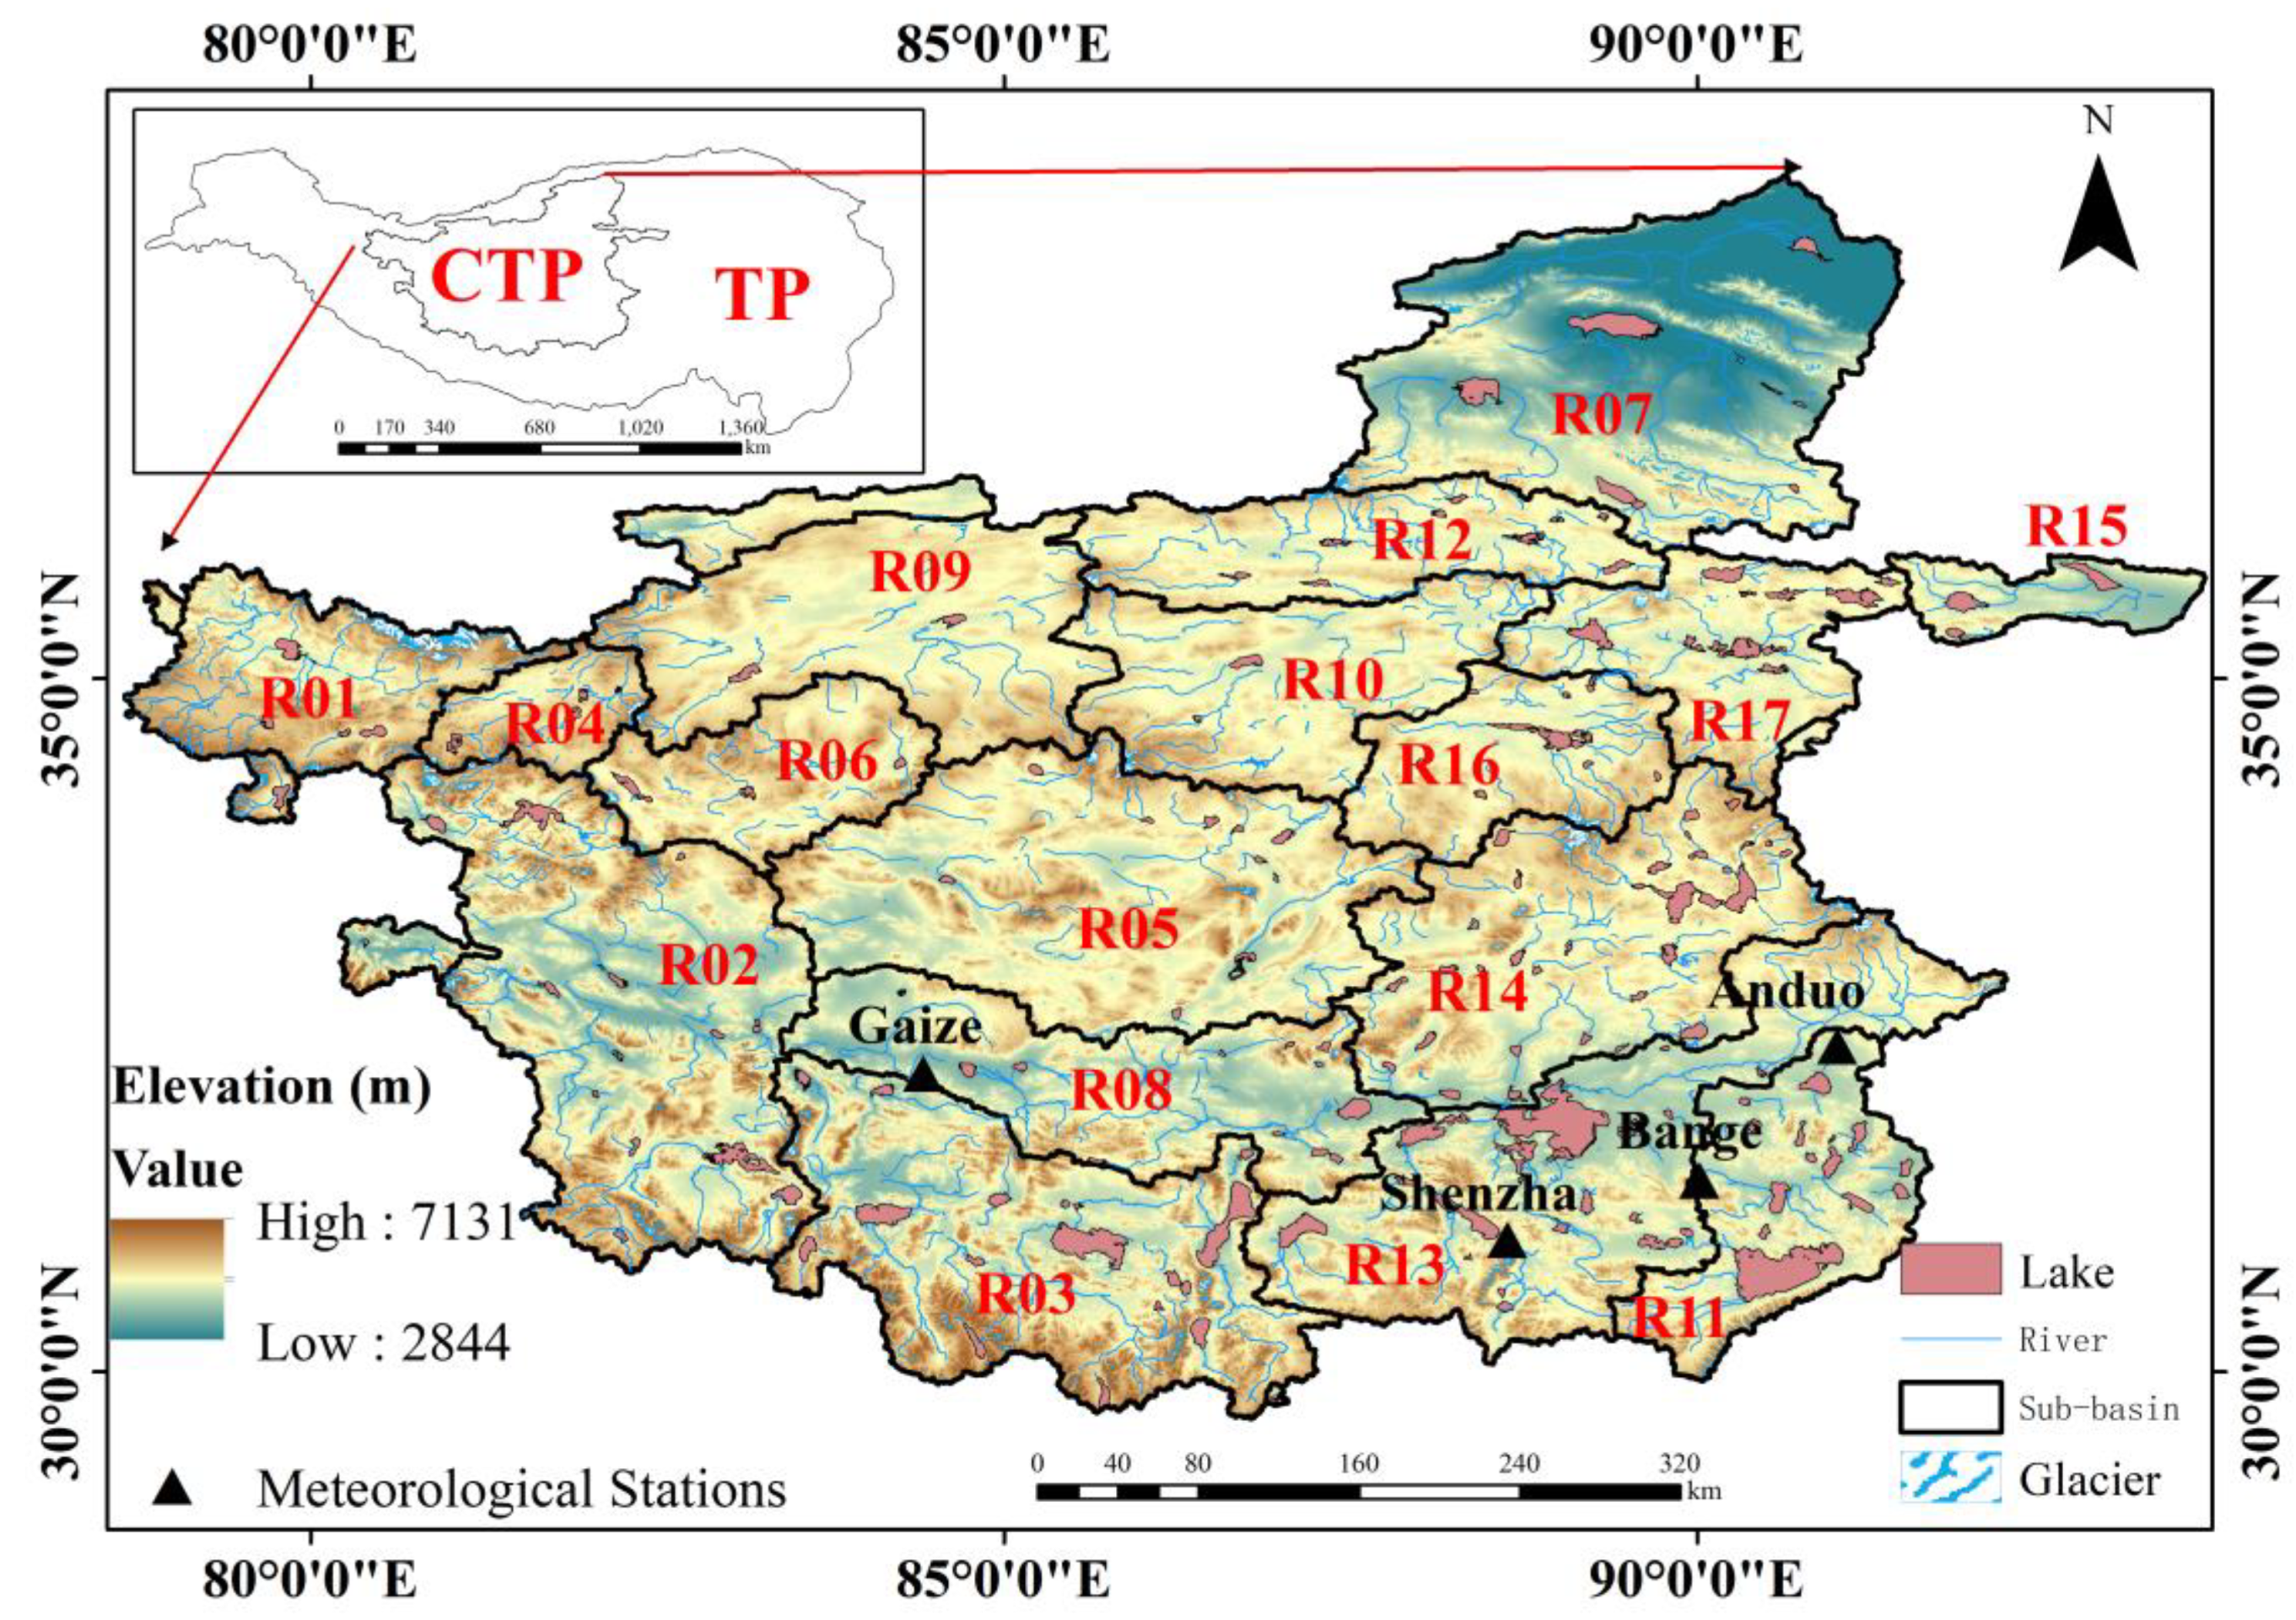
Figure 2.
Over the past 60 years (1960-2020): (a) changes in the total lake area on the CTP, (b) correlation between total lake area on the CTP and cumulative anomaly in regional average summer precipitation for the CTP (29°N to 38°N, 81°E to 92°E).
Figure 2.
Over the past 60 years (1960-2020): (a) changes in the total lake area on the CTP, (b) correlation between total lake area on the CTP and cumulative anomaly in regional average summer precipitation for the CTP (29°N to 38°N, 81°E to 92°E).
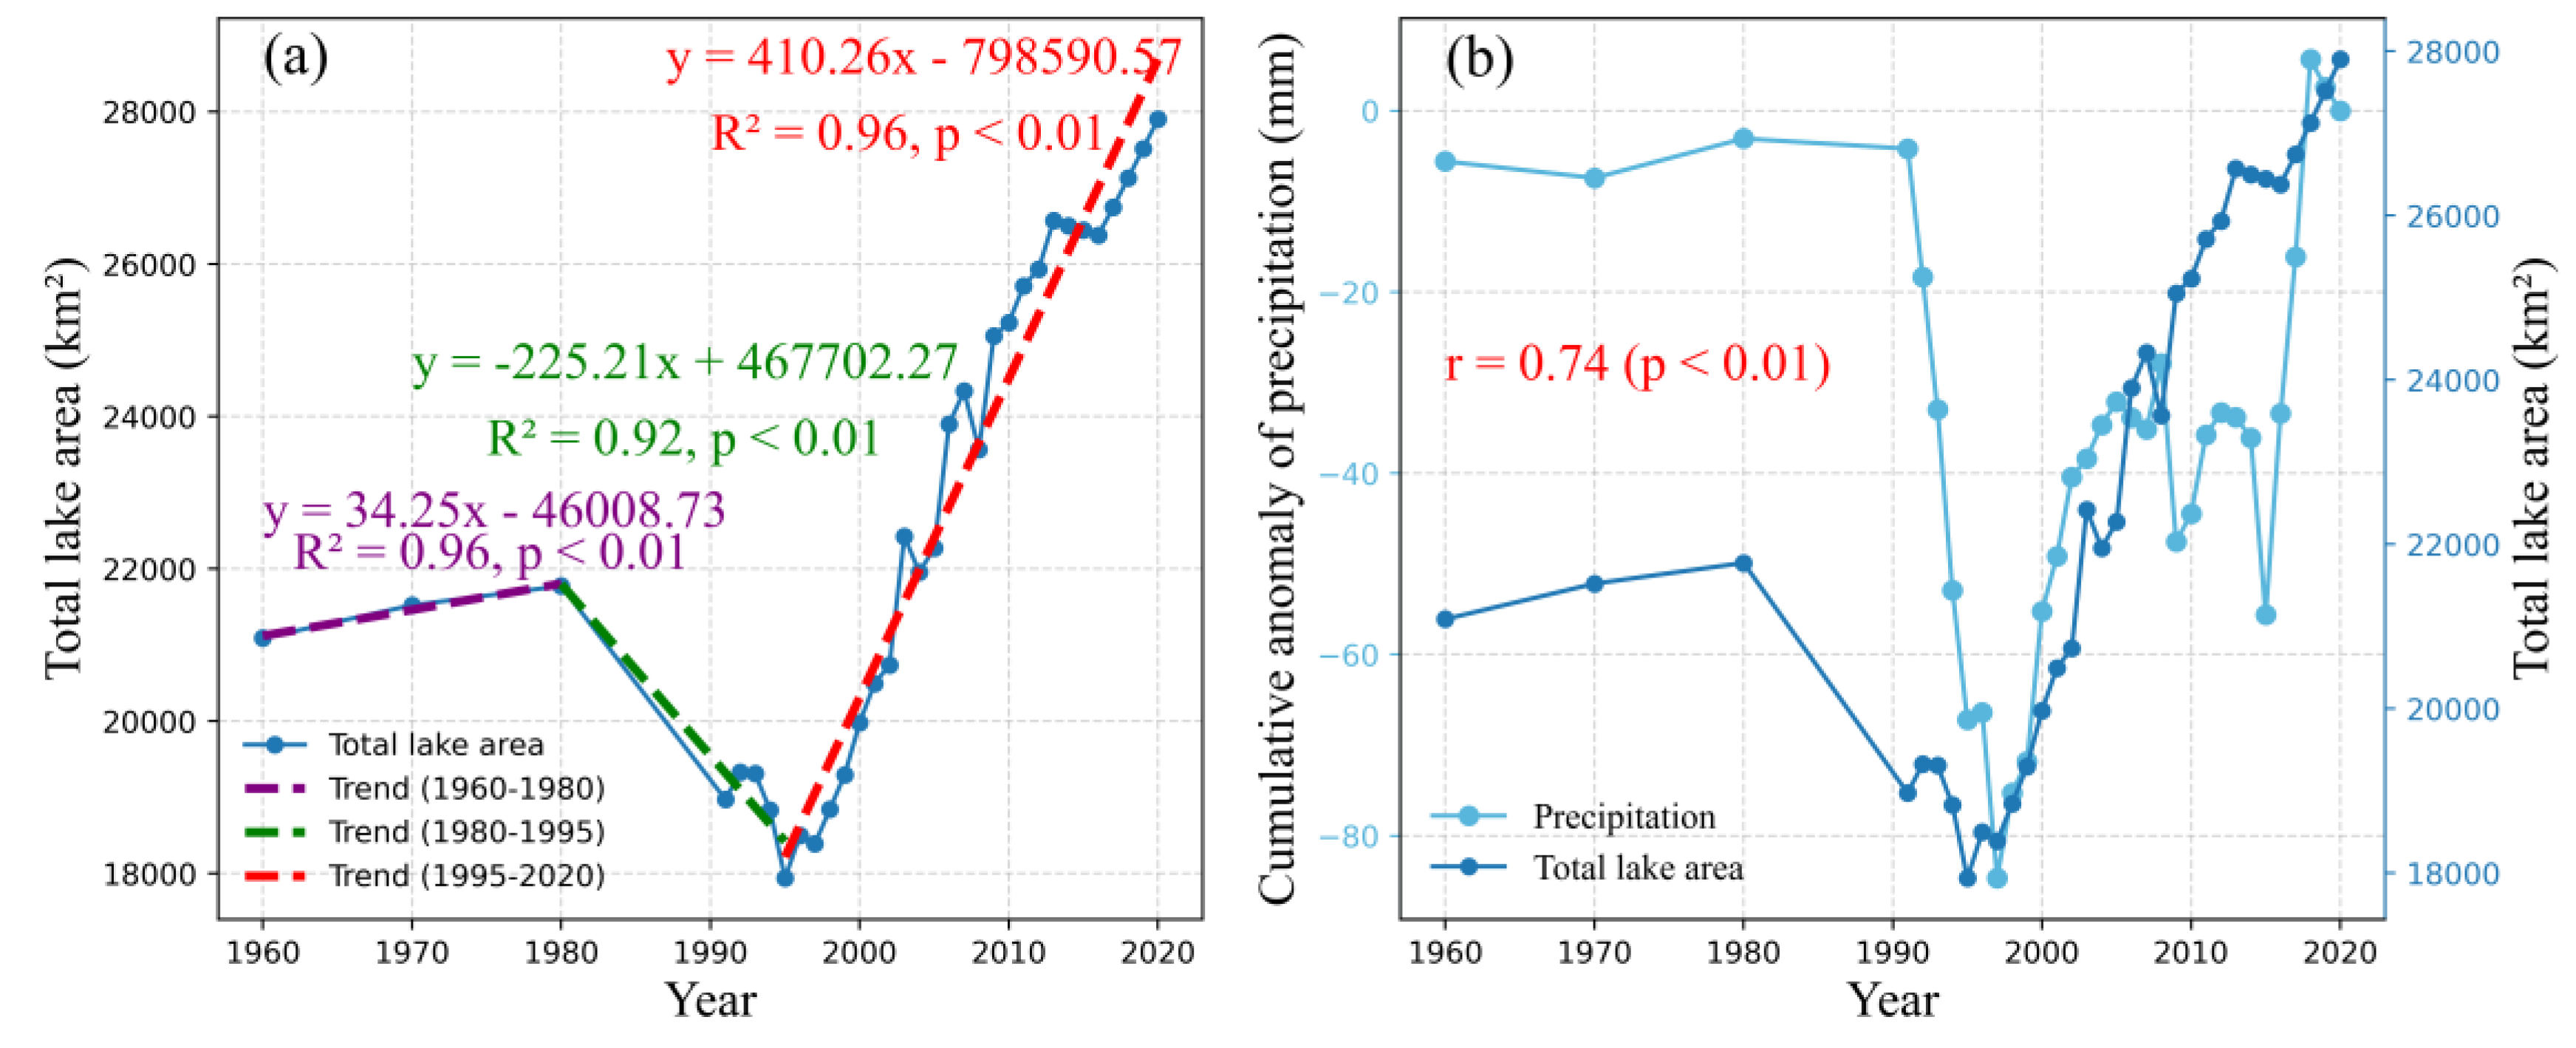
Figure 3.
Over the past 60 years (1960-2020) on the CTP: (a) changes in lake area in sub-basins R01-R09, (b) changes in lake area in sub-basins R10-R17, (c) changes in cumulative anomaly in regional average summer precipitation for sub-basins R01-R09, and (d) changes in cumulative anomaly in regional average summer precipitation for sub-basins R10-R17.
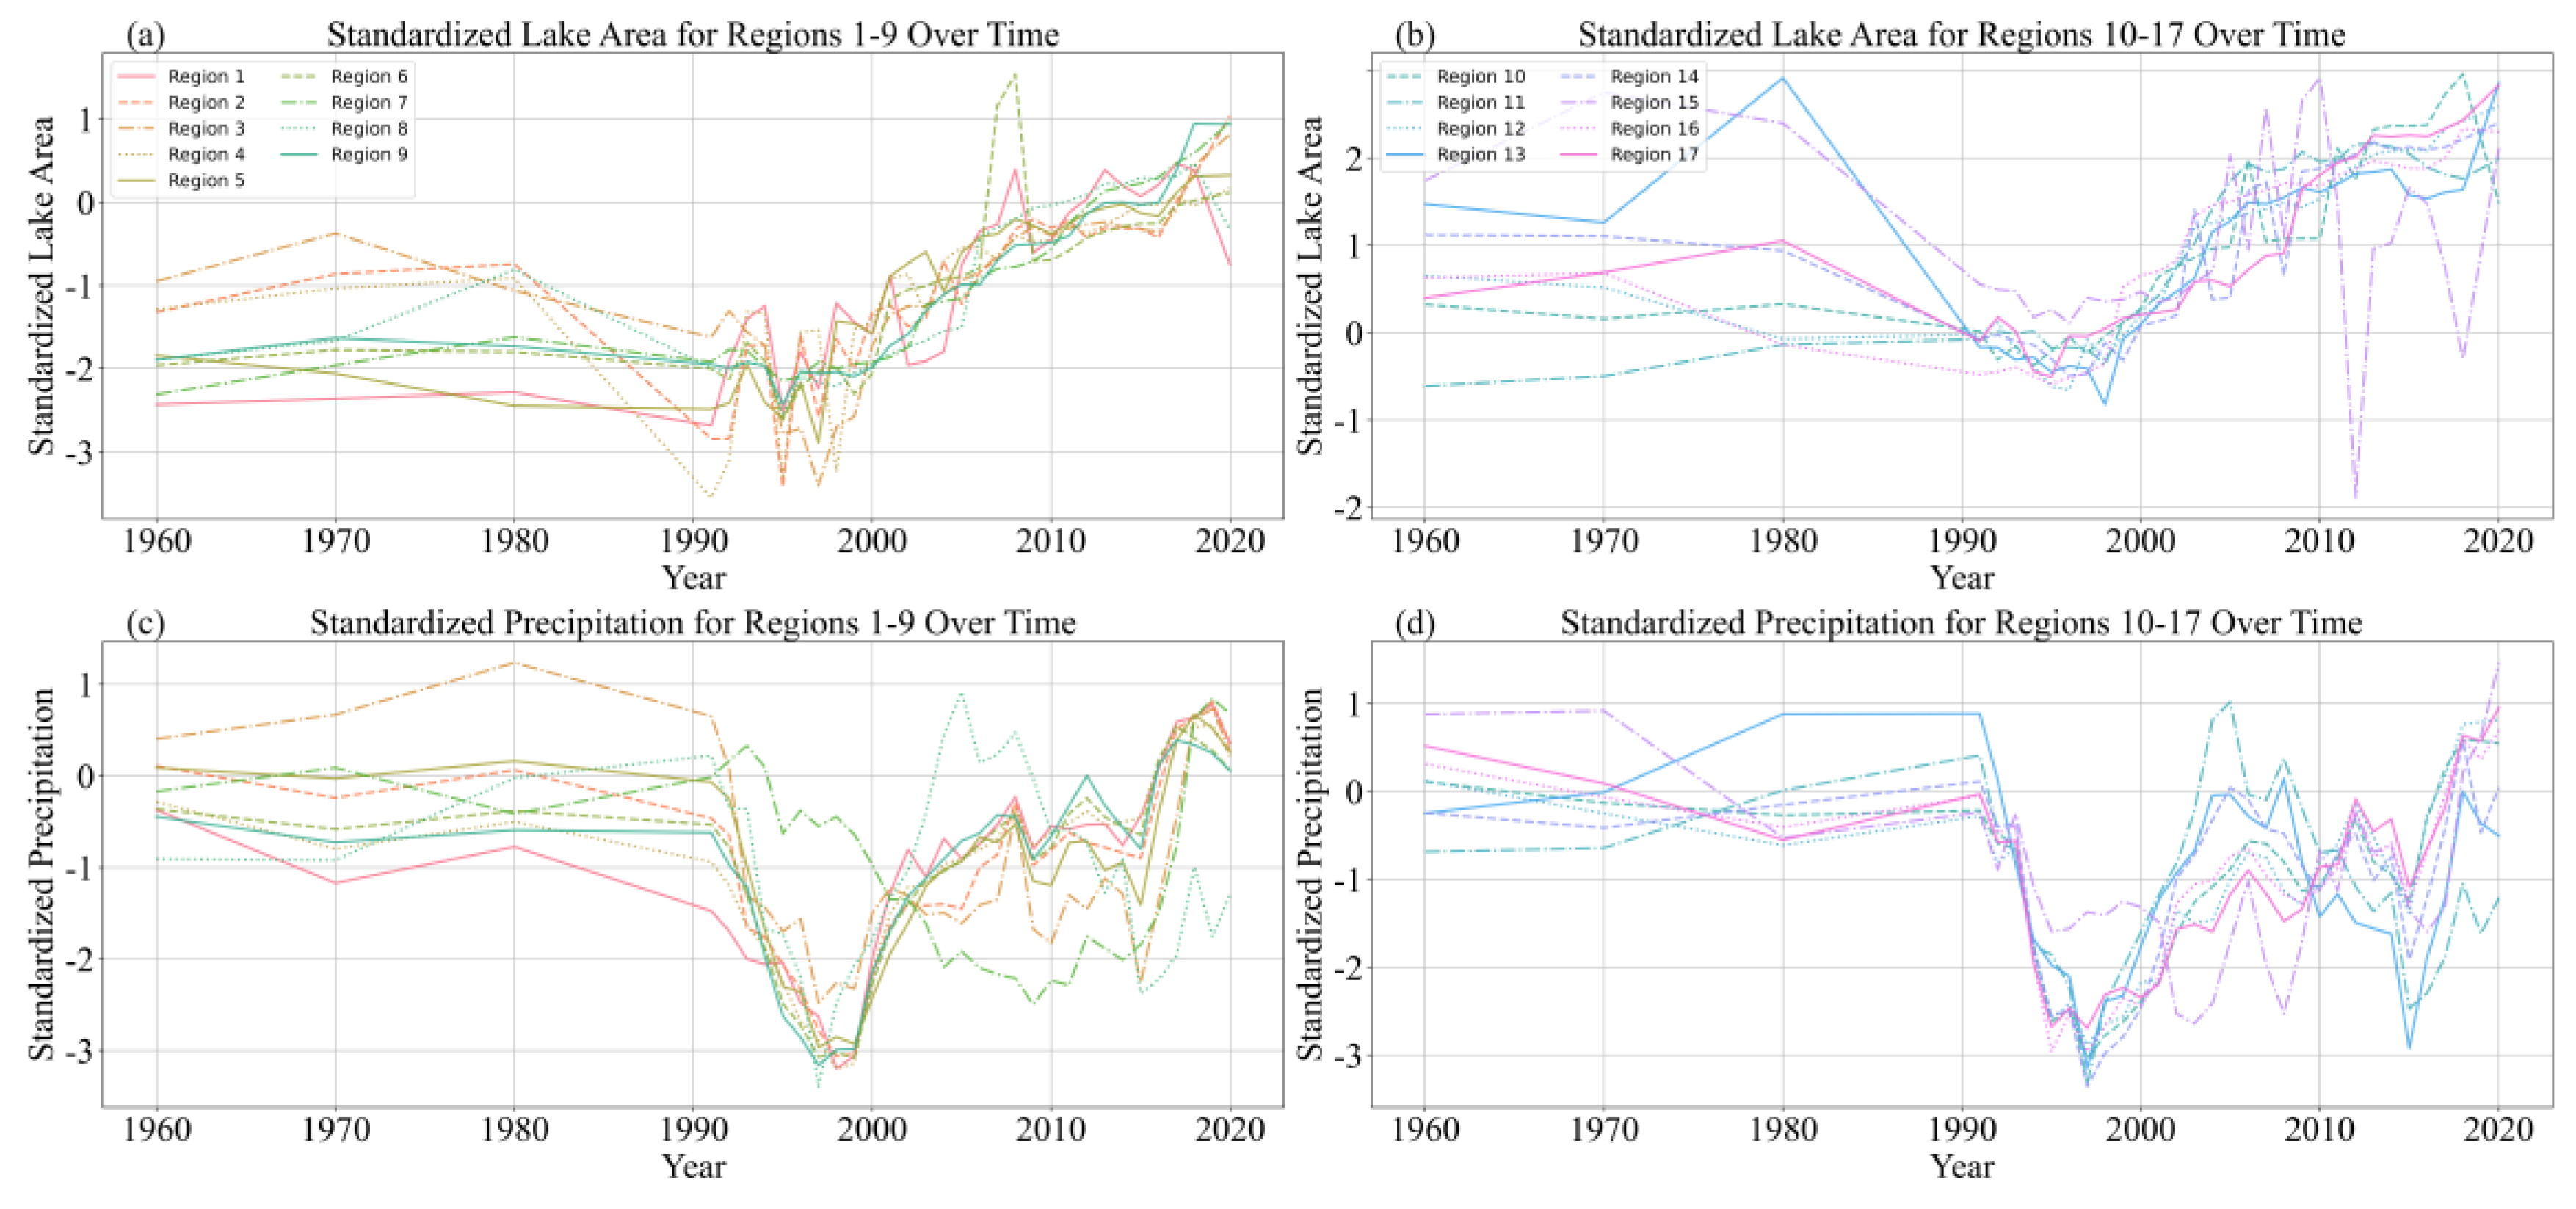
Figure 4.
The spatial distribution of the correlations between the area of 172 lakes and the corresponding regional average summer precipitation over the past 60 years. The range in the red dotted rectangle box indicates the distribution of the seven selected glacier regions.
Figure 4.
The spatial distribution of the correlations between the area of 172 lakes and the corresponding regional average summer precipitation over the past 60 years. The range in the red dotted rectangle box indicates the distribution of the seven selected glacier regions.
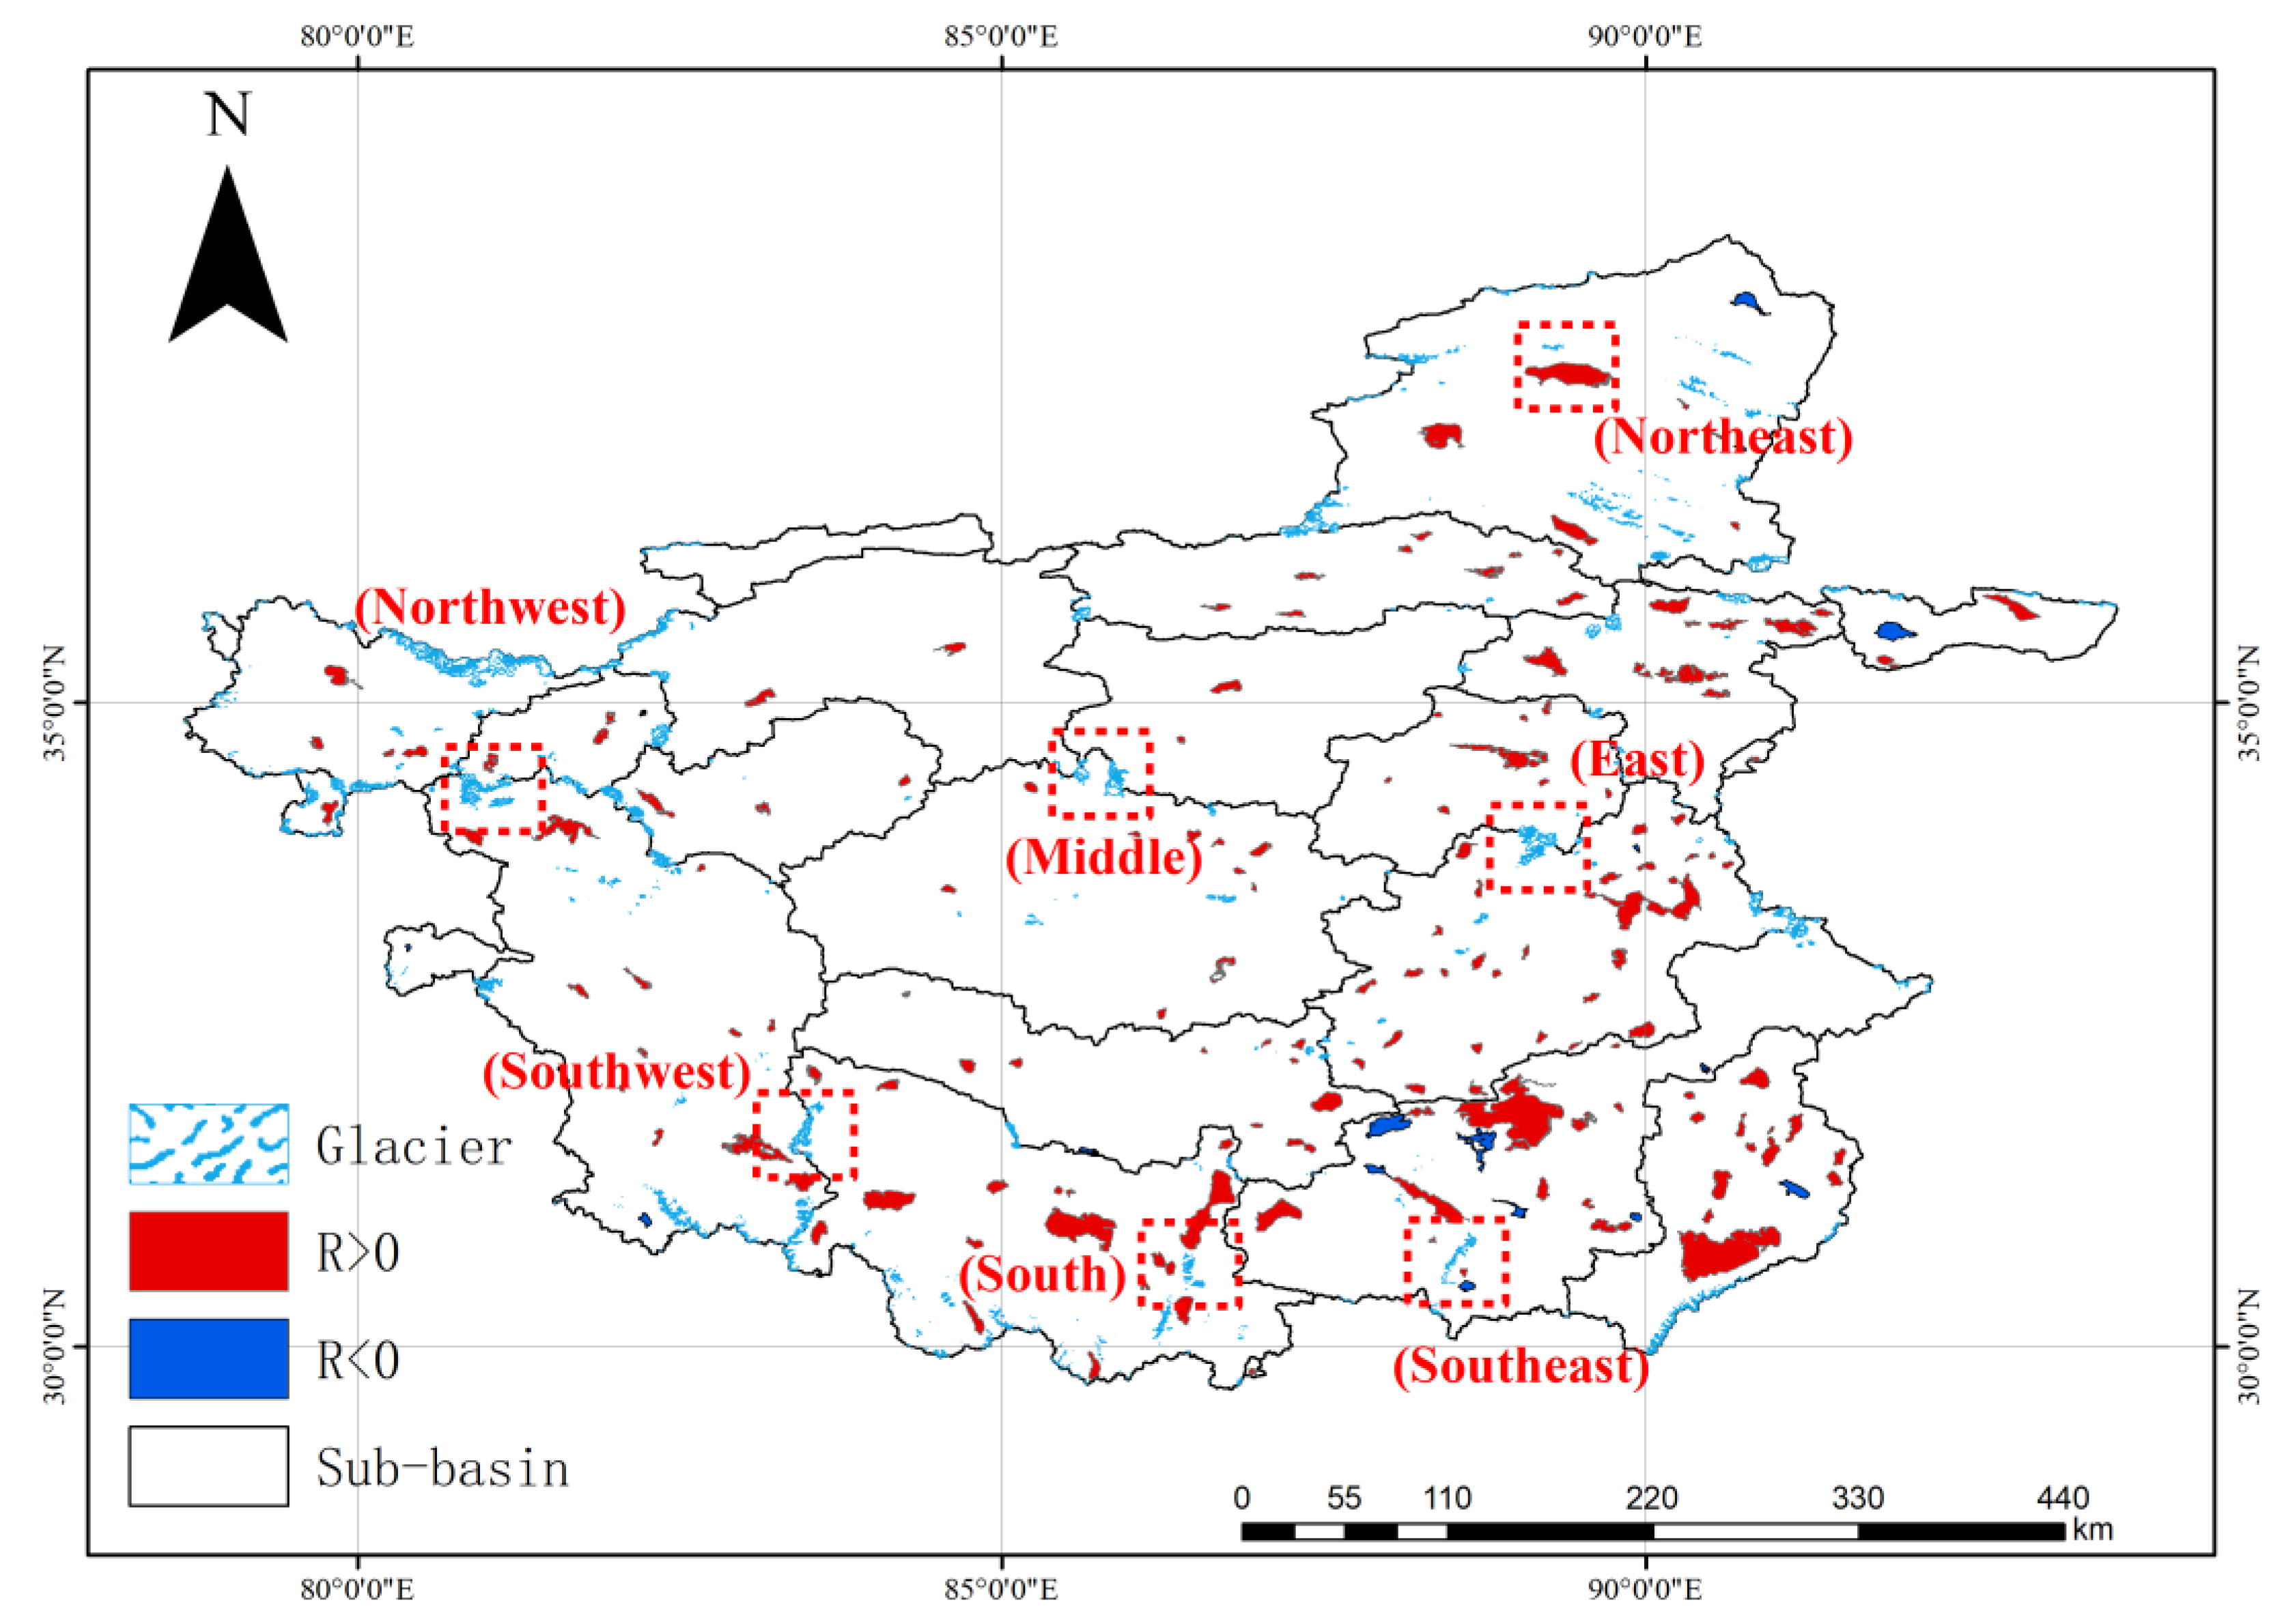
Figure 5.
Changes in the area of glaciers in each region and their relationship with the largest replenishing lake they feed over the past 60 years. Dots denote glacier area, and the solid line denotes the lake area: (a) Lake Ayakumu in the northeast, (b) Woerba Tso in the northwest, (c) Cangmu Tso in the southwest, (d) Yueqia Tso in the southeast, (e) Xuru Tso in the south, (f) Noname Lake in the middle region, and (g) Linggo Co in the east.
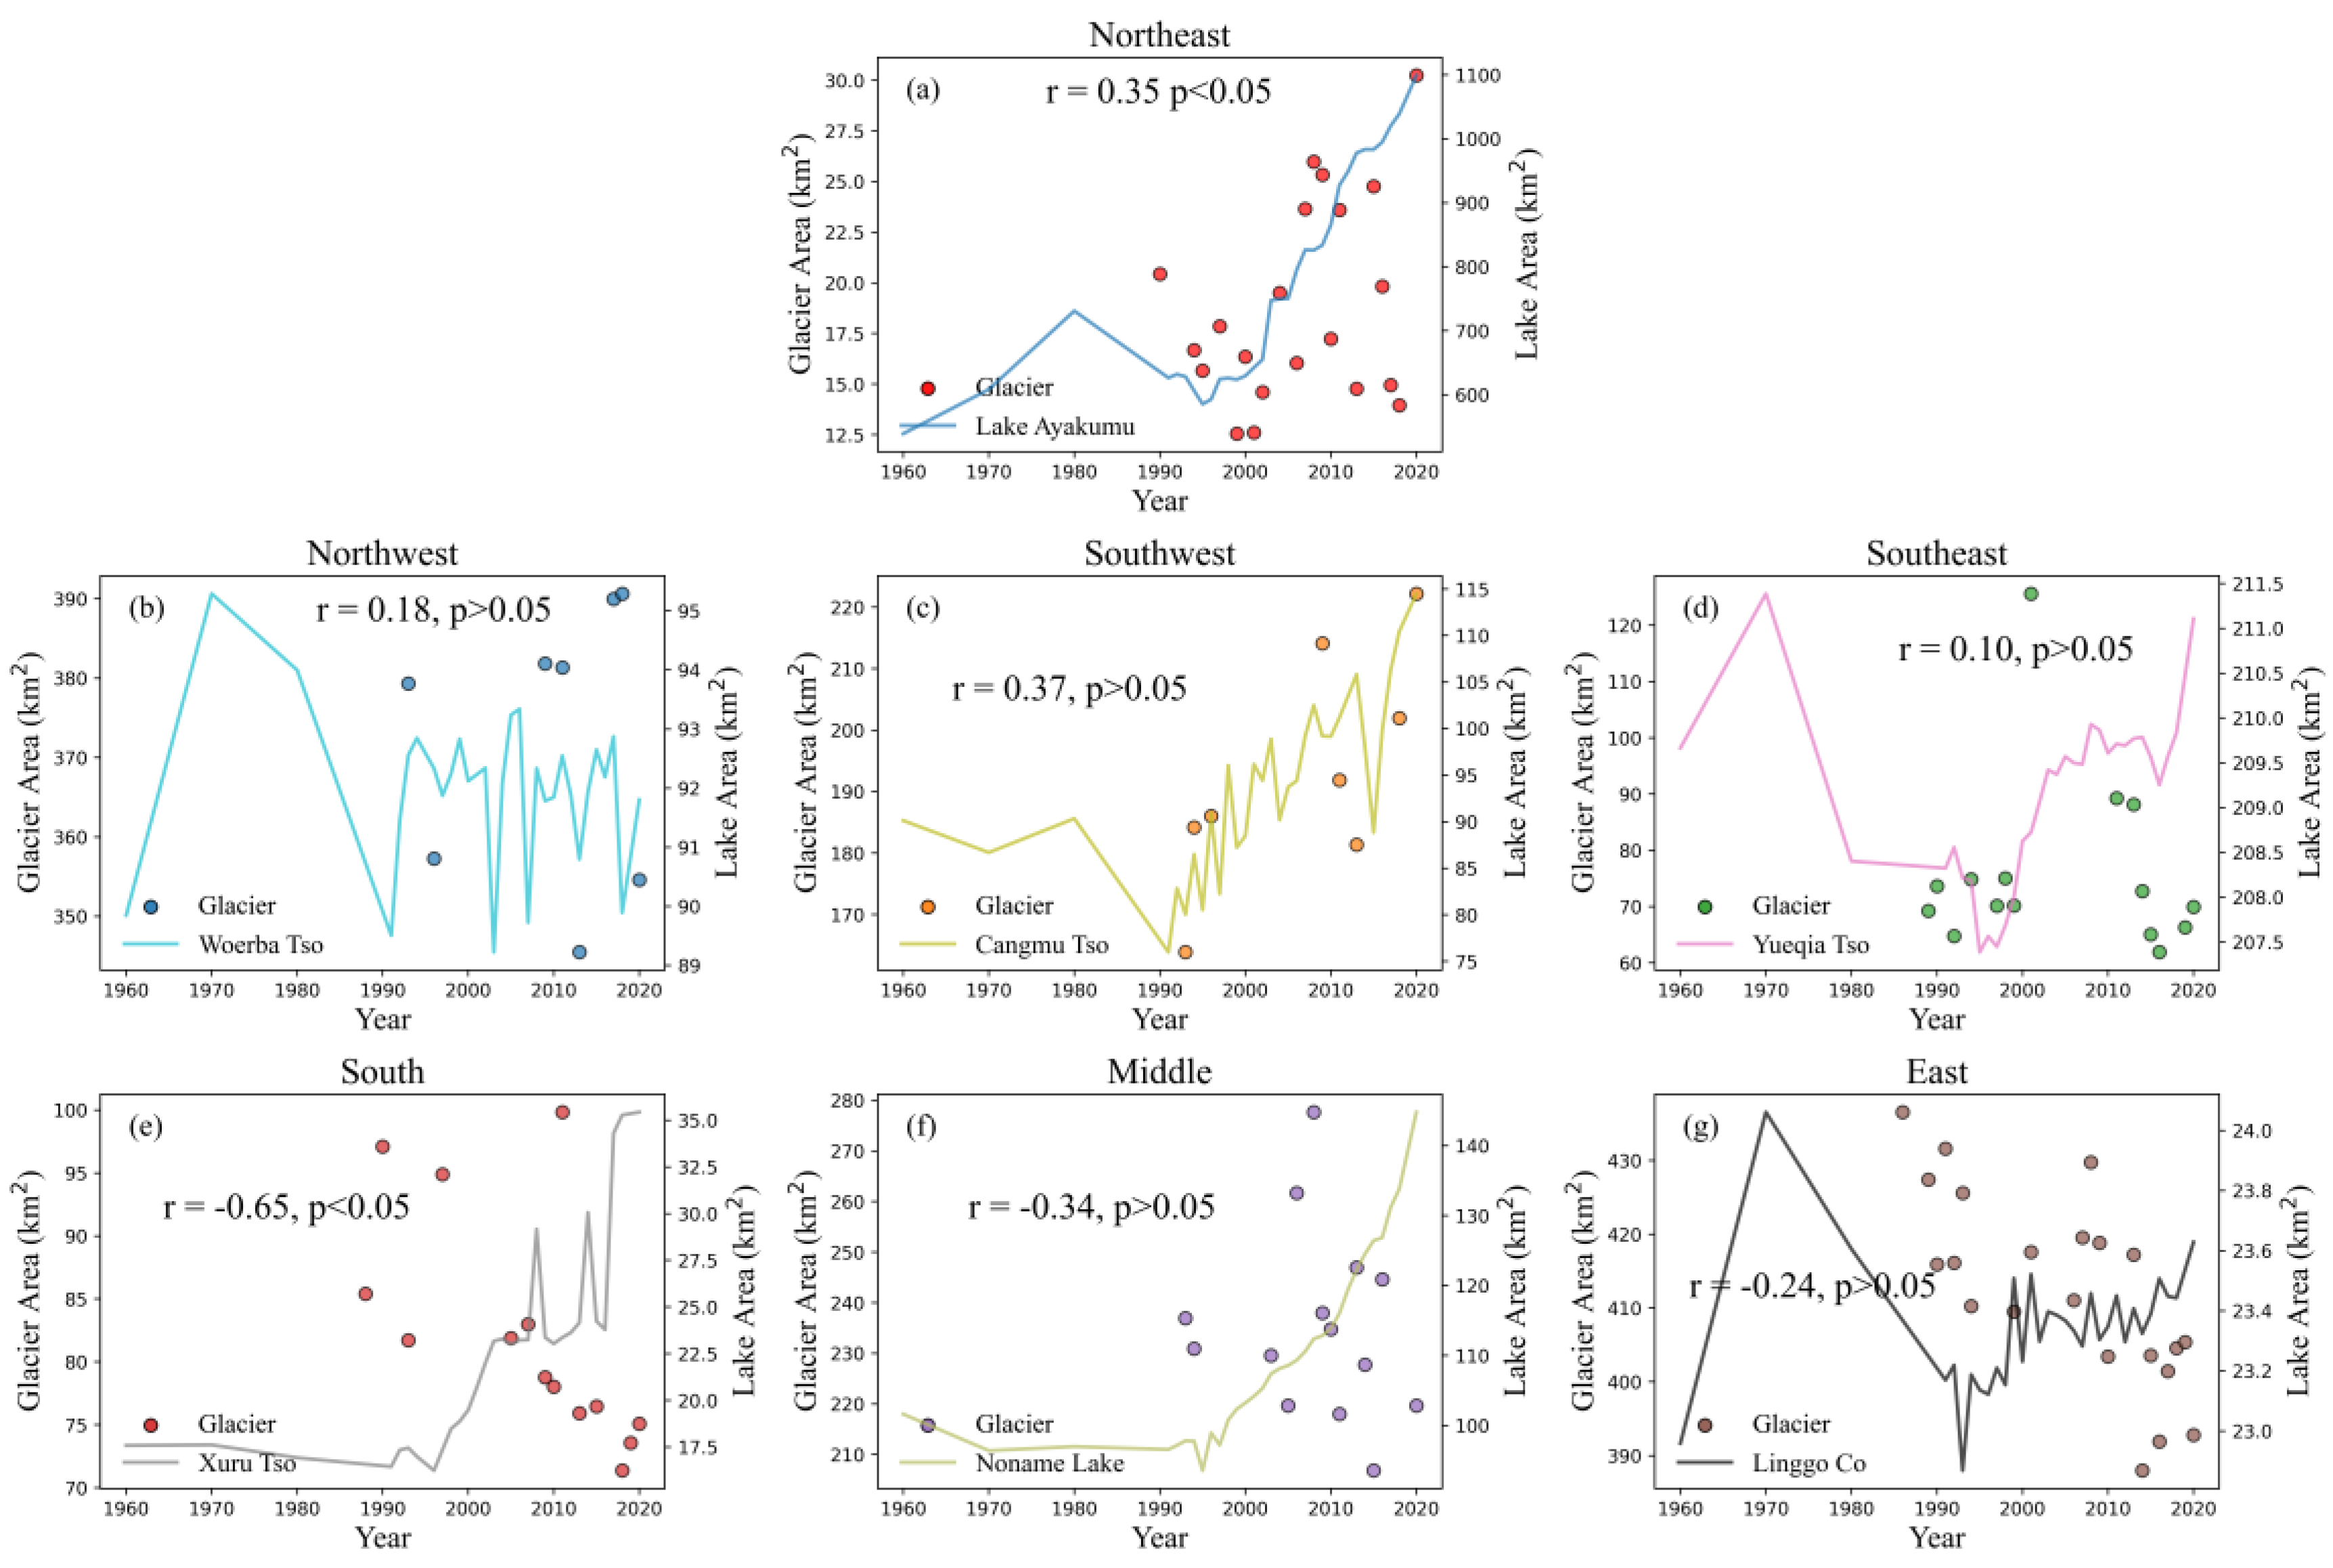
Figure 6.
(a) The relationship between summer 500 hPa specific humidity and precipitation, averaged over the CTP, from 1960 to 2020. (b) Composite 500 hpa summer specific humidity between higher (1999-2020) and lower (1960-1998) rainfall periods (the former minus the latter). The composite summer water vapor flux (c) and its divergence (d) integrated from 500 hPa to 200 hPa between higher (1999-2020) and lower (1960-1998) rainfall periods (the former minus the latter). Only vectors of the U or V components with differences significant at the 95% confidence level are plotted. The black dots indicate the differences are significant at the 95% confidence level.
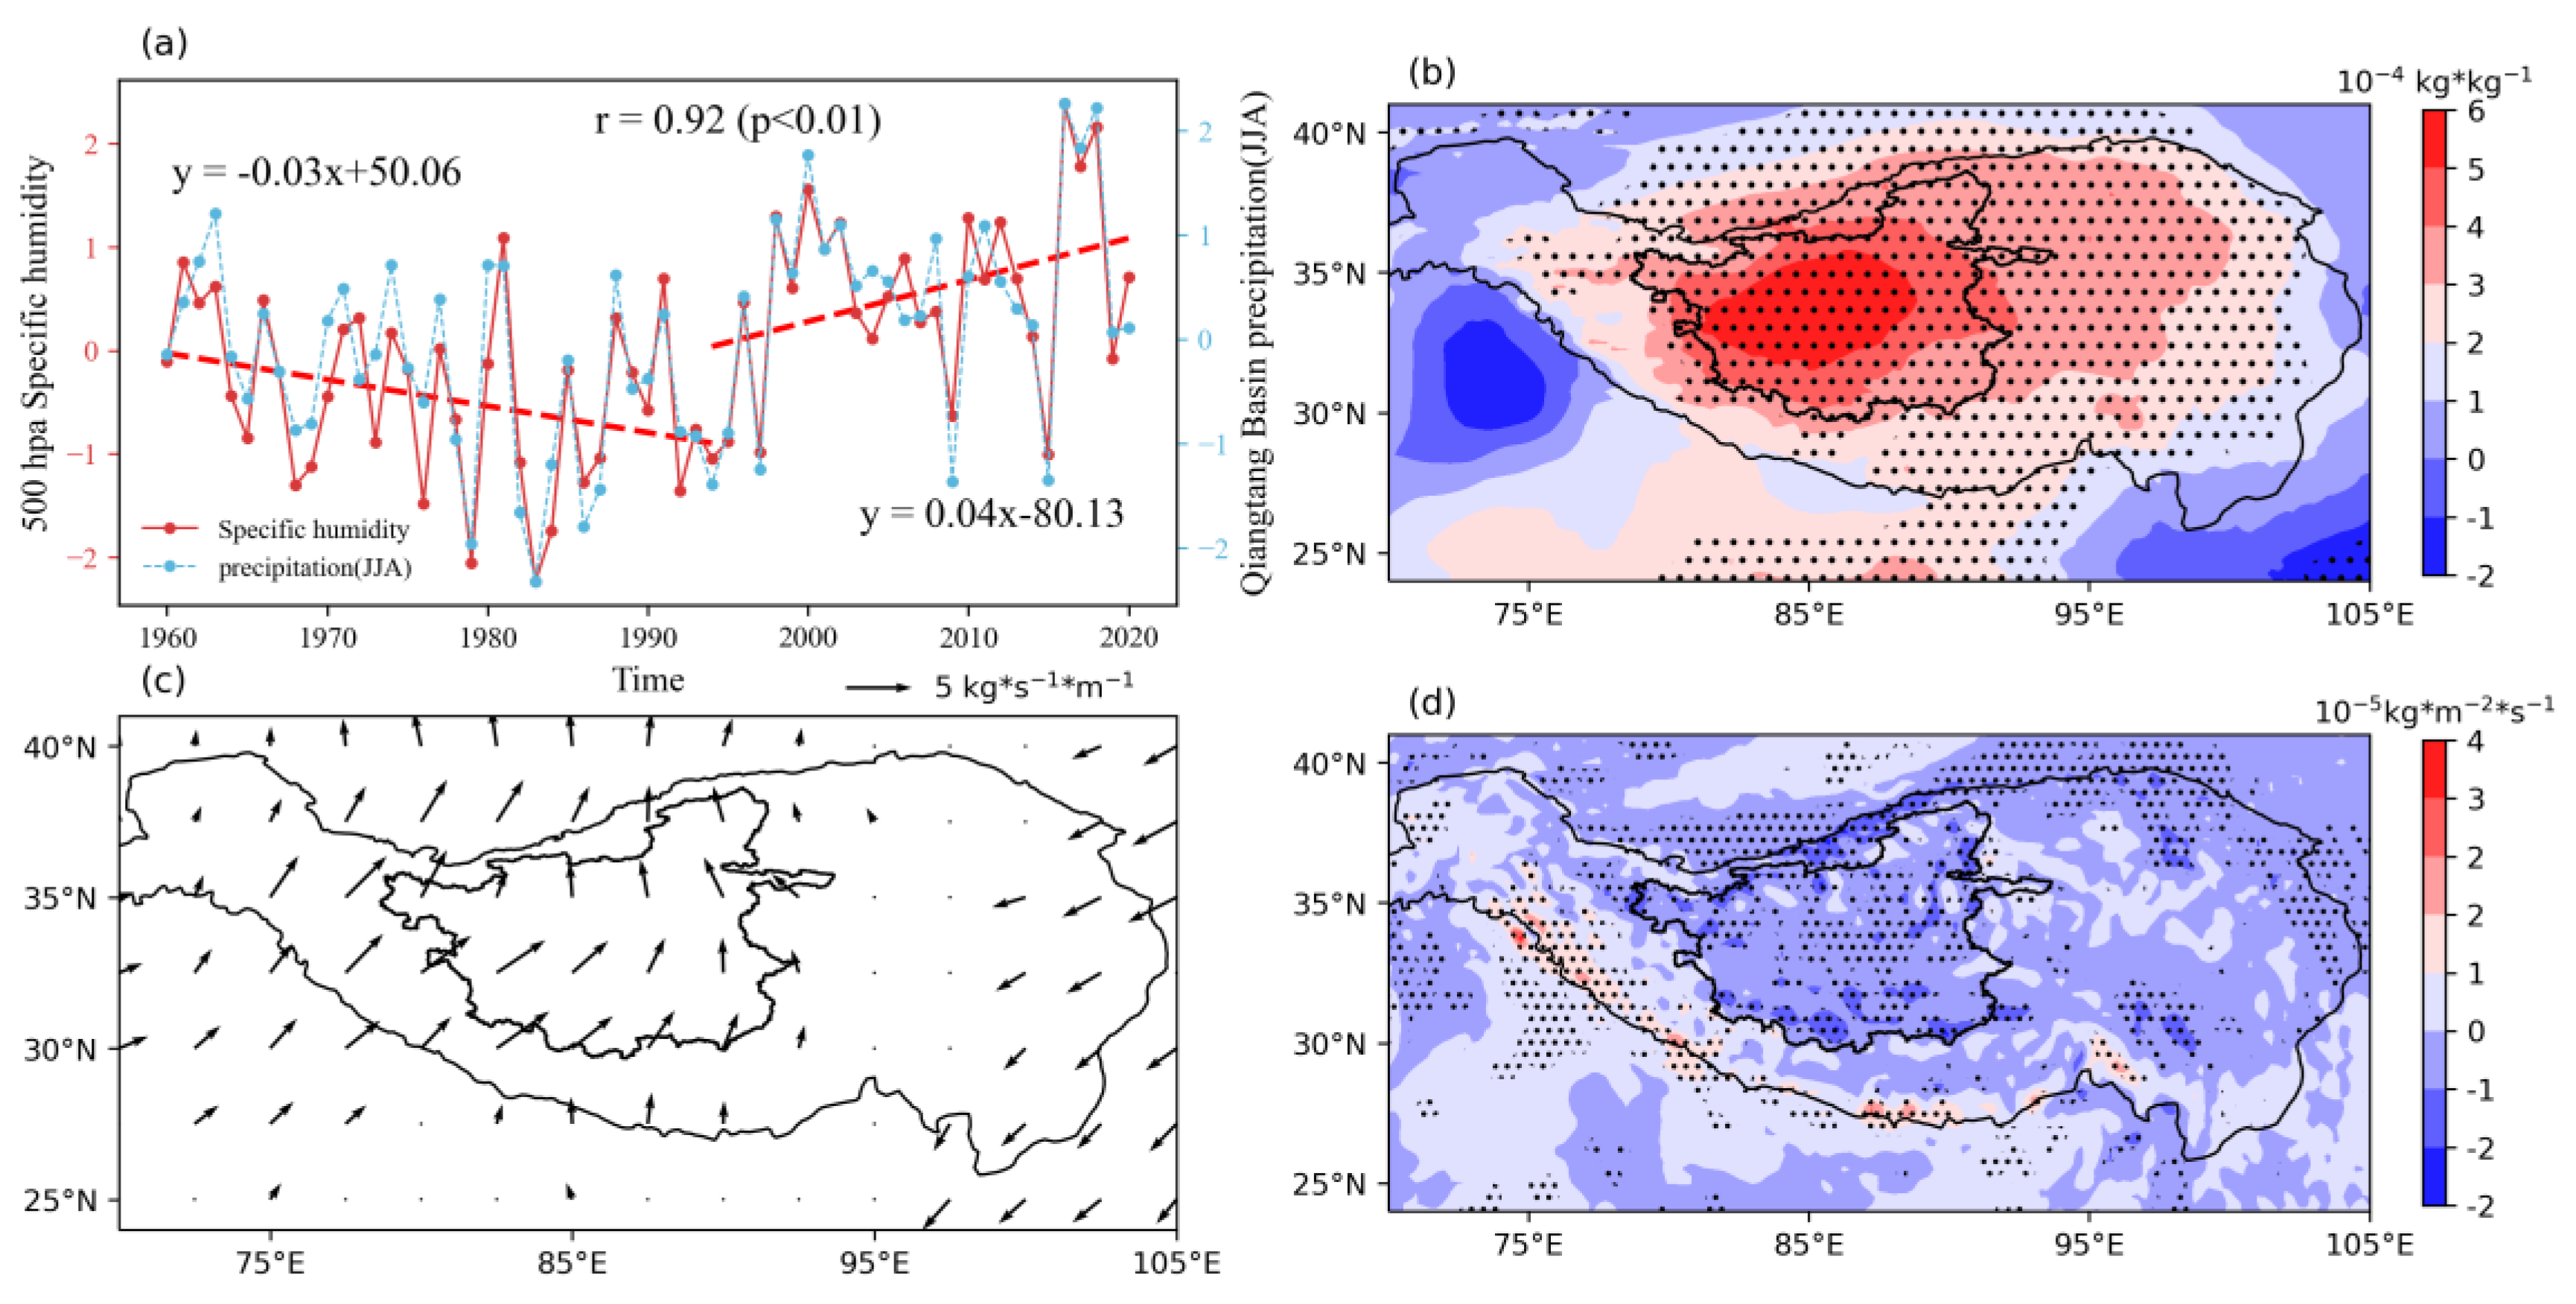
Figure 7.
The relationship between the intensity of the subtropical jet stream and summer 500 hPa (a) zonal wind; (b) specific humidity, averaged over the CTP from 1960 to 2020.
Figure 7.
The relationship between the intensity of the subtropical jet stream and summer 500 hPa (a) zonal wind; (b) specific humidity, averaged over the CTP from 1960 to 2020.
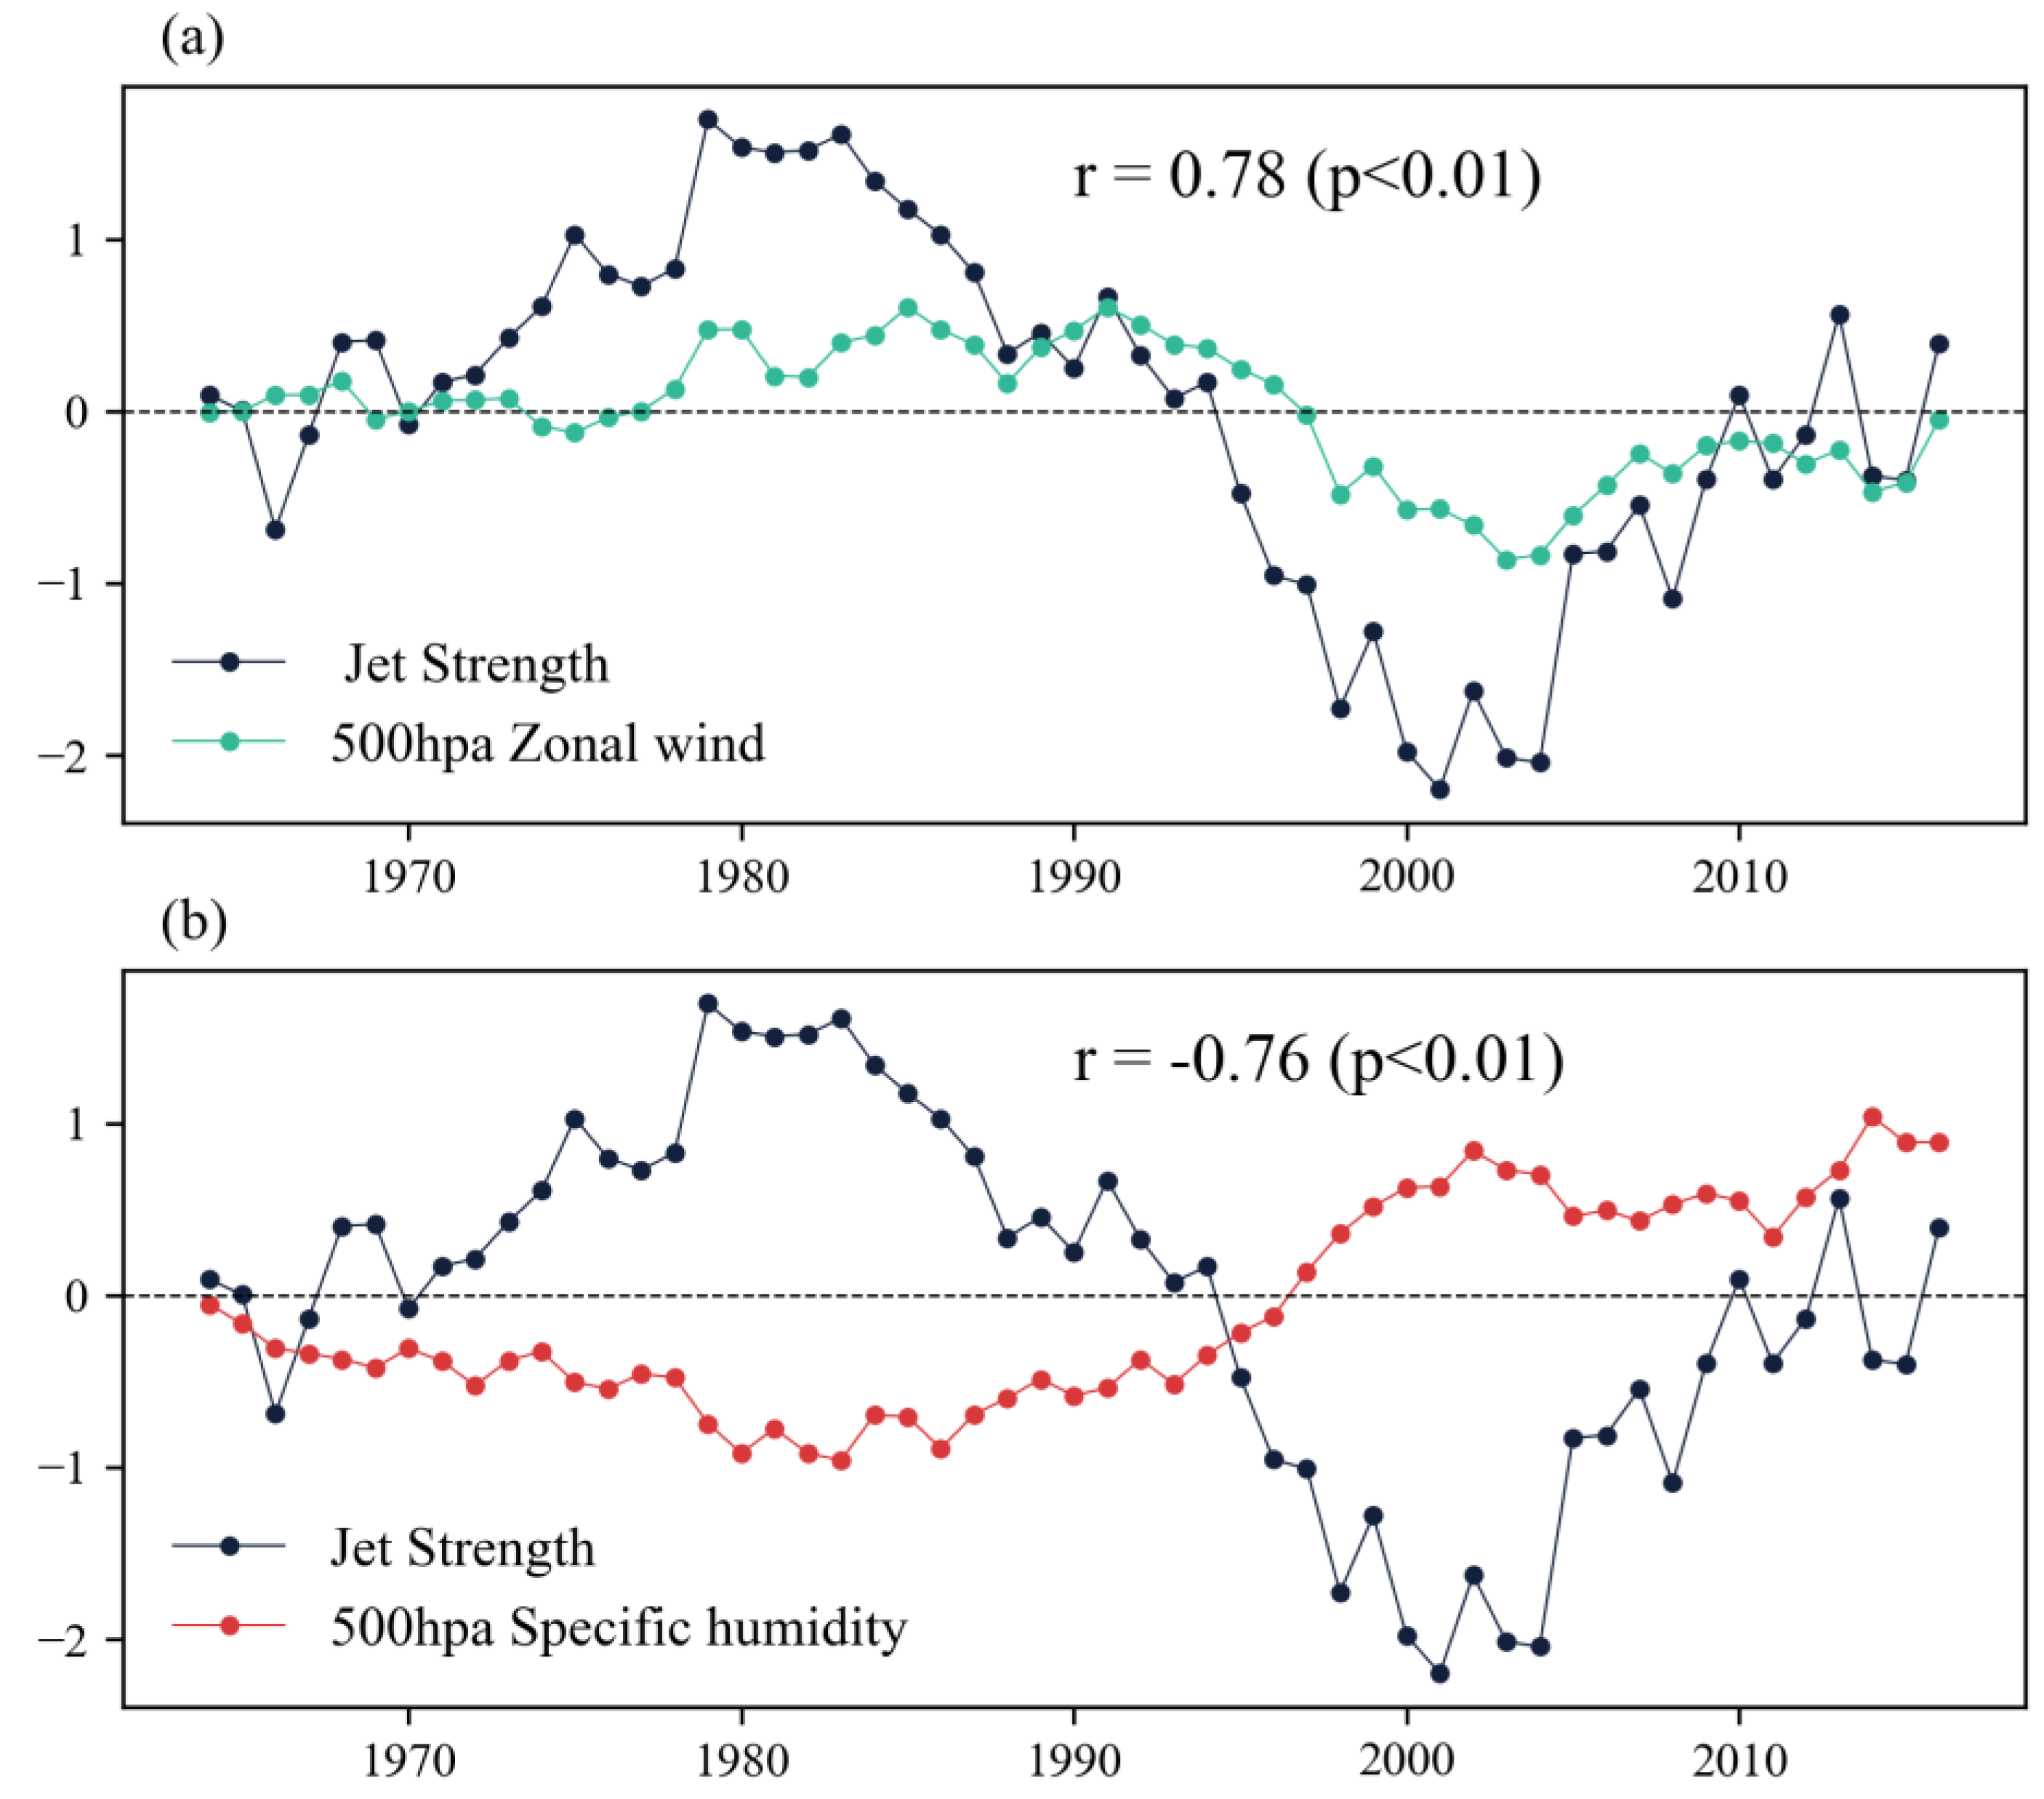
Figure 8.
Changes in summer (a) air temperature; (b) PET; (c) precipitation; (d) surface runoff depth, averaged over the CTP, from 1960 to 2020. The red dashed line in each subplot denotes the trend of variables over higher and lower rainfall periods.
Figure 8.
Changes in summer (a) air temperature; (b) PET; (c) precipitation; (d) surface runoff depth, averaged over the CTP, from 1960 to 2020. The red dashed line in each subplot denotes the trend of variables over higher and lower rainfall periods.
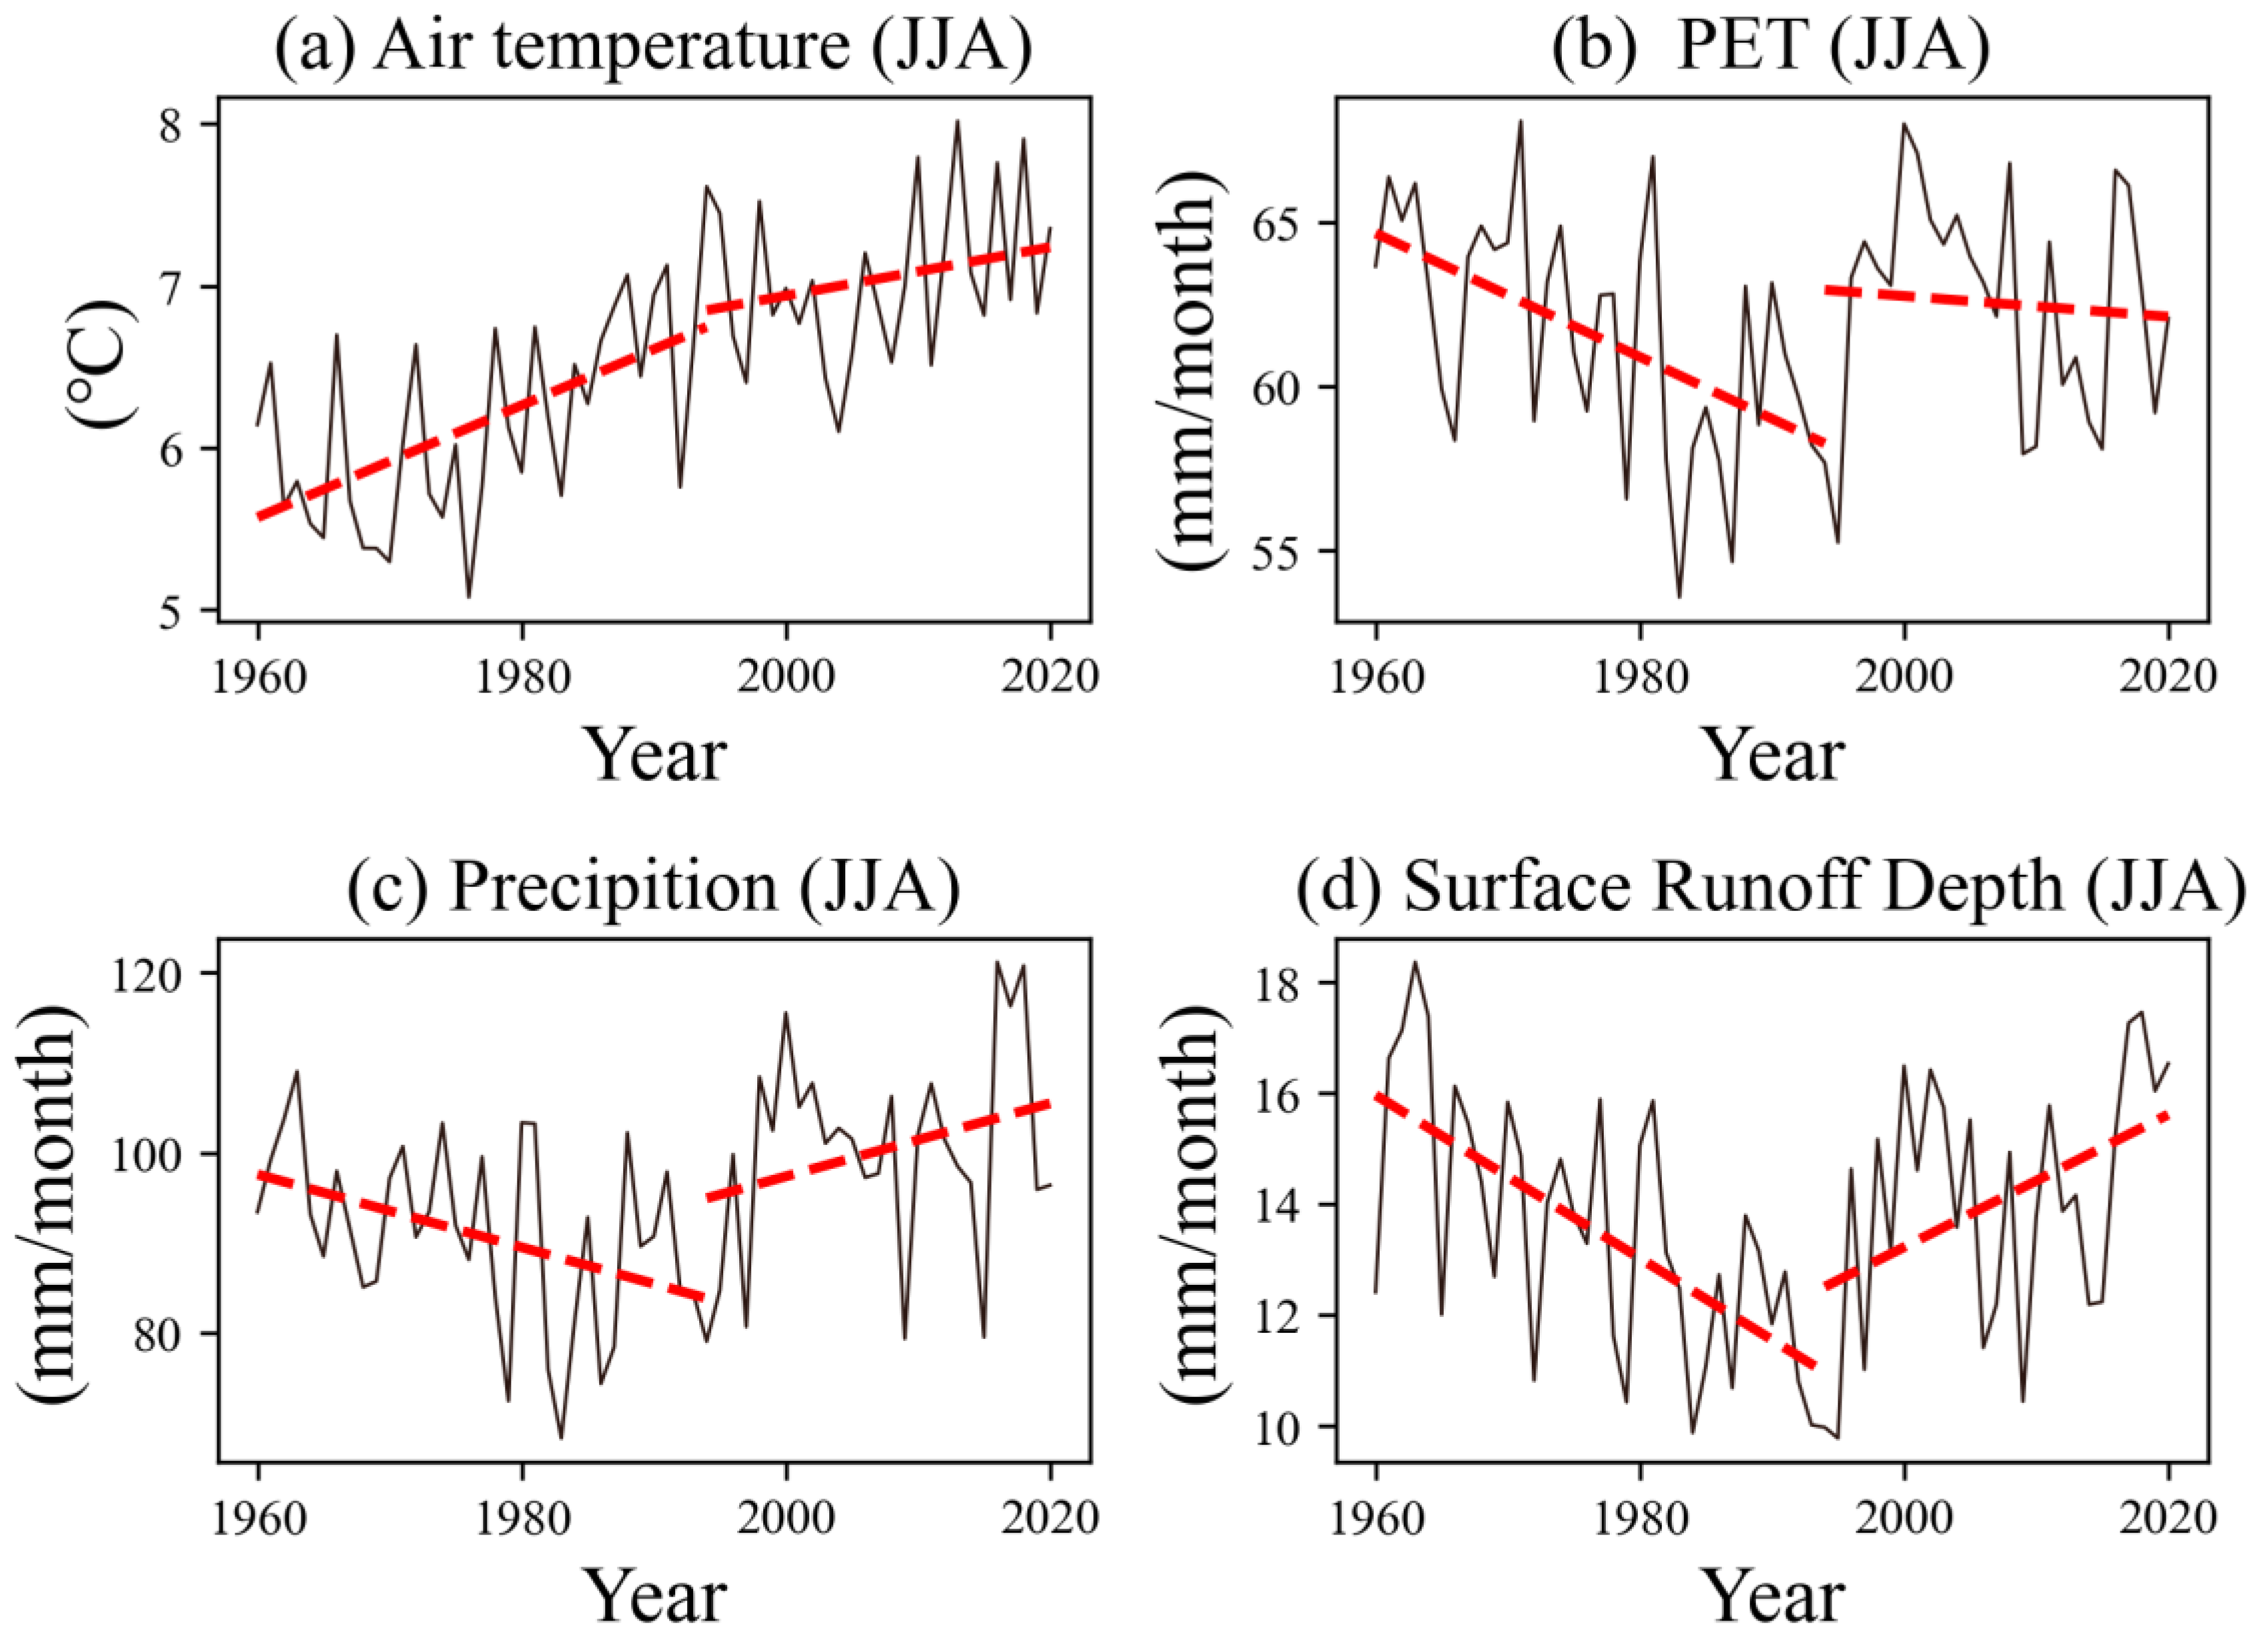
Figure 9.
Differences in (a) air temperature; (b) PET; (c) precipitation; (d) surface runoff depth in summer (JJA) between higher and lower rainfall periods. The dotted areas indicate correlation coefficients that are significant at the 95% confidence level.
Figure 9.
Differences in (a) air temperature; (b) PET; (c) precipitation; (d) surface runoff depth in summer (JJA) between higher and lower rainfall periods. The dotted areas indicate correlation coefficients that are significant at the 95% confidence level.
Disclaimer/Publisher’s Note: The statements, opinions and data contained in all publications are solely those of the individual author(s) and contributor(s) and not of MDPI and/or the editor(s). MDPI and/or the editor(s) disclaim responsibility for any injury to people or property resulting from any ideas, methods, instructions or products referred to in the content. |
© 2025 by the authors. Licensee MDPI, Basel, Switzerland. This article is an open access article distributed under the terms and conditions of the Creative Commons Attribution (CC BY) license (http://creativecommons.org/licenses/by/4.0/).
Copyright: This open access article is published under a Creative Commons CC BY 4.0 license, which permit the free download, distribution, and reuse, provided that the author and preprint are cited in any reuse.


