
Submitted:
22 July 2025
Posted:
23 July 2025
You are already at the latest version
Abstract
Climate change is expected to have a significant effect on crop yield in the Canadian Prairies. The objective of this study was to investigate these possible effects on spring wheat, barley and canola production using the Decision Support System for Agrotechnology Transfer (DSSAT) modelling platform. We applied 21 climate change scenarios from high-resolution (0.22°) regional simulations to three modules, DSSAT-CERES-Wheat, DSSAT-CERES-Barley and CSM-CROPGRO-Canola, using a historical baseline period (1985–2014) and three future periods: near (2015–2040), middle (2041–2070), and far (2071–2100). These simulations are part of CMIP6 (Coupled Model Intercomparison Project Phase 6) and have been processed using statistical downscaling and bias-correction by the NASA Earth Exchange 26 Global Daily Downscaled Projections project, referred to as NEX-GDDP-CMIP6. The calibration and validation results surpassed the thresholds for a high level of accuracy. Simulated yield changes indicate that climate change has a positive effect on spring wheat and barley yields with median-model increases of 7% and 11.6% in the near future, and 5.5 and 9.2% in the middle future, respectively. However, in the far future, barley production shows a modest increase of 4.4%, while spring wheat yields decline significantly by 17%. Conversely, simulated canola yields demonstrate a substantial decrease over time, with reductions of 25.9%, 46.3%, and 62.8% from the near to the far future, respectively. Agroclimatic indices, such as Number of Frost-Free Days (NFFD), Heating Degree-Days (HDD), Length of Growing Season (GSL), Crop Heat Units (CHU), and Effective Growing Degree Days (EGDD), exhibit significant correlations with spring wheat. Conversely, precipitation indices such as very wet days, annual five and 10-day maximum precipitation, have a stronger correlation with canola yield changes when compared with temperature indices.
Keywords:
crop yield
; climate change
; agroclimatic indices
; DSSAT model
; prairies
1. Introduction
The Prairie Provinces (Alberta, Saskatchewan, and Manitoba) represent Canada’s largest and most industrious agricultural region, playing a vital role in the nation’s economy. As an indication, the Gross Domestic Product (GDP) attributed to crop production reached $26.3 billion in the year 2021, providing employment opportunities for 115,500 individuals within the sector [1]. Hence, shifts in production levels, such as those induced by the impacts of climate change, have the potential to influence not only the economic landscape of Canada but also extend to repercussions globally.
The effect of climate change may be to either compromise future grain production due to rising temperatures and drought conditions or enhance crop performance given a longer growing season with elevated levels of atmospheric [2]. The IPCC’s AR6 [3] reported that the Earth’s climate temperatures is likely to increase by 1 to 5 °C by the end of this century. Additionally, concentrations are projected to increase from 390 (ppm) in 2012 to an estimated 935 ppm by the end of the 21st century. serves as a nutrient, enhancing crop productivity alongside its influence on transpiration. Research findings have shown that certain crops, including both C4 and C3 varieties, exhibit a decrease in stomatal conductance as leaves open fewer stomata in response to increased atmospheric levels. This decline in stomatal conductance restricts the intake of for crop photosynthesis, leading to a decrease in transpiration [4,5,6].
Generally, the interaction between rising temperatures and increasing concentrations presents a complex challenge for simulating agricultural production. Warmer climate potentially offer the advantage of a longer growing season, enabling earlier planting and later harvests [7,8]. Under global warming, Canada is expected to experience extended growing seasons and higher crop heat units, which will enhance agricultural productivity on existing farmland [9]. Research indicates that from 1950 to 2016, Canada’s average surface air temperature rose by 1.8°C—a rate nearly double the global average increase of 0.85°C observed between 1880 and 2012 (Vincent et al., 2018) [11]). These climatic shifts are likely to favor crop yields in regions already under cultivation and thus, this can lead to a shorter crop growth period from emergence to maturity, increasing crop water demand, and ultimately reducing crop yields [12,13]. Research has demonstrated how extreme temperatures stress plant growth by adding, reducing yield potential. Adekanmbi et al. [14] found that climate change under high-emission scenarios (e.g., SSP3–7.0 and SSP5–8.5) would likely decrease potato production in Prince Edward Island (Canada). Conversely, crop productivity in other regions could increase amid climate change. For instance, Zare et al. [15] found that the yields of a primary crop, spring wheat, would increase in southern Saskatchewan with rising temperatures. Similarly, Cabas et al. [16] investigated the yields of corn, soybean, and winter wheat in southwestern Ontario, Canada, revealing that elevated temperatures would lead to enhanced average crop yields.
Since agricultural production is directly linked to changes in climatic conditions, modelling techniques [17] that encompass comprehensive future climate forecasts are essential. Crop simulation models serve as valuable instruments for assessing the influence of climate change and various environmental factors on crop yield and growth [18]. The Decision Support System for Agro-technology Transfer (DSSAT) modelling platform [19] considers factors like cultivar genetics, soil moisture, soil carbon, nitrogen content, and agricultural practices under different farm practice scenarios at any given location [20]. Moreover, DSSAT has been employed at various temporal and spatial scales to simulate crop yield under the effect of different climate change scenarios [20,21,22,23,24,25]. The purpose of this research was to analyze the effects of projected climate change on the productivity of barley, canola, and spring wheat in Canada’s Prairie region.
The DSSAT model was utilized with output from 21 Earth System Models under the SSP 8.5 greenhouse gas emission scenario. Crop yields were simulated for four periods: historical baseline (1985–2014), near future (2015–2040), middle future (2041–2070), and far future (2071-2100). The results of this study carry policy and practical implications concerning the forthcoming cultivation of barley, canola and spring wheat and the implementation of adaptive management strategies to mitigate the possible negative effects of climate change.
2. Materials and Methods
2.1. Study Area
This study was conducted across the 468 Census Subdivisions (CSDs) of the Canadian Prairie provinces—Alberta (AB), Saskatchewan (SK), and Manitoba (MB) where contains approximately 80% of Canada’s total cultivated land. The CSDs include 61 Municipal Districts (MD), 37 Municipalities (MU), 7 unorganized areas (NO), 357 Rural Municipalities (RM), 3 Special Areas (SA), and 3 Specialized Municipalities (SM) (Figure 1). The Prairies experience significant climate variability [26,27,28], with long, cold winters and short, warm summers. The Canadian Prairies, with their semi-arid climate, are frequently affected by severe weather events—including droughts, heatwaves [29], hailstorms, floods, and tornadoes. These events pose significant risks to farming and particulay crop productions [30,31]. The agricultural growing season in the region extends from mid-April through September, depending on the type of crop. However, crop production faces drought risks due to limited annual rainfall averaging 454 mm, with the highest precipitation occurring during June and July. The area’s soil composition varies by climate zone: brown grassland soils dominate arid areas, dark-brown mixed grassland soils characterize semiarid zones, and black/gray wooded soils are typical in subhumid areas [32].
2.2. Decision Support System for Agrotechnology Transfer
The DSSAT crop-modelling package includes an environmental resource synthesis model for simulating the growth of individual plants, in this case wheat, canola, and barley [33] and modules for weather, soil characteristics, soil-plant-atmosphere (SPAM) and crop management. The main function of the weather module is to read daily weather data, including maximum and minimum temperature, precipitation, humidity and solar radiation. The soil module is based on soil water, temperature, carbon and nitrogen for four layers, each with a specified drained upper limit (DUL), lower limit (LL), and saturated water content (SAT) used to estimate water flow among the soil layers. The SPAM module in DSSAT computes daily changes in soil, plant and atmosphere inputs and computes root water uptake, potential evapotranspiration (ET), as well as actual soil evaporation and plant transpiration. The crop management component incorporates various agronomic practices, including cultivar selection, sowing parameters (date, depth, and density), row spacing, water supplementation, nutrient inputs, and organic matter additions. Plant growth is modeled on a daily basis by transforming intercepted photosynthetically active radiation (PAR) into biomass through crop-specific radiation use efficiency (RUE), whereas actual growth on any day is limited by water stress and suboptimal temperature [34]. We used a water stress scenario under the effects of climate change on agricultural production. The soil water balance model estimates daily variations in soil moisture across different soil layers by accounting for processes such as rainfall and irrigation infiltration, vertical drainage, unsaturated water movement, evaporation from the soil, plant transpiration, and root absorption [34]. Potential transpiration is determined using either the Priestley-Taylor equation [35] or the Penman-FAO approach [36]. The actual transpiration rate is adjusted based on leaf area index (LAI), soil evaporation rates, and available soil water content.
2.3. Model Performance Evaluation
During the calibration process, the cultivar coefficients were obtained sequentially, beginning with the phenological development parameters associated with flowering and maturity dates (P1V, P1D, P5 and PHINT), followed by the crop growth parameters related to kernel filling rate and kernel numbers per plant (G1, G2 and G3) [37,38]. DSSAT has three wheat models, including CSM-CERES, CSMNWHEAT, and CSM-CROPSIM, developed for different purposes, leading to differences in model structure, source code and input data. In this study, we used the CSM-CERES model in the calibration and validation on a daily step. We selected the wheat cultivar AC Barrie (in the WHCER045.CUL file) for cultivar calibration. Data on precipitation, management practices, and soil hydraulic properties under rain-fed conditions (based on field experiments at Swift Current, Saskatchewan) were available for a sensitivity analysis of the crop modelling for spring wheat. The experimental site generated a continuous long-term dataset on spring wheat yield from 1967 to 2005. We used the DSSAT-CERESE-Barley model and the AC Lacombe cultivar to estimate the parameter coefficients for calibrating genetic coefficients of barley and comparing simulated and observed data (field experiments) [33]. The barley dataset included yield and shoot biomass measurements for the AC Lacombe cultivar at a site located in Breton, Alberta (53˚ 6′ 18″ N, 114˚ 28′ 25″ W), which is well adapted to the black and gray wooded soils of Western Canada. The CSM-CROPGRO-Canola model was also used to determine the impact of climate change on the production of canola. The calibration of genetic coefficients and photosynthesis parameters in CSM-CROPGRO-Canola was based on canola cultivar InVigor 5440, which was calibrated in Canada by Jing et al. [39,40,41]. Field experiments were conducted at Brandon in 2010 and 2012.
2.4. Statistical Evaluation Method
We employed three statistical parameters of index of agreement (d) [42], modelling efficiency (EF) [43,44] and normalized root-mean-square error (nRMSE) [42] to evaluate model performance. Several research studies have established that a value of and were considered as having good model-data agreement for crop growth variables; and indicate moderate agreement; and and shows poor agreement [45,46,47]. The above statistics were calculated as follows:
where and are the th model-simulated and measured values, respectively, is the number of data pairs of simulated and measured values, and is the average of the measured values.
2.5. Agroclimatic Indices
Numerous climate indices, like those from the ETCCDI (Expert Team on Climate Change Detection and Indices), were originally designed to analyze historical and projected shifts in climate extremes. However, these indices may not always be suitable for monitoring climate impacts at regional or local levels. We focused on agroclimatic indices, which represent current limitations on agricultural activities and are strongly related to plant development, growth, and yield [48,49,50]. These indices are based on warm season (spring-planted) crops (e.g., spring wheat, barley, canola) with definitions to be found in Qian et al. [51] that mostly reflect the start (GSS), the end (GSE) and the length (GSL) of the growing season. The definitions of the 18-agroclimatic indices analyzed in this study are listed in Table 1.
2.6. NEX-GDDP-CMIP6
The NASA Earth Exchange Global Daily Downscaled Projections for CMIP6 (NEX-GDDP-CMIP6) is a high-resolution climate dataset that provides daily bias-corrected and spatially downscaled projections based on the latest Coupled Model Intercomparison Project Phase 6 (CMIP6) simulations. Covering the period from 1950 to 2100, this dataset enhances previous versions, such as NEX-GDDP-CMIP5, through improved bias correction and spatial disaggregation techniques [52]. With a 0.25° × 0.25° grid resolution (~25 km), it offers detailed climate projections under various Shared Socioeconomic Pathways (SSPs), supporting research in agriculture, water resources, and extreme climate events [53]. Despite its advancements, uncertainties remain in regional and local-scale applications, necessitating multi-model assessments to better capture the range of potential climate futures [54,55]. The Bias-Correction Spatial Disaggregation (BCSD) method used in NEX-GDDP-CMIP6 mitigates biases in general circulation models (GCMs) by incorporating historical observational data and refining spatial details [56,57,58]. Compared to other CMIP6 datasets, its higher resolution enables more precise regional climate analysis. This study utilizes 21 SSPs CMIP6 models (Table 2) to assess NEX-GDDP-CMIP6’s capability in representing climate variability and crop production, providing valuable insights for climate adaptation and mitigation strategies.
3. Results
3.1. Projected Tmax, Tmin & Precipitation Changes
Figure 2 consists of scatter plots of projected changes in mean temperature and total precipitation between the future and historical periods under three different periods. The multi-SSP mean precipitation increased by 13, 25.8 and 33.6 mm for the near, middle and far future, respectively, when compared with the historical period. The annual mean temperature increases from 1.1 to 3.4 degrees in the near future, 2.8 to 5.7 degrees in the middle and 3 to 10.1 degrees for the far future. The ranking of climate models based on the driest conditions (evaluated using the average rankings of the highest temperature anomalies and the lowest precipitation) indicated that the KACE-1-0-G model projected the driest conditions in the near future. In contrast, the UKESM1-0-LL model was ranked highest for dry conditions in the middle and far future. Conversely, when assessing the wet conditions (using the average rankings of the lowest temperature anomalies alongside the highest rainfall), the GFDL-ESM4 model exhibited the highest wet condition scores in the near term. For the middle and far future periods, the MRI-ESM2-0 model was ranked highest in terms of wet conditions.
Figure 3 presents projected changes during warm season months (from planting to harvest date) for precipitation, Tmax and Tmin between the historical baseline (1985-2014) and the three future periods. These results for the whole prairie are the changes projected from 21 SSP 8.5 simulations for three future periods. The solid horizontal bars represent the multi-model median values. Each box captures the inter-quartile (25th to 75th percentile) range. The whiskers depict the full range of projected values from the 21 models. Maximum temperatures exhibit the most change with a near future increase of 2.1°C in September, a middle future increase of 4.7°C in August, and far future increase of 7.4°C in August. The most significant changes in minimum temperature are an increase by 1.7°C in July, 4.2°C in August, and 7.5°C in August during the near, middle, and far future, respectively. Ensemble median accumulated precipitation during the warm season was highest in April for the near, middle and far future with increases of 6 and 5mm in May, and 10 mm in April, respectively.
3.2. Projected Changes in Agroclimatic Indices
The results of an analysis of agroclimatic indices derived from 21 SSP models are presented as time series of annual agroclimatic (Figure 4). While all indices display an upward trend, the temperature-linked parameters show a more marked escalation than rainfall-related measurements. For instance, hot days and hot nights increase to 55 and 41 days in the late century, respectively (Table 3). As expected, the models project a lengthening in the growing season for warm-season crops by more than 28 days and 44 days in the middle and far future compared with historical, respectively. The rainfall-related indices (e.g., very wet days, P1D, P5D, P10D) exhibit considerable interannual and decadal scale variability, such that shifts in variability represent more climate risk than moderate long-term trends in median values.
3.3. DSSAT Model Calibration and Validation
Table 4 shows the calibration and validation statistics for the DSSAT modelling of crop yield for prairie (i.e., soil, weather and crop management practices data) by running the sub-model (GENCALC) to simulate spring wheat under rainfed conditions. We used the DSSAT-CERES-Wheat, DSSAT-CERES-Barley and CSM-CROPGRO-Canola models for calibration and validation. The d-values for the calibration and validation periods for all crops exceeded the threshold of 0.7, indicating high accuracy. Additionally, EF shows values greater than or equal to 0, while nRMSE falls within the range of 15% to 30% for DSSAT-CERES-Wheat and almost less than 15% for DSSAT-CERES-Barley and CSM-CROPGRO-Canola, which indicates a remarkable similarity between the observed and simulated spring wheat yields (Figure 5).
3.4. Impacts of Future Climate Change on Crop Yield
Figure 6, Figure 7 and Figure 8 summarize results for the DSSAT modelling of spring wheat, barley and canola across the prairie agricultural zone (468 CSDs). They reveal that spring wheat and barley yields will be higher by the middle of the 21st century and then decline by the end of the century in most of the SSP model simulations; however, canola yield will be significantly reduced in all future periods. The solid horizontal bars represent median values. The boxes and whiskers give the interquartile and full range, respectively. Notably, the range of crop yield, between crop loss and exceptional yield, increases into the future.
The ensemble median crop yield was 2540 and 3285 in the historical period for spring wheat and barley, respectively (Figure 9 and Figure 10). It increased to 2720 and 2680 in the near and middle future, but it declined by 2017 in the far future for spring wheat. The ensemble median barley production rises to 3666 and 3587 in the near and middle future, but is reduced to 3445 in the far future. While the ensemble median historical yield of canola was 2458, it decreases to 1821, 1320 and 913 in the near to far future, respectively (Figure 11).
Figure 12 and Figure 13 are maps showing the spatial distribution of ensemble-median wheat and barley yields. These results indicate that, although overall crop yield generally increased during the near and middle periods, its spatial distribution was uneven across the region. Specifically, the northern areas of the ‘grain belt’ contributed predominantly to the crop yield enhancement, whereas the southern regions experienced declines even during the middle periods. This spatial disparity persisted into the distant period, with a more pronounced negative trend in the southern regions. On the other hand, simulations of canola production produced notably divergent outcomes when compared to the other crops (Figure 14).
Figure 15 is a heat map of the Pearson correlation coefficient among the agroclimatic indices listed in Table 1 and the three crops for historical and projected periods. The highest correlations among agroclimatic indices are for wheat, indicating the sensitivity of these crops to weather conditions. The lowest correlations for barley suggest lesser sensitivity to weather conditions. Canola exhibits negative correlations with agroclimatic indices reflecting the adverse impact of high temperatures.
4. Discussion
In this study, we applied data from 21 SSP simulations of future climate to the DSSAT crop-modelling platform to generate an ensemble of crop yield projections. Given that crop simulation modelling involves the interplay of various environmental and crop elements, there is inherent uncertainty when assessing the impact of climate change on crop yield. Employing more than one climate model allows for the quantification of this uncertainty. Therefore, we applied data from an array of climate models to the DSSAT-CERES-Wheat, DSSAT-CERES-Barley and CSM-CROPGRO-Canola crop simulation models to evaluate the cultivars AC Barrie (spring wheat), AC Lacombe (barley) and InVigor 5440 (canola). Calibration and validation results showed the crop yield model performed well against observational data (nRMSE <30%, EF and d ≈1.0), establishing its reliability for subsequent climate change impact analysis. These results indicated good performance for the dynamic modelling of spring wheat, barley and canola production.
The results showed that climate change generally has a positive impact on crop yields in the near future (2015–2040), with median model increases of 7% and 11.6% for spring wheat and barley, respectively. Furthermore, in the middle future (2041–2070), yields are projected to increase by 5.5% for spring wheat and 9.2% for barley. However, in the far future (2071-2100), barley production shows a modest increase of 4.4%, while spring wheat yields decline significantly by 17%. Conversely, simulated canola yields decrease substantially over time, with reductions of 25.9%, 46.3%, and 62.8% from the near to the far future, respectively. Although overall crop yield generally increased during the near and middle periods, the spatial distribution of future yield is uneven across the region. Crop yield increases across most of the northern and eastern parts of the prairies from historical to the end of the century, whereas the southern regions experiences declines even during the middle period. This spatial disparity persists into the far future, with a more pronounced negative trend in the southern regions. On the other hand, simulations of canola production have yielded notably divergent outcomes when contrasted with those of other crops.
Previous research on the connection between climate change and crop yield revealed that, while global warming can have both positive and negative consequences, more often the positive effects tend to dominate in the Canadian Prairies. Our findings are consistent with studies that have modelled crop yields in the same region. Smith et al. [59], Wang et al. [60], Zare et al. [15] and Qian et al. [61] all found higher future yields of spring wheat, relative to a historical baseline, under various greenhouse gas emission scenarios. While previous studies produced similar results, our research took a different approach in several important ways. The DSSAT model is inherently a field-based model, with all inputs defined on a field-by-field basis. Consequently, studies utilizing DSSAT usually focus on relatively small areas, as scaling up can be challenging due to the complexity of computations and the need for detailed input data, particularly weather parameters. This required modification to DSSAT to read and process gridded data. In this study, we extended relatively high-resolution (~25 km) crop modelling over a large area representing more than 80% of Canada’s cropland. In addition, other studies have not explored the combination of various climate change scenarios with farm management strategies, leaving a gap in our understanding of how different adaptations might address the challenges posed by climate change. We demonstrated the effectiveness of farm management for water stress in responding to climate-related challenges.
The array of 21 ESMs from the NEX-GDDP-CMIP6 archive projected a positive effect on GSL and EGDD during the warm season and, thus, positive impacts on crop yield. For example, 10% and 24% increases in GSL and EGDD for the near future resulted in 7% and 11.6% higher yields for spring wheat and barley, respectively. However, canola showed a decrease (-25.9%) in the near future. These results were not consistent with Mapfumo et al. [62], who determined an increasing number of GDD in May, June, and September, which increased mean canola yields, whereas yields in July are decreased in Saskatchewan. An increase in the growing season leads to enhanced CHU, which could result in a substantial change in Canadian cropping patterns, such as an expansion of crops like wheat and barley. The accelerated maturation of these crops due to earlier high temperatures, and the adverse effects of five or more consecutive days or daily maximum temperature above 30°C, offsets any gains from an earlier start to the growing season. Qian et al. [63] demonstrated that a global warming of up to 2.0°C could enhance Canadian crop production, although yields may decline beyond this threshold due to heightened water stress from increased evaporation. This effect becomes particularly noticeable for crops like canola and barley towards the end of the century, coinciding with an average temperature rise of over two degrees. Temperature-related indices demonstrated both a positive and negative linear relationship with production compared to rainfall indicators, particularly in spring wheat and barley. Notably, indices such as Number of Frost-Free Days, Heating Degree-Days, Length of Growing Season, Crop Heat Units, and Effective Growing Degree Days were positively and significantly correlated. Conversely, precipitation indices such as very wet days, annual five and 10-day maximum precipitation, showed a stronger correlation with canola yield changes when compared with temperature indices.
Increased CO2 was associated with a significant increase in spring wheat and barley yields. Thomson et al. [64] and Ko et al. [65] found that the negative effect of increasing global mean temperature on crop yields was partially offset by the positive influence of increasing CO2 and precipitation. Increased levels of CO2 result in elevated rates of net photosynthesis. Additionally, heightened CO2 concentrations enhance water use efficiency (WUE) by decreasing transpiration per unit leaf area, potentially triggering the closure of stomata [66]. Applying additional irrigation during critical growth stages of canola, such as flowering and grain filling, has the potential to mitigate the adverse effects of climate change. Kutcher et al. [67] emphasized that canola crops are particularly vulnerable to elevated temperatures during late June and early July, coinciding with the flowering stage. Additionally, the beneficial impact of higher precipitation during July illustrates how increased rainfall might counterbalance the detrimental effects of temperature on canola flowering, primarily through the process of transpiration. While maximum and minimum temperatures showed the greatest rise during June and July, the rainfall patterns during July exhibited the smallest variance when compared to the base period. Consequently, without implementing an irrigation strategy, there’s a significant risk of a sharp decline in future canola production. Introducing irrigation during the critical flowering stage in July could mitigate the risk of canola loss.
5. Conclusions
We presented future projections of spring wheat, canola and barley yield, forcing a DSSAT model with 21 SSP climate scenarios under historical conditions and three future periods: near, middle and far. Overall, the calibrated DSSAT-CERES-Wheat, DSSAT-CERES-Barley, and CSM-CROPGRO-Canola models are a suitable tool for predicting crop production in response to climate change. The SSP projection of maximum and minimum temperature, and monthly rainfall indicated that the future climate will be warmer than the baseline (1985–2014) with increased rainfall during the warm season, mostly in the earlier half. This includes increases in extremely high temperatures, but also positive effects on frost-free days, GSL and EGDD and thus also on crop yield. Multi-model median projections of spring wheat and barley yields were increased at least by the middle of the current century, while crop yield simulation for canola showed negative effects resulting in a median-model decrease of 25.9%, 46.3%, and 62.8% from the near to the far future, respectively. It appears that future warming, accompanied by increased CO2 concentration, will benefit yields of spring wheat and barley at least by the middle future for the Prairie. Despite these higher yields, analysis of the spatial distribution reveals that production of both crops declines in the southern regions of the Canadian Prairies. Conversely, increased production in the northern regions compensates for these decreases, resulting in an overall upward trajectory in total regional production. These results offer valuable insights for devising long-term adaptation strategies aimed at mitigating the detrimental effects of climate change and capitalizing on the opportunities presented by a warmer climate. However, further validation of the methods and results presented here will be necessary before the maps and data of future crop yield can be applied to the assessment of policy and management practices. Furthermore, the results of this study represent a worst-case scenario; we assumed rainfed crop production and conventional soil and water management. Our further research will incorporate the current and potential locations of irrigated land and practices to manage soil moisture and health.
Funding
This research was funded by the RBC Tech for Nature program and by the Prairie Adaptations Research Collaborative, University of Regina.
Data Availability Statement
The data presented in this study are available from the corresponding author on reasonable request.
Acknowledgments
The research documented in this paper benefitted from a collaboration with the Canadian Water Network (CWN). Staff of the CWN established a project technical advisory committee. We received expert advice during several meetings of this committee.
Conflicts of Interest
The authors declare no conflicts of interest.
References
- Agriculture and Agri-Food Canada. Statistical Overview of the Canadian Greenhouse Vegetable and Mushroom Industry, 2021. Horticulture Reports. 2022. https://agriculture.canada.ca.
- Garofalo, P.; Ventrella, D.; Kersebaum, K.C.; Gobin, A.; Trnka, M.; Giglio, L.; Dubrovský, M.; Castellini, M. Water footprint of winter wheat under climate change: Trends and uncertainties associated to the ensemble of crop models. Sci. Total Environ. 2019, 658, 1186–1208. [Google Scholar] [CrossRef] [PubMed]
- IPCC. Climate Change 2021: The Physical Science Basis. Contribution of Working Group I to the Sixth Assessment Report of the Intergovernmental Panel on Climate Change; Masson-Delmotte, V., Zhai, P., Pirani, A., Eds.; Cambridge University Press: Cambridge, UK; New York, NY, USA, 2021. [Google Scholar]
- Gedney, N.; Cox, P.M.; Betts, R.A.; Boucher, O.; Huntingford, C.; Stott, P.A. Detection of a direct carbon dioxide effect in continental river runoff records. Nature 2006, 439, 835–838. [Google Scholar] [CrossRef] [PubMed]
- Morison, J.I. Intercellular CO2 concentration and stomatal response to CO2. In Stomatal Function; Zeiger, E., Farquhar, G.D., Cowan, I.R., Eds.; Stanford University Press: Stanford, CA, USA, 1987; pp. 229–252. [Google Scholar]
- Wand, S.J.E.; Midgley, G.F.; Jones, M.H.; Curtis, P.S. Responses of wild C4 and C3 grass (Poaceae) species to elevated atmospheric CO2 concentration: A meta-analytic test of current theories and perceptions. Glob. Chang. Biol. 1999, 5, 723–741. [Google Scholar] [CrossRef]
- Piao, S.; Fang, J.; Zhou, L.; Ciais, P.; Zhu, B. Variations in satellite-derived phenology in China’s temperate vegetation. Glob. Chang. Biol. 2006, 12, 672–685. [Google Scholar] [CrossRef]
- Walther, G.-R.; Post, E.; Convey, P.; Menzel, A.; Parmesan, C.; Beebee, T.J.C.; Fromentin, J.-M.; Hoegh-Guldberg, O.; Bairlein, F. Ecological responses to recent climate change. Nature 2002, 416, 389–395. [Google Scholar] [CrossRef] [PubMed]
- Qian, B.; Gameda, S.; Zhang, X.; De Jong, R. Changing growing season observed in Canada. Clim. Chang. 2012, 112, 339–353. [Google Scholar] [CrossRef]
- Vincent, L.A.; Zhang, X.; Mekis, E.; Wan, H.; Bush, E.J. Changes in Canada’s climate: Trends in indices based on daily temperature and precipitation data. Atmos.-Ocean, 2018, 56, 332–349. [Google Scholar] [CrossRef]
- IPCC. Climate Change 2014: Impacts, Adaptation and Vulnerability. Part B: Regional Aspects. Contribution of Working Group II to the Fifth Assessment Report of the Intergovernmental Panel on Climate Change; Barros, V.R., Field, C.B., Dokken, D.J., Eds.; Cambridge University Press: Cambridge, UK; New York, NY, USA, 2014. [Google Scholar]
- Asseng, S.; Martre, P.; Maiorano, A.; Rötter, R.P.; O’Leary, G.J.; Fitzgerald, G.J.; Girousse, C.; Motzo, R.; Giunta, F.; Babar, M.A.; et al. Climate change impact and adaptation for wheat protein. Glob. Chang. Biol. 2019, 25, 155–173. [Google Scholar] [CrossRef] [PubMed]
- Kheir, A.M.S.; El Baroudy, A.; Aiad, M.A.; Zoghdan, M.G.; Abd El-Aziz, M.A.; Ali, M.G.M.; Fullen, M.A. Impacts of rising temperature, carbon dioxide concentration and sea level on wheat production in North Nile delta. Sci. Total Environ. 2019, 651, 3161–3173. [Google Scholar] [CrossRef] [PubMed]
- Adekanmbi, T.; Wang, X.; Basheer, S.; Nawaz, R.A.; Pang, T.; Hu, Y.; Liu, S. Assessing future climate change impacts on potato yields—A case study for Prince Edward Island, Canada. Foods 2023, 12, 1176. [Google Scholar] [CrossRef] [PubMed]
- Zare, M.; Azam, S.; Sauchyn, D. Simulation of climate change impacts on crop yield in the Saskatchewan Grain Belt using an improved SWAT model. Agriculture 2023, 13, 2102. [Google Scholar] [CrossRef]
- Cabas, J.; Weersink, A.; Olale, E. Crop yield response to economic, site and climatic variables. Clim. Chang. 2010, 101, 599–616. [Google Scholar] [CrossRef]
- Guo, R.; Lin, Z.; Mo, X.; Yang, C. Responses of crop yield and water use efficiency to climate change in the North China Plain. Agric. Water Manag. 2010, 97, 1185–1194. [Google Scholar] [CrossRef]
- Challinor, A.J.; Watson, J.; Lobell, D.B.; Howden, S.M.; Smith, D.R.; Chhetri, N. A meta-analysis of crop yield under climate change and adaptation. Nat. Clim. Chang. 2014, 4, 287–291. [Google Scholar] [CrossRef]
- Jones, J.W.; Hoogenboom, G.; Porter, C.H.; Boote, K.J.; Batchelor, W.D.; Hunt, L.A.; Wilkens, P.W.; Singh, U.; Gijsman, A.J.; Ritchie, J.T. The DSSAT cropping system model. Eur. J. Agron. 2003, 18, 235–265. [Google Scholar] [CrossRef]
- Sen, S. Impact of spatial soil variability on rainfed maize yield in Kansas under a changing climate. Agronomy 2023, 13, 1436. [Google Scholar] [CrossRef]
- Ngwira, A.R.; Aune, J.B.; Thierfelder, C. DSSAT modelling of conservation agriculture maize response to climate change in Malawi. Soil Tillage Res. 2014, 143, 85–94. [Google Scholar] [CrossRef]
- Tooley, B.; Fraser, E.D.G.; Staver, A.C. Predicting the response of a potato-grain production system to climate change for a humid continental climate using DSSAT. Agric. Syst. 2021, 192, 103174. [Google Scholar] [CrossRef]
- QU, C. hong. ; LI, X. xiang.; JU, H.; LIU, Q. The impacts of climate change on wheat yield in the Huang-Huai-Hai Plain of China using DSSAT-CERES-Wheat model under different climate scenarios. J. Integr. Agric. 2019, 18, 1379–1391. [Google Scholar] [CrossRef]
- Gardi, M.W.; Assefa, T.T.; Tsegaye, D.; Tesfaye, K. Simulating the effect of climate change on barley yield in Ethiopia with the DSSAT-CERES-Barley model. Agronomy 2021, 11, 2253. [Google Scholar] [CrossRef]
- Harvey, C.; Rakotobe, Z.; Rao, N.; Dave, R.; Razafimahatratra, H.; Rabarijohn, R.; Rajaofara, H.; Mackinnon, J. Projections of spring wheat growth in Alaska: Opportunity and adaptations in a changing climate. Clim. Chang. 2021, 169, 19. [Google Scholar] [CrossRef]
- Bonsal, B.R.; Zhang, X.; Hogg, W.D. Canadian Prairie growing season precipitation variability and associated atmospheric circulation. Clim. Res. 1999, 11, 191–208. [Google Scholar] [CrossRef]
- Bonsal, B.R.; Wheaton, E.E. Atmospheric circulation comparisons between the 2001 and 2002 and the 1961 and 1988 Canadian Prairie droughts. Atmos.-Ocean 2005, 43, 163–172. [Google Scholar] [CrossRef]
- St. Jacques, J.M.; Huang, Y.A.; Zhao, Y.; Lapp, S.L.; Sauchyn, D.J. Detection and attribution of variability and trends in streamflow records from the Canadian Prairie Provinces. Can. Water Resour. J. 2014, 39, 270–284. [CrossRef]
- Noorisameleh, Z.; Gough, W.A.; Mirza, M.M.Q. Spatial Variability of Summer Droughts and Heatwaves in Southern Canada. Advances in Science, Technology & Innovation, 2024. Springer, Cham. [CrossRef]
- Yusa, A.; Berry, P.; Cheng, J.J.; Ogden, N.; Bonsal, B.; Stewart, R.; Waldick, R. Climate change, drought and human health in Canada. Int. J. Environ. Res. Public Health, 2015, 12, 8359–8412. [Google Scholar] [CrossRef] [PubMed]
- Mapfumo, E.; Chanasyk, D.S.; Puurveen, D.; Elton, S.; Acharya, S. Historic climate change trends and impacts on crop yields in key agricultural areas of the Prairie Provinces in Canada: A literature review. Can. J. Plant Sci. 2023, 103, 243–258. [Google Scholar] [CrossRef]
- Liu, J.G.; Huffman, T.; Qian, B.D.; Shang, J.L.; Li, Q.M.; Dong, T.F.; Davidson, A.; Jing, Q. Crop yield estimation in the Canadian Prairies using Terra/MODIS-derived crop metrics. IEEE J. Sel. Top. Appl. Earth Obs. Remote Sens. 2020, 13, 2685–2697. [Google Scholar] [CrossRef]
- Jego, G.; Pattey, E.; Liu, J. Spring barley yield and potential northward expansion under climate change in Canada. Field Crops Res. 2023, 294, 108864. [Google Scholar] [CrossRef]
- Ritchie, J.T.; Singh, U.; Godwin, D.; Bowen, W.T. Cereal growth, development, and yield. In Understanding Options for Agricultural Production; Tsuji, G.Y., Hoogenboom, G., Thornton, P.K., Eds.; Kluwer Academic: Dordrecht, The Netherlands, 1998; pp. 79–98. [Google Scholar]
- Priestley, C.H.B.; Taylor, R.J. On the assessment of surface heat flux and evaporation using large-scale parameters. Mon. Weather Rev. 1972, 100, 81–92. [Google Scholar] [CrossRef]
- Doorenbos, J.; Pruitt, W.O. Crop Water Requirements; FAO Irrigation and Drainage Paper No. 24 (rev.); FAO: Rome, Italy, 1977.
- Hunt, L.A.; Boot, K.J. Data for model operation, calibration and evaluation. In Understanding Options for Agricultural Production; Tsuji, G.Y., Hoogenboom, G., Thornton, P.K., Eds.; Kluwer Academic: Dordrecht, The Netherlands, 1998; pp. 9–39. [Google Scholar]
- Hunt, L.A.; Pararajasingham, S.; Jones, J.W.; Hoogenboom, G.; Imamura, D.T.; Ogoshi, R.M. GENCALC—Software to facilitate the use of crop models for analyzing field experiments. Agron. J. 1993, 85, 1090–1094. [Google Scholar] [CrossRef]
- Jing, Q.; Qian, B.; Shang, J.; Huffman, T.; Liu, J.; Pattey, E.; Drury, C.F.; Tremblay, N. Assessing the options to improve regional wheat yield in eastern Canada using the CSM–CERES–Wheat model. Agron. J. 2017, 109, 510–523. [Google Scholar] [CrossRef]
- Jing, Q.; Shang, J.; Huffman, T.; Qian, B.; Pattey, E.; Liu, J.; Dong, T.; Drury, C.F.; Tremblay, N. Using the CSM–CERES–Maize model to assess the gap between actual and potential yields of grain maize. J. Agric. Sci. 2016, 155, 239–260. [Google Scholar] [CrossRef]
- Jing, Q.; Huffman, T.; Shang, J.; Liu, J.; Pattey, E.; Drury, C.F.; Qian, B.; Tremblay, N. Evaluation of the CSM-CROPGRO-Canola model for simulating canola growth and yield at West Nipissing in eastern Canada. Agron. J. 2016, 108, 575–584. [Google Scholar] [CrossRef]
- Willmott, C.J. Some comments on the evaluation of model performance. Bull. Am. Meteorol. Soc. 1982, 63, 1309–1313. [Google Scholar] [CrossRef]
- Loague, K.M.; Freeze, R.A. A comparison of rainfall-runoff modelling techniques on small upland catchments. Water Resour. Res. 1985, 21, 229–248. [Google Scholar] [CrossRef]
- Yang, J.M.; Yang, J.Y.; Liu, S.; Hoogenboom, G. An evaluation of the statistical methods for testing the performance of crop models with observed data. Agric. Syst. 2014, 127, 81–89. [Google Scholar] [CrossRef]
- Liu, S.; Yang, J.Y.; Zhang, X.Y.; Drury, C.F.; Reynolds, W.D.; Hoogenboom, G. Modelling crop yield, soil water content and soil temperature for a soybean–maize rotation under conventional and conservation tillage systems in Northeast China. Agric. Water Manag. 2013, 123, 32–44. [Google Scholar] [CrossRef]
- Liu, S.; Yang, J.Y.; Drury, C.F.; Liu, H.L.; Reynolds, W.D. Simulating maize (Zea mays L.) growth and yield, soil nitrogen concentration, and soil water content for a long-term cropping experiment in Ontario, Canada. Can. J. Soil Sci. 2014, 94, 435–452. [Google Scholar] [CrossRef]
- Liu, S.; Yang, J.Y.; Yang, X.M.; Drury, C.F.; Jiang, R.; Reynolds, W.D. Simulating maize yield at county scale in southern Ontario using the decision support system for agrotechnology transfer model. Can. J. Soil Sci. 2021, 101, 734–748. [Google Scholar] [CrossRef]
- Olmstead, A.L.; Rhode, P.W. Adapting North American wheat production to climatic challenges, 1839–2009. Proc. Natl. Acad. Sci. USA 2011, 108, 480–485. [Google Scholar] [CrossRef] [PubMed]
- Pugh, T.A.M.; Müller, C.; Elliott, J.; Deryng, D.; Folberth, C.; Olin, S.; Schmid, E.; Arneth, A. Climate analogues suggest limited potential for intensification of production on current croplands under climate change. Nat. Commun. 2016, 7, 12608. [Google Scholar] [CrossRef] [PubMed]
- [49] Su, B.; Huang, J.L.; Fischer, T.; Wang, Y.J.; Kundzewicz, Z.W.; Zhai, J.Q.; Sun, H.M.; Wang, A.Q.; Zeng, X.F.; Wang, G.J.; et al. Drought losses in China might double between the 1. 5 °C and 2.0 °C warming. Proc. Natl. Acad. Sci. USA 2018, 115, 10600–10605. [Google Scholar] [CrossRef]
- [50] Qian, B.; Zhang, X.; Chen, K.; Feng, Y.; O’Brien, T. Observed long-term trends for agroclimatic conditions in Canada. J. Appl. Meteorol. Climatol. 2010, 49, 604–618. [Google Scholar] [CrossRef]
- Thrasher, B.; Wang, W.; Michaelis, A.; Melton, F.; Lee, T.; Nemani, R. NASA global daily downscaled projections, CMIP6. Sci. Data 2022, 9, 262. [Google Scholar] [CrossRef] [PubMed]
- Murali, G.; Iwamura, T.; Meiri, S.; Roll, U. Future temperature extremes threaten land vertebrates. Nature 2023, 615, 461–467. [Google Scholar] [CrossRef] [PubMed]
- Kim, Y.H.; Min, S.K.; Zhang, X.; Sillmann, J.; Sandstad, M. Evaluation of the CMIP6 multi-model ensemble for climate extreme indices. Weather Clim. Extrem. 2020, 29, 100269. [Google Scholar] [CrossRef]
- Eyring, V.; Cox, P.M.; Flato, G.M.; Gleckler, P.J.; Abramowitz, G.; Caldwell, P.; Collins, W.D.; Gier, B.K.; Hall, A.D.; Hofman, F.M.; et al. Taking climate model evaluation to the next level. Nat. Clim. Chang. 2019, 9, 102–110. [Google Scholar] [CrossRef]
- Maurer, E.; Hidalgo, H. Utility of daily vs. monthly large-scale climate data: An intercomparison of two statistical downscaling methods. Hydrol. Earth Syst. Sci. Discuss. 2008, 4, 3413–3440. [Google Scholar] [CrossRef]
- Thrasher, B.; Maurer, E.P.; McKellar, C.; Duffy, P.B. Technical note: Bias correcting climate model simulated daily temperature extremes with quantile mapping. Hydrol. Earth Syst. Sci. 2012, 16, 3309–3314. [Google Scholar] [CrossRef]
- Wood, A.W.; Maurer, E.P.; Kumar, A.; Lettenmaier, D. Long-range experimental hydrologic forecasting for the eastern United States. J. Geophys. Res. 2002, 107, 4429. [Google Scholar] [CrossRef]
- Smith, W.N.; Grant, B.B.; Desjardins, R.L.; Kroebel, R.; Li, C.; Qian, B.; Worth, D.E.; McConkey, B.G.; Drury, C.F. Assessing the effects of climate change on crop production and GHG emissions in Canada. Agric. Ecosyst. Environ. 2013, 179, 139–150. [Google Scholar] [CrossRef]
- Wang, H.; He, Y.; Qian, B.D. Short communication: Climate change and biofuel wheat: A case study of southern Saskatchewan. Can. J. Plant Sci. 2012, 92, 421–425. [Google Scholar] [CrossRef]
- Qian, B.; De Jong, R.; Huffman, T.; Wang, H.; Yang, J. Projecting yield changes of spring wheat under future climate scenarios on the Canadian Prairies. Theor. Appl. Climatol. 2016, 123, 651–669. [Google Scholar] [CrossRef]
- Mapfumo, E.; Chanasyk, D.S.; Puurveen, D.; Elton, S.; Acharya, S. Historic climate change trends and impacts on crop yields in key agricultural areas of the Prairie Provinces in Canada: A literature review. Can. J. Plant Sci. 2015, 95, 1041–1056. [Google Scholar] [CrossRef]
- Qian, B.; Zhang, X.; Smith, W.; Grant, B.; Jing, Q.; Cannon, A.J.; Neilsen, D.; McConkey, B.; Li, G.; Bonsal, B. Climate change impacts on Canadian yields of spring wheat, canola and maize for global warming levels of 1.5 °C, 2.0 °C, 2.5 °C and 3.0 °C. Environ. Res. Lett. 2019, 14, 074005. [Google Scholar] [CrossRef]
- Thompson, A.M.; Brown, R.A.; Rosenberg, N.J.; Izaurralde, R.C.; Benson, V. Climate change impacts for the conterminous USA: An integrated assessment Part 3. Dryland production of grain and forage crops. Clim. Chang. 2005, 69, 43–65. [Google Scholar] [CrossRef]
- Ko, J.; Ahuja, L.R.; Saseendran, S.; Green, T.R.; Ma, L.; Nielsen, D.C.; Walthall, C.L. Climate change impacts on dryland cropping systems in the Central Great Plains, USA. Clim. Chang. 2012, 111, 445–472. [Google Scholar] [CrossRef]
- Rosenzweig, C.; Iglesias, A. The use of crop models for international climate change impact assessment. In Understanding Options for Agricultural Production; Tsuji, G.Y., Hoogenboom, G., Thornton, P.K., Eds.; Springer: Dordrecht, The Netherlands, 1998; pp. 267–292. [Google Scholar]
- Kutcher, H.R.; Warland, J.S.; Brandt, S.A. Temperature and precipitation effects on canola yields in Saskatchewan, Canada. Agric. For. Meteorol. 2010, 150, 161–165. [Google Scholar] [CrossRef]
Figure 1.
468 CSD types in the Canadian Prairie provinces along with cropland area.
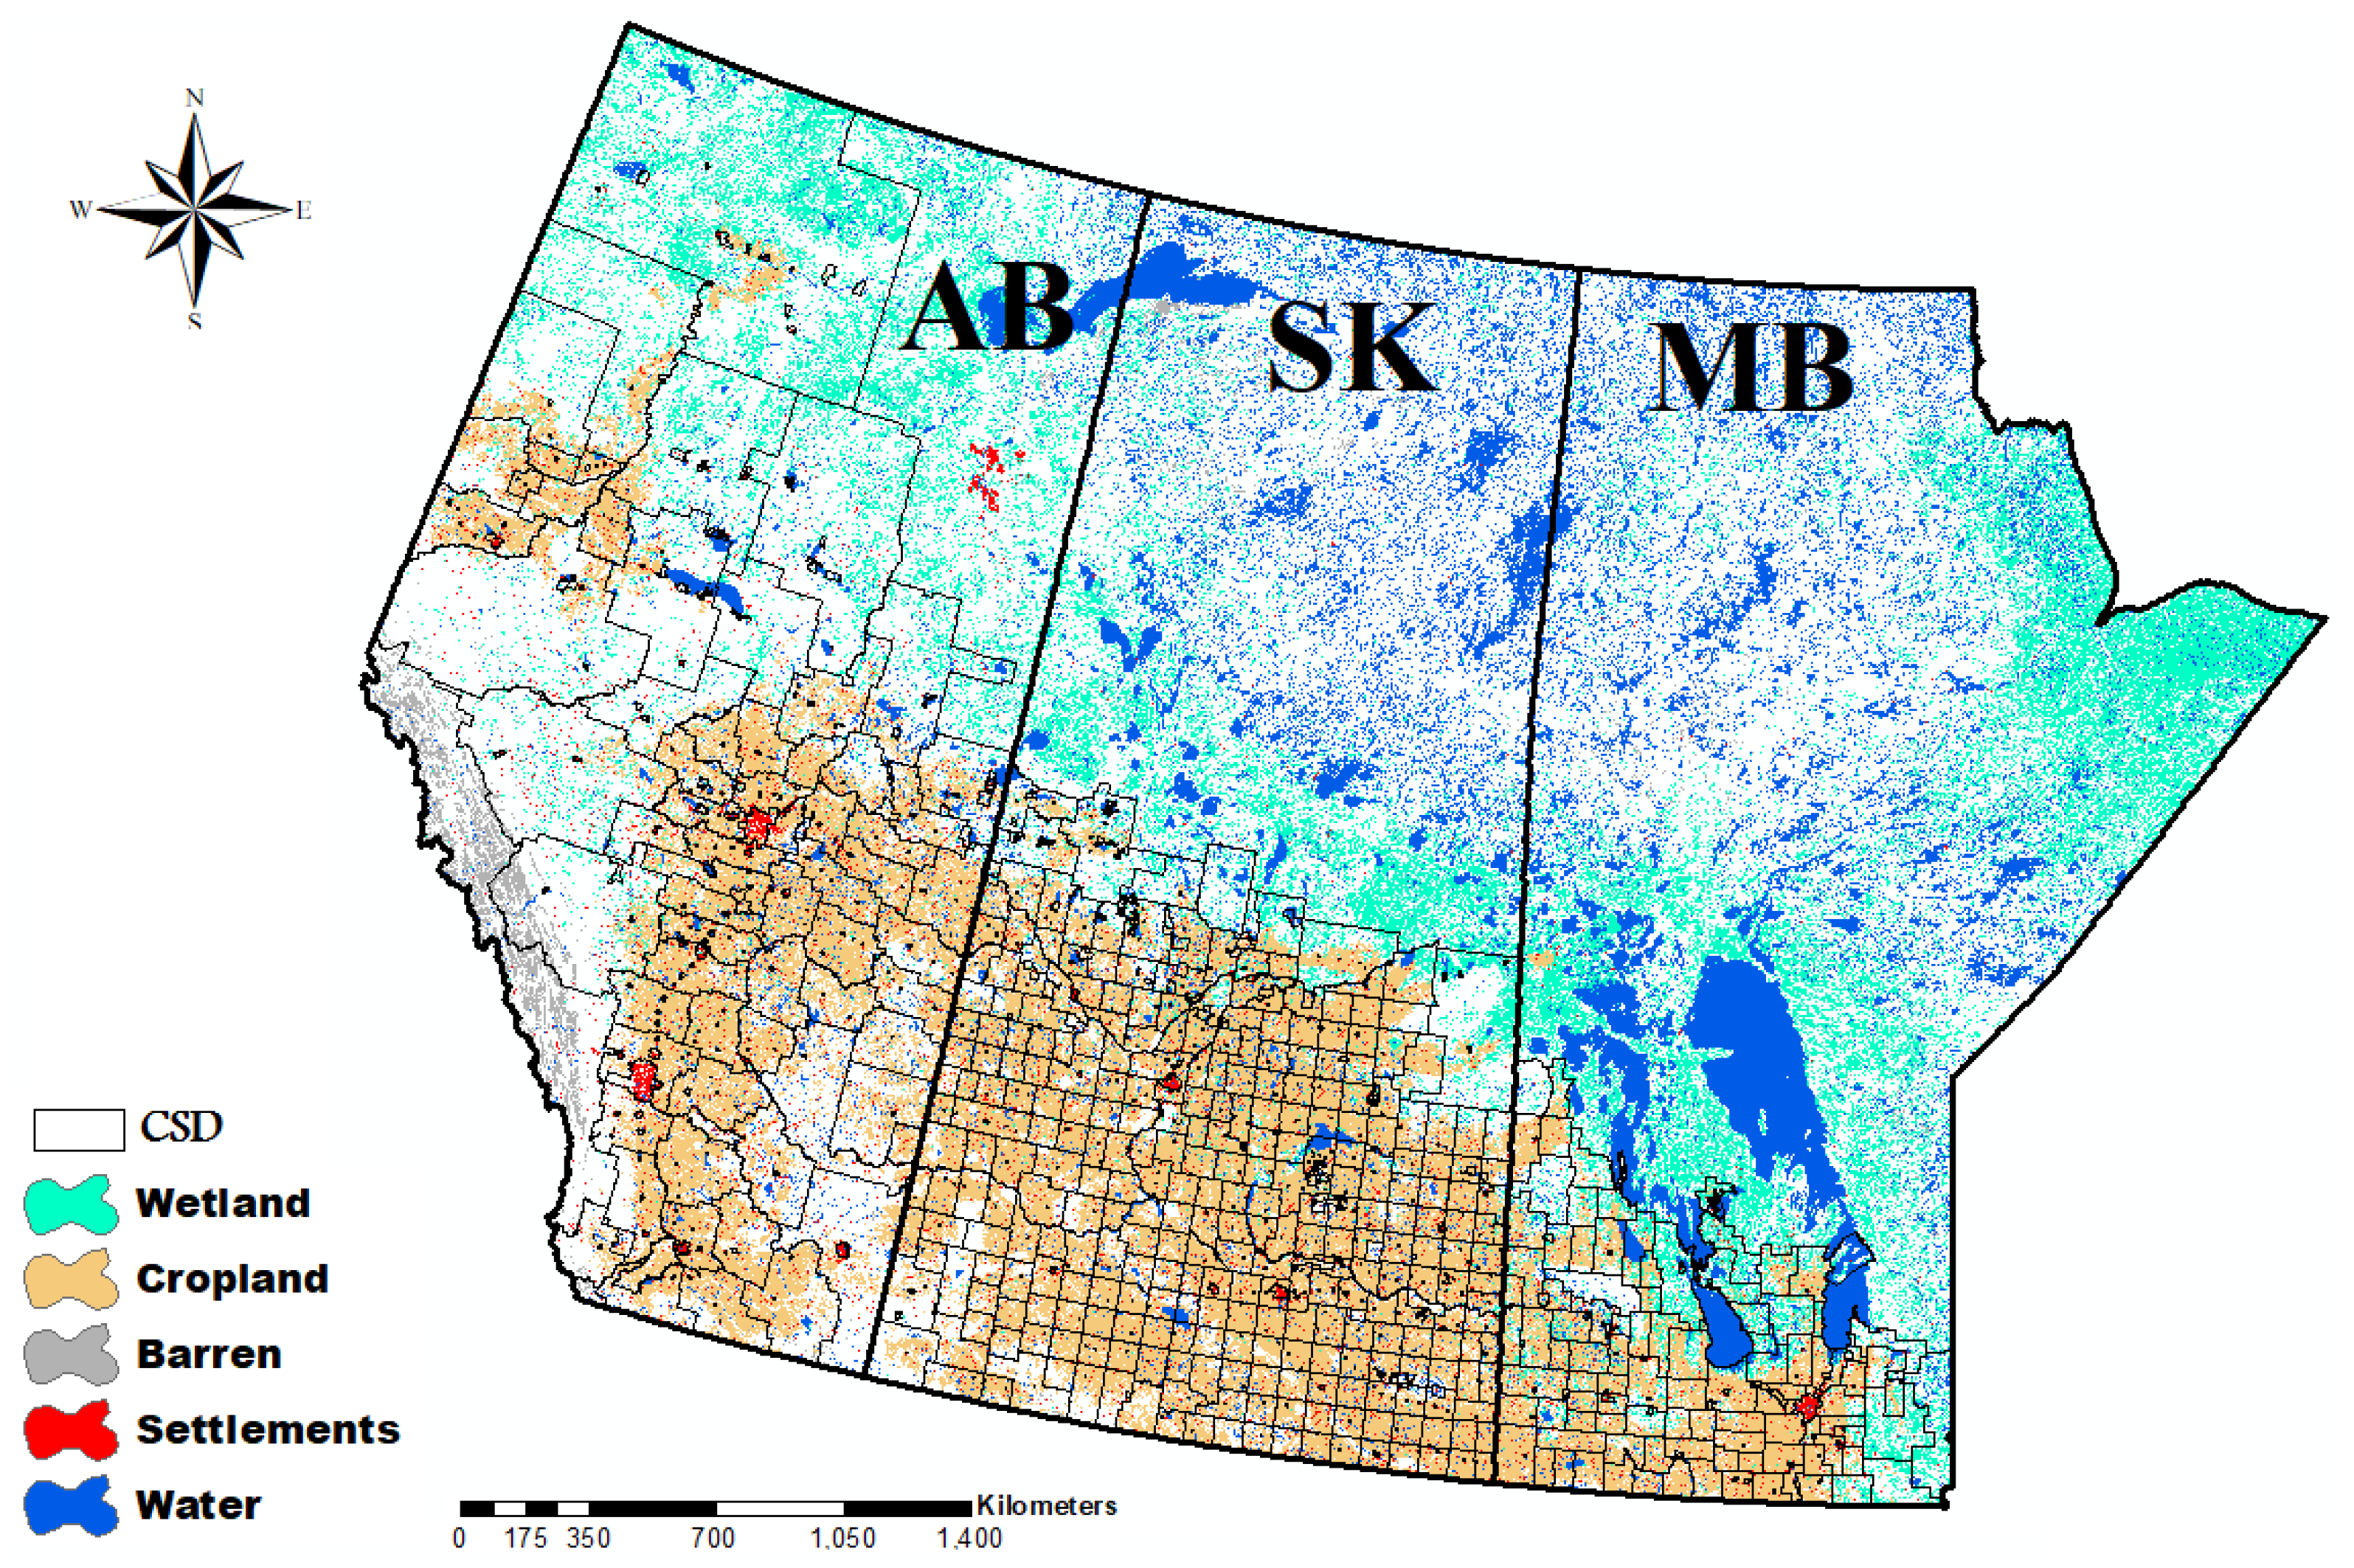
Figure 2.
Changes in mean temperature and total precipitation under different future periods and SSPs.
Figure 2.
Changes in mean temperature and total precipitation under different future periods and SSPs.
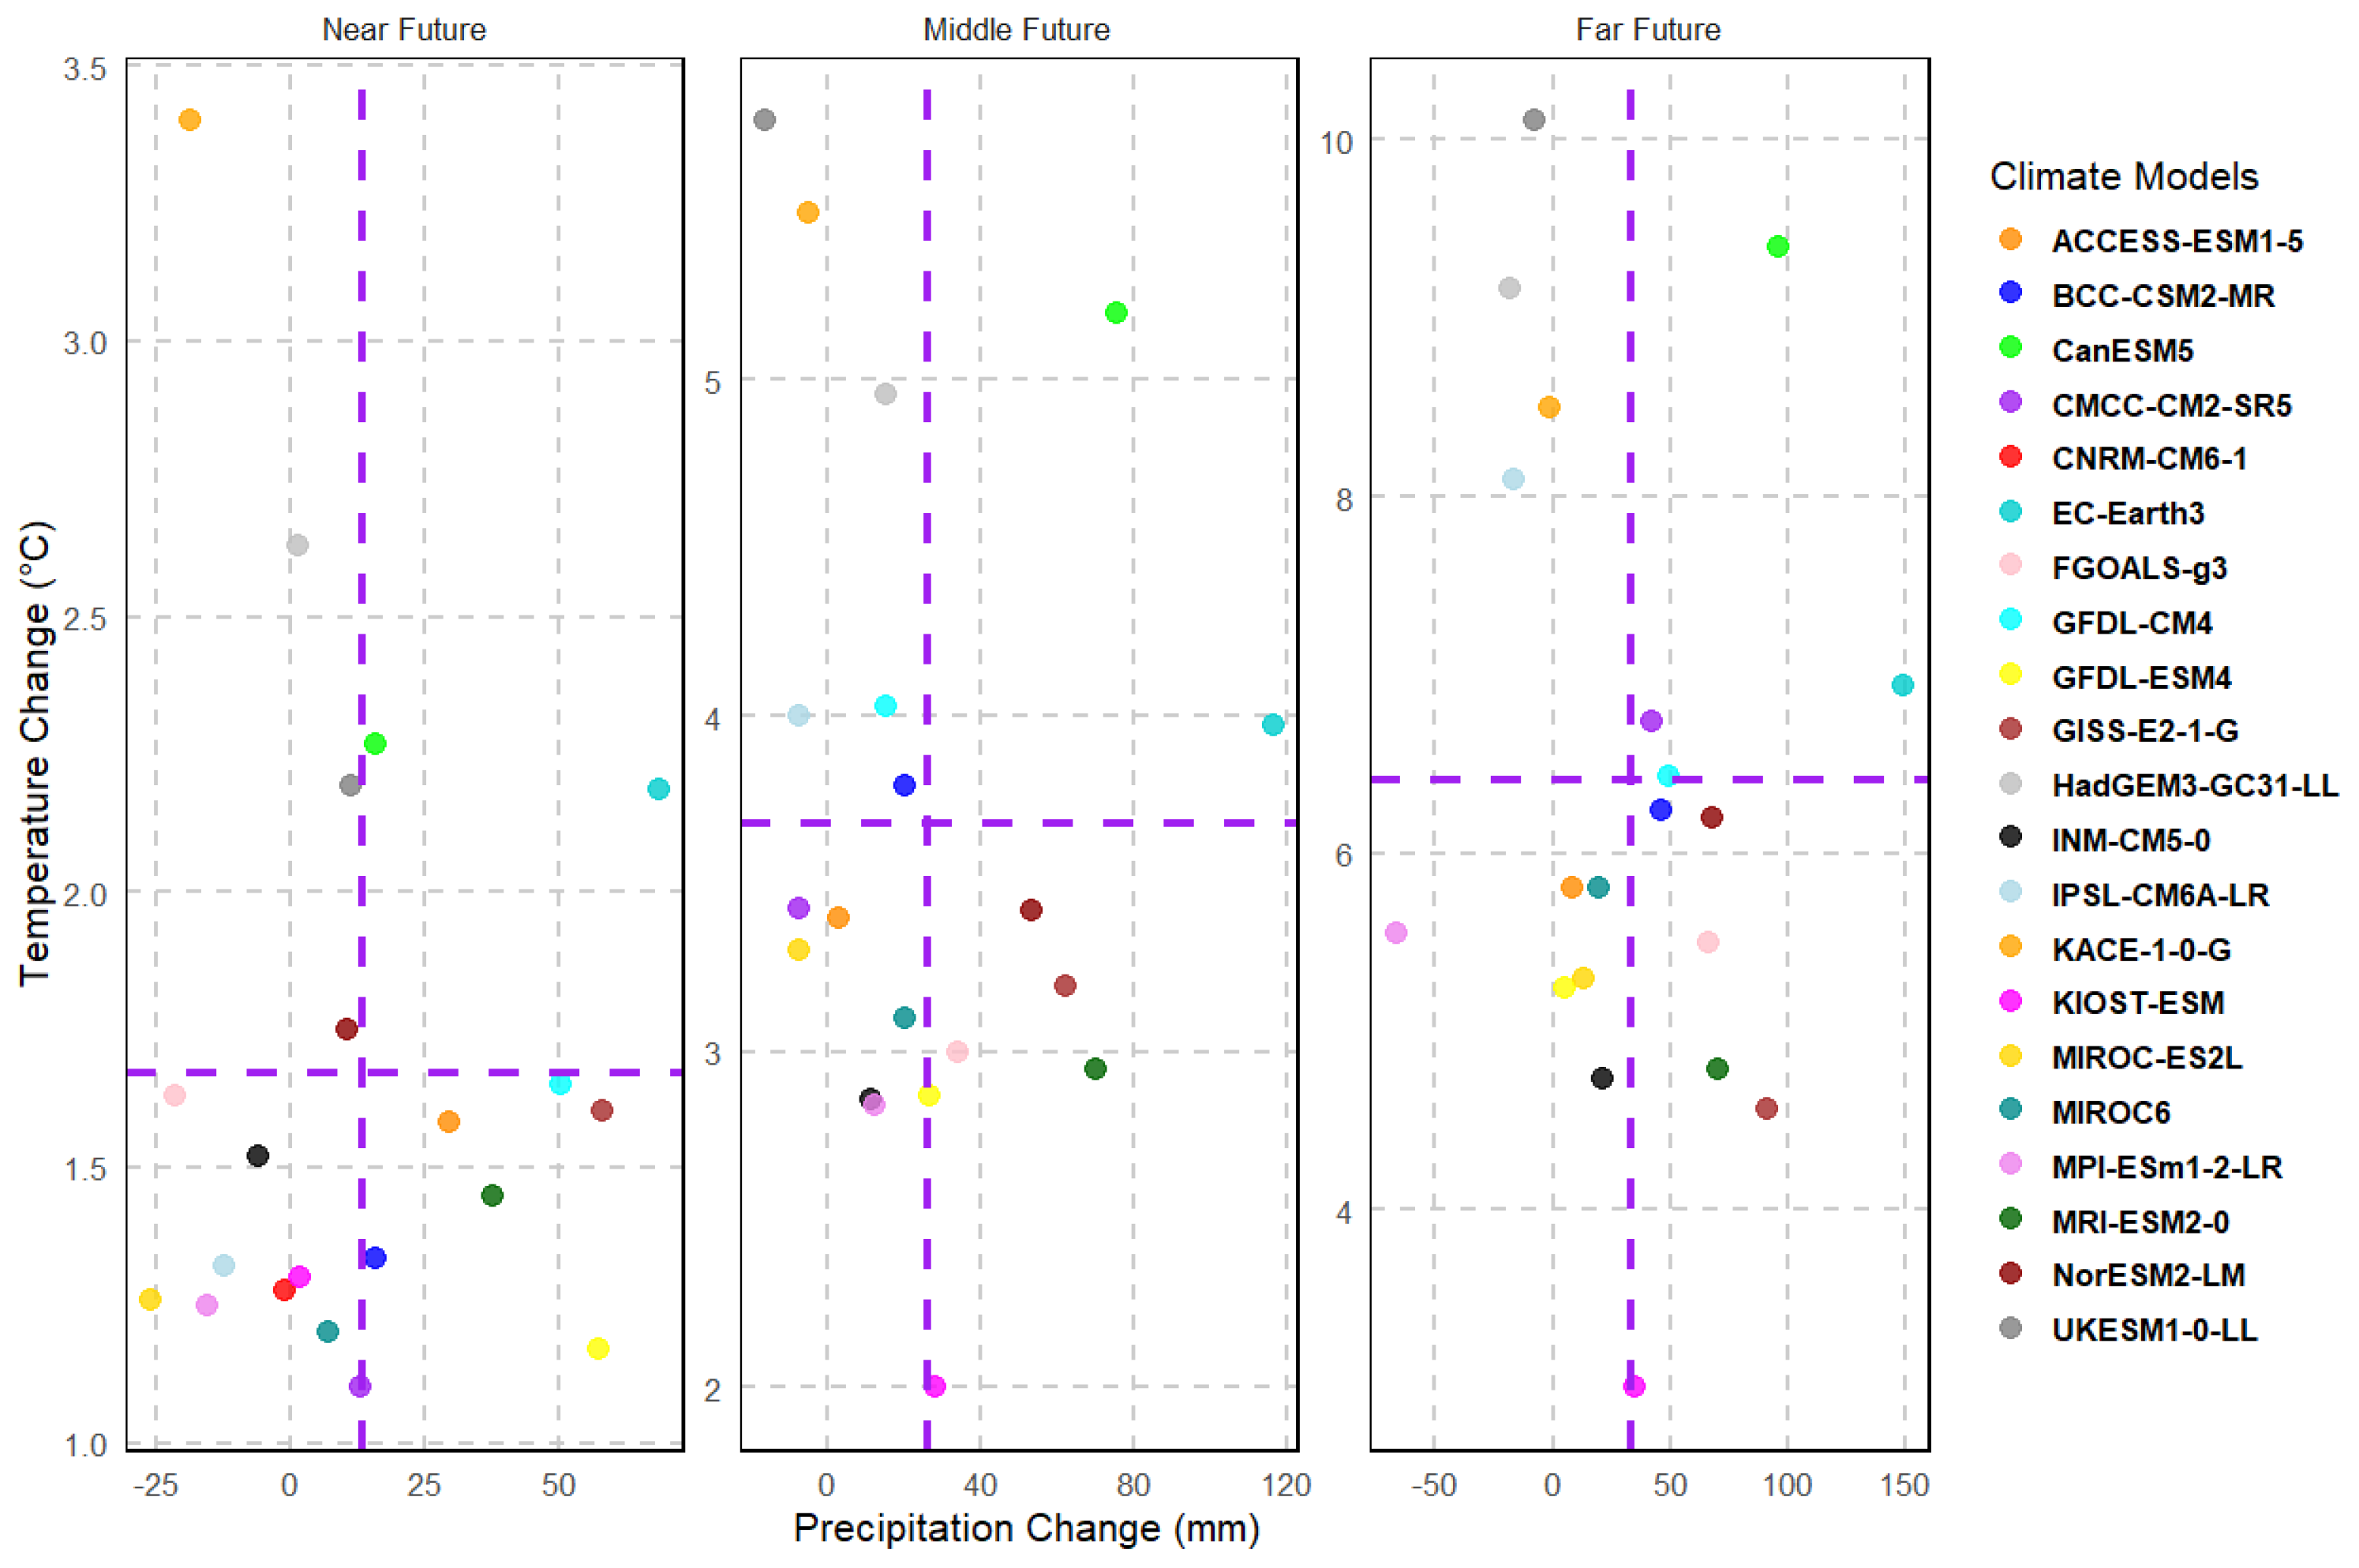
Figure 3.
Projected changes during warm season months from planting to harvest date.
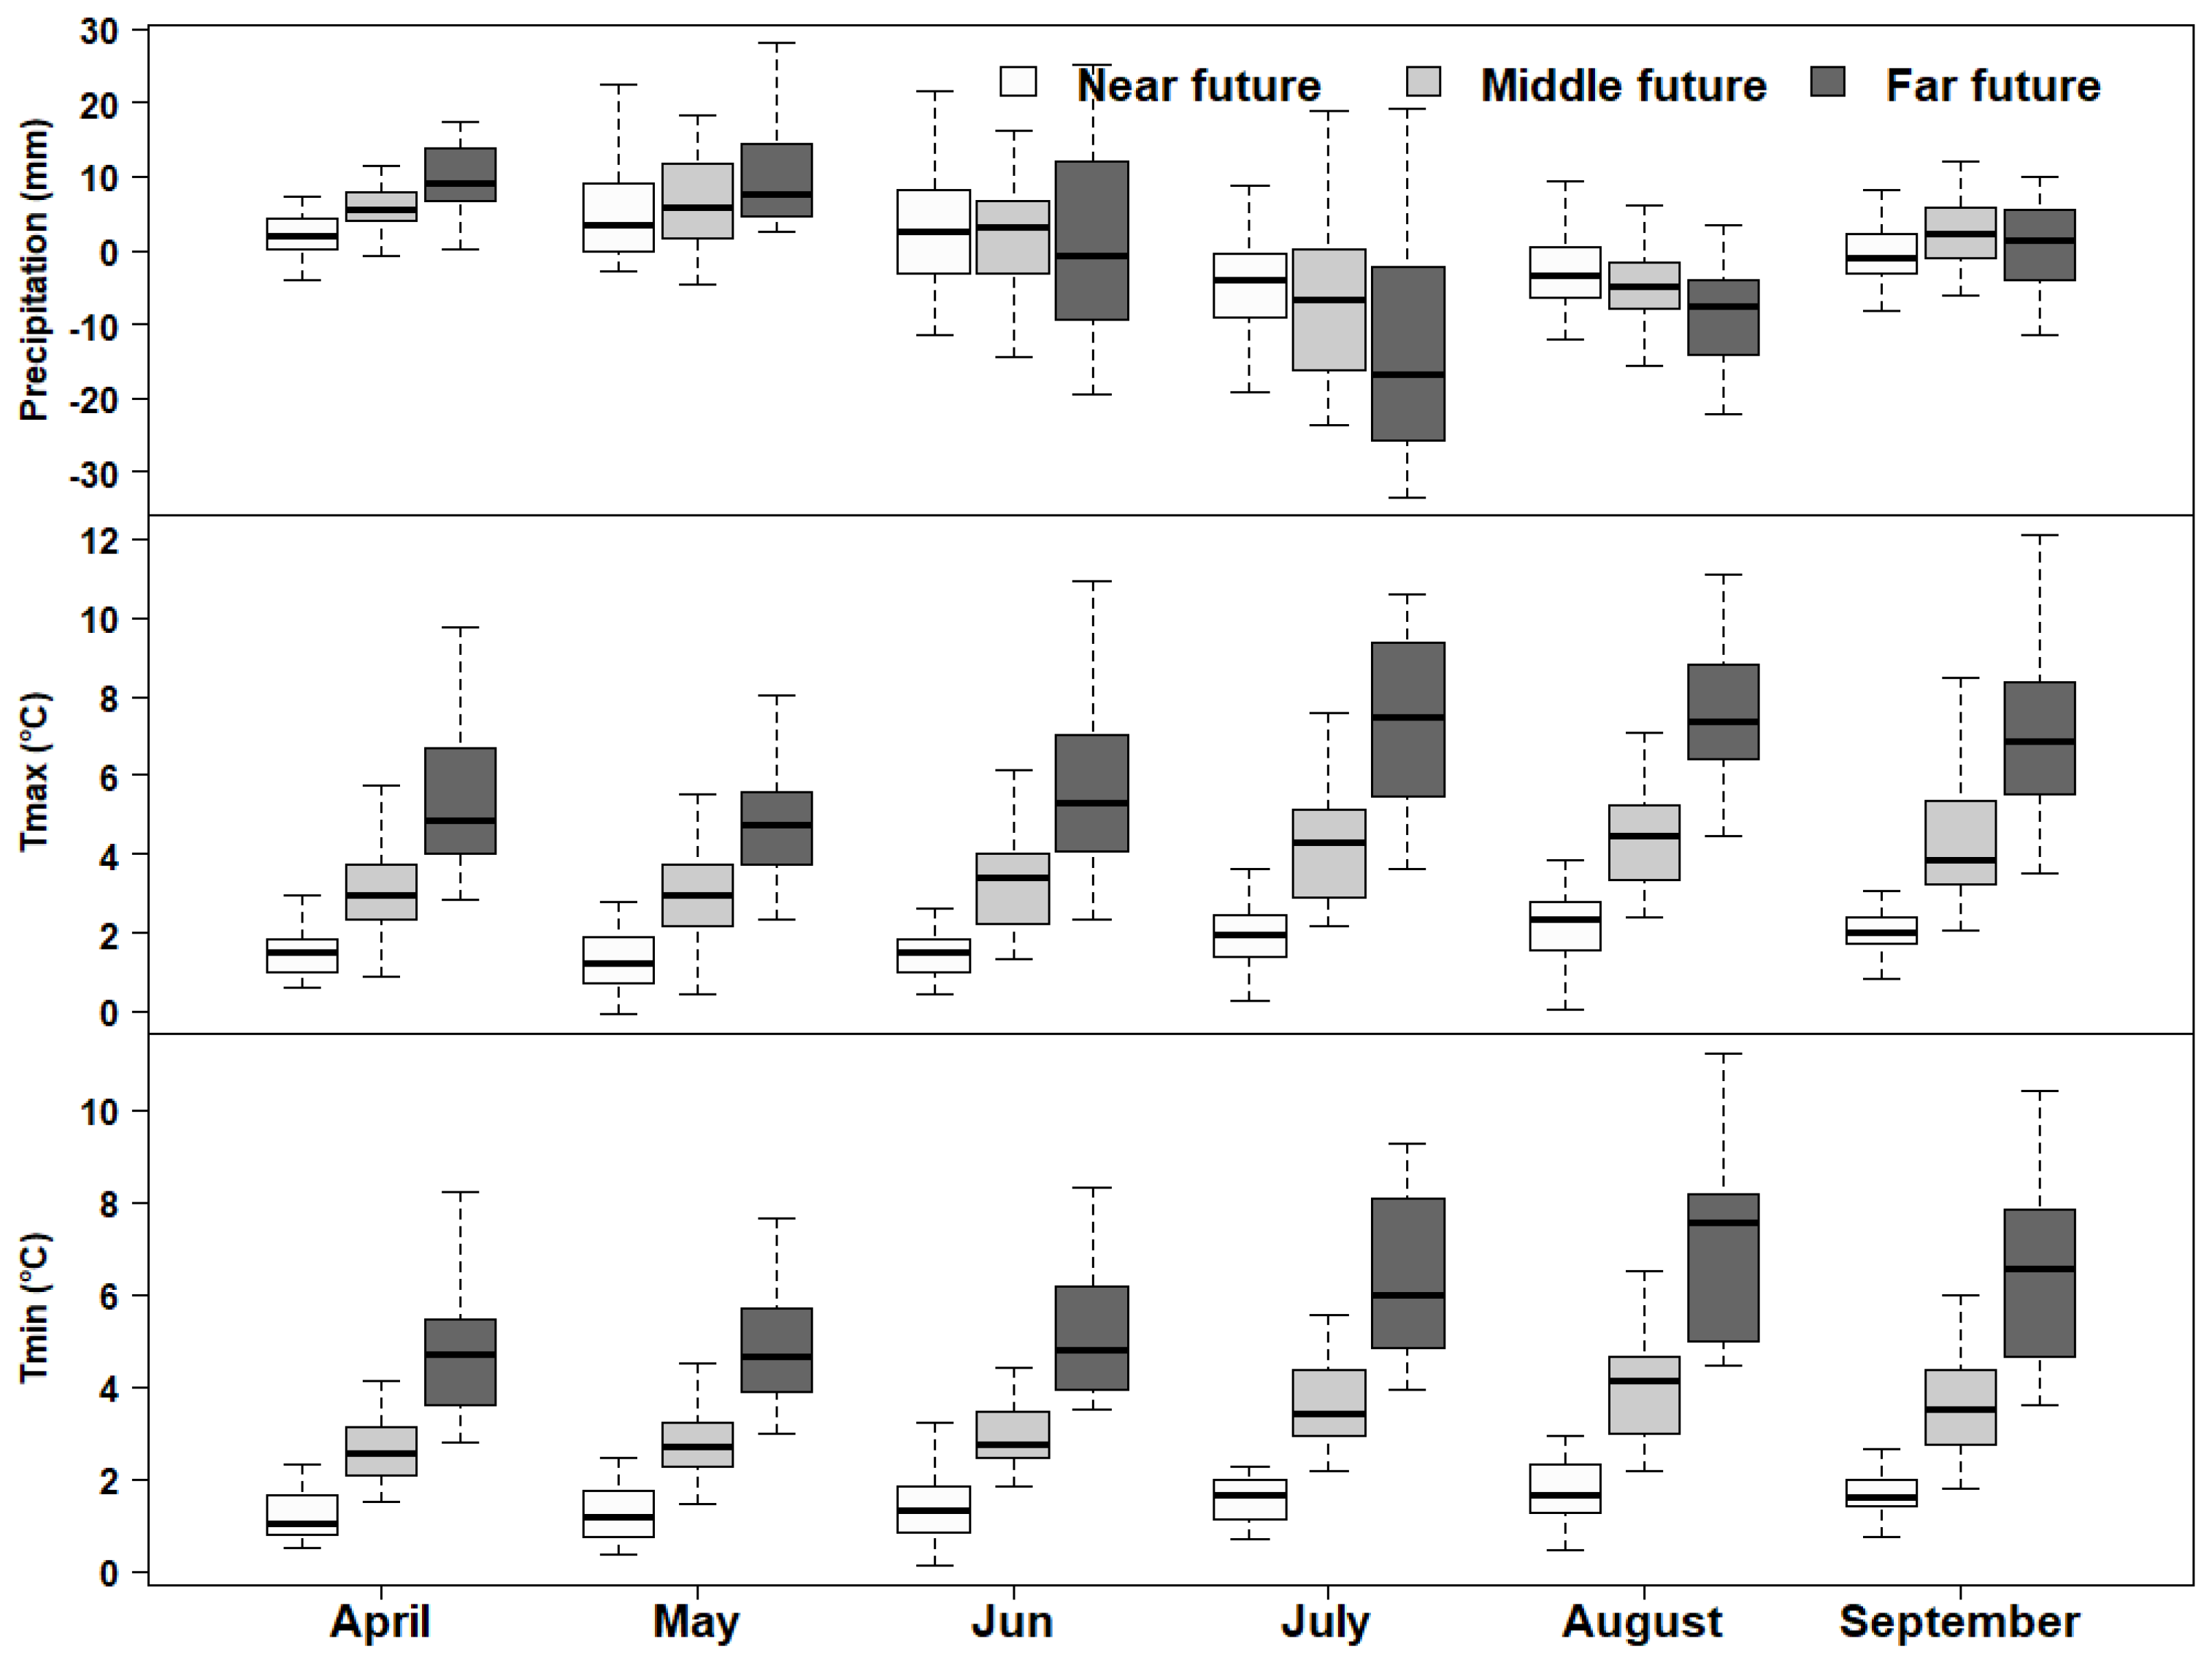
Figure 4.
Agroclimatic indices for historical and future periods. Lines: ensemble medians; shading: interquartile range (25th–75th).
Figure 4.
Agroclimatic indices for historical and future periods. Lines: ensemble medians; shading: interquartile range (25th–75th).
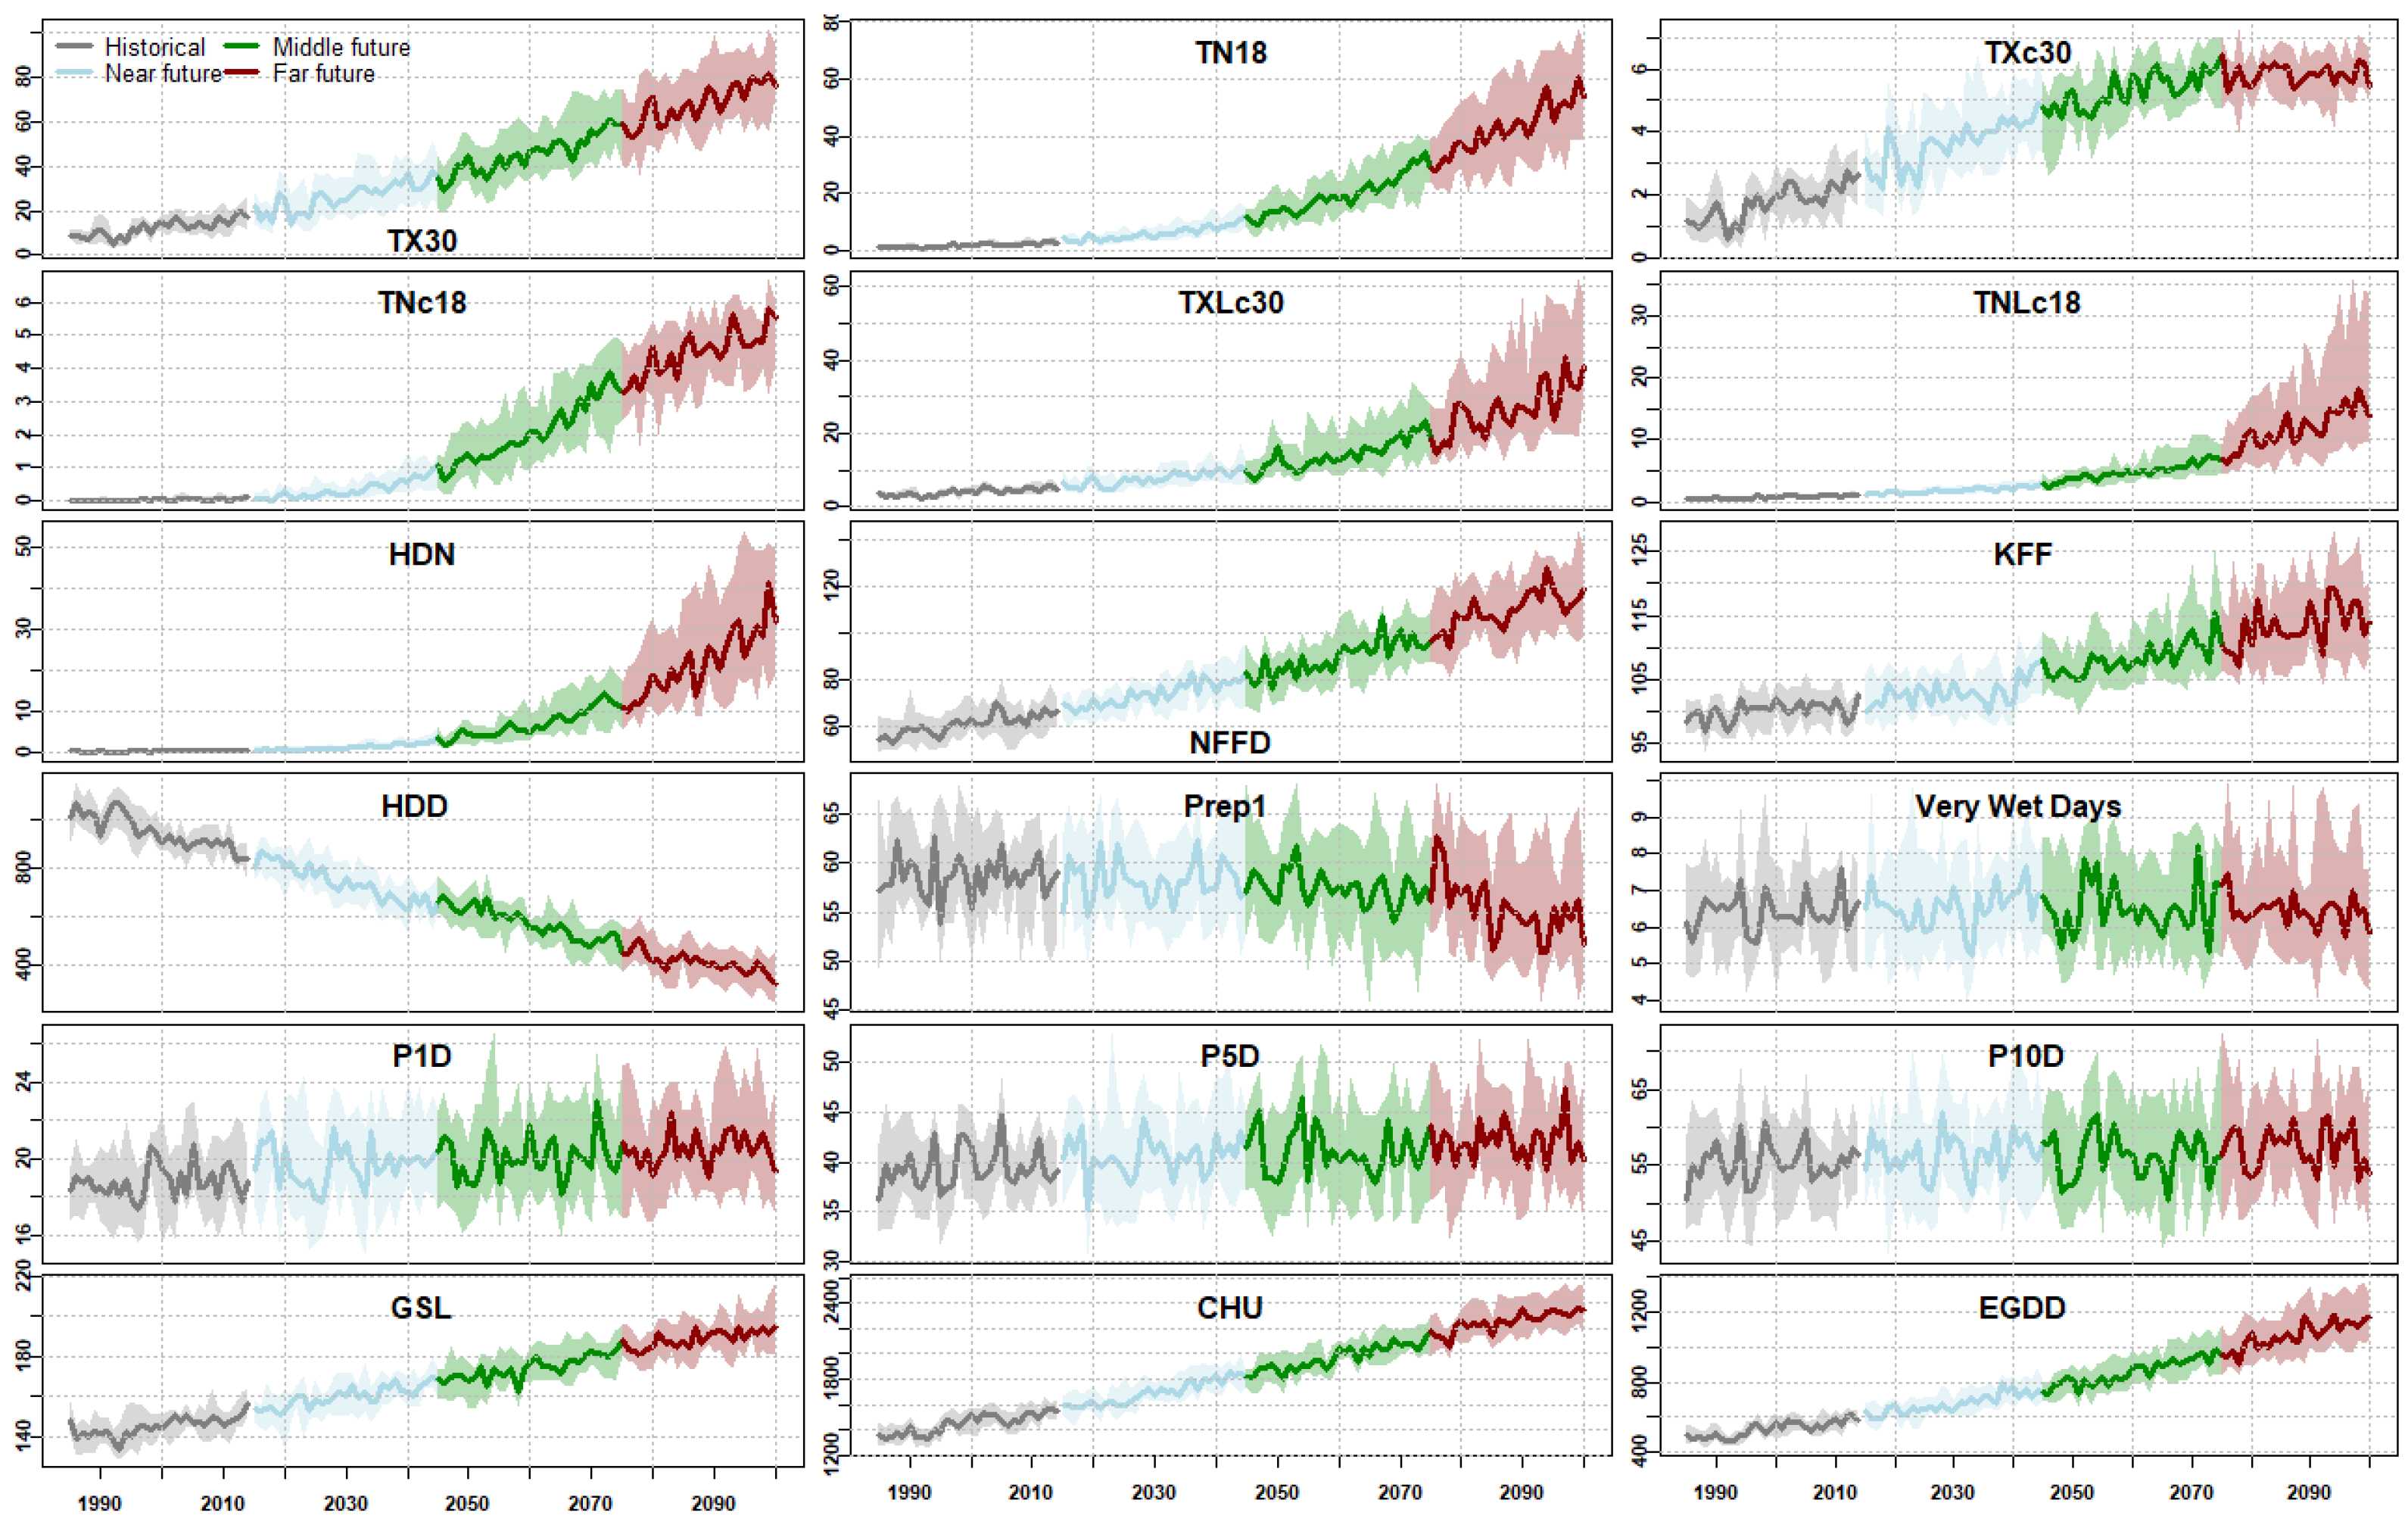
Figure 5.
Observed vs. simulated rainfed spring wheat, barley, and canola yields during calibration and validation.
Figure 5.
Observed vs. simulated rainfed spring wheat, barley, and canola yields during calibration and validation.
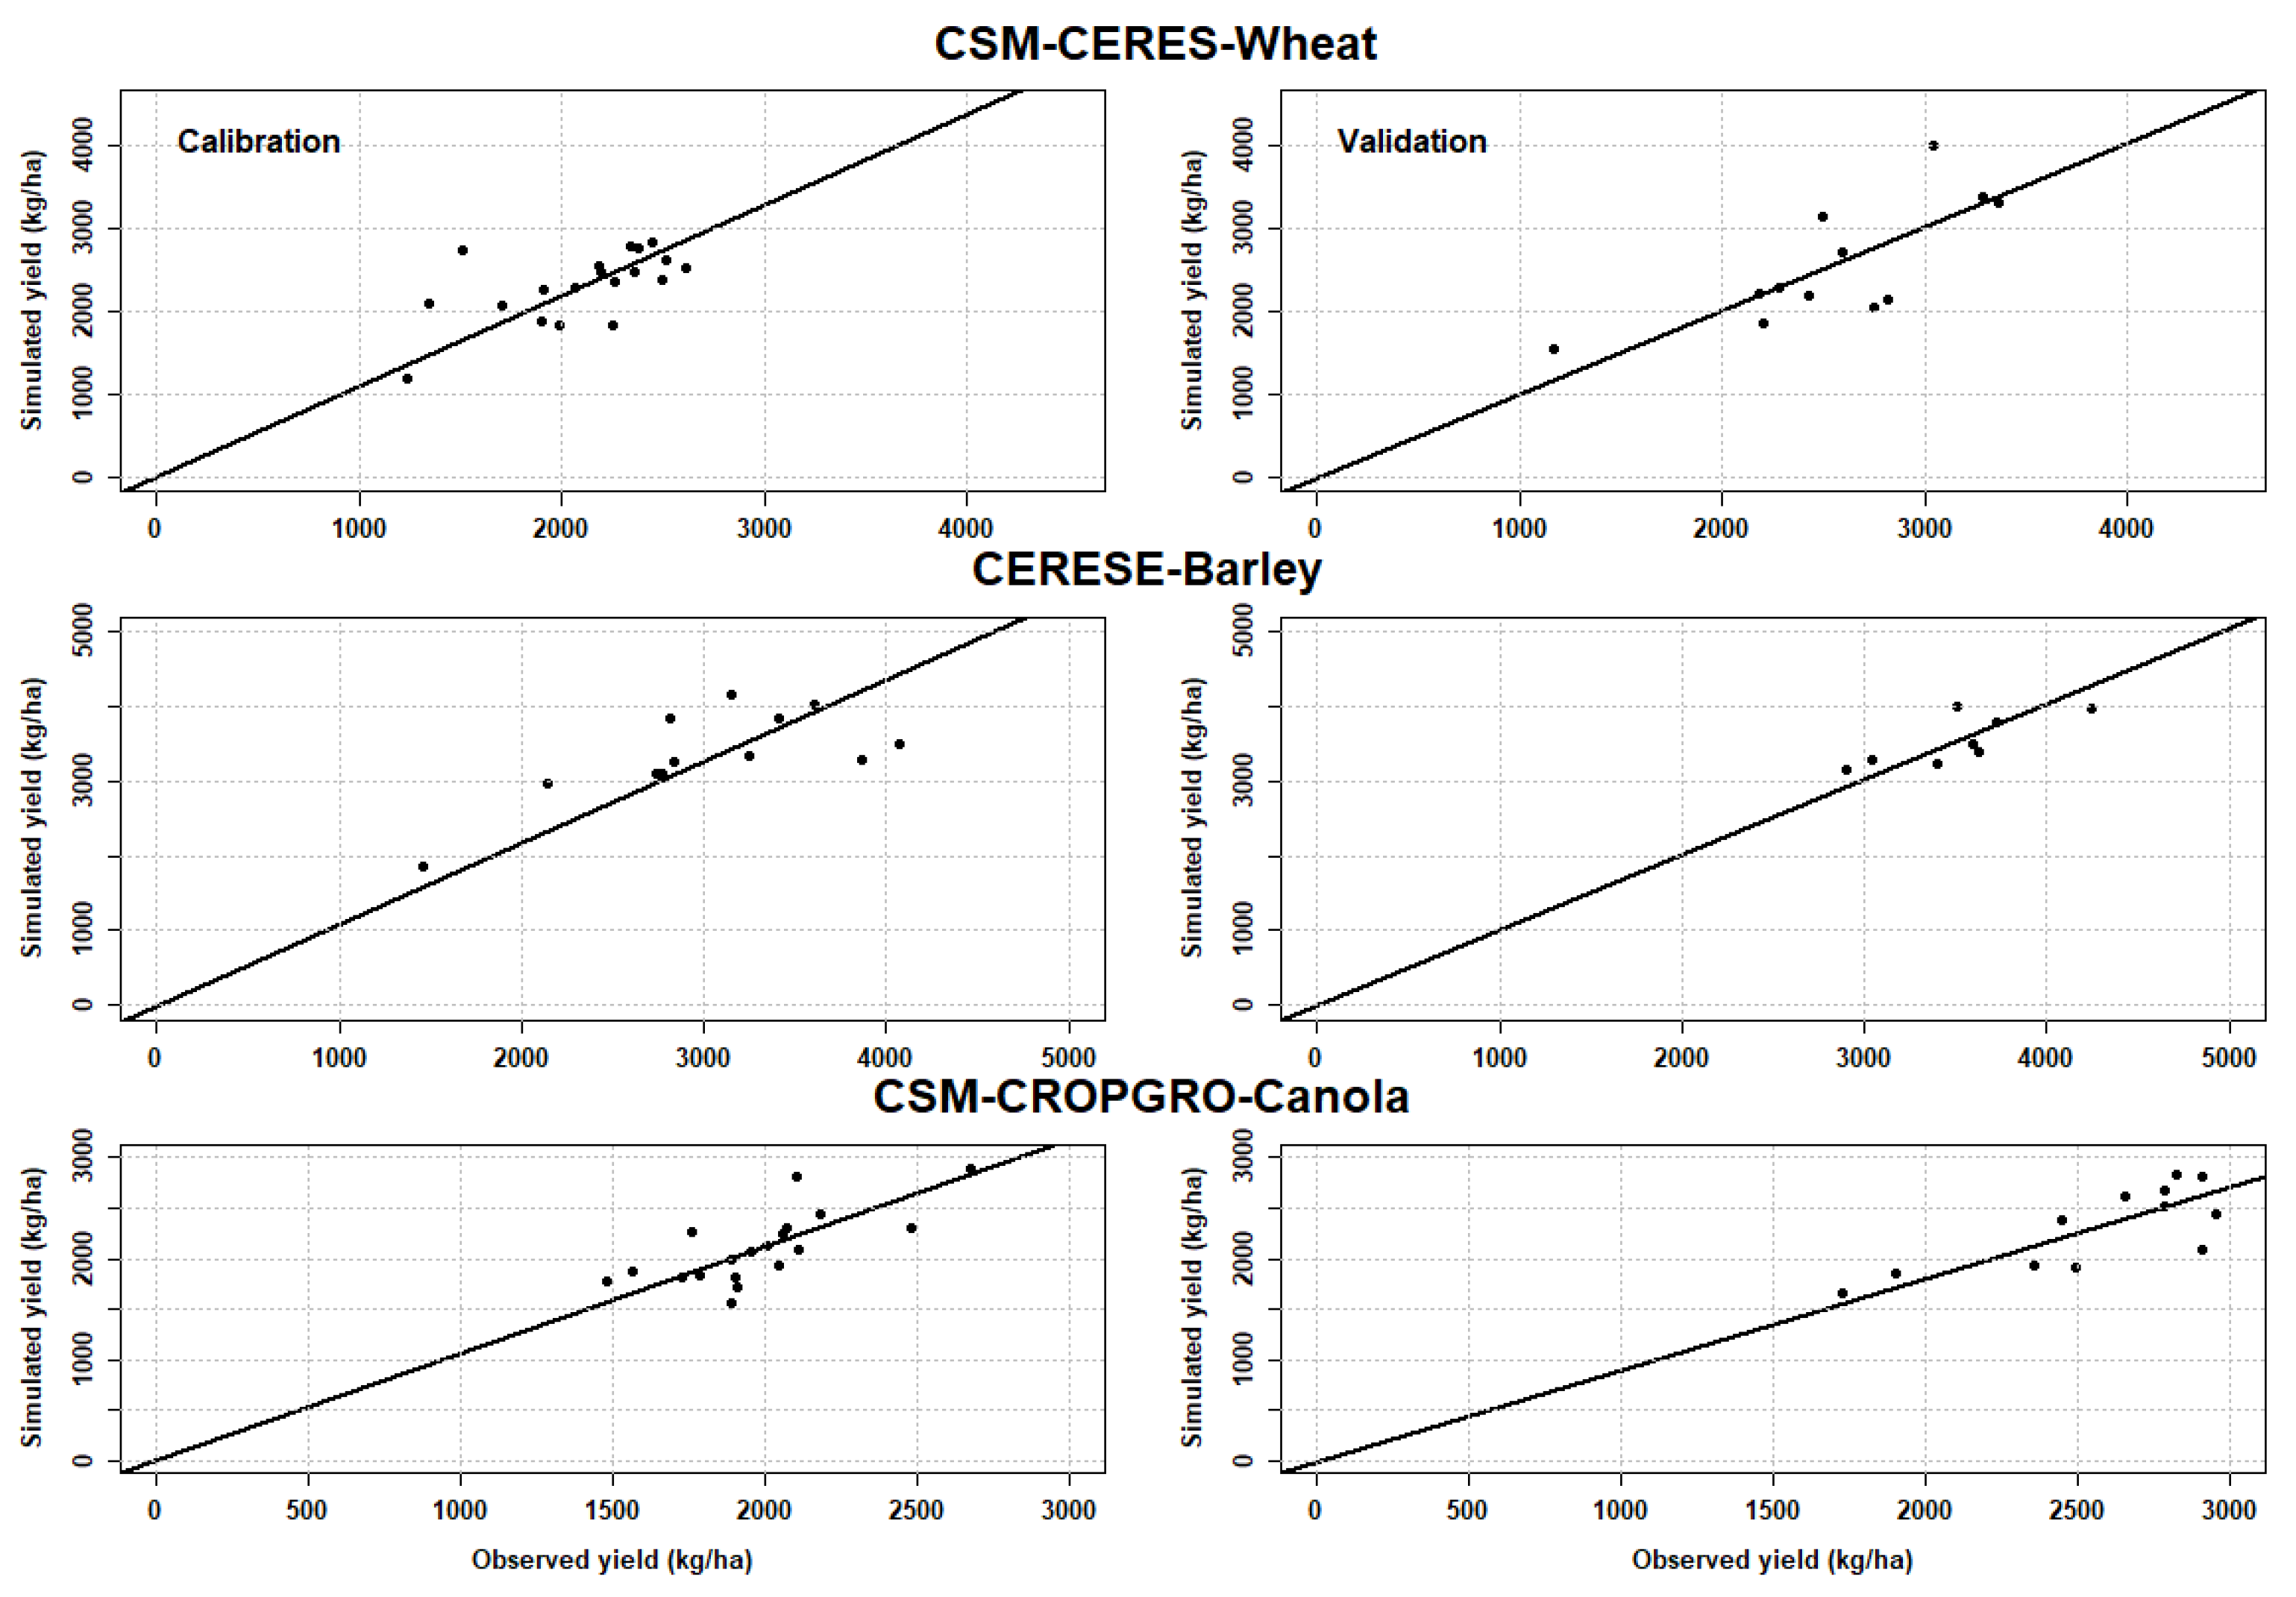
Figure 6.
The amount of spring wheat production for the historical and projection periods.
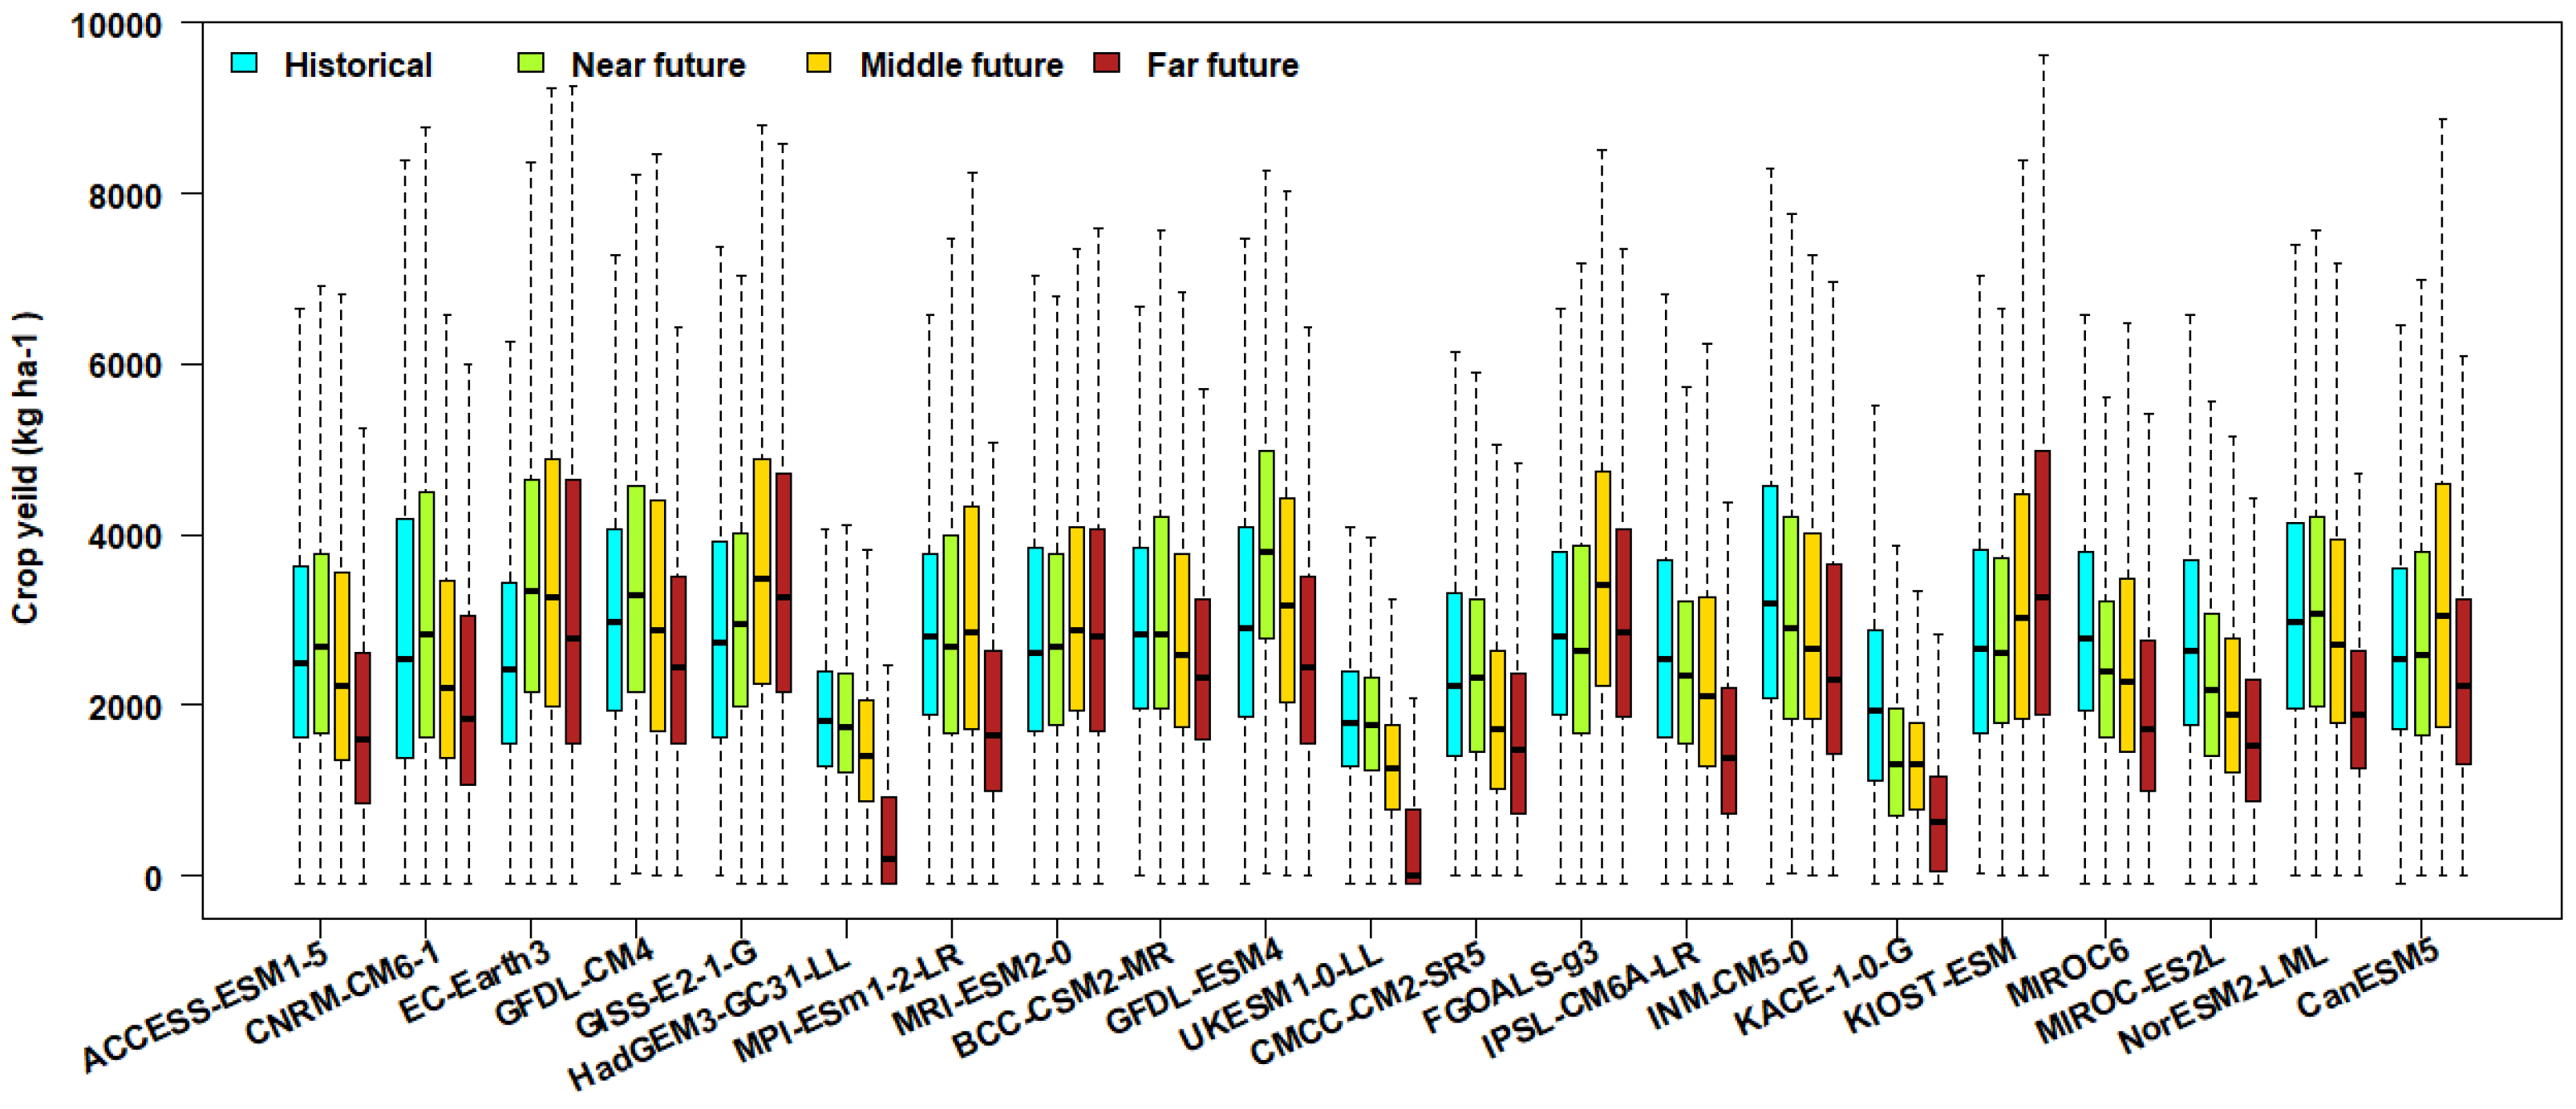
Figure 7.
The amount of barley production for the historical and projection periods.
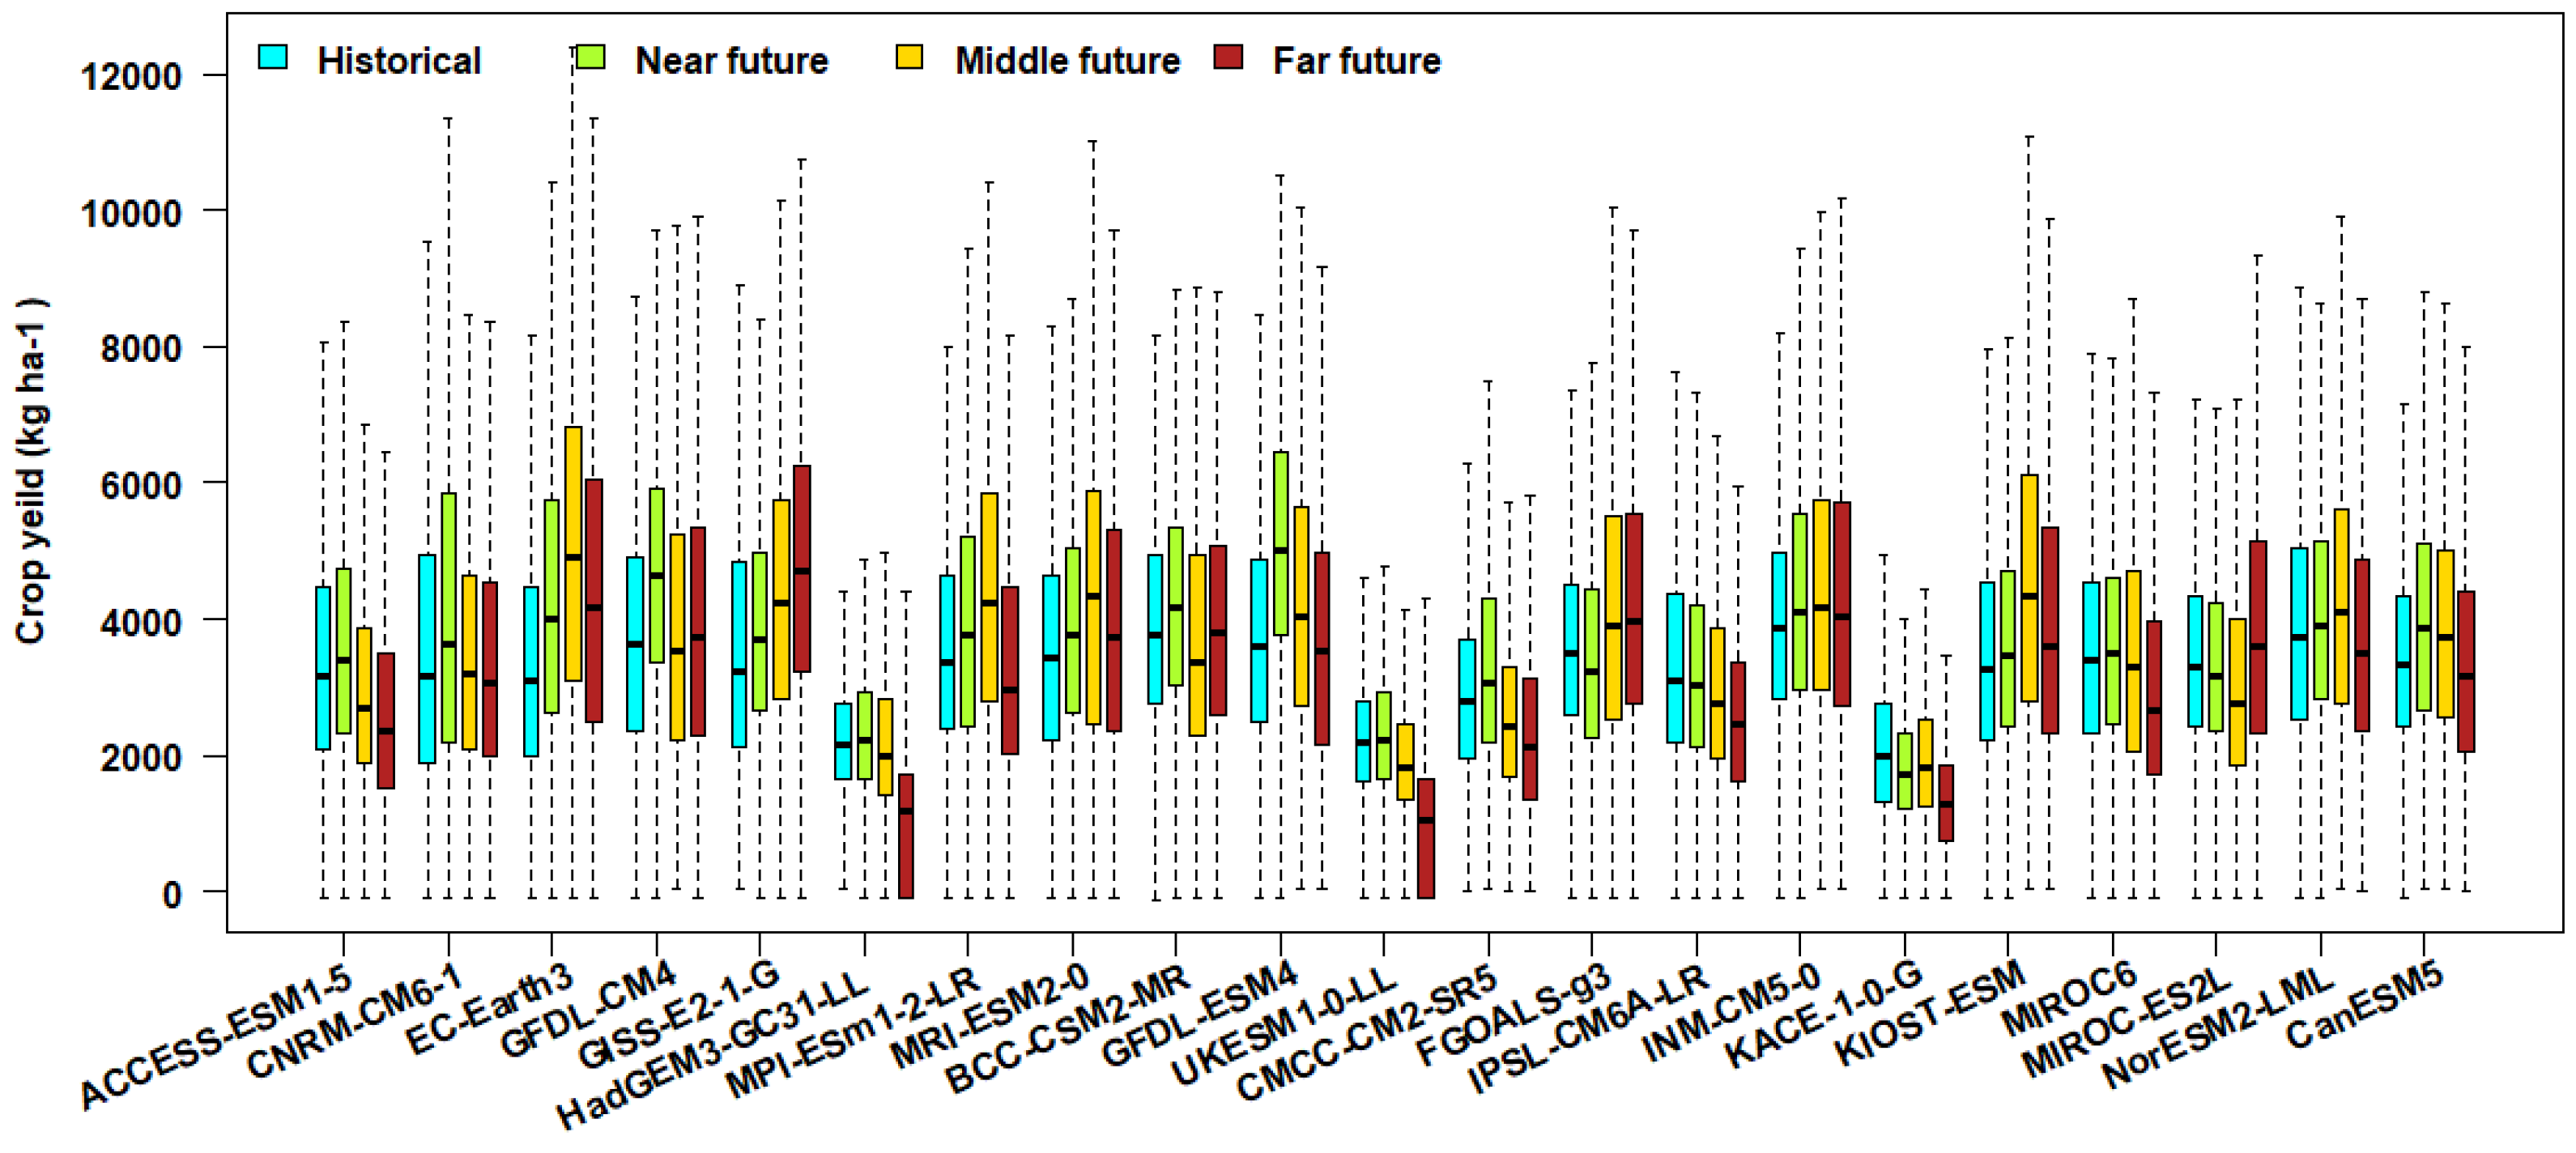
Figure 8.
The amount of canola production for the historical and projection periods.
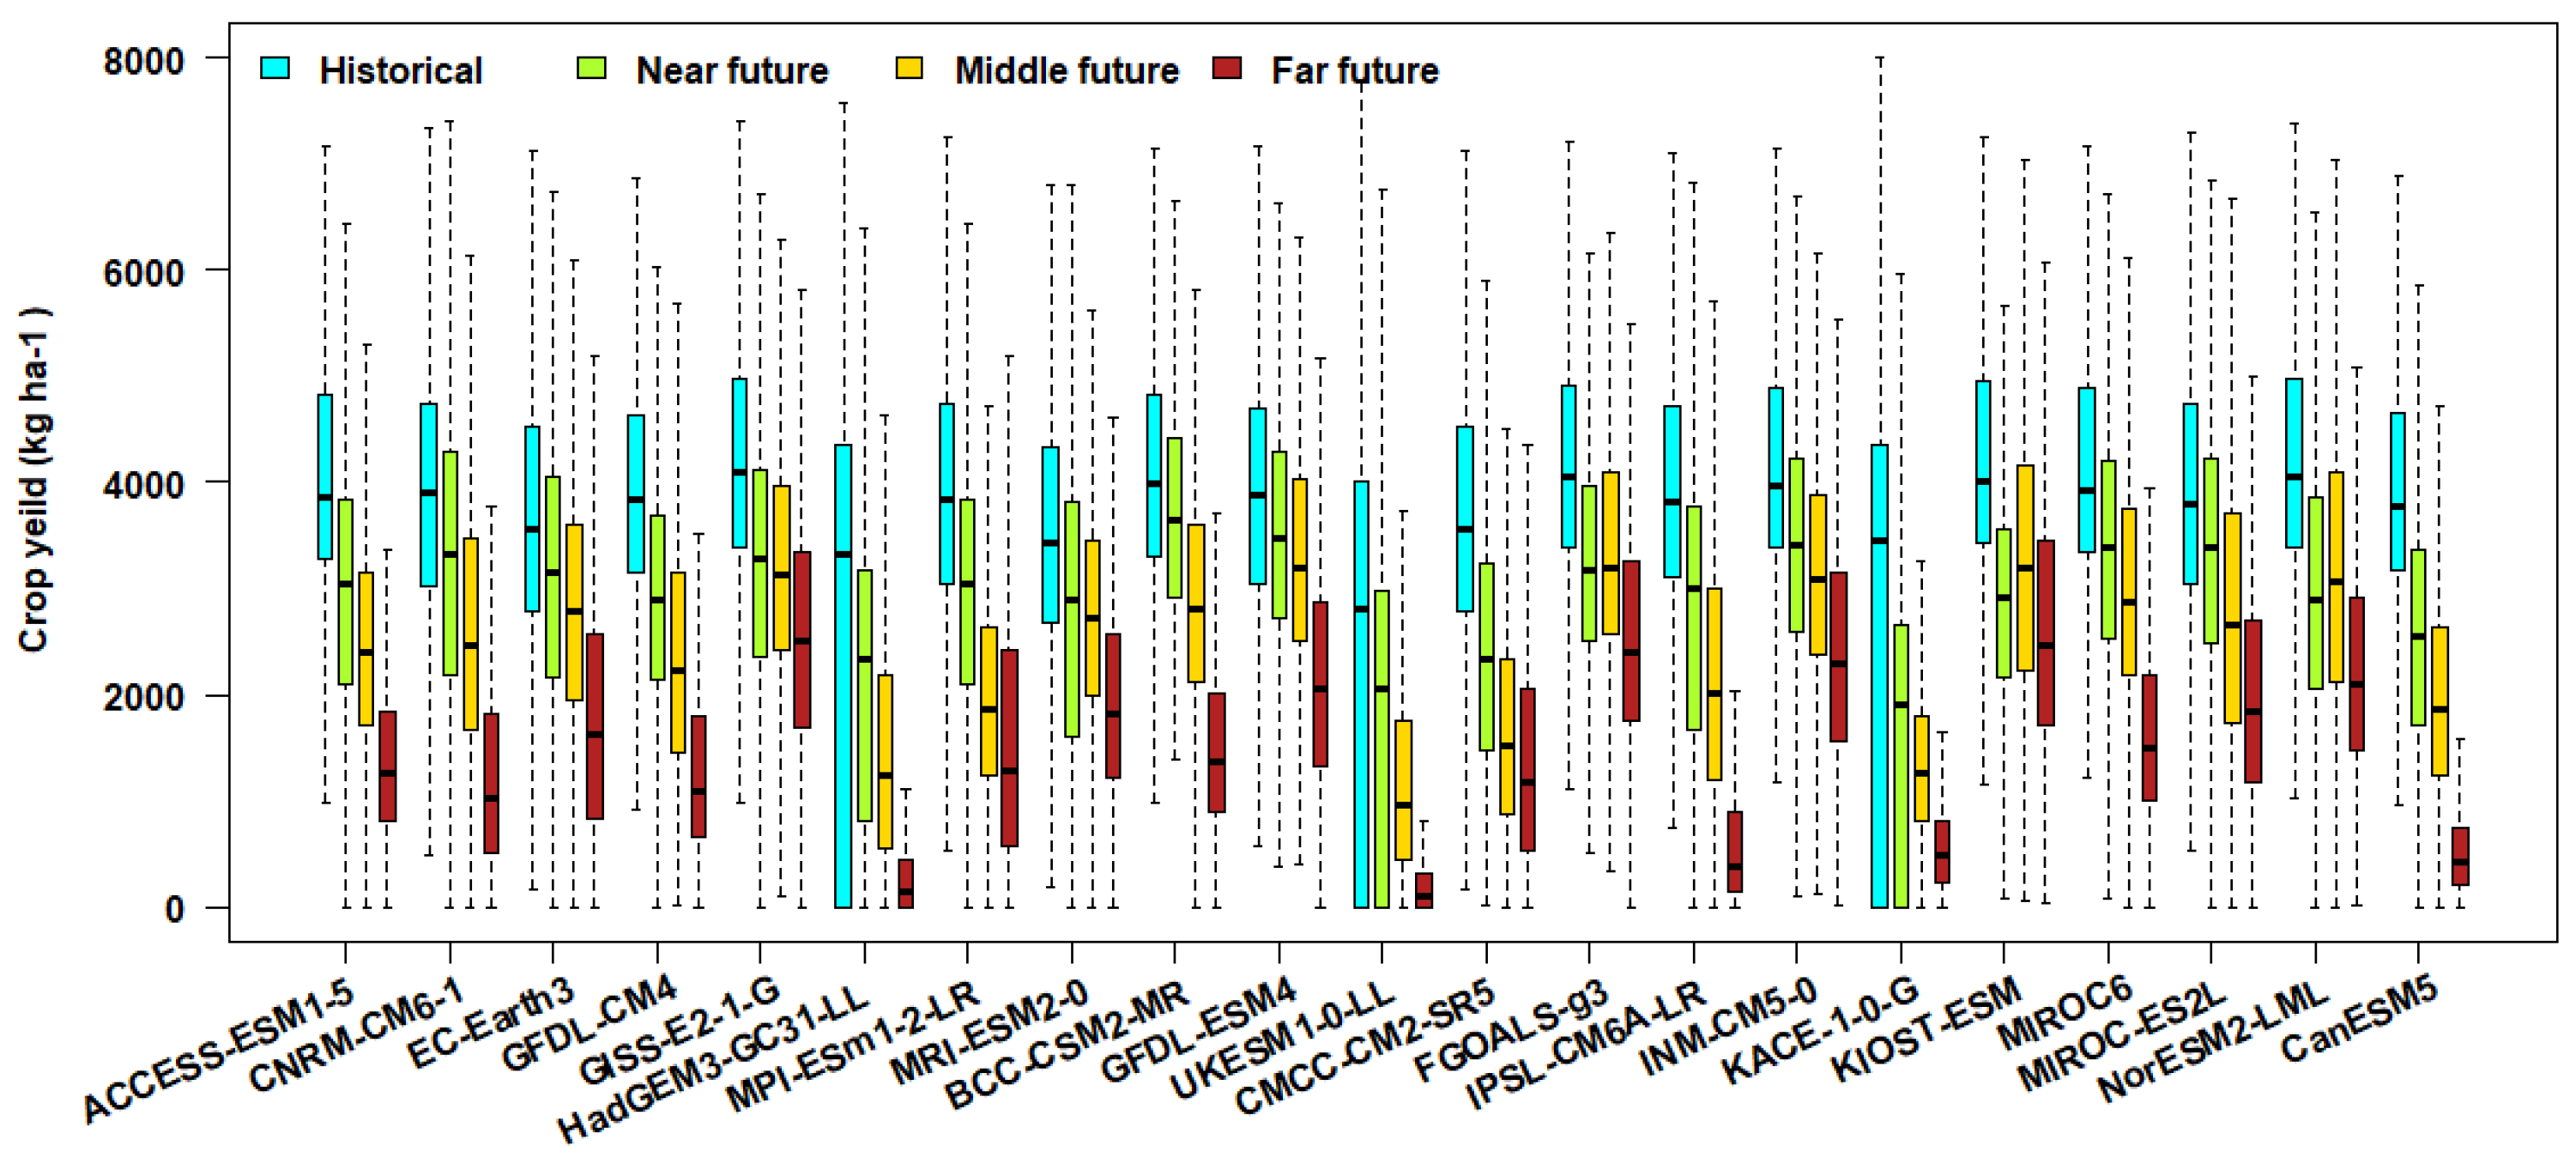
Figure 9.
Spring wheat yields relative to historical and future periods. The solid line represents the multi-model median value.
Figure 9.
Spring wheat yields relative to historical and future periods. The solid line represents the multi-model median value.
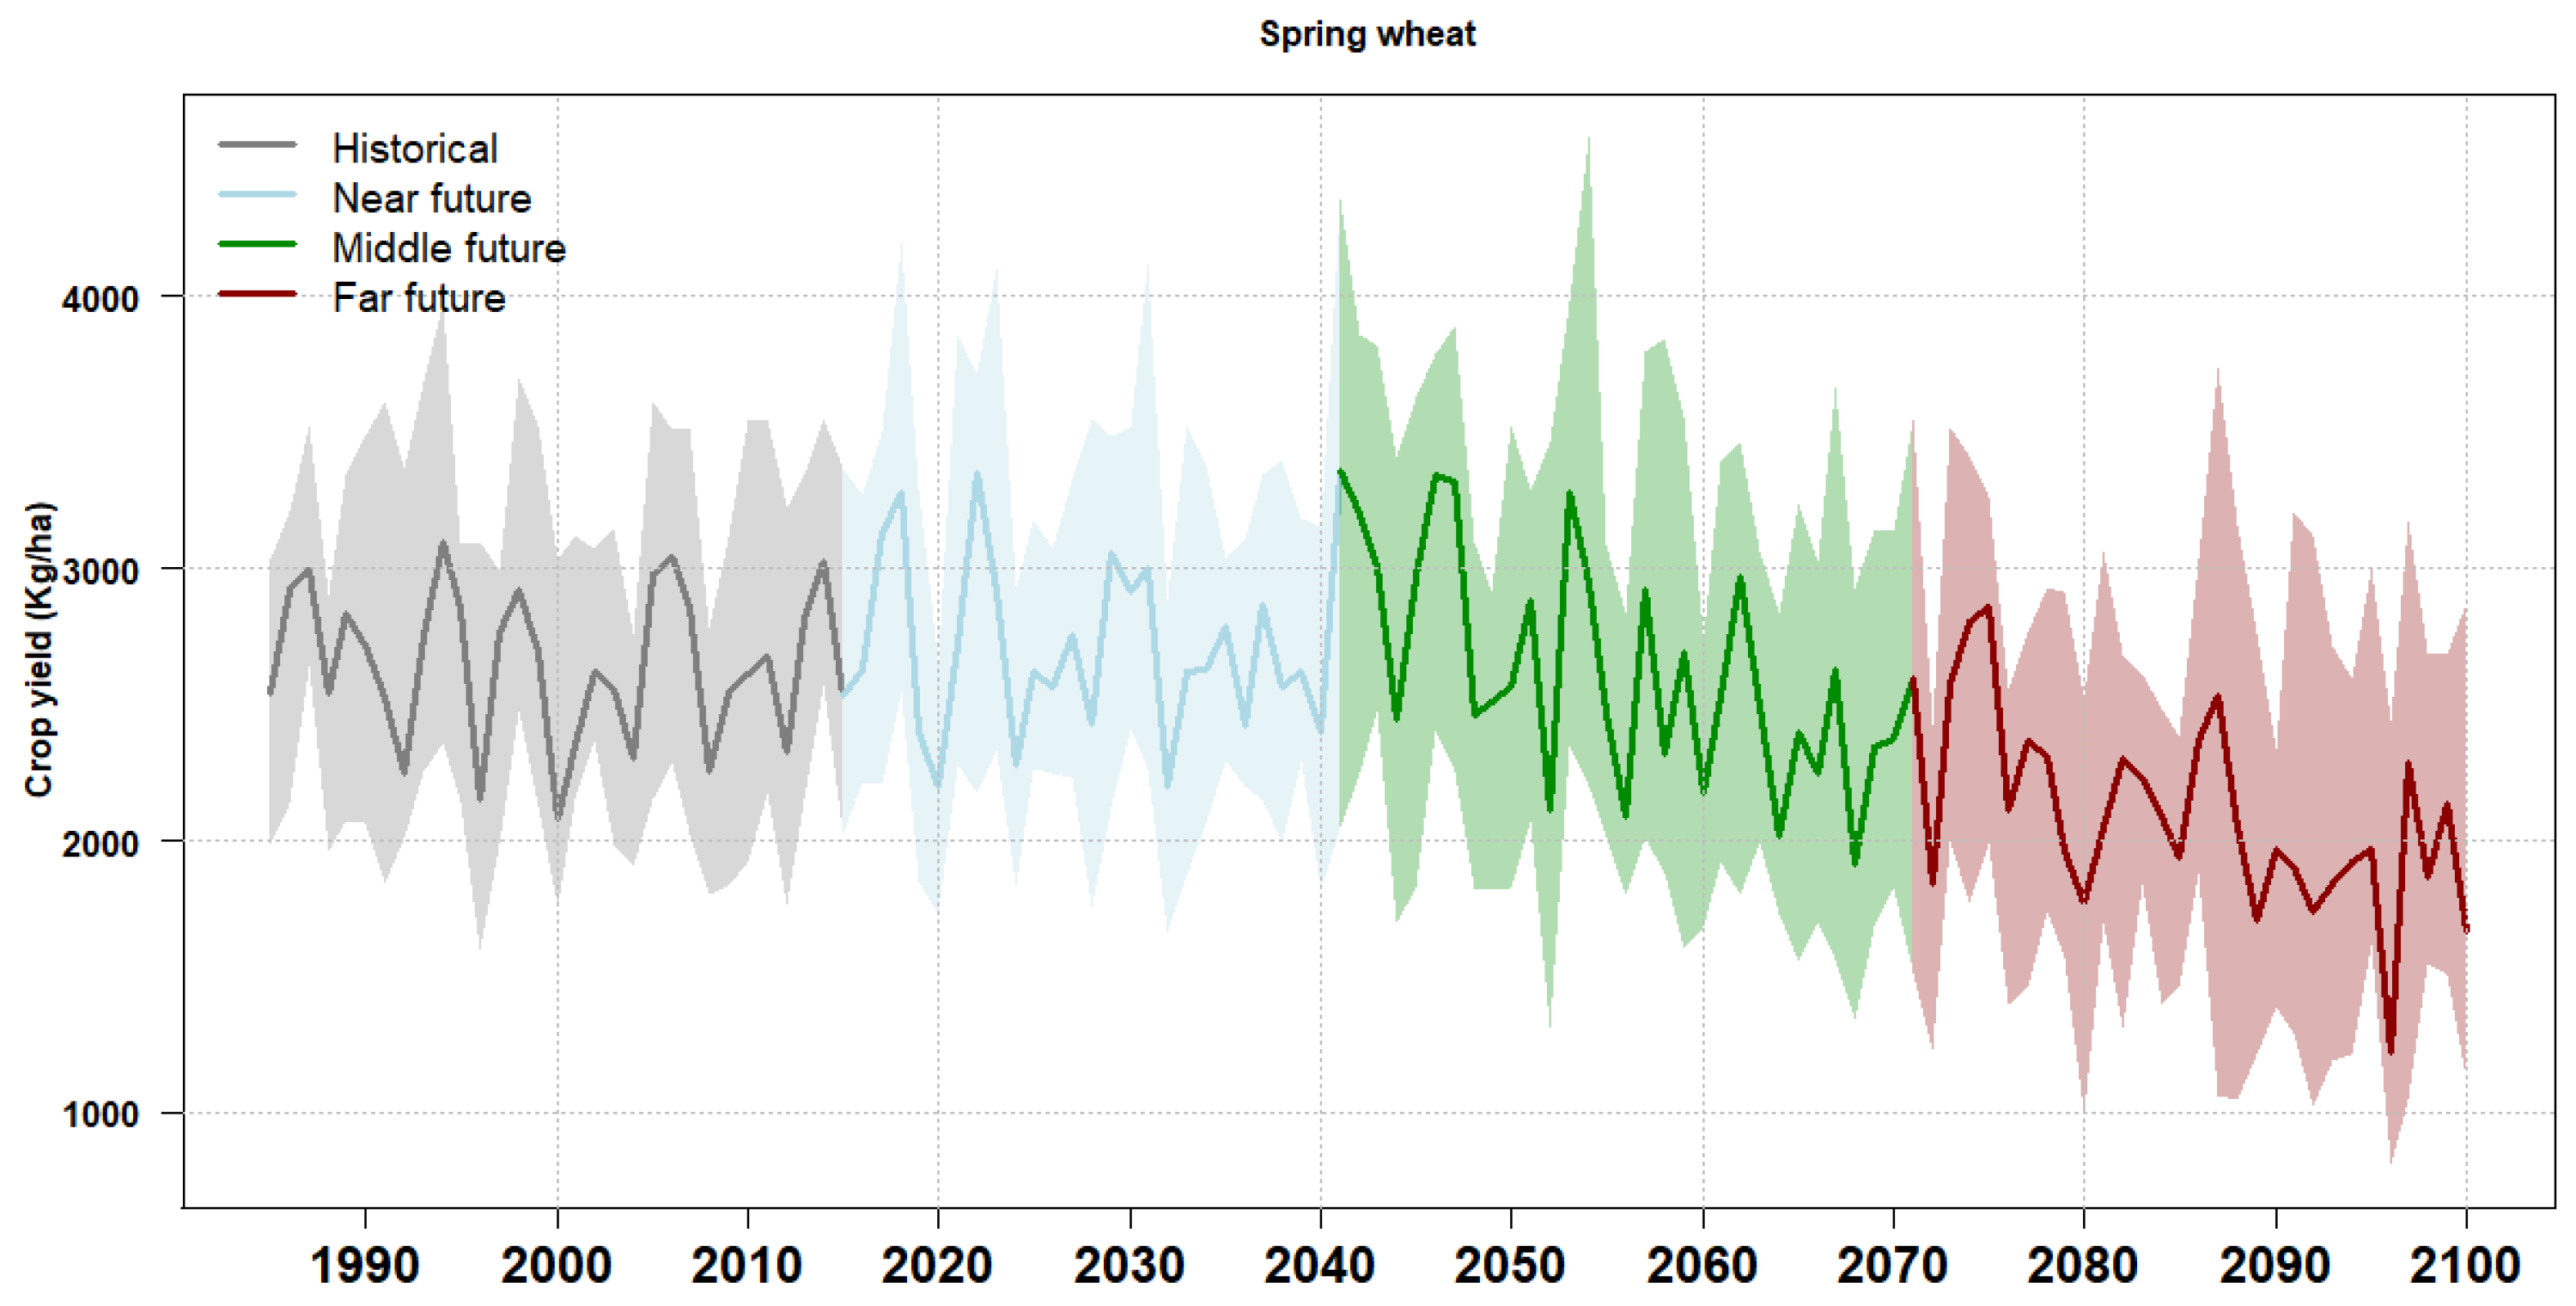
Figure 10.
Barley yields in historical and future periods. The solid line represents the multi-model median value.
Figure 10.
Barley yields in historical and future periods. The solid line represents the multi-model median value.
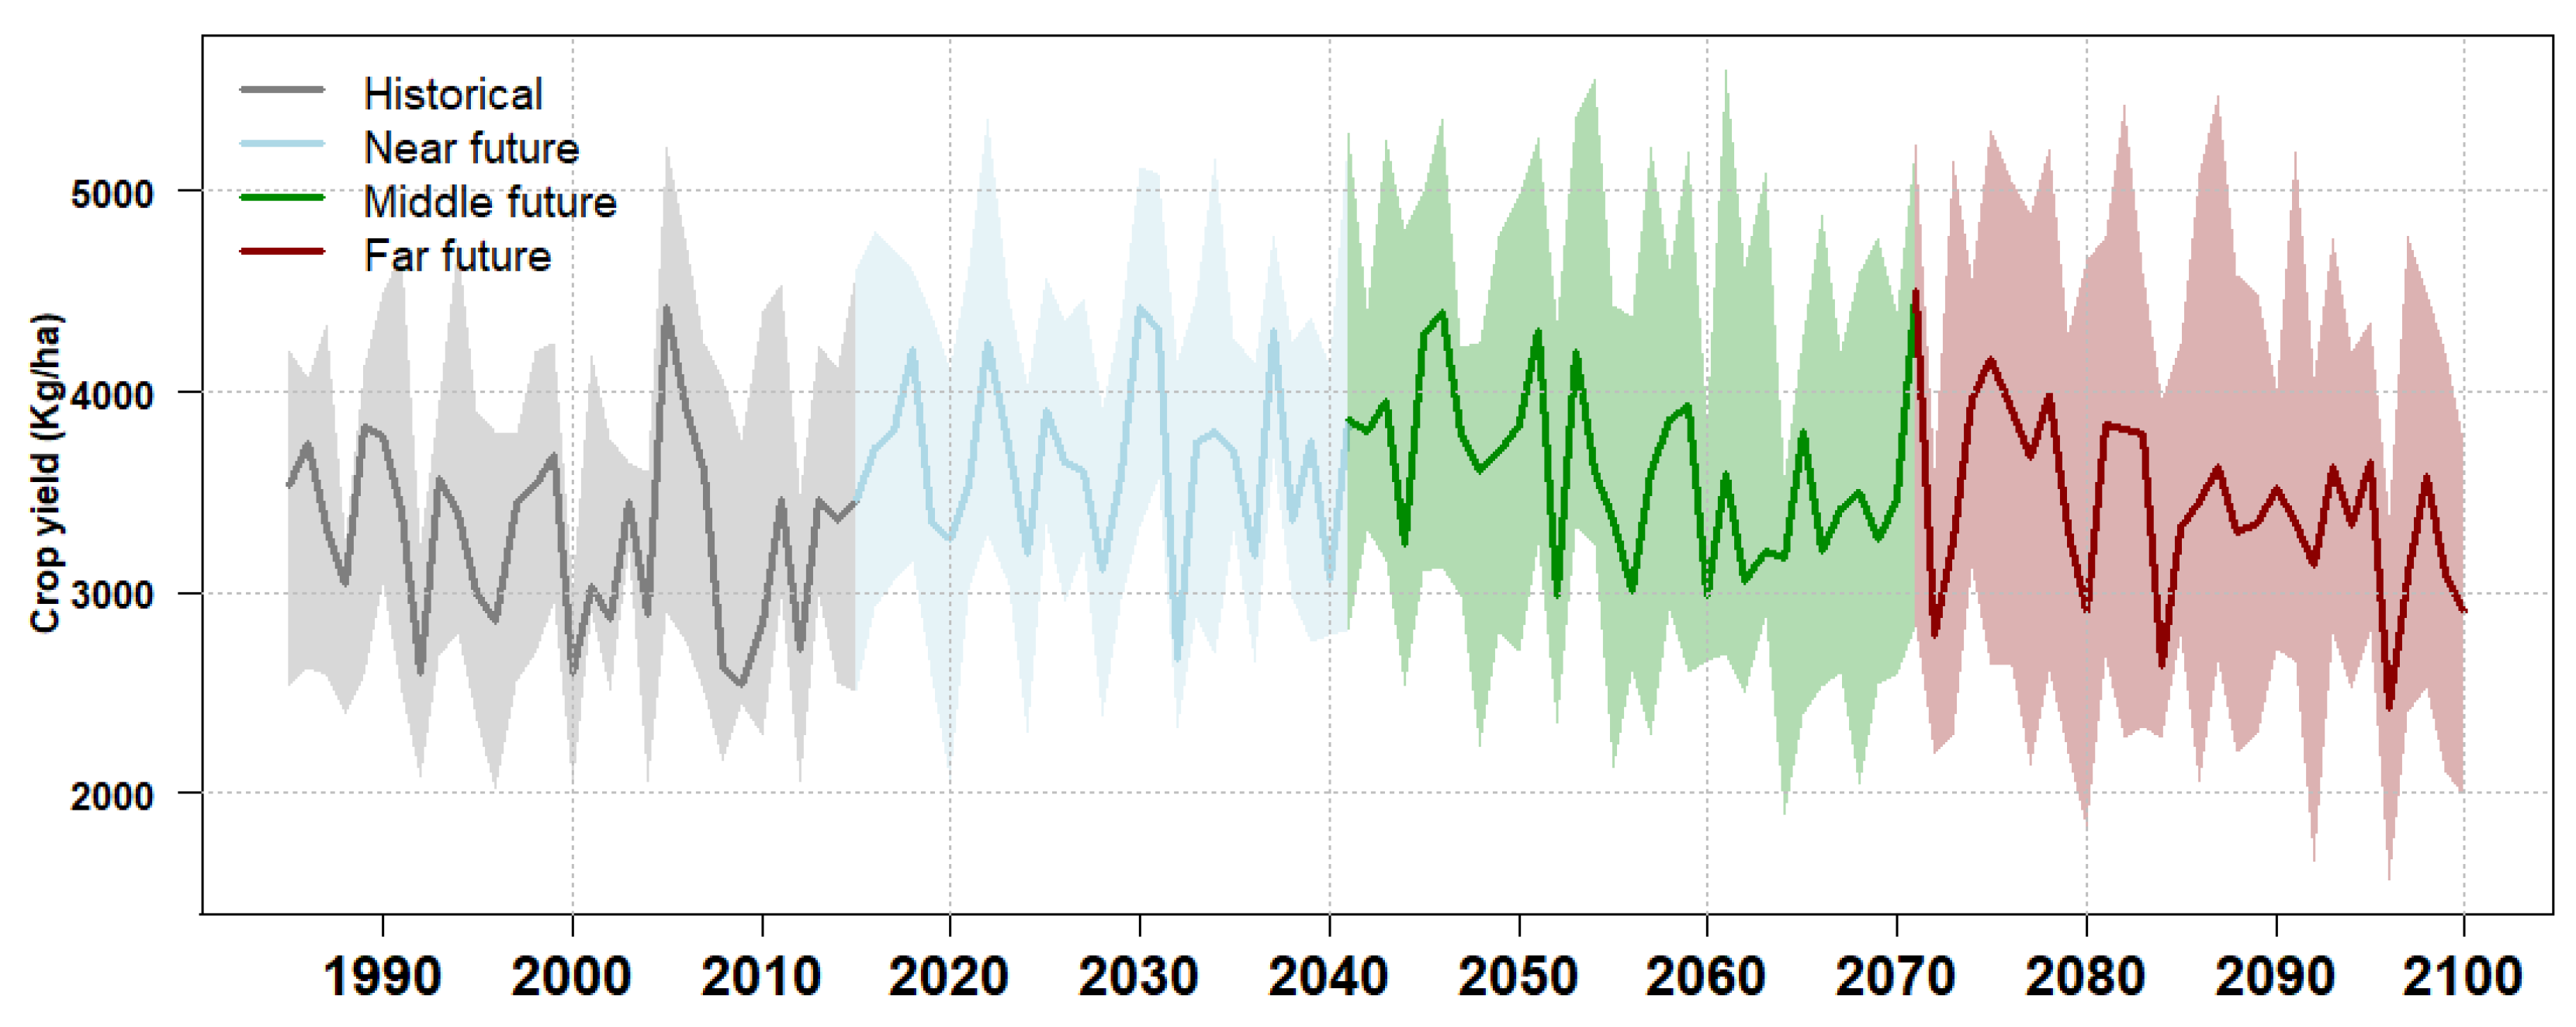
Figure 11.
Canola yields in historical and future periods. The solid line represents the multi-model median value.
Figure 11.
Canola yields in historical and future periods. The solid line represents the multi-model median value.
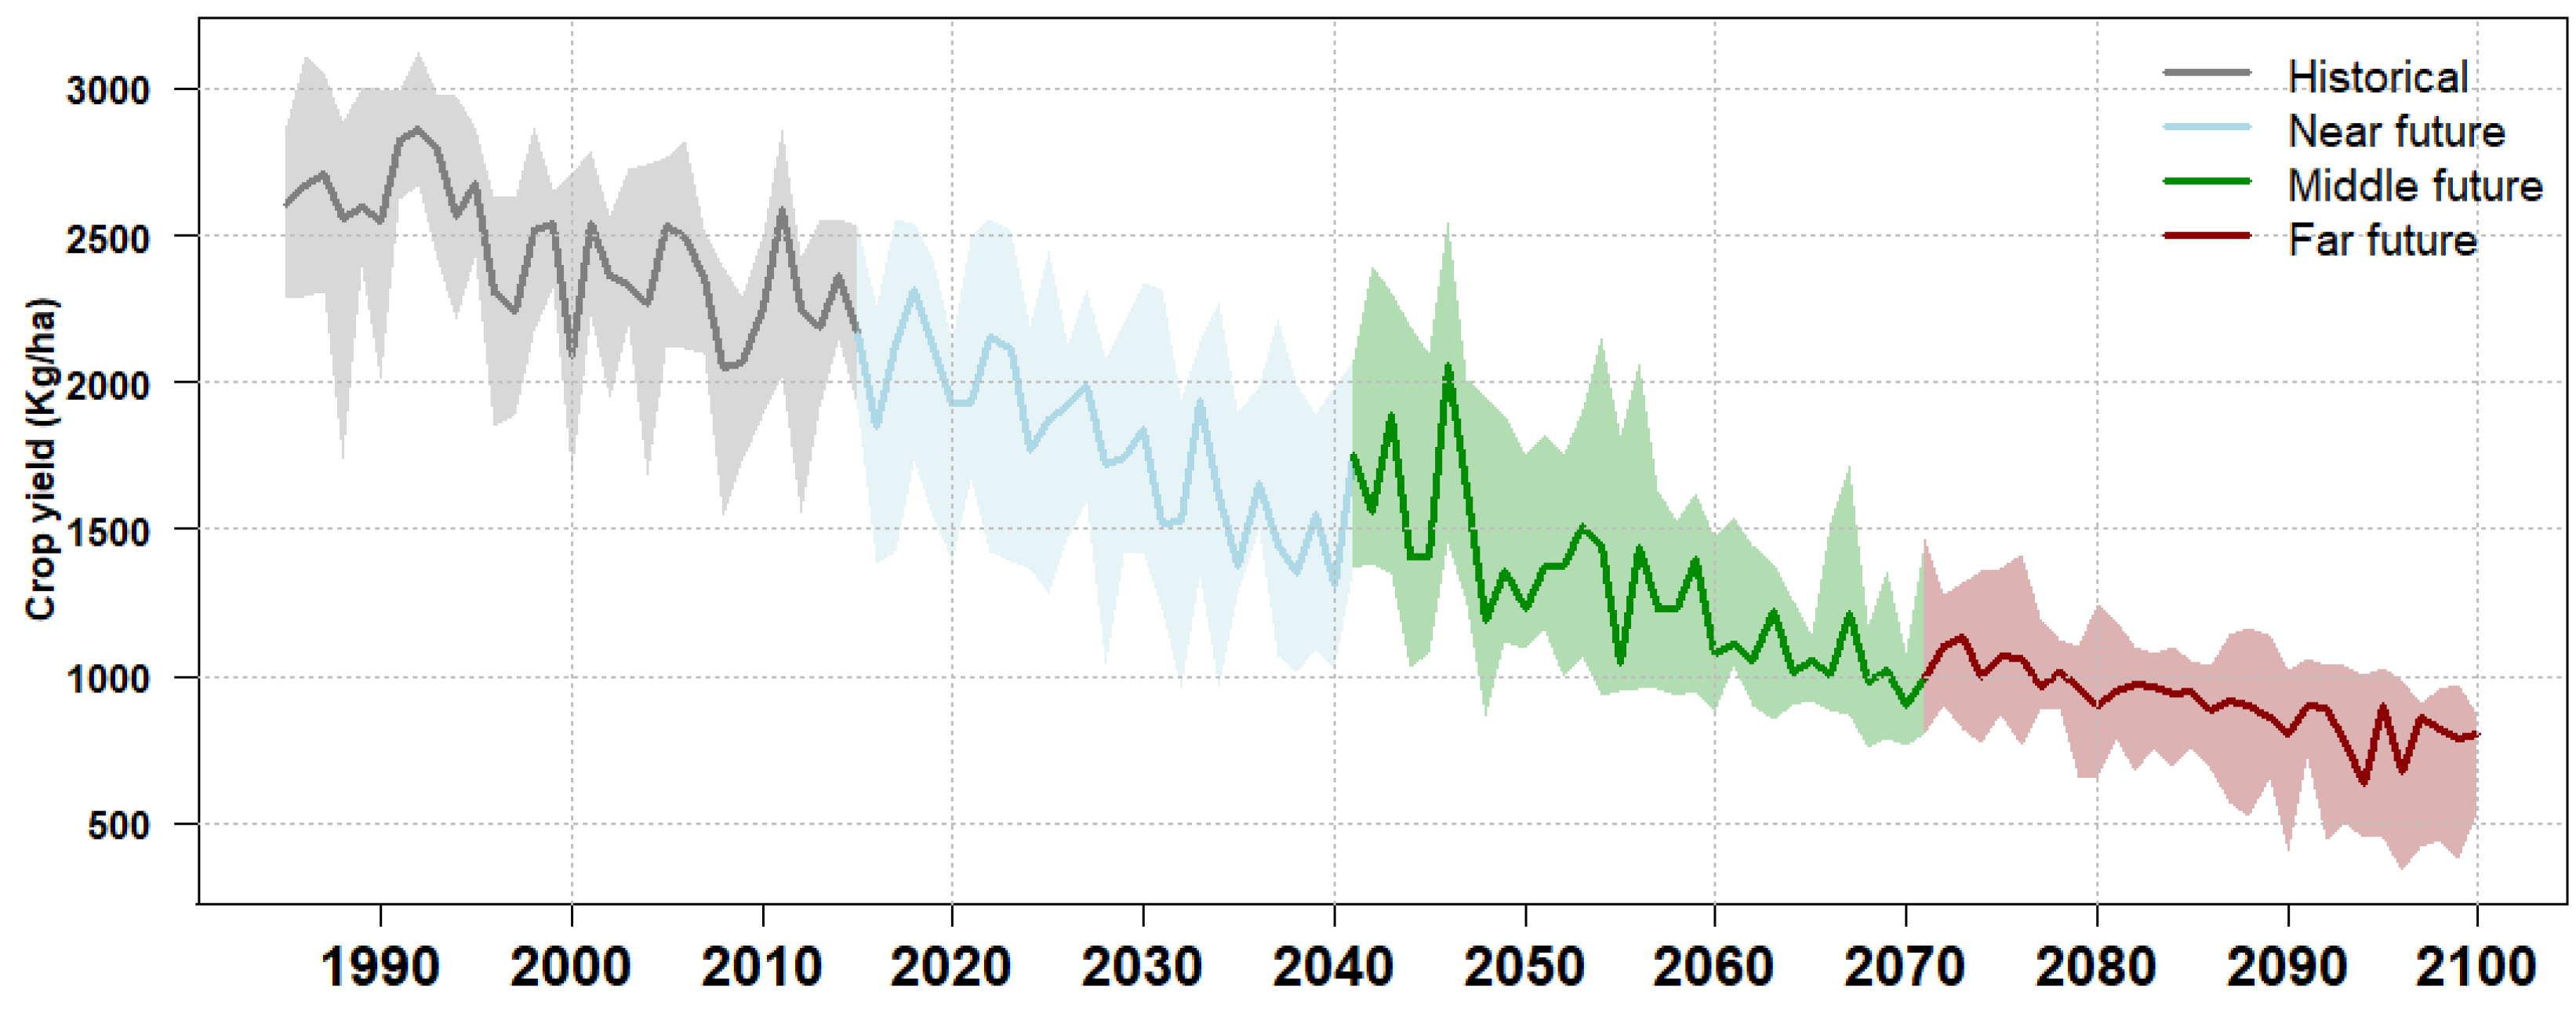
Figure 12.
The geographic distribution of median projected wheat yield in the prairie agricultural zone for historical and future periods.
Figure 12.
The geographic distribution of median projected wheat yield in the prairie agricultural zone for historical and future periods.
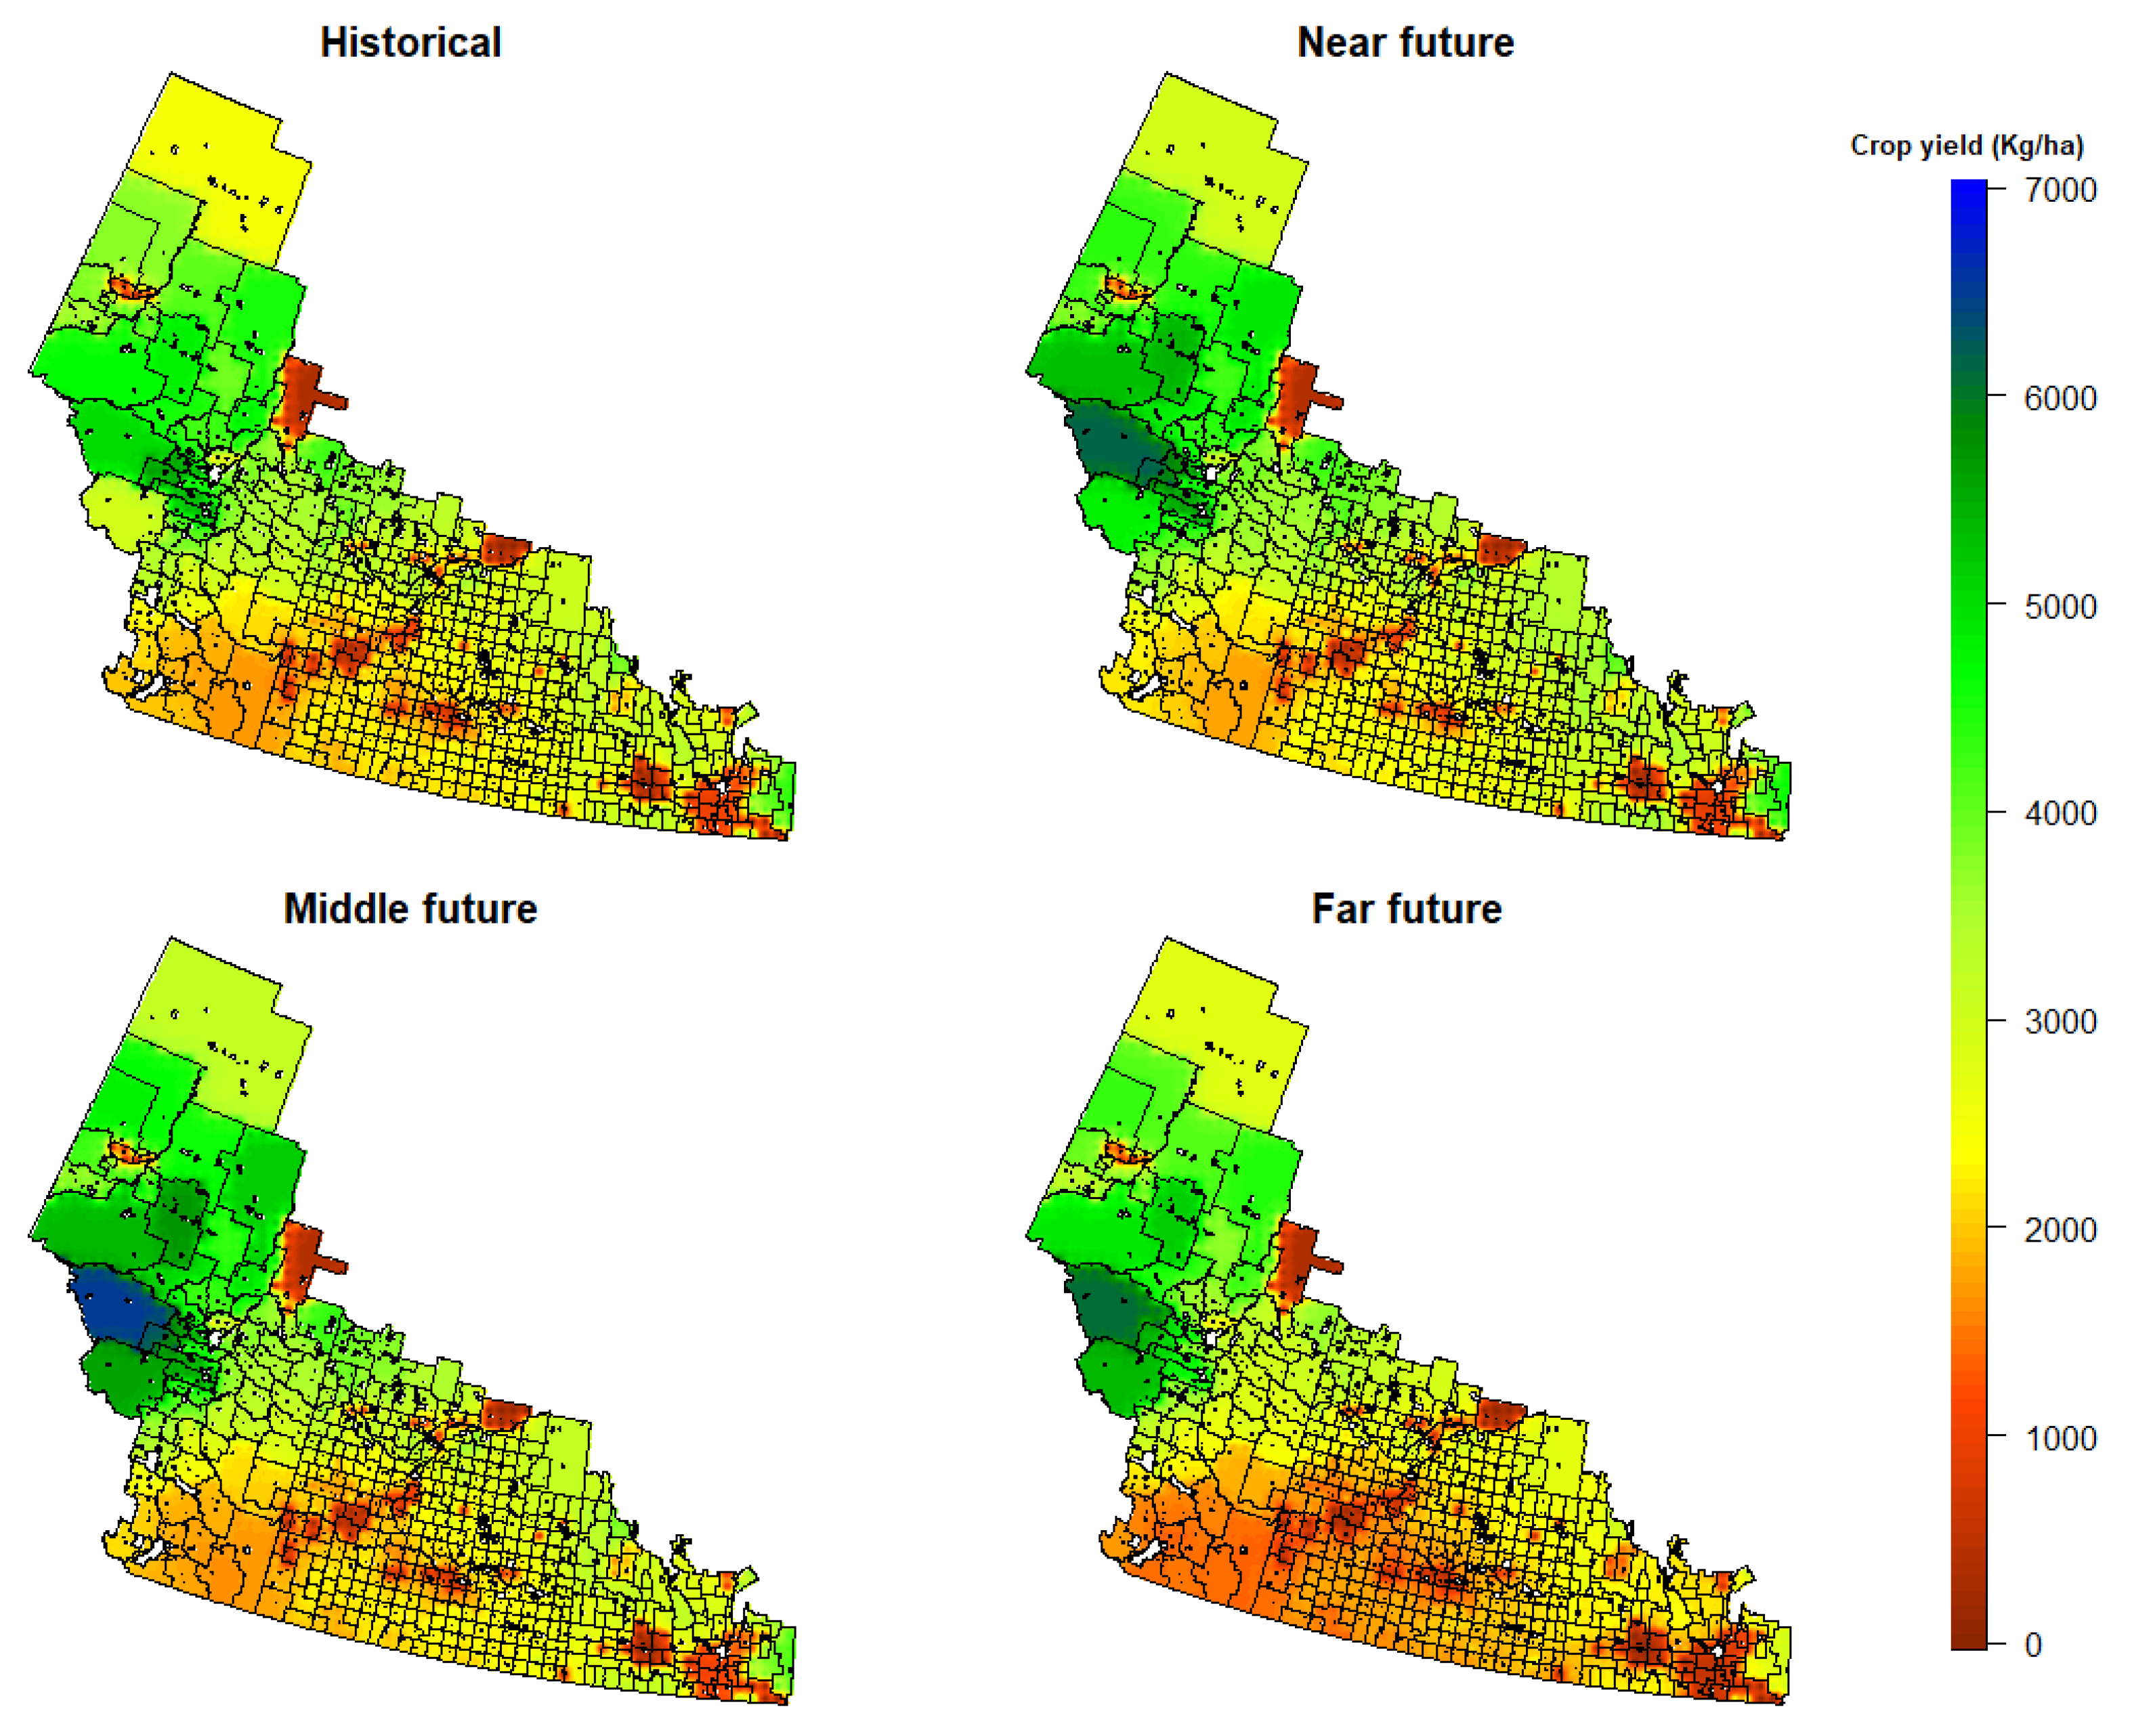
Figure 13.
Ensemble median of barley yield in the prairie agricultural zone during historical and projection periods.
Figure 13.
Ensemble median of barley yield in the prairie agricultural zone during historical and projection periods.
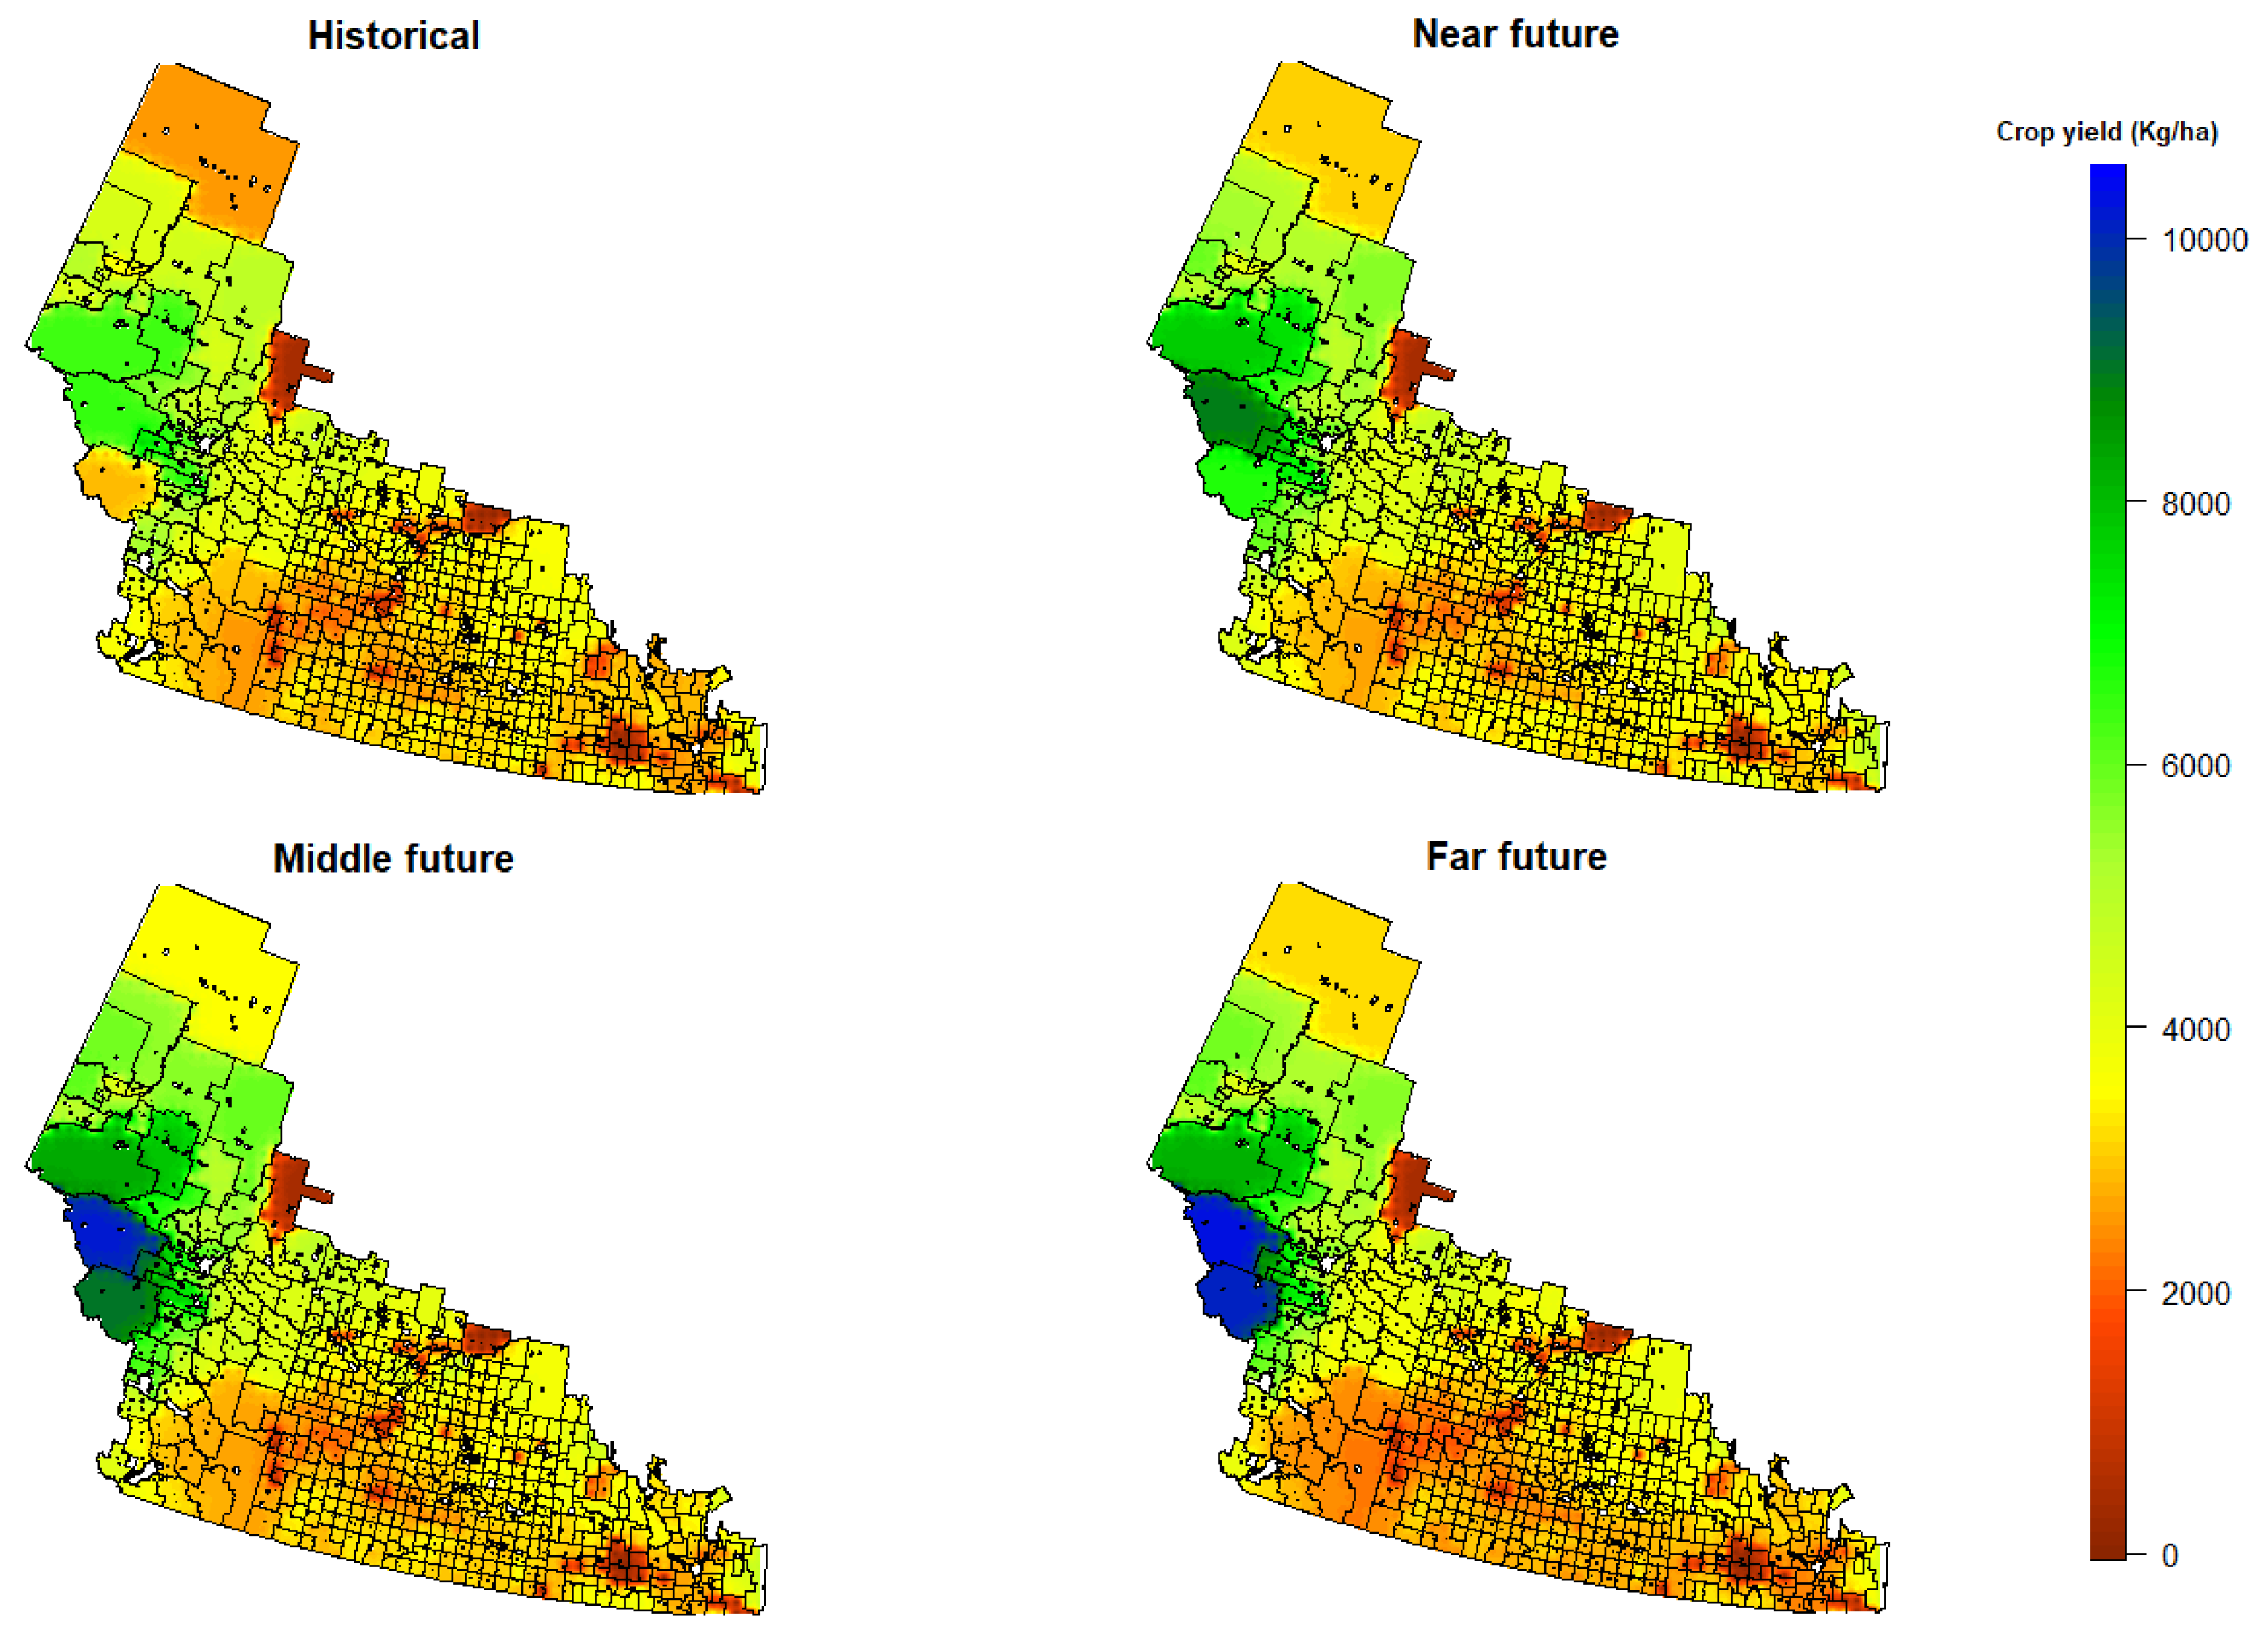
Figure 14.
Ensemble median of Canola yield in the prairie agricultural zone during historical and projection periods.
Figure 14.
Ensemble median of Canola yield in the prairie agricultural zone during historical and projection periods.
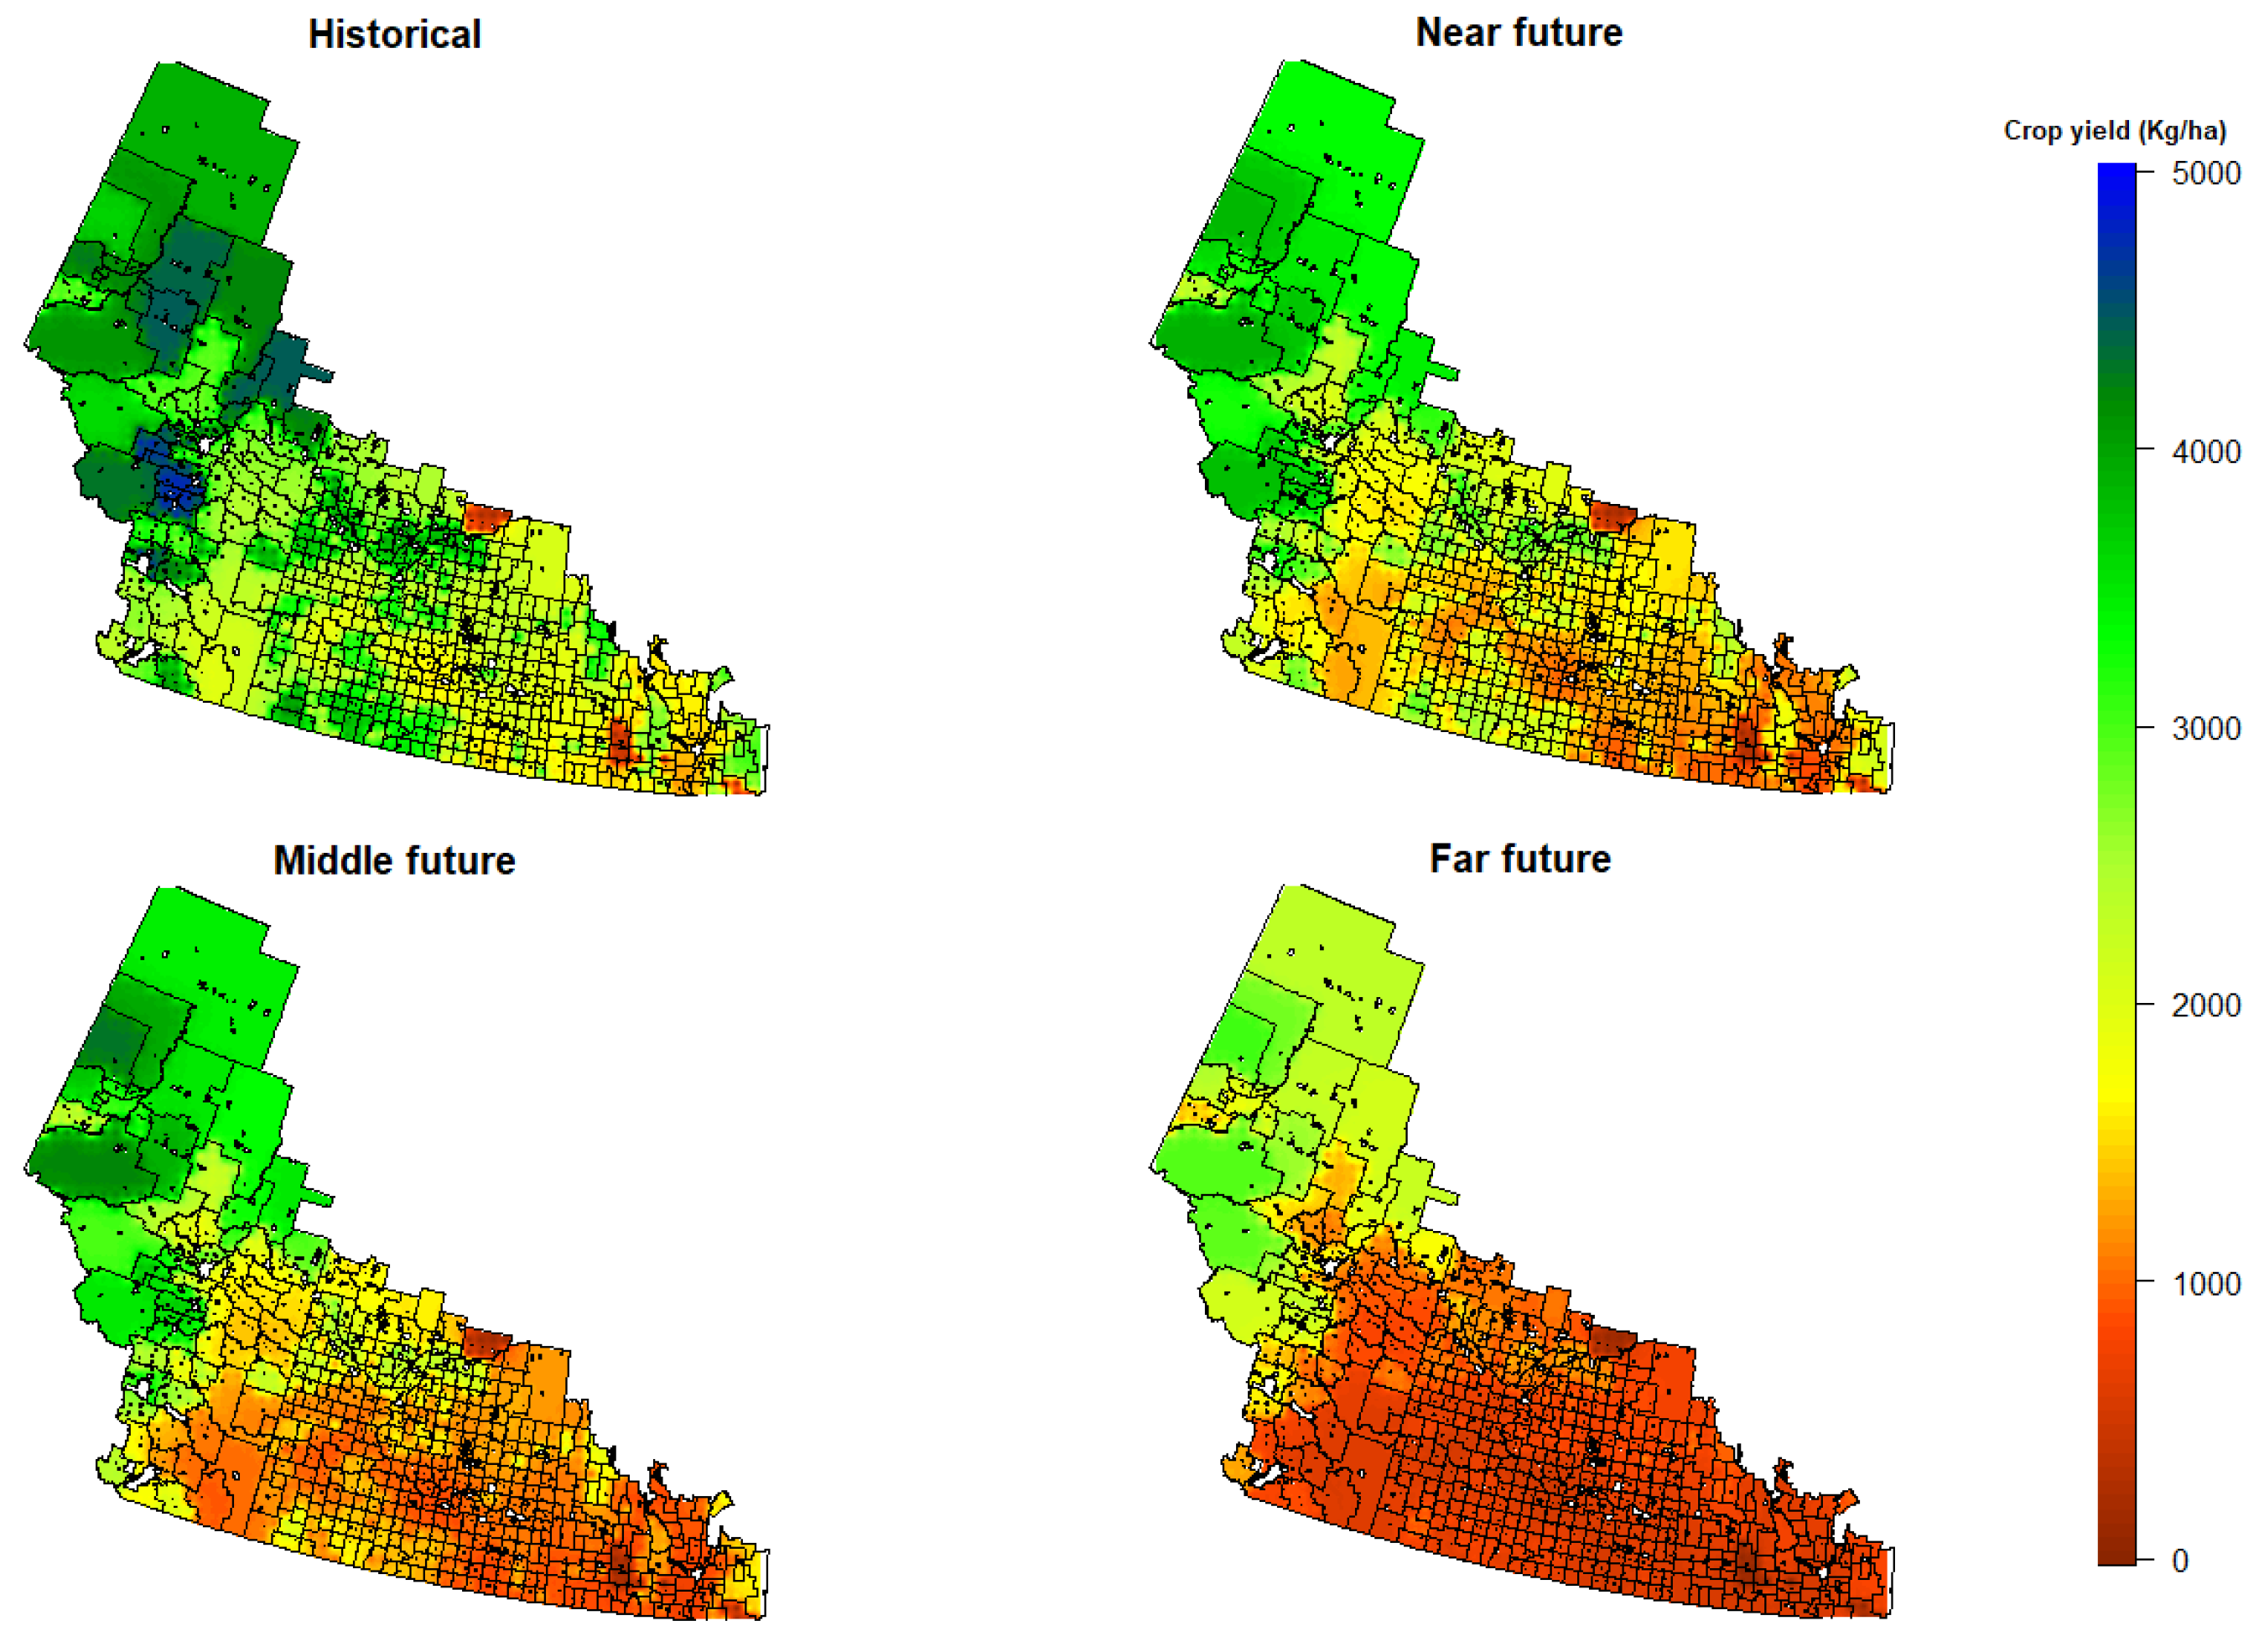
Figure 15.
Heat map of the Pearson correlation coefficient across all agroclimatic indices and four crop yields.
Figure 15.
Heat map of the Pearson correlation coefficient across all agroclimatic indices and four crop yields.
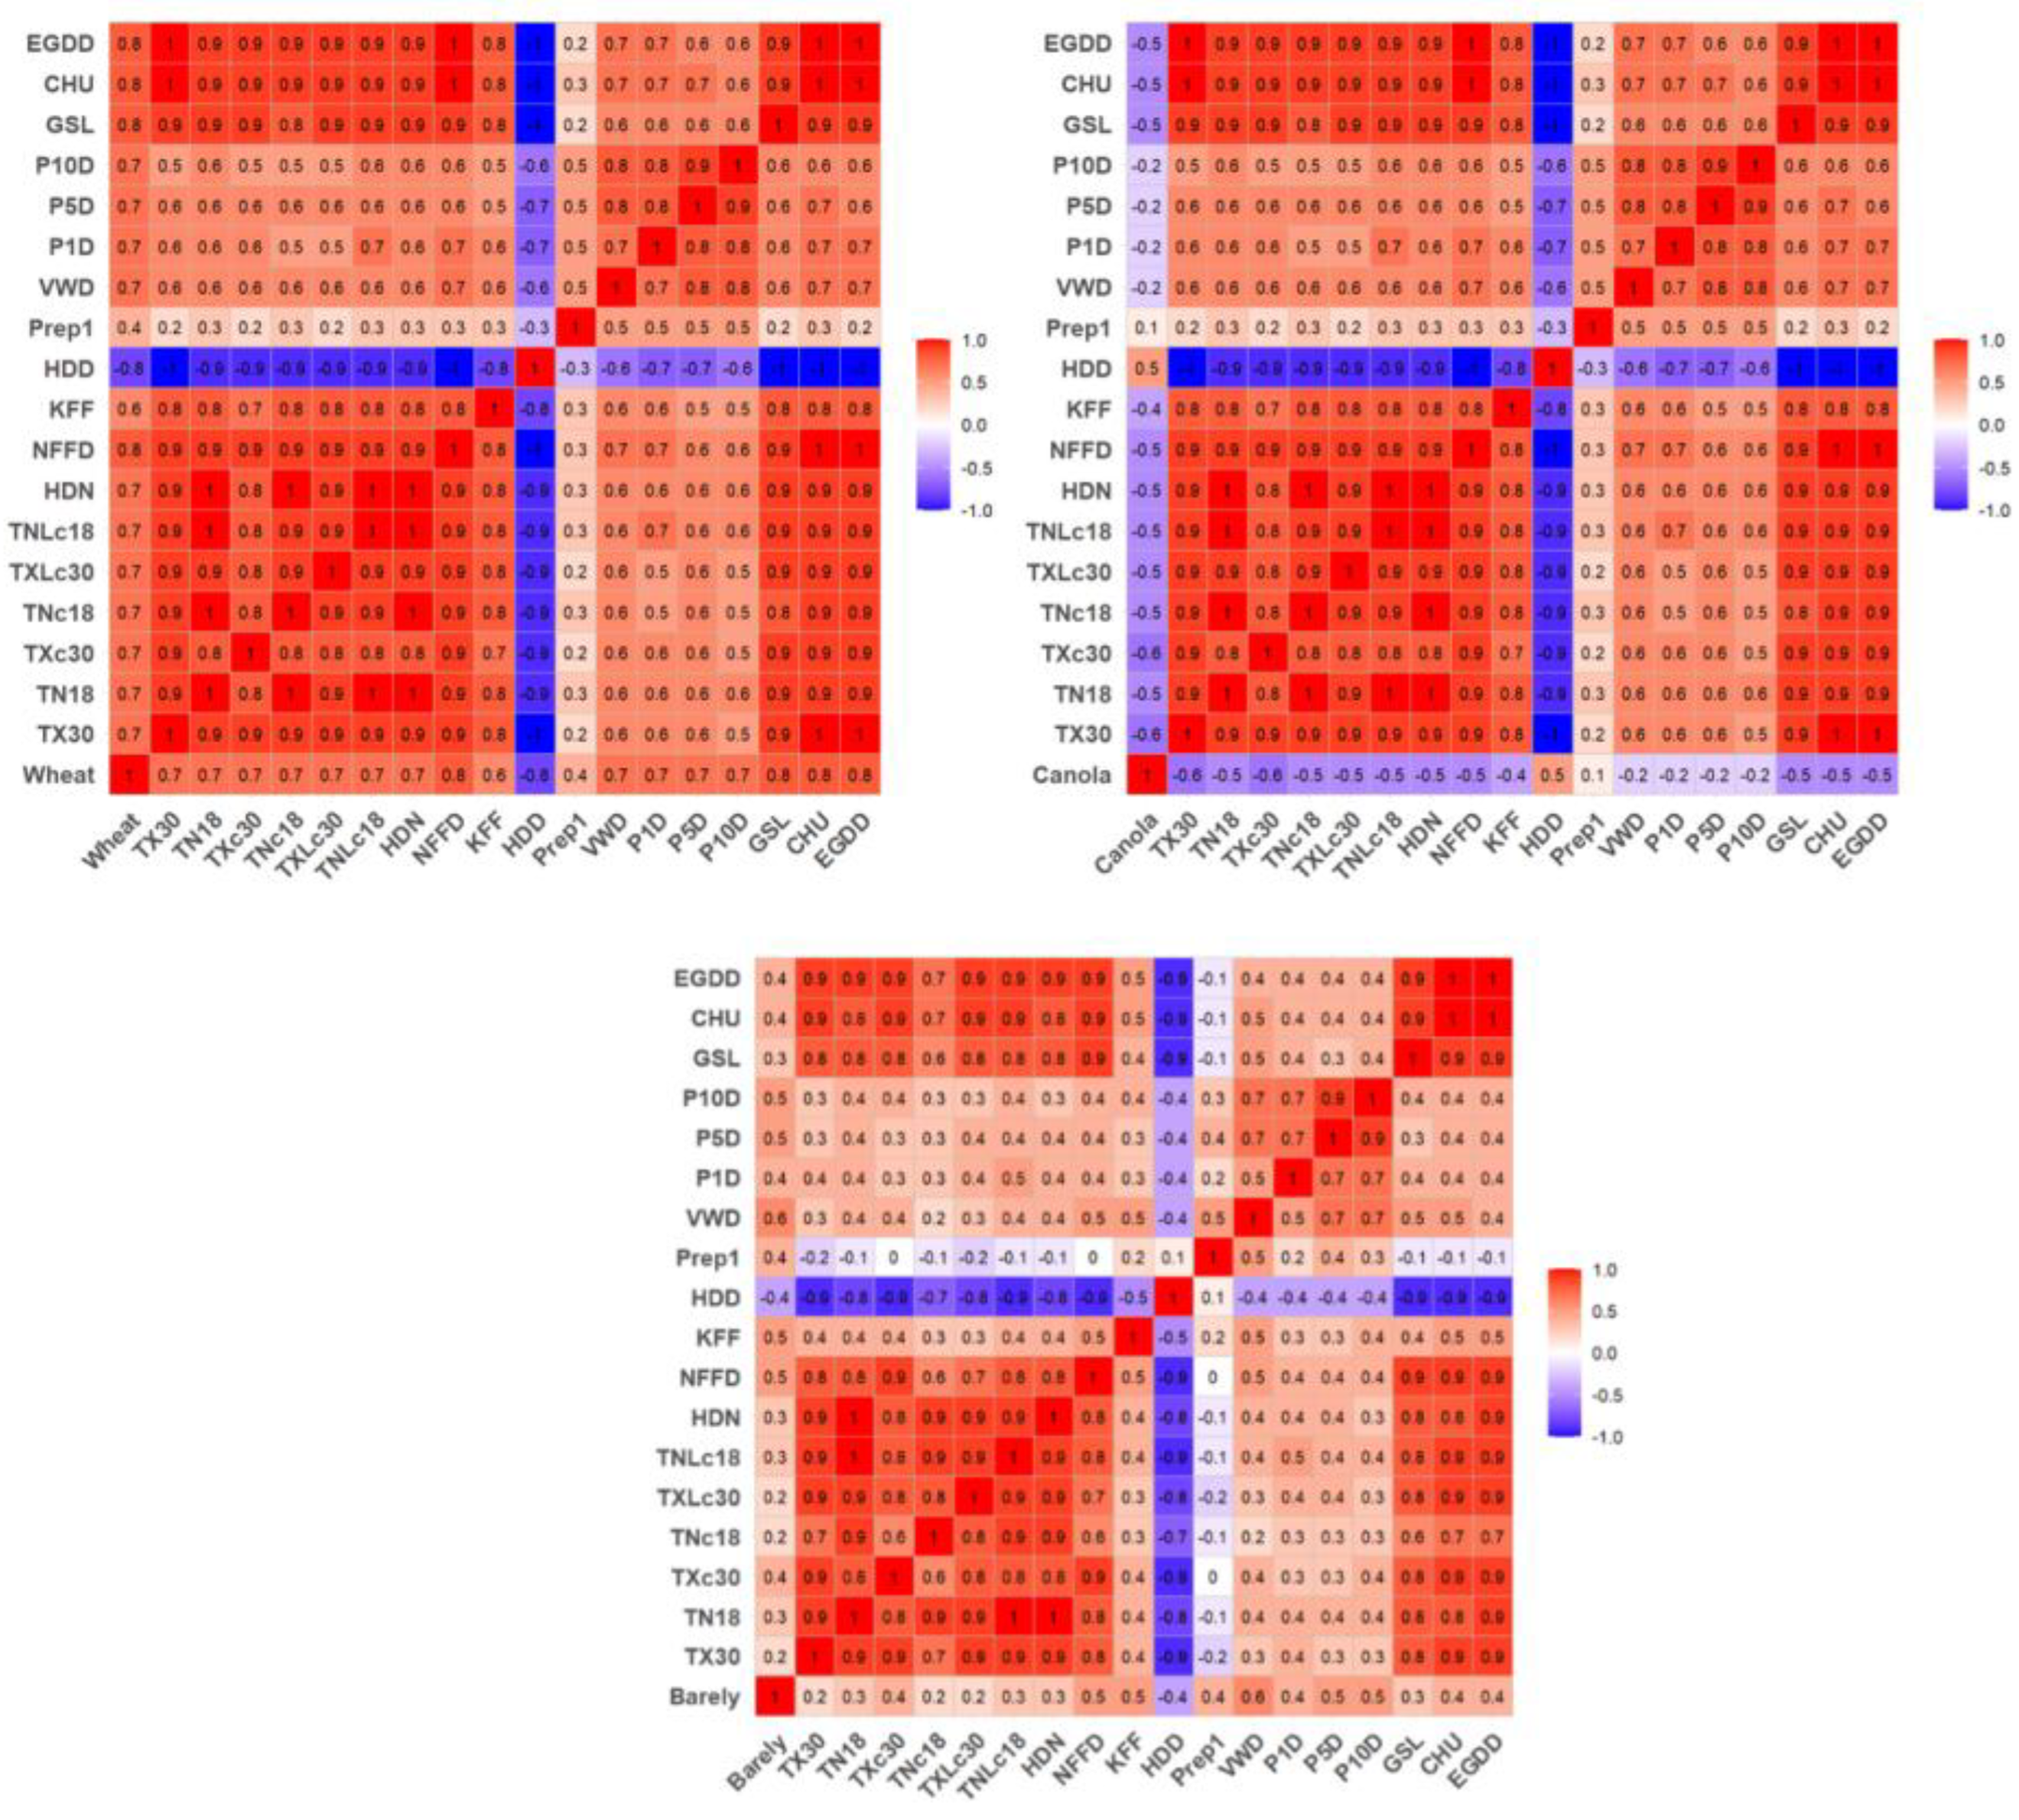

Table 1.
List of agroclimatic indices, including unit and means of calculation.
| Indicator | Meaning | Unit |
|---|---|---|
| TX30 | Days with max temp > 30°C | Days |
| TN18 | Days with min temp > 18°C | Days |
| TXc30 | Hot days in ≥3-day spells | Days |
| TNc18 | Hot nights in ≥3-night spells | Days |
| TXLc30 | Longest hot day spell | Days |
| TNLc18 | Longest hot night spell | Days |
| HDN | Days with both TX > 30°C & TN > 18°C | Days |
| NFFD | Days between last spring & first fall frost | Days |
| KFF | Degrees below 18°C (heating season) | °C-day |
| HDD | Degrees above 18°C (cooling season) | °C-day |
| Prep1 | Days with precipitation > 1 mm | Days |
| ≥10mm Days | Days with precipitation ≥ 10 mm | Days |
| P1D | Max 1-day precipitation | mm |
| P5D | Max 5-day precipitation | mm |
| P10D | Max 10-day precipitation | mm |
| GSL | Length of crop growing season | Days |
| CHU | Accumulated crop heat units | Heat units |
| EGDD | Accumulated effective GDD (base 10°C) | °C-day |
Table 2.
NEX-GDDP-CMIP6 global climate models.
| No. | Model | Institution | Country |
|---|---|---|---|
| 1 | ACCESS-ESM1-5 | CSIRO | Australia |
| 2 | BCC-CSM2-MR | Beijing Climate Center | China |
| 3 | CanESM5 | CCCma | Canada |
| 4 | CNRM-CM6-1 | CNRM | France |
| 5 | CMCC-CM2-SR5 | CMCC | Italy |
| 6 | EC-Earth3 | EC-Earth Consortium | Sweden |
| 7 | FGOALS-g3 | CAS | China |
| 8 | GFDL-CM4 | NOAA GFDL | USA |
| 9 | GFDL-ESM4 | NOAA GFDL | USA |
| 10 | GISS-E2-1-G | NASA GISS | USA |
| 11 | HadGEM3-GC31-LL | Met Office Hadley Centre | UK |
| 12 | INM-CM5-0 | INM | Russia |
| 13 | IPSL-CM6A-LR | IPSL | France |
| 14 | KACE-1-0-G | KMA | South Korea |
| 15 | KIOST-ESM | KIOST | South Korea |
| 16 | MIROC6 | JAMSTEC | Japan |
| 17 | MIROC-ES2L | JAMSTEC | Japan |
| 18 | MPI-ESM1-2-LR | Max Planck Institute | Germany |
| 19 | MRI-ESM2-0 | MRI | Japan |
| 20 | NorESM2-LM | Norwegian Climate Centre | Norway |
| 21 | UKESM1-0-LL | Met Office Hadley Centre | UK |
Table 3.
Agroclimatic indices changes in projection relative to historical (1985-2014).
| Agroclimatic Indices | 2015-2040 | 2041-2070 | 2071-2100 |
|---|---|---|---|
| TX30 (days) | 11 | 30 | 55 |
| TN18 (days) | 4 | 16 | 41 |
| TXc30 (days) | 2 | 3 | 4 |
| TNc18 (days) | 0 | 2 | 4 |
| TXLc30 (days) | 3 | 11 | 27 |
| TNLc18 (days) | 1 | 4 | 13 |
| HDN (days) | 1 | 6 | 24 |
| NFFD (days) | 13 | 26 | 49 |
| KFF (°C-day) | 3 | 8 | 11 |
| HDD (°C-day) | -182 | -357 | -529 |
| Prep1 (days) | 1 | 0 | -3 |
| Very Wet Days (days) | 1 | 0 | 0 |
| P1D (mm/day) | 2 | 2 | 3 |
| P5D (mm/5d) | 3 | 3 | 3 |
| P10D (mm/10d) | 4 | 3 | 4 |
| GSL (days) | 13 | 28 | 44 |
| CHU | 229 | 485 | 792 |
| EGDD (°C-day) | 124 | 298 | 541 |
Table 4.
Statistical performance evaluation of the DSSAT model for the crop yields.
| Crop | Period | Year | ) | Statistical Performance | |||
|---|---|---|---|---|---|---|---|
| Observation | Simulation | d | EF | nRMSE | |||
| Wheat CERES | Calibration | 1992-2010 | 2089 | 2316 | 0.73 | 0.17 | 20.15 |
| Validation | 2011-2022 | 2548 | 2573 | 0.85 | 0.3 | 18.5 | |
| Barley | Calibration | 2000-2011 | 3009 | 3358 | 0.77 | 0.25 | 19.9 |
| Validation | 2012-2019 | 3504 | 3546 | 0.85 | 0.57 | 7.2 | |
| Canola | Calibration | 1992-2010 | 1980 | 2098 | 0.8 | 0.03 | 13.6 |
| Validation | 2011-2022 | 2564 | 2309 | 0.81 | 0.1 | 14.1 | |
Disclaimer/Publisher’s Note: The statements, opinions and data contained in all publications are solely those of the individual author(s) and contributor(s) and not of MDPI and/or the editor(s). MDPI and/or the editor(s) disclaim responsibility for any injury to people or property resulting from any ideas, methods, instructions or products referred to in the content. |
© 2025 by the authors. Licensee MDPI, Basel, Switzerland. This article is an open access article distributed under the terms and conditions of the Creative Commons Attribution (CC BY) license (http://creativecommons.org/licenses/by/4.0/).
Copyright: This open access article is published under a Creative Commons CC BY 4.0 license, which permit the free download, distribution, and reuse, provided that the author and preprint are cited in any reuse.


