
Submitted:
22 July 2025
Posted:
22 July 2025
You are already at the latest version
Abstract
Background: Urban land markets significantly influence city development. However, analyzing them in data-scarce environments presents challenges. This study utilizes spatial big data mining techniques to analyze building density dynamics as a proxy for understanding urban land market behavior in Kigali, Rwanda. Methods: High-resolution building footprint data from 2023 were integrated with cadastral and administrative datasets to compute the housing density across 501,170 land parcels. Spatial autocorrelation analysis and k-means clustering were applied to segment the cities into distinct housing density zones. The clustering results were validated using Silhouette, Davies-Bouldin, and Calinski-Harabasz scores. Results: Spatial autocorrelation analysis revealed a significant clustering of housing density (Moran's I = 0.9780, p < 0.001). K-means clustering was used to identify the five distinct housing density zones. High-density clusters (average density 0.34) were concentrated in the central districts, encompassing 9.93% of the land area and 23.9% of the parcels. Extensive low-density zones (average density 0.03-0.09) dominated 90.07% of the land area. Conclusions: The spatial distribution of housing density clusters aligns with bid-rent theory and monocentric city models. This study demonstrates that building density, when analyzed through spatial big data mining, can provide critical insights into urban land market dynamics in data-scarce environments. This methodology offers a replicable framework for inferring land value gradients and market pressures in rapidly urbanizing cities lacking traditional valuation data.
Keywords:
Spatial Big Data Mining
; Urban land market
; Building density dynamics
; Data-Scarce Cities
1. Introduction
Urban land markets are crucial in determining the development and growth trajectories of cities [1]. These markets involve the exchange of land for various urban uses, shaped by factors such as location, accessibility, and zoning regulations. A comprehensive understanding of the urban land markets is essential for effective planning and policymaking [2]. Investigating these topics in data-scarce cities, such as Kigali Rwanda, presents both unique challenges and significant opportunities. Kigali, a rapidly developing city, urgently requires data-driven planning to manage swift urbanization; however, it often lacks traditional data sources available in more developed contexts [3,4,5,6]. This situation calls for innovative approaches to understand urban dynamics and ensure sustainable growth [7]. Spatial big data and machine-learning techniques offer promising solutions to overcome these data limitations and generate valuable insights for urban planning and policymaking [3,8]. This study introduces a novel spatial big-data mining approach specifically designed to model urban land markets in data-scarce cities, such as Kigali. This approach uniquely integrates diverse, non-traditional spatial big data sources to uncover patterns previously hidden by data gaps [9,10]. The primary aim was to examine the dynamics of building density and its intrinsic connection to land market dynamics, directly addressing the challenges posed by limited data availability in developing urban contexts. We seek to determine how spatial big data mining techniques can effectively mitigate data scarcity in modeling urban land markets, and how these derived patterns relate to land prices and broader urban development trajectories. Ultimately, this study aimed to provide a transferable methodology that can empower data-informed urban planning in rapidly urbanizing environments. This paper is organized into sections covering literature review, methodology, findings, and discussion.
2. Literature Review
Analyzing urban land market dynamics in rapidly developing, data-scarce environments such as Kigali necessitates the integration of insights from land economics, urban spatial analysis, and big data applications. Fundamentally, land value is determined by the interaction of demand and supply [11,12]. Land demand is influenced by factors such as population growth, economic development, accessibility to services and infrastructure, and regulatory frameworks. These factors enhance the desire and capacity to acquire land for residential, commercial, and industrial purposes [13,14,15]. Conversely, the supply of land is inherently fixed, geographically immobile, and further constrained by land use regulations, environmental policies, and physical limitations [16].
This inelasticity of supply makes land prices highly sensitive to demand shifts. Spatially, these forces result in heterogeneous land values across urban areas, with the bid-rent theory elucidating how different land users’ willingness to pay for land at various locations creates a gradient, with higher values typically concentrated in accessible and economically vibrant areas [17,18]. However, these theoretical frameworks encounter significant challenges when they are applied to developing countries. Urban environments in many developing nations, including Kigali, are often characterized by market imperfections, such as information asymmetries, speculative behavior, prevalent informal land markets, and weak institutional frameworks [19,20,21,22].
Urban morphology serves as an essential framework for analyzing the physical structure and spatial organization of cities [23,24,25]. Within this domain, building density is a critical metric that quantifies land use intensity and acts as a significant indicator of land demand and development pressure [26,27,28,29]. Regions characterized by high land demand, often driven by economic opportunities and accessibility, typically exhibit elevated building densities as developers seek to optimize the use of limited urban land [30].
Contemporary urban landscapes are increasingly defined by the proliferation of spatial big data, which encompasse diverse, large-volume datasets that have revolutionized urban studies [31,32,33]. These sources include high-resolution satellite imagery, mobile phone data on human mobility, geotagged social media content, Volunteered Geographic Information (VGI), smart city sensor networks, and transportation data [34,35,36]. The vast scale and complexity of this data necessitate spatial data mining, an interdisciplinary field that integrates statistics, machine learning, data mining, and GIS [37,38,39,40,41,42,43].
Despite recent advancements, significant research gaps persist in the application of advanced analytical techniques to land market dynamics, particularly in data-deficient environments. This study aims to address these gaps by employing advanced spatial big data mining techniques to conduct a comprehensive spatial analysis of the building density dynamics within Kigali.
2. Materials and Methods
This study employed a methodological framework that combined spatial data preprocessing, density computation, spatial statistics, and machine learning to uncover deep insights into housing development across Kigali. The approach involves five main stages: data acquisition and preprocessing, housing density computation, descriptive statistical analysis, spatial autocorrelation assessment, and application of machine-learning-based spatial clustering models.
The analysis relied on a suite of high-resolution spatial datasets that were collected and validated on December 31, 2023. The core spatial datasets included building footprint data, parcel boundaries, and administrative layers. A total of 679,411 building footprints were extracted from recent satellite imagery. These footprints were derived from cloud-filtered Sentinel-2 satellite imagery, which offers 10-meter spatial resolution for its key bands. The extraction of these footprints was performed using advanced artificial intelligence techniques, specifically a Convolutional Neural Network (CNN) based on a U-Net architecture, trained on high-resolution ground truth building data obtained from previous studies and validated open-source datasets. To ensure spatial consistency and accurate geometric calculations, all spatial datasets were projected onto the Universal Transverse Mercator system, specifically the UTM Zone 36N (EPSG: 32636). Following projection, the datasets were cleaned to remove topological errors such as silver polygons, null geometries, and duplicates.
The housing density indicator was defined as the ratio of the total built-up area to the total area of the 100 m buffer around every analyzed parcel (that parcel area included). This specific buffer size was chosen to effectively capture the immediate neighborhood context influencing development intensity, reflecting local land-use competition and access to infrastructure beyond the individual parcel boundary, while remaining computationally efficient. The computed density values were standardized on a scale from 0 to 1. To understand the spatial structure of housing density and determine whether development patterns were random or clustered, spatial autocorrelation techniques were applied. Global Moran’s I was used to measure the degree of spatial dependence among the housing density values.
This study employed unsupervised machine learning techniques to model spatial variation and classify housing density into meaningful spatial typologies. Five clustering algorithms were implemented: k-means, spectral clustering, Gaussian Mixture Models (GMM), Agglomerative Clustering, and HDBISCAN. Each algorithm is executed with varying cluster counts (k-values ranging from 2 to 10). Three widely recognized internal clustering validation metrics were employed to evaluate the quality of the clustering results: the silhouette score, Davies-Bouldin index (DBI), and Calinski-Harabasz index (CHI).
The Silhouette Score measures the degree of similarity between a data point and its own cluster compared to other clusters. It is calculated by computing the average distance between a point and all other points in the same cluster (cohesion) and comparing it with the average distance to points in the nearest neighboring cluster (separation). Mathematically, the silhouette score for a given point is expressed as:
where is the average intra-cluster distance and is the minimum average distance to other clusters. The scores range from –1 to +1, where values closer to 1 indicate that the point is well matched to its own cluster and poorly matched to neighboring clusters [44,45]. The DBI assesses clustering quality by measuring the ratio of intra-cluster distance to inter-cluster distance. It is calculated as the average similarity between each cluster and its most similar cluster, with lower values indicating better clustering. The is given by the formula
where and represent the average distances of each cluster’s members to their centroids, and is the distance between the centroids of clusters and . A lower indicates that the clusters are compact and well separated [46,47]. The CHI, also known as the Variance Ratio Criterion, evaluates clustering by measuring the ratio of between-cluster dispersion to within-cluster dispersion, adjusted for the number of clusters and total observations. It is defined as
where is the trace of the between-group dispersion matrix; is the trace of the within-cluster dispersion matrix; n is the number of observations; and k is the number of clusters. Higher CHI values indicate better clustering, as they reflect tight, well-separated clusters [48]. Together, these three validation metrics provide a robust framework for evaluating clustering outcomes. The next results are presented in the next section.
4. Results
This study analyzed the building density of Kigali City as of December 31, 2023, using high-resolution spatial data. From a total analyzed area of 688.09 km2, representing 94.33% of Kigali City’s total land area (729.51 km2), 679,411 individual building footprints across 501,170 land parcels were extracted. Housing density, defined as the ratio of built-up area to the total area within a 100-meter buffer around each parcel, was standardized to a scale of 0 to 1. This standardization allowed for a comprehensive assessment of development intensity, ranging from undeveloped parcels (0.0) to fully occupied parcels (0.99).
4.1. Descriptive Statistics of Housing Density
The distribution of housing density values exhibited a pronounced positive skew (Figure 1), indicating that the majority of land parcels in Kigali fall within the low to moderate density ranges. The most prevalent density class, encompassing 325,313 parcels, was between 0.1 and 0.2, signifying the predominant land use intensity. This was followed by the 0.2–0.3 class (106,114 parcels), 0.0–0.1 class (43,005 parcels), and 0.3–0.4 class (25,595 parcels). A sharp decline in frequency was observed for higher density classes; only 873 parcels were in the 0.4–0.5 range, and 270 parcels in the 0.5–0.6 range, with negligible representation beyond this threshold.
These findings suggest that despite ongoing urban growth, most land parcels in Kigali City are not characterized by high-density development. The limited number of parcels exceeding a housing density of 0.5 indicates that vertical expansion and plot saturation are not yet widespread, even in core urban areas. This underscores the significant spatial fragmentation in Kigali’s urban development and highlights the importance of strategic densification policies within key urban centers. The descriptive analysis provides a foundational understanding of Kigali’s urban structure and settlement intensity, informing subsequent spatial modeling.
4.2. Spatial Autocorrelation of Housing Density
The spatial structure of housing density was examined rigorously using global and local spatial autocorrelation techniques. The Global Moran’s I index for 2023 was 0.9780 (P = 0.0010), indicating a statistically significant and strong positive spatial autocorrelation. This confirms that housing density in Kigali City is not randomly distributed but rather exhibits a clustered pattern, with high-density areas adjacent to other high-density areas, and similarly for low-density areas. This spatial coherence is attributable to factors such as urban form, land-use regulation, historical growth, terrain, and infrastructure access.
To delve into localized patterns, Local Indicators of Spatial Association (LISA) were applied, categorizing spatial units into four distinct clusters: High-High (HH), Low-Low (LL), Low-High (LH), and High-Low (HL) (Figure 2).
HH clusters, depicted in red, represent areas of high housing density surrounded by high-density zones. These clusters were concentrated in the central urban districts of Nyarugenge, Gasabo, and Kicukiro, which have established residential, commercial, social, and administrative hubs. Covering approximately 111.61 km2 (16.22% of the study area). These areas reflect Kigali’s urban core and primary growth centers, which are characterized by compact and intense development. LL clusters, shown in green, constitute dominant landscape features, particularly in peripheral and undeveloped areas. Occupying 554.09 km2 (80.53% of Kigali’s total surface), denoting widespread zones of low housing density, often corresponding to rural-urban fringes, agricultural lands, environmentally constrained areas, or land awaiting development. The prevalence of LL clusters illustrates a clear radial density gradient from the city center outwards, which is consistent with a monocentric urban model. LH clusters, colored yellow, span 15.94 km2 (2.32%) and represent areas of low housing density adjacent to high-density zones. These are likely transitional urban areas undergoing early stages of densification or land-use conversion. Conversely, HL clusters, shown in blue, cover a smaller area of 6.46 km2 (0.94%) and indicate high-density pockets surrounded by low-density neighborhoods, potentially representing informal settlements, isolated high-rise developments, or localized planning anomalies.
The LISA cluster map unequivocally reveals a monocentric urban development pattern, with housing density intensifying towards the central business district and progressively declining towards the periphery. This spatial structure highlights the centralization of infrastructure, services, and economic activities, while also emphasizing the challenge of managing peripheral low-density expansion. These findings are crucial for urban planners and policymakers, and suggest the need for targeted densification strategies, improved infrastructure planning in low-density zones, and policy interventions that promote balanced spatial development across the city.
4.3. Spatial Modeling of Housing Density
To model the spatial heterogeneity of housing density, an unsupervised machine-learning approach was employed, testing five clustering algorithms: k-means, spectral clustering, GMM, agglomerative clustering, and HDBISCAN. These models were evaluated across a range of cluster numbers (k = 10) using three internal clustering validation metrics: Silhouette Score, DBI, and CHI.
The Silhouette Score (Figure 3), which measures cluster cohesion and separation (higher values indicate better-defined clusters), showed Spectral Clustering excelling at k = 2 with a score of approximately 0.62, suggesting two well-defined housing density regions. However, its performance deteriorates beyond k = 2. K-means and spectral clustering displayed a more stable performance across a wider range of k values, both peaking around k = 5 with a silhouette score of approximately 0.37, indicating their capacity to capture finer spatial differentiations. The GMM peaked at k = 5 (approximately 0.31) but generally yielded lower-quality clusters. HDBISCAN, which does not rely on a fixed k, maintains a constant silhouette score of approximately 0.09, serving as a baseline indicating moderate clustering quality.
The DBI (Figure 4), where lower values signify better clustering quality, reinforces these observations. Spectral Clustering performed exceptionally well at k = 2 with a minimum DBI of approximately 0.35. K-means and Spectral Clustering recorded their lowest DBIs around k = 5 (approximately 0.85 for K-means and 0.78 for Spectral), suggesting superior intra-cluster compactness and inter-cluster separation. GMM started with a high DBI (above 1.4) at k = 2 and improved slightly towards k = 5, but still lagged behind K-means and Spectral methods. HDBISCAN maintained a stable DBI of approximately 0.96, confirming its low effectiveness.
CHI (Figure 5), which rewards dense and well-separated clusters with higher values, revealed that K-means consistently outperformed the other algorithms across most k values. The highest score was observed at k = 5, reaching approximately 6700, followed by Spectral Clustering, which peaked at approximately 5400 at k = 6. These values highlight the ability of k-means and spectral clustering to form coherent and distinct clusters. GMM’s maximum CHI was approximately 5200, whereas agglomerative clustering peaked at approximately 2900 at k = 8. HDBISCAN displayed a flat CHI of approximately 900, which was significantly lower than those of the other models.
Integrating all three metrics, k-means and spectral clustering emerged as the most robust and reliable methods for modeling housing density in Kigali, demonstrating optimal performance at k = 5 or k = 6. This suggests that Kigali’s spatial housing density structure can be effectively segmented into five or six distinct zones, representing gradations from high-density urban centers to transitional and peripheral low-density areas. K-means slightly outperformed Spectral Clustering in terms of overall cluster compactness and definition, which was particularly evident in its superior Calinski-Harabasz scores. Agglomerative Clustering was effective for binary classification but lost effectiveness with increased spatial complexity. GMM consistently underperformed, likely owing to the mismatch between its Gaussian assumptions and the complex spatial geometry of the urban structures. HDBISCAN’s performance was relatively weak across all metrics in this study.
Based on this comprehensive comparison, K-means with k = 5 was selected as the most suitable model for spatial modeling of housing density in Kigali City. This model achieved a Silhouette Score of 0.37, a CHI of 6700, and a DBI of 0.85, confirming a well-balanced performance in terms of compactness, separation, and structural definition. This configuration enables the effective segmentation of the city into five spatial typologies of housing density, facilitating targeted urban management, zoning, and infrastructure investment. These results underscore the utility of spatial big data mining techniques in uncovering hidden patterns in urban morphology and informing spatial policy decisions in rapidly urbanizing cities, such as Kigali.
4.4. Spatial Housing Density Pattern in Kigali
The application of the selected k-means clustering model with k = 5 to the 2023 housing density dataset revealed five distinct spatial zones, each characterized by varying levels of housing density and urban development intensity. These zones are visually represented in Figure 6 and quantitatively detailed in Table 1, providing insights into their area coverage, average housing density, and parcel counts.
Cluster 0 (green) emerged as the largest cluster; encompassing approximately 186.73 km2 (27.14% of the total parcels area). Predominantly located in the northern and northeastern regions of the city, this zone exhibited the lowest average housing density (0.03) and contained 95,480 parcels. It represents the least urbanized area, likely comprising protected natural spaces, agricultural land, and sparsely populated rural settlements, indicating a largely undeveloped landscape. Cluster 3 (black), the second largest in terms of spatial extent, covers 154.29 km2 (22.42% of the total parcel area). Concentrated in the southeastern and eastern parts of Kigali, this cluster showed a moderate housing density (0.09) with 96,232 parcels. Its spatial distribution suggests that these areas are undergoing gradual urbanization, acting as transitional zones between fully urbanized and rural regions, indicating ongoing eastward and southeastward city expansion influenced by land availability and infrastructure.
Cluster 1 (yellow) occupies 142.77 km2 (20.75% of the total parcel area) and was primarily found in the southwestern and west-central parts of the city. With an average housing density of 0.08 and 95,333 parcels, this cluster reflects moderately dense residential zones, likely consisting of planned housing development and established neighborhoods. The organized land_use patterns and consistent density suggest areas with stable urban growth and relatively balanced infrastructure development. Cluster 4 (blue) represents 19.76% of the total parcel area, covering 136 km2. Predominantly located in the central and northwestern sectors of Kigali, this cluster has a housing density of 0.07 and includes 94,355 parcels. Despite a slightly lower density than Cluster 1, this indicates more compact development, potentially involving mixed-use areas. Its central location and spatial characteristics suggest infill development and densification within previously built-up urban zones, signaling a pattern of consolidation rather than expansion. Cluster 2 (red), the smallest area (68.31 km2 or 9.93% of the total parcel area), had the highest average housing density (0.34) and contained the largest number of parcels (119,770). These high-density zones are scattered across central Kigali and other intensively developed urban pockets, including commercial centers and informal settlements. The fragmented but concentrated development patterns in these red zones reflect the urban pressure, land scarcity, and vertical expansion within the city core.
Broadly speaking, the spatial configuration of these clusters illuminates the direction and structure of urban growth in Kigali. The dominance of low-density zones in the north and northeast suggests limited development in these directions, possibly due to environmental constraints. Conversely, the significant presence of moderate-density clusters in the southeast and east points to active eastward and southeastward urban expansion. Central and western clusters indicate more stable development, whereas compact, high-density red clusters signify inner-city intensification and redevelopment. The progression from green (lowest density) to red (highest density) clearly mapped the city’s urban rural gradient. These insights are invaluable for urban planning, land use management, and infrastructure provision, offering a spatially grounded foundation for directing sustainable urban growth and policy interventions in Kigali.
5. Discussion
The findings from Kigali City provide strong empirical validation for both classical and contemporary theories of urban land markets, particularly the bid-rent theory [11,13] and monocentric city model [49]. These foundational theories posit that accessibility to economic hubs, essential infrastructure, and amenities significantly influences spatial variation in land values and development intensity. The observed spatial distribution of housing density, with high-density clusters concentrated in the central districts of Nyarugenge, Gasabo, and Kicukiro, clearly confirms the dominance of accessibility-driven urban morphology. These areas exhibit features consistent with intense land-use competition, reflecting a higher willingness to pay for central and accessible locations, aligning perfectly with theoretical expectations. HH clusters of housing density, covering 16.22% of the city area, underscore zones where land demand has outstripped supply, compelling developers to intensify land use through denser developments. LL clusters dominated 80.53% of the land surface, suggesting that the vast majority of Kigali’s territory remained underutilized or was in the early stages of urban transformation. These spatial patterns resonate with Solow’s (1972) assertion that an inelastic land supply in growing cities necessitates upward expansion and densification in response to market pressure.
5.1. Housing Density as a Market Equilibrium Mechanism
Given Kigali’s relatively fixed land supply and fluctuating demand, housing density has emerged as a crucial mechanism for achieving urban land market equilibrium [50]. As classical models suggest, when demand for centrally located land increases and supply is constrained by geography or policy, prices escalate, rendering horizontal expansion unsustainable [50,51,52]. In response, developers and households either intensify vertical land use or relocate to peripheral zones where land is more affordable. This dynamic is evident in cluster 2, which represents the densest areas of Kigali. Despite covering only 9.93% of the land, it accounts for the highest average housing density (0.34) and largest parcel count (119,770). These densely built zones encompass both formal and informal settlements, reflecting the varied market responses to intense land pressure. In stark contrast, the prevalence of low-density clusters (Clusters 0, 1, and 4) despite ongoing urbanization pressure points to an uneven development intensity across Kigali. This spatial fragmentation can be attributed to a combination of regulatory constraints, limited infrastructure provision, or environmental protection which collectively impedes full market responsiveness. These observations further validate the applicability of bid-rent and urban economic models for interpreting settlement intensity and land value spatial gradients in Kigali’s unique context.
5.2. Spatial Autocorrelation and Urban Form Insights
The strong Global Moran’s I index (0.9780, p = 0.001) unequivocally reveals that housing density is spatially clustered and not randomly distributed. This significant spatial autocorrelation reflects coherent urban-form patterns shaped by historical growth, varied terrain, strategic infrastructure investments, and the prevailing regulatory regimes. LISA analysis clearly highlights urban-suburban transitions, with HH clusters concentrated in economically strategic zones and LL clusters concentrated in the peripheral areas. Interestingly, the presence of HL and LH outlier clusters, although marginal in area, signifies localized tension in the urban form. These outliers may indicate rapidly emerging informal settlements, intense infill development, or speculative land use changes. As Kigali continues to grow, strategic integration of these outlier areas into a more cohesive urban structure is paramount for sustainable development planning.
5.3. Uncovering Latent Market Zones Through Spatial Big Data Mining
Unlike traditional statistical or econometric models, our study leveraged spatial big data mining to detect latent structures and complex spatial patterns without relying on predefined hypotheses [53,54]. The application of k-means clustering, robustly validated using Silhouette Score, DBI, and CHI, successfully uncovered five distinct housing density zones. K-means at k=5 achieved the best balance across all validation metrics (silhouette = 0.37, CHI = 6700, DBI = 0.85), confirming its suitability for modeling Kigali’s complex urban morphology.
These spatial clusters reveal a structural segmentation of the land market based on development intensity. For example, Cluster 0, covering the largest area (27.14%) and with the lowest average density (0.03), represents peri-urban or protected land with minimal market activity. Clusters 1 and 3 represent moderately dense, evolving urban zones, reflecting areas of emerging demand driven by infrastructure expansion and land conversion policies. Cluster 2, with the highest parcel count and density, clearly indicates a saturated demand and highly competitive land markets. By employing spatial big data mining, our study effectively captured hidden spatial patterns that traditional models may have overlooked. Unlike ordinary data mining or descriptive statistics, which often rely on tabular summaries and neglect geographic contexts, spatial big data mining integrates location, spatial relationships, and scale to produce nuanced multi-dimensional insights [55,56,57]. This makes it particularly valuable in data-scarce urban environments such as Kigali, where formal land market data are often limited or non-existent.
5.4. Implications for Urban Planning and Spatial Justice
These findings have profound implications for spatial planning in Kigali and similar data-scarce urban environments. First, the dominance of low-density zones calls for targeted densification policies, especially in transitional clusters (e.g., Cluster 3), to optimize existing infrastructure use and reduce spatial fragmentation. Second, the identification of high-density pressure zones (e.g., Cluster 2) suggests a pressing need for vertical expansion, regulatory reform, and improved infrastructure provisioning to accommodate future growth without exacerbating congestion or informal sprawl. Moreover, the ability to spatially differentiate land market typologies based on building density enables more nuanced, equitable, and evidence-based land valuation practices. This directly supports the pursuit of spatial justice by ensuring that valuation and compensation accurately reflect actual land use dynamics and market pressure, particularly in the context of expropriation and redevelopment.
5.5. Theoretical and Methodological Contributions
This study makes a significant contribution to the existing literature. Theoretically, it empirically validates classical urban economic theories in a data-constrained African context, bridging the gap between urban land economics and spatial data science. It demonstrates that housing density, when rigorously derived from high-resolution spatial data, serves as a reliable proxy for latent land market dynamics. Methodologically, the integration of clustering algorithms with spatial autocorrelation analysis presents a replicable framework for decoding urban morphology in fast-growing data-limited cities. This innovative approach effectively overcomes the lack of formal land market records by leveraging spatial proxies and machine learning, thereby contributing to a new paradigm in urban land market research.
5.6. Limitations
Although our spatial big-data mining approach provides robust insights, it is important to acknowledge certain limitations. First, using housing density as an effective proxy might not capture all the granular nuances of land market transactions, which are often influenced by specific legal or informal arrangements. Second, while the study identifies zones of high and low demand, a detailed understanding of the socio-economic drivers within each cluster, beyond accessibility, would require additional data sources not available in this study. Future research could integrate more diverse socio-economic indicators and explore their influence on the identified spatial patterns.
5.7. Conclusion
In conclusion, this study, Decoding Urban Land Markets in Data-Scarce Cities: A Spatial Big Data Mining Approach to Building Density Dynamics in Kigali, demonstrates that building density, when analyzed through sophisticated spatial big data mining techniques, provides critical insights into complex urban land market behaviors. These insights can profoundly inform both theoretical discourse and practical policymaking in cities grappling with rapid urbanization and limited traditional data infrastructure.
Author Contributions
Main author, Iyandemye Samuel; Supervision, Niyobuhungiro Japhet and Edward Bbaale. All authors have read and agreed to the published version of the manuscript.
Funding
This research received no external funding
Data Availability Statement
Data are available from the corresponding author on request.
Conflicts of Interest
The authors declare no conflicts of interest.
References
- Kiviaho, A., & Toivonen, S. (2023). Forces impacting the real estate market environment in shrinking cities: possible drivers of future development. European Planning Studies, 31(1), 189–211. [CrossRef]
- Raza, A., Zhong, M., & Safdar, M. (2022). Evaluating Locational Preference of Urban Activities with the Time-Dependent Accessibility Using Integrated Spatial Economic Models. International Journal of Environmental Research and Public Health, 19(14), 8317. [CrossRef]
- Maneepong, K., Yamanotera, R., Akiyama, Y., Miyazaki, H., Miyazawa, S., & Akiyama, C. M. (2025). Towards High-Resolution Population Mapping: Leveraging Open Data, Remote Sensing, and AI for Geospatial Analysis in Developing Country Cities—A Case Study of Bangkok. Remote Sensing, 17(7), 1204. [CrossRef]
- Owusu, M., Engstrom, R., Thomson, D., Kuffer, M., & Mann, M. L. (2023). Mapping Deprived Urban Areas Using Open Geospatial Data and Machine Learning in Africa. Urban Science, 7(4), 116. [CrossRef]
- Bandauko, E., & Nutifafa Arku, R. (2023). A critical analysis of ‘smart cities’ as an urban development strategy in Africa. International Planning Studies, 28(1), 69–86. [CrossRef]
- Joshi, S., Zakeri, B., Mittal, S., Mastrucci, A., Holloway, P., Krey, V., Shukla, P. R., O’Gallachoir, B., & Glynn, J. (2024). Global high-resolution growth projections dataset for rooftop area consistent with the shared socioeconomic pathways, 2020–2050. Scientific Data, 11(1), 563. [CrossRef]
- Casali, Y., Aydin, N. Y., & Comes, T. (2022). Machine learning for spatial analyses in urban areas: a scoping review. Sustainable Cities and Society, 85, 104050. [CrossRef]
- Anwar, M. R., & Sakti, L. D. (2024). Integrating Artificial Intelligence and Environmental Science for Sustainable Urban Planning. IAIC Transactions on Sustainable Digital Innovation (ITSDI), 5(2), 179–191. [CrossRef]
- Mugiraneza, T., Ban, Y., & Haas, J. (2019). Urban land cover dynamics and their impact on ecosystem services in Kigali, Rwanda using multi-temporal Landsat data. Remote Sensing Applications: Society and Environment, 13. [CrossRef]
- Nduwayezu, G., Manirakiza, V., Mugabe, L., & Malonza, J. M. (2021). Urban Growth and Land Use/Land Cover Changes in the Post-Genocide Period, Kigali, Rwanda. Environment and Urbanization ASIA, 12(1_suppl). [CrossRef]
- Angel, S. (2023). Urban expansion: theory, evidence and practice. Buildings and Cities, 4(1), 124–138. [CrossRef]
- Sunny, F. A., Jeronen, E., & Lan, J. (2024). Influential Theories of Economics in Shaping Sustainable Development Concepts. Administrative Sciences, 15(1), 6. [CrossRef]
- Alonso, W. (1964). Location and Land Use. Harvard University Press. [CrossRef]
- Bansal, S., & Pandey, S. (2024). Legal frameworks for sustainable urban development: Analysing the efficacy of zoning regulations in promoting environmental conservation. E3S Web of Conferences, 527, 01022. [CrossRef]
- Haghani, M., Sabri, S., De Gruyter, C., Ardeshiri, A., Shahhoseini, Z., Sanchez, T. W., & Acuto, M. (2023). The landscape and evolution of urban planning science. Cities, 136, 104261. [CrossRef]
- Broitman, D., & Koomen, E. (2020). The attraction of urban cores: Densification in Dutch city centres. Urban Studies, 57(9), 1920–1939. [CrossRef]
- Maser, S. M., Riker, W. H., & Rosett, R. N. (1977). The Effects of Zoning and Externalities on the Price of Land: An Empirical Analysis of Monroe County, New York. The Journal of Law and Economics, 20(1), 111–132. [CrossRef]
- Cui, X., Fang, C., Wang, Z., & Bao, C. (2019). Spatial relationship of high-speed transportation construction and land-use efficiency and its mechanism: Case study of Shandong Peninsula urban agglomeration. Journal of Geographical Sciences, 29(4), 549–562. [CrossRef]
- Achmani, Y., Vries, W. T. de, Serrano, J., & Bonnefond, M. (2020). Determining Indicators Related to Land Management Interventions to Measure Spatial Inequalities in an Urban (Re)Development Process. Land, 9(11), 448. [CrossRef]
- Abdulla, B., & Birgisson, B. (2020). Predicting Road Network Vulnerability to Fluvial Flooding Using Machine Learning Classifiers: Case Study of Houston during Hurricane Harvey. Construction Research Congress 2020: Computer Applications - Selected Papers from the Construction Research Congress 2020, 38–47. [CrossRef]
- Goodwin-Hawkins, B., Mahon, M., Farrell, M., & Dafydd Jones, R. (2022). Situating spatial justice in counter-urban lifestyle mobilities: relational rural theory in a time of crisis. Geografiska Annaler, Series B: Human Geography. [CrossRef]
- Nyamai, D. N., & Schramm, S. (2023). Accessibility, mobility, and spatial justice in Nairobi, Kenya. Journal of Urban Affairs, 45(3). [CrossRef]
- Jochem, W. C., Leasure, D. R., Pannell, O., Chamberlain, H. R., Jones, P., & Tatem, A. J. (2021). Classifying settlement types from multi-scale spatial patterns of building footprints. Environment and Planning B: Urban Analytics and City Science, 48(5), 1161–1179. [CrossRef]
- Hu, J., Wang, Y., Taubenböck, H., & Zhu, X. X. (2021). Land consumption in cities: A comparative study across the globe. Cities, 113. [CrossRef]
- Wu, Y., Han, Z., Koko, A. F., & Zhang, S. (2024). Spatio-temporal analysis of the driving factors of urban land use expansion in China: A study of the Yangtze River Delta region. Open Geosciences, 16(1). [CrossRef]
- Kurvinen, A., & Saari, A. (2020). Urban housing density and infrastructure costs. Sustainability (Switzerland), 12(2). [CrossRef]
- Schorcht, M., Jehling, M., & Krüger, T. (2023). Where are cities under pressure? – An indicator for measuring the impact of building changes on urban density. Ecological Indicators, 149. [CrossRef]
- Liu, D., & Shi, Y. (2022). The Influence Mechanism of Urban Spatial Structure on Urban Vitality Based on Geographic Big Data: A Case Study in Downtown Shanghai. Buildings, 12(5), 569. [CrossRef]
- Zhang, X., Du, L., & Song, X. (2024). Identification of Urban Renewal Potential Areas and Analysis of Influential Factors from the Perspective of Vitality Enhancement: A Case Study of Harbin City’s Core Area. Land, 13(11), 1934. [CrossRef]
- Shlomo Angel, Alejandro M. Blei, Patrick Lamson-Hall, Jason Parent, C. H. G. (2016). Atlas of Urban Expansion. In Volume 1: Areas and Densities (2016th ed., Vol. 1). NYU Urban Expansion Program at New York University, UN-Habitat, and the Lincoln Institute of Land Policy. [CrossRef]
- Miao, R., Wang, Y., & Li, S. (2021). Analyzing Urban Spatial Patterns and Functional Zones Using Sina Weibo POI Data: A Case Study of Beijing. Sustainability, 13(2), 647. [CrossRef]
- Peng, X., Bao, Y., & Huang, Z. (2020). Perceiving Beijing’s “City Image” Across Different Groups Based on Geotagged Social Media Data. IEEE Access, 8, 93868–93881. [CrossRef]
- Xia, N., Cheng, L., & Li, M. (2019). Mapping Urban Areas Using a Combination of Remote Sensing and Geolocation Data. Remote Sensing, 11(12), 1470. [CrossRef]
- Poorthuis, A., & Zook, M. (2017). Making Big Data Small: Strategies to Expand Urban and Geographical Research Using Social Media. Journal of Urban Technology, 24(4), 115–135. [CrossRef]
- Li, X., Xu, H., Huang, X., Guo, C., Kang, Y., & Ye, X. (2021). Emerging geo-data sources to reveal human mobility dynamics during COVID-19 pandemic: opportunities and challenges. Computational Urban Science, 1(1), 22. [CrossRef]
- Awan, F. M., Minerva, R., & Crespi, N. (2021). Using Noise Pollution Data for Traffic Prediction in Smart Cities: Experiments Based on LSTM Recurrent Neural Networks. IEEE Sensors Journal, 21(18), 20722–20729. [CrossRef]
- Dhawas, P., Ramteke, M. A., Thakur, A., Polshetwar, P. V., Salunkhe, R. V., & Bhagat, D. (2024). Big Data Analysis Techniques (pp. 183–208). [CrossRef]
- Tsiu, S., Ngobeni, M., Mathabela, L., & Thango, B. (2024). Applications and Competitive Advantages of Data Mining and Business Intelligence in SMEs Performance: A Systematic Review. [CrossRef]
- Partha Protim Roy, Md. Shahriar Abdullah, & Iqtiar Md. Siddique. (2024). Machine learning empowered geographic information systems: Advancing Spatial analysis and decision making. World Journal of Advanced Research and Reviews, 22(1), 1387–1397. [CrossRef]
- Pedro, F. (2023). A Review of Data Mining, Big Data Analytics and Machine Learning Approaches. Journal of Computing and Natural Science, 169–181. [CrossRef]
- Sobieraj, J., & Metelski, D. (2024). Machine Learning Insights: Exploring Key Factors Influencing Sale-to-List Ratio—Insights from SVM Classification and Recursive Feature Selection in the US Real Estate Market. Buildings, 14(5), 1471. [CrossRef]
- Zhang, X., Du, S., Zhou, Y., & Xu, Y. (2022). Extracting physical urban areas of 81 major Chinese cities from high-resolution land uses. Cities, 131, 104061. [CrossRef]
- Yu, Y., Lu, J., Shen, D., & Chen, B. (2021). Research on real estate pricing methods based on data mining and machine learning. Neural Computing and Applications, 33(9), 3925–3937. [CrossRef]
- Januzaj, Y., Beqiri, E., & Luma, A. (2023). Determining the Optimal Number of Clusters using Silhouette Score as a Data Mining Technique. International Journal of Online and Biomedical Engineering (IJOE), 19(04), 174–182. [CrossRef]
- Shahapure, K. R., & Nicholas, C. (2020). Cluster Quality Analysis Using Silhouette Score. 2020 IEEE 7th International Conference on Data Science and Advanced Analytics (DSAA), 747–748. [CrossRef]
- Ros, F., Riad, R., & Guillaume, S. (2023). PDBI: A partitioning Davies-Bouldin index for clustering evaluation. Neurocomputing, 528, 178–199. [CrossRef]
- Wijaya, Y. A., Kurniady, D. A., Setyanto, E., Tarihoran, W. S., Rusmana, D., & Rahim, R. (2021). Davies Bouldin Index Algorithm for Optimizing Clustering Case Studies Mapping School Facilities. TEM Journal, 10(3), 1099–1103. [CrossRef]
- Wang, X., & Xu, Y. (2019). An improved index for clustering validation based on Silhouette index and Calinski-Harabasz index. IOP Conference Series: Materials Science and Engineering, 569(5), 052024. [CrossRef]
- Yu, H., Zhu, S., Li, J. V., & Wang, L. (2024). Dynamics of urban sprawl: Deciphering the role of land prices and transportation costs in government-led urbanization. Journal of Urban Management, 13(4), 736–754. [CrossRef]
- Huang, L., Yang, L., Tian, L., Yu, R., Wang, D., Hao, J., & Lu, J. (2020). Does the location of construction land supply play an very important role on economic growth? The case study of Tianjin Binhai New Area. Journal of Urban Management, 9(1), 104–114. [CrossRef]
- Solow, R. M. (1972). Congestion, Density and the Use of Land in Transportation. The Swedish Journal of Economics, 74(1), 161. [CrossRef]
- Muth, R. F. (1969). Cities and Housing; the Spatial Pattern of Urban Residential Land Use. In Third Series: Studies in Business and Society: Vol. XXII (2nd ed., Issue 355). University of Chicago Press, 1969. https://trid.trb.org/view.aspx?id=545388.
- Miller, H. J., & Goodchild, M. F. (2015). Data-driven geography. GeoJournal, 80(4), 449–461. [CrossRef]
- Guo, M., & Xiong, X. (2022). Spatial Data Mining Assisting Urban Epidemic Surveillance with the Weighted DBSCAN Algorithm. IEEE 6th Information Technology and Mechatronics Engineering Conference, ITOEC 2022. [CrossRef]
- Ma, Q., Gong, Z., Kang, J., Tao, R., & Dang, A. (2020). Measuring Functional Urban Shrinkage with Multi-Source Geospatial Big Data: A Case Study of the Beijing-Tianjin-Hebei Megaregion. Remote Sensing, 12(16), 2513. [CrossRef]
- Deng, X., Liu, P., Liu, X., Wang, R., Zhang, Y., He, J., & Yao, Y. (2019). Geospatial Big Data: New Paradigm of Remote Sensing Applications. IEEE Journal of Selected Topics in Applied Earth Observations and Remote Sensing, 12(10), 3841–3851. [CrossRef]
- Chen, Y., He, C., Guo, W., Zheng, S., & Wu, B. (2023). Mapping Urban Functional Areas Using Multisource Remote Sensing Images and Open Big Data. IEEE Journal of Selected Topics in Applied Earth Observations and Remote Sensing, 16, 7919–7931. [CrossRef]
Figure 1.
Frequency of housing density Groups.
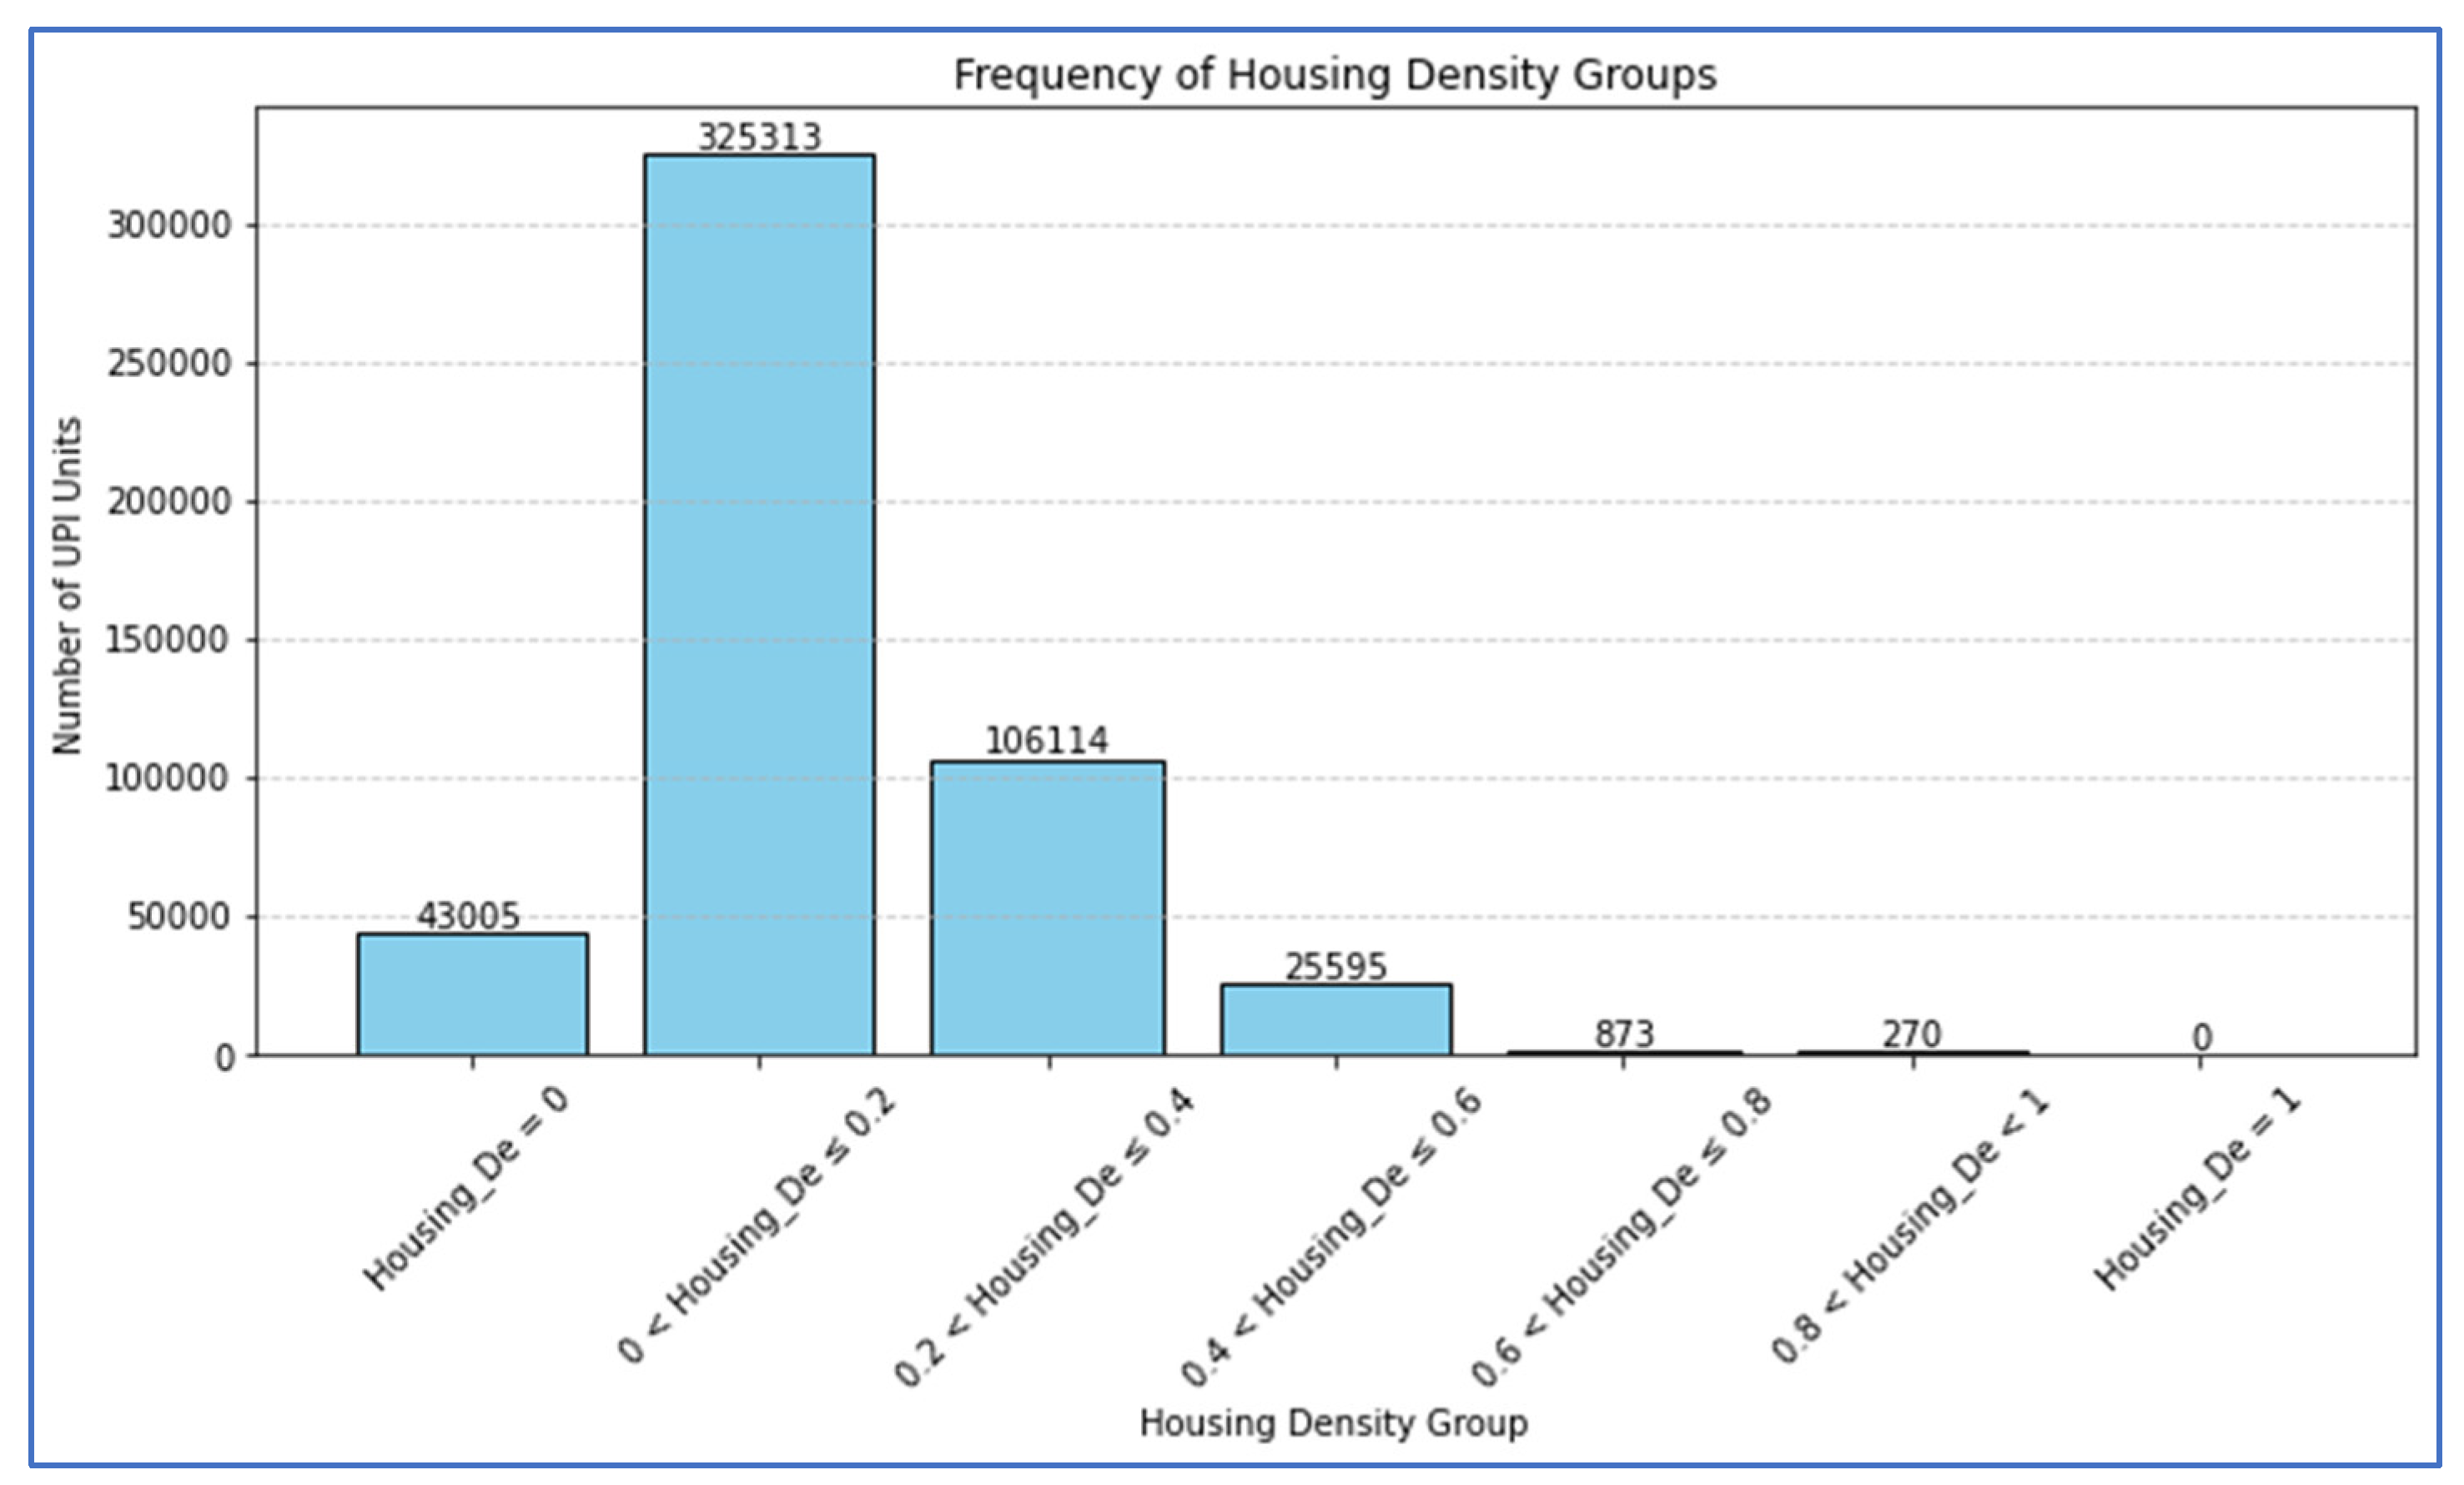
Figure 2.
LISA cluster map of housing density on December 2023.
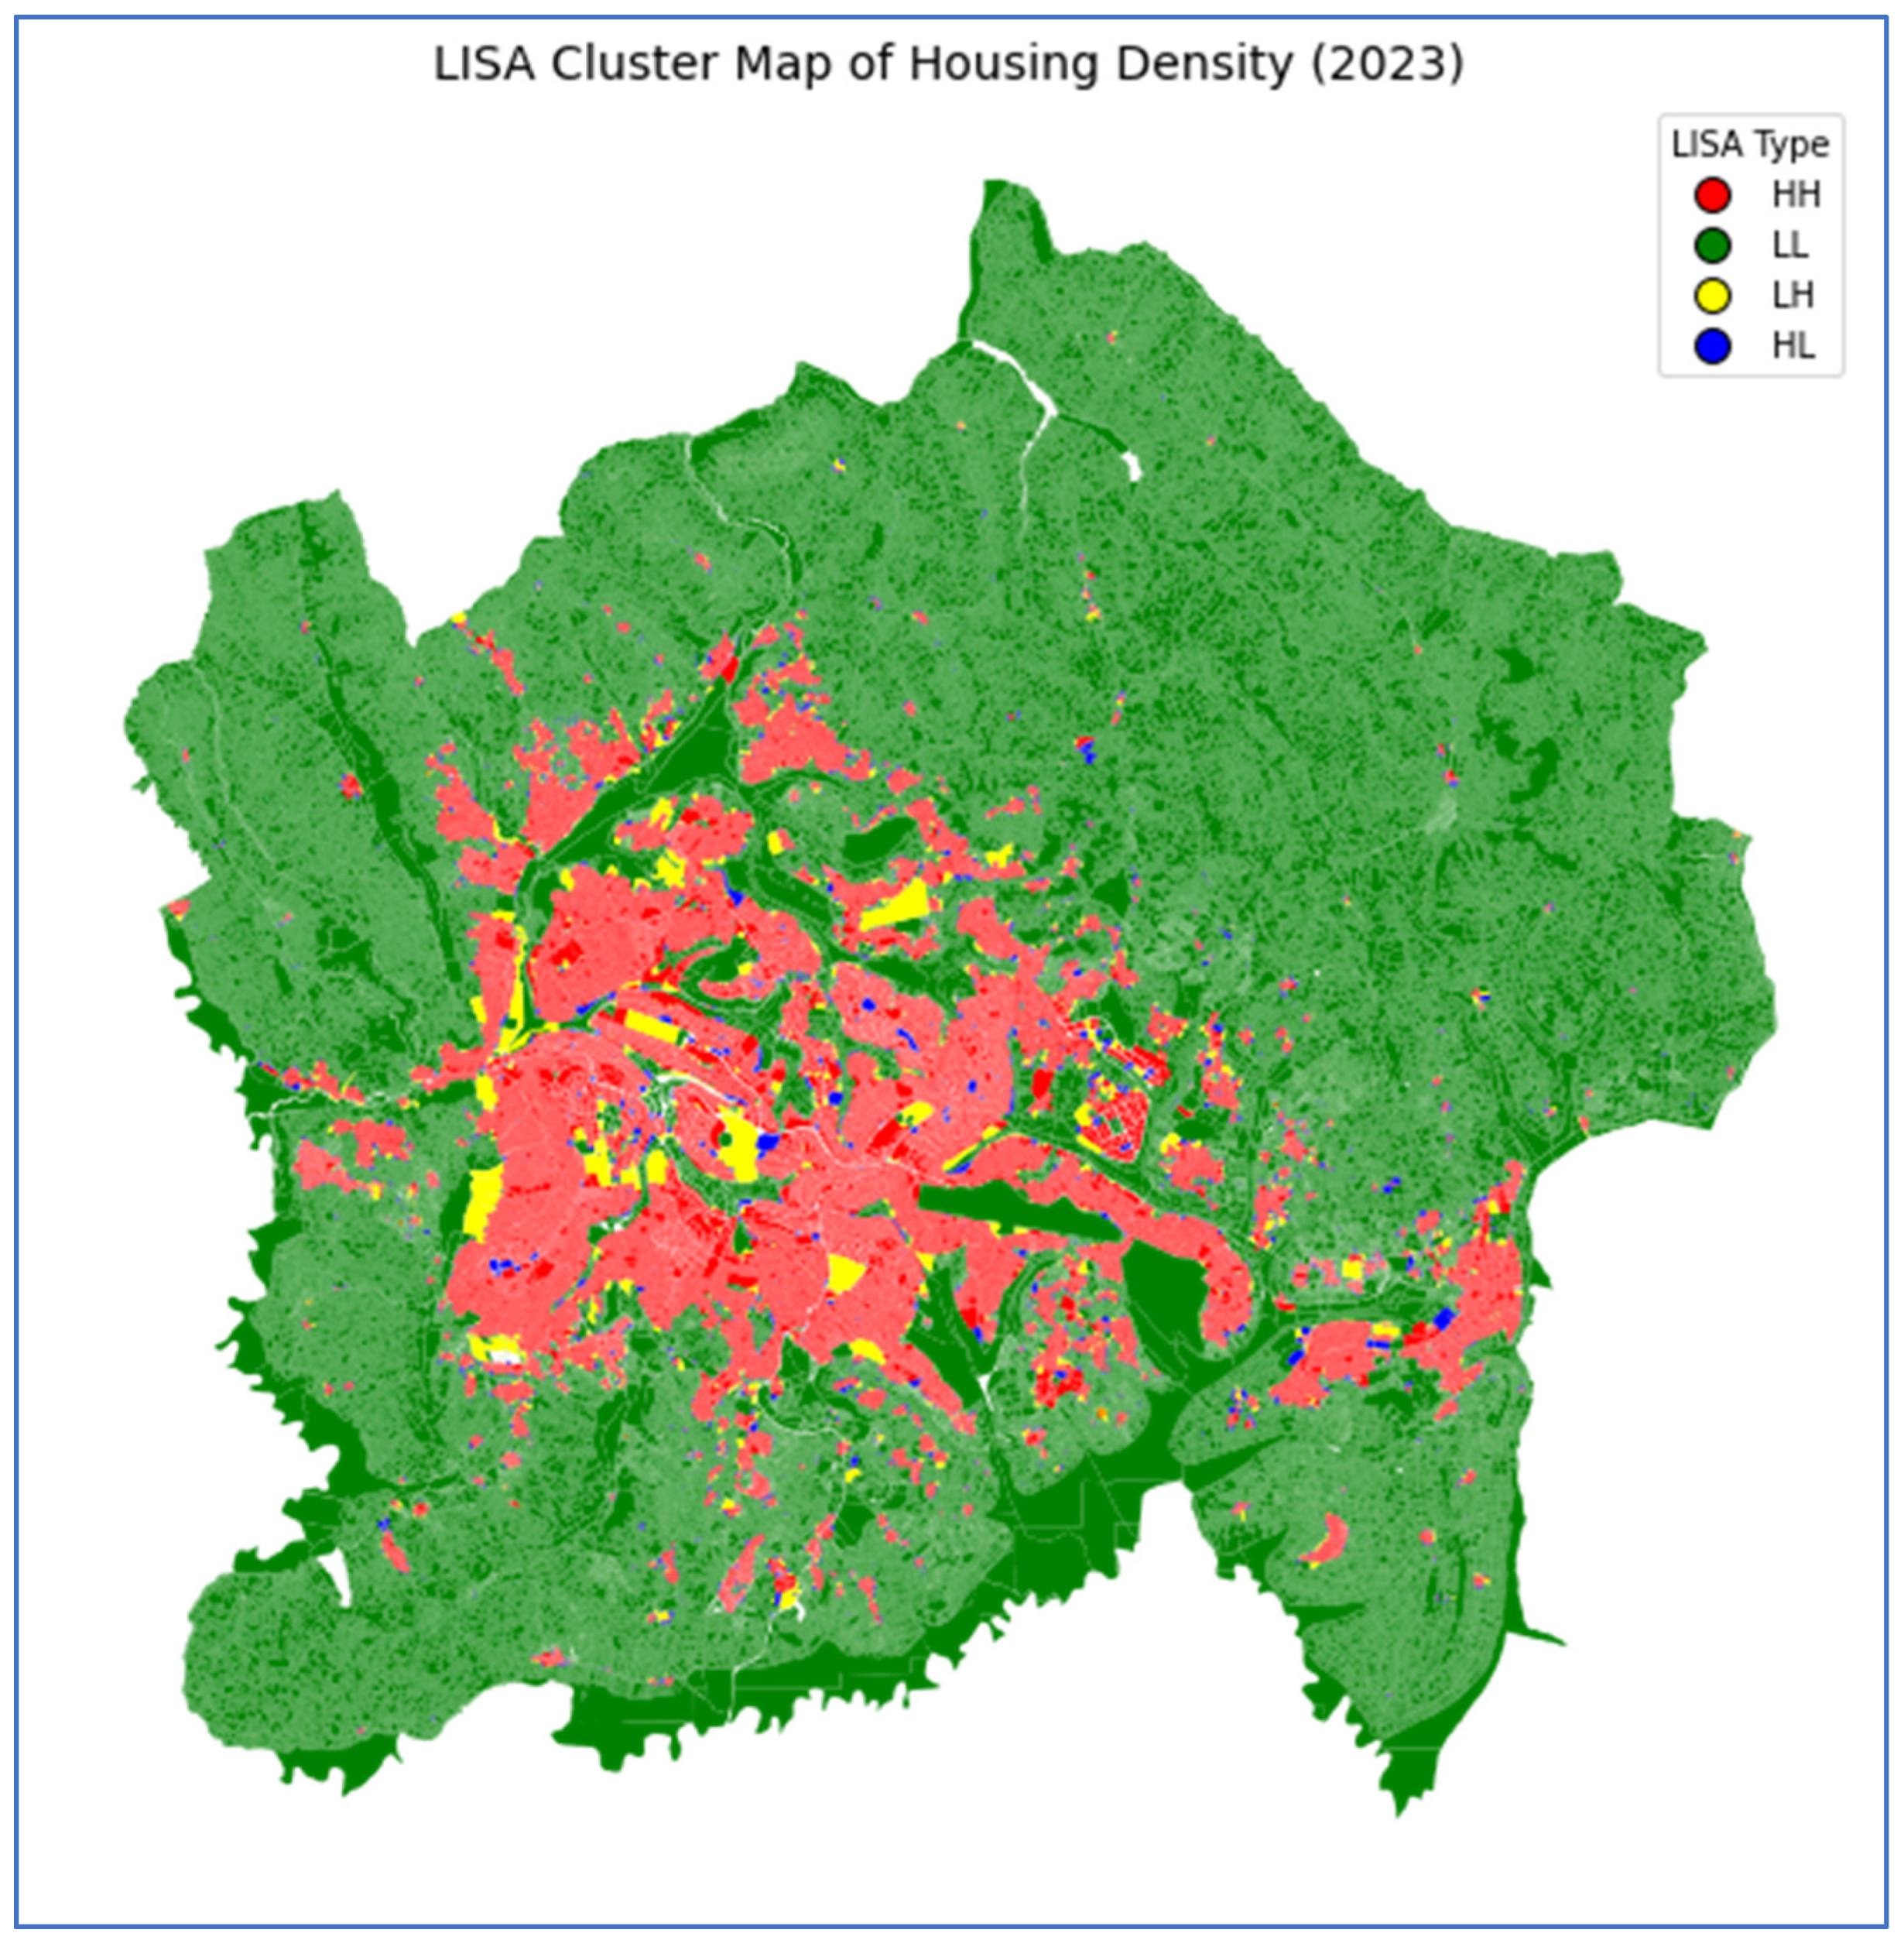
Figure 3.
Silhouette Score Comparison.
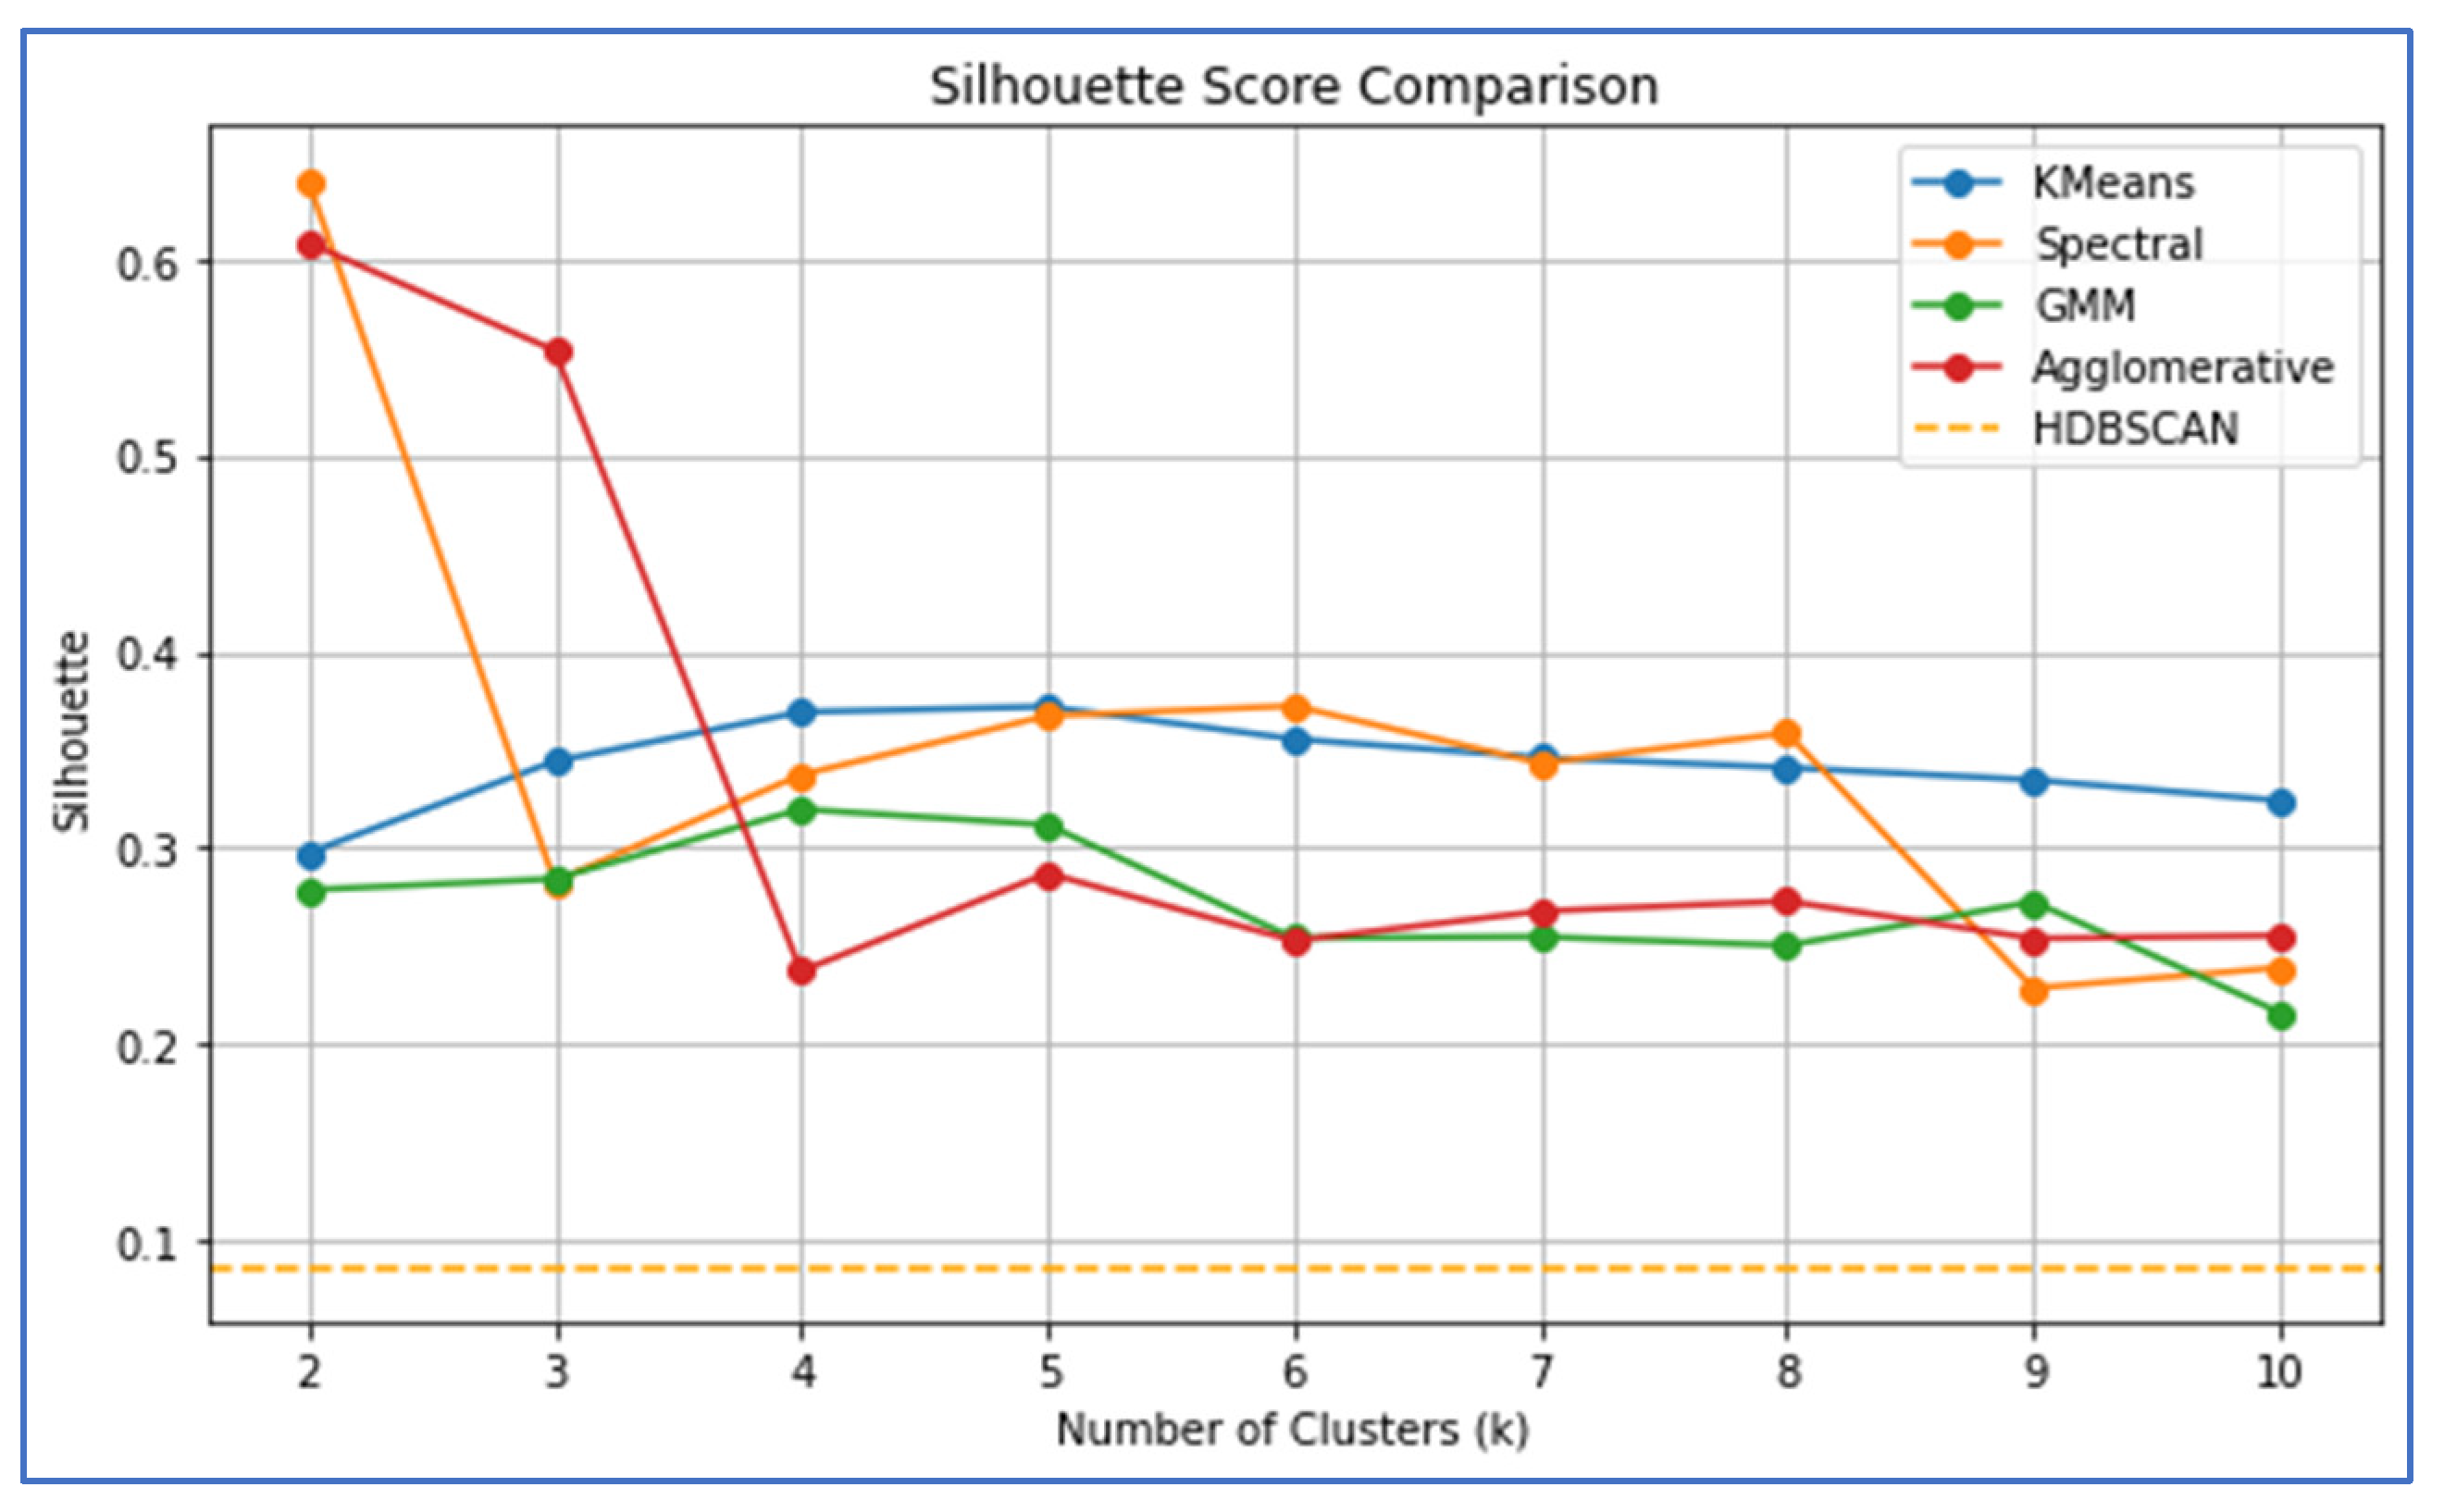
Figure 4.
DBI comparison.
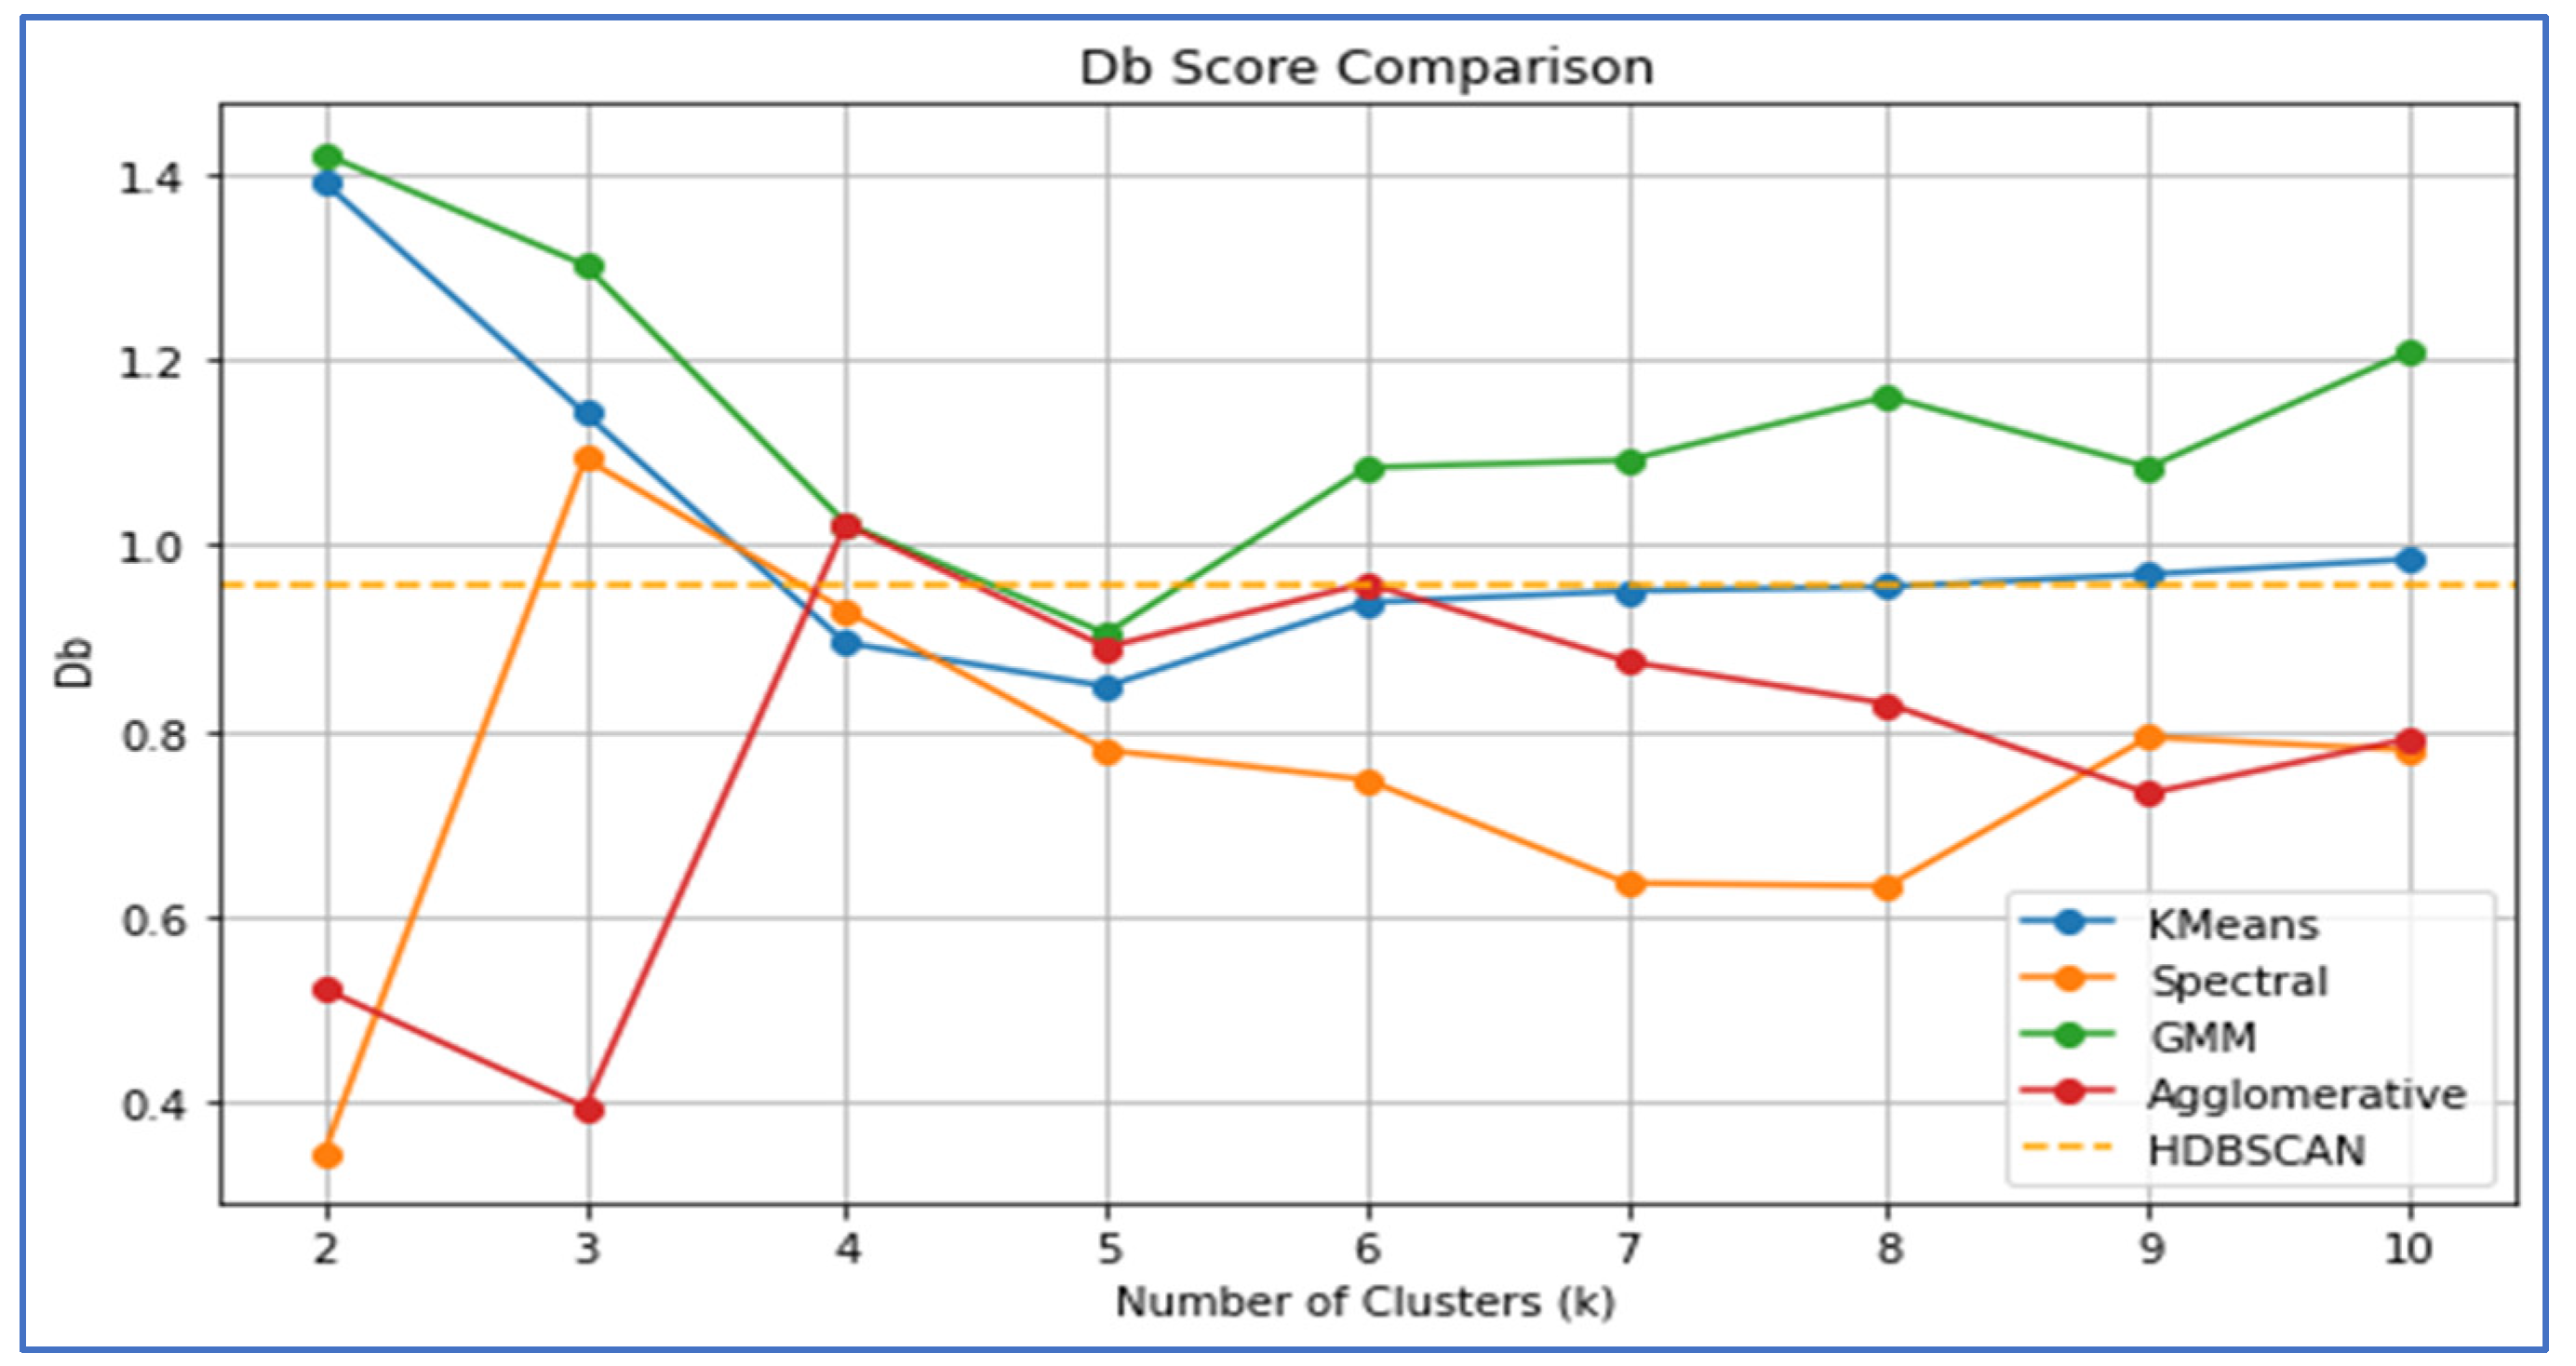
Figure 5.
CHI Comparison.
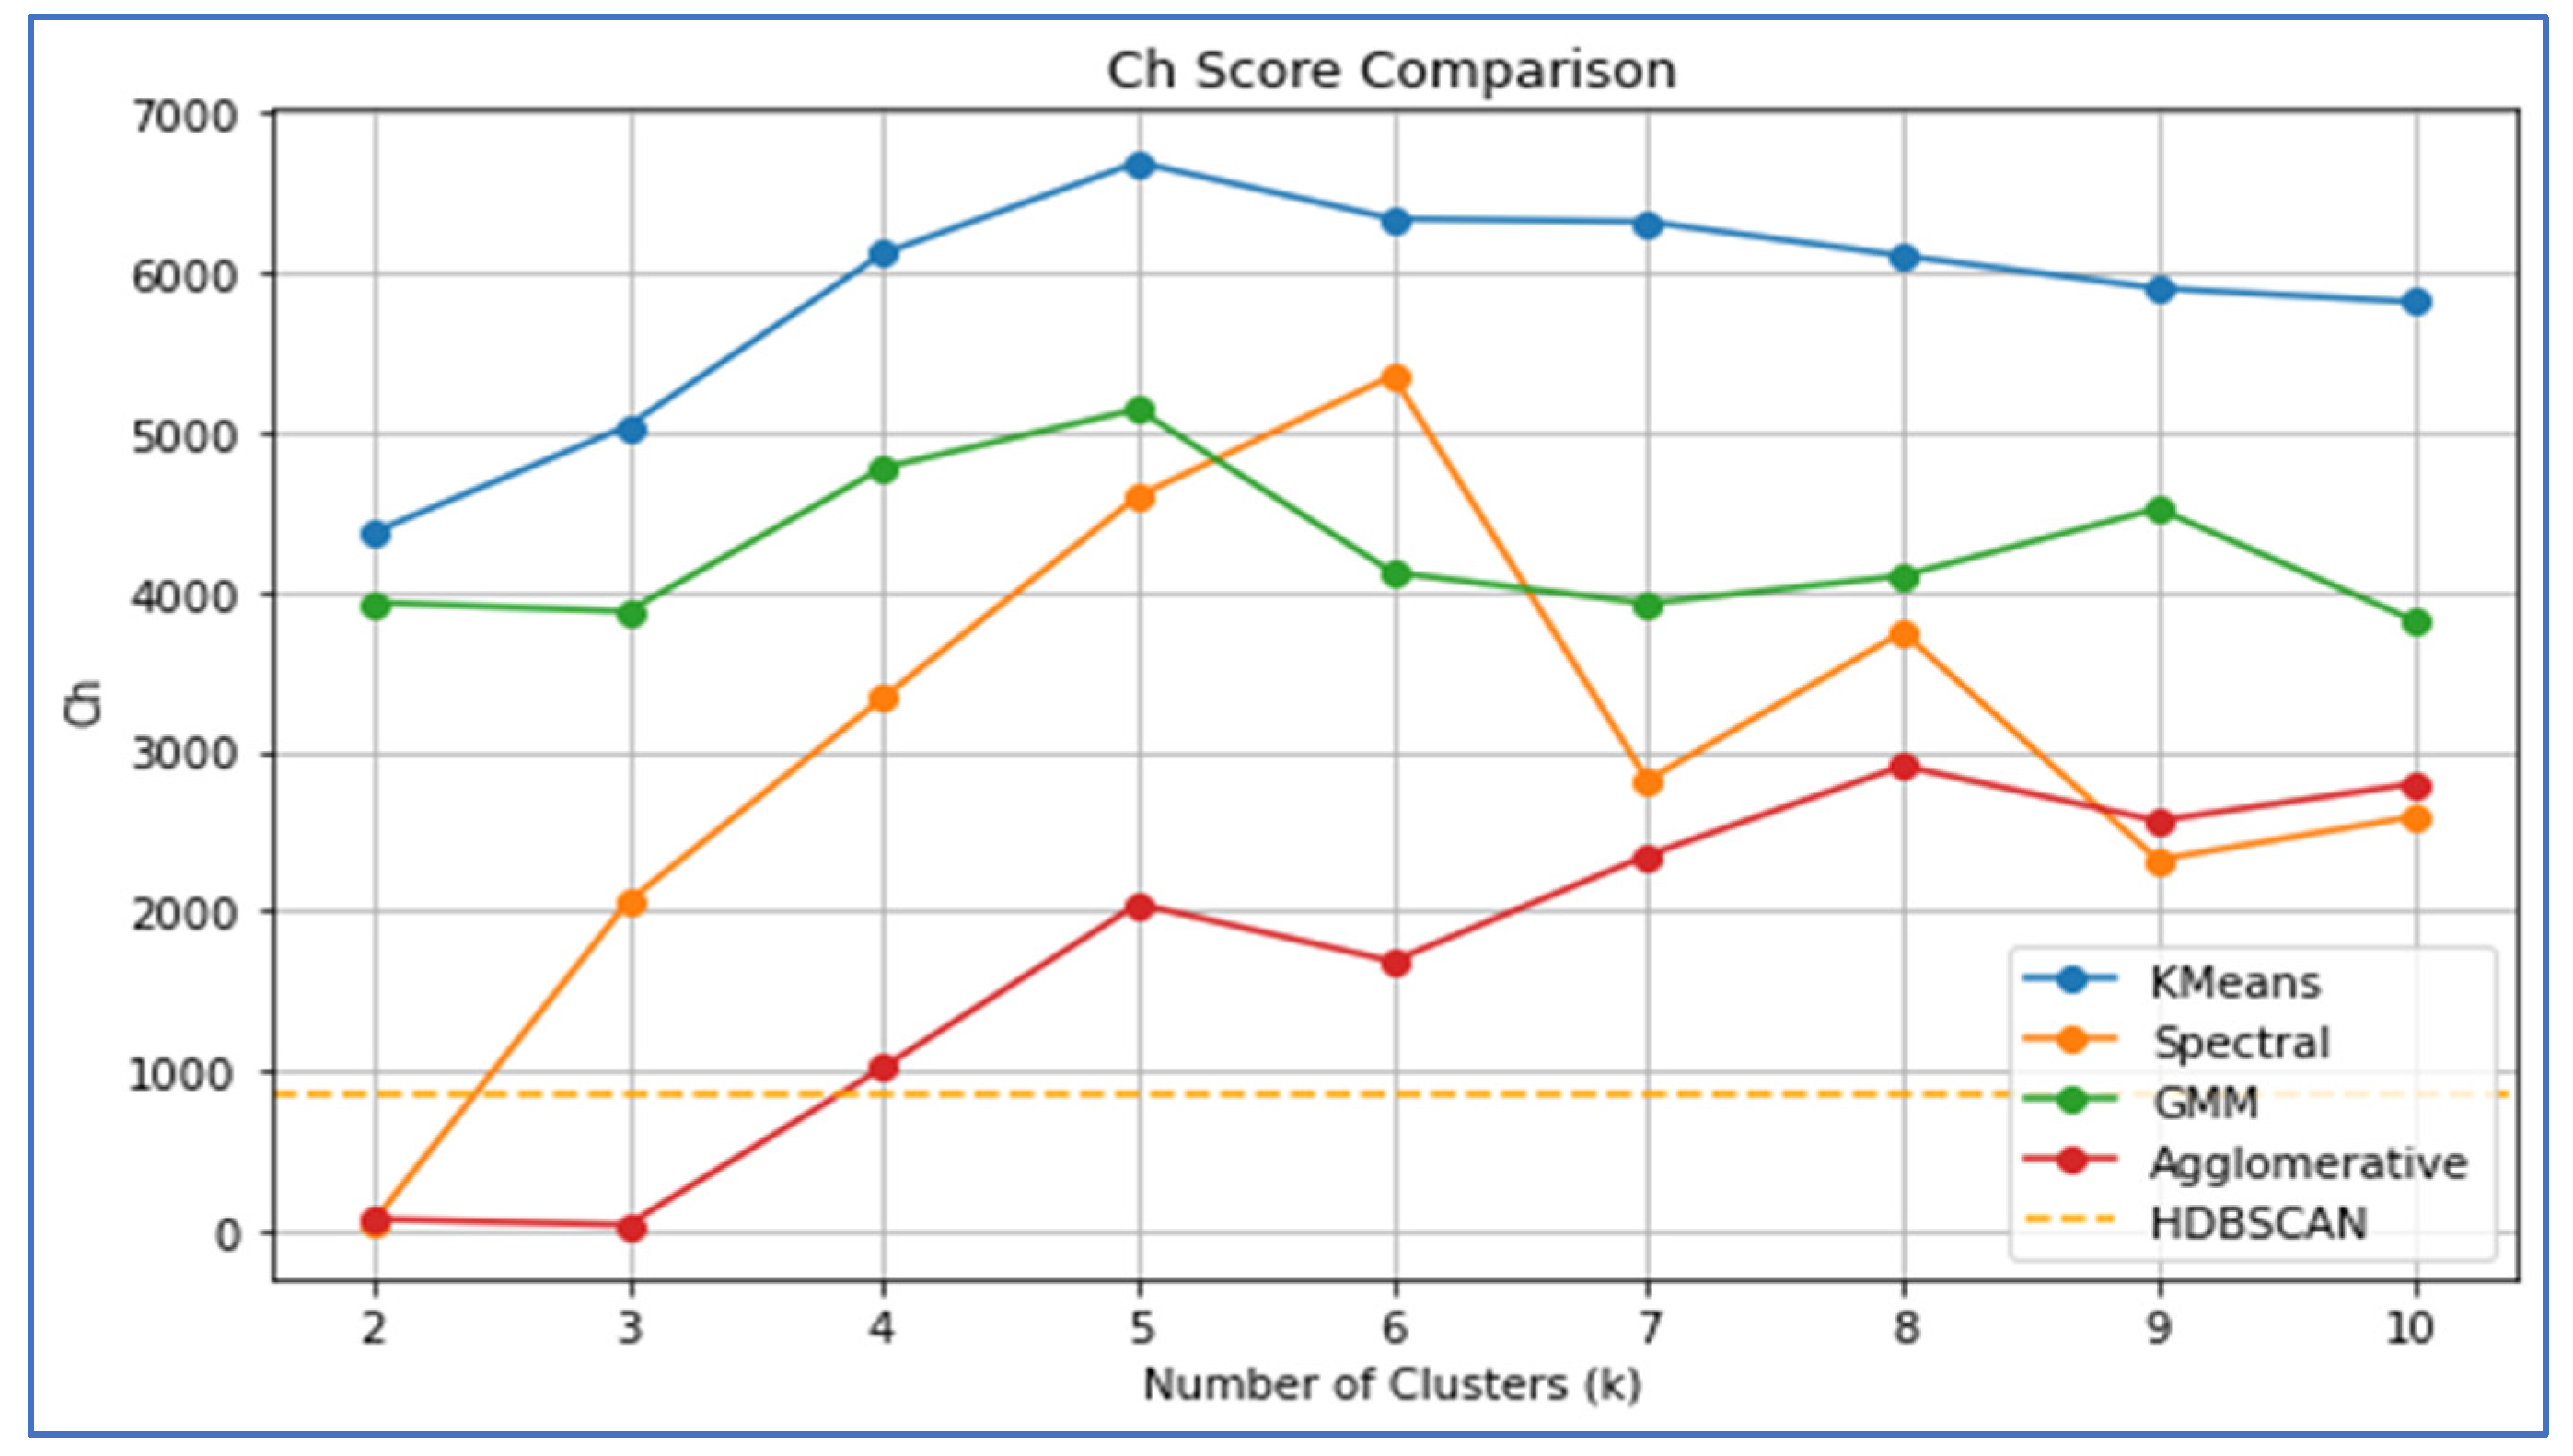
Figure 6.
K-means clusters of Kigali city housing density 2023.
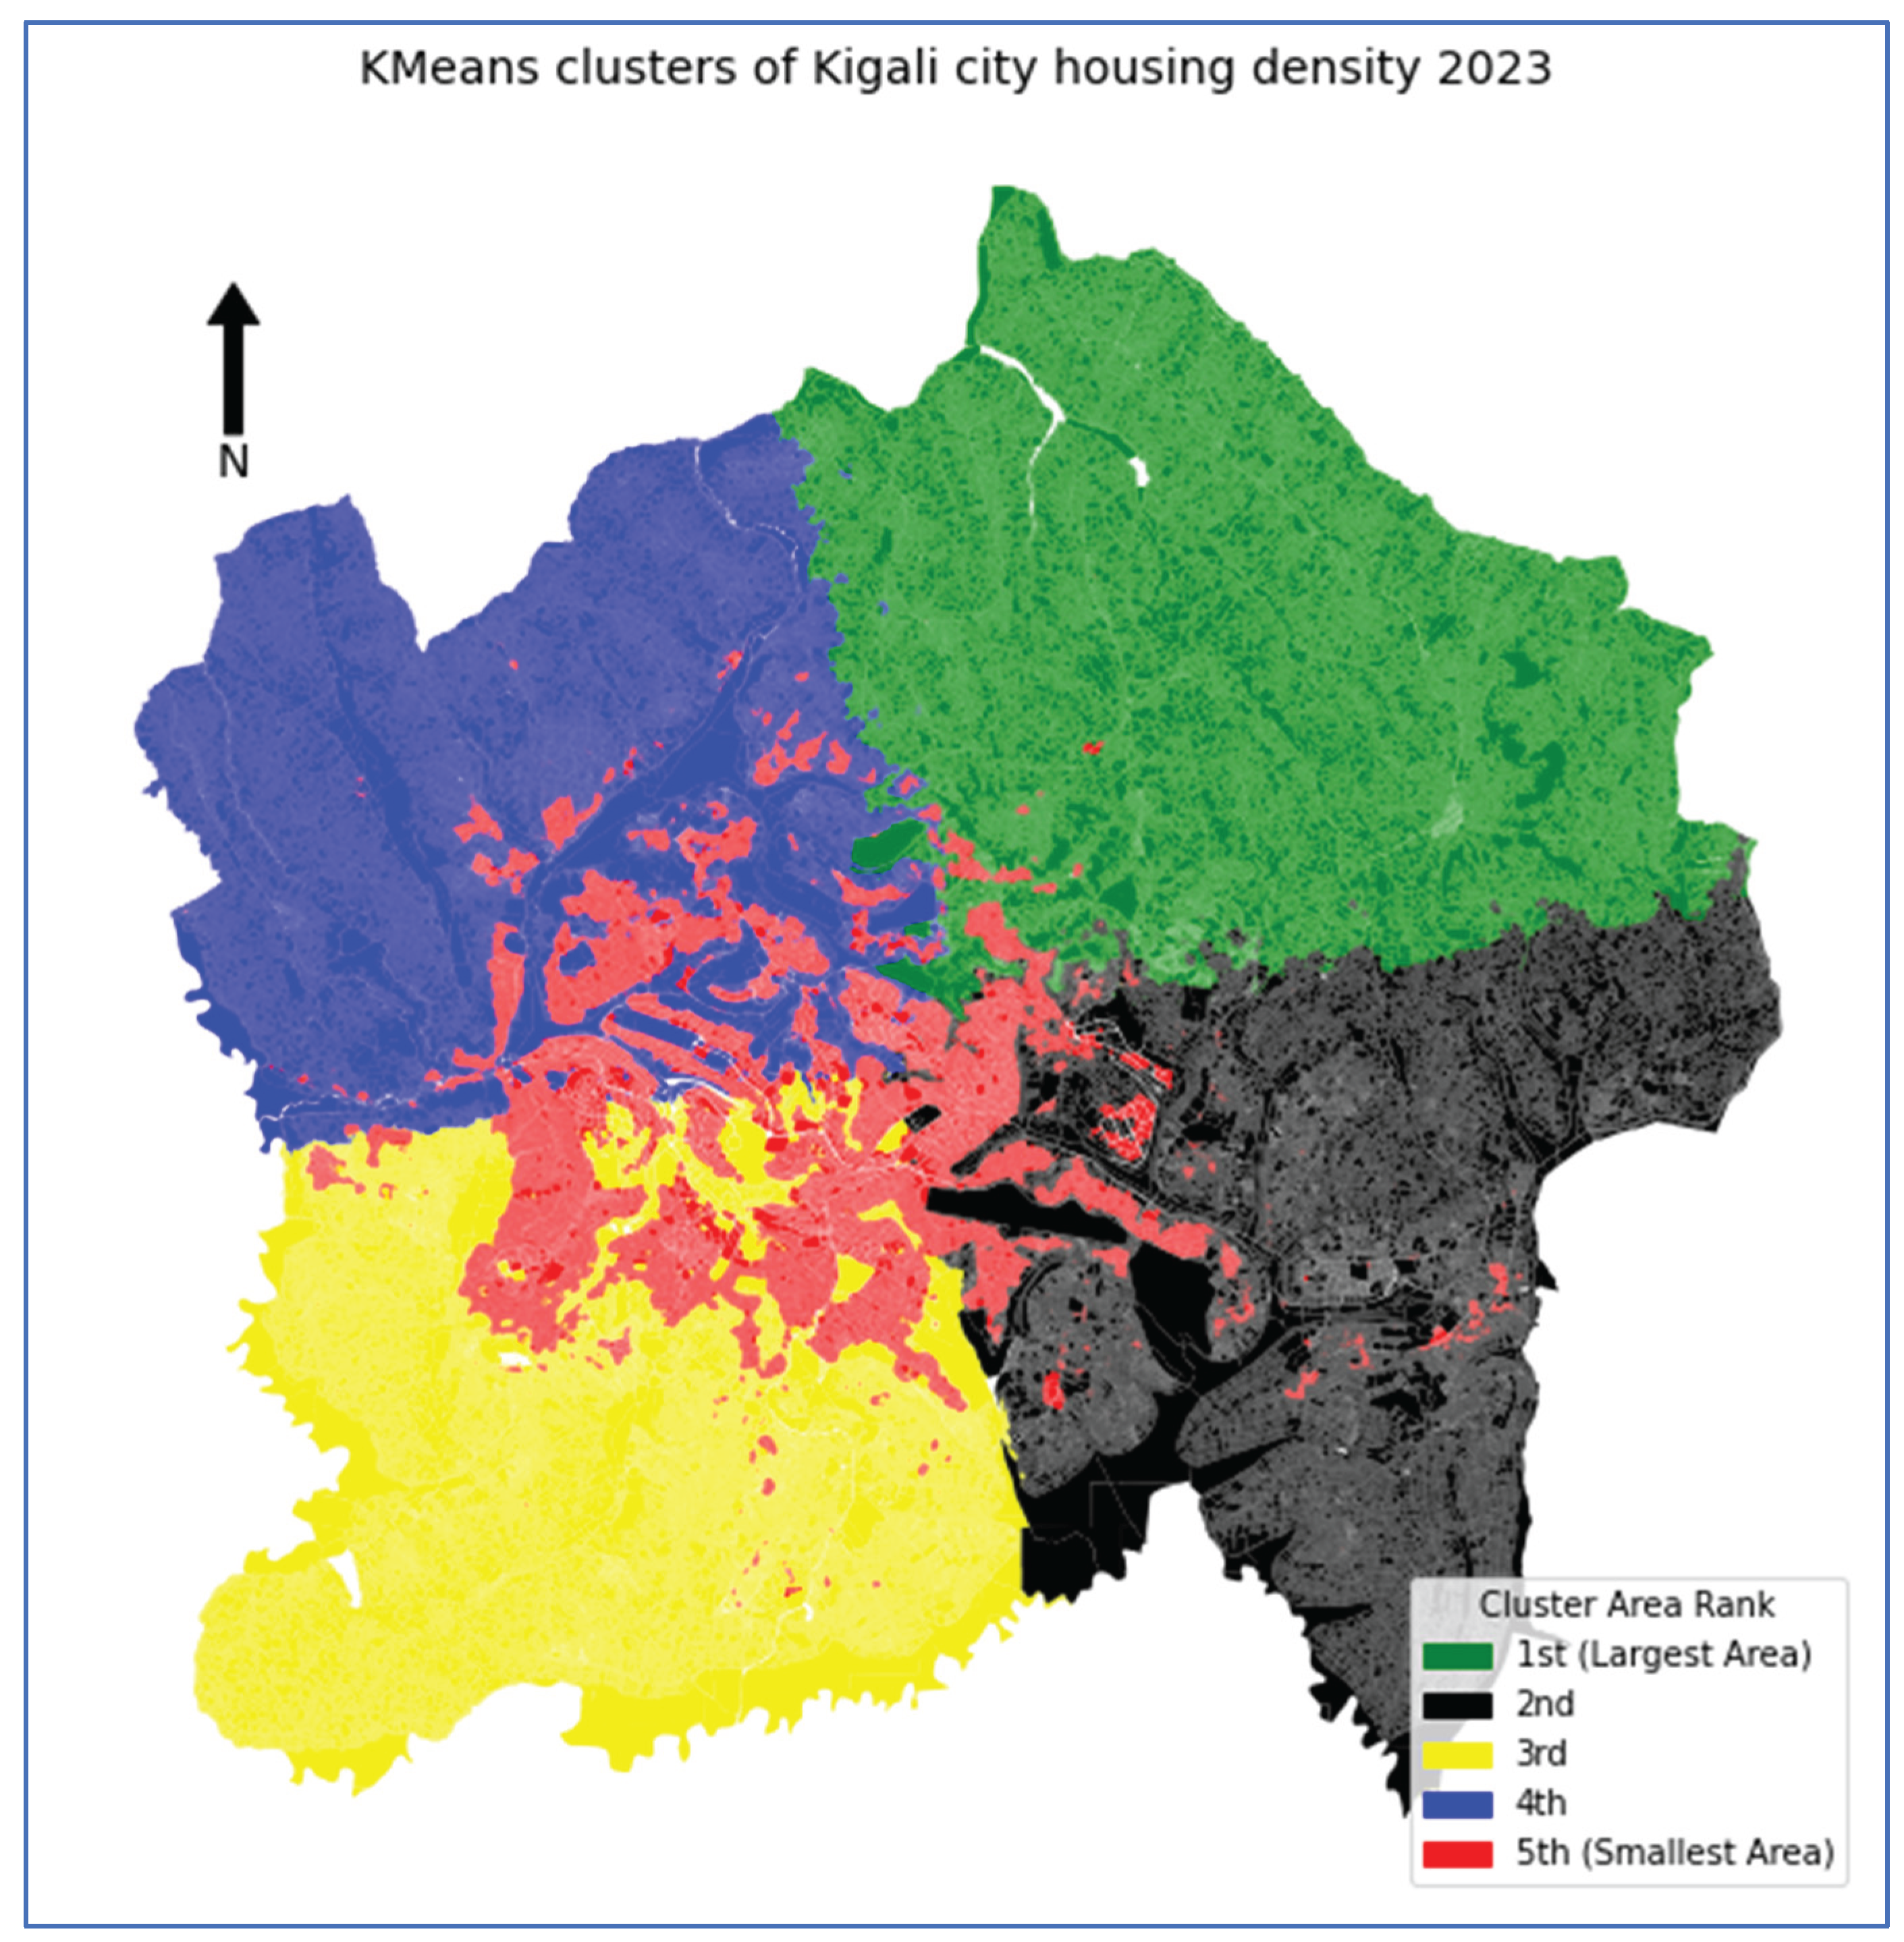

Table 1.
K-means Cluster Statistics for Kigali City Housing Density.
| Cluster | Area_km2 | Area_% | Avg_H_Density | Parcel_Count |
| 0 | 186.73 | 27.14 | 0.03 | 95480 |
| 1 | 142.77 | 20.75 | 0.08 | 95333 |
| 2 | 68.31 | 9.93 | 0.34 | 119770 |
| 3 | 154.29 | 22.42 | 0.09 | 96232 |
| 4 | 136.00 | 19.76 | 0.07 | 94355 |
| Overall | 688.09 | 100.00 | 0.13 | 501170 |
Disclaimer/Publisher’s Note: The statements, opinions and data contained in all publications are solely those of the individual author(s) and contributor(s) and not of MDPI and/or the editor(s). MDPI and/or the editor(s) disclaim responsibility for any injury to people or property resulting from any ideas, methods, instructions or products referred to in the content. |
© 2025 by the authors. Licensee MDPI, Basel, Switzerland. This article is an open access article distributed under the terms and conditions of the Creative Commons Attribution (CC BY) license (http://creativecommons.org/licenses/by/4.0/).
Copyright: This open access article is published under a Creative Commons CC BY 4.0 license, which permit the free download, distribution, and reuse, provided that the author and preprint are cited in any reuse.


