Introduction
Urban demographic growth impacts economic growth through various mechanisms, including population density, human capital accumulation, and urban concentration. While population density and urbanization generally promote economic growth, the effects can be mixed, particularly in developing countries where rapid urbanization may have negative consequences. Urban growth in developing countries is unprecedented, driven by national population growth, economic levels, and urban population size, but requires further research and development objectives. (Glaeser et al., 1995) Cities with better amenities, agglomeration economies, human capital, and diverse production foster urban growth, while fewer roads and restrictions on housing supply hinder it.(Duranton & Puga, 2014b). City populations may be non-stationary, but long-term growth of cities and total urban population is parallel, with deviations from this growth rate due to exogenous shocks lasting less than a decade.(Sharma, 2003)
Urbanization plays a key role in human capital accumulation and long-term economic growth and development through structural changes, infrastructure development, investment in human capital, and institutional arrangements.(Mehmood et al., 2021) Urbanization promotes efficiency and patterns of growth, with localized information spillovers promoting agglomeration and human capital accumulation, but can also foster income inequality. (Black & Henderson, 1999). Urban concentration benefits economic growth in high-income countries, but not in developing countries, with no uniform relationship between urban concentration and economic growth.(Frick & Rodríguez-Pose, 2018)
Changes in demographic rates have an increasing effect on determining the spatial component of multiregional population growth.(Campisi, 1986) Demographic change, including births, deaths, and in-migration, has asymmetric impacts on land development, with births increasing built-up land area more than deaths slowing this process down. (Clement & York, 2017). Rapid urbanization leads to significant land use changes, often converting agricultural and natural lands into developed areas. This trend is observed in both developed and developing regions (Darrel Jenerette & Potere, 2010; Gong et al., 2023; Li et al., 2015; Zhang et al., 2013). In areas with declining populations, land use changes are influenced more by economic factors than by demographic shifts alone (Kroll & Haase, 2010) The relationship between spatial change and demographic change is intricate and context-dependent. Demographic factors such as population growth, aging, and migration significantly influence spatial patterns, land use, and urbanization. These changes, in turn, affect environmental sustainability and socio-economic development Economic growth and technological advancements also play a significant role in land use changes, often interacting with demographic factors to drive urbanization and land conversion.(Egidi et al., 2021; Li et al., 2015) In larger and denser metropolitan areas, housing supply constraints have led to demand growth manifesting as price increases rather than increases in housing units or population. This is due to higher costs of new housing in areas with intense existing development and restrictive regulations (Accetturo et al., 2020, 2021; Baum-Snow, 2023; Glaeser et al., n.d.)
Rapid urbanization has led to increased demand for housing in urban areas, often outpacing the supply. This mismatch is exacerbated by the slow response of housing supply to demand changes, leading to higher house prices(Liu et al., 2022; San Juan, 2023; Tobi et al., 2020).Physical geography, such as steep terrain and water bodies, along with regulatory constraints, significantly limit the developable land in metropolitan areas. These constraints make housing supply less elastic, contributing to higher housing prices and slower economic growth in response to demand shocks (Saleh et al., 2017).Urban population growth and new urbanization trends contribute to the disequilibrium between housing supply and demand, affecting market dynamics (Kwoun et al., 2013; Okuta et al., 2024). Urbanization in developing countries often leads to increased housing demand, but the supply response is typically slow due to various constraints, leading to a mismatch (Accetturo et al., 2020; Malpezzi & Mayo, 1987)
Hawassa city growth and expansion tendencies were not scientifically studied; however, due to demographic change and rural-urban migration, the city is expanding to South, Northeast, Southeast direction, which are the potential land for the town that will accommodate the future growth and expansion of the town even though, guided by structural plan.
First and foremost, the development of industrial parks has had a socioeconomic impact on Hawassa and the country as a whole. However, in the last ten years, the establishment of the town’s industrial park has resulted in a significant increase in population attraction, as well as a dramatic change from agricultural land to residential plots in more than three settlements, including Cheffe, Dato, Monopol, and Loke. Those locations are now densely populated, yet they were originally used for agriculture. Nonetheless, as compared to other previously developed lands, such communities are quickly becoming the primary choice of low- and middle-income earners. Because of the socioeconomic and geographical mismatch, the city has challenges in providing enough infrastructure and services, informal spontaneous land use change in previously established settlements, and a mismatch between housing demand and availability. The objective of this paper is to assess the link between socioeconomic and spatial developments in Hawassa city.
2.2. Materials and Methods
2.2.1. Study Area
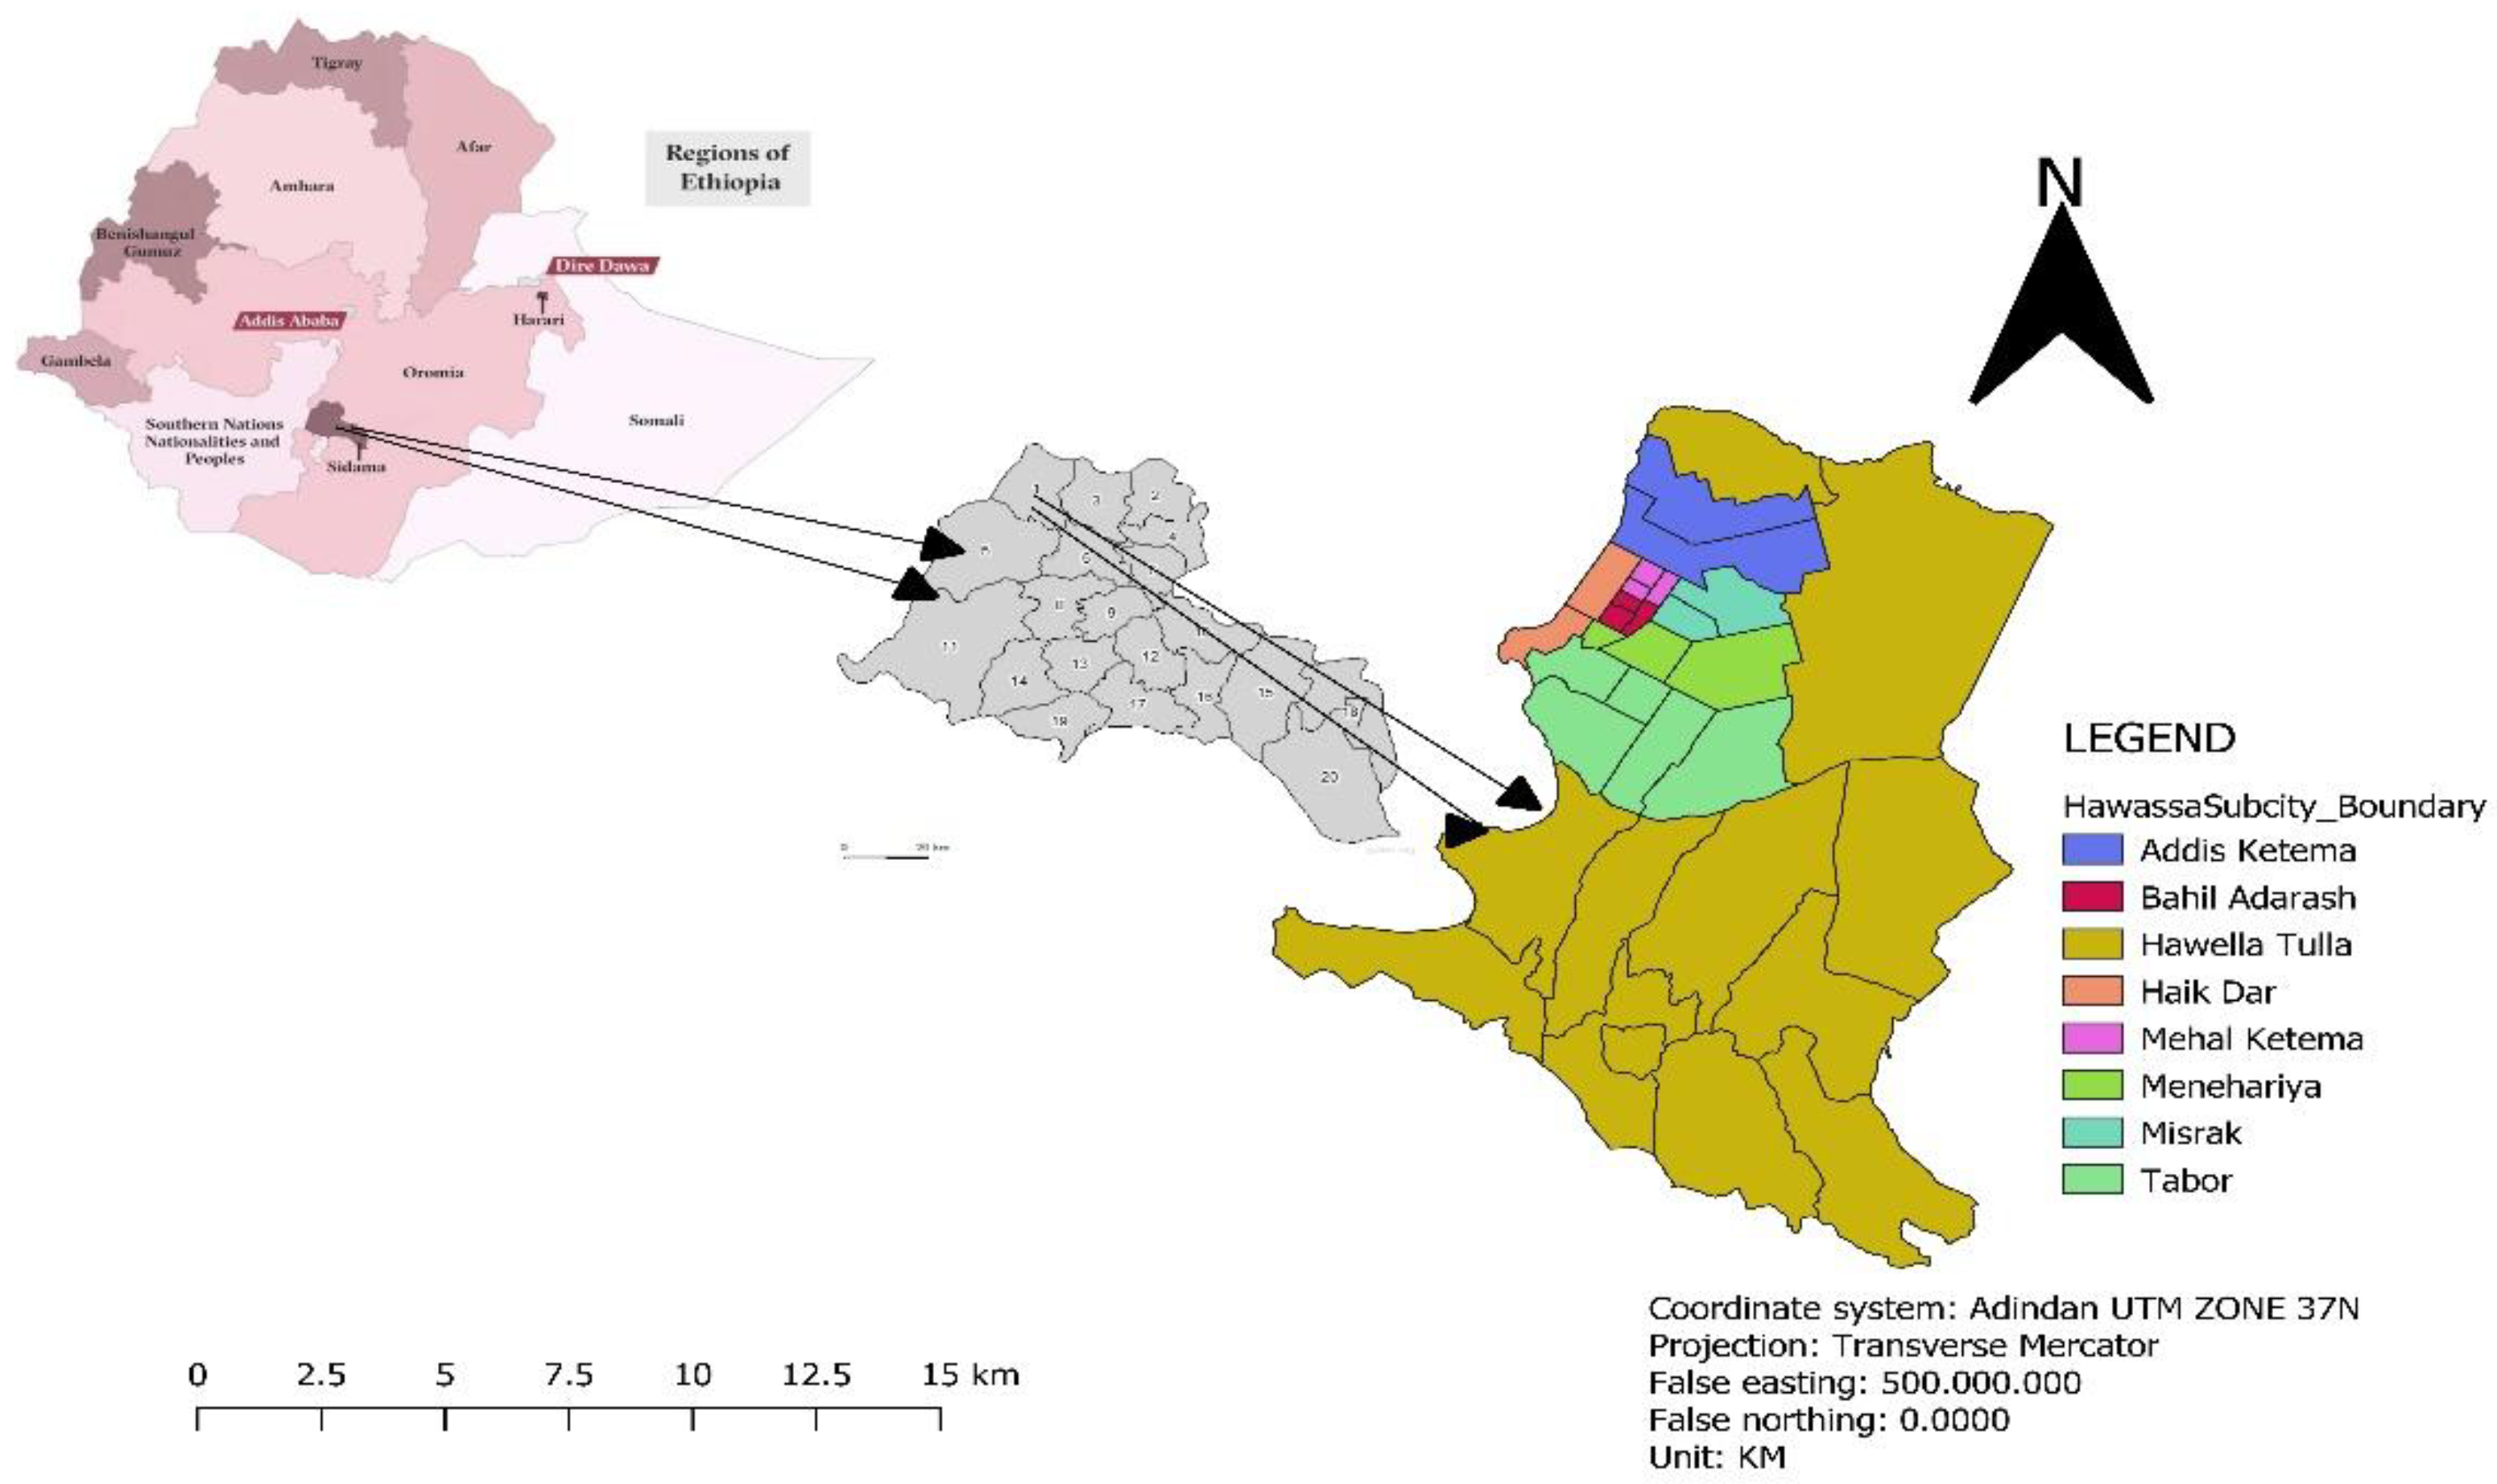
Hawassa is located in southern Addis Ababa, Ethiopia, along the Addis Ababa-Moyale international highway and is situated between the TikurWuha River, Alamura Mountain, Chelelaka Marshy, and Lake Hawassa. Hawassa previously served as the administrative seat of SNNPR, and recently, the city also served as the administrative seat for the Sidama Regional Estate. Currently, in Hawassa, 493,484 people reside (CSA Census) within eight sub cities. The town of Hawassa has a typical elevation of approximately 1,690 meters above sea level and extends partially in the rift valley, a flat plain. Currently, Hawassa city is facing the spreading and expansion of squatter housing settlements in emerging peri-urban settlements that cultivate a lack of good governance, which is caused by unplanned development.
Figure 1.
Location Map of Hawassa City, 2023. Source: Hawassa city Administration Urban Plan Department 2023 (modified by Researcher).
Figure 1.
Location Map of Hawassa City, 2023. Source: Hawassa city Administration Urban Plan Department 2023 (modified by Researcher).
2.2.2. Methodology
The research is based on mixed methods that encompass both quantitative and qualitative data collection. The population according to CSA projection (2023) in Hawassa city is 513,321; thus, the total sample size for collecting survey data is determined using the commonly used assumptions of the confidence interval (93%) and error margin (7%). Since the population of the sampled cities/towns is more than 1,000, the maximum sample of 167 is determined using the sample size table of research advisors 2006 (
http://researchadvisors.com). The total quantity of samples for the household survey was 167. Then, information is gathered from the sampled sub-city, and the research employs a proportional sample allocation equation through Kothari sampling calculation (Kothari, 2004).
Where;
S= Sample size of the stratum,
p= Total households of the stratum
N= Total population (i.e., total HHs)
n= Total sample size
Stratified random sampling technique executed to collect primary and secondary data from selected sites of the city. The strata used for sampling were classified into two parts based on the characterization and growth dynamics of the city; therefore, the city was divided into previously emerged settlements and emerging peri-urban settlements to identify the urban growth dynamics of the city. From previously emerged settlements, Atote, Piyassa, Harari Sefer and Old bus station sefer were selected for site observation and household survey from emerging peri-urban settlements. Dato Odahe, Cheffe Cote Jebisa, Loke, Monopol (Gemeto Gale) and Diaspora sites were selected for site observation and household survey.
The qualitative data type included satellite images, previously published magazines and brochures, written documents and reports about the town’s previous plans, socioeconomic evaluation reports, spatial reports, research and articles that have a relationship with this research, and an audit report (financial and socioeconomic). The quantitative data types that were used as input for this research include population and demographic data, transportation data, GDP of the town, and the current total area of the town with the population projection.
Data analysis was made through Land use analysis, using different statistical and analytical methods SPSS, GIS, and Excel spreadsheets was used to analyze socio-economic and spatial data that have direct implication on the research objective. To analyze socio-economic relationship correlational and regression analysis executed to identify the causal relationship between socio-economic and spatial change.
2.3. Result and Discussion
Physical and socioeconomic growth patterns are connected; the socioeconomic characteristics of the city influence the physical growth trends. For example, since the city became the administrative headquarters of SNNPR in 1999 G.C., it has attracted a number of businesses and government agencies. As a result, change happened, and the boomerang effect of the shift has a deliberately impact on the city’s growth trends.
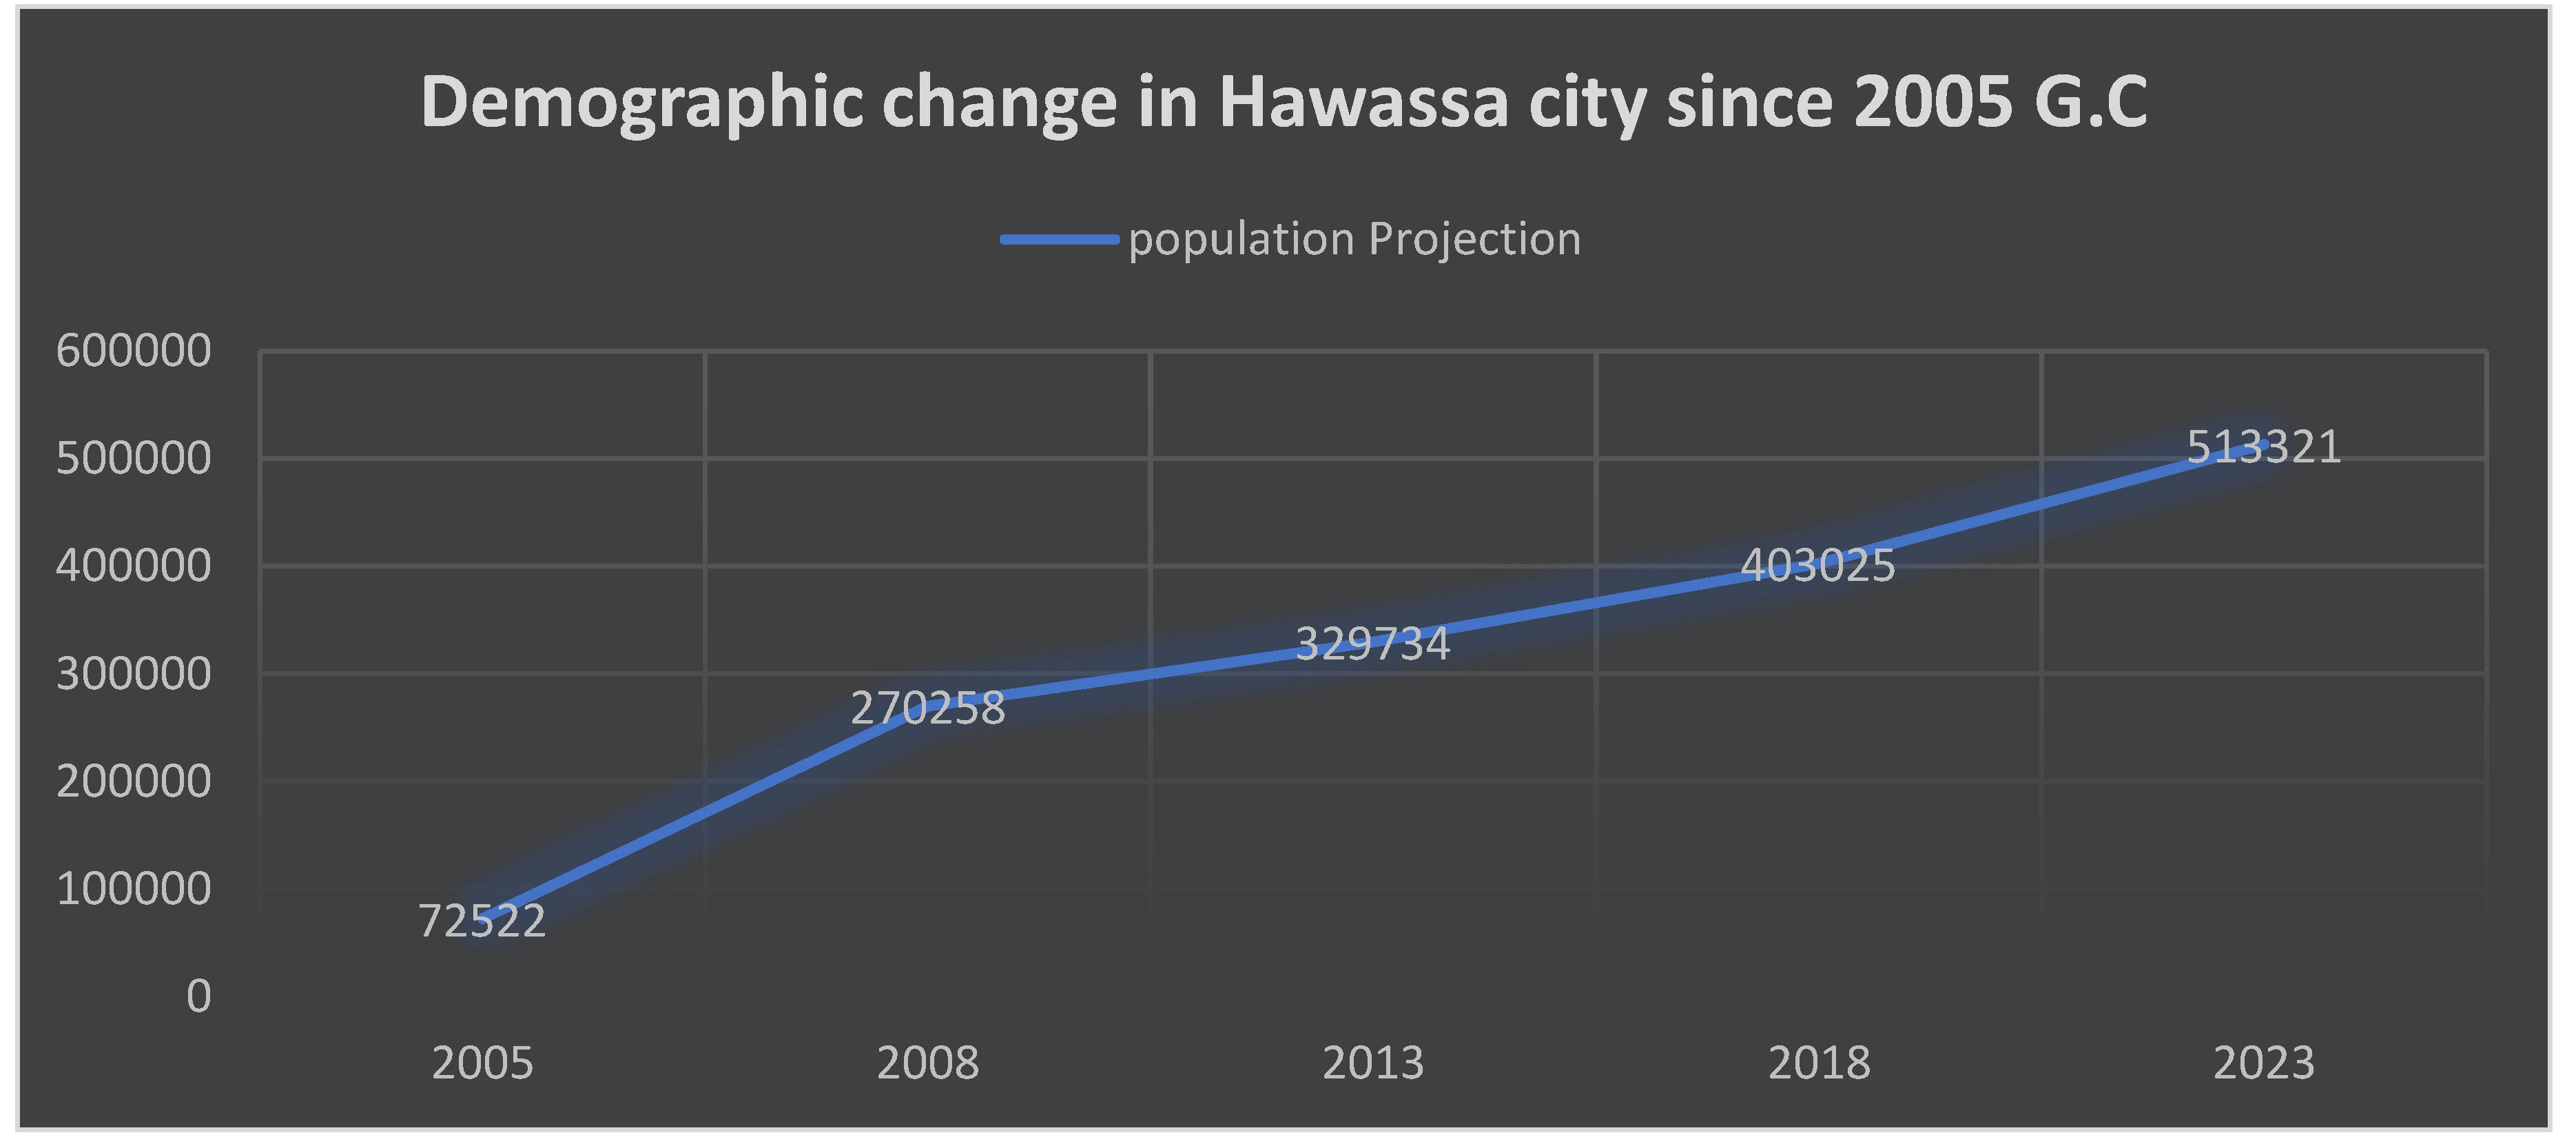
From 2003 G.C. to 2023 E.C., the population of Hawassa increases from 72,522 to 513,521; the population increases more than seven times. Consecutively, the number of rural populations also increases exponentially; therefore, informality in peri-urban settlements increases rapidly, and during this season, the city became the administrative capital of SNNPR, and many governmental offices attract the employee from southern nations, and that became the causal factor for the expansion and growth of the city.
Table 1.
correlation table of computed socio-economic variables.
Table 1.
correlation table of computed socio-economic variables.
| Variables |
Total Demographic change in 5 Years Interval |
Revenue change in 5 Year Interval |
Tourism flow in 5 Years Interval |
Peri-urban demographic change in 5 year Interval |
Transport Modality in in 5 Years Interval |
| Total Demographic change in 5 Years Interval |
Pearson Correlation |
1 |
0.639 |
0.867 |
0.029 |
0.834 |
| |
Sig. (2-tailed) |
|
0.246 |
0.057 |
0.963 |
0.079 |
| |
N |
5 |
5 |
5 |
5 |
5 |
| Revenue change in 5 Year Interval |
Pearson Correlation |
0.639 |
1 |
0.312 |
0.523 |
0.825 |
| |
Sig. (2-tailed) |
0.246 |
|
0.610 |
0.366 |
0.086 |
| |
N |
5 |
5 |
5 |
5 |
5 |
| Tourism flow in 5 Years Interval |
Pearson Correlation |
0.867 |
0.312 |
1 |
-0.419 |
0.756 |
| |
Sig. (2-tailed) |
0.057 |
0.610 |
|
0.482 |
0.139 |
| |
N |
5 |
5 |
5 |
5 |
5 |
| Peri-urban demographic change in 5 year Interval |
Pearson Correlation |
0.029 |
0.523 |
-0.419 |
1 |
0.000 |
| |
Sig. (2-tailed) |
0.963 |
0.366 |
0.482 |
|
1.000 |
| |
N |
5 |
5 |
5 |
5 |
5 |
| Transport Modality in Hawassa in 5 Years Interval |
Pearson Correlation |
0.834 |
0.825 |
0.756 |
0.000 |
1 |
| |
Sig. (2-tailed) |
0.079 |
0.086 |
0.139 |
1.000 |
|
| |
N |
5 |
5 |
5 |
5 |
5 |
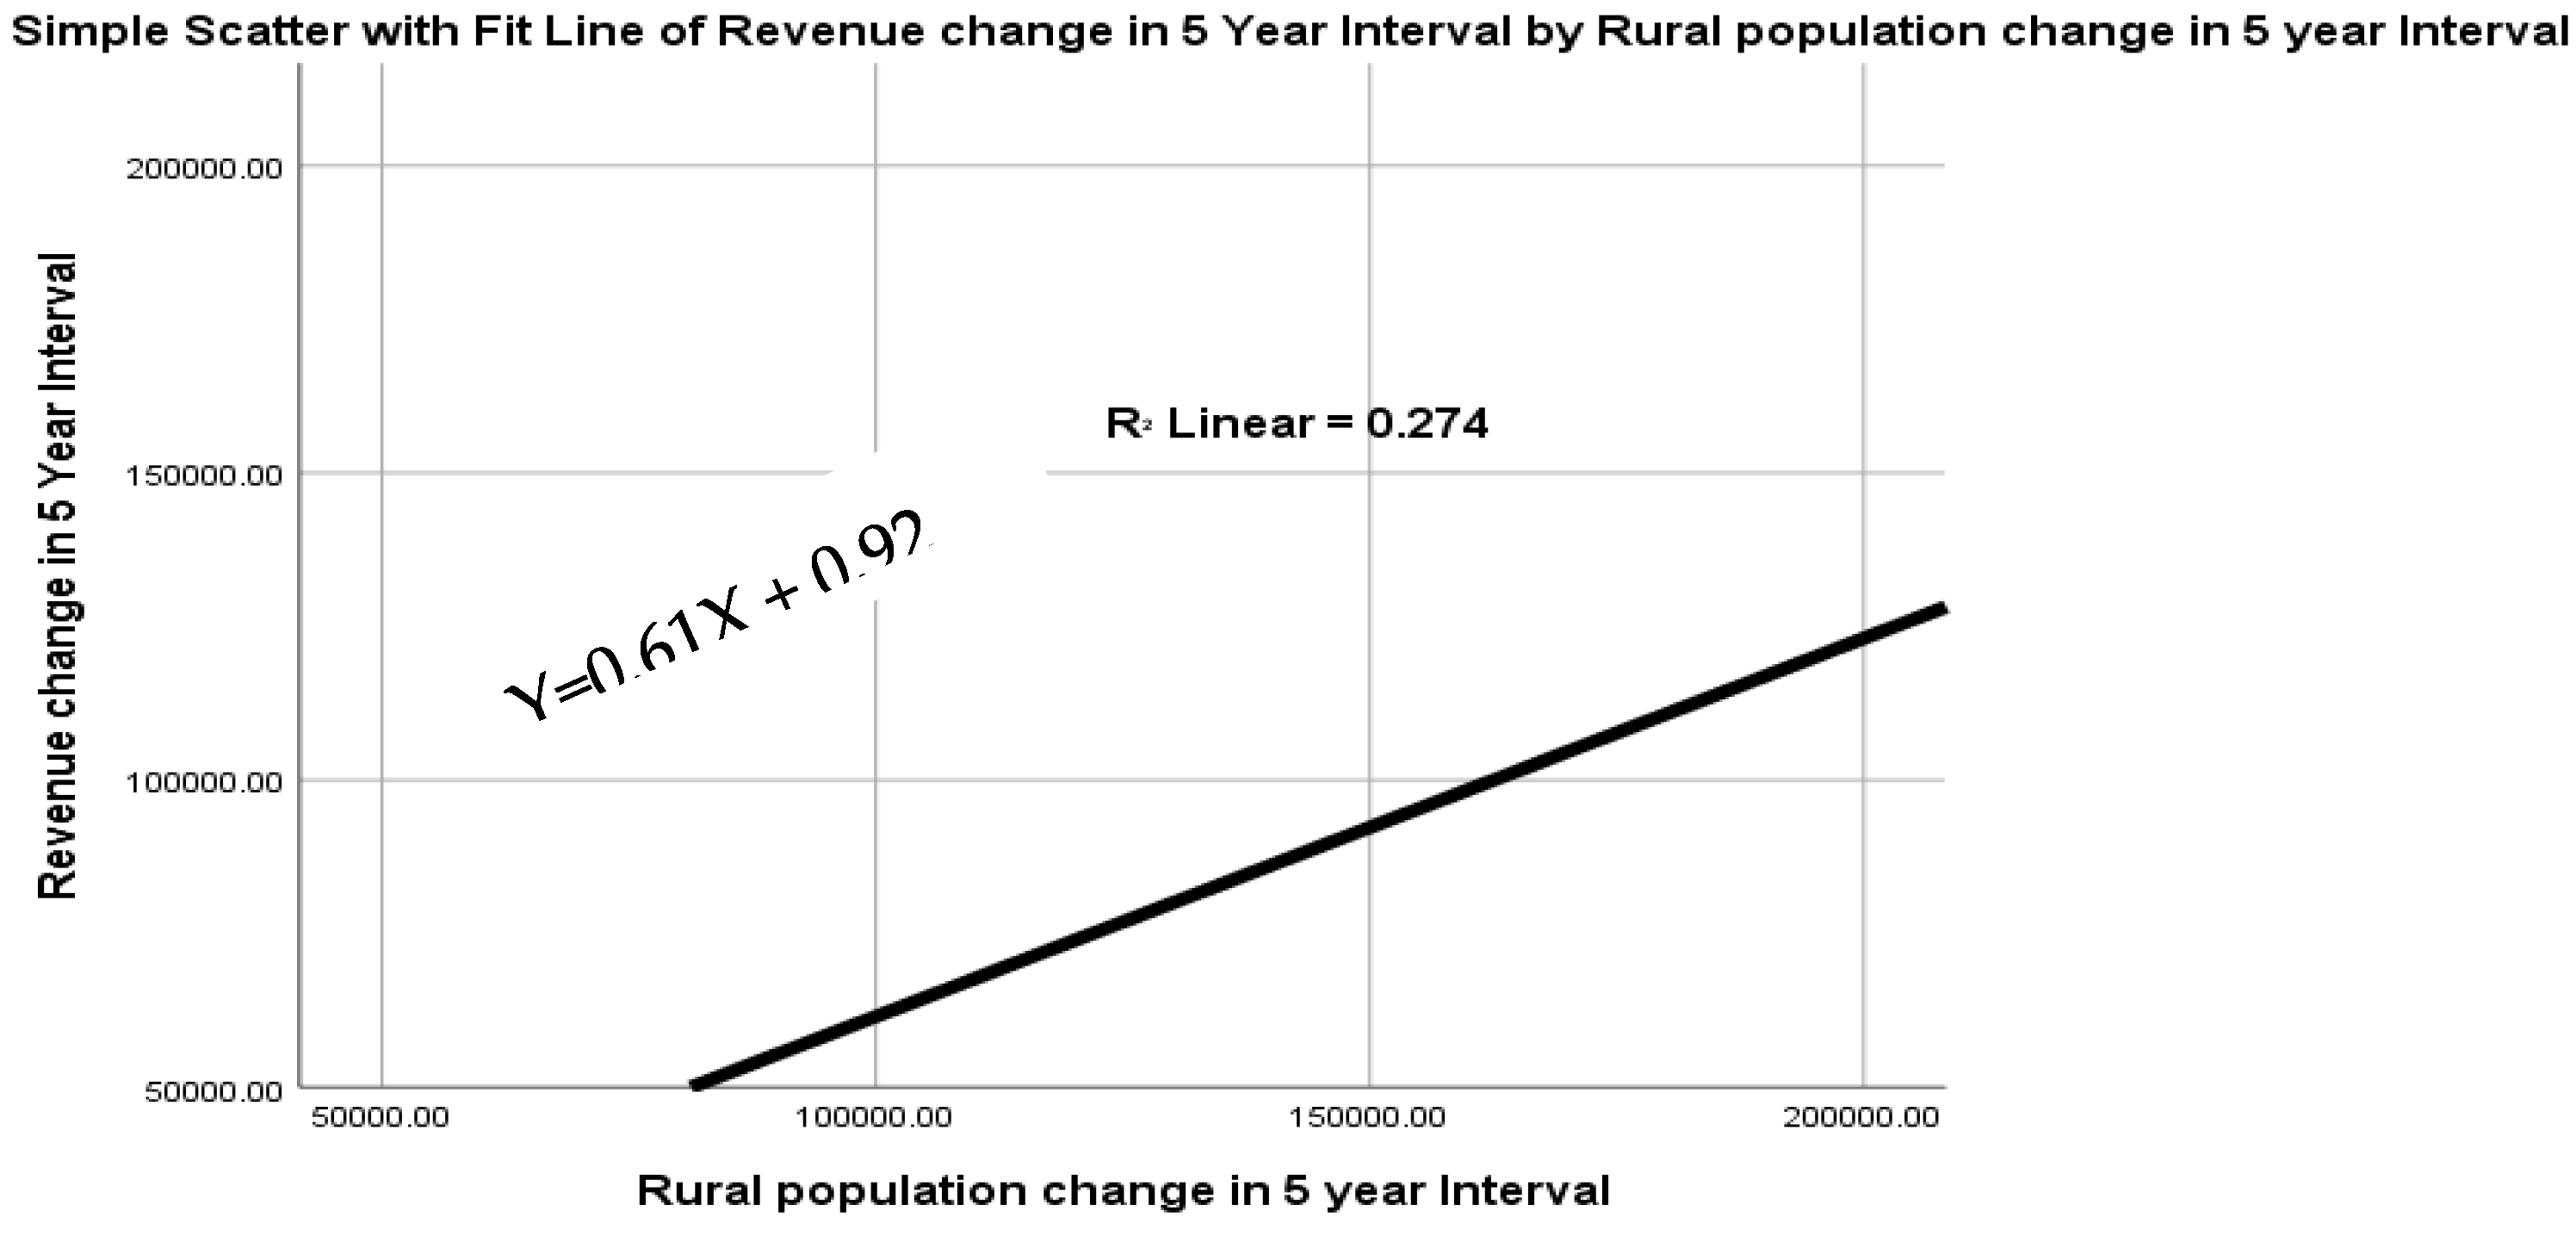
Figure 2 shows the relationship of revenue with rural population having a positive relationship, as the revenue of the city increases, the rural population increases by 27.4%, which implies that the revenue contributes to the growth of job opportunity in the city, and, respectively, the rural population (peri-urban settlements) increases consistently.
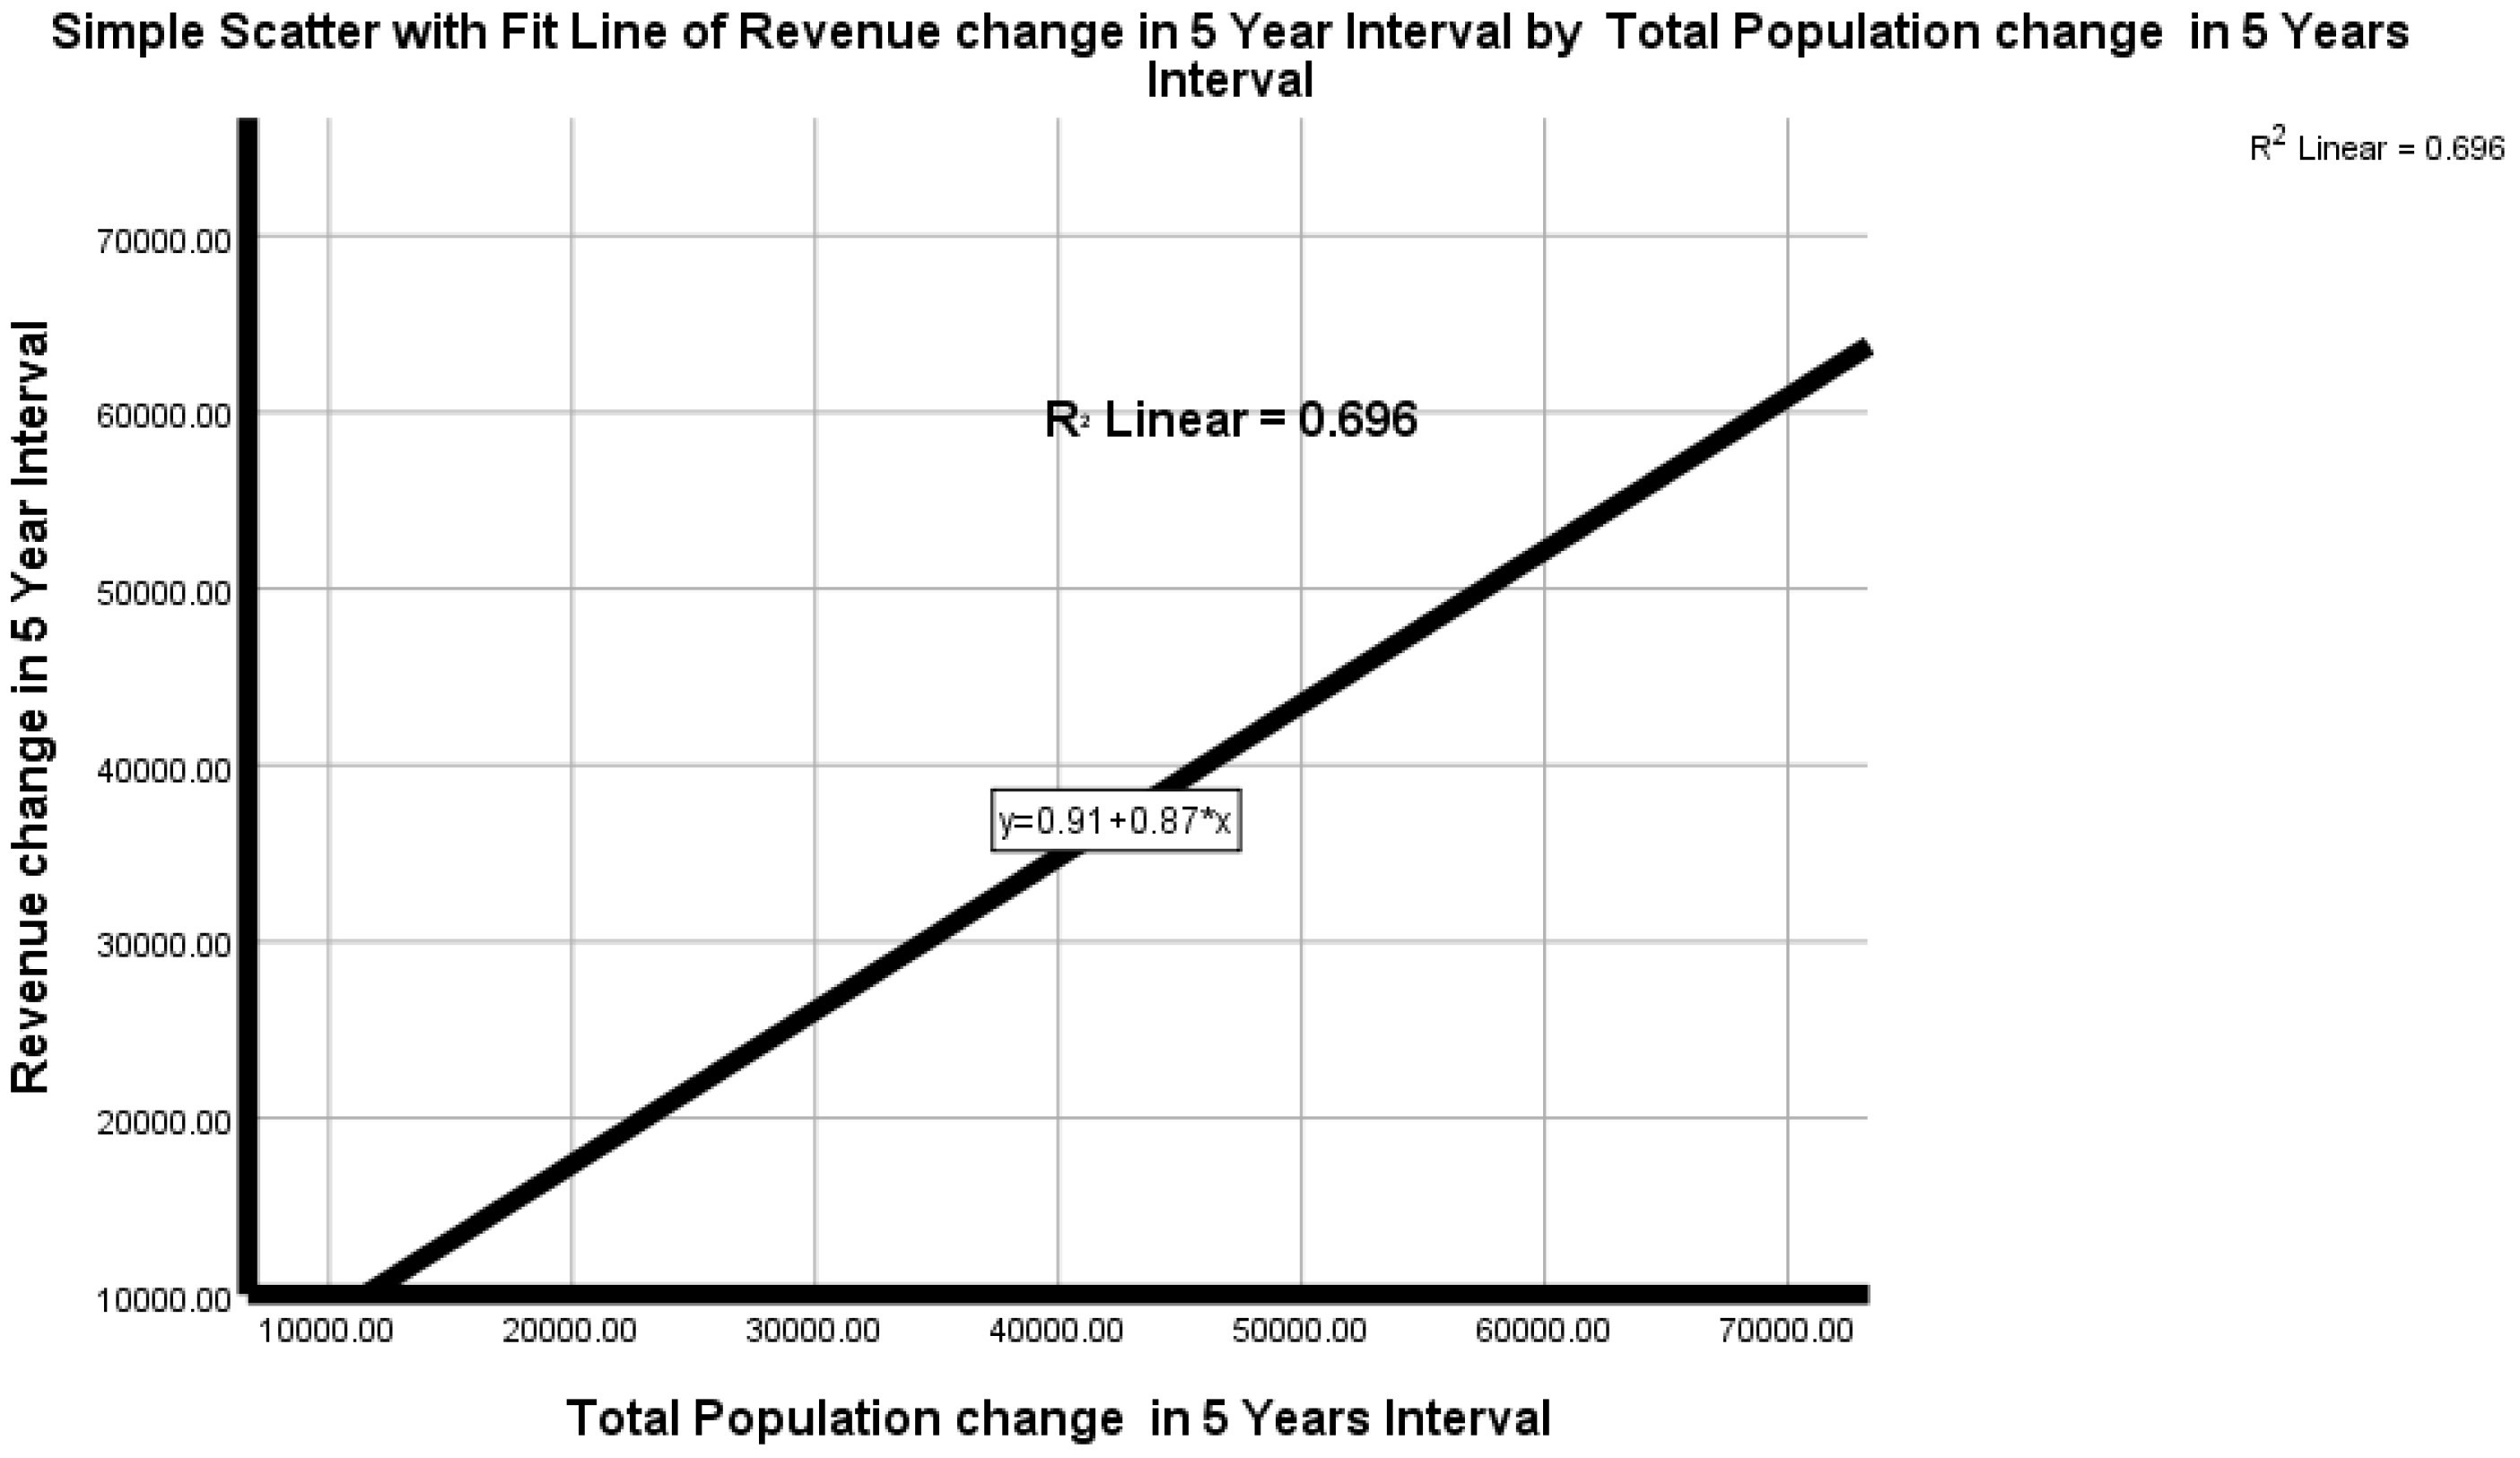
Figure 3 shows the relationship between revenue and demographic change, as the figure shows revenue and demographic change have a positive relationship, as revenue increases, the population increases by 69.6%. The computed data shows in
Figure 3 the positive relationship between revenue and demographic change, which has significant implications for the spatial change of Hawassa city. Furthermore, as the revenue of the city increases, the migration and fertility of the city have increased.
In
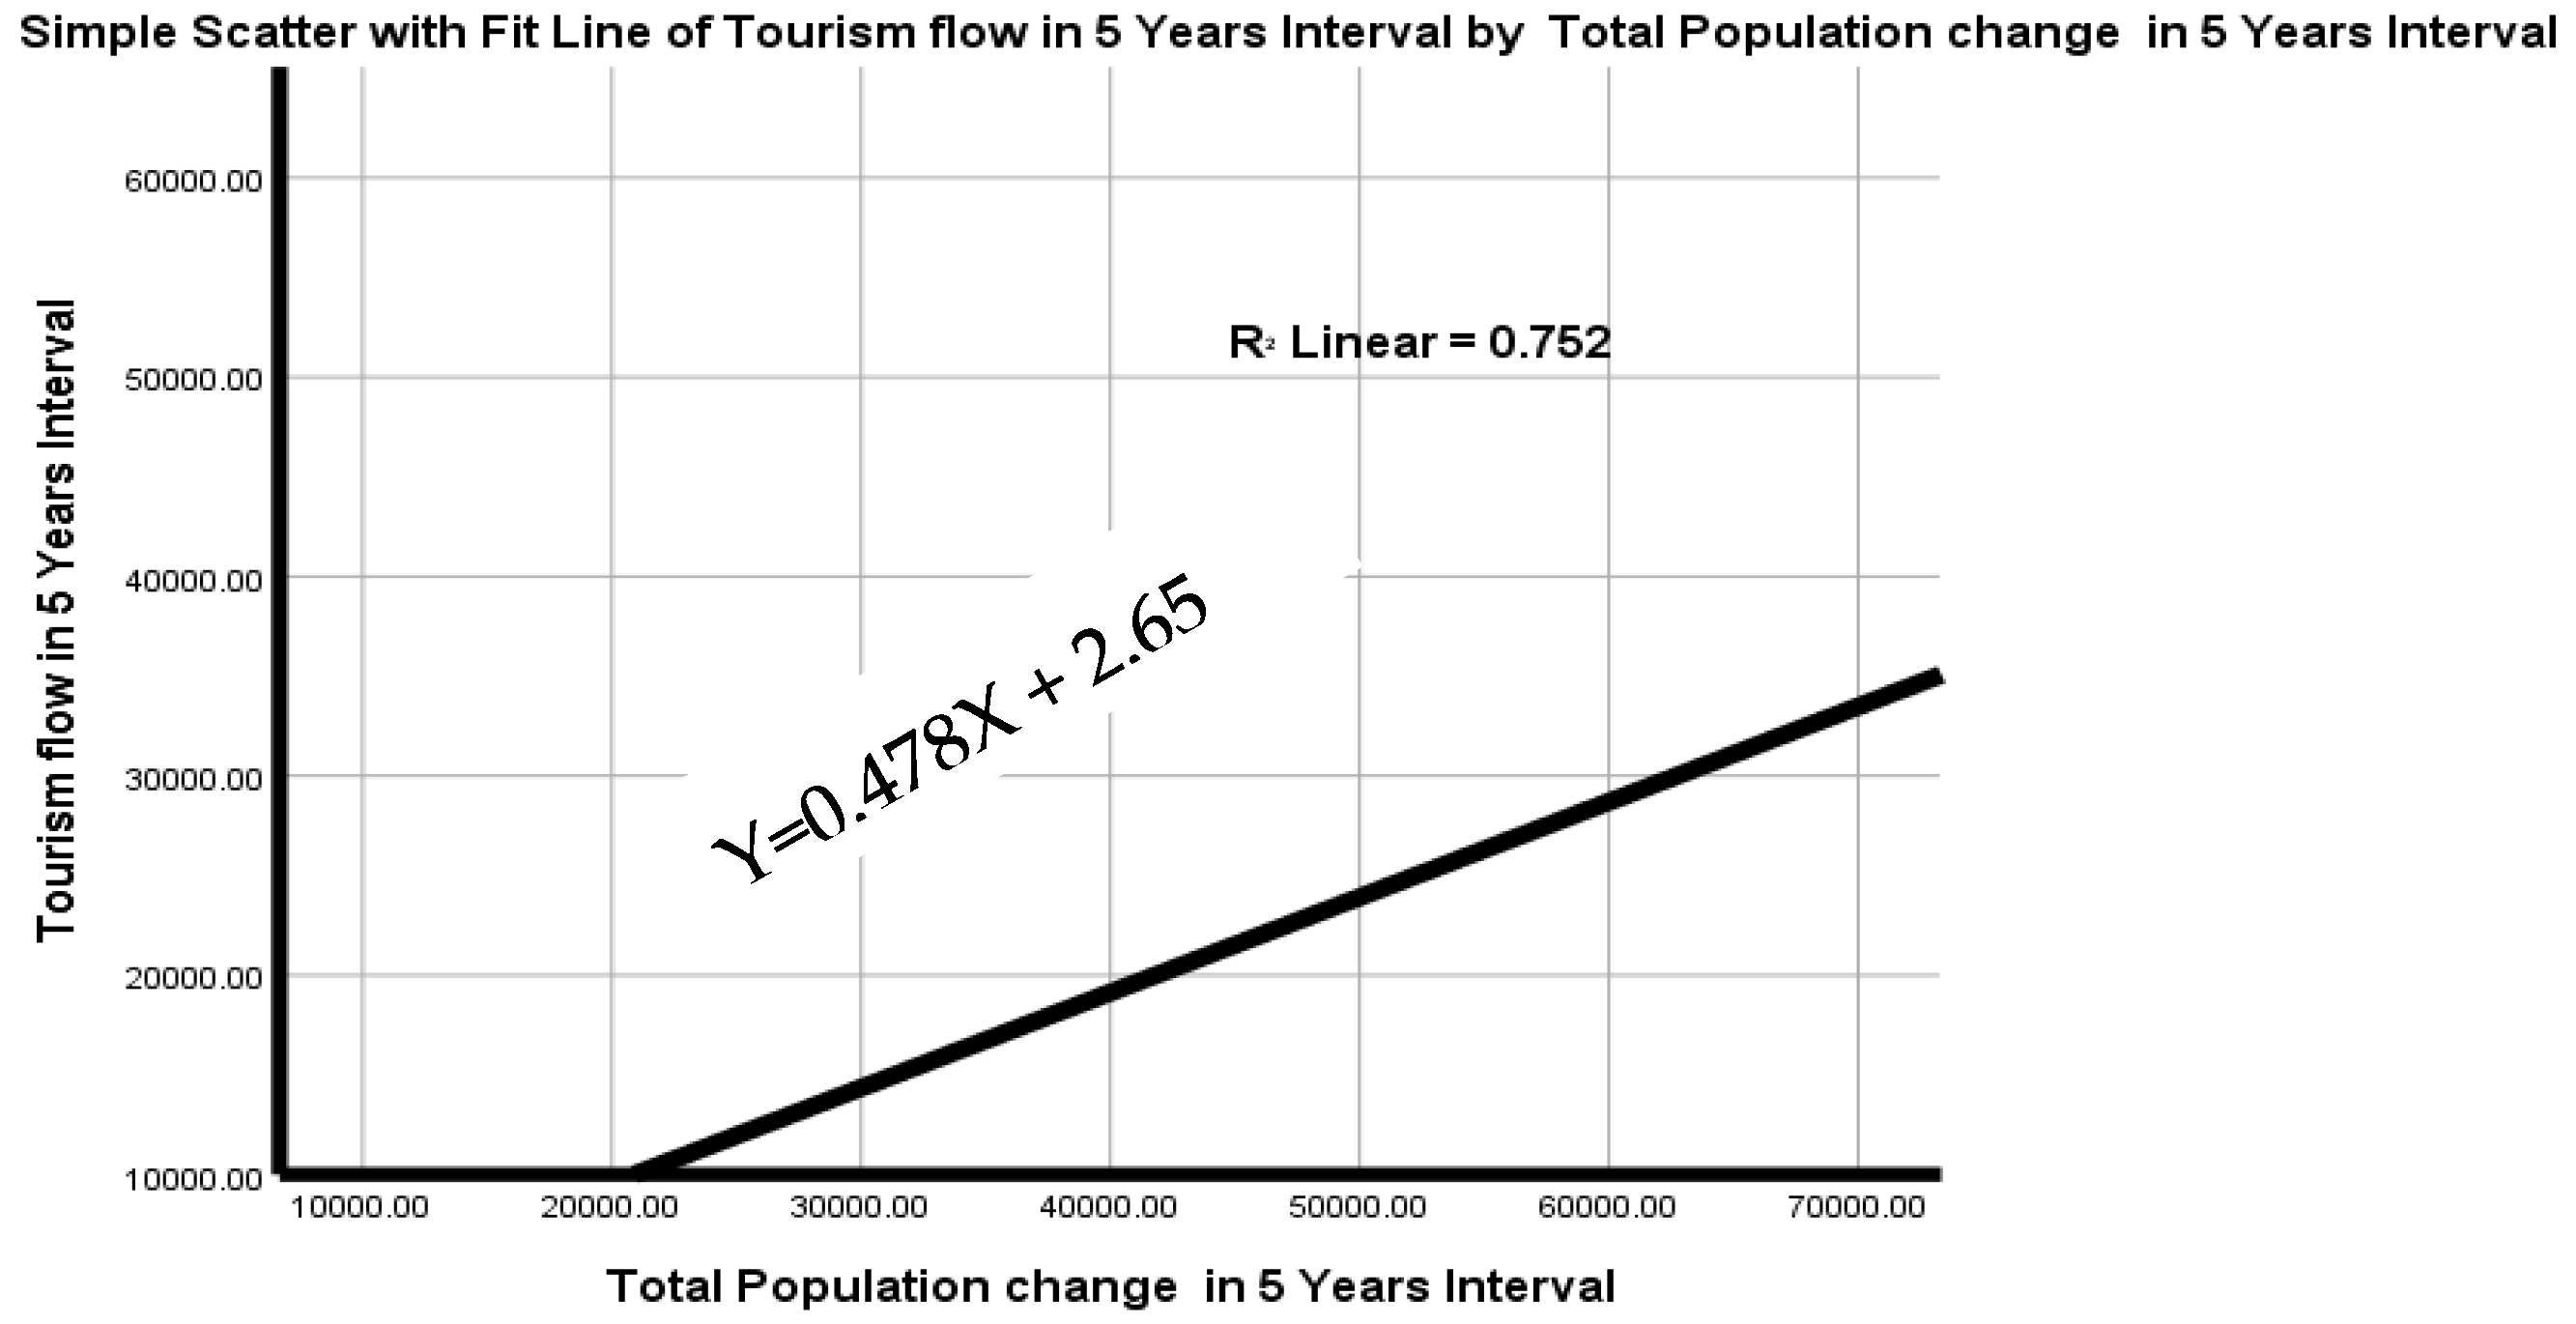
Figure 4, the total demographic change and tourism flow have a positive relationship, as the figure shows tourism flow increases the total demographic change of Hawassa by 75.2%. As a result, the job opportunity attracts inhabitants to the city with the highest rate, and consecutively the business firm’s educational institutions (colleges and vocational training centers) attract from nearby urban and rural settlements.
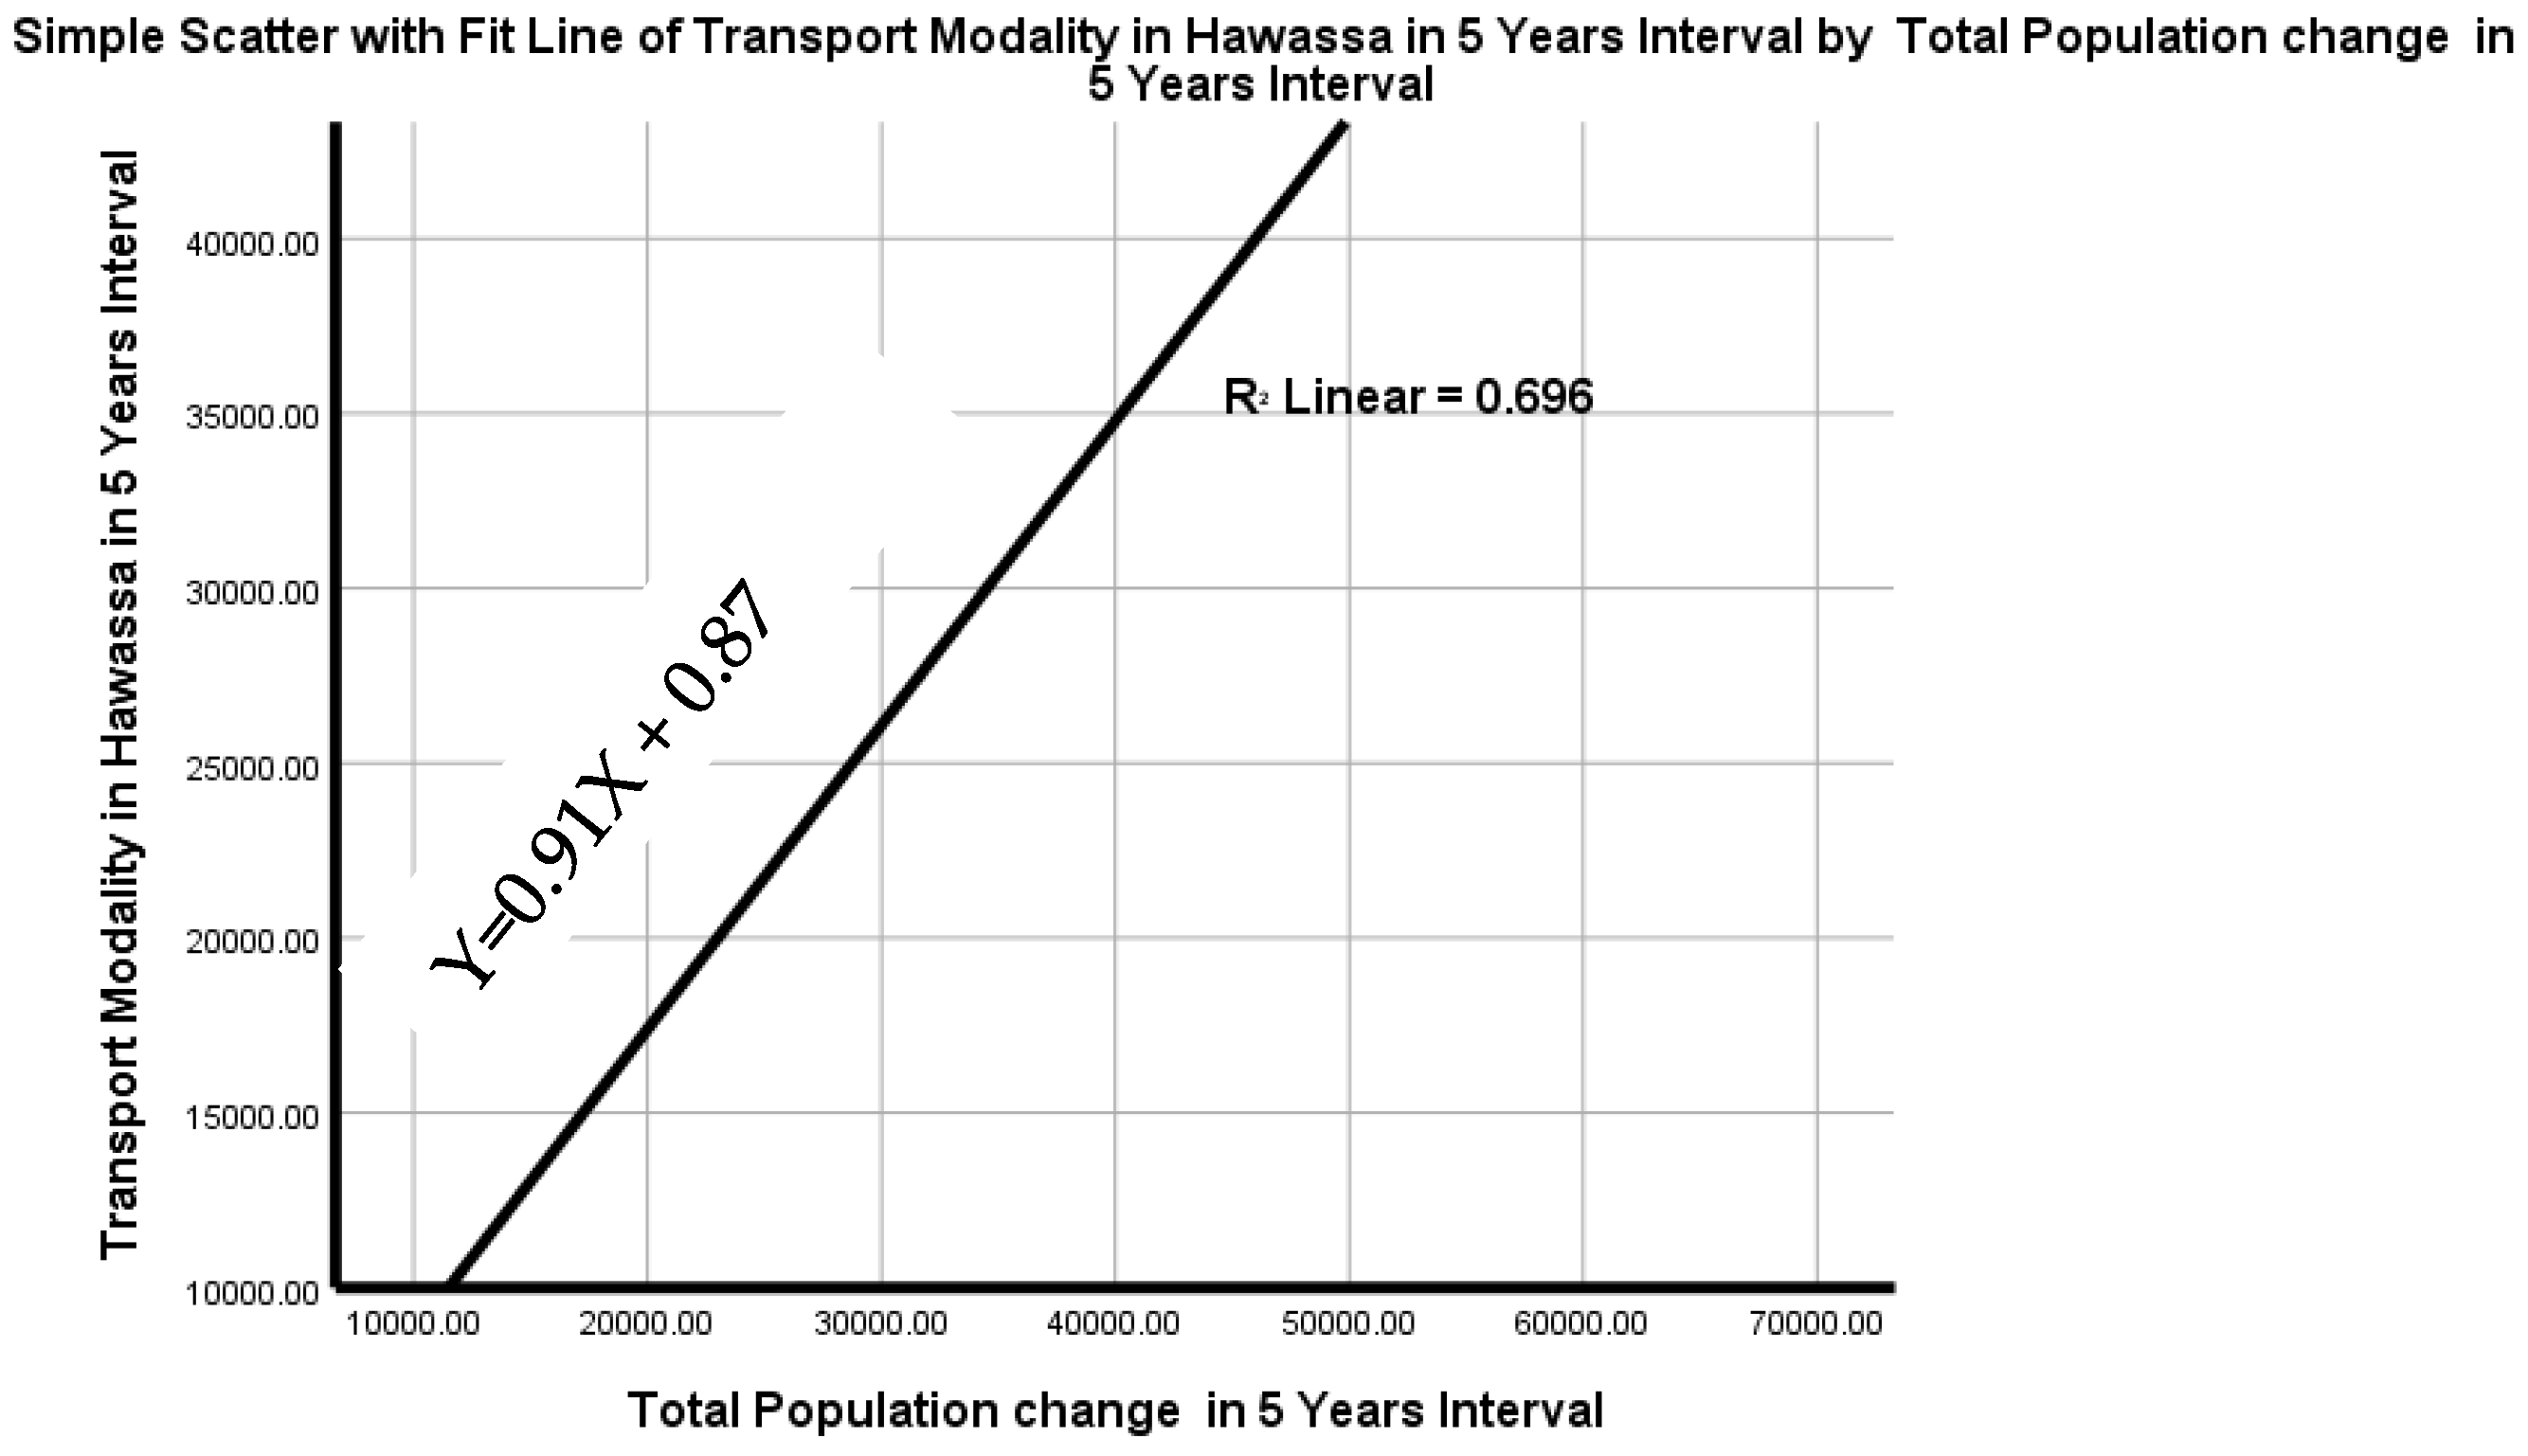
Figure 5 shows the relationship of population increase and transport modality, as the figure shows population and transportation modality have a positive relationship; as the population increases, the transportation modality increases by 69.6%.
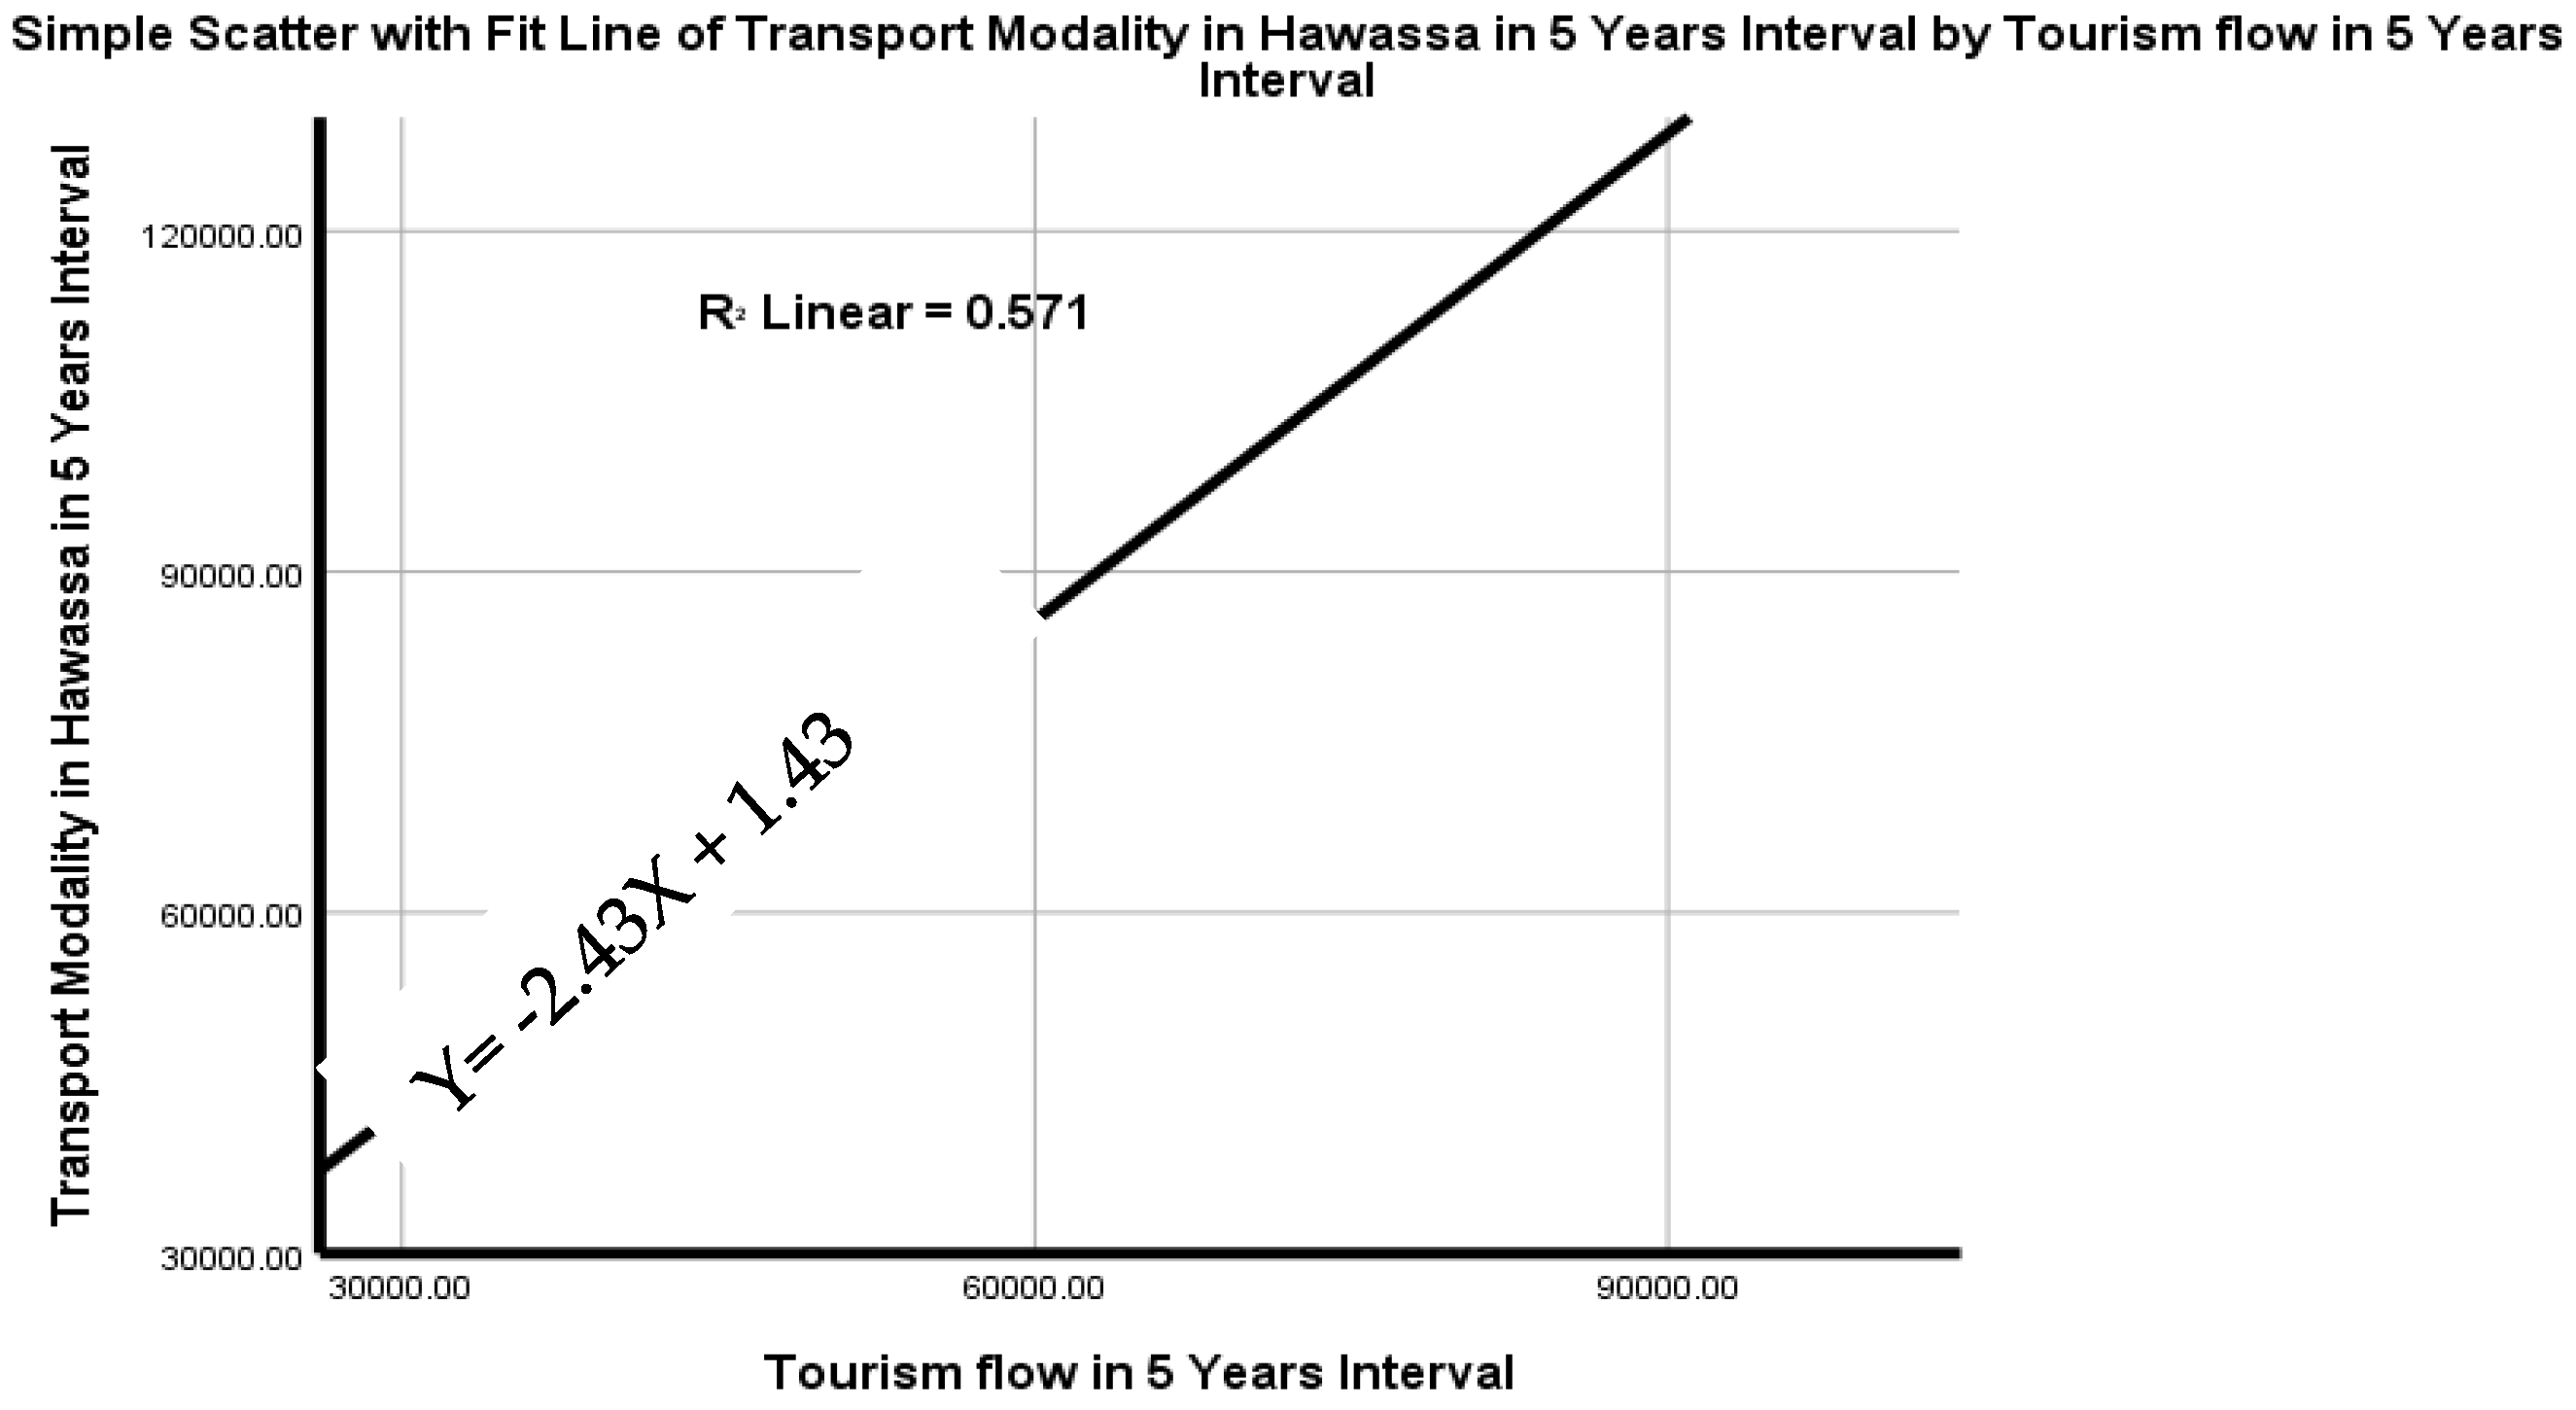
Figure 6 shows the relationship of tourism flow with transportation modality choice, as the figure shows the tourism flow and transportation flow have a positive relationship as tourism flow increases, transportation modality choice increases by 57.1%.
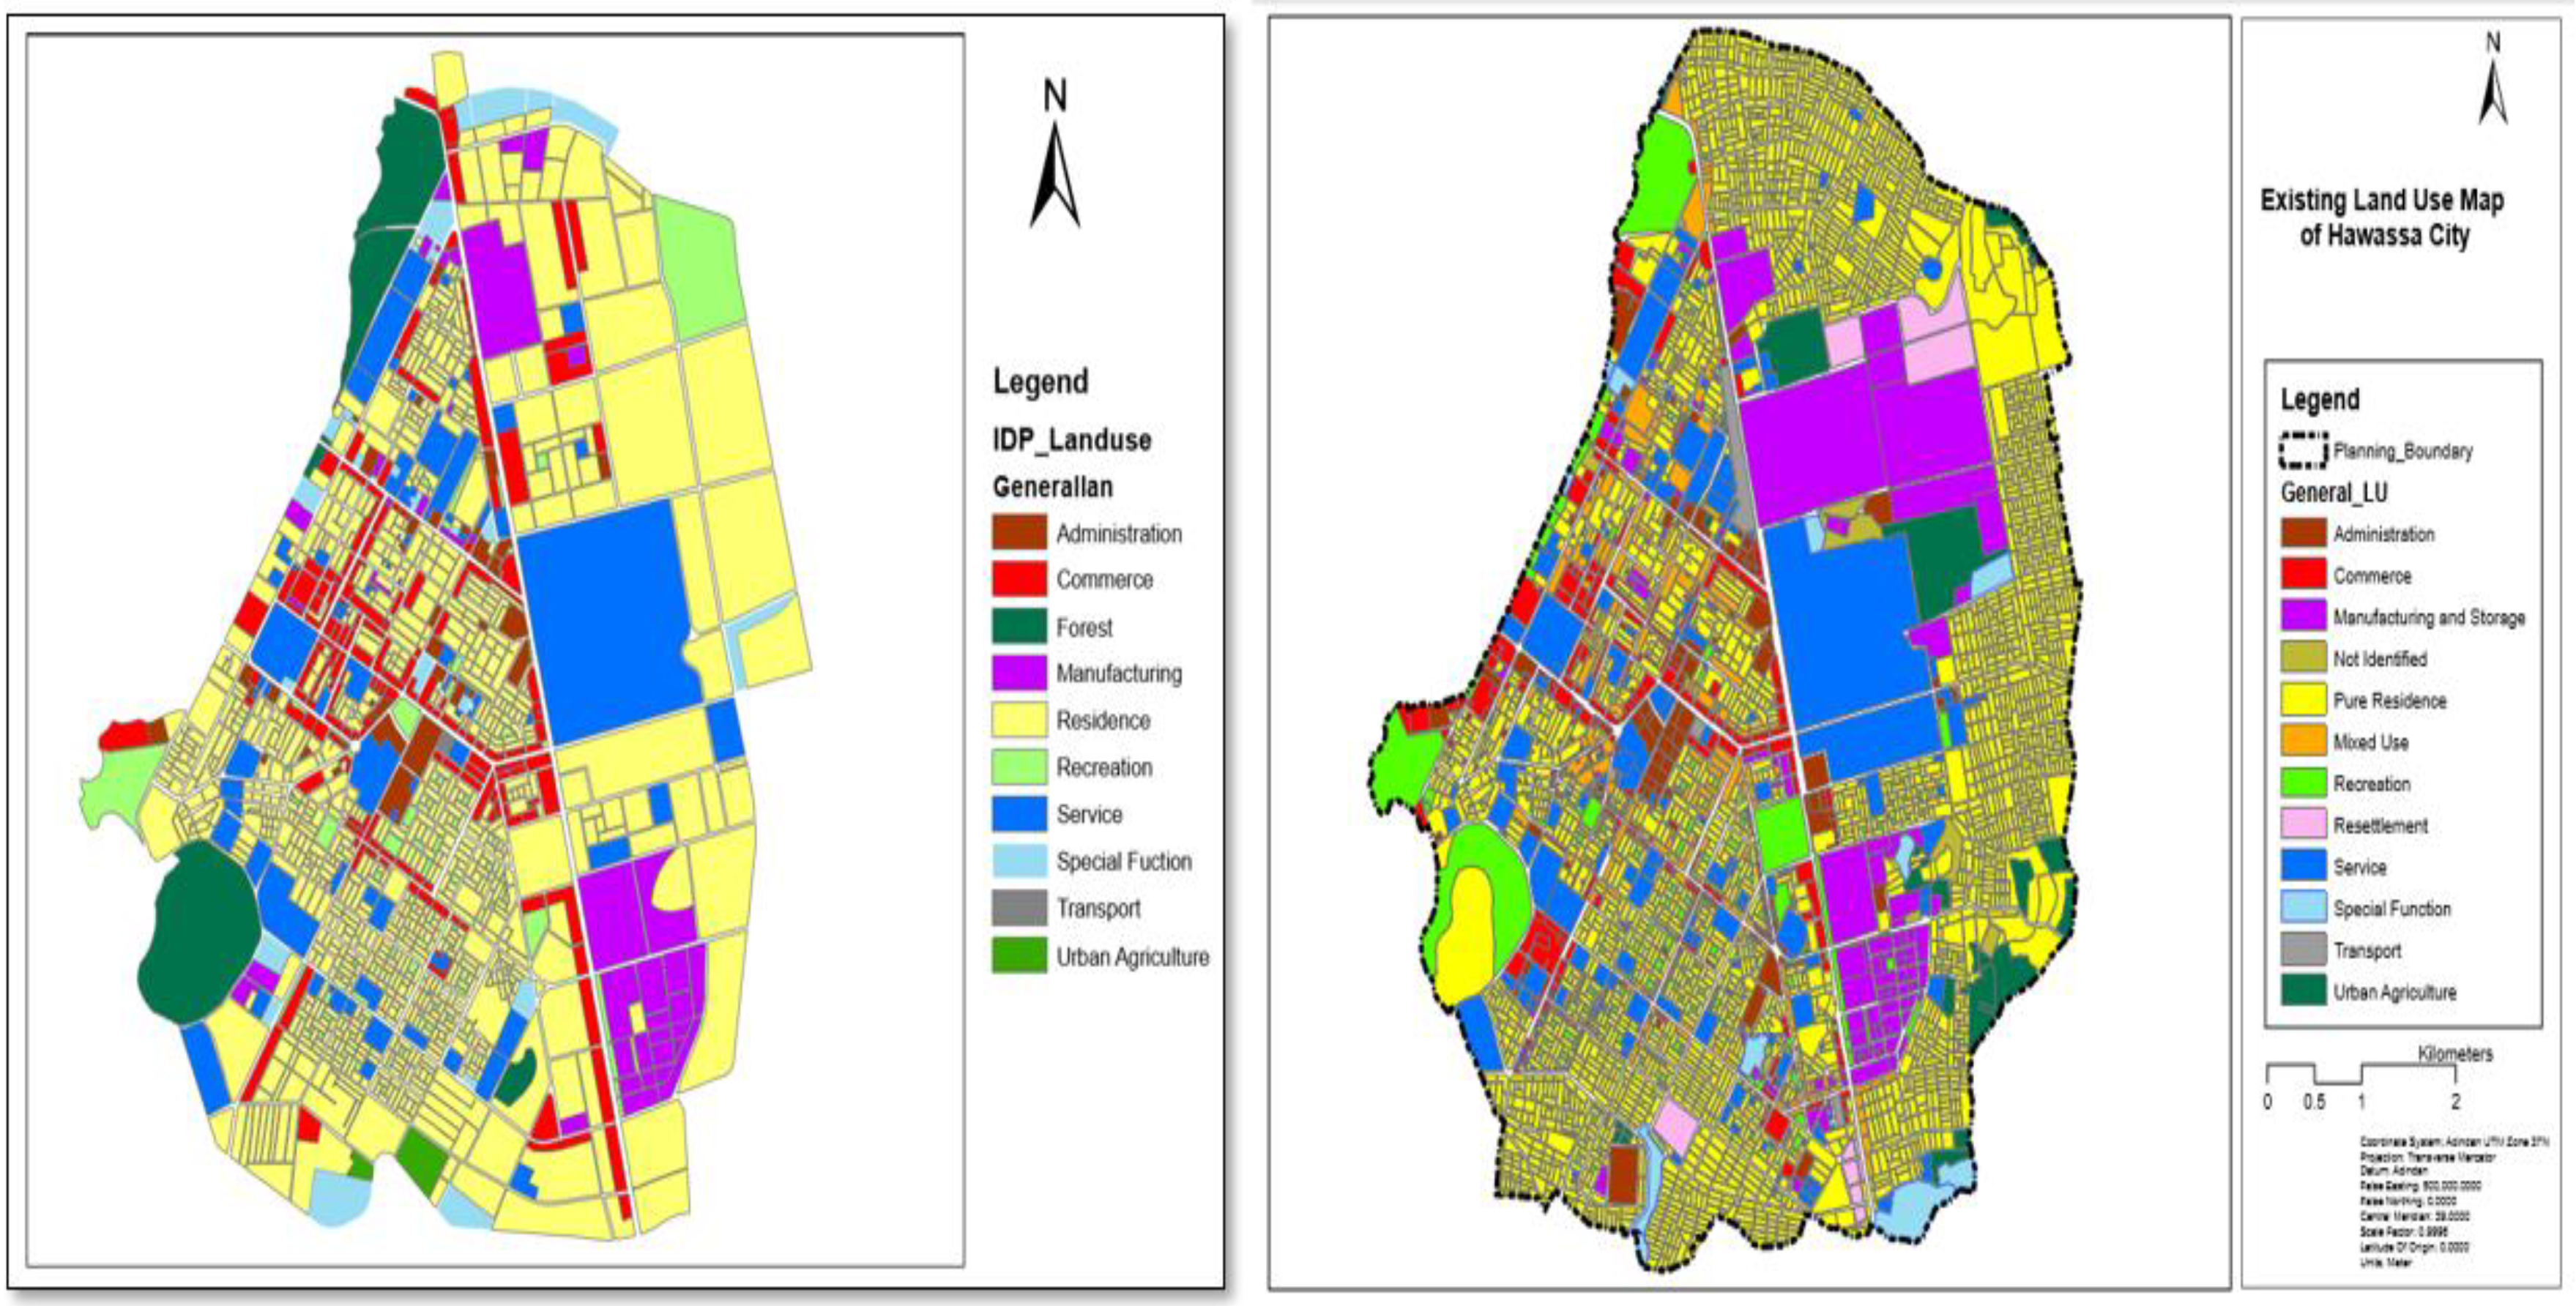
2.3.1. Changes in Land Use and Accessibility in Hawassa
High-level service land use by itself has the potential to attract more inhabitants, as shown in
Figure 9, the more proximity to high-level service The tendency of spontaneous land use change from pure commercial to mixed use can be observed in settlements around Hawassa referral hospitals, such as hospitals, educational institutions, public spaces, and nodal points, which directly influences the accessibility of the locations, and the reverse is also true. Based on field survey results shown in
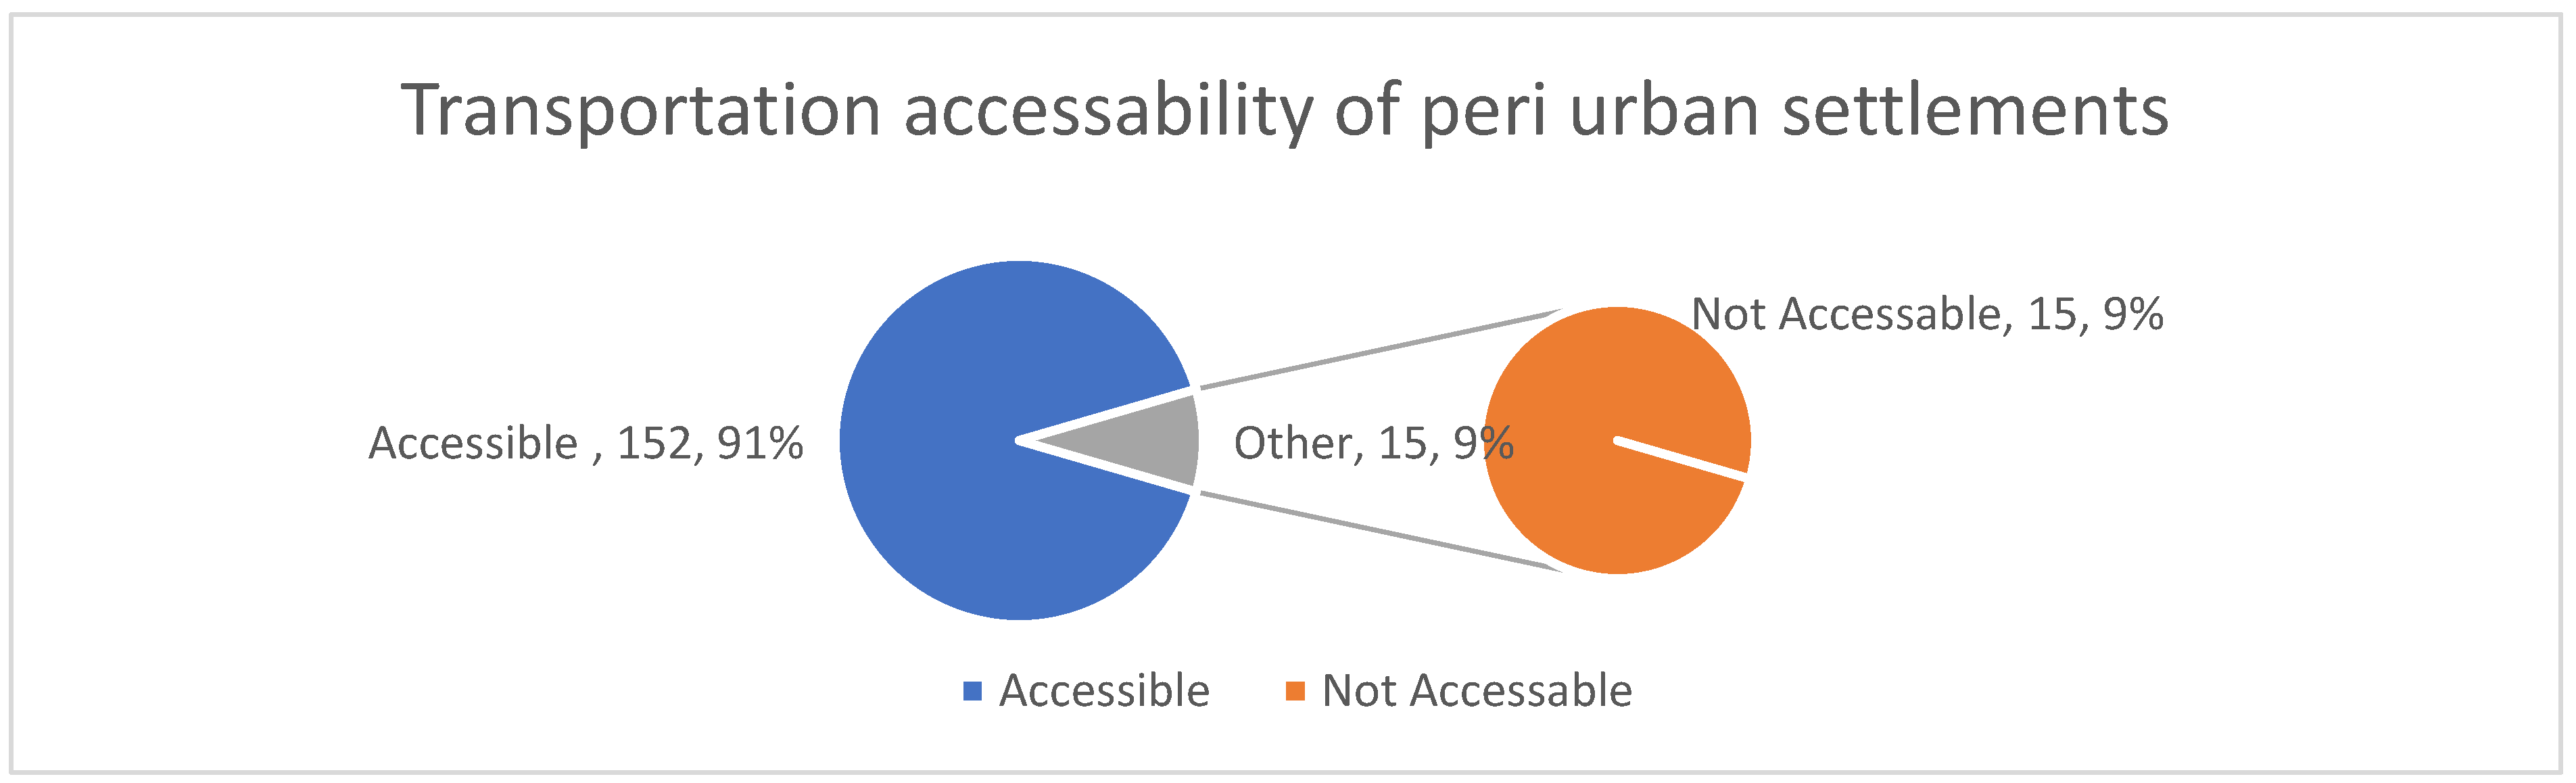
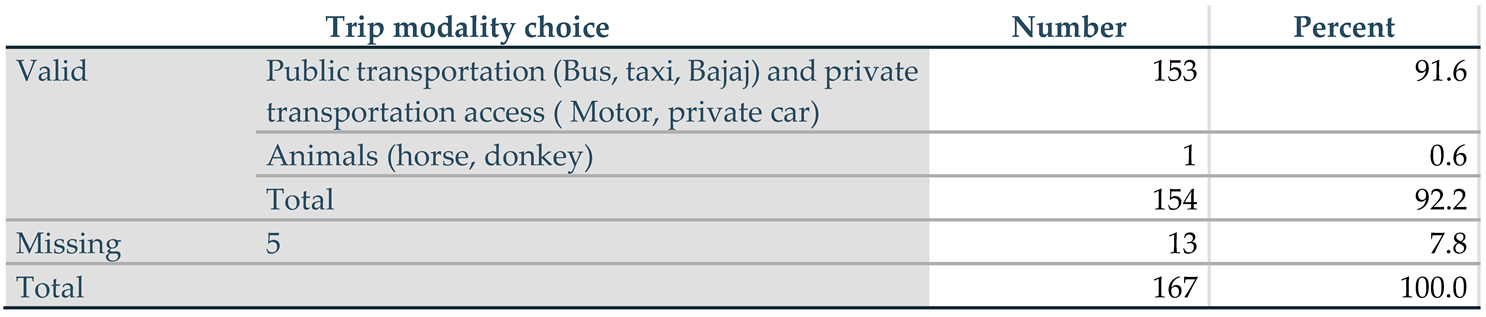
Table 2 and
Figure 7, modality choice and accessibility in emerging informal settlements are 91.6% and 90%, respectively, which have significant implications for land use change. As the land use change occurs on previously emerged settlements, as shown in
Figure 2 and
Figure 3, the transformation of agricultural lands to residential plots in emerging informal settlements realizes, and horizontal growth of Hawassa city takes place.
As shown in
Figure 8a,b, in the past ten years, agricultural lands in the fringe area of the city shifted to residential and commercial uses due to the demographic shift of Hawassa city since the emergence of Hawassa industrial parks and the development and social service potential of the city. As the previous spatial data report (before 10 years), the planning area of the city was 80 hectares; hence, the recent spatial report (spatial data report 2024) shows the planning area of the city is 192 hectares, which shows more than double the total area of the city as compared to the past decades.
As shown in
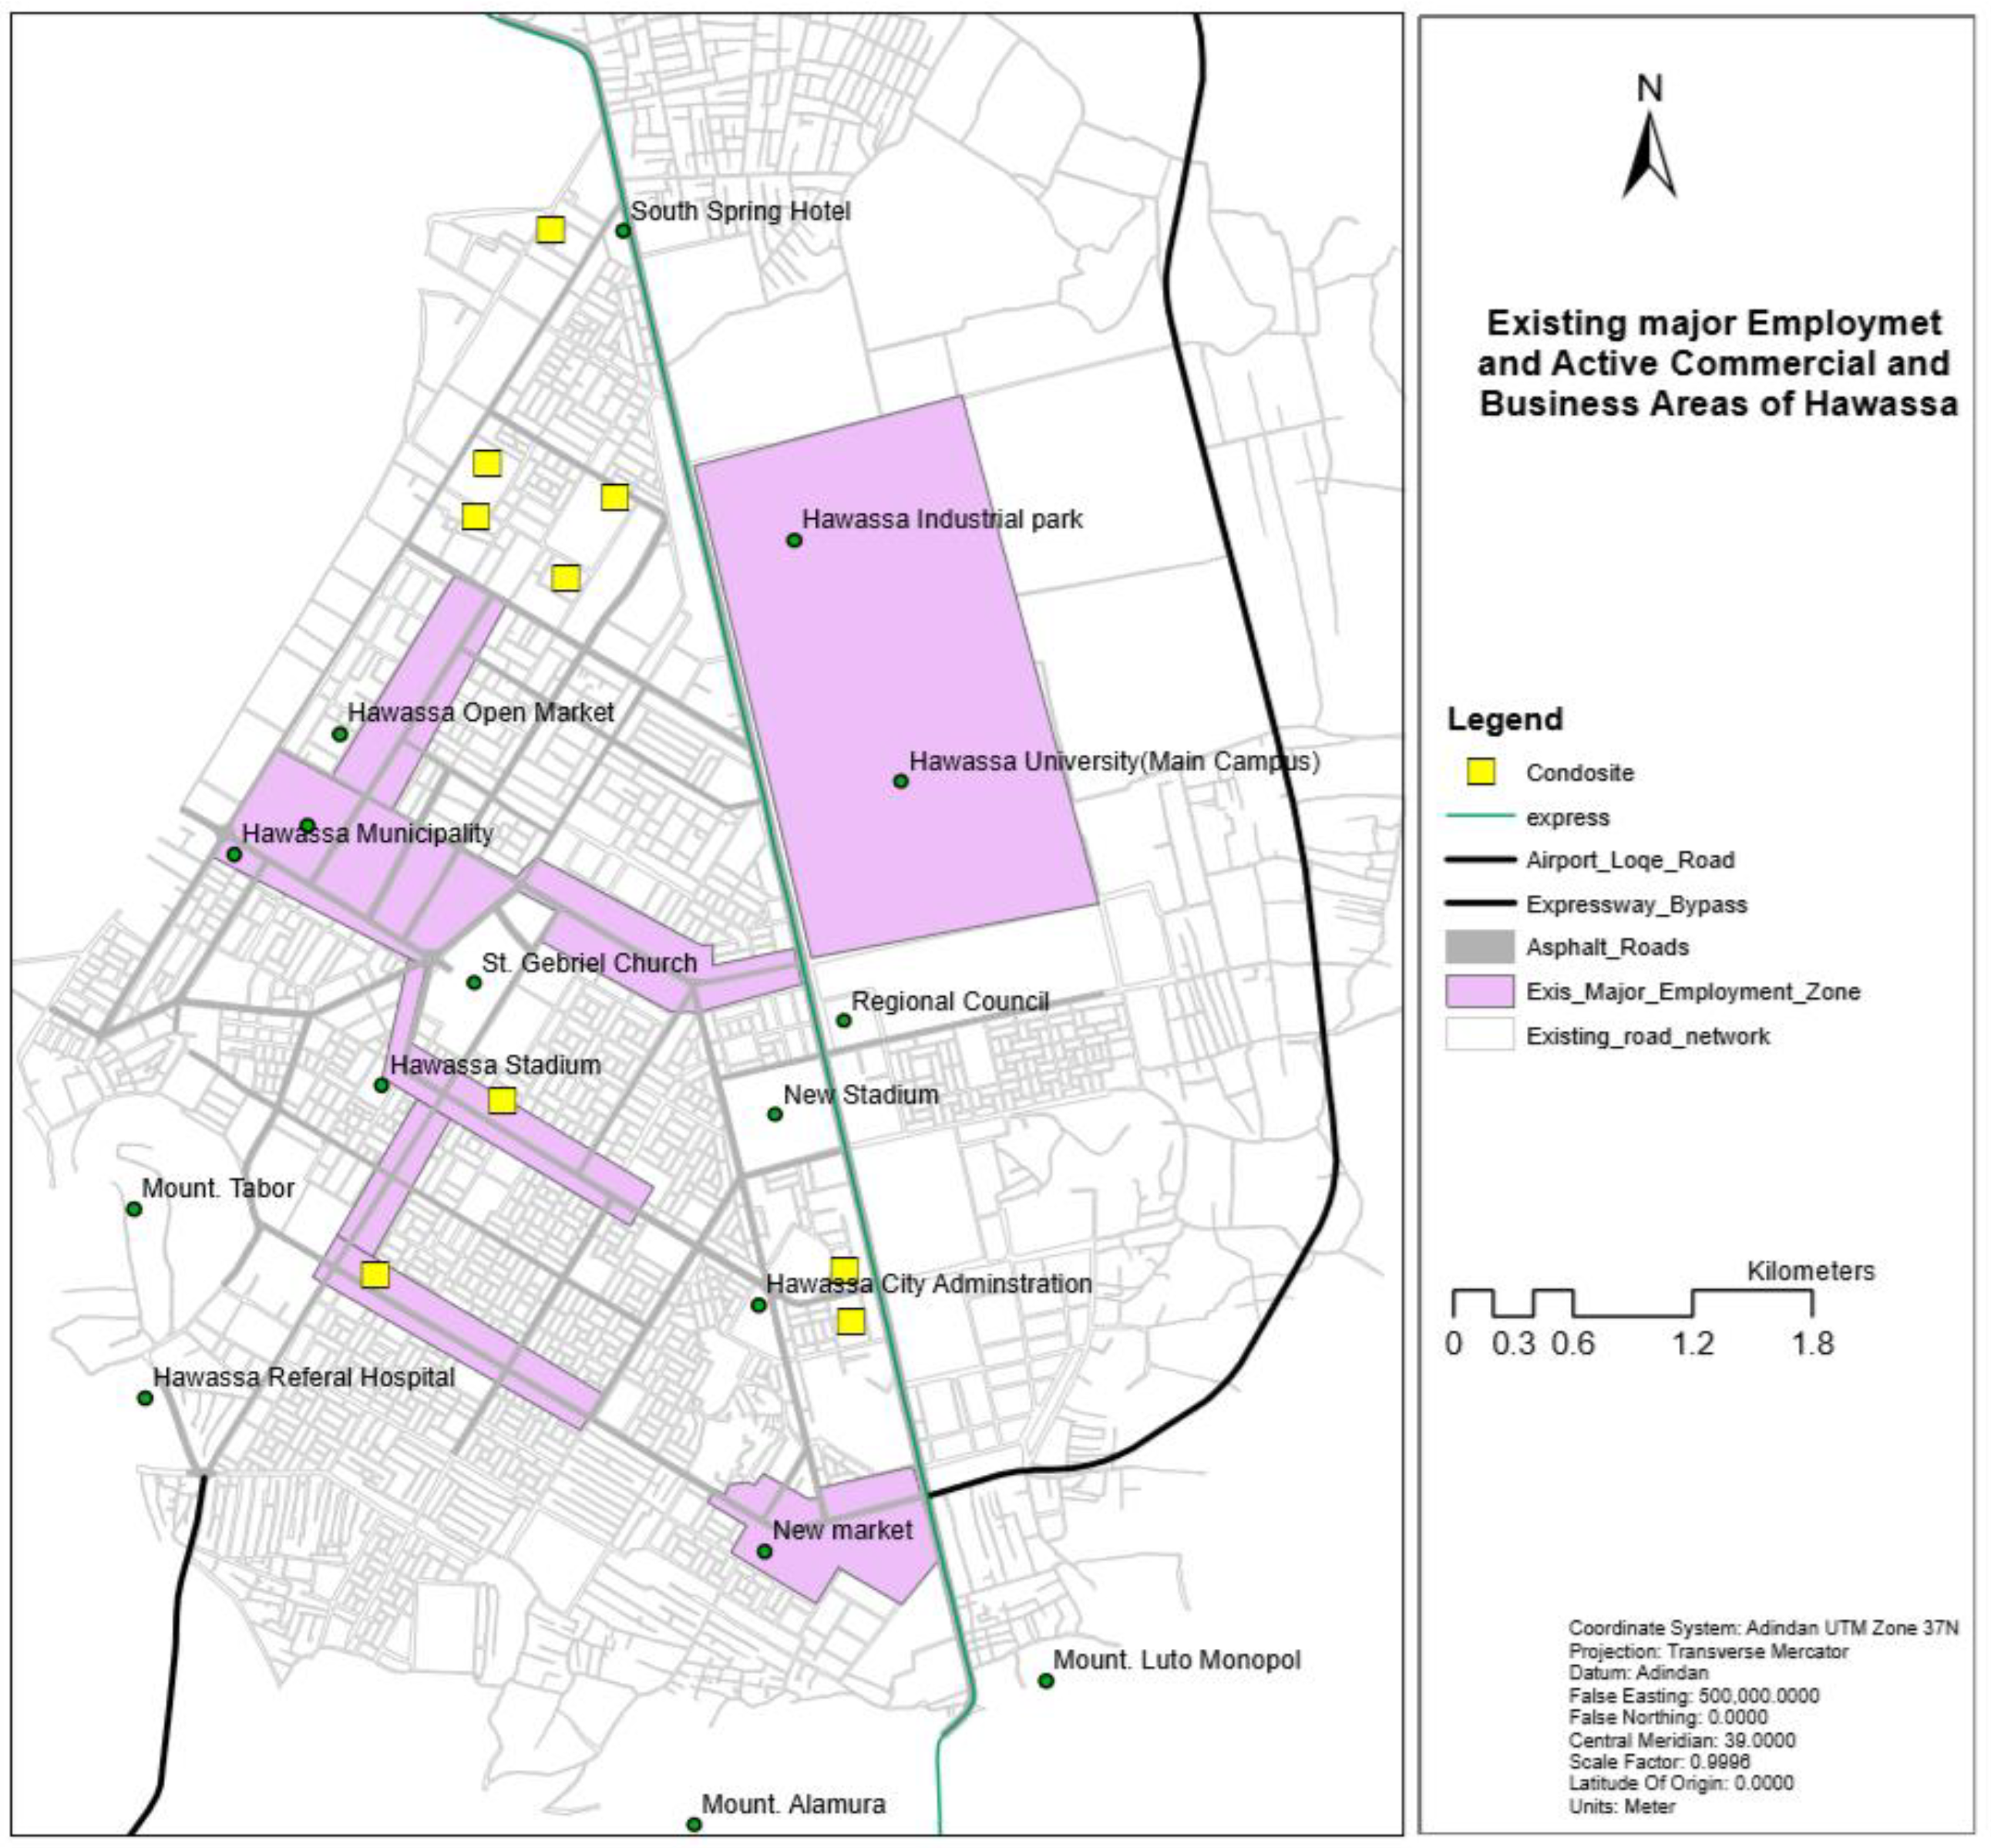
Figure 8 and
Figure 9, major employment and active commercial areas in previously emerged settlements cause spontaneous land use change from pure residential to mixed-use and commercial that have spillover effects on the urban sprawl and land use change of emerging informal settlements.
Figure 9.
Major employment and active commercial and business area. Source: Hawassa city Administration Urban Plan Department 2023 (modified by Researcher).
Figure 9.
Major employment and active commercial and business area. Source: Hawassa city Administration Urban Plan Department 2023 (modified by Researcher).
As shown in
Figure 8a, Hawassa city land use before ten years became stagnant as the demographic change in the city was not dynamic; as shown in
Figure 4, the horizontal expansion of the city was stagnant. As shown in
Figure 8 and
Figure 9, the change occurs since 2005; agricultural lands in periphery settlements shifted to housing units and haphazardly became active land use change in 2023 due to demographic change dynamics in the city. As shown in
Figure 10, the demographic change in Hawassa city is becoming dynamic from time to time, which has prominent implications for spatial and spontaneous land use change.
As
Figure 10 shows, the demographic change in Hawassa city has been increasing tediously since 2005, and that has a direct impact on the availability of serviced land for residential plots in the inner city. Therefore, peri-urban settlements have been significantly influenced by the demographic change, as shown in
Figure 8a,b, where horizontal expansion takes place. In contrast, as shown in
Figure 2, the revenue change in the city attracts more inhabitants in the city that haphazardly influences the demographic change since 2005.
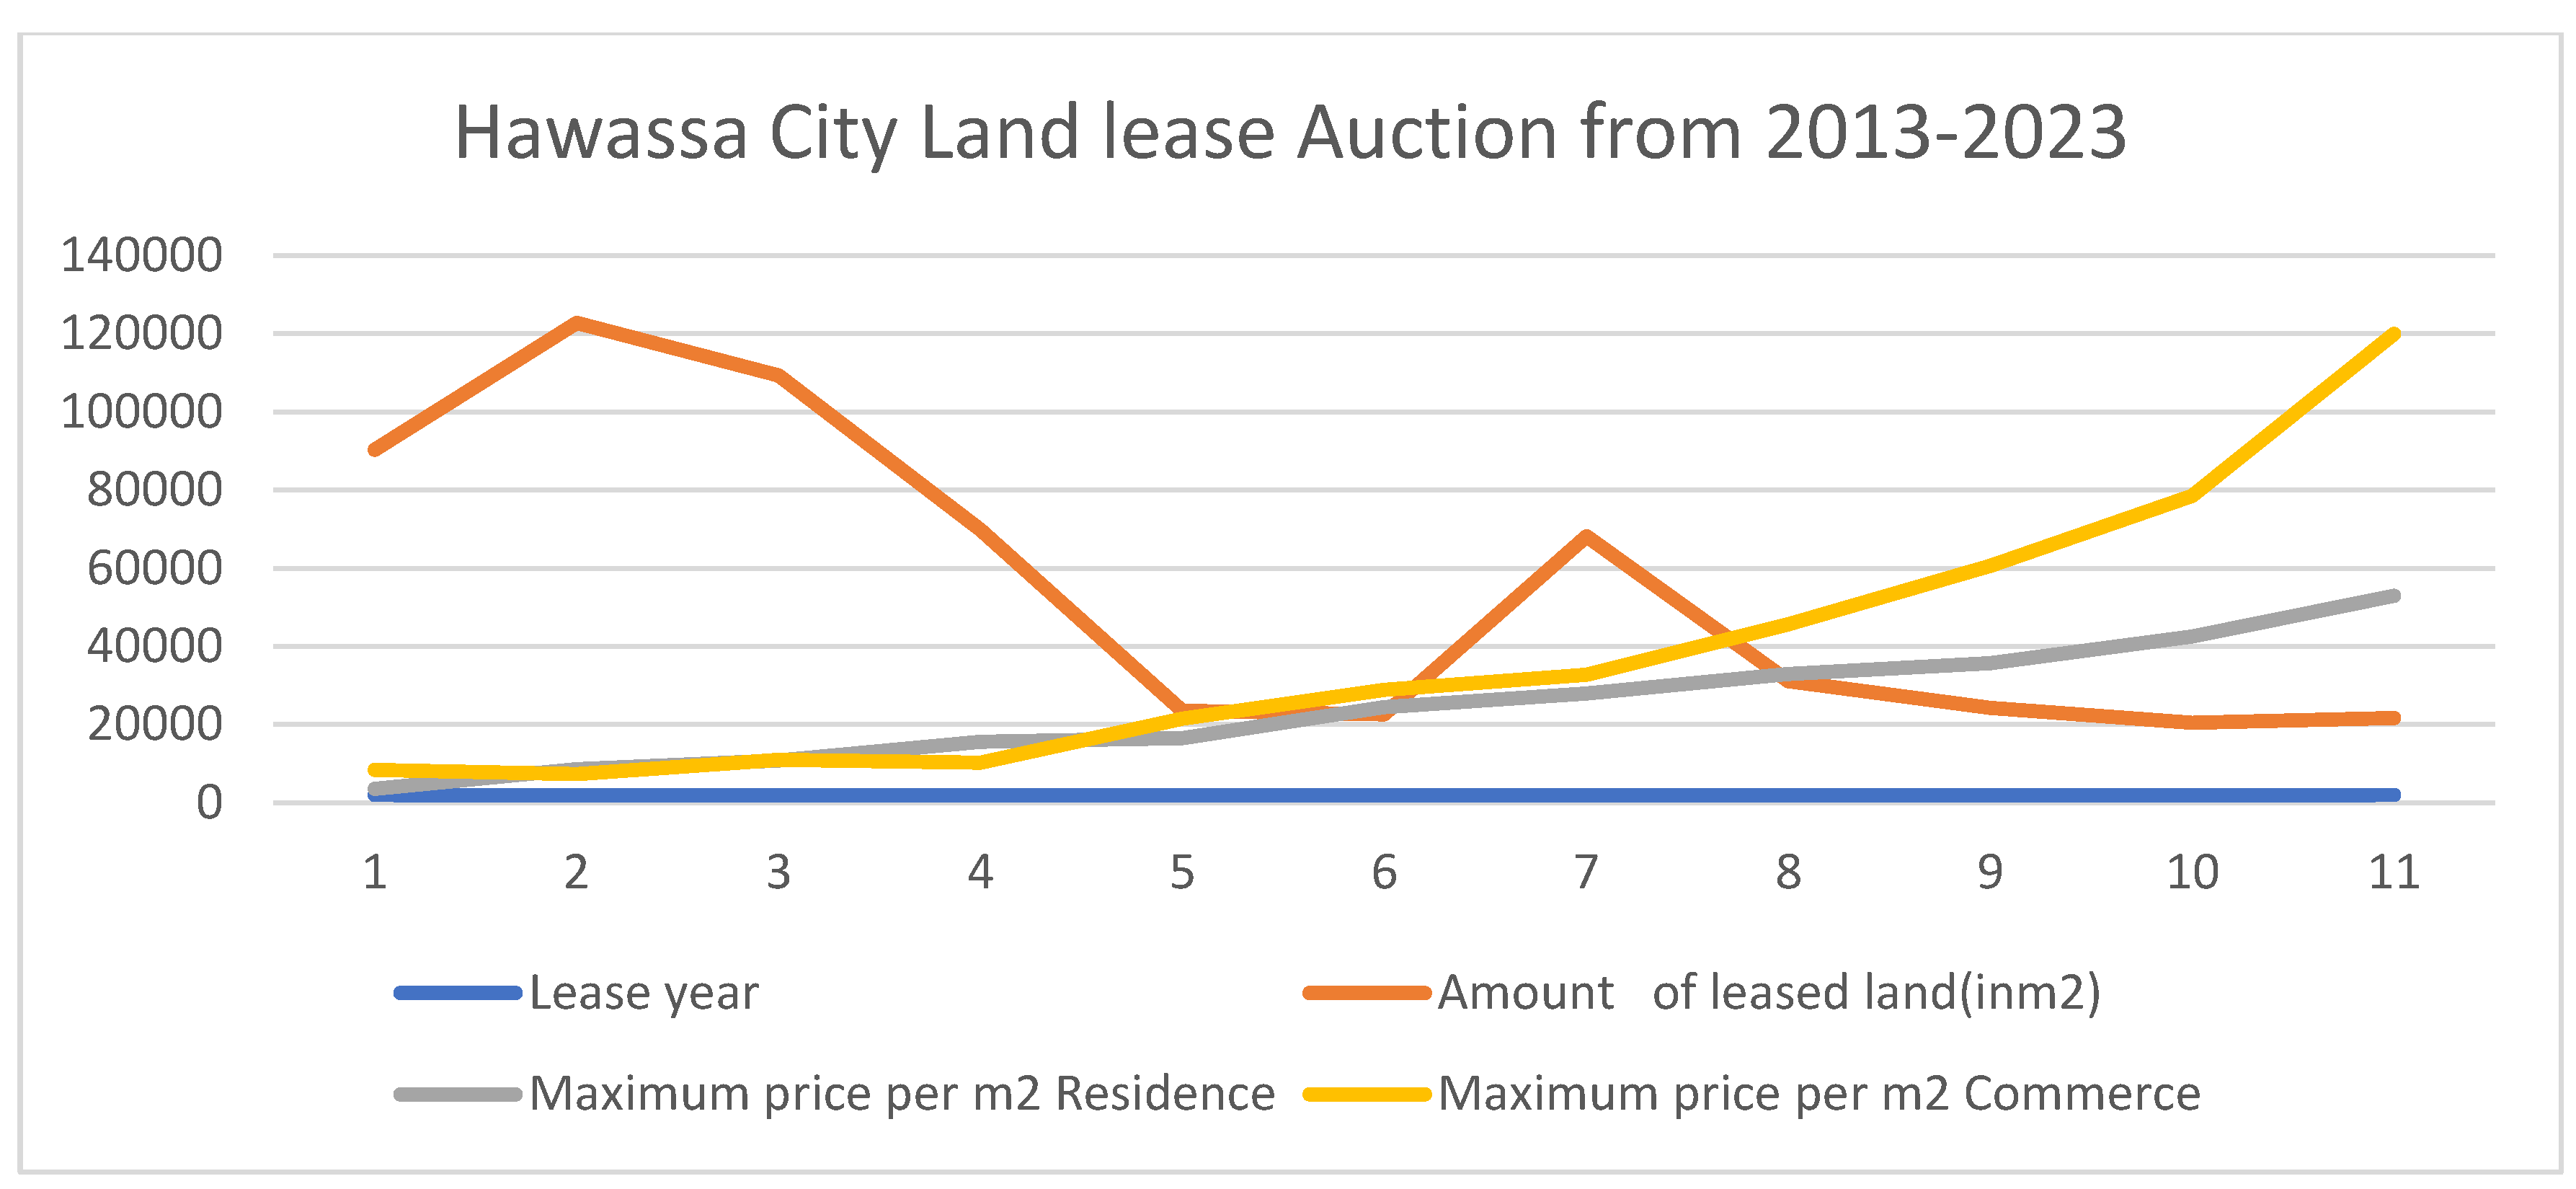
2.3.2. Land Market and Housing Provision
As shown in
Figure 12, the price of land is escalating with high dynamism, which plays a vital role in urban informal settlement growth. This shows a direct relationship between the land lease price and the emergence and expansion of informal settlements. As shown in
Figure 12, the amount of leased land for auction declined from 2013 to 2023; nevertheless, the price of auctioned land increased extraordinarily. On the other hand, based on the interview results, the price of land in the peri-urban settlements was affordable as compared to the land auction price, though the tendency of informal land transformation from agricultural lands to housing plots takes place gradually with due reasons.
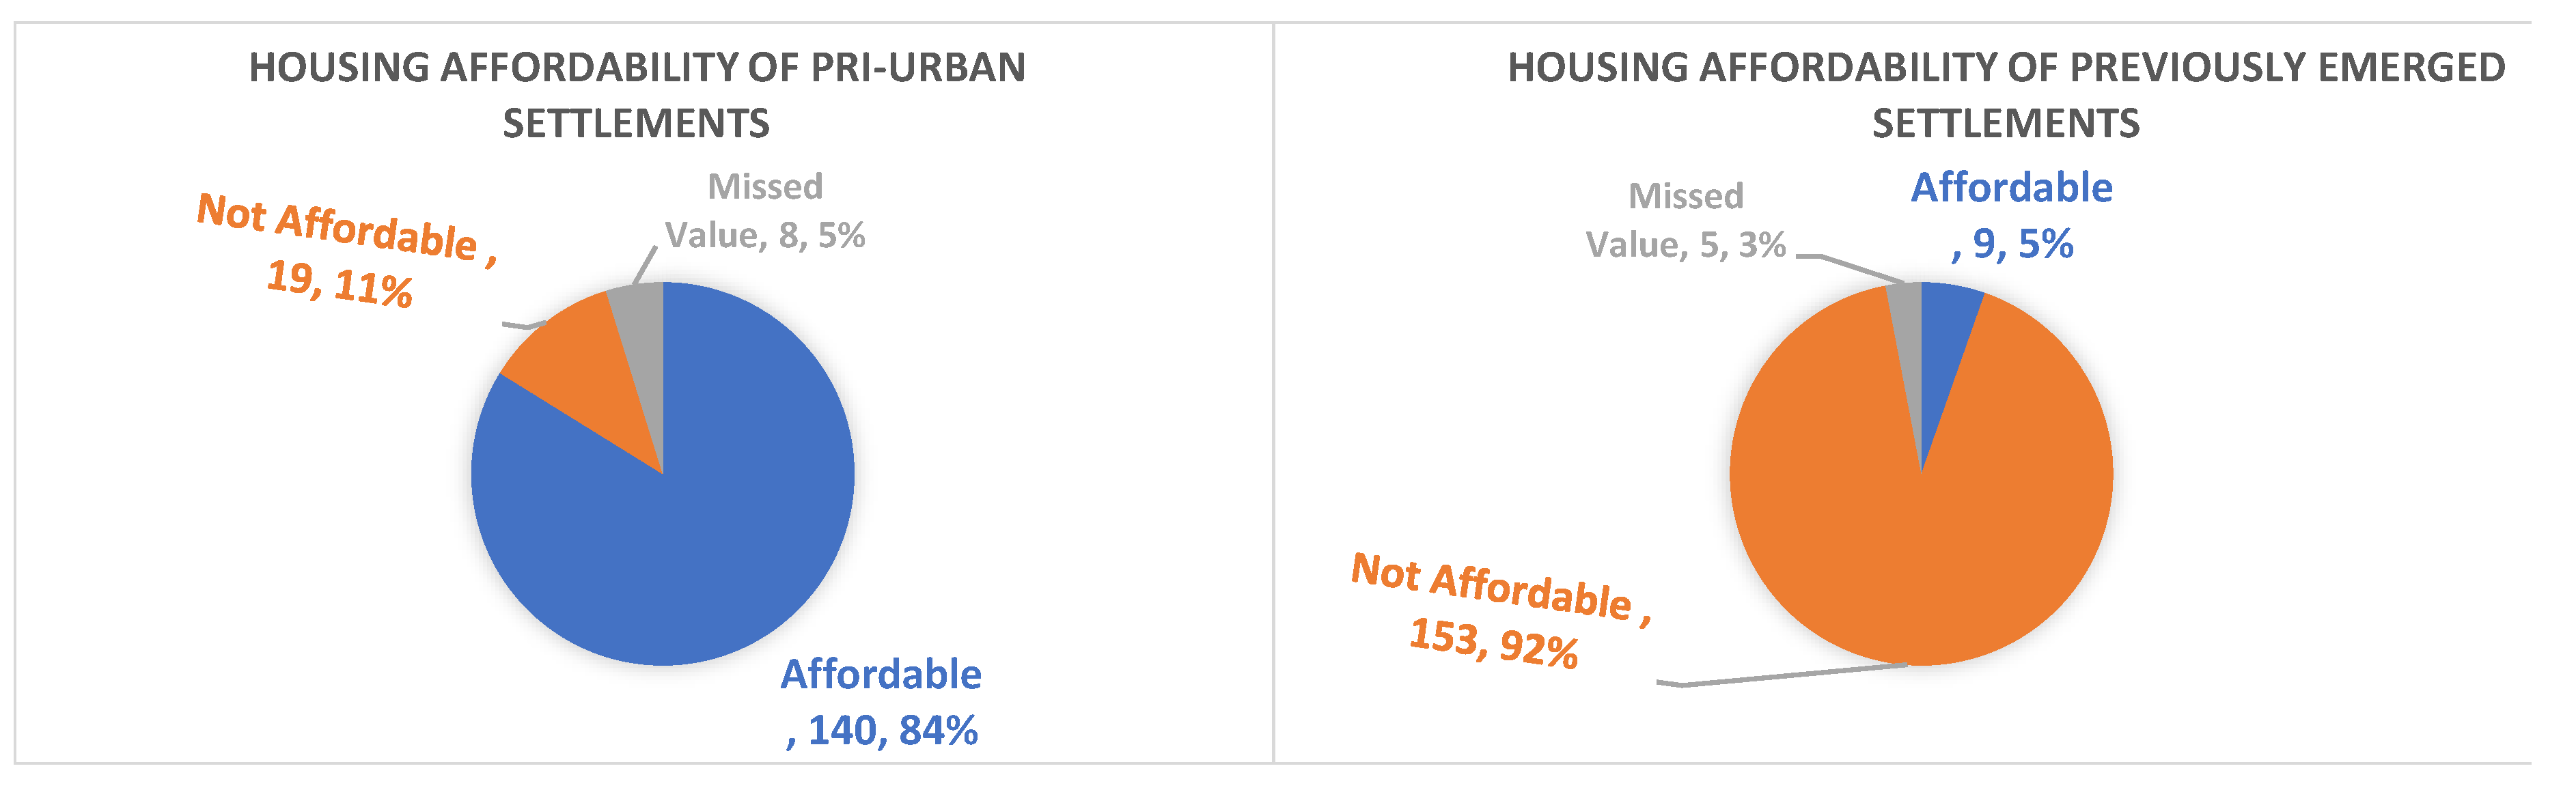
According to household survey results, emerging settlements are shown in
Figure 13a; 84% of the respondents reported housing or land prices as affordable in peri-urban settlements; conversely, only 11% of the respondents reported housing or land prices as not affordable, and 5% were missing values. Therefore, the urban growth and expansion of emerging peri-urban settlements show an inorganic growth trend due to housing affordability issues that have their own significant impact on the growth and expansion of informality.
As shown in
Figure 13b, housing in previously emerged settlements is not affordable (92%) as compared to
Figure 13a that shows as a result of housing affordability, the inhabitants of Hawassa prefer to settle in peri-urban settlements that have implications on the dynamic horizontal expansion of the city. On the other hand, as shown in
Figure 12, the land auction price in the city is escalating from time to time, yet the availability of land for the auction declines, which has a direct impact on the housing affordability and informality growth of the city.
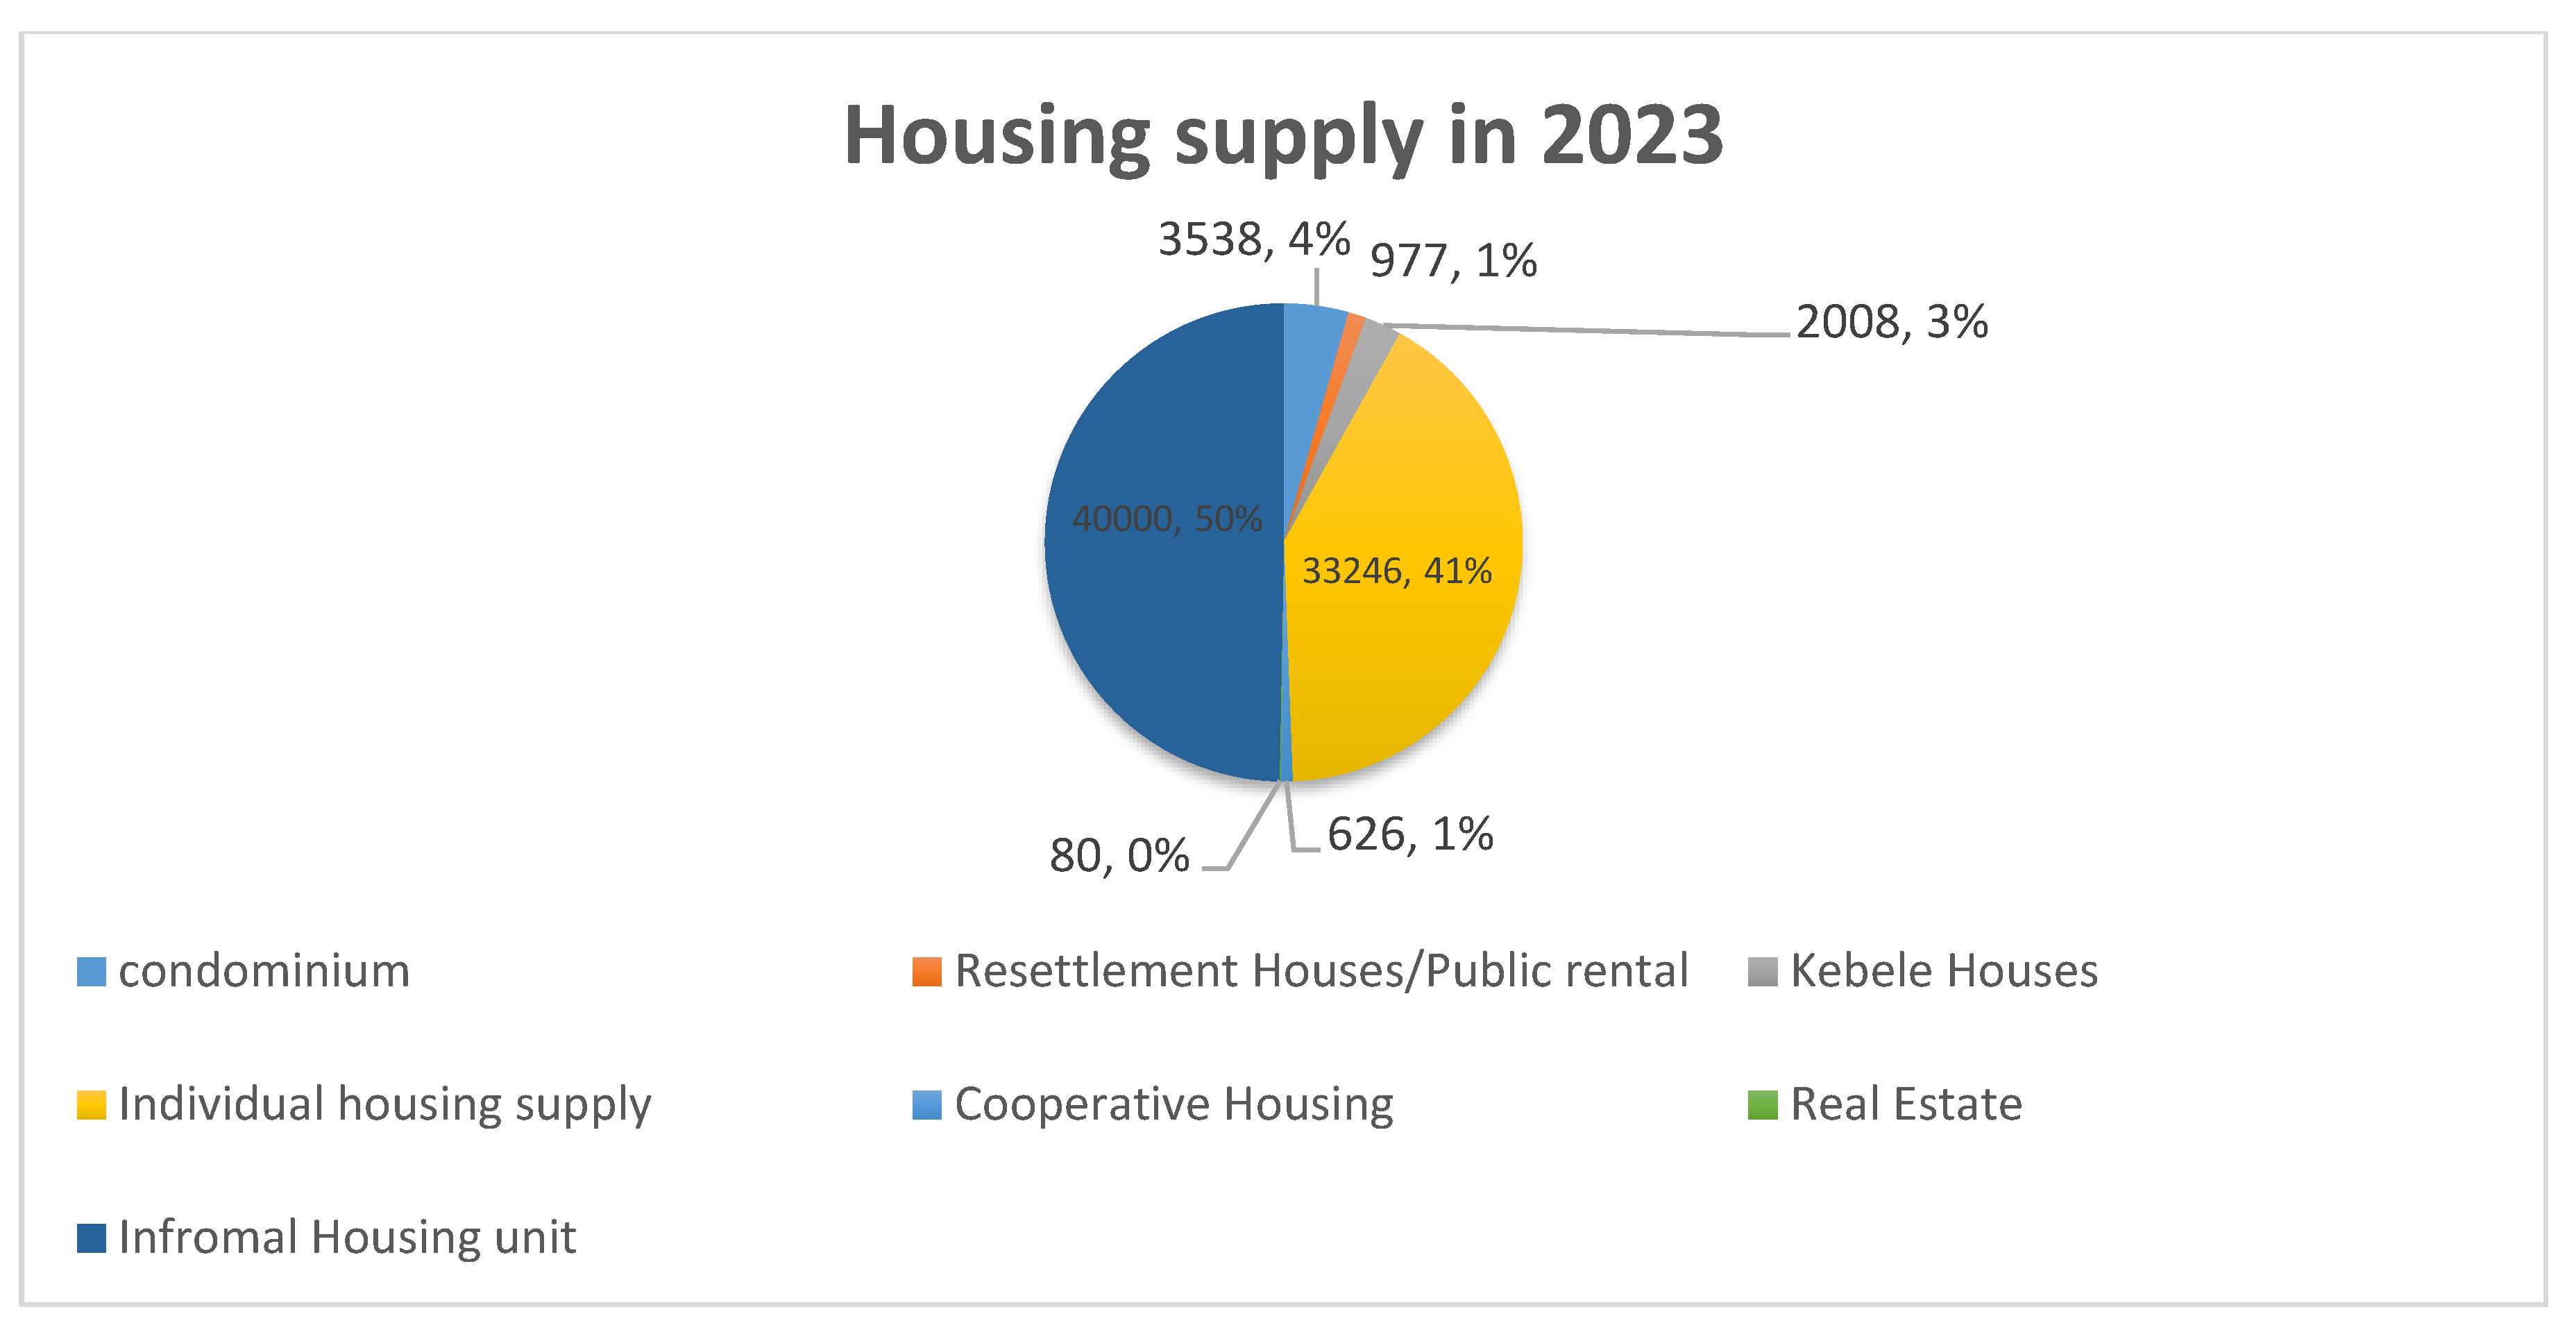
Figure 14 shows housing supply in Hawassa city, as the data shows 50% of housing units in Hawassa city were satisfied by informal housing that have a direct impact on the housing affordability of peri-urban settlements, and from the overall share of housing supply, government housing supply is 5%, which has an attributed impact on the housing affordability in the city. The data shows housing supply in the city has become worse as compared to the share of informal housing units at the city level.
2.4. Discussion
The study also found that when legal housing supply falls, informality grows and expands. The growth rate of informal dwelling units increases when land supply declines and has a positive link with land price. According to Kroll and Haase (2010), economic growth has a greater impact on land use change than population change. As the economy expands, spontaneous land use change occurs in previously established towns. According to the findings, informality is closely linked to declining home affordability. In contrast, demographic change has a direct influence on spatial area expansion; hence, spontaneous land use change happened as a result of economic growth and proximity to high-level services that attract businesses.
The finding shows that spatial change in the city happened as a result of demographic development, becoming dynamic and impulsively impacting the city’s spatial layout. Furthermore, Glaeser et al. (1995) claim that population change and urbanization are intimately tied to the geographical growth and extension of cities in emerging nations. As access to infrastructure and services grows, previously established communities will see informal land use changes.
According to Darrel Jenerette and Potere (2010), it also has a backwash impact on urban peripheral land use, shifting it from agriculture to residential and mixed plots. Gong, et al. (2023). Li et al. (2015) and Zhang et al. (2013) demonstrate that urbanization through urban expansion tends to pave the way for land use change and land use dynamics of developed and developing regions.
The finding also reveals that housing supply has a direct impact on the growth and expansion of informality as the formal housing supply declines. The growth tendency of informal housing units increases as the land supply decreases and has a positive relationship with land price. According to Kroll & Haase (2010), land use change is more influenced by economic growth rather than demographic change. As the economy grows, the spontaneous land use change takes place in previously emerged settlements. Informality is directly associated with the declines in housing affordability, according to the finding. In contrast, demographic change has a direct impact on spatial area growth; hence, spontaneous land use change occurred due to the economic growth and proximity to high-level services that attract business premises.