
Submitted:
20 July 2025
Posted:
22 July 2025
You are already at the latest version
Abstract
This study aims to identify and map informal settlements in the city of San José de Cúcuta using Sentinel-2 satellite imagery and geospatial analysis tools available on the Google Earth Engine platform. For this process, a multitemporal composite image was created, enriched with various spectral indices (such as NDVI, SAVI, MNDWI, among others), and a model was trained using supervised classification machine learning algorithms, specifically Random Forest, with representative samples of relevant land cover types in the urban context of the study area. The Validation was performed using 30% of the samples, generating a confusion matrix to evaluate its performance. The results were positive, with an overall accuracy of 87.5% and a Kappa index of 0.86, indicating a high level of agreement between the classified and actual land cover classes. While some classes, such as informal settlements, showed greater confusion, others—such as water bodies and vegetation—were classified more accurately, reinforcing the reliability of the methodology used. Finally, after a spatial post-processing step to remove noise from the composite image, the informal settlement class was extracted to retain only significant groupings of the same class. Based on this final coverage, the total area occupied by informal settlements was calculated, as well as its variability during the 2018–2024 period.
Keywords:
Informal Settlements
; Supervised Classification
; Google Earth Engine
; Sentinel-2
; Random Forest
; Urban Remote Sensing
1. Introduction
Changes in land cover serve as a clear and evident indicator of the transformative processes occurring on the Earth’s surface, making it essential to rely on accurate observations to monitor and understand current processes such as deforestation, urban land use, biodiversity loss, and water management, among others [1]. In this context, continuous monitoring of urban land is of great importance for better understanding the trajectories of land cover change, its impact on the environment, and the dynamics of urban ecosystem services [2].
The development of informal settlements (also known as unplanned areas) is increasing in many parts of the world. This trend is driven by several factors, including rural-to-urban migration, a shortage of affordable housing, rising poverty levels, and social inequality [3,4,5,6,7]. These urban phenomena, common in developing cities worldwide ([8], tend to expand rapidly, especially along peripheries, a highly dispersed pattern that incorporates large areas into urban boundaries, worsening land use occupation and fragmentation problems in both social and environmental terms [9].
The development of informal settlements progresses through several stages: infancy, consolidation, and saturation [10]. Infancy refers to the initial stage, where vacant lands are occupied. Consolidation is marked by outward expansion, subdivision, and construction [11]. Saturation occurs when expansion ceases, and empty spaces are filled with new structures. This stage is typically characterized by overcrowding, which worsens living conditions for settlement inhabitants [12].
In this context, detecting and monitoring informal settlements has become a priority for local governments, as well as for non-governmental and international organizations. In the case of Colombia, informal settlements date back to the late 19th century, gaining greater relevance in both number and diversity after the mid-20th century, when urbanization processes accelerated in Colombian cities [13]. Significantly, the notion of informality has drawn critical attention from many disciplines [14]. Many informal settlements and their housing practices are innovative, resourceful, and highly organized, with the construction and expansion of housing largely independent of official codes and regulations [15,16].
In this regard, remote sensing and geospatial analysis offer powerful tools for identifying large-scale land occupation patterns with high temporal frequency. Specifically, the use of multispectral satellite imagery, such as that provided by the Copernicus program through its Sentinel-2 mission [17], enables the characterization of urban areas by analyzing spectral signatures and derived indices. However, accurately identifying informal settlements requires advanced classification and data processing techniques, such as object-oriented analysis or machine learning algorithms [18].
Figure 1 illustrates a series of images illustrating an informal settlement located on the outskirts of the city of Cúcuta at different points in time. Although there are notable differences among them regarding construction type, housing density, and degree of internal organization, they also share common morphological traits traditionally used to identify them as informal settlements. These elements include narrow streets, irregular housing layouts, and the absence of a defined urban grid, which contrasts with the planned morphology of the rest of the city. Even in more advanced stages of consolidation, these settlements retain characteristics that clearly distinguish them within the urban landscape.
There has been a growing body of literature on the mapping of informal settlements using remote sensing and Geographic Information Systems (GIS) [19,20]. Regarding data availability, remotely acquired imagery from artificial satellites offers a highly suitable data source. However, to fully benefit from this data and extract the necessary information, appropriate analysis methods are required [21]. Geospatial techniques have emerged as reliable tools for capturing more detailed, accurate, up-to-date, and objective spatial information on informal settlements, their dynamics, and morphological characteristics with high temporal frequency [19,22].
In this study, a methodology based on supervised classification using the Random Forest algorithm is implemented, employing Sentinel-2 imagery and multiple spectral indices to detect informal settlements in Cúcuta city, Colombia. Additionally, spatial post-processing techniques are applied to improve the accuracy of the results and eliminate classification noise. Its main purpose is to demonstrate how the cloud-based platform Google Earth Engine (GEE) can serve as an effective tool for the automated identification of informal settlements. By evaluating the model’s accuracy and performance in complex urban environments, the study seeks to highlight its practical utility. The intention is to contribute to the development of urban monitoring systems that are not only more efficient but also accessible and easily replicable in different contexts.
2. Materials and Methods
2.1. Study Area
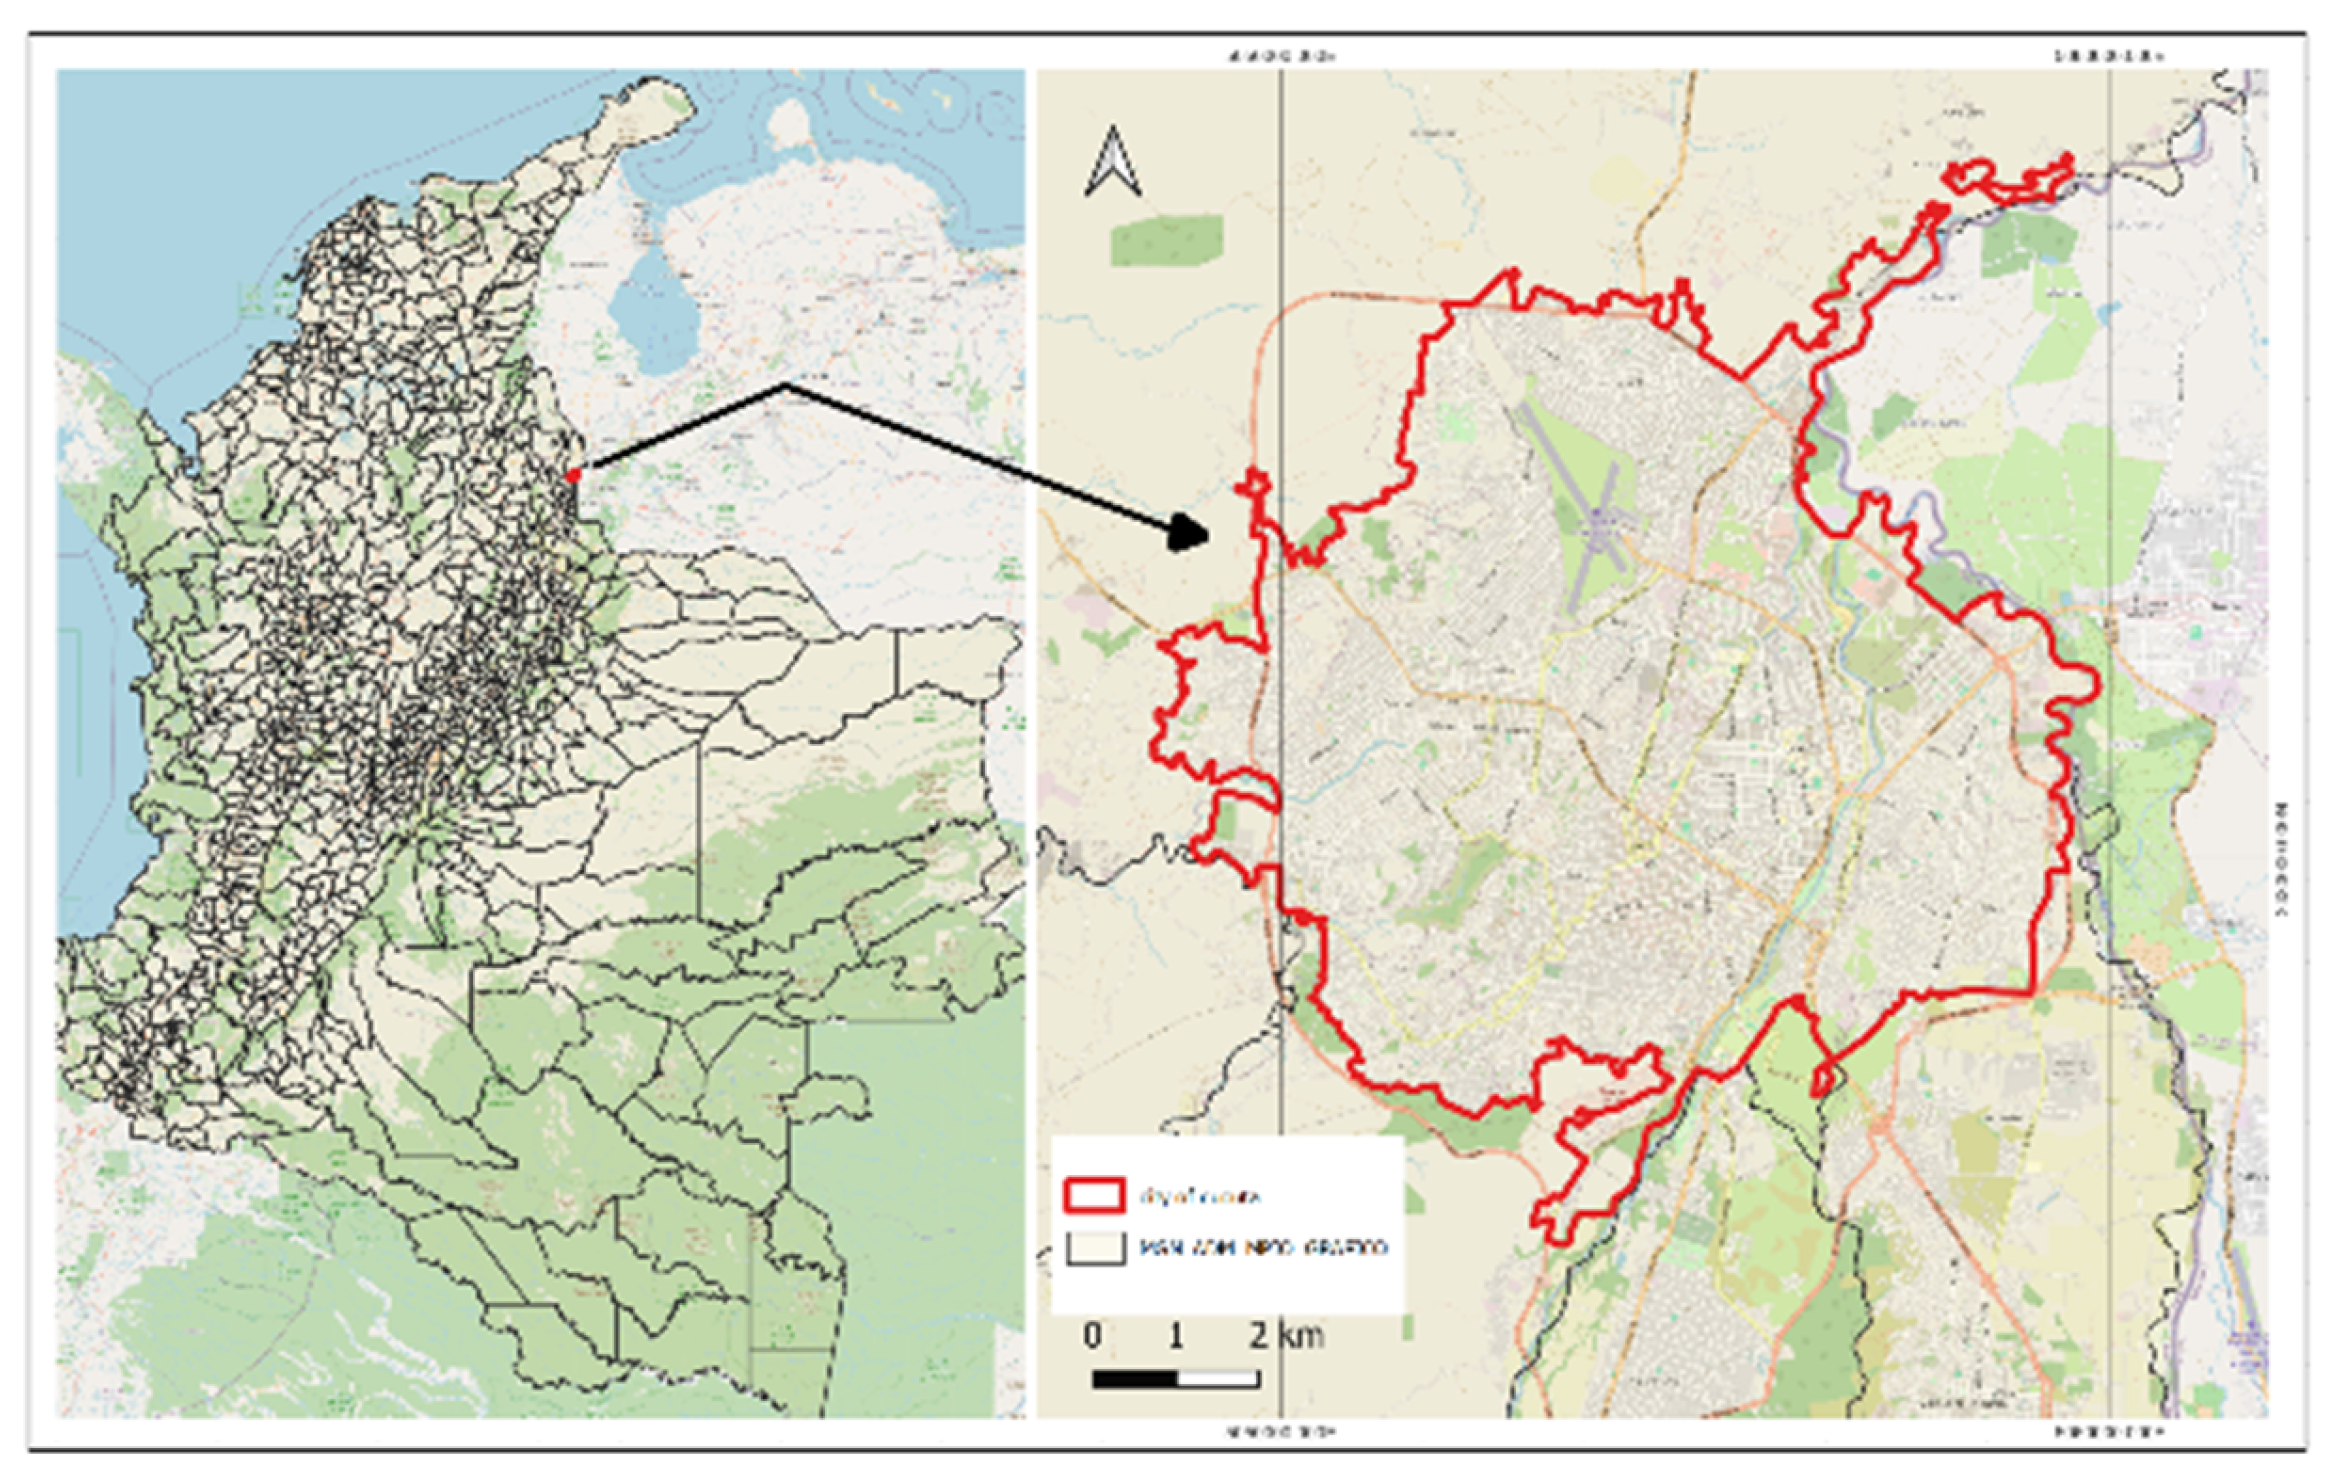
San José de Cúcuta is the capital of the department of Norte de Santander. A city bordering Venezuela, it is in the east-central part of the department within the Eastern Cordillera at 7º 30' north latitude and 72° 30' west longitude (Figure 1). Its strategic geographic location, combined with various processes of population and urban growth, has led to the formation of a metropolitan area that integrates multiple territories connected through a shared core. This development has been shaped by the city's historical phases and natural determinants, promoting a new spatial configuration that consolidates key territorial elements such as settlements, population, economy, migration, and mobility, in line with the provisions of Law 1625 of 2013 [23].
Figure 2.
Study area and location maps.
According to a study conducted by worldbank.org (2019) [24], published on its blog for Latin America and the Caribbean, it was found that Cúcuta shows an increasing number of informal settlements, increasingly concentrated in peripheral areas along the border with Venezuela and to the west toward the municipality of El Zulia, and increasingly located in high-risk areas (Figure 3).
According to Bank (2019) by comparing satellite imagery with the land use classification provided by Cucuta’s Municipal Land Use Plan, urban expansion was observed beyond the city’s official boundary. The analysis revealed detailed information about settlements established on low, erosion-prone lands covered with brush vegetation along the road to the municipality of El Zulia—areas that are not suitable for housing construction.
The selection of the city of Cúcuta as the study area is based on multiple factors that make it a representative and relevant case for the analysis of informal settlements using geospatial and remote sensing tools. Since the COVID-19 pandemic in 2019, Cúcuta has experienced rapid, visible, and significant urban growth driven by both internal dynamics and migratory flows from neighboring Venezuela. This has resulted in a disorganized expansion of the urban perimeter and a notable increase in informal settlements along its outskirts (Figure 4). Additionally, the city and its periphery present a diverse morphological pattern of land occupation, allowing for an evaluation of the classification algorithms' ability to distinguish between different land cover types, such as formal (urban) and informal (non-urban) areas. This spatial heterogeneity represents both a technical challenge and an opportunity to validate the applicability of satellite image-based and machine learning methodologies in complex urban contexts.
Moreover, the availability of geospatial data and the existence of prior studies on informal urbanization in Cúcuta help contextualize the results and allow for comparison with empirical information. Ultimately, using this city as a case study aims to generate valuable insights for local land-use planning and for the development of public policies focused on managing urban growth and improving living conditions in vulnerable areas.
Regarding the proposed work methodology, the data flow diagram (DFD) (Figure 5) was structured into several sequential stages, integrating remote sensing tools, spatial analysis, and machine learning, all supported by the Google Earth Engine (GEE) platform. The process began with the acquisition of satellite data from the 2018–2024 period. Subsequently, a training dataset was built using georeferenced samples from different classes, including both formal and informal settlements, in order to generate clear differentiation between them. The methodology involves training a supervised classification model using the Random Forest algorithm, with 30% of the samples randomly set aside for validation. Evaluation metrics must then be generated to assess the model’s accuracy and reliability based on the identified classes. Finally, from the resulting classification, the informal settlement class will be extracted specifically to analyze its variability and spatial expansion in the city of Cúcuta during the 2018–2024 period.
2.2. Dataset
Previous research has demonstrated the value of using medium- and high-resolution satellite imagery to map urban areas and subsequently isolate informal settlements (as cited by Alrasheedi et al., 2024; Cinnamon, 2024; Li et al., 2022; Mahabir et al., 2018). Remote sensing facilitates spatial analysis [29], and its synoptic and repetitive capabilities offer updated, consistent, and comprehensive geospatial information with high thematic detail, especially in complex urban environments [30].
However, at the local scale in developing countries, it is rarely feasible to use high- or very-high-resolution remote sensing data due to their high cost. Therefore, medium- to high-resolution imagery, such as Sentinel-2 or Landsat 8–9, is most commonly used for land cover classification because of its free availability [31]. Several case studies have attempted to apply medium- to high-resolution satellite images in machine learning applications through the cloud-based platform Google Earth Engine (GEE); many of these studies reference the implementation of the Random Forest algorithm for land cover classification using Landsat and Sentinel-2 imagery to compare classification accuracy between image types [32].
In this context, and for the purposes of this study, imagery from the Sentinel-2A (S2A, 2015) satellite was used. These are medium- to high-resolution multispectral image missions launched by the European Space Agency (ESA) through its Copernicus program, with a temporal resolution of five days [33], and consist of 13 spectral bands: visible and NIR at 10 meters, red-edge and SWIR at 20 meters spatial resolution. This specific COPERNICUS/S2 dataset, available on the Google Earth Engine cloud platform, provides imagery for the 2018–2024 period, prioritizing images with less than 20% cloud cover over the study area.
2.3. Preprocessing and Index Generation
Changes in land cover can serve as primary indicators of territorial change at various spatial and temporal scales, making their detection and evaluation a key priority for researchers and decision-makers in different fields [34,35]. In this regard, spectral indices are combinations of spectral reflectance values from two or more wavelengths that indicate the relative abundance of features of interest in a given area. Vegetation indices are the most widely used, but there are also indices for built-up features, water bodies, geological features, and burned areas [36].
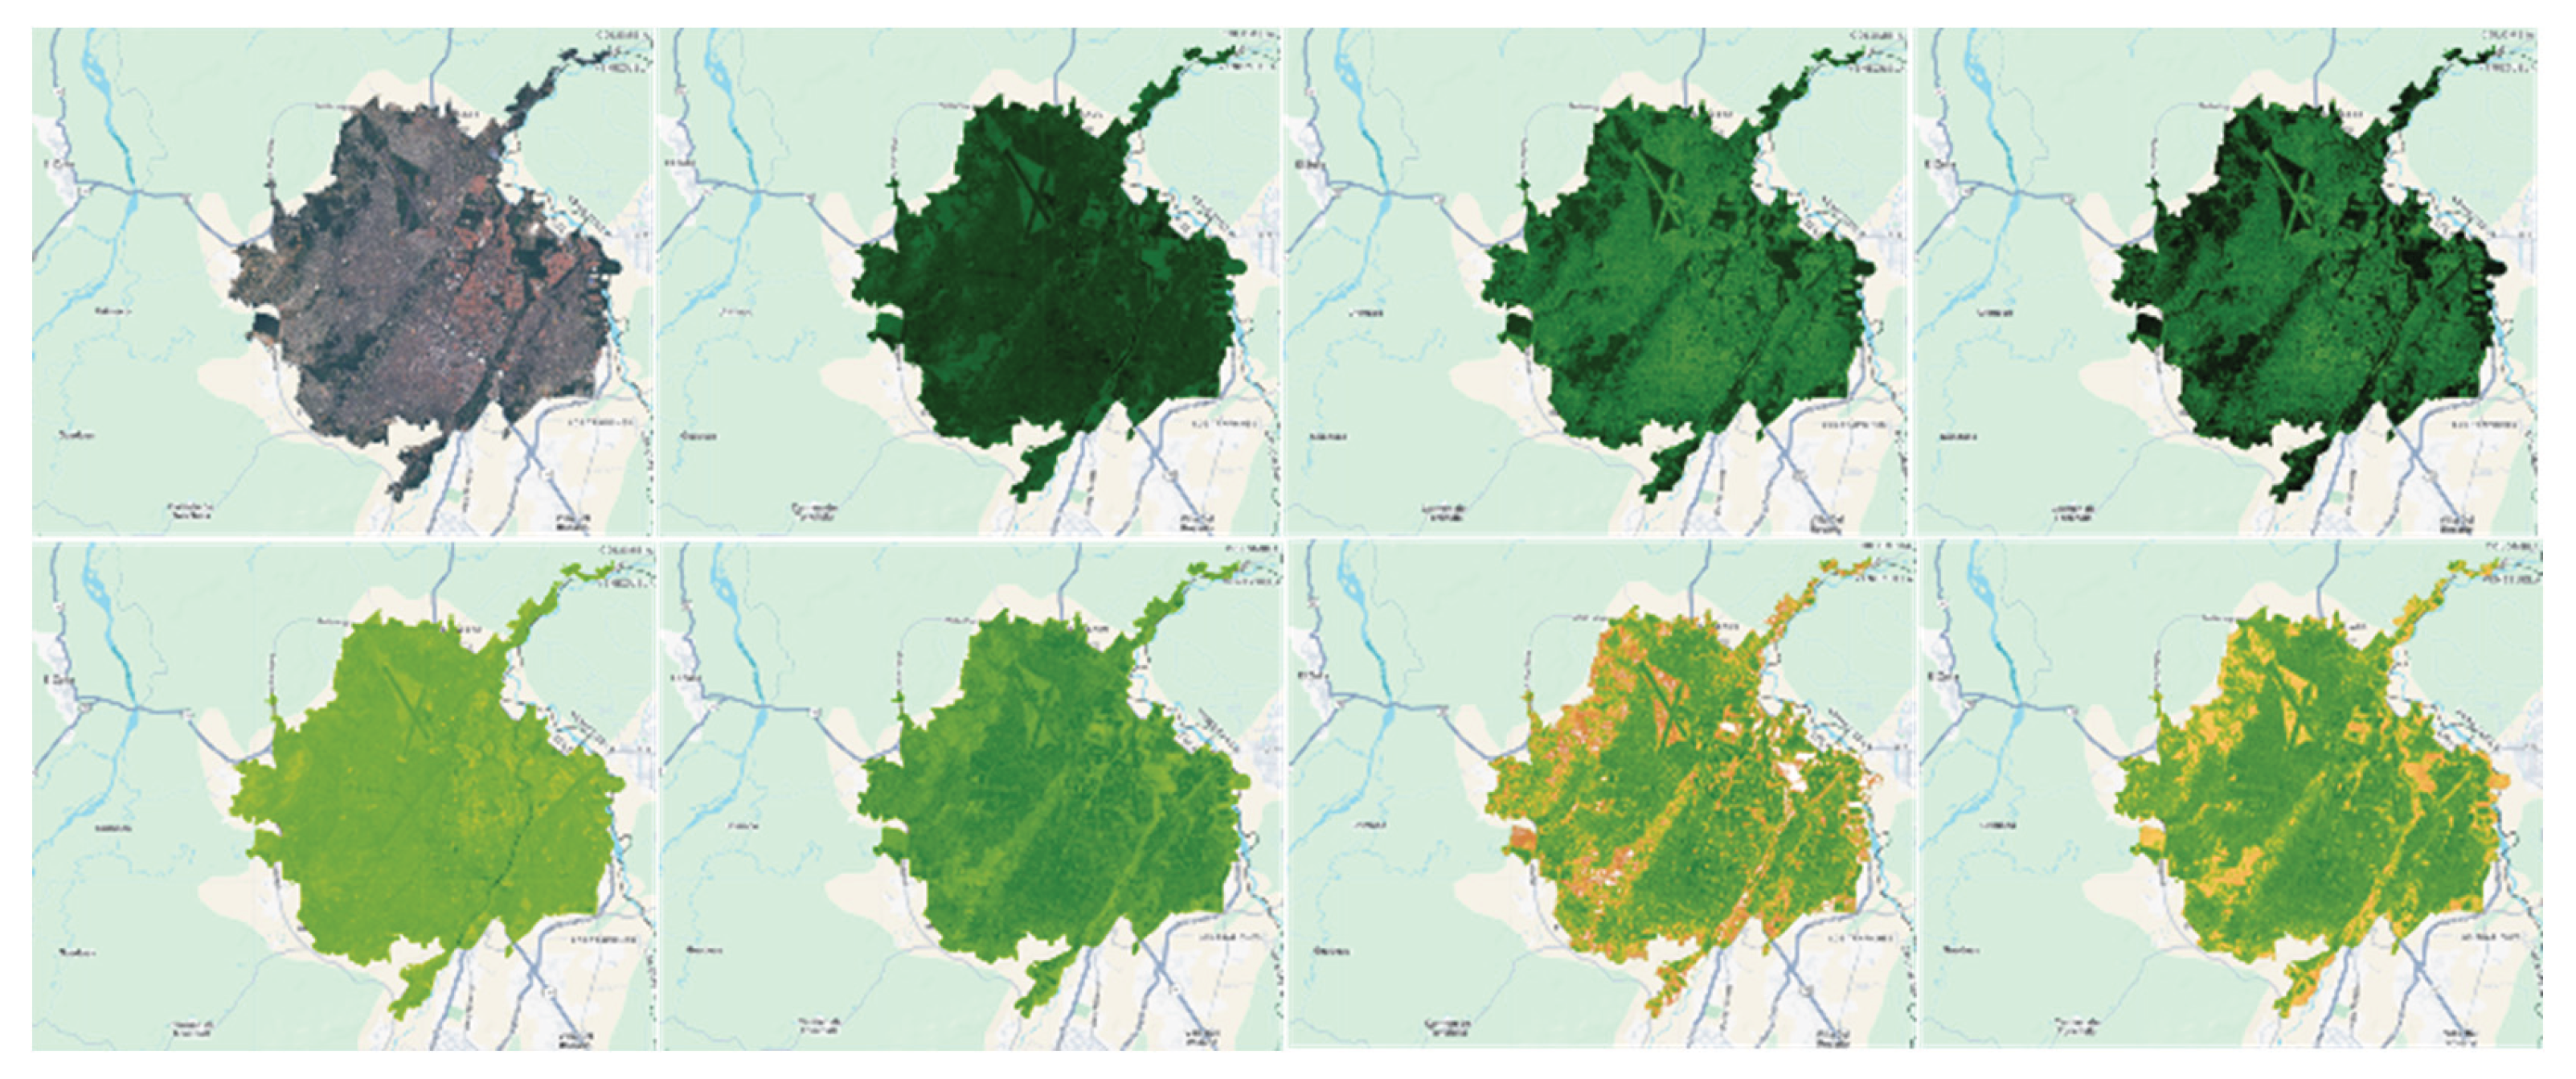
Once the images were selected, an atmospheric correction and clipping process was applied specifically to the study area—the periphery zone of the municipality of San José de Cúcuta. Subsequently, and with the goal of highlighting and extracting specific surface features of the study area, several relevant spectral indices were determined for urban characterization and informal settlement detection. These include: NDVI (Normalized Difference Vegetation Index), NDBI (Normalized Difference Built-up Index), MNDWI (Modified Normalized Difference Water Index), SAVI (Soil Adjusted Vegetation Index), BRBA, BUI, and UI (derived indices for enhancing built-up areas). These indices were added as additional bands to the composite images, enriching the available spectral information for classification.
Figure 6.
Spectral indices for 2018 (from left to right: S2_Image2018; BRBA Index, NDVI Index, SAVI Index, MNDWI Index, NDBI Index, BUI Index, UI Index).
Figure 6.
Spectral indices for 2018 (from left to right: S2_Image2018; BRBA Index, NDVI Index, SAVI Index, MNDWI Index, NDBI Index, BUI Index, UI Index).
2.4. Training Samples
Training data are essential for supervised image classification [37]. A training dataset was constructed using manually digitized point geometries via the GEE interface on Sentinel-2 imagery, carefully representing eight land cover classes relevant to the urban context of the study area for the years 2018, 2019, 2022, and 2024. These classes included: informal settlements, formal settlements, vegetation, bodies of water, bare soil, tree cover, roads, and other urban areas. Each class was assigned a unique numeric value using the Class property. The samples were merged into a single collection and filtered to ensure each had the correct label.
Each geometry was assigned a Class property to which a unique numeric value was assigned (e.g., 0 for informal settlements, 1 for formal settlements, etc.). This encoding enabled all samples to be merged into a single FeatureCollection, which served as the training base for the model. To ensure labeling consistency, a filter was applied to eliminate any samples missing the Class attribute.
Efforts were made to ensure that the representative samples covered different sectors of the city, including both central and peripheral zones, to capture greater spectral and morphological variability within each class. Special care was taken with the informal settlement class—the primary focus of the model—ensuring that samples represented various stages of development, density, and spatial patterns. Informal settlements typically progress through stages such as infancy, consolidation, and saturation [10]. Infancy refers to the initial stage where vacant lands are occupied; consolidation is marked by outward expansion, subdivision, and construction [11]; and saturation occurs when expansion halts and remaining empty spaces are filled with new structures [12]. This diversity was key to training a robust model capable of generalizing effectively over the study area.
Finally, as part of the training process, the sample set was randomly divided into two subsets: 70% for training and 30% for validation. This allowed for an objective evaluation of the classifier's performance using accuracy metrics and a confusion matrix.
2.5. Supervised Classification
GEE’s machine learning algorithms are among the most advanced techniques for generating reliable and informative maps from diverse satellite data sources [38]. GEE is designed to store, process, and analyze large datasets for decision-making [39]. The platform enables real-time processing of large datasets using image processing functions directly accessible through the Code Editor, which is built to handle big data using JavaScript without additional installations. GEE offers several machines learning methods, including Random Forest (RF), Classification and Regression Trees (CART), Naive Bayes (NB), and Support Vector Machine (SVM) (Lee et al., 2024)—methods falling under the broader category of artificial intelligence [40,41,42]. These techniques are increasingly gaining attention for land cover classification [42].
In this study, once the composite images with spectral and derived indices were generated, a supervised classification was conducted using the Random Forest (RF) machine learning algorithm. RF, widely recognized for its robustness, generalization capability, and computational efficiency in remote sensing applications, was implemented directly in the Google Earth Engine platform, leveraging its cloud processing capabilities and access to large volumes of satellite data.
As mentioned earlier, the labeled sample set was randomly divided into two data subsets: 70% for training and 30% for validation. This division was carried out using GEE's randomColumn() function, which assigns a random value to each sample, allowing for a reproducible and unbiased partition. The model was trained with a total of 50 decision trees—a value commonly used in the literature to balance accuracy and computational efficiency.
During training, the model learned to distinguish between the various land cover classes based on the previously calculated spectral variables and indices. The trained model was then applied to the composite image to generate a classified map in which each pixel was assigned to one of the defined classes based on its spectral similarity to the training samples.
To assess model performance, the validation subset was used to generate a confusion matrix comparing the predicted classes with the actual sample labels. From this matrix, key metrics such as overall accuracy, kappa index, and class-specific accuracy were calculated, helping to identify the model’s strengths and weaknesses in discriminating each land cover type. This approach resulted in a detailed thematic map of the study area, with particular emphasis on the distribution of informal settlements—the class of highest interest in this study. The combination of multiple spectral indices, a robust classification algorithm, and rigorous validation ensured the reliability of the results. Authors such as Jochem et al. (2018) [43] applied RF to classify regular and irregular settlements with overall accuracies ranging between 78% and 90% in a study across seven provincial capitals in Afghanistan. Bourgoin et al. (2020) [44] used RF for land cover classification with Landsat and Sentinel-2 data, reporting an overall accuracy and kappa index of 0.81 and 0.87, respectively [42], demonstrating the applicability and reliability of such processes.
2.6. Supervised Classification
Once the classified image was obtained, a spatial postprocessing step was performed to improve the quality of the thematic map and reduce the noise inherent to pixel-based classification. This sub-process is particularly important in dense and heterogeneous urban environments, where isolated or misclassified pixel groups can affect result analysis and interpretation. The connectedComponents() function in GEE was used to identify contiguous pixel clusters that share the same class. In this case, it was specifically applied to the informal settlements class, generating a connected component layer based on a cross-type neighborhood (4-neighbors). Each group was assigned a unique label, allowing for size quantification by number of pixels. Subsequently, a connectivity filter was applied using the connectedPixelCount() function, establishing a minimum threshold of 50 connected pixels for a group to be considered valid. This operation eliminated small, isolated clusters that could represent classification errors or spectral noise, preserving only the most representative and spatially coherent clusters.
The result of this process was a refined image of informal settlements in which areas with greater spatial consistency were preserved, and “spurious” elements were discarded. This stage was key to ensuring the practical utility of the final product, especially for urban planning, territorial monitoring, and decision-making applications. Additionally, this approach preserved the original spatial resolution of Sentinel-2 imagery (10 meters), facilitating integration with other geographic layers and visualization on geospatial analysis platforms.
3. Results
One of the outcomes obtained from the supervised classification process was the creation of a multiclass thematic map representing the spatial distribution of different land cover types within the city of San José de Cúcuta. This map was generated through the application of the Random Forest (RF) machine learning algorithm on a composite image enriched with spectral bands and indices derived from Sentinel-2 satellite imagery and executed on the GEE platform. The classification included eight classes: informal settlements, formal settlements (in two levels of consolidation), herbaceous vegetation, water bodies, bare soil, tree cover, and roads. Each class was represented with a distinctive color palette to facilitate visual interpretation.
Figure 7 shows the classified map for the year 2024. Informal settlements are mainly concentrated on the outskirts of the city of Cúcuta, particularly in areas of unplanned urban expansion. These areas are characterized by high occupancy density, irregular patterns, and the absence of formal road infrastructure, consistent with field observations and institutional reports.
This classified map (Figure 7) clearly identifies land covers such as green areas, water bodies, and consolidated urban zones, demonstrating the model’s ability to distinguish between classes with similar spectral characteristics. The 10-meter spatial resolution allowed for the capture of relevant details in the urban environment, maintaining a balance between accuracy and geographic coverage. This cartographic product serves as a valuable tool for territorial planning, enabling quick and precise visualization of vulnerable areas that require priority attention in terms of infrastructure, services, and land regularization.
From this map, and through postprocessing, a refined image of informal settlements was obtained, in which areas with greater spatial consistency were preserved and misleading elements were discarded. The result is a cleaned-up map showing the possible settlements identified in the study area. This output takes the form of a binary mask displaying only the pixels classified under class 0 (informal settlements), filtered by spatial connectivity—that is, only connected pixel groups with at least 50 neighboring pixels were retained (as per the applied filter), effectively removing "noise" or isolated misclassifications that likely do not represent actual informal settlements. This process was repeated across several periods from 2018 to 2024 (see Figure 6) to identify and map zones of change or the presence of informal settlements.
The spatial analysis following the refinement of the classified image—whose results are shown in Figure 8 reveals that most informal settlements are distributed along the city’s periphery. This distribution is not random; it reflects patterns observed in the city over the past decade, where central areas are typically more regulated, consolidated, and have greater access to formal infrastructure. In contrast, the peripheral zones offer land that is easier to occupy, allowing for the development of housing without planning or basic services, making them prone to informal expansion.
These areas, being farther from the city center and beyond the reach of urban control, tend to develop outside the borders of legality. They may even be associated with processes of land speculation and the absence of inclusive housing policies, which further hinder their integration into the formal urban fabric. The identification of these areas using geospatial platforms such as Google Earth Engine (GEE), combined with remote sensing imagery like Sentinel-2, enables geospatial analysis that not only makes this ongoing issue visible but also helps guide more equitable and sustainable intervention strategies within the study area.
When comparing the images from the annual periods 2018, 2022, and 2024, it is evident that the areas marked in red in Figure 9 are those identified by the model as informal settlements with sufficient spatial evidence. Table 1 shows the respective areas associated with each representative period.
These changes also become evident not only with their spatial distribution as shown in Figure 8, but also with the increments of areas, as shown in Table 1.
Subsection
To evaluate the performance of the supervised classification model, a quantitative approach was applied, comparing the classes predicted by the algorithm with the actual classes from a validation sample set for the year 2024. This comparison was conducted using a confusion matrix Figure 10) statistical tool that allows for visualization of how often the model correctly or incorrectly classified each category. For this process, 30% of the available samples were used, reserved exclusively for validation.
Based on the confusion matrix shown in Figure 10, key metrics were calculated to assess the accuracy and overall quality of the model, resulting in the following:
Overall Accuracy: This represents the total percentage of correctly classified samples. The overall accuracy indicates that the model correctly classified 87.5% of the samples in the validation set. While this metric provides a general measure of model performance, it does not reflect potential imbalances across classes.
Kappa Coefficient: This metric evaluates the reliability of the classification. In this case, a value of 0.86 reflects a high degree of reliability or agreement between the assigned classes and the actual classes. Values closer to 1 indicate excellent classification performance.
Producer’s Accuracy: This metric allows for evaluating the model’s performance for each individual class. In this case, it indicates the probability that a pixel belonging to a real (reference) class was correctly classified. The results for each class are presented in Table 2.
User’s Accuracy: Like the previous metric, this allows for evaluating the model’s performance for each individual class. In this case, it indicates the probability that a pixel classified into a given class belongs to that class as shown in Table 3.
Figure 11 is the graphical representation of all the results obtained for class-specific accuracy. For example, class 4 (water) shows perfect accuracy in terms of the pixels classified under this category, while class 0 (informal settlements) demonstrates lower performance, indicating that this class is more difficult to classify correctly.
Besides the appraisal of the classification method, a verification of the informal settlements identified through a geospatial analysis was conducted, considering the latest census data regarding the materials of the dwellings (DANE, 2018). In general, dwellings from informal settlements are characterized by poor materials used to build the walls and floors of the houses. In this case, the percentage of dwellings with dirt floors, regarding the total dwellings for each census block, was used as a proxy to categorize zones as informal settlements (Figure 12). The higher the percentage, the higher the likelihood of a census block to be considered as an area of informal housing.
When comparing Figure 8 and Figure 12, it is possible to observe that census blocks with the higher percentages (>60%) of dwellings with dirt floors are located in areas classified as informal settlements through the geospatial analysis. This comparison is considered relevant to validate the results, considering that the data of the census is completely independent from the processing of the aerial imagery.
4. Discussion
The results obtained reflect solid performance of the classification model, with an overall accuracy of 87.5% and a Kappa index of 0.86, indicating a high level of agreement between the classes established at the beginning of the process and the actual ones. Some classes, such as water bodies or vegetation, were classified with greater accuracy—an expected outcome given the distinctiveness of their spectral signatures. In contrast, classes such as informal settlements presented greater uncertainty, which could be attributed to image resolution, the heterogeneous and asymmetrical composition of these areas, or their spectral similarity to other urban covers like bare soil or formal constructions.
This trend aligns with findings from previous analyses that have highlighted the difficulty of identifying informal settlements using medium- to high-resolution remote sensing imagery, especially in densely urbanized areas. Nevertheless, the use of specific spectral indices and spatial connectivity filtering helped improve detection and re-duce noise in the final map.
Among the main limitations is the dependence on remote sensing imagery, which in the case of the study area is often affected by atmospheric conditions and cloud cover. Additionally, both the quality and representativeness of the training samples significantly influence model performance. For future studies on this topic, it is recommended to incorporate data such as radar imagery, which can detect structures and surfaces even under cloud cover, or elevation and slope data to better differentiate between land covers with similar spectral signatures (e.g., bare soil and concrete). It is also advisable to refine urban classes and explore other deep learning techniques to enhance the discrimination of complex urban land covers. The generated product can be highly useful for urban planning, land management, and the monitoring of informal dynamics in urban environments.
5. Conclusions
The integration of Sentinel-2 imagery, spectral indices, and Random Forest classification within the Google Earth Engine platform enabled the reliable identification and monitoring of informal settlements in Cúcuta, Colombia. Despite the spectral similarity between certain urban classes, the methodology achieved strong performance—87.5% overall accuracy and a Kappa index of 0.86—demonstrating its robustness in complex urban contexts. The refinement of outputs through spatial connectivity filtering proved essential to improving thematic clarity, particularly in areas with irregular urban morphology.
The spatial growth of informal settlements—from approximately 88 hectares in 2018 to over 260 hectares in 2024—highlights the urgency of addressing unplanned urban expansion in the city’s periphery. These results support the practical applicability of cloud-based remote sensing tools for territorial diagnostics, especially in data-scarce regions. While limitations persist, the approach offers a scalable, low-cost solution to support inclusive land use planning, and future studies could benefit from integrating radar or elevation data and experimenting with more advanced classification algorithms.
Author Contributions
Project administration, Investigation, Data curation, Writing – original draft preparation, Software, Formal analysis, and Resources, S.V.; Validation and Supervision, M.R., M.C., J.V.; Conceptualization, Visualization, and Writing – review and editing, S.V.; Methodology, S.V., M.R., M.C., J.V.; all authors have read and agreed to the published version of the manuscript.
Funding
This research received no external funding.
Institutional Review Board Statement
Not applicable.
Informed Consent Statement
Not applicable.
Conflicts of Interest
The authors declare no conflicts of interest.
References
- M. Herold et al., “Assessment of the Status of the Development of the Standards for the Terrestrial Essential Climate Variables: T9 Land Cover,” Rome, Italy, 2009.
- T. Mugiraneza, A. Nascetti, and Y. Ban, “Continuous monitoring of urban land cover change trajectories with Landsat time series and LandTrendr-Google Earth Engine cloud computing,” Remote Sens (Basel), vol. 12, no. 18, p. 2883, 2020. [CrossRef]
- S. Fox, “The Political Economy of Slums: Theory and Evidence from Sub-Saharan Africa,” World Dev, vol. 54, pp. 191–203, 2014.
- S. C. Winter, L. M. Obara, and S. McMahon, “Intimate partner violence: A key correlate of women’s physical and mental health in informal settlements in Nairobi, Kenya,” PLoS One, vol. 15, p. e0230894, 2020.
- D. Matarira, O. Mutanga, and M. Naidu, “Google Earth Engine for informal settlement mapping: A random forest classification using spectral and textural information,” Remote Sens (Basel), vol. 14, no. 20, p. 5130, 2022. [CrossRef]
- D. S. Williams, M. Máñez Costa, C. Sutherland, L. Celliers, and J. Scheffran, “Vulnerability of informal settlements in the context of rapid urbanization and climate change,” Environ Urban, vol. 31, no. 1, pp. 157–176, Apr. 2019. [CrossRef]
- K. G. Alrasheedi, A. Dewan, and A. El-Mowafy, “Using local knowledge and remote sensing in the identification of informal settlements in Riyadh City, Saudi Arabia,” Remote Sens (Basel), vol. 15, no. 15, p. 3895, 2023. [CrossRef]
- UN-Habitat and W. Bank, “The State of the World’s Cities Report; Dimensions of urban poverty in Europe and the Central Asia Region; Informal Urban Development in Europe,” 2009.
- A. Aguilar, M. Flores, and L. Lara, “Peri-Urbanization and Land Use Fragmentation in Mexico City. Informality, Environmental Deterioration, and Ineffective Urban Policy,” Frontiers in Sustainable Cities, vol. 4, p. 790474, 2022. [CrossRef]
- F. Orina, “Comparing spatial patterns of informal settlements between Nairobi and Dares Salaam,” 2015.
- R. Sliuzas, “Diversity of Global Slums Conditions - Is a Universal Spatial Definition of Slums Feasible?,” 2008.
- N. D. Sori, “Identifying and Classifying Slum Development Stages from Spatial Data,” University of Twente, Faculty of Geo-Information and Earth Observation (ITC), 2012.
- C. A. Torres Tovar, Ciudad informal colombiana, Barrios construidos por la gente. Universidad Nacional de Colombia, Facultad de Artes, 2009.
- K. Nilva, “Informality and Formalization of Informal Settlements at the Turn of the Third Millennium: Practices and Challenges in Urban Planning,” J Stud Soc Sci, vol. 9, no. 2, pp. 247–299, 2014.
- P. Jones, “Formalizing the informal: Understanding the position of informal settlements and slums in sustainable urbanization policies and strategies in Bandung, Indonesia,” Sustainability, vol. 9, no. 8, p. 1436, 2017. [CrossRef]
- P. Silva and H. Farrall, “Lessons from informal settlements: A ‘peripheral’ problem with self-organising solutions,” Town Planning Review, vol. 87, no. 3, pp. 297–319, 2016. [CrossRef]
- E. S. A.-C. S. C. M. M. Team, “Sentinel High Level operations plan (HLOP),” 2021. Accessed: May 30, 2024. [Online]. Available: https://sentiwiki.copernicus.eu/__attachments/1673407/COPE-S1OP-EOPG-PL-15-0020%20-%20Sentinel%20HLOP%202021%20-%203.1.pdf?inst-v=ce885cc8-6ce8-45ba-998f-4d0e6a9a835e.
- A. Da Penha Pachêco, R. Mikosz Gonçalves, E. de Lima, and A. Garcia Ximenes Quintans, “Sensoriamento remoto de alta resolução espacial na caracterização de assentamentos informais,” Revista de Geografía Norte Grande, vol. 57, pp. 143–159, 2014. [CrossRef]
- M. Kuffer, K. Pfeffer, R. Sliuzas, and I. Baud, “Extraction of slum areas from VHR imagery using GLCM variance,” IEEE J Sel Top Appl Earth Obs Remote Sens, vol. 9, no. 5, pp. 1830–1840, 2016.
- V. Alegría and K. Dovey, “Morphogenesis of contemporary informal settlement in Chile,” Urban Design International, 2022. [CrossRef]
- Z. Assarkhaniki, S. Sabri, and A. Rajabifard, “Using open data to detect the structure and pattern of informal settlements: an outset to support inclusive SDGs’ achievement,” Big Earth Data, vol. 5, no. 4, pp. 497–526, 2021. [CrossRef]
- N. Mboga, C. Persello, J. R. Bergado, and A. Stein, “Detection of informal settlements from VHR images using convolutional neural networks,” Remote Sens (Basel), vol. 9, no. 11, p. 1106, 2017. [CrossRef]
- E. Ayala, “Área Metropolitana de Cúcuta: historia de un territorio, una frontera y una región,” Instituto de Estudios Urbanos – IEU, 2021. [Online]. Available: https://ieu.unal.edu.co/en/medios/noticias-del-ieu/item/area-metropolitana-de-cúcuta-historia-de-un-territorio-una-frontera-y-una-region.
- W. Bank, “How Venezuelan migration is changing urban expansion in Cucuta, Colombia,” World Bank Blogs, 2019. [Online]. Available: https://blogs.worldbank.org/en/latinamerica/how-venezuelan-migration-changing-urban-expansion-cucuta-colombia.
- R. Mahabir, A. Croitoru, A. Crooks, P. Agouris, and A. Stefanidis, “A critical review of high and very high-resolution remote sensing approaches for detecting and mapping slums: Trends, challenges and emerging opportunities,” Urban Sci., vol. 2, no. 1, p. 8, 2018. [CrossRef]
- J. Li, X. Huang, L. Tu, T. Zhang, and L. Wang, “A review of building detection from very high resolution optical remote sensing images,” GISci Remote Sens, vol. 59, no. 1, pp. 1199–1225, 2022. [CrossRef]
- J. Cinnamon, “Visual imagery and the informal city: examining 360-degree imaging technologies for informal settlement representation,” Inf. Technol. Dev., vol. 30, no. 4, pp. 590–607, 2024. [CrossRef]
- K. G. Alrasheedi, A. Dewan, and A. El-Mowafy, “Combining local knowledge with object-based machine learning techniques for extracting informal settlements from very high-resolution satellite data,” Earth Syst. Environ., vol. 8, no. 2, pp. 281–296, 2024. [CrossRef]
- N. M. Farda, “Multi-temporal land use mapping of coastal wetlands area using machine learning in Google Earth Engine,” in *IOP Conf. Ser. Earth Environ. Sci.*, vol. 98, p. 012042, 2017.
- J. Wang, M. Kuffer, D. Roy, and K. Pfeffer, “Deprivation pockets through the lens of convolutional neural networks,” Remote Sens. Environ., vol. 234, p. 111448, 2019.
- Z. Zhao et al., “Comparison of three machine learning algorithms using Google Earth Engine for land use land cover classification,” Rangeland Ecol. Manag., vol. 92, pp. 129–137, 2024. [CrossRef]
- J. Lee, K. Kim, and K. Lee, “Multi-sensor image classification using the random forest algorithm in Google Earth Engine with KOMPSAT-3/5 and CAS500-1 images,” Remote Sens (Basel), vol. 16, no. 24, p. 4622, 2024. [CrossRef]
- M. Drusch et al., “Sentinel-2: ESA’s optical high-resolution mission for GMES operational services,” Remote Sens. Environ., vol. 120, pp. 25–36, 2012. [CrossRef]
- A. Ansari and M. H. Golabi, “Prediction of spatial land use changes based on LCM in a GIS environment for Desert Wetlands – A case study: Meighan Wetland, Iran,” Int. Soil Water Conserv. Res., vol. 7, no. 1, pp. 64–70, 2019. [CrossRef]
- C. Polykretis, M. Grillakis, and D. Alexakis, “Exploring the impact of various spectral indices on land cover change detection using change vector analysis: A case study of Crete Island, Greece,” Remote Sens (Basel), vol. 12, no. 2, p. 319, 2020. [CrossRef]
- Nv5, “Spectral Indices,” 2024. [Online]. Available: https://www.nv5geospatialsoftware.com/docs/SpectralIndices.html.
- OpenMRV.org, “Recopilación de Datos de Entrenamiento Usando Google Earth Engine,” 2021. [Online]. Available: https://www.openmrv.org/es/w/modules/mrv/modules_1/training-data-collection-using-google-earth-engine.
- Z. Zhao et al., “Comparison of three machine learning algorithms using Google earth engine for land use land cover classification,” Rangel Ecol Manag, vol. 92, pp. 129–137, 2024. [CrossRef]
- L. Kumar and O. Mutanga, “Google Earth Engine applications since inception: Usage, trends, and potential,” Remote Sens (Basel), vol. 10, no. 9, p. 1509, 2018.
- Y. Chen et al., “Deep learning ensemble for hyperspectral image classification,” IEEE J. Sel. Top. Appl. Earth Obs. Remote Sens., vol. 12, no. 6, pp. 1882–1897, 2019. [CrossRef]
- M. Klaiber, “A fundamental overview of SOTA-ensemble learning methods for deep learning: A systematic literature review,” Sci. Inf. Technol. Lett., vol. 2, no. 2, pp. 1–14, 2021. [CrossRef]
- J. Sun and S. Ongsomwang, “Optimal parameters of random forest for land cover classification with suitable data type and dataset on Google Earth Engine,” Front. Earth Sci. (Lausanne), vol. 11, 2023. [CrossRef]
- W. C. Jochem, T. J. Bird, and A. J. Tatem, “Identifying residential neighbourhood types from settlement points in a machine learning approach,” Comput. Environ. Urban Syst., vol. 69, pp. 104–113, 2018. [CrossRef]
- Bourgoin et al., “Assessing the ecological vulnerability of forest landscape to agricultural frontier expansion in the Central Highlands of Vietnam,” Int. J. Appl. Earth Obs. Geoinf., vol. 84, p. 101958, 2020. [CrossRef]
Figure 1.
Expansion of an informal settlement in the northwestern area of the city of Cúcuta (2015, 2018, 2019, 2022, 2024). Images sourced from Google Earth.
Figure 1.
Expansion of an informal settlement in the northwestern area of the city of Cúcuta (2015, 2018, 2019, 2022, 2024). Images sourced from Google Earth.
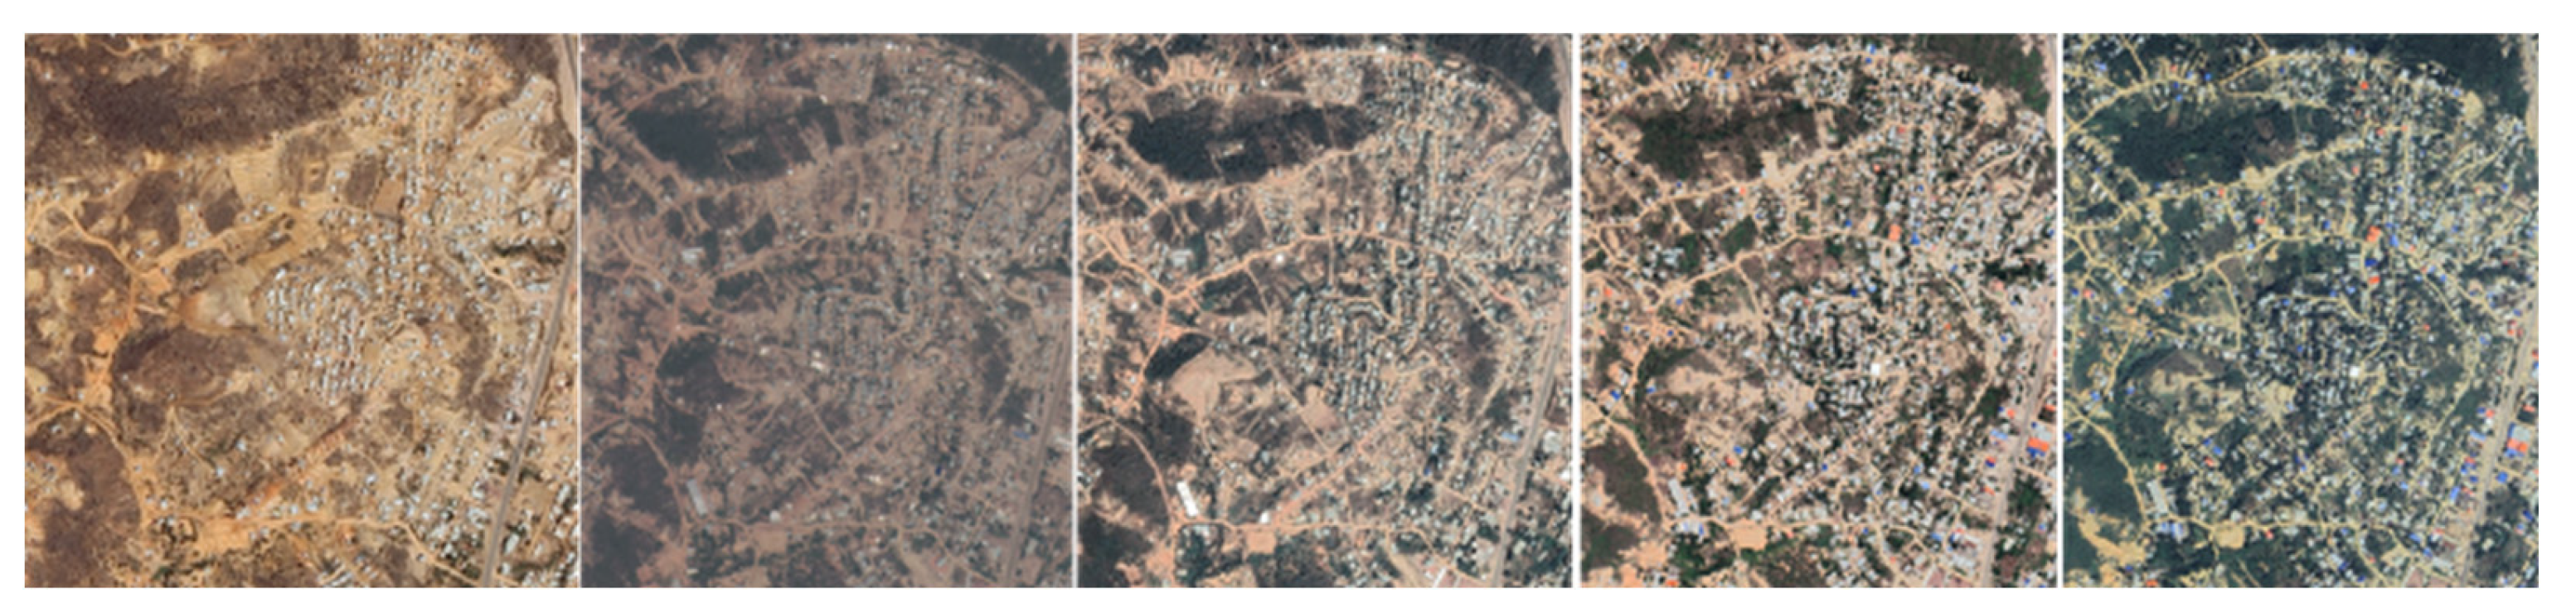
Figure 3.
Urban Expansion in Cúcuta. Source: UNOSAT for ESA/World Bank, 2019.
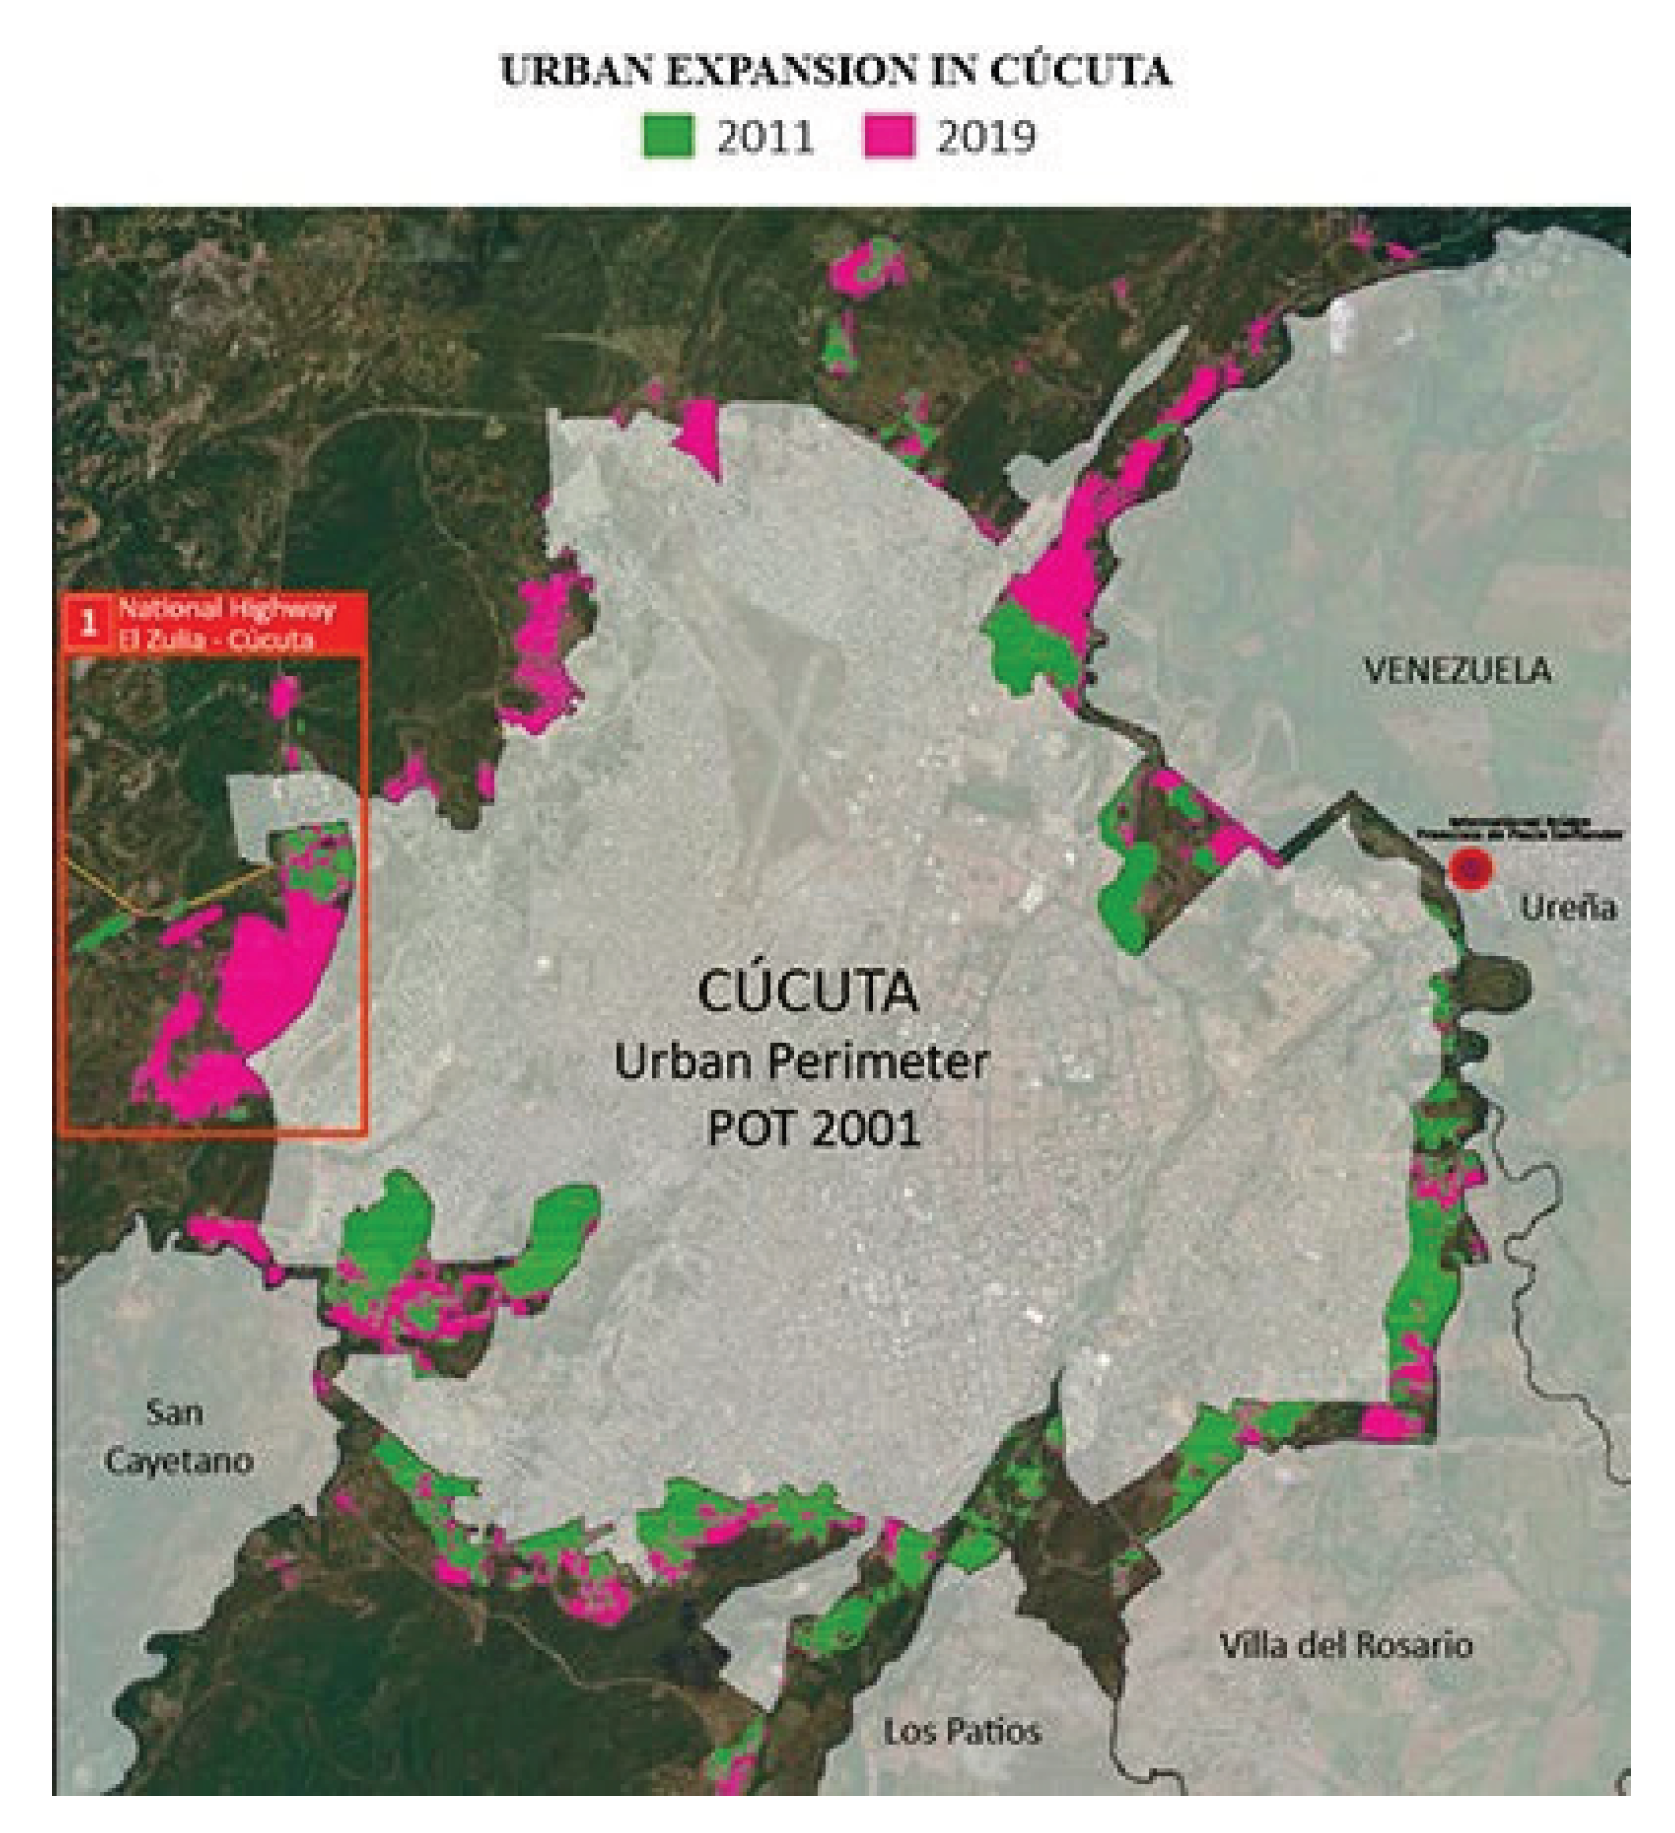
Figure 4.
Example of buildings in informal (L) settlements in the periphery and formal (R) settlements in the city center.
Figure 4.
Example of buildings in informal (L) settlements in the periphery and formal (R) settlements in the city center.
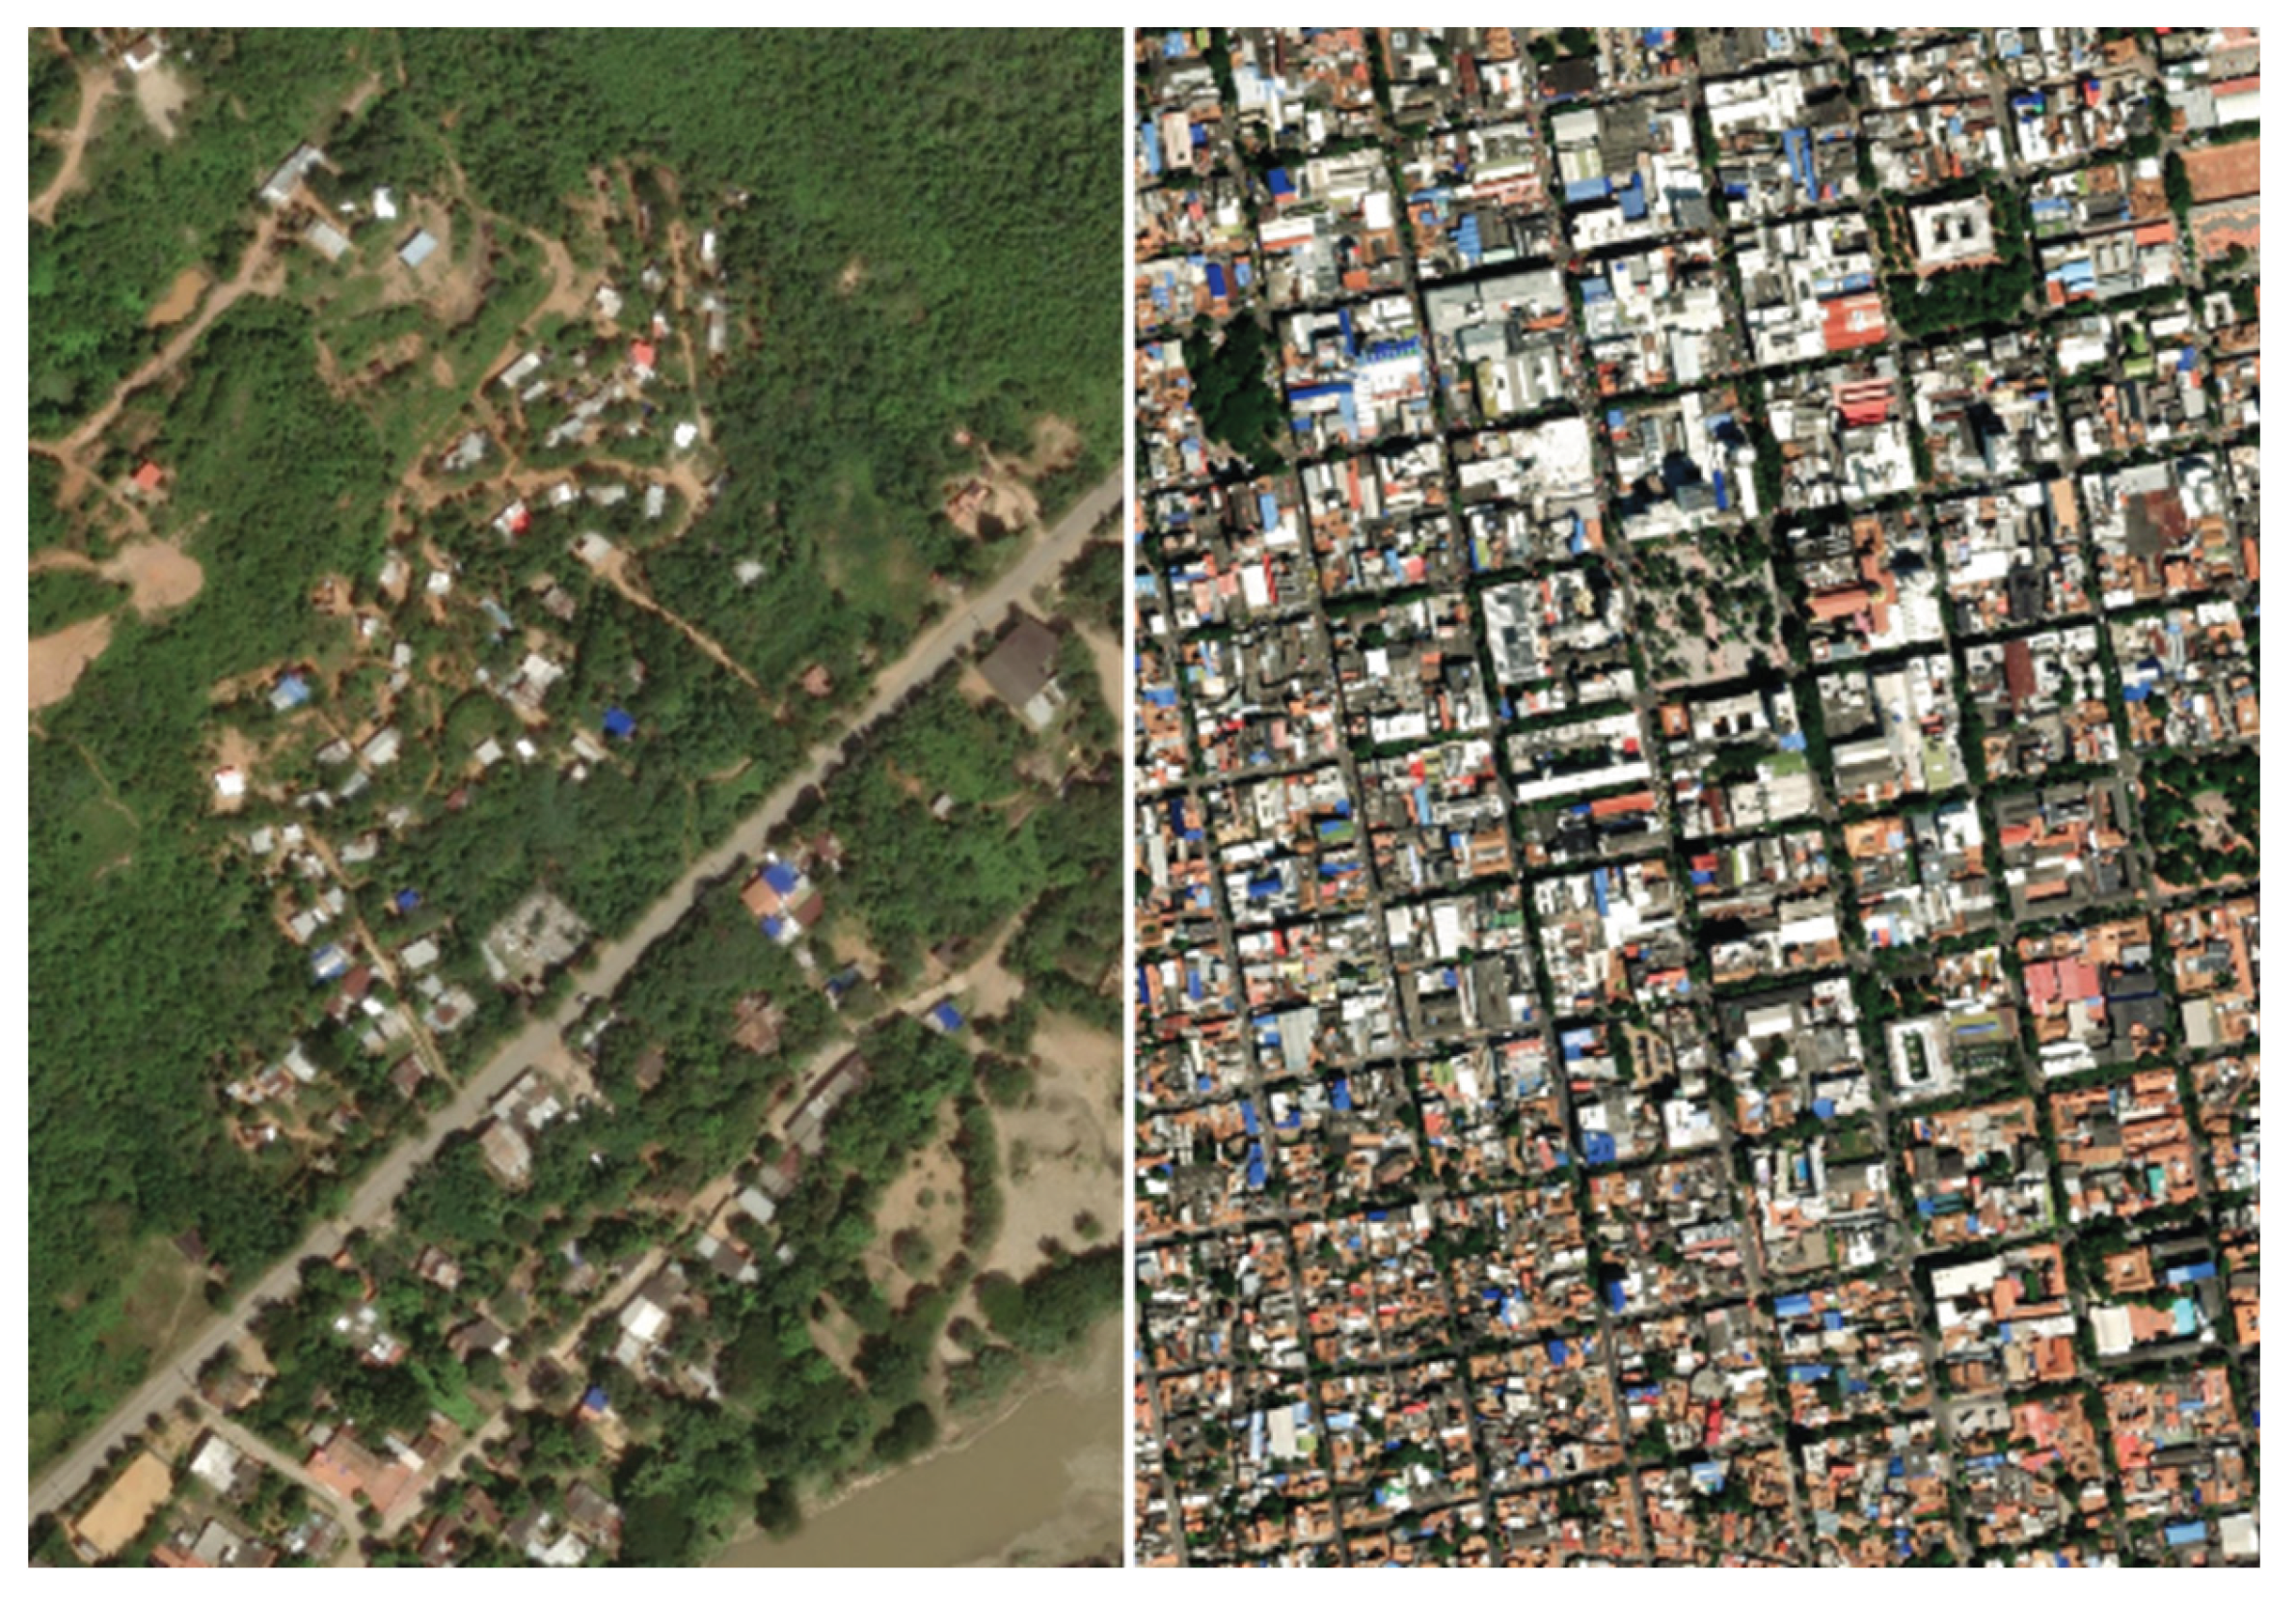
Figure 5.
Data flow diagram Supported in GEE.

Figure 7.
Classified map for the year 2024.
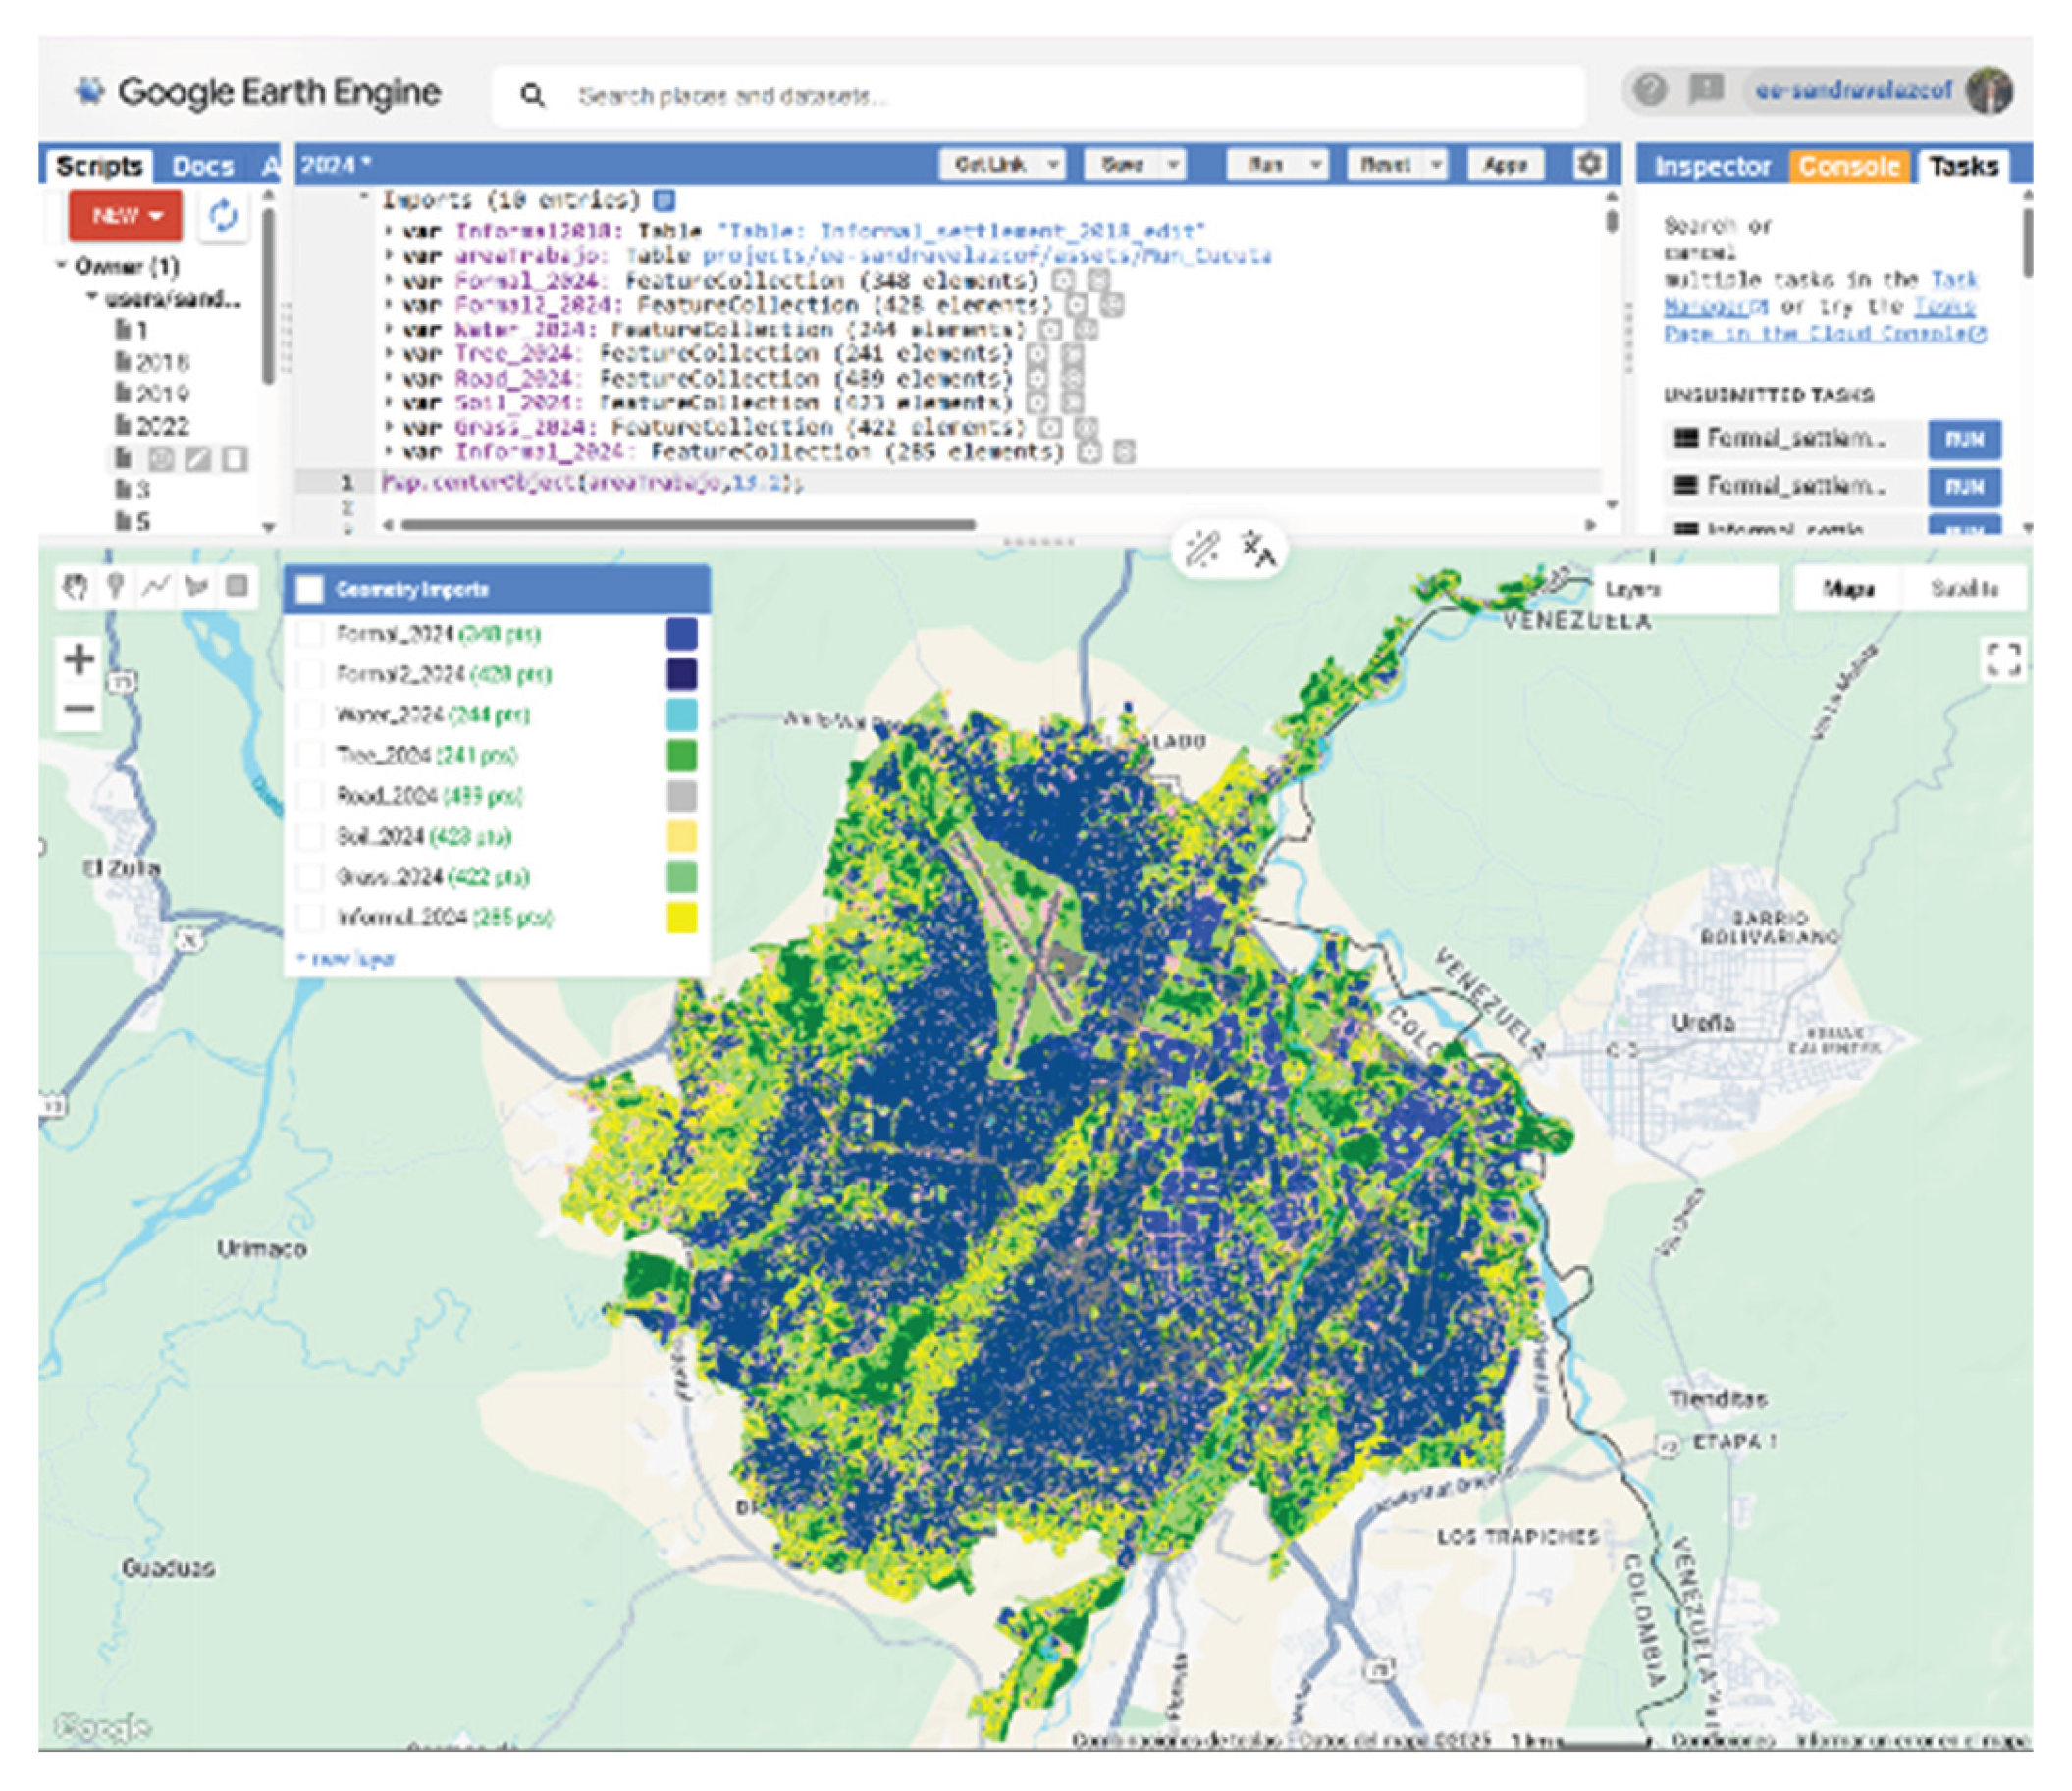
Figure 8.
Refined Image of Informal Settlements for the Periods 2018 (top left), 2022 (top right), 2024 (bottom).
Figure 8.
Refined Image of Informal Settlements for the Periods 2018 (top left), 2022 (top right), 2024 (bottom).
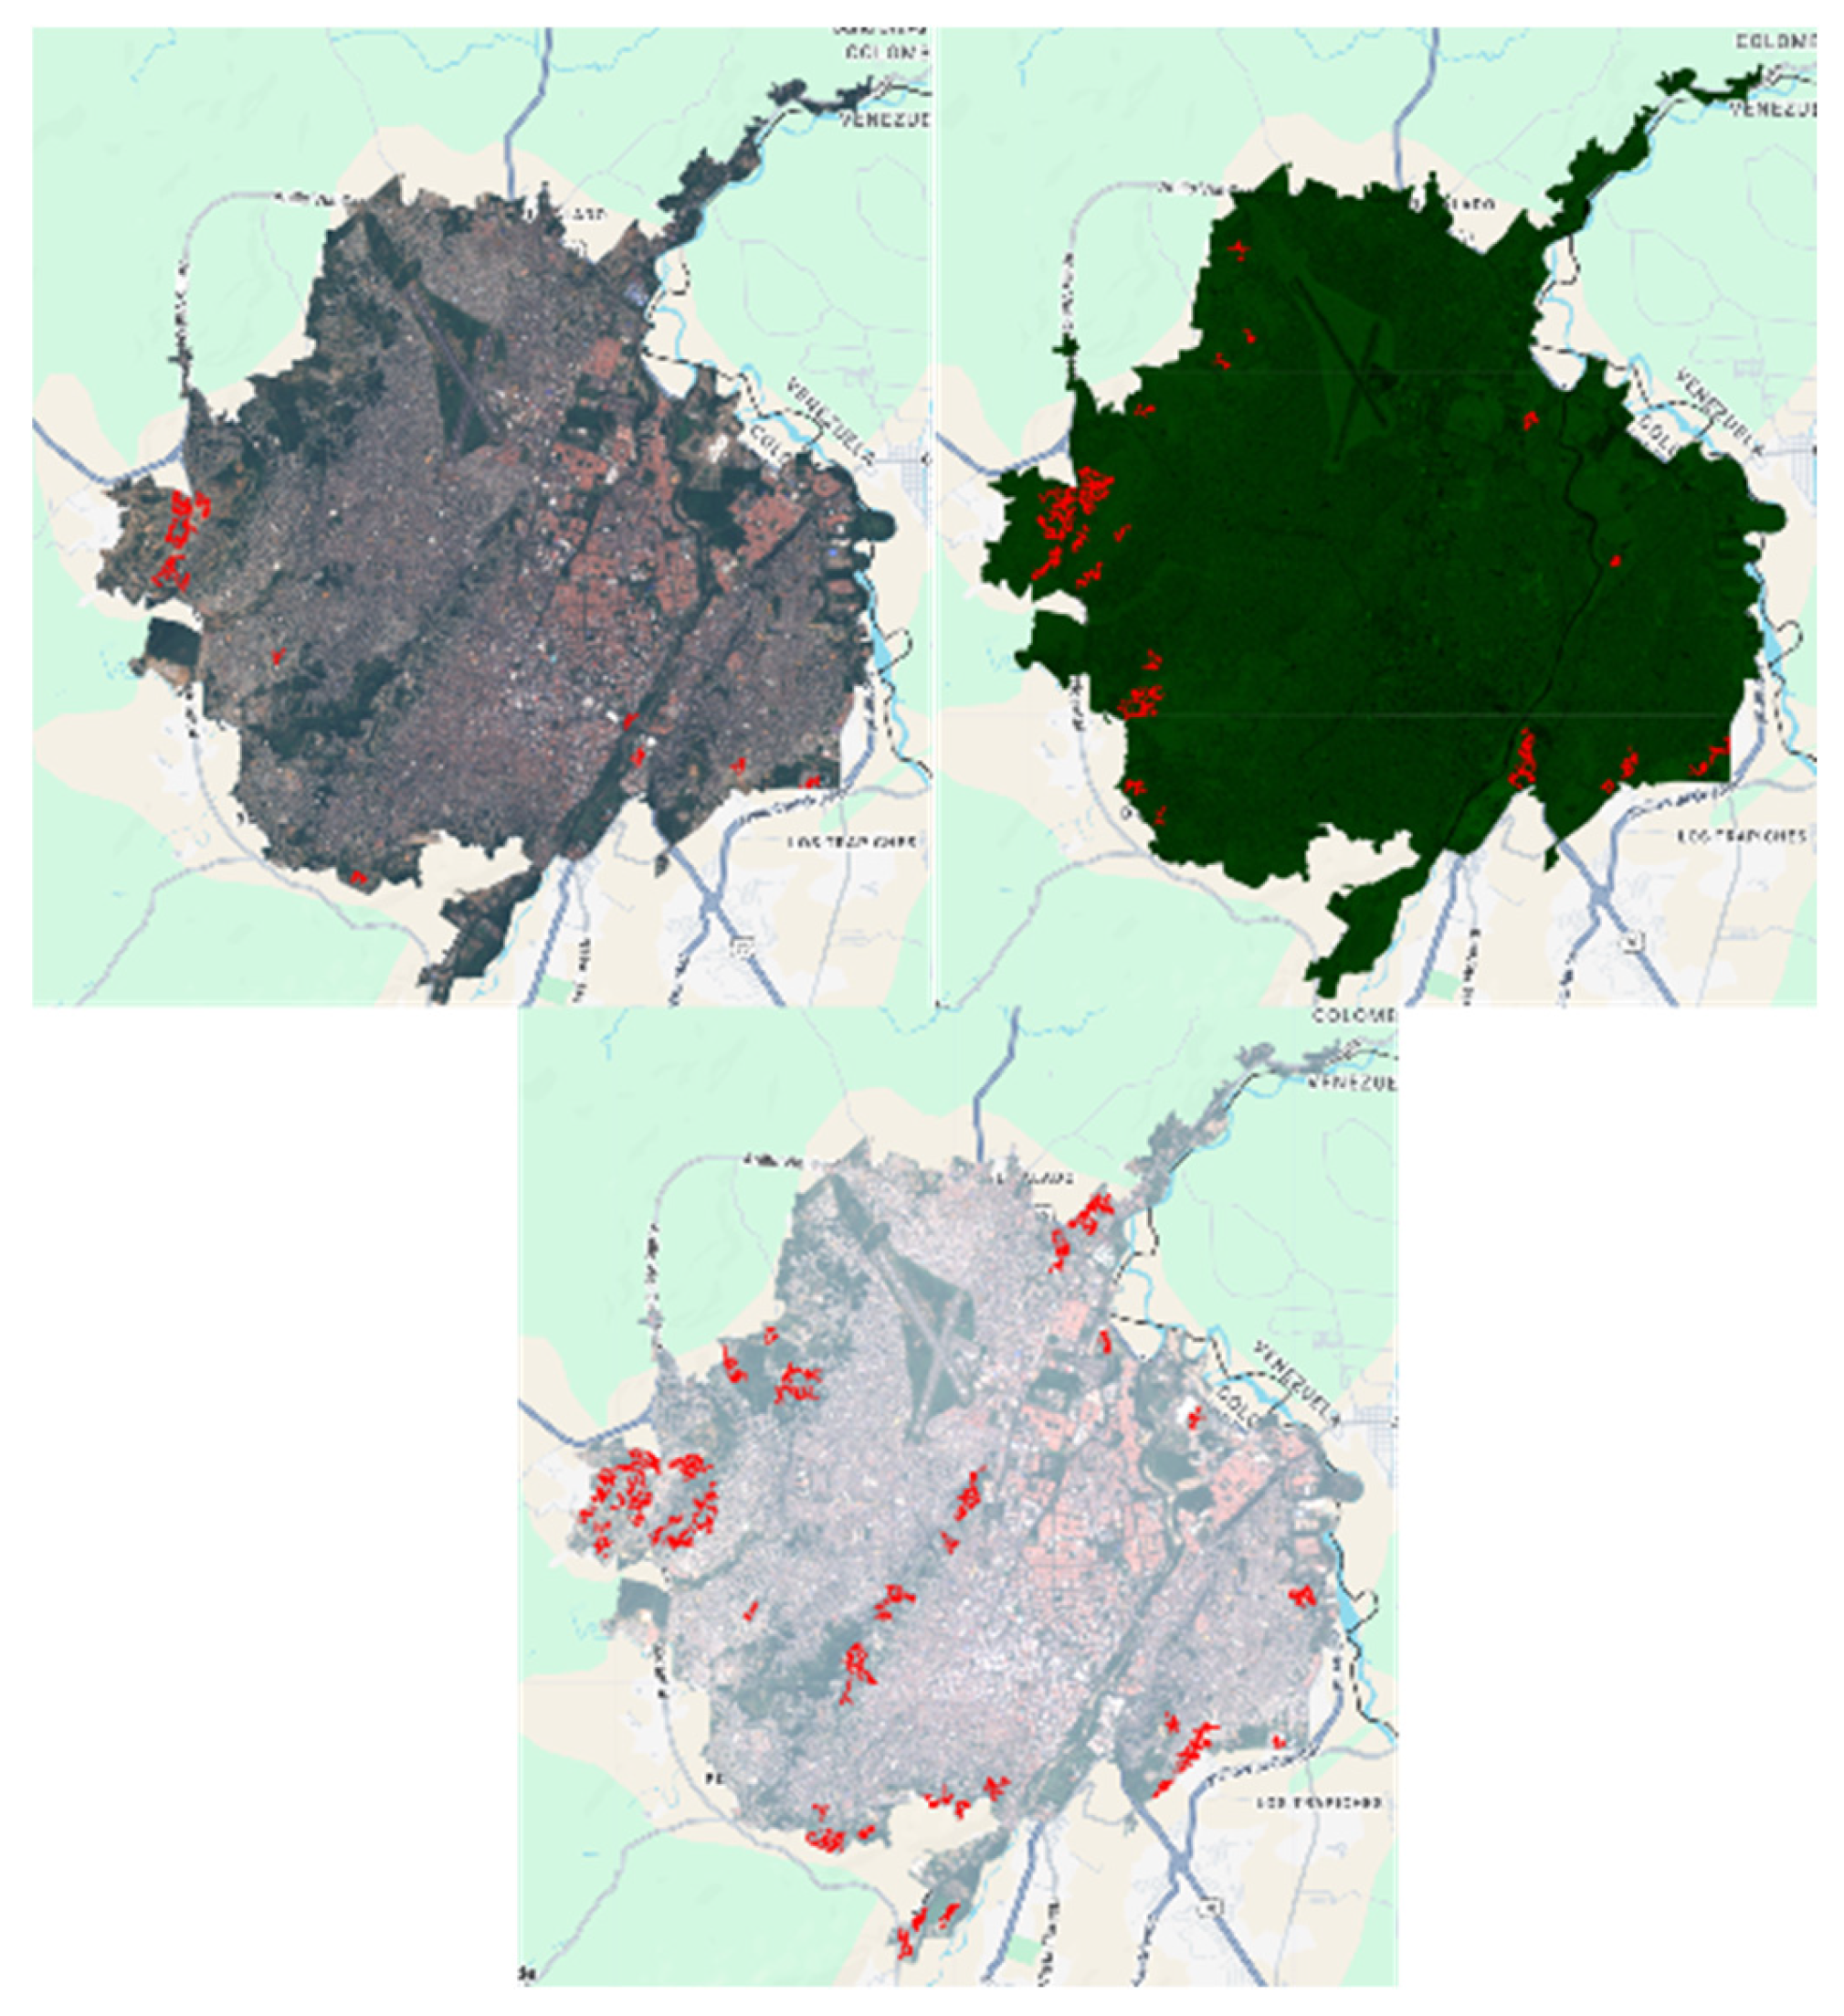
Figure 9.
Comparing the images from the annual periods 2018, 2019, 2022, and 2024.
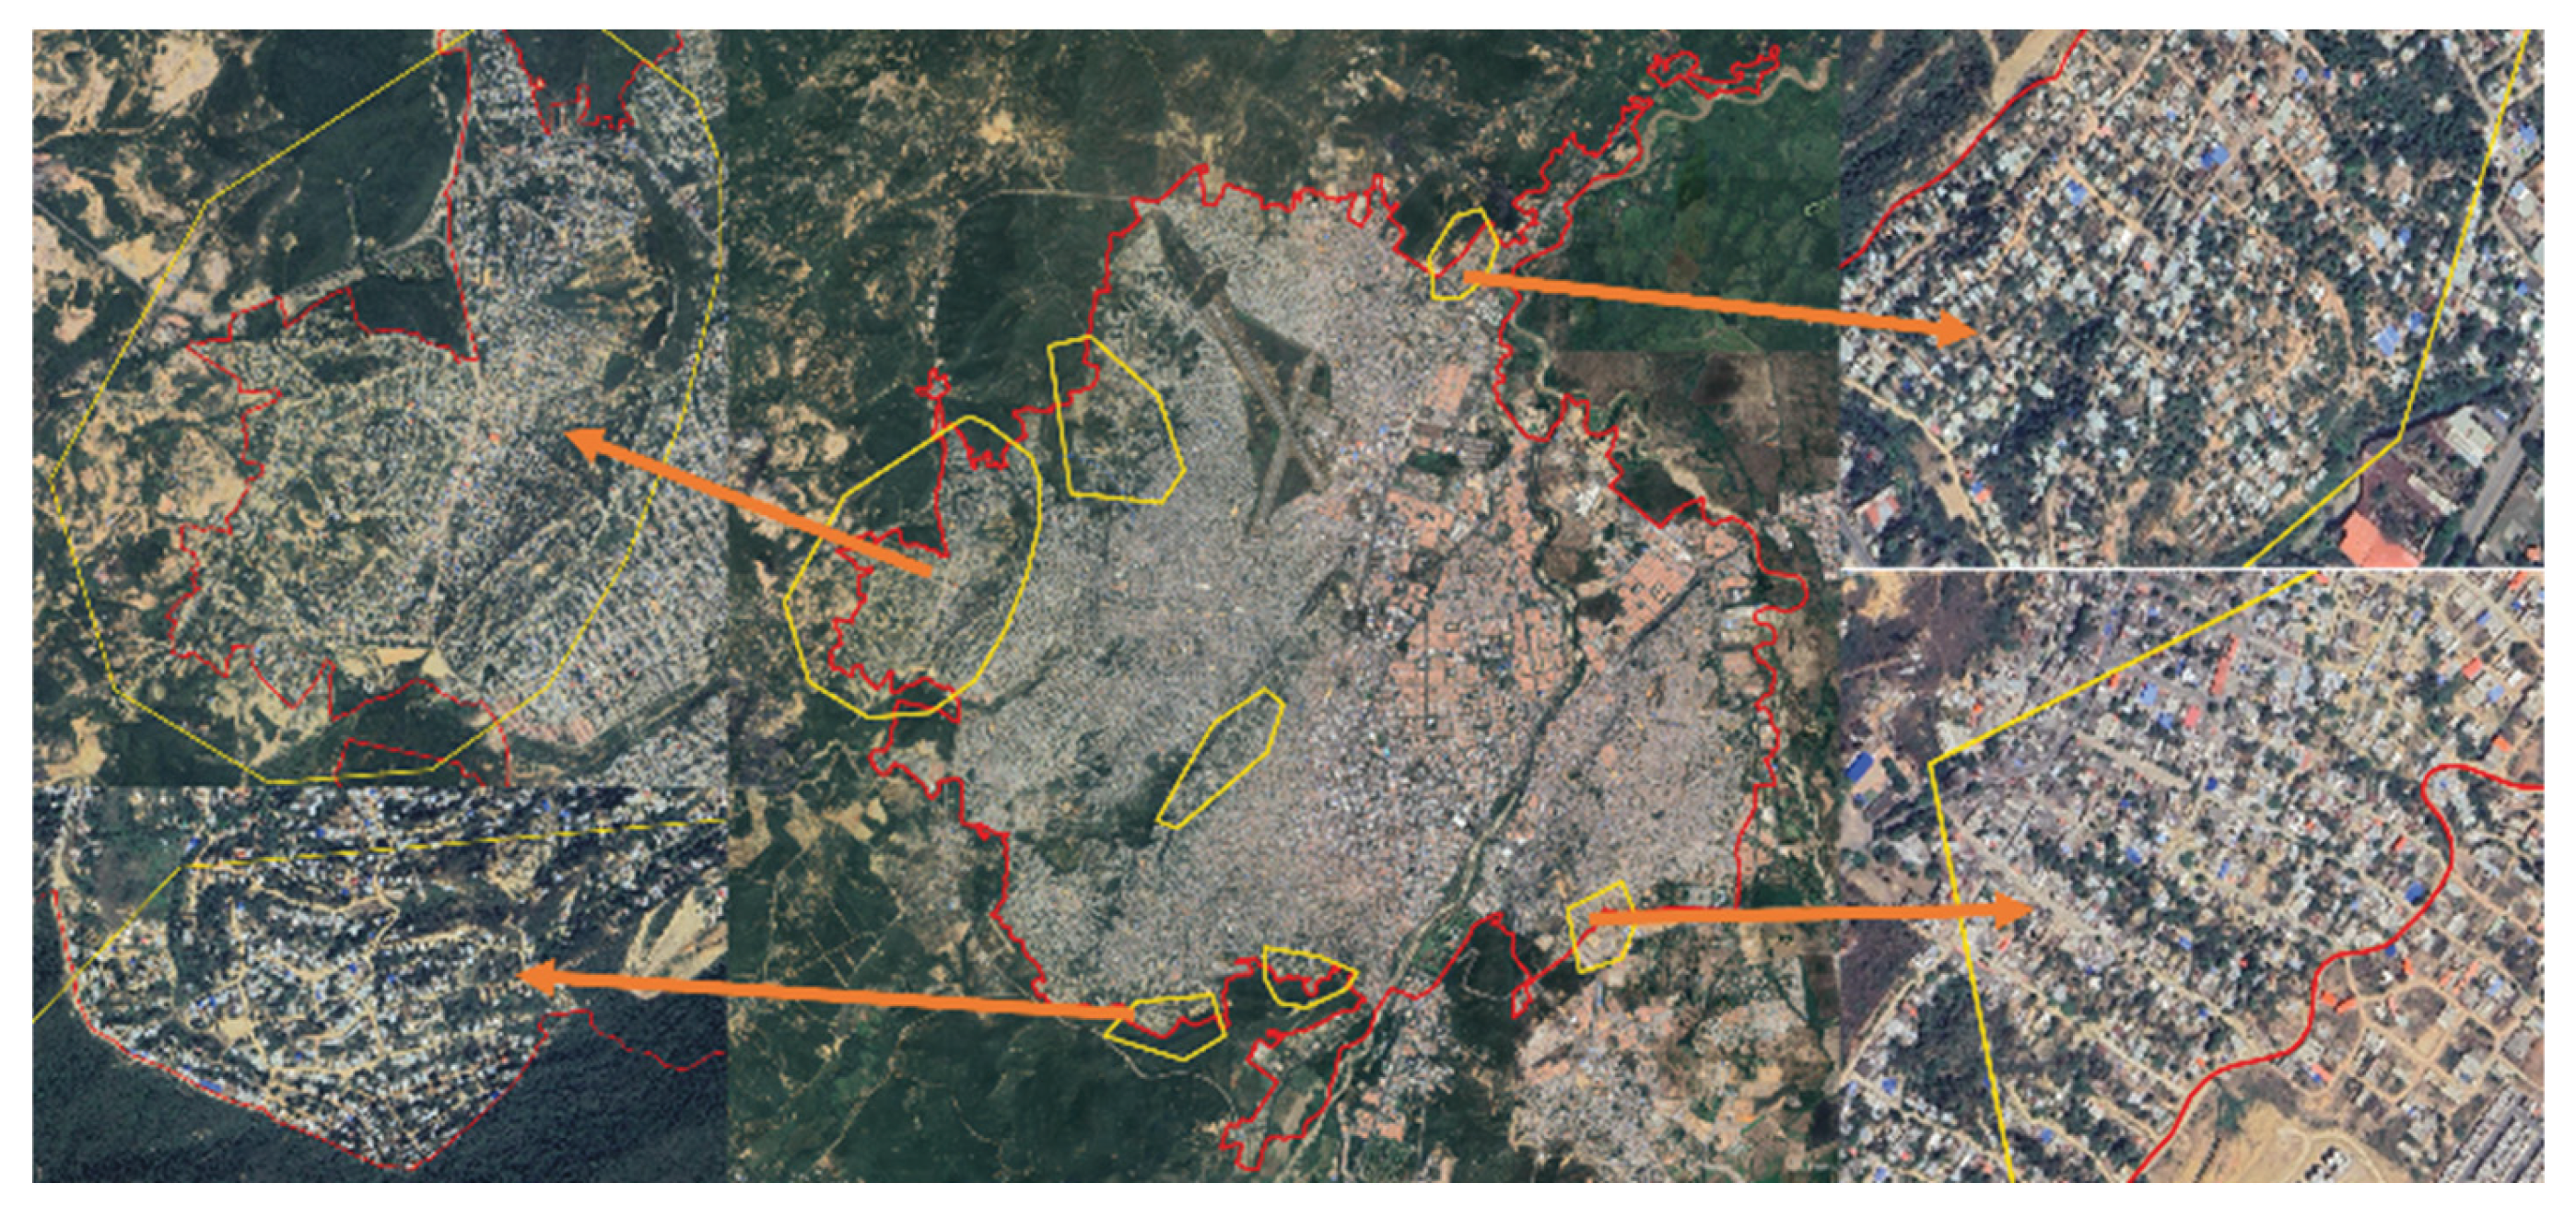
Figure 10.
matrix using for the validation.
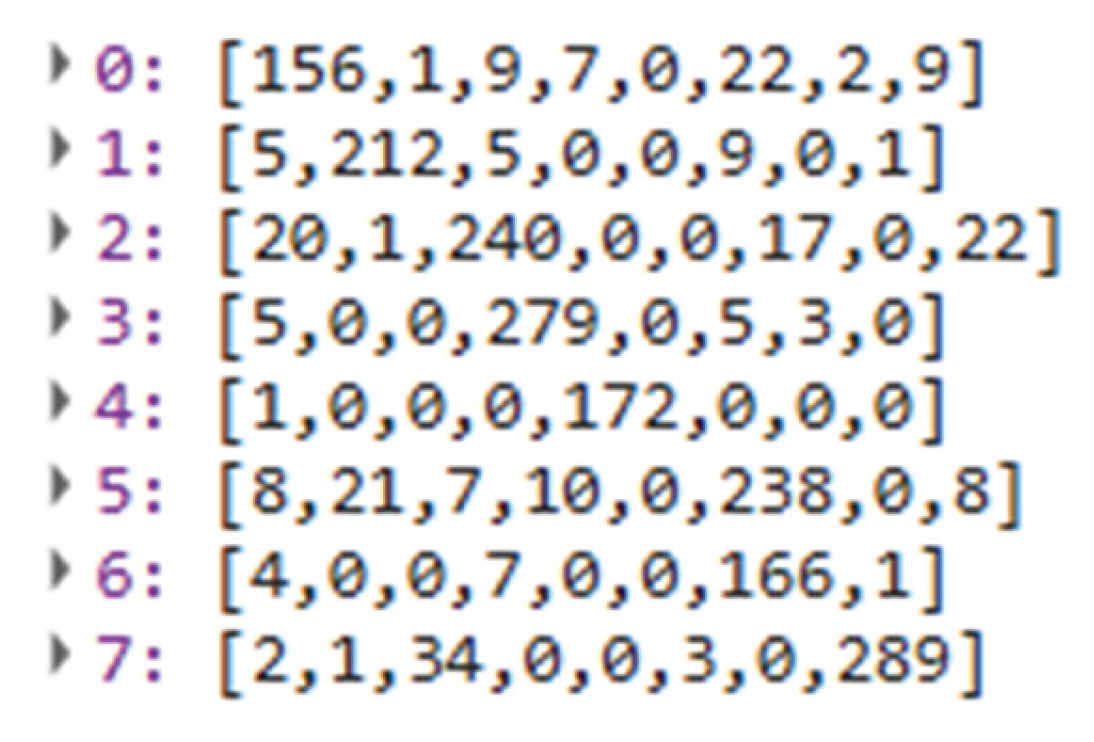
Figure 11.
Graphical representation of the obtained results for class-specific accuracy.

Figure 12.
Percentage of dwellings with dirt floors.
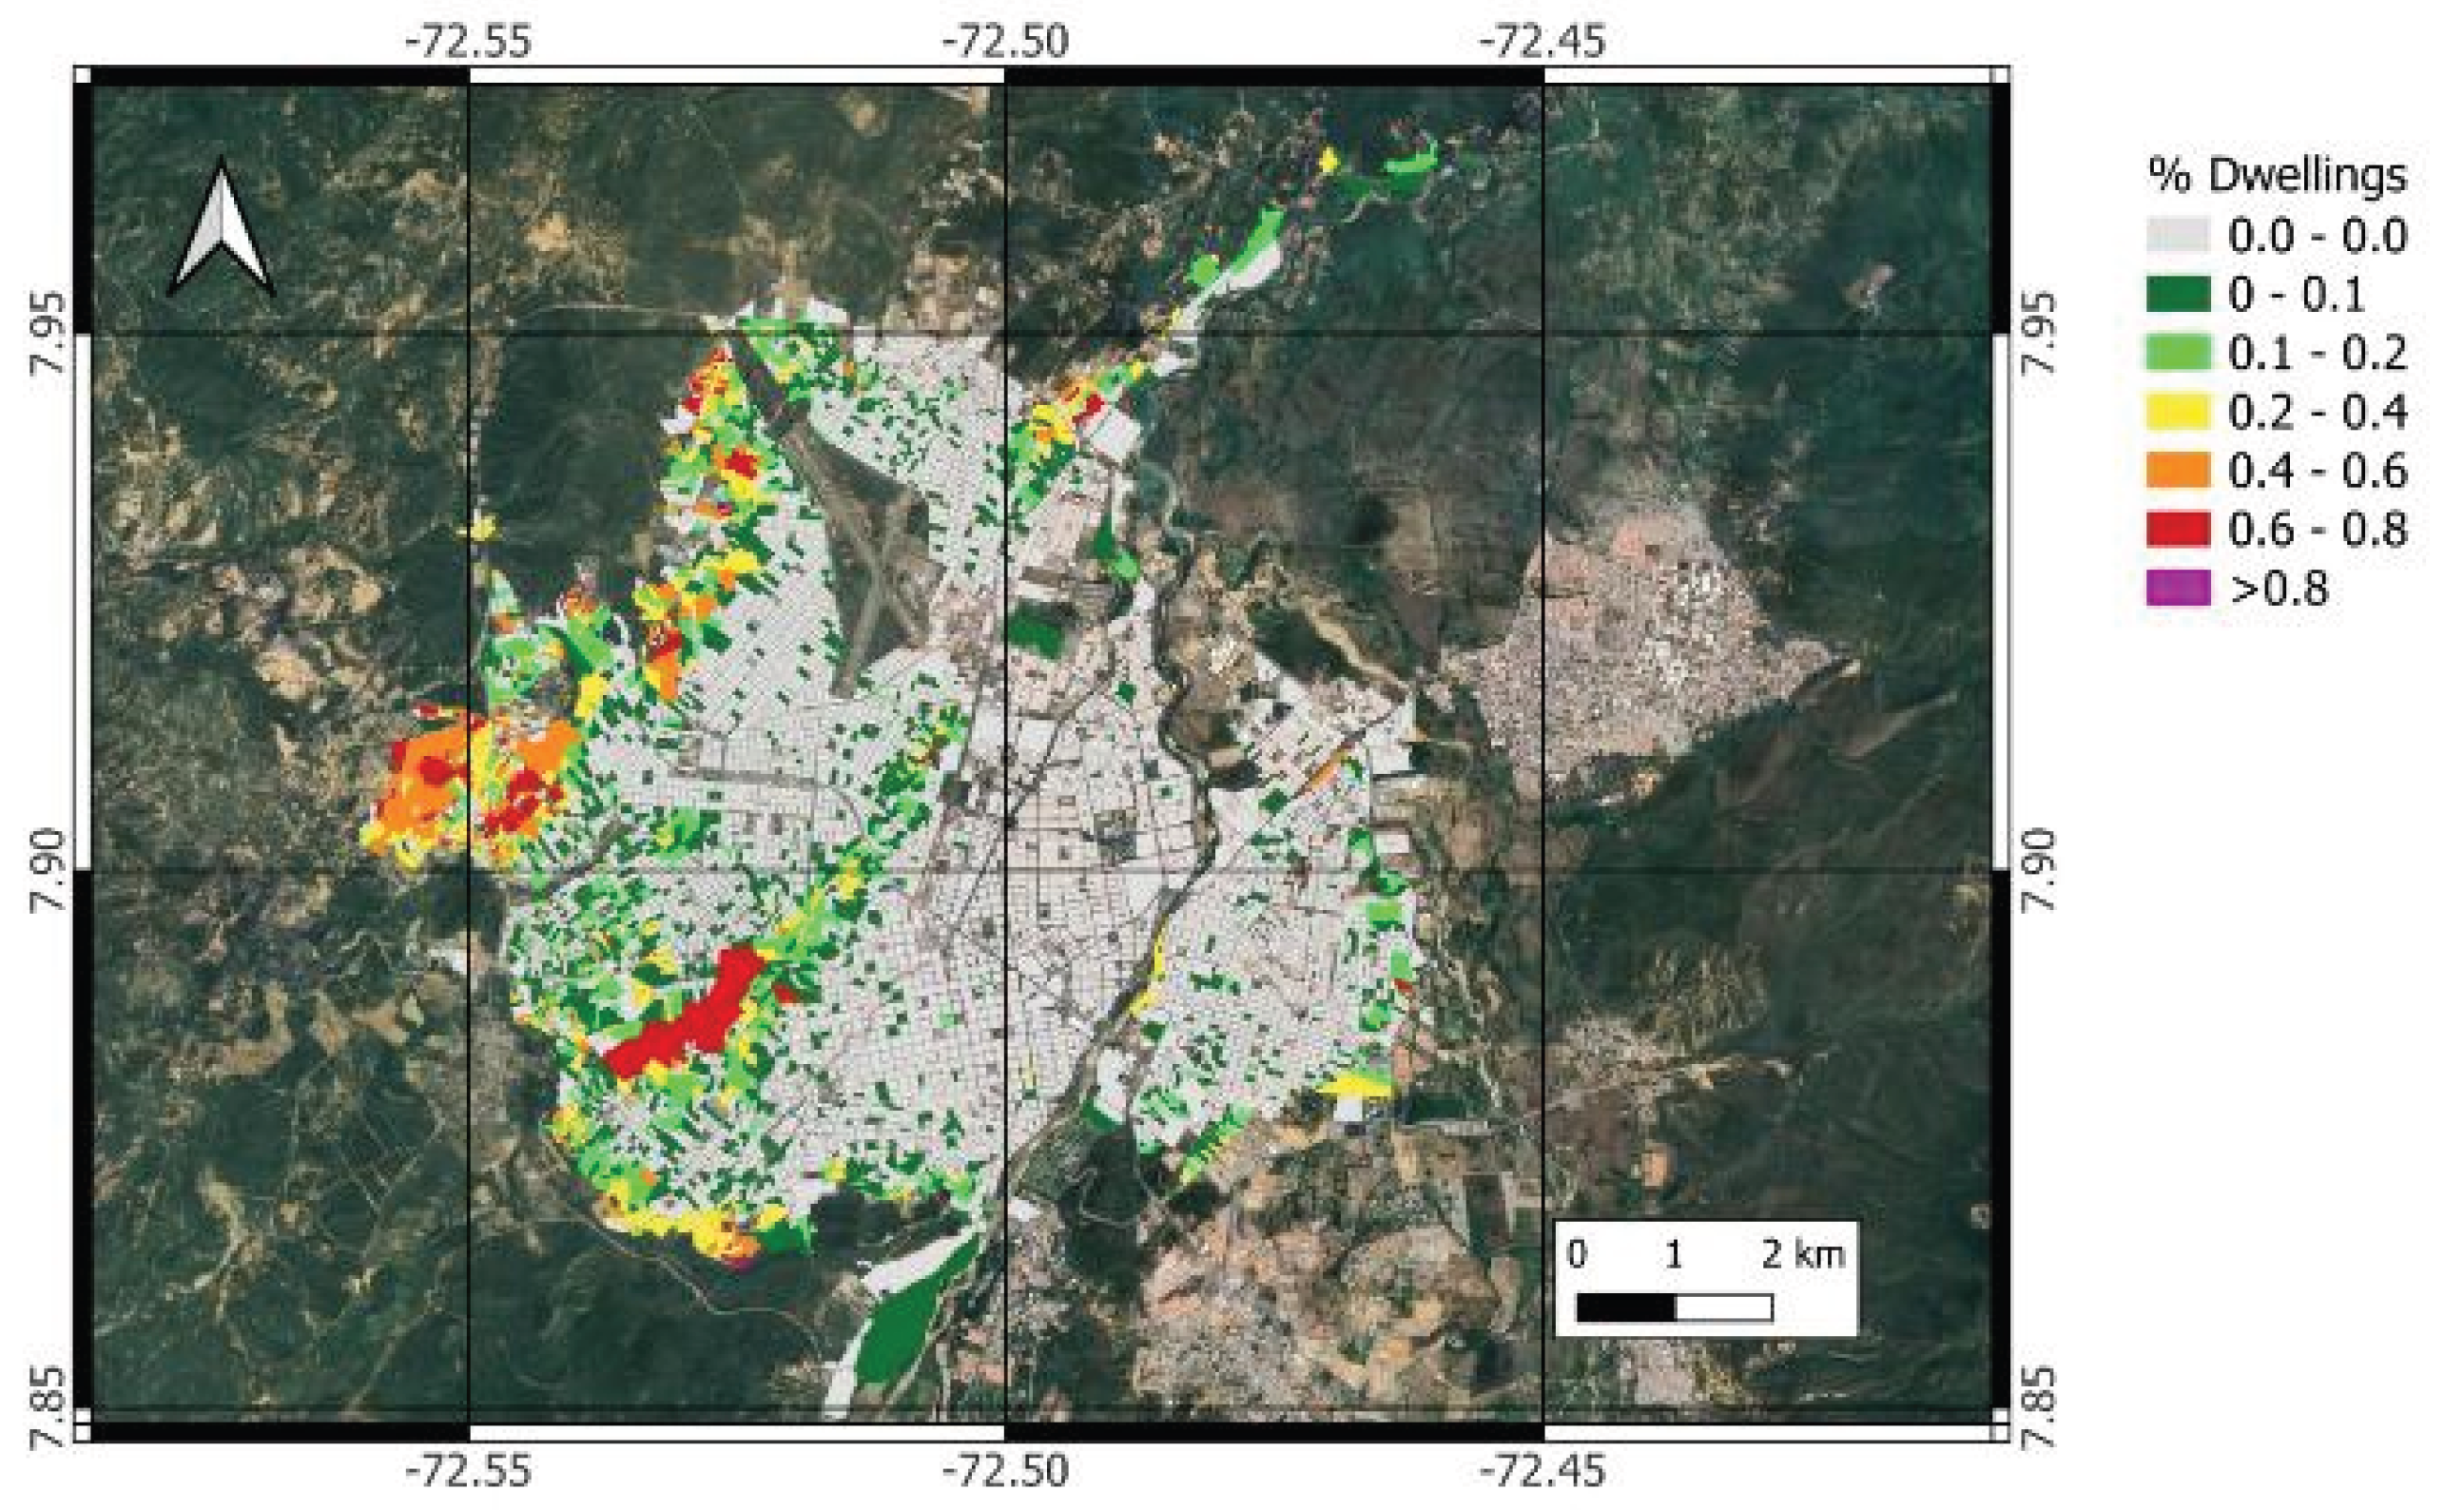

Table 1.
Representative areas for each period identified by the model.
| YEAR | Area m2 | Area Hectares |
|---|---|---|
| 2018 | 880444.40 | 88.044 |
| 2022 | 1645431.29 | 164.54 |
| 2024 | 2602389.47 | 260.24 |
Table 2.
Producer’s Accuracy for each of the classes.
| Class | Producer’S Accuracy |
|---|---|
| 0 | 75.73% |
| 1 | 91.38% |
| 2 | 80.00% |
| 3 | 95.55% |
| 4 | 99.42% |
| 5 | 81.51% |
| 6 | 93.26% |
| 7 | 87.84% |
Table 3.
User’s Accuracy for each of the classes.
| CLASS | USER’S ACCURACY |
|---|---|
| 0 | 77.61% |
| 1 | 89.83% |
| 2 | 81.36% |
| 3 | 92.08% |
| 4 | 100.00% |
| 5 | 80.95% |
| 6 | 97.08% |
| 7 | 87.58% |
Disclaimer/Publisher’s Note: The statements, opinions and data contained in all publications are solely those of the individual author(s) and contributor(s) and not of MDPI and/or the editor(s). MDPI and/or the editor(s) disclaim responsibility for any injury to people or property resulting from any ideas, methods, instructions or products referred to in the content. |
© 2025 by the authors. Licensee MDPI, Basel, Switzerland. This article is an open access article distributed under the terms and conditions of the Creative Commons Attribution (CC BY) license (http://creativecommons.org/licenses/by/4.0/).
Copyright: This open access article is published under a Creative Commons CC BY 4.0 license, which permit the free download, distribution, and reuse, provided that the author and preprint are cited in any reuse.


