
Submitted:
19 July 2025
Posted:
22 July 2025
You are already at the latest version
Abstract
Background: Road Traffic Accidents (RTAs) are considered as one of the leading causes of morbidity and mortality worldwide. Even minor to moderate injuries due to RTAs may have short-term and long-term impacts on physical health and psychosocial outcomes. Objectives: The study aimed to assess the immediate and short-term physical and psychosocial complications among RTA victims admitted to the Level I Trauma Care Center of a Tertiary Care Hospital in Kolkata, West Bengal. Materials and methods: A longitudinal study was conducted for 24 months among 52 hospitalized RTA victims, aged ≥ 18 years, followed up at 1-, 3- and 6 months post-discharge from the hospital. Validated measurement scales were used to assess disabilities, Post-Traumatic Stress Disorder (PTSD) status, social impact, and economic impact. Results: Mean (± SD) age of the RTA victims was 31.3 (± 12.9) years. Of the RTA victims, 81% suffered a fracture, mostly comminuted in nature, and 33% had head injuries. 96% of participants who rode a two-wheeler did not use helmets at the time of RTA, and only 1 (8.3%) reported using seatbelts while driving a vehicle. The level of disability was low in the 6-months of follow-up. However, PTSD was present in 87%, 94% and 60% of patients after 1 month (1st visit), 3 months (2nd visit) and 6 months (3rd visit) of follow-up, respectively. Head injury was significantly associated with PTSD severity at the 1st (p = 0.01) and the 3rd follow-up (p = 0.007). The socioeconomic impact following RTA was ‘low’ among 33% at the 2nd follow-up, while it was ‘high’ among 85% at the 3rd follow-up. Conclusion: RTAs can lead to physical, psychosocial, and financial impacts among the victims. Rigorous law enforcement and public awareness building for safe driving and seatbelt use are essential to prevent RTA and associated complications.
Keywords:
road traffic accident
; disability
; PTSD
; socioeconomic impact
; longitudinal study
; follow-up
1. Introduction
According to the World Health Organization, road traffic accidents (RTAs) are among the leading causes of death in children and young adults aged 5-29 years [1]. Every 24 seconds, one person is killed in a road accident, which translate to 1.35 million deaths per day worldwide. Globally, more than 500 children under the age of 18 die on the road each day [2].
Data in developing countries are more shocking. More than 90% of the world’s road traffic fatalities occur in low- and middle-income countries [1]. India continues to lead on road accidents fatalities globally, with a 4.2% increase in crashes, and a 2.6% increase in fatalities in 2023 when compared with the country data on road accidents in the previous year [3]. Unsafe driving, including speeding, driving under influence, non-use of motorcycle helmets and seatbelts, and distracted driving are common causes of RTA. In addition to human behaviors, unsafe road infrastructure, unsafe vehicles, inadequate law enforcement of traffic laws, etc. play a critical role in road traffic injuries [1,2].
RTAs often result in dreadful consequences where members of a whole family including RTA survivors, their parents, friends, and other caregivers often suffer from adverse physical, social, and psychological effects [4,5]. Longitudinal studies on RTA victims have revealed that psychological factors, including emotional and cognitive perceptions, are negatively associated with functional outcomes more commonly following head injury and lower extremity trauma [6,7]. Studies have also shown that involvement in RTA may put individuals at increased risk for long-term psychosocial disorders, including anxiety, depression, and Post Traumatic Stress Disorder (PTSD). Particularly, PTSD is now a significant public health concern among RTA survivors. PTSD is characterized by re-experiencing the traumatic event in the form of vivid dreams, disturbing memories, flashbacks, or nightmares, which are accompanied by strong or overwhelming emotions, particularly fear or horror, and intense physical sensations [8,9]. The physical and psychological effects of RTAs can impact a person’s work capacity, financial stability, and social productivity [10]. Interestingly, PTSD has been linked to a bidirectional signaling between the gut and the brain, resulting in an increased risk of physical health disorders such as irritable bowel syndrome and other disorders [11]. Additionally, involvement in injury compensation claims processes is associated with poorer post-injury physical and psychological health [12]. RTA-related hospital expenses, loss of income, and loss of work could create a major financial burden for trauma victims and the affected families [12,13].
This study aimed to address the magnitude of disability, PTSD, and social-, and economic complications among RTA victims within 6 months of post-discharge from a trauma care center of a tertiary care hospital in West Bengal, India. The overarching goal of this project was to suggest comprehensive management and preventive measures for RTAs based on the data generated from the study.
2. Materials and Methods
2.1. Study Design and Participants
This longitudinal study was conducted from July 2022 to June 2024. Phase I of the study was carried out at the Level I Trauma Care Center of the Institute of Post Graduate Medical Education and Research (IPGME&R) and Seth Sukhlal Karnani Memorial (SSKM) Hospital, Kolkata, West Bengal. Phases II-IV (described later) involve follow-up studies of the RTA victims at different time-points after the hospital discharge.
Approximately 6000 adults with significant injuries due to RTA per year are admitted to the hospital. Inclusion criteria included adults aged 18 years or older, either gender, and the hospitalized RTA-victims who had Glasgow Coma Score (GCS) [14] of 9 or more after 48 hours of admission. Exclusion criteria were RTA patients with GCS ≤ 8, and those who did not give informed written consent for participating in the study. A written informed consent was obtained before enrollment.
2.2. Ethical Procedures
The research protocol was approved by the Institutional Ethics Committee (IEC) of IPGME&R and SSKM Hospital in Kolkata, West Bengal (Memo No. IPGME&R/IEC/2022/462, dated 07/11/2022). The eligible RTA victims were admitted to the Level I Trauma Care Center of the hospital. Patients (or their legal guardians/close relatives) were explained the purpose of the study. A written informed consent was taken from the patient or guardian/close relatives of a severely injured study participant before enrollment of the patient to the study.
2.3. Sample Size Estimation
The major outcome variable for the sample size estimation was the prevance of PTSD after RTA. The sample size (n) was calculated using the standard formula for a cross-sectional study, which is as follows [15]:
Here, Z = 1.96, with Type-1 error as 5% or 0.05. An average prevalence of 0.5 of the relevant risk factors reported by various studies of RTA in India [5]; q = (1- p) = 0.5; d absolute precision = 0.15.
The calculated sample size was 43. After considering a 20% loss to follow-up, the final sample size was calculated to be 52. Thus, the final estimated sample size was about 10% of the total eligible population during the study period.
2.4. Data Collection Instruments
Data collection instruments (questionnaires) are presented in Appendix I. Data included three components:
- A.
- Socio-demographic data – Data were collected at the time of enrollment. The variables included age, gender, religion, occupation, residence, education, income, etc.
- B.
- Details of RTA, type of injury, and clinical data – Data were collected during the hospital stay of the victim. According to the type of accident, RTAs were divided into motor vehicle accidents (MVAs), non-MVAs, pedestrian accidents, and passenger accidents. MVAs include car accidents, motorcycle accidents, tram accidents, tractor accidents, special mechanical accidents, etc. Non-MVAs consisted of rickshaw accidents, bicycle accidents, etc. Pedestrian and/or passenger accidents refer to accidents in which pedestrians and/or passengers were primarily responsible.
- C.
- Follow-up data: Four types of data instruments were vital for the outcome measurements of this study. They included 1) Disability Assessment by using the World Health Organization Disability Assessment Schedule 2.0 (WHODAS 2.0) [14]; 2) PTSD Checklist for DSM 5 (PCL-5) [16]; 3) Social Impact Data; and 4) Economic Impact Data.
WHODAS 2.0 Scale
WHODAS 2.0 [14] is a validated scale developed by the WHO, which includes 36-items to measure disability in patients aged 18 years and older. The variables assessed an overall disability based on six domains, including understanding and communicating, getting around, self-care, getting along with people, life activities (i.e., household, work, and/or school activities), and participation in the society.
Each item of the WHODAS 2.0 involves the individual to rate how much difficulty he/she has had in specific areas of functioning during the past 30 days. The scores assigned to each of the items were “none” (0), “mild” (1), “moderate” (2), “severe” (3), and “extreme” (4). The summary score was the combined value of six domains.
The higher the score, the greater the disability was. WHODAS 2.0 provides a common metric of the impact of any health condition in terms of functioning. Being a generic measure, the instrument does not target a specific disease. It can thus be used to compare disability due to different diseases or events.
The measurement scale was validated earlier in the Asian population [17]. The WHODAS 2.0 scale had excellent reliability in the overall sample and good to excellent reliability across conditions. The test-retest reliability and agreement between self-administered and interviewer-administered modes were good. The WHODAS 2.0 scores had moderate to strong correlations with the Social and Occupational Functioning Scale and the Sheehan Disability Scale scores in the overall sample and across four conditions.
Findings suggest that WHODAS 2.0 [14] is a valid tool to measure functioning and disability in those with schizophrenia, anxiety, depression, and diabetes. This validated scale was used in the current study to assess the overall disability status of the RTA victims across various domains post-injury, instead of focusing solely on the physical aspect.
An overall summary score was calculated and was converted into a scale ranging from 0 to 100 (where 0 = no disability; 100 = full disability). A percentile score is calculated using the WHODAS 2.0 percentile score that allows for a comparison to a large sample [14]. The level or severity of disability was categorized as ‘very low’ for scores ≤ 25th percentile, ‘low’ for scores between the 26-49th percentile, 50th percentile as ‘moderate’ (average disability), 50-75th as ‘high’ and ≥ 75th percentile score as ‘very high’ level of disability.
PCL-5 Checklist (for PTSD)
The PCL-5 checklist is a psychometric validation of 20-item self-reported measure for DSM-5 symptoms of PTSD [18,20]. PCL-5 has been validated in South Asian populations [19]. This self-reported scale is 0-4 for each symptom. Rating scale descriptors are: “not at all,” “a little bit,” moderately,” “quite a bit,” and “extremely”. The PCL-5 can determine a provisional PTSD diagnosis by the following criteria: summing up all the 20 items (range 0-80) and using a cut-off score of 31-33 based upon current psychometric work on the scale [19]. Higher the cut-off point, more stringent will be the criteria.
In the current study, we used the total scoring criteria by adding individual item scores. Based on the cut-off score of 33 of PTSD diagnosis in the South Asian populations [19], we used the same cut-off point for making a provisional diagnosis of PTSD. Thus, a total score ≥ 33 is considered as ‘PTSD present’ and a score ≤ 32 as ‘PTSD absent’.
Assessment of the Socioeconomic Impact of RTA
This questionnaire included separate assessments for social and economic impacts.
- 1)
- Social Impact Data – The questions were as follows: Was the victim being neglected by family/friends/neighbors/other acquaintances following RTA?; Was the victim made fun of/insulted by others following the RTA? Did the victim receive any rehabilitative services?
- 2)
- Economic Impact Data – There were 8 questions related to absence from a job, reduced workload, change of job, wage loss, and out-of-pocket expenses. Each item under the socioeconomic impact domain was given a score of ‘1’ for a ‘yes or positive’ response, and ‘0’ for a no or negative response
2.5. The Study Protocol
The study was carried out in four phases:
Phase I: Data were collected by face-to-face interviews of the eligible study participants admitted at the Level I Trauma Care Centre. Data collection was conducted on two randomly selected days in a week (Tuesday and Saturday) for 5 consecutive weeks, and for three randomly selected days on the 6th subsequent week (Tuesday, Thursday, and Saturday). 4 RTA victims, who fulfilled the selection criteria, were interviewed consecutively on each day of data collection for 6 weeks to achieve the desired sample size of 52.
Phase II (1-month post-discharge): The 1st follow-up visits after 1 month of post-discharge were scheduled for each study participant at the Outpatient Departments (OPDs) of Orthopedics, General Surgery, Neuromedicine, and Neurosurgery from 9:30 A.M.- 2 P.M. If any participant did not show up on the scheduled day of follow-up visit at the OPD, he/she was contacted by telephone and advised to come the next day. If the next day happened to be a Sunday (weekend), the participant was advised to attend the respective OPDs on Monday or any day of the following week.
Phase III (3 months post-discharge): This phase (2nd follow-up) of the study was carried out after a period of 3 months of discharge of the victim from the Trauma Centre. Data collection was undertaken by telephone interview using the WHODAS 2.0 and PCL-5 scales. In addition, the socioeconomic impact of RTA on each participant was also assessed in this phase.
Phase IV (6 months post-discharge): The final phase (3rd follow-up) of the study was carried out after a period of 6 months from the discharge of the victim from the Trauma Care Centre. Data were collected again through telephone interviews using the WHODAS 2.0 and PCL-5 scales. The socioeconomic impact of RTA was also assessed during this visit.
2.4. Statistical Methods
Data were tabulated in Microsoft Office Excel 2021 (Microsoft Corp, Redmond, WA, USA) and analyzed using the Statistical Package for the Social Sciences, IBM SPSS (Statistics for Windows, Version 25.0. Armonk, NY: IBM Corp. 2017). Descriptive statistics such as Mean (± SD), frequency, and percentage were calculated as applicable. The association between categories of disability status, PTSD, and socioeconomic impact (high or low) during each follow-up period was assessed with the sociodemographic statis using Chi-Square Test. Spearman’s correlation was used to find out the correlation between the disability scores during the 1st and 3rd follow-up, between the PTSD scores during the 1st and 3rd follow-up, and between the socioeconomic impact scores during the 1st and 3rd follow-up periods. Friedman ANOVA Test was employed to check any significant mean differences of scores (by assigning ‘ranks’) between the disability severity, PTSD, and socioeconomic impact scores during the 1st, 2nd,, and 3rd follow-up periods. These groups were categorized pairwise and the differences in scores between the matched pairs of follow-up periods were assessed using the Wilcoxon Matched-Pairs Signed Rank Test. A p-value ≤ 0.05 was considered statistically significant.
3. Results
3.1. Sociodemographic Status
Table 1 shows that the mean ± SD age of the study participants was 31.3 ± 12.9; almost half (51.9%) of the study participants belonged to the age group of 21-30 years and 76.9% of them were males. Around 23% of participants received middle school and higher secondary school education and above. 55.8% of study participants were employed. Almost 44% belonged to the lower-middle (Class IV) socioeconomic class. 27% of participants were unmarried while 4% were divorced. 5 (10%) of the study participants did not have any health insurance scheme. 90% of them had health insurance. None of the study participants were under the influence of any addictive substance at the time of sustaining an RTA.
3.2. Type of Injuries
Most of the participants suffered an RTA during the night (38.5%, n=20); 46% sustained an RTA in lanes, and 17% on highways. Getting hit by another vehicle was the most reported mechanism of injury caused by an RTA. Environmental factors causing RTAs included stormy weather and heavy rainfall at the time of RTA. 81% of the participants suffered a fracture following an RTA. 96% of participants who rode a two-wheeler at the time of RTA did not use helmets, while only 1 (8.3%) reportedly used seatbelts while driving a four-wheeler. 44.2% had a GCS score of 15 at the time of admission at the Level I Trauma Care Center. Among the participants who sustained fracture(s), the most reported were comminuted fractures (45.2%). 33% had reported a history of a head injury following RTA, among which the most reported was a cerebral concussion (23.5%), followed by acute Extra Dural Hemorrhage (EDH) (17.6%) and coup-contrecoup hemorrhagic contusions in right basal, frontal and temporoparietal lobes, with subarachnoid hemorrhage (SAH) in the left parietal lobe (17.6%). Two study subjects suffered blunt trauma in the abdomen following RTA.
3.3. Disability Status
Table 2 shows that the disability status in terms of six domains such as cognition, mobility, self-care, getting along, life activities, and participation at the three follow-up periods. There was a gradual of the percentile of people from 1st to 2nd follow-up with a decline in the 3rd follow-up period, in Domains I, II, and V. However, Domain IV (Getting along) showed a progressive increase in the level of disability with each follow-up period.
3.4. PTSD
Table 3 demonstrates that the presence of PTSD showed an increase during the 2nd follow-up, followed by a decline during the 3rd follow-up. While among those who reportedly did not have PTSD, the proportion showed a decline during the 2nd follow-up from the 1st, however, it increased during the 3rd follow-up.
3.5. Social Impact
The trend of social impact was high in all the three follow-up visits following RTA. Although it was not statistically significant, but the proportion of people with an “high social impact” was higher during the 3rd follow-up visit (44/52, 84.6%) compared to the 1st follow-up (36/52, 69.2%) and the 2nd follow-up visit (35/52, 67.3%) (Figure 1).
3.6. Economic Impact
As the data shows in Figure 2, the economic impact of RTA was ‘high’ among most of the study participants throughout the three follow-up periods. The rates were 82.7% (43/52), 78.8% (41/52), and 84.6% (44/52) during the 1st visit, the 2nd visit, and the 3rd visit, respectively.
4. Discussion
This study showed that the level of disability among the RTA victims was from “very low” to “low” with a progressive improvement in each of the three follow-up periods of 6 months post-discharge. Whereas the percentage of victims suffering from PTSD was very high – with 87% during the 1st follow-up visit, 94% during the 2nd follow-up visit, and 60% during the 3rd visit. This discrepancy in rates may suggest potential issues with the sensitivity of the WHODAS 2.0 in capturing the full extent of disability in this population.
The trend of social impact of RTA was high during the 6 months of follow-up. The economic impact due to RTA was even higher than the social impact, with around 80% being affected at least for 6 months of follow-up visits.
4.1. Disability
In a cross-sectional study of 563 victims of RTA in Turkey, the rate of disability was determined in 295 cases [21]. Most disabilities were recorded in teenagers and adults between 15 to 50 years of age. Injuries of the pelvis and lower extremities resulted in the majority of disabilities (n = 217, 73.6%), followed by head injuries (n = 35, 11.9%), whereas our study showed most disabilities among head injury patients. In another study, Bull (1985) [22] reviewed disabilities incurred by 2502 road accidents in the United Kingdom. There was an equal number of disabled among pedestrians, motorcyclists, and vehicle occupants, while motorcyclists had the highest number of RTAs and disabilities in our study subjects. In the UK study, like the Turkish study, the most serious disabilities were caused by head injuries and lower limb injuries. In a population-based study of 91,846 households with 20,425 disabled persons older than 15 years [23], 443 had a disability due to RTA, yielding the prevalence rate of RTA-associated disability of 2.1 per 1000 inhabitants (95% CI: 1.8 to 2.3). The risk of disability was highest among persons aged 31 to 64 years. This rate of low prevalence of disability is similar to the low rates observed in our study subjects.
4.2. Post-Traumatic Stress Disorder
PTSD results from the traumatic experiences in many RTA victims [24]. In a longitudinal study in Ethiopia, Fekadu et al. (2019) [24] showed that nearly half of RTA survivors develop PTSD, like our study where 87% of the RTA victims developed PTSD after one month of follow-up following hospital discharges, which peaked at the second follow-up at 3 months and then about 10% improved after 6 months post-discharge. In the Ethiopian study, 51.9% reported extreme problems in social functioning. Alcohol dependence, hazardous alcohol consumption, and harmful use of alcohol were reported by 7.9%, 15.1%, and 4.7% of the participants, respectively. In an earlier study in Germany [25], Frommberger et al. reported that 18.4% of 179 RTA victims developed PTSD at 6-month follow-up. In a study in France [26], among 592 subjects with RTA, the risk of PTSD was predicted by initial injury severity, post-traumatic amnesia, the feeling of not being responsible for the accident, and persistent pain.
4.3. Economic Impact of RTA
RTAs have profound economic impact as well in terms of loss of life and productivity, serious injuries and substantial mental trauma experienced by the victims and their families. A national report the estimated mean direct total cost of RTA burden in India in 2019 was 1,534 million Rupees (equivalent to US$ 18 million) with a median (IQR) of 1,155 million (2,588 million) Rupees (US$ 13 million ($ 31 million) [27].
However, the calculation of financial losses is often a complex process. Various quality-of-life scales are often used to measure the economic impact of RTA [28]. In a study conducted by the European Transport Safety Council, persons with low socioeconomic status were found to suffer from more traffic injuries [29]. In the current study, almost 30% of the RTA victims belonged to a low or lower middle socio-economic scale in India. A difference in the measurement scale of the economic loss also accounts for the societal differences in the observed economic impact. In our study, the economic impact of RTA was measured in terms of absenteeism from job following the accident, loss of wages, reduction in workplace performance, change of job, expenditure on treatment, and out-of-pocket expenditure, whereas, the European study delineated medical cost, property damage and administrative cost as the cost of restitution and used the value of lost productive capacity as a human capital approach for the calculation of the economic loss [30].
One of the major findings of this study was the high economic impact of RTA. In another study in India [31], about two-third of the RTA victims had to spend about 10 times of their monthly income whereas only 3.5% of victims had health insurance coverage in the country. Moreover, 64.0% of RTA victims had lost their wages while staying in hospital [31]. Prinja et al. (2029) [31] reported a high prevalence of catastrophic expenditure among 22.2% following RTA in India, of which about 12% fell below the poverty line after major incidents.
As mentioned earlier, there are potential difficulties in selecting variables in the calculation of the economic impact. We considered the following parameters for the calculation -- absenteeism from the job following the accident, loss of wages, reduction in workplace performance, change of job, expenditure on treatment, and out-of-pocket expenditure. For each of these items, a scoring system was used to measure an overall economic impact. Measurement tools may also vary by the socioeconomic condition of the people. Therefore, a more comprehensive measurement tool is needed to accurately measure the economic impact of RTA in developing countries.
4.4. Social Impact of RTA
According to the National Highway Traffic Safety Administration [32], an estimated monetary value of societal harm from motor vehicle crashes is nearly $836 billion, which is roughly three and a half times the value measured by economic impacts of RTA alone. Of this total, 71 percent represented lost quality of life. In our study, the social impact was estimated based on parameters like social neglect, mockery, or availability of rehabilitation services, which can be considered as proxy indicators of social quality of life. Social impact, thus measured, was substantial (as high as 84.6%) among victims during the final follow-up visit following the accident.
Thus, not only economic losses but also the more intangible social factors are to be considered during the formulation of post-accident rehabilitative services.
4.5. Limitations
The sample size was relatively small for a longitudinal study. However, the sampling frame from which the sample was done as first-come-first basis included all RTA victims who visited the hospital during the study period, which reduced the chance of bias. Secondly, two follow-up visits were conducted by telephone interview, which could result in reporting bias, social desirability bias, and lack standardization. In addition to the quantitative analyses, a mixed method of study design using focus group discussion could potentially minimize recall biases over time. Another limitation was the time of follow-up period – the 6-month follow-up study period could not measure long-term effect of RTAs on major disorders such as PTSD. Again, although the study provides evidence for a high economic impact of RTA, the total economic impact couldn’t be quantified from this study due to lack of data.
5. Conclusions
This longitudinal follow-up study was able to establish the impact of RTA on the physical health, mental health, and socioeconomic consequences of the victims over a short period. To our knowledge, this is the first follow-up study addressing a multiple nature of the burden of RTA in a developing country situation. The major implication of this study is that while managing the RTA victims, a more holistic long-term approach is needed in addition to immediate medical care. A stricter enforcement of laws, including large financial penalties for the violation, and an increased surveillance system are suggested. The city planners should prioritize proper road design and construction for road safety (particularly on narrower roads), improve traffic control, and sufficient display of warning signs and safety messages in strategic locations. Also, extensive campaigns and media coverage on road safety measures are needed for public awareness. Social scientists and psychotherapists can work together to effectively treat a wide range of mental health conditions of the victims to overcome their financial crisis, and for social adjustment and rehabilitation.
Author Contributions
Conceptualization, SP, SD, SN, SS; Methodology, SP, SD; Software, SP; Formal Analysis, SP, AKM; Investigation, SP, SD; Resources, SD, MB; writing—original draft preparation, SP; writing—review & editing, AKM, SD; visualization, SP, A.K.M.; supervision, SD; project administration, SD. All authors read and agreed to the published version of the manuscript.
Funding
This research received no external funding.
Institutional Review Board Statement
The study was conducted following the Declaration of Helsinki, and the research protocol was approved by the Institutional Ethics Committee (IEC) of IPGME&R/SSKM Hospital (Memo number IPGME&R/IEC/2022/462, dated 07/11/2022).
Informed Consent Statement
Informed consent was obtained from all subjects involved in the study.
Data Availability Statement
The data collection questionnaires are provided in Appendix A. The data presented in this study are available on request from the corresponding author.
Conflicts of Interest
The authors declare no conflicts of interest.
Appendix A
PART I: Socio-Demographic Profile of the Study Participants
- a)
- Age (in completed years)-
- b)
- Gender: Male/ Female/ others (specify)-
- c)
- Residence- Urban/Rural
- d)
- Living with- Alone/ Family
- e)
- Religion- Hindu/Muslim/Christian/Others (specify)
- f)
- Marital status- Married/ unmarried/ others (specify)
- g)
- Highest level of education- Illiterate/ non-formal education/ primary/ middle school/ secondary/ higher secondary and above
- h)
- Occupation- Unemployed/ Employed (specify)-
- i)
- Total family income per month (in Rs.)-
- j)
- Number of family members-
- k)
- Socio-economic status (as per Modified B.G. Prasad Scale, 2022)-
- l)
- Health insurance- Present/Absent
If present, specify-
- m)
- Addiction history- Present/Absent
If present: alcohol/ smoking/ smokeless tobacco/ others (specify)-
- n)
- Whether under the influence of any abusive substance at the time of accident? – Yes/No
If yes, specify-
- o)
- Socio-cultural problems in family- Present/Absent
If present, specify-
PART II: Details of RTA and the Clinical Profile of Admitted Patients
- a)
- Date of accident-
- b)
- Place of accident- Street/ Highway/ Lane
- c)
- Time of accident-
- d)
- Date and Time of admission at the Level I Trauma Centre of IPGME&R-
- e)
- Any environmental factors leading to the RTA? – Yes/ No
If yes (multiple responses):
- Bad road conditions- Yes/No
- Poor weather conditions – Yes/ No
If yes- heavy rainfall/ storm/ foggy weather
- Defective vehicle conditions – Yes/ No
If yes – engine failure/ brake failure/ tire puncture/ others (specify)
- f)
- Mechanism of injury following accident (multiple responses):
- i)
- Fall from vehicle- Yes/No
- ii)
- Skidding while driving- Yes/No
- iii)
- Getting hit by another vehicle- Yes/No
- g)
- Type of injury following accident (multiple responses):
- i)
- Fracture- Yes/No
If yes:
- name of fractured bone (including skull fracture if any)-
- type of fracture- displaced/not displaced
- ii)
- Dislocation- Yes/No
If yes:
- Name of affected bone-
- iii)
- Head injury- Yes/No
If yes:
- hemorrhage/ cerebral contusion/ cerebral concussion/ others (specify)-
- iv)
- Blunt trauma: Yes/No
If yes:
- Site on the body –
- Any rupture of viscera- Yes/ No
If yes, specify-
- Whether there was any internal bleeding? – Yes/No
- v)
- Amputation: Yes/No
If yes:
- Which part of the body (specify)
- h)
- Consciousness level following accident- Conscious/ Unconscious
- i)
- GCS at the time of admission at the Level I Trauma Centre-
- j)
- Whether the victim was-
- A pedestrian- Yes/ No
- Inside a vehicle- Yes/No
If yes,
- type of vehicle in which the victim was travelling:
- Two-wheeler- Yes/ No
If yes, whether the victim wore a helmet? – Yes/ No
- Three-wheeler - Yes/ No
- Four-wheeler – Yes/No
If yes, whether the victim had seat-belt on? – Yes/ No
- Was the victim driving the vehicle? – Yes/ No
- Before admission in the Level I Trauma Centre, whether taken to any other health facility- Yes/No
If yes:
- Name of the facility-
- Distance of the facility from the site of accident-
- Whether went alone or accompanied by someone to the facility- Alone/ Accompanied by someone (specify)-
- Time of attendance at the facility-
- Received treatment at the facility- Yes/No
- Whether referred to the Level I Trauma Centre of IPGME&R? – Yes/No
- Whether undergone any major surgery following the accident? Yes/No
If yes, specify-
- Was the victim admitted to the Critical Care unit (ICU/HDU) at any point following admission? – Yes/ No
If yes, duration of stay -
PART III: Follow-Up Data Collection (1ST, 2ND AND 3RD)
Only for 1st follow-up:
Duration of hospital stay (in days):
For 1st, 2nd and 3rd follow-up data collection:
Part 1. WHODAS 2.0 Scale (for disability assessment):
Domain I: Cognition
In the past 30 days, how much difficulty did you have in-
- a)
- Concentrating in doing something for 10 mins?
- b)
- Remembering to do important things?
- c)
- Analysing and finding solutions to problems in day-to-day life?
- d)
- Learning a new task, for example, learning how to get to a new place?
- e)
- Generally understanding what people say?
- f)
- Starting and maintaining a conversation?
Domain II: Mobility
In the past 30 days, how much difficulty did you have in-
- a)
- Standing for long periods such as 30 minutes?
- b)
- Standing up from sitting down?
- c)
- Moving around inside your home?
- d)
- Getting out of your home?
- e)
- Walking a long distance such as a kilometre [or equivalent]?
Domain III: Self-care
In the past 30 days, how much difficulty did you have in-
- a)
- Washing your whole body?
- b)
- Getting dressed?
- c)
- Eating?
- d)
- Staying by yourself for few days?
Domain IV: Getting along
In the past 30 days, how much difficulty did you have in-
- a)
- Dealing with people you do not know?
- b)
- Maintaining a friendship?
- c)
- Getting along with people who are close to you?
- d)
- Making new friends?
- e)
- Sexual activities?
Domain V: Life activities
In the past 30 days, how much difficulty did you have in-
- a)
- Taking care of your household responsibilities?
- b)
- Doing most important household tasks well?
- c)
- Getting all the household work done that you needed to do?
- d)
- Getting your household work done as quickly as needed?
- e)
- Your day-to-day work/school?
- f)
- Doing your most important work/school tasks well?
- g)
- Getting all the work done that you need to do?
- h)
- Getting your work done as quickly as needed?
Domain VI: Participation
In the past 30 days, how much difficulty did you have in-
- a)
- How much of a problem did you have joining in community activities (for example, festivities, religious or other activities) in the same way anyone else can?
- b)
- How much of a problem did you have because of barriers or hindrances in the world around you?
- c)
- How much of a problem did you have living with dignity because of the attitudes and actions of others?
- d)
- How much time did you spend on your health condition, or its consequences?
- e)
- How much have you been emotionally affected by your health condition?
- f)
- How much has your health been a drain on the financial resources of you or your family?
- g)
- How much of a problem did your family have because of your health problems?
- h)
- How much of a problem did you have in doing things by yourself for relaxation or pleasure?
| None | Mild | Moderate | Severe | Extreme/Cannot do |
| 0 | 1 | 2 | 3 | 4 |
Part II. PTSD Checklist for DSM 5 (PCL-5)
| Questions |
Not at all 0 |
Little bit 1 |
Moderately 2 |
Quite a bit 3 |
Extremely 4 |
| 1. Repeated, disturbing, and unwanted memories of the stressful experience? | |||||
| 2. Repeated, disturbing dreams of the stressful experience? | |||||
| 3. Suddenly feeling or acting as if the stressful experience were actually happening again (as if you were actually back there reliving it)? | |||||
| 4. Feeling very upset when something reminded you of the stressful experience? | |||||
| 5. Having strong physical reactions when something reminded you of the stressful experience (for example, heart pounding, trouble breathing, sweating)? | |||||
| 6. Avoiding memories, thoughts, or feelings related to the stressful experience? | |||||
| 7. Avoiding external reminders of the stressful experience (for example, people, places, conversations, activities, objects, or situations)? | |||||
| 8. Trouble remembering important parts of the stressful experience? | |||||
| 9. Having strong negative beliefs about yourself, other people, or the world (for example, having thoughts such as: I am bad, there is something seriously wrong with me, no one can be trusted, the world is completely dangerous)? | |||||
| 10. Blaming yourself or someone else for the stressful experience or what happened after it? | |||||
| 11. Having strong negative feelings such as fear, horror, anger, guilt, or shame? | |||||
| 12. Loss of interest in activities that you used to enjoy? | |||||
| 13. Feeling distant or cut off from other people? | |||||
| 14. Trouble experiencing positive feelings (for example, being unable to feel happiness or have loving feelings for people close to you)? | |||||
| 15. Irritable behavior, angry outbursts, or acting aggressively? | |||||
| 16. Taking too many risks or doing things that could cause you harm? | |||||
| 17. Being “super alert” or watchful or on guard? | |||||
| 18. Feeling jumpy or easily startled? | |||||
| 19. Having difficulty concentrating? | |||||
| 20. Trouble falling or staying asleep? |
PART III: Socio-Economic Impact of RTA
- A.
- Social Impact:
- Was the victim being neglected by family/friends/neighbors/other acquaintances following RTA? – Yes/No
- Was the victim made fun of/ being insulted by others following the RTA- Yes/No
- Did the victim receive any rehabilitative services? – Yes/No. If yes, specify-
If no, give reason (s) -
- B.
- Economic Impact:
- For how many days was the victim absent from his job following the accident?
- Any loss of wages of the victim following the RTA? – Yes/No
- Has the performance of the victim reduced at the workplace following the accident? – Yes/ No
- Did the victim opt for a different job following the accident? – Yes/No
If yes:
Reason(s) – Specify
How many days after the previous job?
Was there any change in salary? – Yes/ No
If yes, whether the current salary is more/less than previous salary? – More / Less
- 5.
- How much money was spent for treatment following the accident (hospital admission+ follow-up visits) in Rs. -
- 6.
- Did the victim get any accident policy/ claim for treatment? – Yes/No
If yes, how much (in Rs.) -
- 7.
- Did the victim take any loan for treatment following the accident? – Yes/ No
If yes, how much (in Rs.)-
Mode of repaying the loan (specify)-
- 8.
- Was there any out-of-pocket (OOP) expenditure of the victim due to RTA? – Yes/ No. If yes:
- OOP during hospital admission (in Rs.) –
Reason(s) – Specify
- OOP during follow-up (in Rs.) –
Reason(s) – Specify
Appendix B
STROBE Checklist
| Item No | Recommendations | Page No. | Relevant text | |
| Title and abstract | 1 | (a) Indicate the study’s design with a commonly used term in the title or the abstract: Mentioned as ‘follow up study’ | 1 | The title includes the following: “A 6-month follow-up study” |
| (b) Provide in the abstract an informative and balanced summary of what was done and what was found: The same mentioned as recommended | 1 | A longitudinal study was conducted for 24 months among 52 hospitalized RTA victims, aged ≥ 18 years, followed up at 1-, 3- and 6 months post-discharge from the hospital. | ||
| Introduction | ||||
| Background/rationale | 2 | Explain the scientific background and rationale for the investigation being reported: Mentioned | 2-3 | Lines 41-78. |
| Objectives | 3 | State specific objectives, including any prespecified hypotheses: Objectives mentioned, no prespecified hypotheses given | 3 | This study aimed to address the magnitude of disability, PTSD, and social-, and economic complications among RTA victims within 6 months of post-discharge from a trauma care center of a tertiary care hospital in Kolkata, West Bengal, India. |
| Methods | ||||
| Study design | 4 | Present key elements of study design early in the paper | 3-4 | Cross-sectional study with 6 months’ follow-up. |
| Setting | 5 | Describe the setting, locations, and relevant dates, including periods of recruitment, exposure, follow-up, and data collection |
Setting: Level-I Trauma Care Centre, IPGME&R and SSKM Hospital, Kolkata (India) Period of recruitment Mentioned Follow up periods 6 months Data collection: Details of the instruments are mentioned. |
|
| Participants | 6 | Cross-sectional study—Give the eligibility criteria, and the sources and methods of selection of participants | 3 | Page 3, line 83-87 |
| Variables | 7 | Clearly define all outcomes, exposures, predictors, potential confounders, and effect modifiers. Give diagnostic criteria, if applicable. |
4-7 | Outcome variables: disability, PTSD and socioeconomic complications. Predictors: the outcome variables; potential confounders: socioeconomic variables |
| Data sources/ measurement | 8* | For each variable of interest, give sources of data and details of methods of assessment (measurement). Describe comparability of assessment methods if there is more than one group. |
7-8 | Sources of data for each variable of interest: RTA victims followed up through 6 months post-discharge from the Trauma Care Centre) Comparability of assessment methods: No controls |
| Bias | 9 | Describe any efforts to address potential sources of bias | Not mentioned | |
| Study size | 10 | Explain how the study size was arrived at | 4 | Used the prevalence sample size formula and published data for the baseline (5] Line 96-107 |
| Quantitative variables | 11 | Explain how quantitative variables were handled in the analyses. If applicable, describe which groupings were chosen and why | 5-6 | WHODAS 2.0 scale for disability was grouped into 5 categories. PTSD was grouped into: present or absent. Followed the standard published methods. |
| Statistical methods | 12 | Describe all statistical methods, including those used to control confounding: |
(a) | (b) |
| Describe any methods used to examine subgroups and interactions: | 8 | Not done in the study | ||
| Explain how missing data were addressed | There were no missing data. | |||
| Cross-sectional study—If applicable, describe analytical methods taking account of sampling strategy | 5-8 | Details of the method are described. | ||
| (e) Describe any sensitivity analyses | Not applicable | |||
References
- World Health Organization. Road traffic injuries. Available online: https://www.who.int/news-room/fact- sheets/detail/road-traffic-injuries, accessed on 24 December 2024.Author 1, A.; Author 2, B. Title of the chapter. In Book Title, 2nd ed.; Editor 1, A., Editor 2, B., Eds.; Publisher: Publisher Location, Country, 2007; Volume 3, pp. 154–196.
- United Nations. Fact Sheet Road Safety. Sustainable Transport Conference, 14-16 October 2021, Beijing. Available online: chrome- extension://efaidnbmnnnibpcajpcglclefindmkaj/https://www.un.org/sites/un2.un.org/files/media_gstc/FACT_SHEET_Road_safety.pdf, accessed on 24 December 2024. Author 1, A.B.; Author 2, C. Title of Unpublished Work. Abbreviated Journal Name year, phrase indicating stage of publication (submitted; accepted; in press).
- Observer Research Foundation. Why are road accidents in India are on the rise? Available online: https://www.orfonline.org/expert-speak/why-are-road-accidents-in-india-on-the-rise, accessed on 24 December 2024.
- Nanjunda, D.C. Impact of socio-economic profiles on public health crisis of road traffic accidents: A qualitative study from South India. Clin Epidemiol Global Health. 2021, 9, 7-11.
- Bicholkar, A.; Cacodcar, J.A. A study of road traffic injury victims at a tertiary care hospital in Goa, India. J Family Med Prim Care. 2022, 11(9):5490-5494. doi: 10.4103/jfmpc.jfmpc_693_21. [CrossRef]
- Dutta, S.; Sarkar, D.; Mallick, N. A study on the socio-demographic profiles of road traffic accident cases attending a peripheral tertiary care medical College hospital of West Bengal. J Evidence Based Med. 2021, 8(15), 945-949, DOI: 10.18410/jebmh/2021/183. [CrossRef]
- Alghnam, S.; Alkelya, M.; Aldahnim, M.; Aljerian, N.; Albabtain, I.; Alsayari, A.; et al. Healthcare costs of road injuries in Saudi Arabia: A quantile regression analysis. Accid Anal Prev. 2021, 159, 106266.
- Rissanen, R.; Berg, H.Y.8; Hasselberg, M. Quality of life following road traffic injury: A systematic literature review. Accid Anal Prev. 2017, 108, 308-320.
- Papic, C.; Kifley, A.; Craig, A.; Grant, G.; Collie, A.; Pozzato, I.; et al. Factors associated with long term work incapacity following a non-catastrophic road traffic injury: Analysis of a two-year prospective cohort study. BMC Public Health. 2022, 22(1), 1498.
- Jain, M.; Radhakrishnan, R.V.; Mohanty, C.R.; Behera, S.; Singh, A.K.; Sahoo, S.S.; et al. Clinicoepidemiological profile of trauma patients admitting to the emergency department of a tertiary care hospital in eastern India. J Family Med Prim Care. 2020, 9(9), 4974-79. doi: 10.4103/jfmpc.jfmpc_621_20. [CrossRef]
- Ng QX, Soh AYS, Loke W, Venkatanarayanan N, Lim DY, Yeo WS. Systematic review with meta-analysis: The association between post-traumatic stress disorder and irritable bowel syndrome. J Gastroenterol Hepatol. 2019 Jan;34(1):68-73. doi: 10.1111/jgh.14446. Epub 2018 Sep 10. PMID: 30144372. [CrossRef]
- Undavalli, C.; Das, P.; Dutt, T.; Bhoi, S.; Kashyap, R. PTSD in post-road traffic accident patients requiring hospitalization in Indian subcontinent: A review on magnitude of the problem and management guidelines. J Emerg Trauma Shock. 2014, 7(4), 327-331, doi: 10.4103/0974-2700.142775. [CrossRef]
- Kumar, S.; Mahima; Srivastava, D.K.; Kharya, P.; Sachan, N.; Kiran, K. Analysis of risk factors contributing to road traffic accidents in a tertiary care hospital. A hospital based cross-sectional study. Chin J Traumatol. 2020, 23(3), 159-62. DOI: 10.1016/j.cjtee.2020.04.005. [CrossRef]
- Jain, S.; Iverson, L.M. Glasgow Coma Scale. [Updated 2023 Jun 12]. In: StatPearls [Internet]. Treasure Island (FL): StatPearls Publishing; 2025. Available online: https://www.ncbi.nlm.nih.gov/books/NBK513298/ (accessed 10 January 2025).
- Daniel, W.W.; Cross, C.L. Biostatistics: A Foundation for Analysis in the Health Sciences. 10th edition, John Wiley and Sons, Inc., 2013.
- World Health Organization. Disability Assessment Schedule 2.0. WHODAS 2.0. Available online: https://www.cms.gov/files/document/whodas-20-instrument.pdf, accessed on 10 January 2025.
- Abdin E, Seet V, Jeyagurunathan A, Tan SC, Mok YM, Verma S, Lee ES, Subramaniam M. Validation of the 12-item World Health Organization Disability Assessment Schedule 2.0 in individuals with schizophrenia, depression, anxiety, and diabetes in Singapore. PLoS One. 2023, 18(11), e0294908. doi: 10.1371/journal.pone.0294908. [CrossRef]
- U.S. Department of Veterans Affairs. PTSD: National Center for PTSD. PTSD Checklist for DSM-5 (PCL-5). Available online: https://www.ptsd.va.gov/professional/assessment/adult-sr/ptsd-checklist.asp, accessed on 10 January 2025.
- Hall BJ, Yip PSY, Garabiles MR, Lao CK, Chan EWW, Marx BP. Psychometric validation of the PTSD Checklist-5 among female Filipino migrant workers. Eur J Psychotraumatol. 2019, 10(1), 1571378. doi: 10.1080/20008198.2019.1571378. [CrossRef]
- PCL-5: Scoring and interpretation [Internet]. Comorbidity Guidelines. Available online: https://comorbidityguidelines.org.au/appendix-s-ptsd-checklist-for-dsm5-pcl5/pcl5-scoring-and-interpretation, accessed on 20 November 2024.
- Esiyok, B., Korkusuz, I., Canturk, G., Alkan, H. A., Karaman, A. G., & Hamit Hanci, I. (2005). Road traffic accidents and disability: A cross-section study from Turkey. Disability and Rehabilitation, 27(21), 1333–1338. https://doi.org/10.1080/09638280500164867. [CrossRef]
- Bull J.P. Disabilities caused by road traffic accidents and their relation to severity scores. Accid Anal Prev. 1985, 17(5), 387-397, https://doi.org/10.1016/0001-4575(85)90093-4. [CrossRef]
- Palmera-Suárez, R.; López-Cuadrado, T.; Almazán-Isla, J.; Fernández-Cuenca, R.; Alcalde-Cabero, E.; Galán, I. Disability related to road traffic crashes among adults in Spain. Gaceta Sanitaria 2025, 29(1), 43-48. https://doi.org/10.1016/j.gaceta.2015.01.009. [CrossRef]
- Fekadu, W,; Mekonen, T.; Belete, H.; Belete, A.; Yohannes, K. Incidence of post-traumatic stress disorder after road traffic accident. Front. Psychiatry 2019, 10, https://doi.org/10.3389/fpsyt.2019.00519. [CrossRef]
- Frommberger, U.H.; Stieglitz, R-D.; Nyberg, E.; Schlickewei, W.; Kuner, E. Berger, M. Prediction of posttraumatic stress disorder by immediate reactions to trauma: a prospective study in road traffic accident victims. Eur Arch Psychiatry Clin Neurosci. 1998, 228, 316-321.
- Chossegros, L.; Hours, M.; Charnay, P.; Bernard, M.; Fort, E.; Boisson, D.; et al. Predictive factors of chronic post-traumatic stress disorder 6 months after a road traffic accident. Accid Anal Prev. 2011, 43(1), 471-477. https://doi.org/10.1016/j.aap.2010.10.004. [CrossRef]
- Kumar, S.; Bagepally, B.S.; Shankara, B.; Sasidharan, A.; Jagadeesh, K.V.; Ponniah, M. State-wise economic burden of road traffic accidents in India. medRxiv preprint doi: https://doi.org/10.1101/2023.12.21.23300419 Available online: https://www.medrxiv.org/content/10.1101/2023.12.21.23300419v1.full.pdf, accessed on 12 December 2024. [CrossRef]
- Gorea, R. Financial impact of road traffic accidents on the society. Int J Ethics Trauma Victimology 2016, 2(1):6-9. doi.10.18099/ijetv.v2i1.11129.
- European Transport Safety Council (ETSC). Social and economic consequences of road traffic injury in Europe. Brussels: 2007 p. 23.
- Verma, P.; Gupta, S.; Misra, S.; Agrawal, R.; Agrawal, V.; Singh, G. Road traffic accidents: A lifetime financial blow the victim cripples under. Indian J Community Health. 2015, 27(2):257–262.
- Prinja, S.; Jagnoor, J.; Sharma, D.; Aggarwal, S.; Katoch, S.; Lakshmi, P.V.; et al. Out-of-pocket expenditure and catastrophic health expenditure for hospitalization due to injuries in public sector hospitals in North India. PloS One. 2019, 14(11), e0224721.
- Blincoe, L. J.; Miller, T. R.; Zaloshnja, E.; Lawrence, B. A. The economic and societal impact of motor vehicle crashes, 2010. (Revised) (Report No. DOT HS 812 013). Washington, DC: National Highway Traffic Safety Administration, May 2025. http://www-nrd.nhtsa.dot.gov/Pubs/812013.pdf.
Figure 1.
Distribution of study participants according to the social i1mpact following RTA during each follow-up period (n= 52).
Figure 1.
Distribution of study participants according to the social i1mpact following RTA during each follow-up period (n= 52).
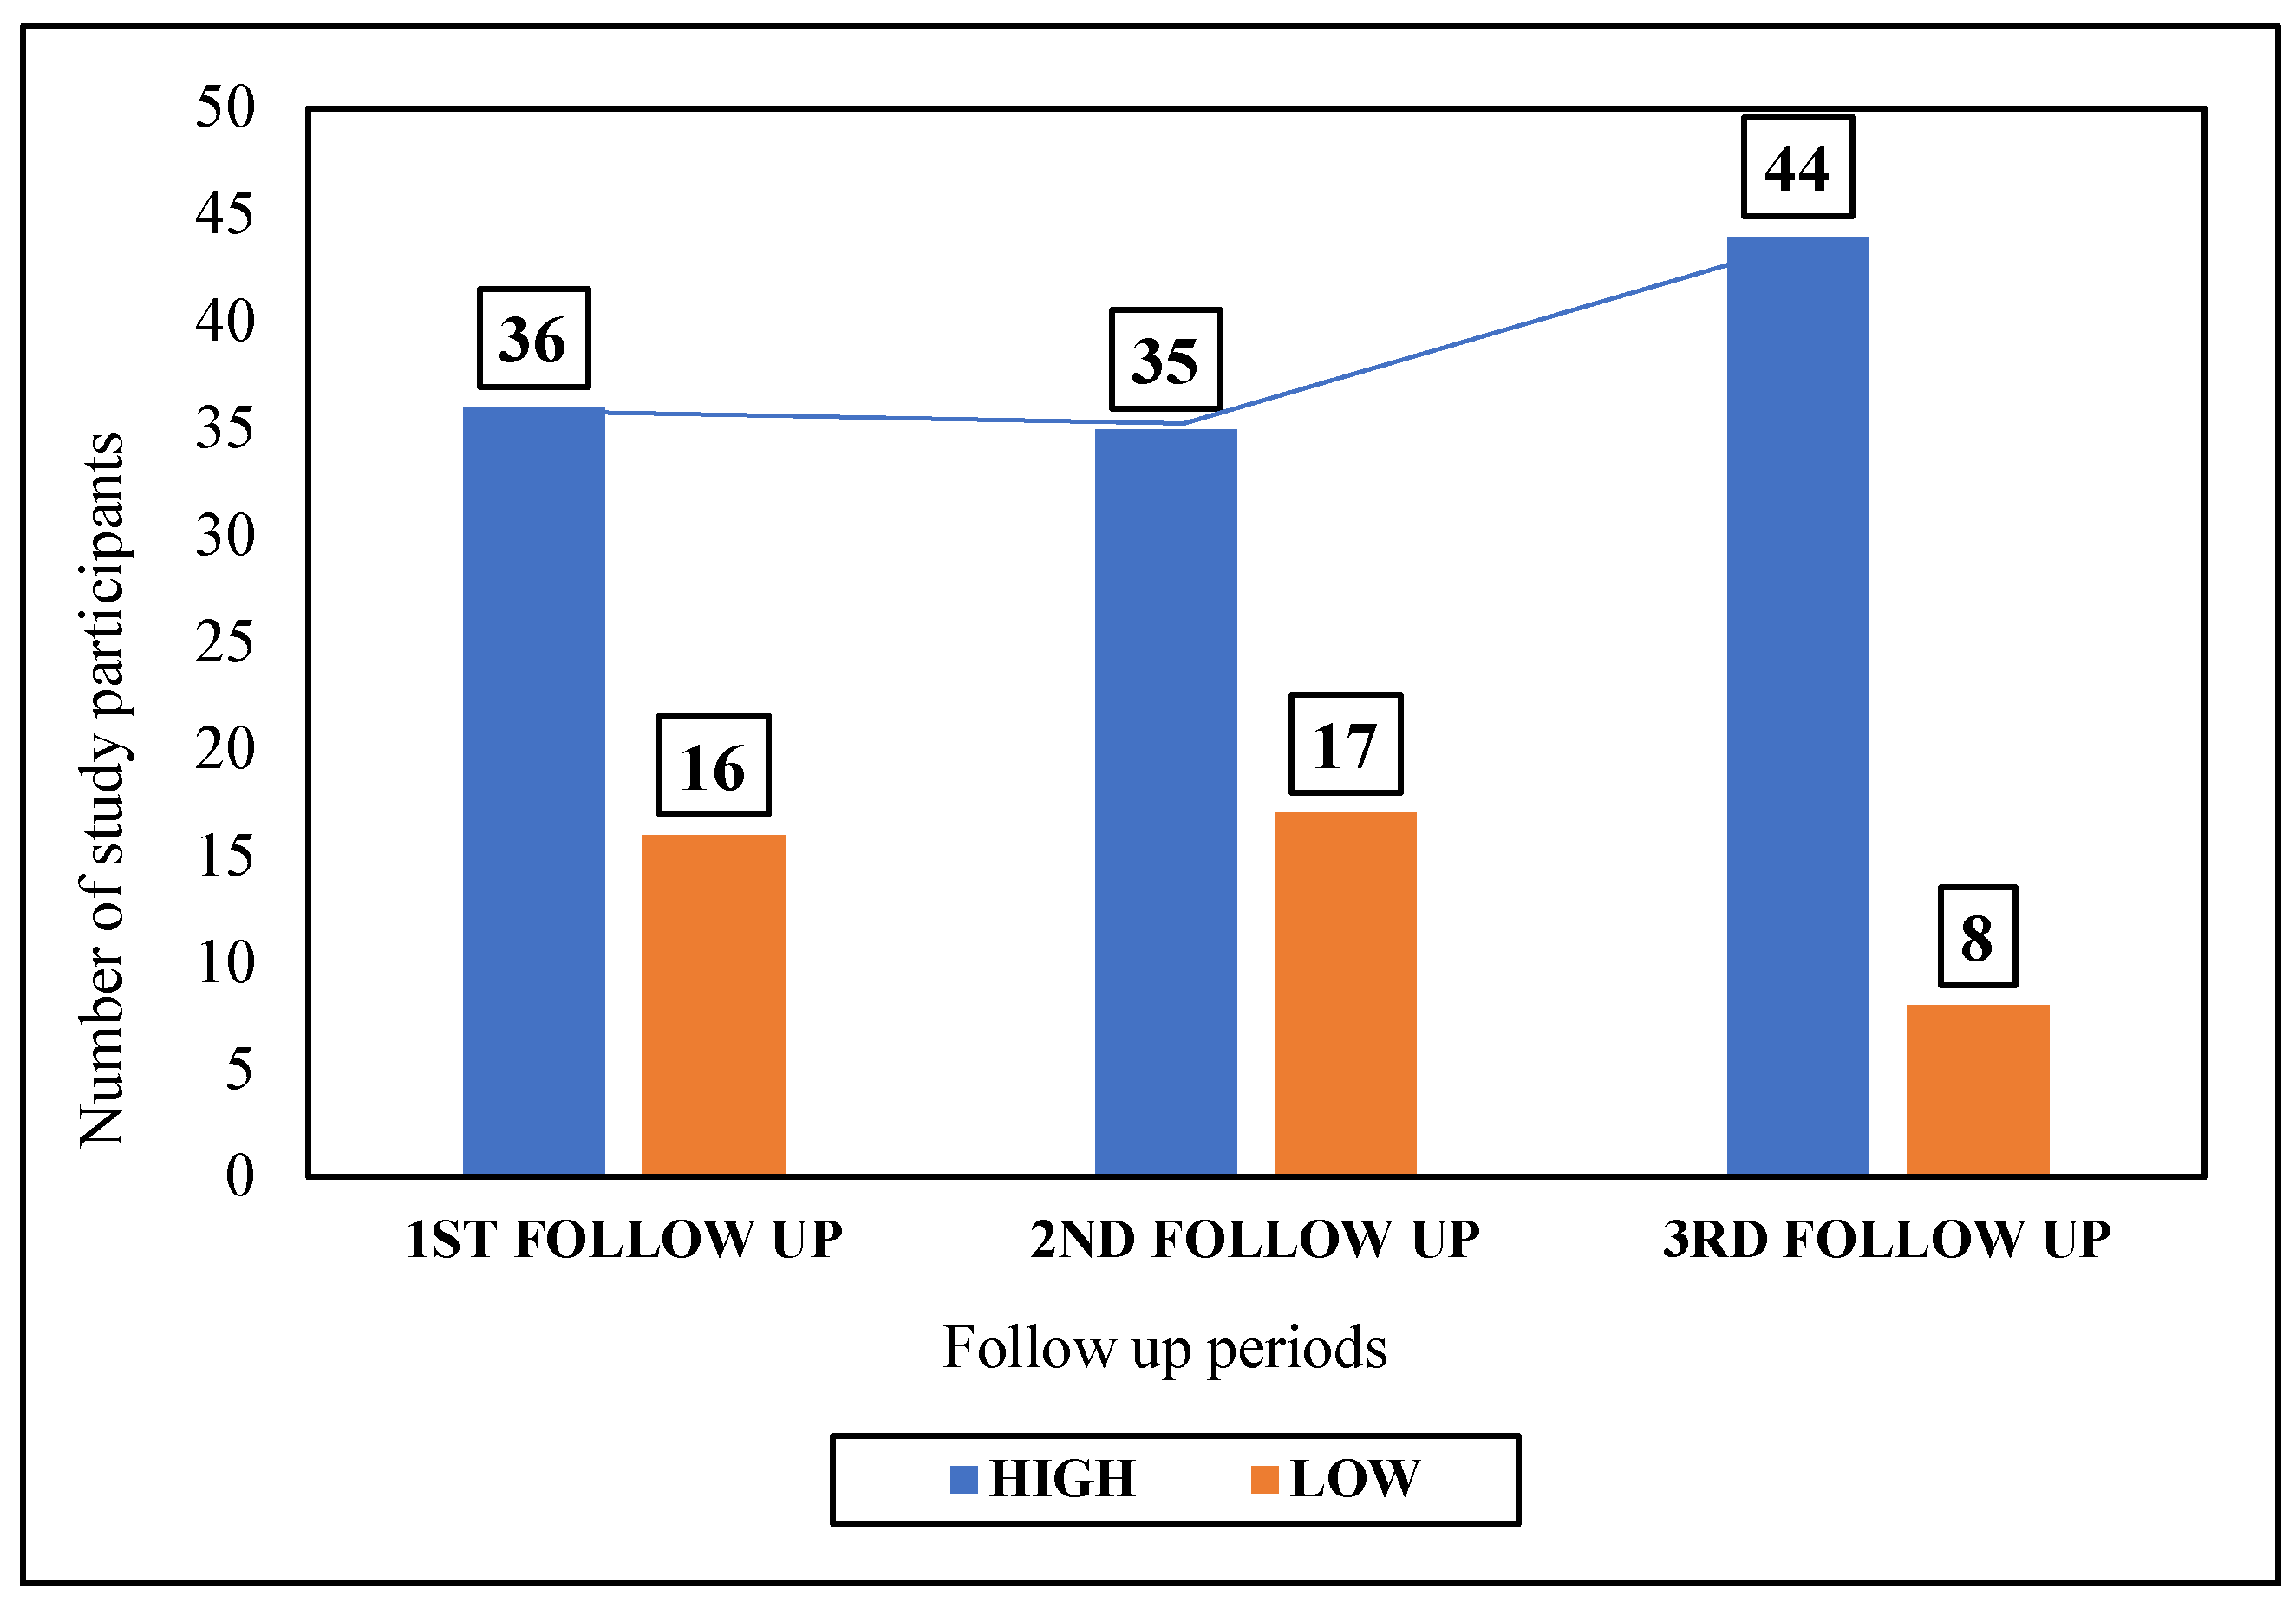
Figure 2.
Distribution of study participants according to the economic impact following RTA during each follow-up (n= 52).
Figure 2.
Distribution of study participants according to the economic impact following RTA during each follow-up (n= 52).
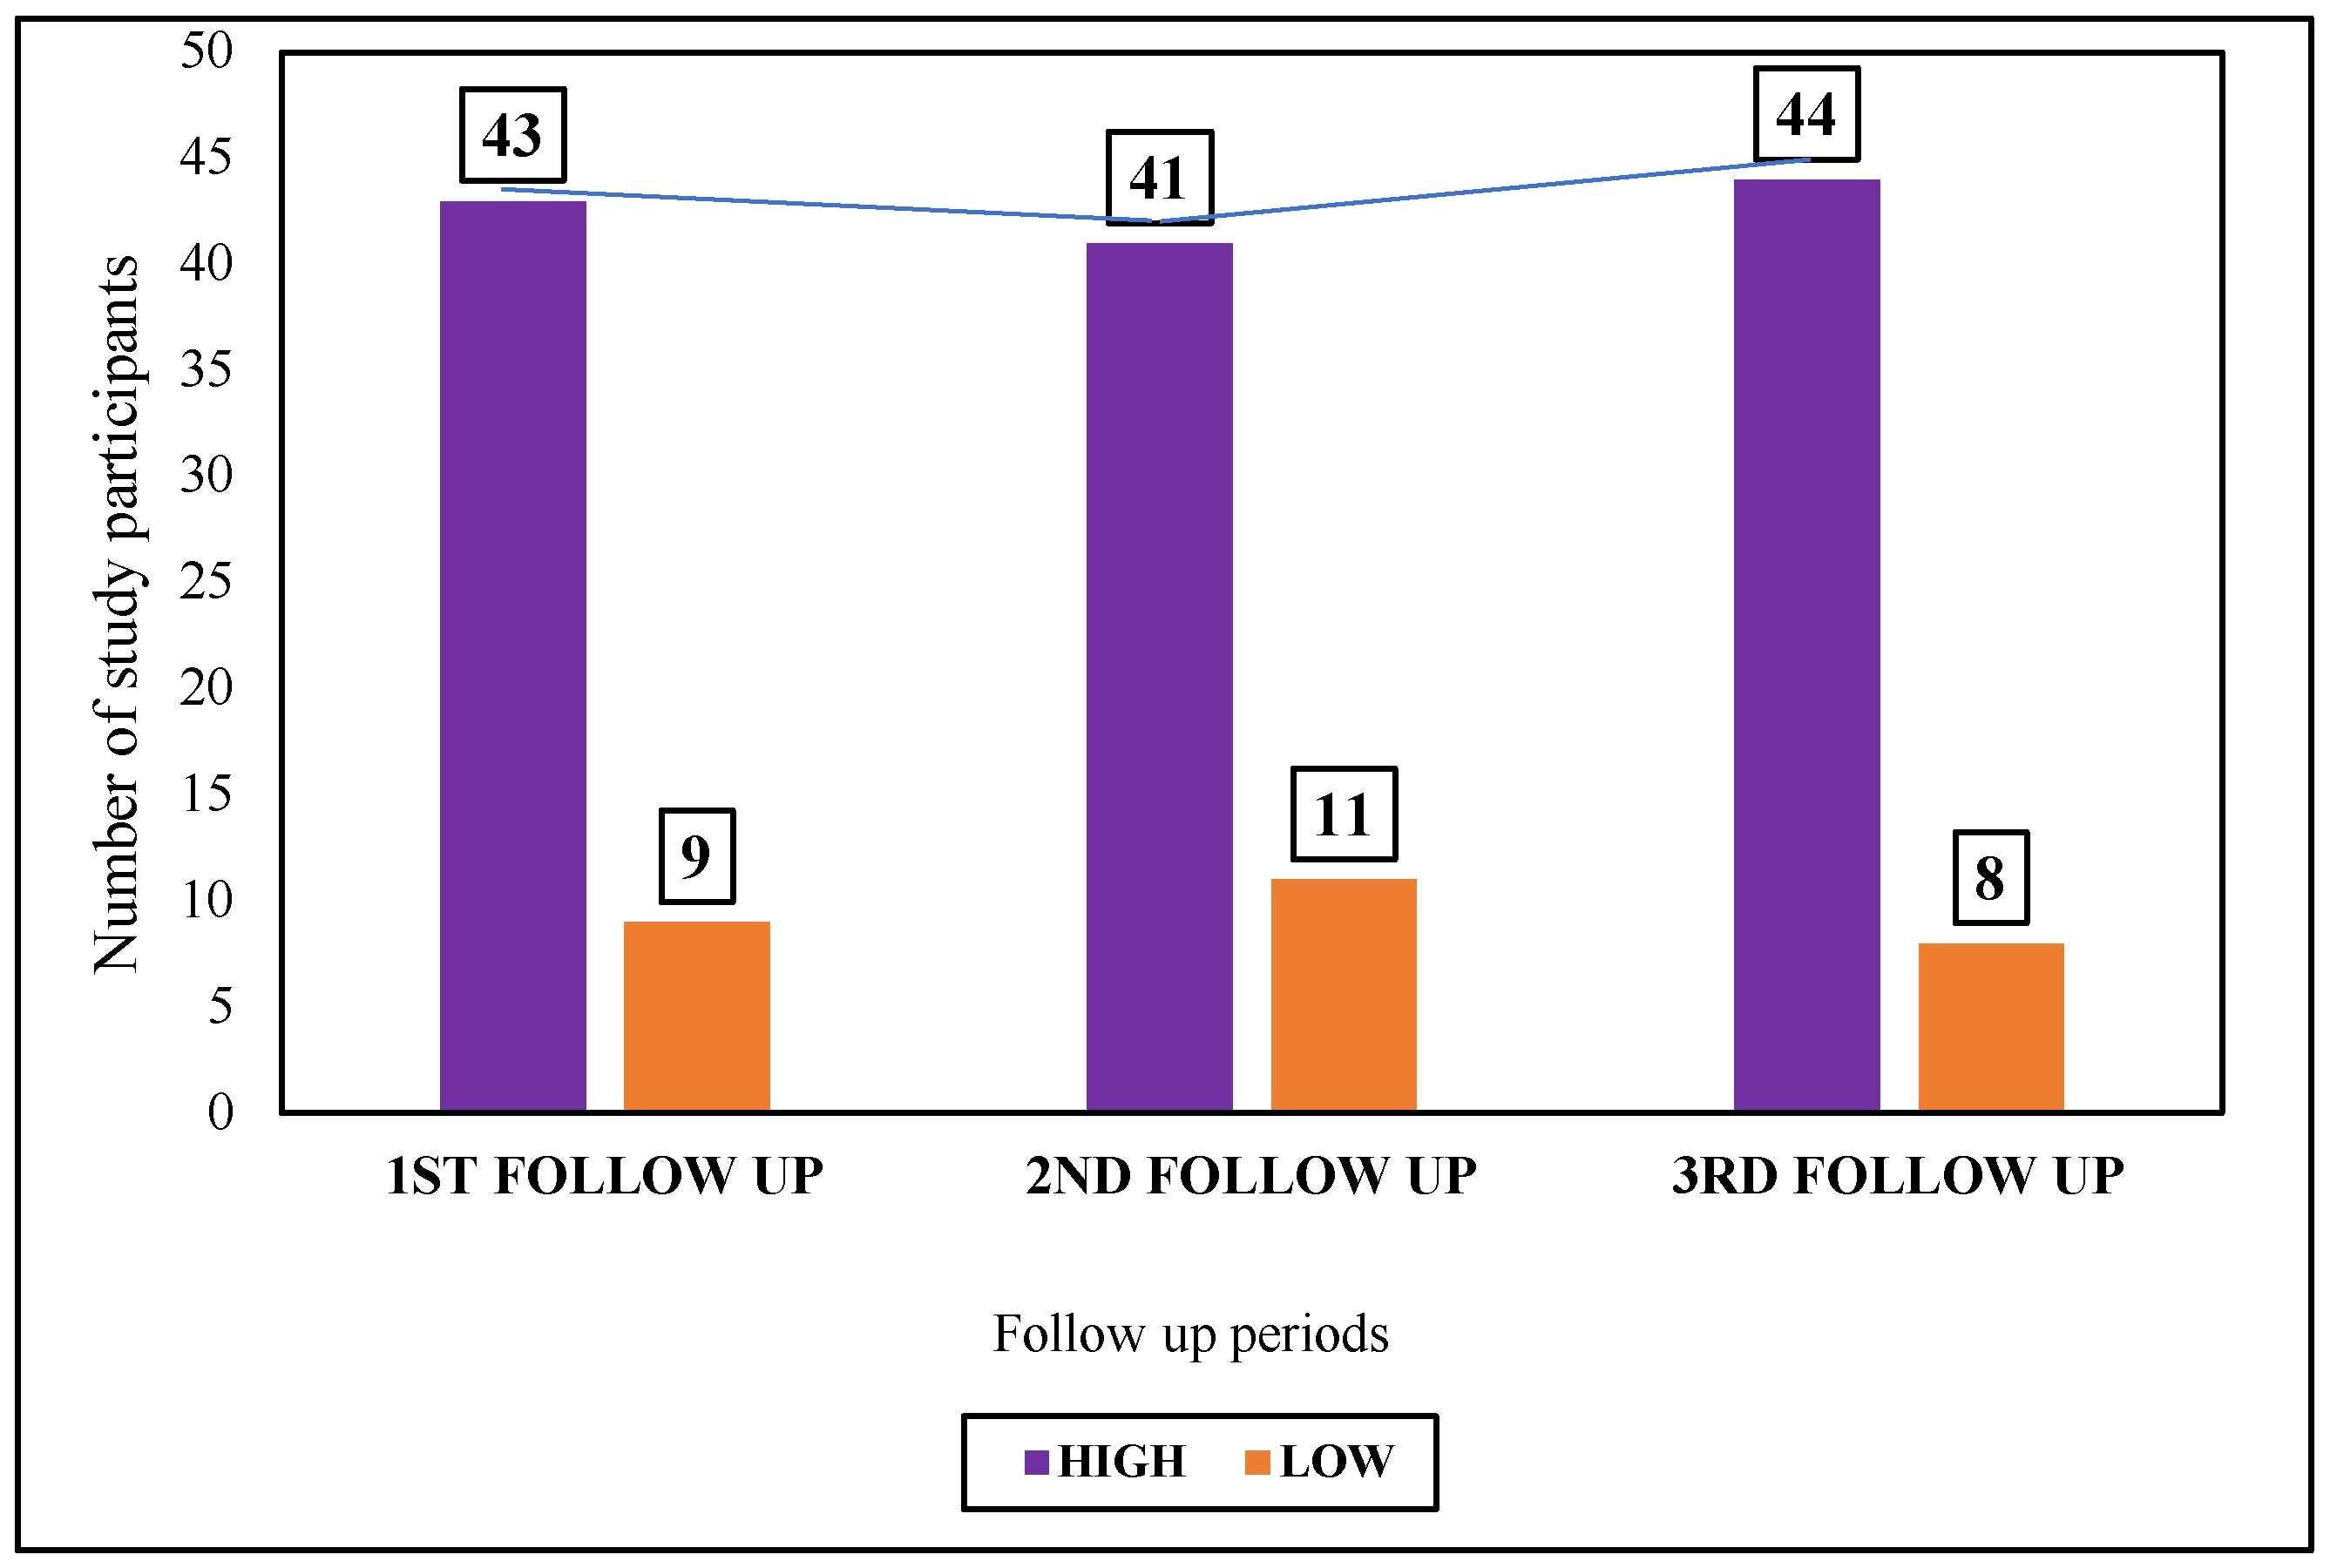

Table 1.
Distribution of study participants according to their sociodemographic characteristics (n = 52).
Table 1.
Distribution of study participants according to their sociodemographic characteristics (n = 52).
| Socio-demographic Characteristics | Number (%) |
|---|---|
| Age group (years) | |
| ≤ 20 | 8 (15.4) |
| 21-30 | 27 (51.9) |
| 31-40 | 6 (11.5) |
| 41-50 | 6 (11.5) |
| ≥ 51 | 5 (9.7) |
| Gender | |
| Female | 12 (23.1) |
| Male | 40 (76.9) |
| Religion | |
| Hinduism | 30 (57.7) |
| Islam | 20 (38.5) |
| Christianity | 2 (3.8) |
| Place of current residence | |
| Rural | 33 (63.5) |
| Urban | 19 (36.5) |
| The highest level of education attained | |
| Illiterate | 9 (17.3) |
| Primary | 8 (15.4) |
| Middle school | 12 (23.1) |
| Secondary | 11 (21.2) |
| Higher Secondary and above | 12 (23.1) |
| Occupation | |
| Employed | 29 (55.8) |
| Unemployed | 7 (13.5) |
| Homemakers | 10 (19.2) |
| Students | 3 (5.7) |
| Retirees | 3 (5.7) |
| Socioeconomic status | |
| Class I (Upper) | 1 (1.9) |
| Class II (Upper middle) | 6 (11.5) |
| Class III (Middle) | 16 (30.8) |
| Class IV (Lower middle) | 23 (44.2) |
| Class V (Lower) | 6 (11.5) |
| Marital status | |
| Married | 36 (69.2) |
| Unmarried | 14 (26.9) |
| Widowed | 2 (3.8) |
| Addiction history | |
| Yes | 33 (64.0) |
| No | 19 (36.0) |
| Status of health insurance | |
| Absent | 5 (10.0) |
| Present | 47 (90.0) |
Table 2.
Distribution of study participants according to their domain-wise severity of disability (based on percentile scores) during each follow-up period (n= 52).
Table 2.
Distribution of study participants according to their domain-wise severity of disability (based on percentile scores) during each follow-up period (n= 52).
| Follow-up periods (following discharge from Level-I Trauma Care Centre) | Percentile scores of each domain under WHODAS 2.0 | |||||
| Domain I (Cognition) |
Domain II (Mobility) | Domain III (Self-care) | Domain IV (Getting along) | Domain V (Life activities) | Domain VI (Participation) | |
|
1st follow-up (1 month after discharge) |
19.5 | 22.8 | 15.8 | 21.3 | 29.3 | 25.3 |
|
2nd follow-up (3 months after discharge) |
22.5 | 24.5 | 15.8 | 25.3 | 30.4 | 27.3 |
|
3rd follow-up (6 months after discharge) |
21.3 | 23.8 | 15.8 | 26.3 | 29.3 | 27.3 |
Table 3.
Distribution of study participants according to their PTSD status during each follow-up period (n= 52).
Table 3.
Distribution of study participants according to their PTSD status during each follow-up period (n= 52).
| PTSD |
1st Follow-up (1 month after discharge) |
2nd follow-up (3 months after discharge) |
3rd follow-up (6 months after discharge) |
| Number (%) | Number (%) | Number (%) | |
| Present | 45 (86.5) | 49 (94.2) | 31 (59.6) |
| Absent | 7 (13.5) | 3 (5.8) | 21 (40.4) |
| Total | 52 (100.0) | 52 (100.0) | 52 (100.0) |
Among the type of injuries, head injury was significantly associated with PTSD severity during the 1st (p = 0.01) and 3rd follow-up periods (p = 0.007). Sustainment of fractures had statistically significant associations with severity of disability, PTSD, and socioeconomic impact during all three follow-up periods (data not shown).
Disclaimer/Publisher’s Note: The statements, opinions and data contained in all publications are solely those of the individual author(s) and contributor(s) and not of MDPI and/or the editor(s). MDPI and/or the editor(s) disclaim responsibility for any injury to people or property resulting from any ideas, methods, instructions or products referred to in the content. |
© 2025 by the authors. Licensee MDPI, Basel, Switzerland. This article is an open access article distributed under the terms and conditions of the Creative Commons Attribution (CC BY) license (http://creativecommons.org/licenses/by/4.0/).
Copyright: This open access article is published under a Creative Commons CC BY 4.0 license, which permit the free download, distribution, and reuse, provided that the author and preprint are cited in any reuse.


