Submitted:
19 July 2025
Posted:
22 July 2025
You are already at the latest version
Abstract
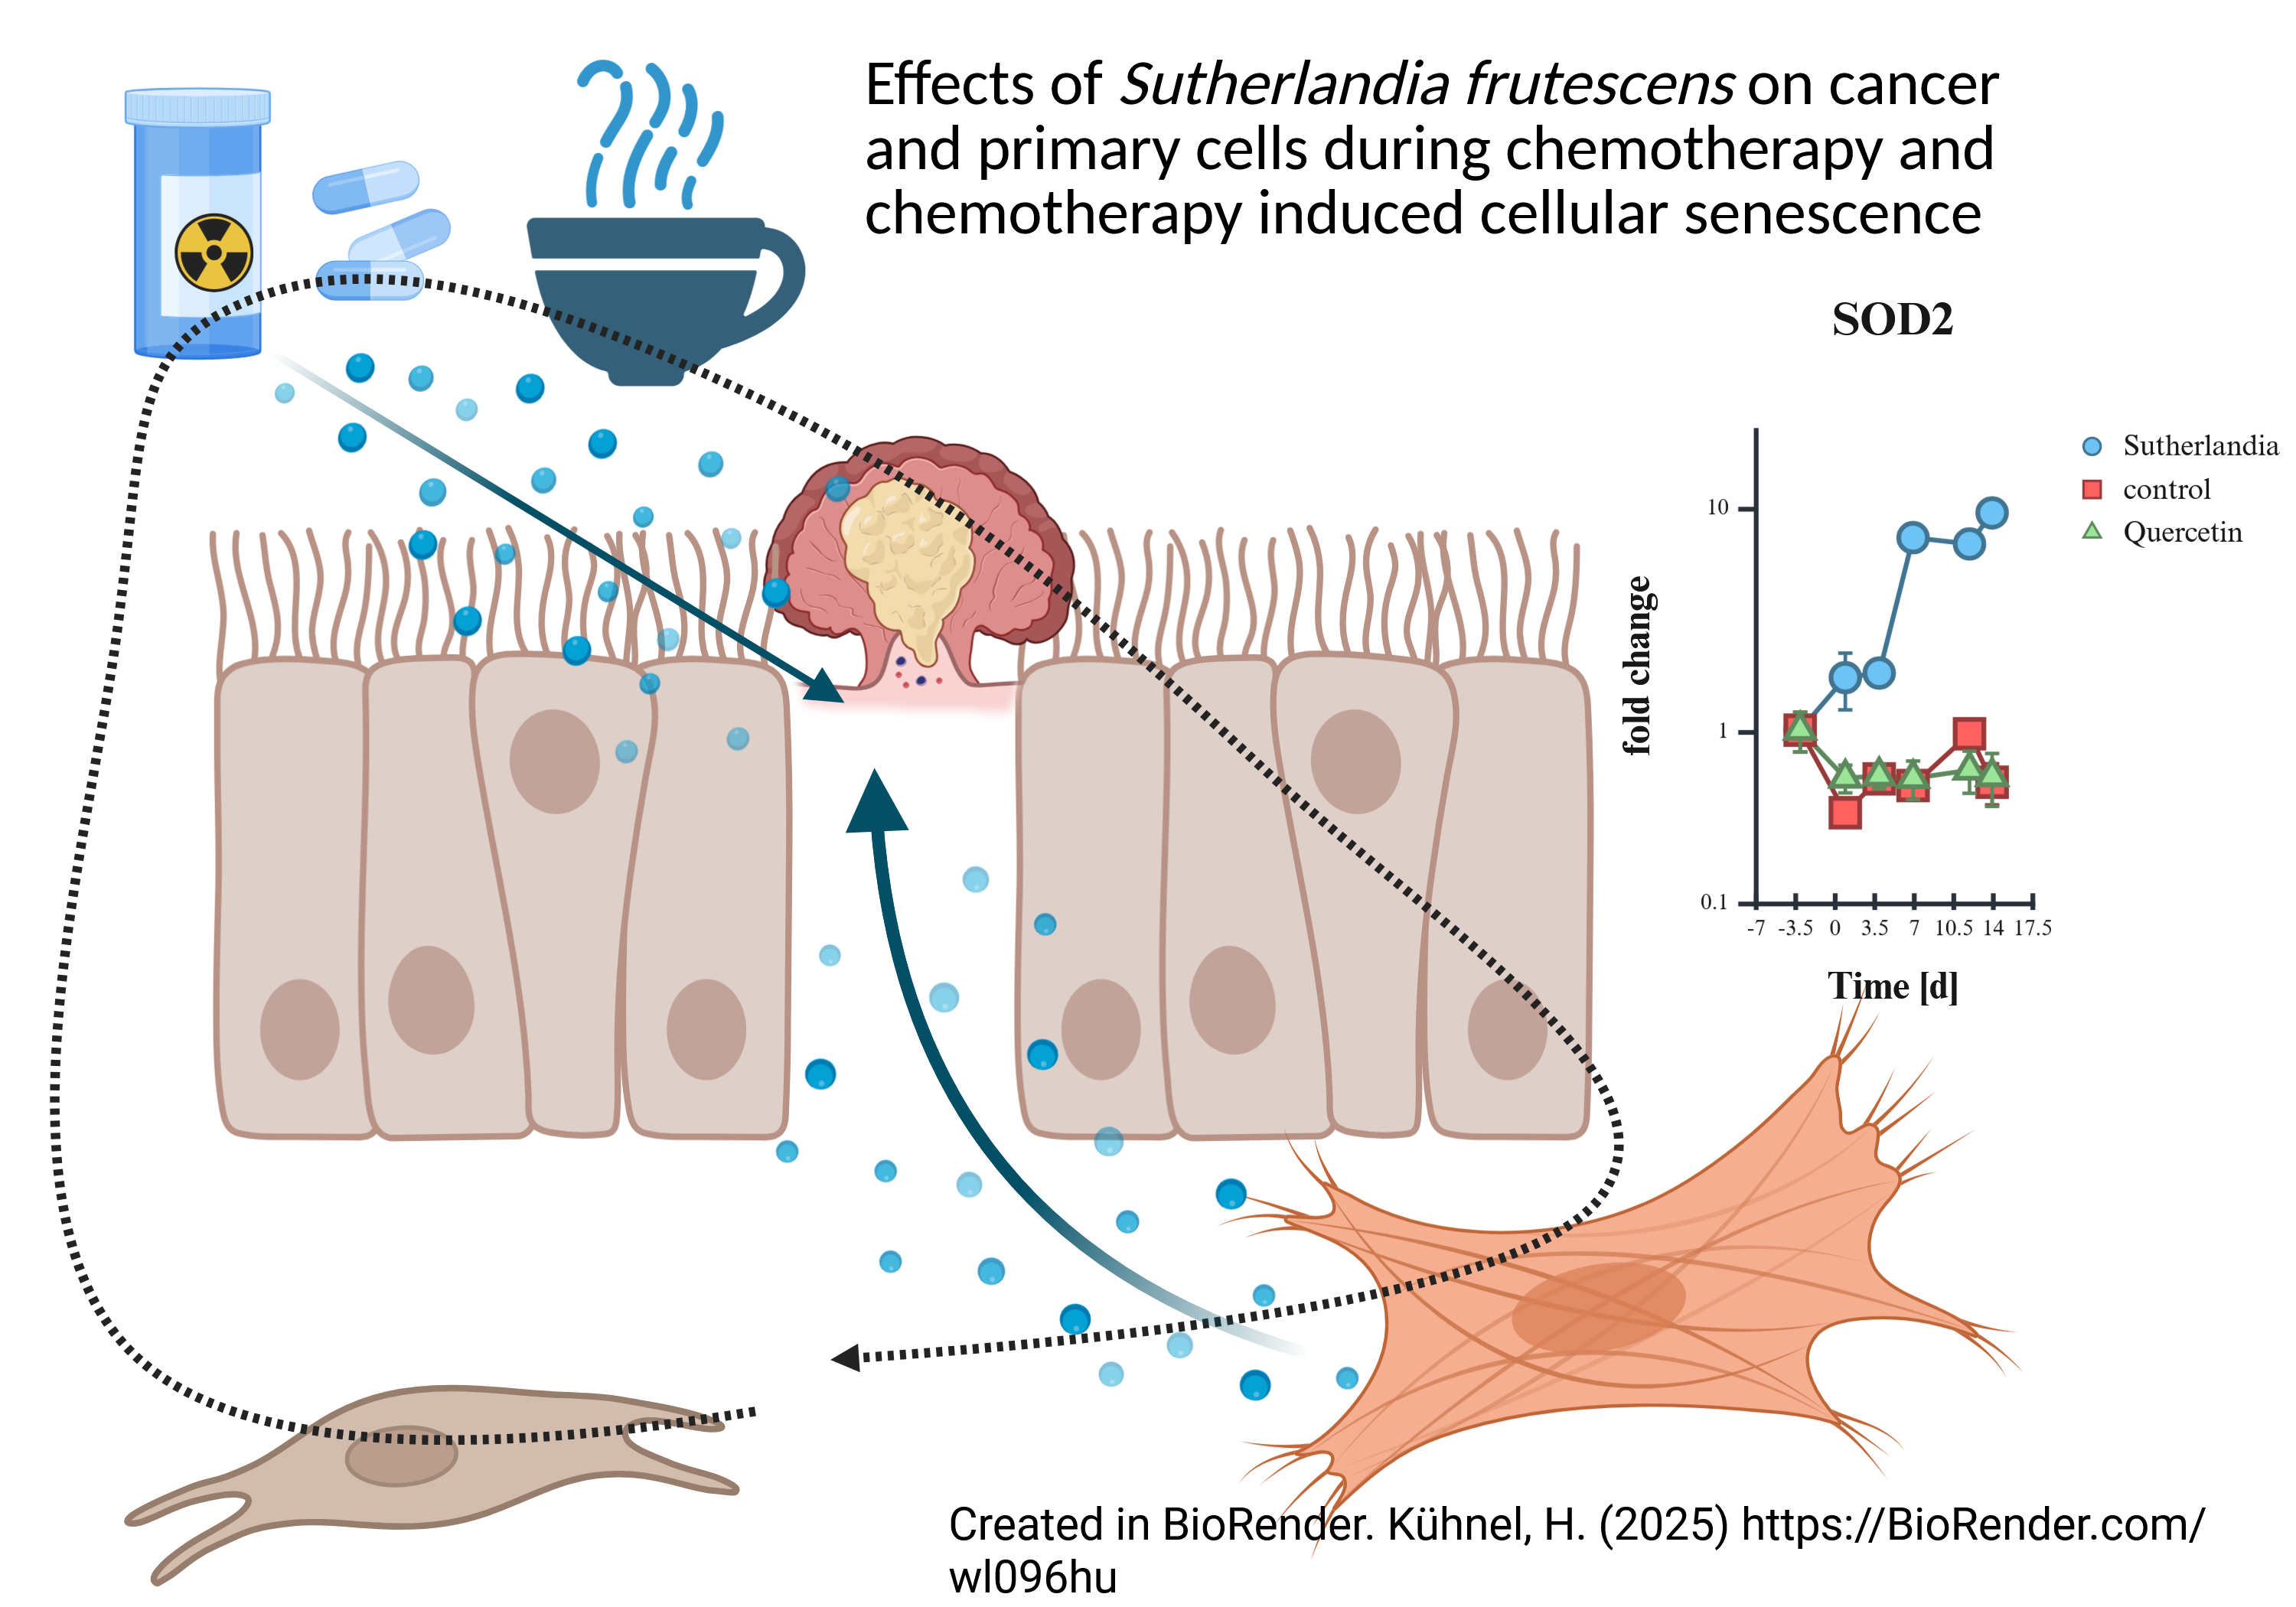
Background/Objectives: Cancer is a global health problem. Chemotherapeutics such as 5-fluorouracil and etoposide are important but limited by side effects and resistance. Cel-lular senescence can both suppress and promote tumors through therapy-induced senes-cence (TIS) and the senescence-associated secretory phenotype (SASP). Sutherlandia fru-tescens (SF), used in African traditional medicine, may have anti-cancer effects. As the use of herbal medicine increases, understanding its interactions with chemotherapeutic agents—particularly on cellular responses and senescence—is crucial. In this study, the effect of SF and chamomile on cancer cells (CaCo-2, PANC-1) and human skin fibroblasts (HDF) during chemotherapy was investigated.
Methods: Aqueous extracts of SF, and a commercially available product of SF capsules (Ballonerbse), and chamomile were tested for their antioxidant potential and physical properties. The cytotoxicity of chemotherapeutics and plant extracts was tested on cancer cells using XTT assay and confluence measurements. Senescence was induced in cancer cells and primary cells (HDF) by chemotherapy and subsequent treatment with plant ex-tracts. Cellular responses were assessed by microscopy, viability assays, IL-6 ELISA, flow cytometry and qPCR.
Results: The chemotherapeutic agents inhibited cell growth, with the PANC-1 cells re-sponding more sensitively to etoposide. The SF extract supported cell recovery after etopo-side treatment. IL-6 secretion and cell cycle effects were cell line-specific. In HDFs, SF sig-nificantly influenced the SASP factors interleukin 6 and 8 as well as MMP1. in addition, SF led to a significant upregulation of SOD2.
Conclusions: SF and chamomile extracts modulate chemotherapy-induced cellular re-sponses. In addition, SF is induces SASP factors in primary HDF cells, that could influ-ence the tumor milieu when rendered senescent as a byproduct of chemotherapy.
Keywords:
etoposide
; 5 fluorouracil
; cellular senescence
; tumor induced senescence
; Sutherlandia frutescens
; chamomile
1. Introduction
Cancer is fundamentally a disease of aging, with incidence rates increasing exponentially after midlife due to the cumulative effects of genomic instability, epigenetic changes, and age-related declines in tissue maintenance and immune surveillance. The close relationship between aging and cancer is underscored by the observation that most cancer cases occur in individuals over 65, reflecting the interplay of molecular and cellular processes that promote malignant transformation in the aging organism [1,2].
Cancer is caused by disturbances in cellular regulatory systems that lead to uncontrolled cell proliferation and the formation of tumors. While benign tumors remain localized, malignant cells invade the surrounding tissue and can spread throughout the body. Tumor development is a multi-step process involving genetic mutations and clonal selection, in which cells with growth advantages become dominant, leading to increasingly aggressive and fast-growing malignant tumors. Cancer is a major global health problem, responsible for nearly 10 million deaths annually and representing the highest burden of disease worldwide in terms of disability-adjusted life years (DALYs) [3]. Factors such as late detection, treatment resistance, environmental changes, and lifestyle contribute to the rising incidence and mortality. The economic and personal impact is profound, with financial burden affecting patient well-being and access to care, particularly in low-income regions [4].
A variety of model systems are used to advance cancer research and therapy, [5]. In vivo animal models provide a complex microenvironment but are limited by ethical concerns and resource requirements. In vitro models, particularly cancer cell lines grown in two-dimensional cultures, provide controllable, reproducible and cost-effective platforms for studying tumor biology, drug response, and resistance [6].
Chemotherapeutic agents remain central to cancer treatment, as they target rapidly developing cells through various mechanisms such as DNA damage, inhibition of nucleotide synthesis, or disruption of the cell division machinery. Drugs such as 5-fluorouracil, an antimetabolite [7,8,9], and etoposide, a topoisomerase inhibitor [10,11,12], are widely used but face problems such as limited selectivity, significant side effects, and the development of drug resistance. Overcoming these obstacles will require continued research into new therapeutic strategies, targeted treatments, and improved model systems to better predict clinical outcomes and reduce the global burden of cancer [13,14,15,16].
Cellular senescence is a state of permanent cell cycle arrest that cells enter in response to various stress factors such as DNA damage, telomere shortening, or oncogene activation. Naturally, senescence acts as a crucial tumor-suppressive mechanism by halting the proliferation of cells at risk of malignant transformation, thus serving as a barrier to cancer development [17,18]. In the context of cancer therapy, treatments such as chemotherapy and radiotherapy can induce senescence in both cancer cells and their surrounding non-cancer cells—a phenomenon known as therapy-induced senescence (TIS) [19,20]. While TIS can suppress tumor growth by halting the proliferation of cancer cells, senescent cells also secrete a number of bioactive molecules (the senescence-associated secretory phenotype, SASP) that can promote inflammation, tissue remodeling, and may even promote tumor progression, metastasis, or resistance to therapy [21,22].The interaction between cancer and cellular senescence is thus complex: senescence can both inhibit cancer development and reoccurrence and, under certain conditions, promote it. This duality has led to growing interest in strategies that not only induce senescence to suppress tumors, but also selectively eliminate senescent cells after therapy to prevent their potentially tumor promoting effects [23,24].
Sutherlandia frutescens (L.) (Fabaceae) is a perennial shrub native to southern Africa, including Namibia, Botswana, South Africa, and Lesotho [25]. Taxonomically, it belongs to the class Magnoliopsida,the order Fabales, the family Fabaceae, the genus Sutherlandia, and the species frutescens. The genus name honors James Sutherland, the first director of the Edinburgh Botanic Garden, while “frutescens” refers to the shrubby- form [26]. S. frutescens has a long- tradition in traditional medicine and is used by indigenous healers and herbalists for a variety of ailments, such as digestive disorders, diabetes, HIV/AIDS symptoms, internal cancers, inflammation, wounds, fever, and stress-related conditions [27]. Its therapeutic effects are thought to be based on the stimulation and modulation of the immune system. Recent studies have identified S. frutescens as a potential source of bioactive compounds that inhibit the viral enzymes of SARS-CoV-2 [28].
Among its various ethnopharmacological uses, S. frutescens is particularly known for its anticancer properties, which is reflected in its Afrikaans name “kankerbos” (“can-cer bush”). It is traditionally used for internal cancers, including esophageal, pancreatic, and colon cancer [29]. Anecdotal reports suggest that the quality of life and survival rates of cancer patients using aqueous or ethanolic extracts of the plant parts approve. A study conducted 2005 shows that Sutherlandia extracts reduced fatigue in cancer patients [30]. Several in vitro studies have shown that Sutherlandia extracts exert antiproliferative and pro-apoptotic effects on cancer cell lines [31].
The exact mechanisms underlying these effects are still unclear. Several bioactive constituents have been identified, including the amino acid L-canavanine, flavonol glycosides with kaempferol or quercetin aglycones (Sutherlandins), the cyclitol pinitol, and triterpenoid saponins of the cycloartanglycoside type (Sutherlandiosides). It is assumed that the pharmacological effect is based on synergistic interactions between these compounds, as the isolated components do not develop their full therapeutic effect. Recent research has focused on the cytostatic and cytotoxic activities of Sutherlandiosides, which are associated with membrane permeabilization, modulation of anion channel function, mitochondrial and endoplasmic reticulum dysfunction, and immune response [32,33].
Herb-drug interactions during cancer chemotherapy are increasingly recognized as clinically significant, particularly with widely used chemotherapeutic agents such as 5-fluorouracil (5-FU) and etoposide. Chamomile (Matricaria recutita), which serves as the herbal control preparation in this article, contains flavonoids such as apigenin and bisabol that inhibit multiple cytochrome P450 enzymes, including CYP3A4, potentially altering drug metabolism and enhancing the toxicity or efficacy of 5-FU depending on timing and dose [34]. Conversely, Sutherlandia frutescens induces CYP3A4 expression and activity—demonstrated by a 2–3-fold increase in CYP3A4 mRNA and enzyme function following chronic exposure—raising concerns that co-administration could reduce systemic concentrations of CYP3A4-metabolized drugs such as etoposide and compromise therapeutic outcome [35]. In addition, chemotherapy and radiotherapy can induce cellular senescence, which stops tumor cell proliferation but triggers a senescence-associated secretory phenotype (SASP) that can promote inflammation, therapy resistance, and relapse. Therefore, the combination of cytostatic strategies with senolytic or SASP-modulating measures (“senotherapy”) is being investigated to increase efficacy and attenuate the tumor-promoting effects of the remaining secreting cells [36,37].
In this study we will shed light on the complex interplay between cellular senescence, chemotherapy and herbal treatments with two different cancer cell lines and also one primary cell line.
2. Results
2.1. Definition of Reagents
2.1.1. Antioxidative Properties of Sutherlandia frutescens (SF)
The antioxidative potential of an aqueous extract of SF was tested using the DPPH assay. Vitamin C was used as a control to compare the antioxidant potential. The EC50 of Vitamin C of 42,75 µg/ml is at the upper limit of the literature values and the EC50 of the aqueous extract of SF is also quite high, at 836,4 µg/ml it is about 10-times higher than the EC50 of ethanolic extracts found in the literature. The antioxidant potential was measured throughout the extraction process and the entire time of use of the extract, and the mean of all these measurements was used for this graph. The antioxidant potential did not change significantly during this time (Figure 1).
2.1.2. Physical Properties of Aqueous Herbal Extracts (tea)
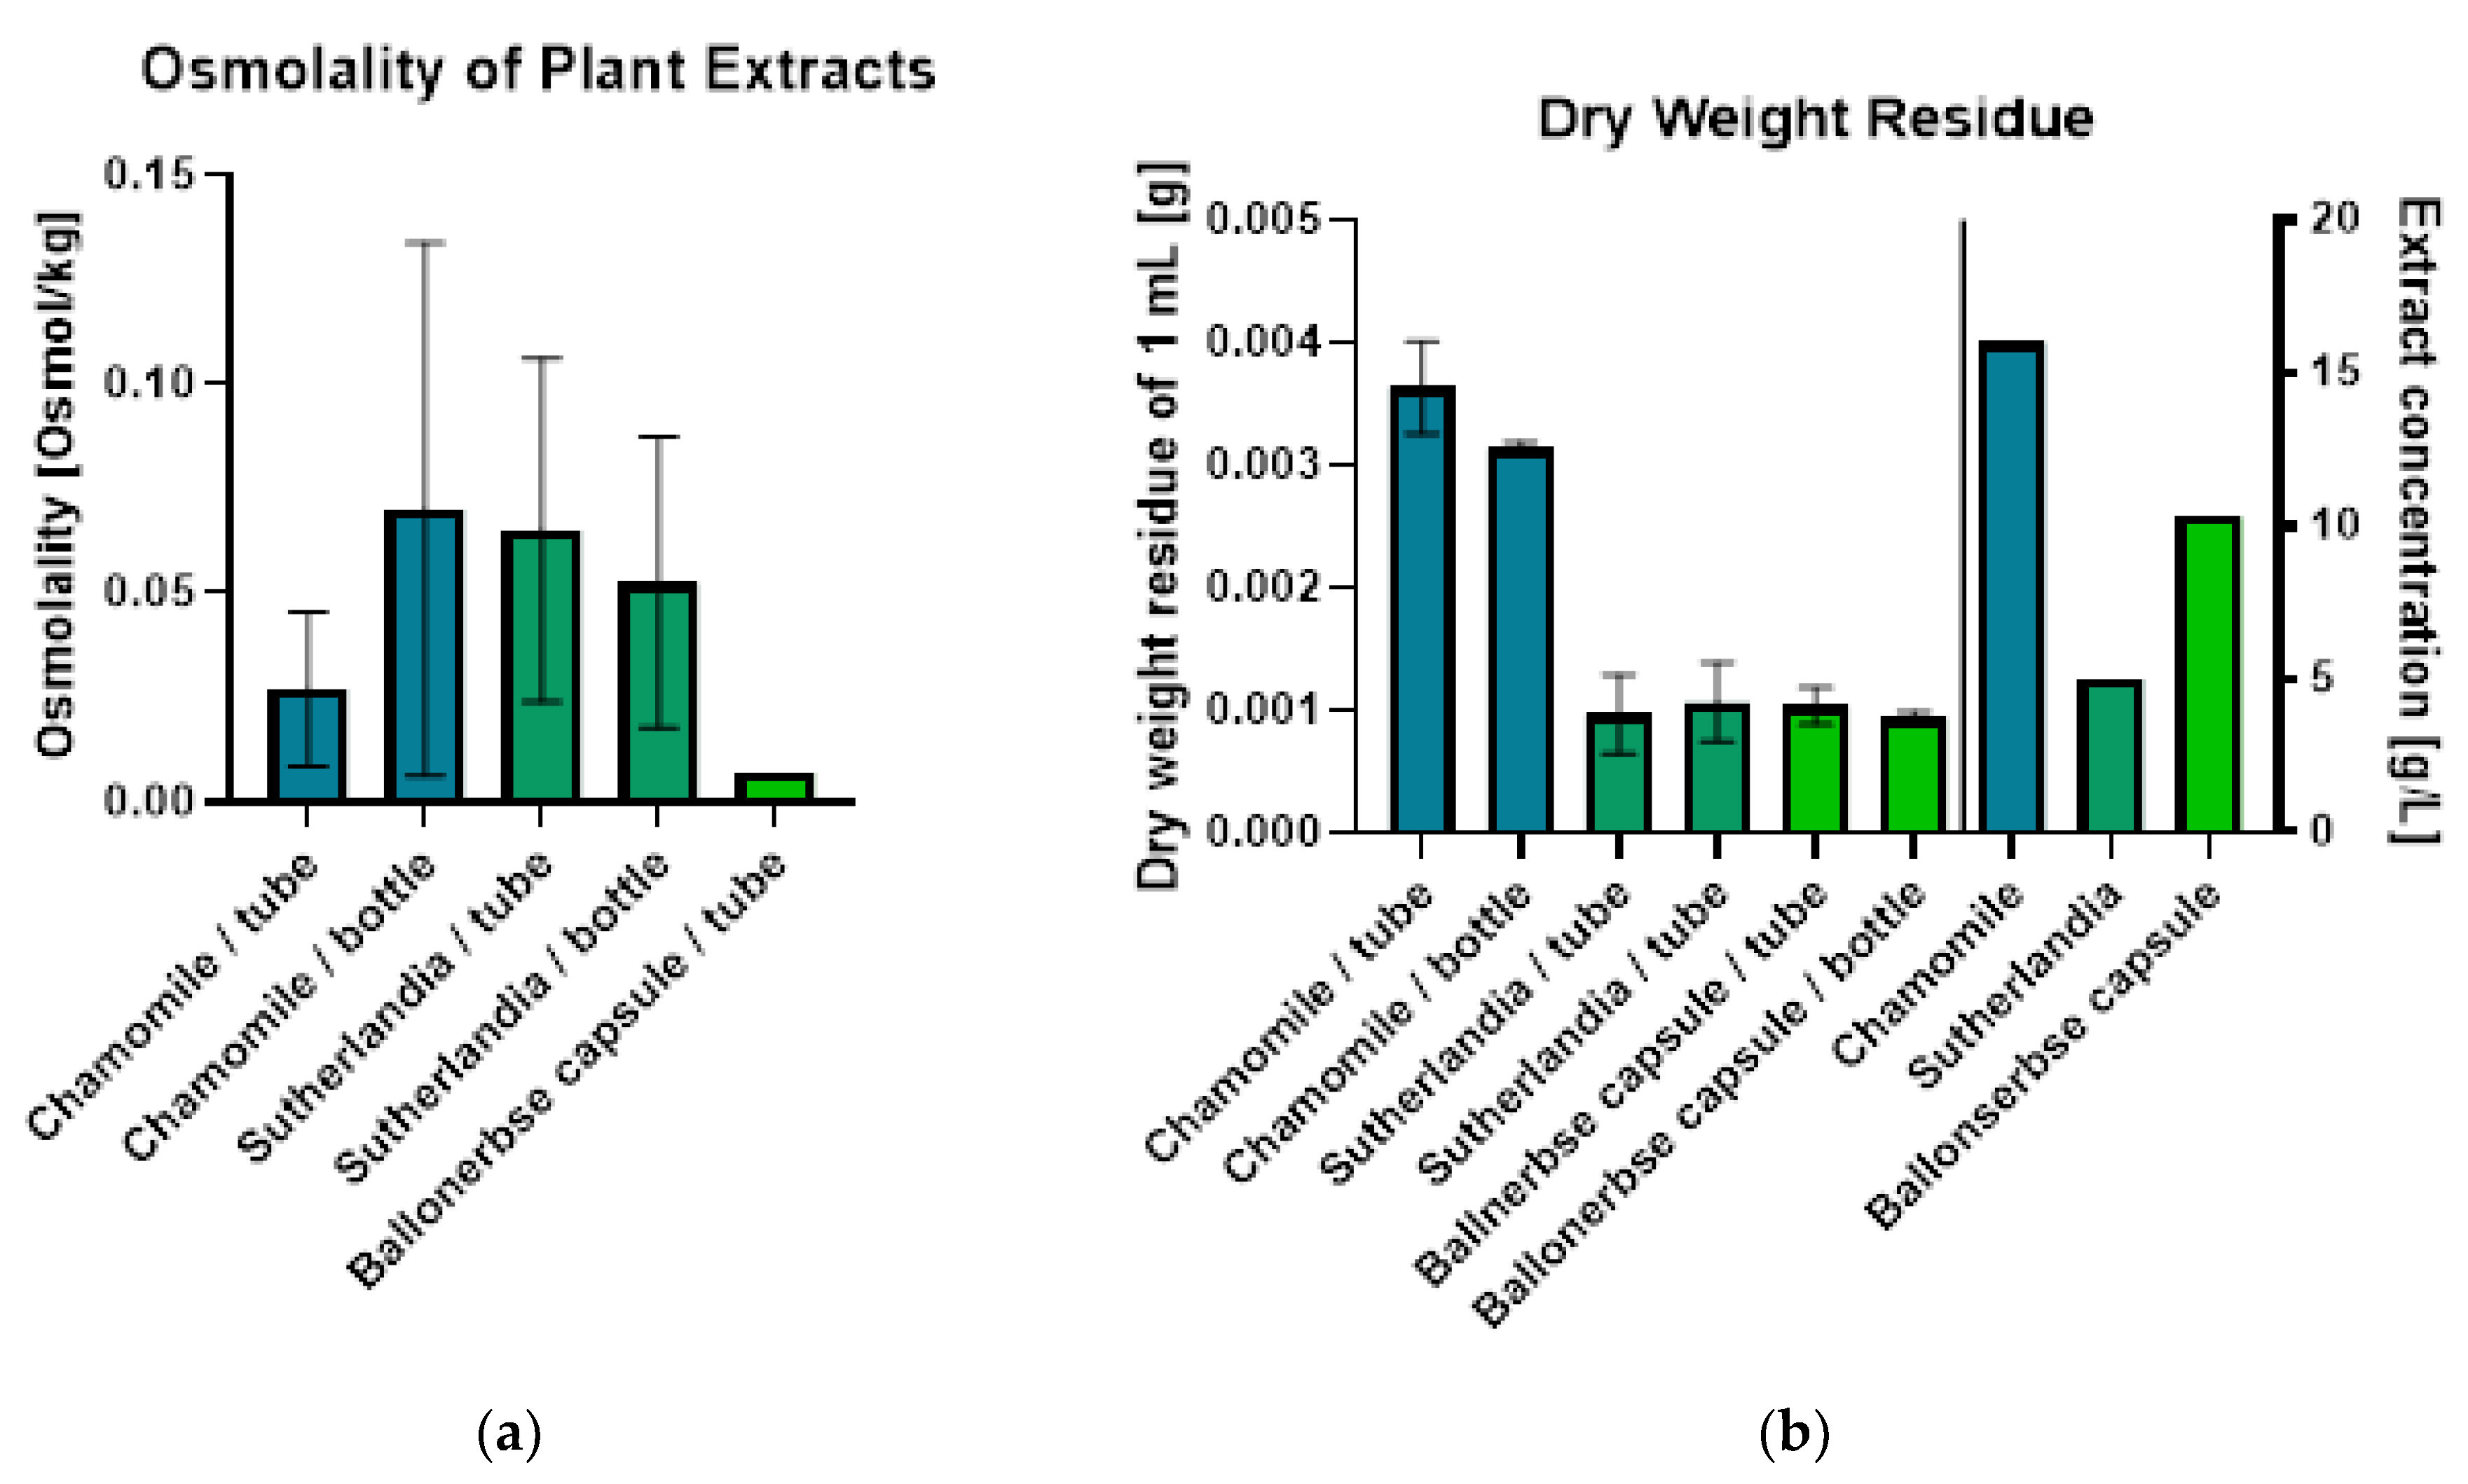
Figure 2 a shows the measurements of osmolality, which displayed high variability in duplicate measurements (n=2), except for the extract from Ballonerbse (we use the German name to distinguish between commercially obtained SF (Ballonerbse) and the SF we collected in South Africa) which was repeatedly produced “Spontaneous crystallization” errors. The osmometer, which was calibrated at 0.3 osmol/kg, proved to be unsuitable for the low osmolality values measured (mostly <0.1 osmol/kg, with Ballonerbse at 0.007 osmol/kg). Osmolality values varied inconsistently between storage containers: chamomile extract ranged from 0.027 Osmol/kg (tube) to 0.07 Osmol/kg (bottle), while Sutherlandia showed 0.065 Osmol/kg (tube) and 0.053 Osmol/kg (bottle).
Due to limitations in osmolality measurement, the determination of the dry weight residue provided more reproducible results (Figure 2 b) when measured in triplicate (n=3). Chamomile extract showed the highest dry weight residue (0.0036 g/mL in tube, 0.0031 g/mL in bottle), while Sutherlandia and Ballonerbse extracts had similar, lower values (approximately 0.001 g/mL regardless of storage vessel). The dry weight residue ratio between chamomile and Sutherlandia extracts (3:1) correlated with their extract concentrations. However, Ballonerbse extract’s dry weight residue was comparable to Sutherlandia despite having twice the extract concentration, likely due to differences between direct plant material extraction versus pre-processed capsule products. The type of storage container had no significant effect on the measurement of the dry weight of residues.
Figure 2.
Results of plant extract characterization - osmolality and dry weight residue. Error bars show the mean and standard deviation of duplicate measurements (osmolality: n=2, dry weight residue: n=3).
Figure 2.
Results of plant extract characterization - osmolality and dry weight residue. Error bars show the mean and standard deviation of duplicate measurements (osmolality: n=2, dry weight residue: n=3).
2.1.3. Cell Growth
Both cell lines showed continuous growth with a constant growth rate as can be seen in Figure 3. PANC-1 cells do grow slower than CaCo-2 cells in our hands.
2.1.4. Chemotherapeutic Treatment Cytotoxicity of 5 FU
Figure 4 shows the relative XTT absorbance values at the tested 5-fluorouracil-concentrations as per-centage of the untreated control. Non-linear regression was applied to plot a sigmoidal dose-response curve (Asymmetric Sigmoidal, 5PL, X is log/concentration). This fit was used to calculate the IC50 concentrations of 5-fluorouracil on the treated cell lines under assay conditions. The IC50 values were calculated as 3.691 µM for the PANC-1 cell line and 6.422 µM for the CaCo-2 cell line.
2.1.5. Cytotoxicity of Herbal Extracts
The XTT assay evaluated the cytotoxic effects of plant extracts on CaCo-2 and PANC-1 cell viability, with results expressed as percentage of untreated control (n=4 replicates). Chamomile extract (Figure 5 a) showed the strongest antiproliferative activity, with 8.0 g/L being highly cytotoxic and reducing the viability of CaCo-2 to 0.9% and that of PANC-1 to 3.3% of the control. At 2.7 g/L, chamomile still significantly reduced viability to 49.5% (CaCo-2) and 70.4% (PANC-1). In contrast, the Sutherlandia extract (Figure 5 b) at a concentration of 2.5 g/L showed moderate effect by reducing the viability of CaCo-2 to 83.9% and that of PANC-1 to 80.4%. Similarly, Ballonerbse extract (Figure 5 c) at 5.2 g/L reduced the viability of CaCo-2 to 81.9% and that of PANC-1 to 75.4%.
The concentration-response relationships showed that chamomile concentrations above 5 g/L are cytotoxic for both cell lines, while Sutherlandia and Ballonerbse extracts probably require concentrations above 10 g/L to achieve significant antiproliferative effects. Concentrations below 1 g/L for Sutherlandia and Ballonerbse, or below 0.1 g/L for chamomile, did not significantly affect cell viability and were therefore selected as sublethal concentrations for subsequent senescence induction experiments.
2.2. Treatments and Cellular Senescence
2.2.1. Cell Proliferation Monitoring
Growth curves from daily confluence measurements (n=9) showed different cell lines and drug-specific responses. CaCo-2 cells (Figure 6 a) treated with 5-fluorouracil showed concentration-dependent effects: low concentrations (1-2 µM) produced growth like controls, medium concentrations (4-8 µM) caused slower growth but reached 100% confluence by day 21, and 16 µM caused prolonged inhibition (10 days) with 80.5% final confluence. PANC-1 cells (Figure 6 b) showed similar sensitivity to 5-fluorouracil at low concentrations but recovered from higher concentrations (16-32 µM) after 10 days, reaching 97.9% and 76.6% confluence, respectively. Etoposide treatment showed differential cell line sensitivity: CaCo-2 cells (Figure 6 c) recovered after 13 days reaching 79.2% (25 µM) and 53.8% (50 µM) confluence, while PANC-1 cells (Figure 6 d) were more sensitive, showing cytotoxic effects with final confluence of only 24.2% (25 µM) and 18.7% (50 µM), indicating growth arrest rather than recovery.
2.2.2. Microscopic Morphology Analysis Summary
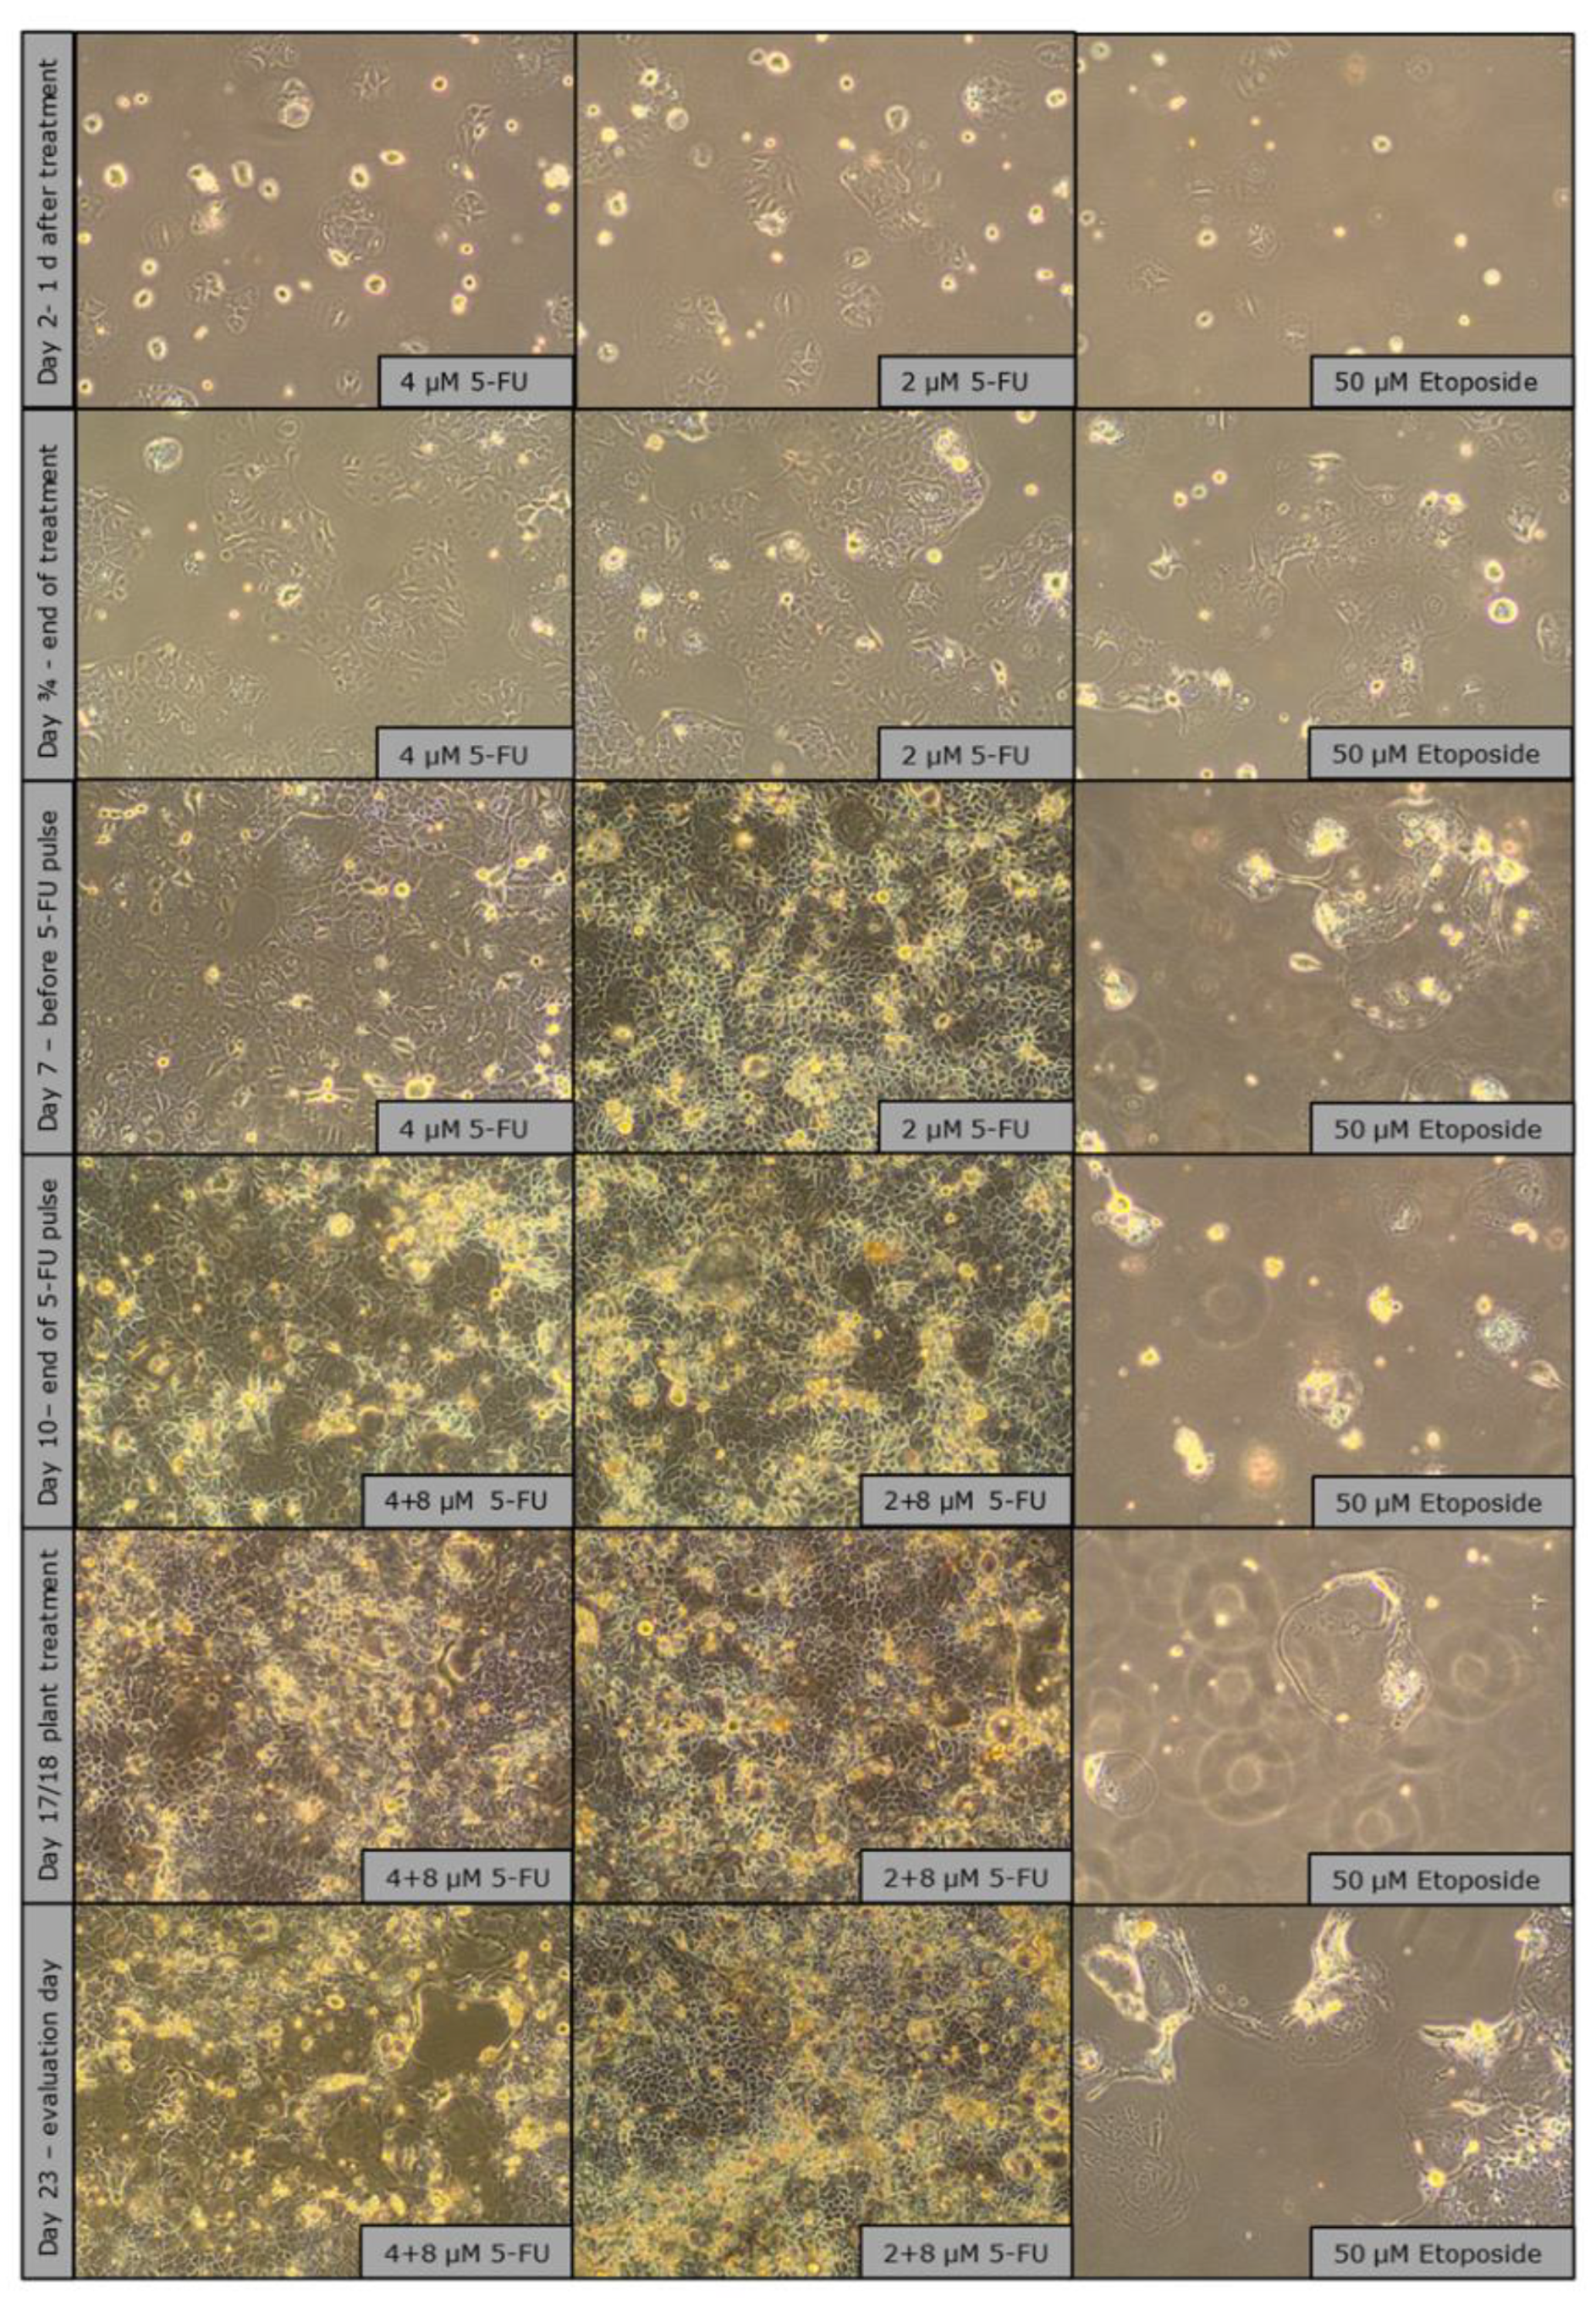
Microscopic images of CaCo-2 cells over a period of 23 days showed clear morphological responses to chemotherapy treatments in flask culture. Cells treated with 5-fluorouracil- (2 µM and 4 µM) grew rapidly and reached 50% confluence on day 3 and 4 and almost 100% confluence on day 7, on which day an additional pulse treatment with 8 µM was applied. Despite the treatment, the cells continued to proliferate (as in the cell proliferation monitoring experiment Figure 6 a) and formed multilayers with some detached cells, similar to overgrown routine cultures. No obvious morphological changes were observed and both concentrations produced similar visual results. The treatment corresponds to mild chemotherapy. Senescence induction was carried out with Etoposide, which was much easier to perform and with which there is a lot of experience (Figure 7).
Etoposide-treated cells (50 µM) showed clear treatment effects by maintaining low confluence (30% at the end of treatment, <30% at day 7) and exhibiting significant morphological changes, including increased granularity, increased size and circular shape. A growth stop was observed during the entire trial. However, toward the end of the 23-day period, small patches of cells with “healthy” morphology began to reappear, suggesting a possible recovery or selection of re-resistant cell populations (Figure 7).
Figure 7.
Observation images (brightfield microscope, 10X objective) of senescence induction in T-75 over a culture period of 23 days.
Figure 7.
Observation images (brightfield microscope, 10X objective) of senescence induction in T-75 over a culture period of 23 days.
2.2.3. Cell Harvest Results from Senescent Flask Cultures
An analysis of the cell harvest on day 23 showed significant treatment-dependent effects on both the viability and the proliferation capacity of the cells (Figure 8). Cell viability was consistently reduced in all treatment groups compared to untreated controls (96.5%) and ranged from 66% to 89.5%. Cells treated with 2 µM 5-fluorouracil had the lowest viability, followed by 1 g/L Sutherlandia extract (66%), while the highest viability was observed after treatment with 50 µM etoposide and 1 g/L Sutherlandia extract (89.5%). Cell proliferation showed different patterns with the different chemotherapy agents: - flask treated with 5-fluorouracil consistently yielded higher cell numbers than cultures treated with etoposide-, with the maximum harvest of 7.84 million cells from the group treated with 4 µM 5-fluorouracil plus 0.1 g/L chamomile. In cells treated with etoposide-, the Sutherlandia extract showed a better protective effect compared to chamomile: 3.97-4.33 million cells compared to 1.57-2.06 million cells (respectively). The relatively low viability (80-81%) in etoposide-treated groups in combination with the reduced cell count indicates growth arrest rather than direct cytotoxicity, suggesting successful senescence induction. These results show that plant extracts can modulate chemotherapy-induced cellular responses, with Sutherlandia showing efficacy in supporting cell recovery following etoposide treatment.
2.2.4. End-Point Evaluation by PrestoBlue & Hoechst Assay
The viability of the cells was examined with PrestoBlue (metabolic activity) (Figure 9 a) and Hoechst (DNA content) (Figure 9 b) after chemotherapy and the phytochemical treatments. CaCo-2 cells showed moderate sensitivity, with etoposide viability ranging from 65.6-87.0% and 5-fluorouracil maintaining >84% viability at all concentrations. PANC-1 cells (Figure 10 a and b) showed dramatic sensitivity to chemotherapy, with treatments with etoposide resulting in <20% viability (maximum 18.6%), while treatment with 5-fluorouracil maintained >80% viability (minimum 87.0%). Optimal recovery occurred with 1 µM 5-fluorouracil followed by plant extracts: CaCo-2 cells reached 111.7% (chamomile), 108.4% (Sutherlandia), and 97.3% (Ballonerbse) viability, while PANC-1 cells reached 106.6% (Sutherlandia), 101.35% (chamomile), and 97.0% (Ballonerbse). It is noteworthy that cells treated with 32 µM 5-fluorouracil had the highest DNA content despite lower viability, and that higher concentrations of etoposide sometimes led to better viability than lower concentrations. The results show that 5-fluorouracil consistently outperformed etoposide in cell recovery, with PANC-1 cells showing more pronounced chemotherapy sensitivity compared to CaCo-2 cells, but less variability between treatment conditions.
2.2.4. Senescence-Associated-β-Gal Detection
The SAβ-Gal assay failed to evaluate senescence induction due to confluence-dependent false positive staining, a well-documented limitation in senescence research. The assay produced intense, nonspecific blue staining within 6 hours across all conditions, including young controls, which correlated with cell density rather than actual senescence. This false-positive staining occurred because overgrown, confluent cultures at suboptimal pH have increased lysosomal β-galactosidase activity, making it detectable in the SAβ-Gal assay due to increased lysosomal content rather than true senescence-associated enzyme activity. The fundamental problem was that confluent epithelial layers showed continuous blue staining regardless of chemotherapeutic treatment, while individual cells in sub confluent areas remained unstained, preventing adequate quantification and evaluation. The staining time of 6-hour was also inadequate compared to the 12-16 hours normally required for optimal results, although the rapid intense staining under all conditions clearly indicates non-specific enzymatic activity. For future detection of senescence, the cells should be kept at a confluence of ≤50-80% during the test. Several senescence markers, p21 and p16INK4a, were analyzed by Western blot but did not show specific bands (Figure 11 a and b).
2.2.4. IL-6 Measurements in a Screening Experiment
Figure 12 shows the measured IL-6 concentrations in the conditioned medium of CaCo-2 (Figure 12 a) and PANC-1 (Figure 12 b) cells after chemotherapeutic and subsequent phytochemical treatment. Overall, CaCo-2 cells secreted higher amounts of IL-6 than PANC-1 cells across under most treatment conditions, but no clear correlation was observed between IL-6 secretion and the concentration of chemotherapeutic agent or phytochemical treatment in CaCo-2 cells. For example, the highest IL-6 levels in CaCo-2 cells treated with 5-fluorouracil were differentially induced by different phytochemicals, with Ballonerbse and Sutherlandia extracts producing the highest concentrations at different drug doses, and the maximum IL-6 concentration (3.3 pg/mL) was observed after 50 µM etoposide and 1 g/L Sutherlandia. In contrast, PANC-1 cells showed a more consistent response, with IL-6 secretion related to the type of phytochemical treatment rather than the chemotherapeutic dose. In all PANC-1 cells treated with 5-fluorouracil-, the highest IL-6 levels were measured after treatment with 0.1 g/L chamomile, while Ballonerbse consistently resulted in the lowest IL-6 levels, with Sutherlandia-induced levels in between. Treatment with Etoposide resulted in very low or undetectable IL-6 levels in PANC-1 cells, especially in combination with chamomile or Sutherlandia. In the control groups, PANC-1 cells without chemotherapeutic treatment also secreted the most IL-6 after chamomile exposure, with major differences between phytochemical treatments in the resting and young controls, while DMSO controls showed only minimal differences. Overall, these results suggest that the patterns of IL-6 secretion are cell line-dependent and are more strongly influenced by phytochemical treatment in PANC-1 cells, whereas CaCo-2 cells show higher but more variable IL-6 responses.
2.2.4. Flow-Cytometric Cell Cycle Analysis
Flow cytometric analysis using propidium iodide (PI) showed different cell cycle phase distributions after chemotherapy and phytochemical treatments. The gating strategy is shown in Figure 13. The flow cytometry results were interpreted by plotting the forward scatter against the side scatter to identify and eliminate viable single cells. The exclusion of duplicates was achieved by analyzing the pulse shape, i.e., plotting the height against the area of forward scattering. The forward scatter was plotted against the PI signal to identify PI-stained cells. Finally, a histogram of particles could be created from which the percentages of cells in the various cell cycle phases could be determined. These four diagrams were included in the output/report of the flow cytometry results for each sample. Figure 13 shows the plots for the measurement of cells treated with 4 μM 5-fluorouracil and then with 0.1 g/L chamomile extract as an example.
The results in Figure 14 show G2/M arrest patterns consistent with therapeutic-induced senescence, with most treatment groups having equal or larger G2/M populations compared to S-phase populations. The most pronounced G2/M accumulation (36.2%) occurred in cells treated with only 0.1 g/L chamomile extract, while the difference between G1 (41.5%) and S phase populations (21.4%) was the smallest. Similarly, cells treated with 1 g/L SF extract without chemotherapy showed comparable G2/M enrichment patterns. Interestingly, the cells that receive sequential chemotherapy followed by phytochemical treatment showed a cell cycle distribution that was more like the untreated control group, which was particularly evident in the group receiving 2 µM 5-fluorouracil plus 1 g/L SF (G1: 68.5%, S: 14%, G2/M: 15%). Higher 5-fluorouracil concentrations (4 µM) provided increased populations in the S and G2/M phase (40% combined) compared to the G1 (57% after chamomile, 52.5% after SF), while lower concentrations (1-2 µM) and etoposide treatments showed predominant G1 accumulation (61-69%) with reduced S and G2/M populations (19-37% combined). These results suggest that phytochemical treatments can modulate cell cycle arrest induced by chemotherapeutic-agents and possibly influence senescence pathways by regulating the G2/M checkpoint.
2.3. Effect of SF on Primary Dermal Fibroblast Cells with Cellular Senescence Induced by Chemotherapy (Etoposide)
2.3.1. Cell Proliferation Monitoring
An experimental setup is shown in Figure 15. The cells were seeded one day before the etoposide treatment which lasted 2 days. The cells were then incubated with quercetin, SF or water as a vehicle control. This treatment lasted 14 days, with sampling on day 1, 4, 7, 12 and 14 after etoposide treatment.
The HDF-cells were counted and no difference in cell number was observed between quercetin, SF and the control. Growing (untreated) cells grew to confluence within 6 days as shown Figure 16. All groups treated with etoposide no longer grew to confluence, indicating senescence induction. This aging model has been extensively tested in previous publications [38,39,40]. The different treatments (control, SF and quercetin) did not differ from each other.
2.3.2. Gene Expression Analysis
The analysis of gene expression revealed major differences between the treatments. Interleukin 1a (IL-1a) showed little difference between treatment groups (Figure 17 a), but Interleukin 8 (IL-8) (Figure 17 b) showed a massive increase in mRNA compared to quercetin and the control samples (all graphs n=2). In contrast to metalloprotease 1 (MMP1), the transforming growth factor β1 (TGF-β1) (Figure 17 c) was not differentially expressed. MMP1 (Figure 17 d), a major factor of SASP as well as IL-8, showed massive induction of mRNA, which was analyzed by SYBR green qPCR. In addition, SOD2, an antioxidant enzyme of mitochondria, was also massively induced (Figure 17 e). Finally, the protein Interleukin 6 (IL-6) was also quantified by ELISA and was also strongly upregulated (Figure 17 f). In summary, there is a strong activation of SASP, inflammatory markers such as IL-6 and 8 are upregulated, as is MMP1. Another defense mechanism against mitochondrial oxidative stress, SOD2, is also upregulated.
Neither the tested genes for cellular defense and antioxidant response, stress response and metabolic regulation, cell signaling and growth control, mitochondrial function nor structural support were affected by SF treatment compared to control. Data in the Figure 18 show fold changes of genes differences to control.
3. Discussion
The antioxidative potential of the aqueous SF extract was significantly lower than that of vitamin C and ethanolic SF extracts from the literature [41], with an EC50 value of 836.4 µg/mL compared to 42.75 µg/mL of vitamin C, indicating an approximately 20-fold lower antioxidant activity. This lower effectiveness is attributed to the polarity differences between water and ethanol as extraction solvents, as polar solvents such as ethanol extract the phenolic compounds and flavonoids responsible for the antioxidant effect more effectively.
Physical characterization of herbal extracts revealed that osmolality measurements were unreliable for low-osmolality samples due to technical limitations, while dry weight residue determination provided more reproducible results, with chamomile extract showing the highest values (0.0036 g/mL) compared to SF and Ballonerbse extracts (~0.001 g/mL). The observed ratio of 3:1 between chamomile and SF dry weight residues corresponded to the differences in extract concentration, confirming the validity of the method for quantifying extract concentrations.
Both cancer cell lines show linear growth curve with common doubling rates. Growth was inhibited by 5 FU treatment. The PANC-1 cell line is more sensitive to this agent than the CaCo-2 cell line, with a difference between IC50 values of 2.731 µ mol/L.
The toxicity of the herbal extracts showed the response of the chamomile extract, but the concentration was quite high. Sutherlandia and Ballonerbse induced an even lower response in the cancer cell lines. In general, the toxic effect was a thousand-fold lower than chemotherapeutic treatment.
The monitoring of cell proliferation has shown that even if growth is suppressed, the cells can continue to grow over a longer period with short-term treatment. Compared to the classical toxicity assessment in 2.1.4, this long-term assessment shows a different picture. To achieve growth arrest, the treatment concentration had to be increased tenfold (32 µM) compared to short-termIC50 of 3.691 µM determined for the CaCo-2 5-FU combination. It was not possible to stop the growth of PANC-1 cells with 5-FU at the selected concentrations. PANC-1 cells respond better to etoposide than CaCo-2 cells. The suppression of confluence monitoring with TECAN was confirmed by microscopic imaging.
Analysis cell harvest on day 23 showed that all chemotherapies reduced cell viability compared to controls as expected, with the lowest viability observed in the 2 µM 5-fluorouracil plus SF group (66) and the highest in the 50 µM etoposide plus SF group (89.5%). This suggests that the SF extract modulates chemotherapy-induced responses and promotes cell survival probably by facilitating senescence-associated growth arrest rather than by direct cytotoxicity. Interestingly, the group treated with 4 µM 5-FU (in all herbal treatments) grew better than the group treated with 2 µM. The effect corresponds to what is known as hormesis - a biphasic dose-response relationship, in which low doses of a substance can cause effects that are opposite to those of higher doses. This phenomenon has been documented in the context of 5-FU in several cancer cell lines and experimental conditions [42].
The addition of plant extracts after 5-fluorouracil treatment of 1 µM further enhances cell regeneration in both cell lines, suggesting a protective or regenerative effect. Overall, these results show that 5-fluorouracil is more favorable for maintaining cell viability, and that plant extracts can improve recovery after chemotherapy, particularly in the context of less aggressive chemotherapeutic regimens. The different reactions between CaCo-2 and PANC-1 cells also highlight lineage–specific differences in chemosensitivity and recovery potential.
The SAβ-Gal assay was unreliable for detecting senescence in this study due to false positive results caused by cell density, which underscores the need for proper cell density control and the use of additional markers for senescence for accurate assessment. We performed a p16 western blot, but no band was detected. Western blots with p16 are not so easy to perform due to the lack of good antibodies.
The results show that IL-6 secretion in response to chemotherapeutic and herbal treatments is highly dependent on the cell line: CaCo-2 cells consistently released higher, but more variable, IL-6 levels without a clear association with specific treatments, while in PANC-1 cells, IL-6 secretion was overall lower and more predictably influenced by the type of herbal substance, particularly with chamomile, which induced the highest IL-6 levels, and Ballonerbse, which induced the lowest levels; thus, the modulation of inflammatory signaling by these agents is both cell type– and treatment–specific, with PANC-1 cells showing greater sensitivity to the herbal modulation of IL-6 than CaCo-2 cells.
The flow cytometry analysis revealed that both chemotherapy and herbal treatments significantly altered the distribution of cell cycle phases, with indications of G2/M arrest suggesting therapy-induced senescence. It was found that the greatest accumulation of G2/M was observed in cells treated with chamomile or SF extracts alone, while sequential chemotherapy followed by herbal treatment led to cell cycle profiles similar to those of untreated controls, particularly in the group with 5-fluorouracil 2 µM plus 1 g/L SF. Higher concentrations of 5-fluorouracil led to an increased accumulation of the S and G2/M populations, while lower concentrations and etoposide treatments led to predominant accumulation of the G1population. These results suggest that phytochemical extracts can modulate chemotherapy-induced cell cycle blockade, which may influence the induction or resolution of senescence by affecting the G2/M checkpoint regulation.
A massive upregulation of SASP-factors is observed in the treatment of primary HDF cells. We observed the same effect with chamomiles in an earlier study (which is why we used chamomile as a control plant in this study). We do not know why these herbs have a pro-inflammatory effect in our hands. However, this effect is well documented and proven. We tested two different HDF cell lines in the study of Imb et al. [40] and observed the same effect. One possible reason could be bacterial contamination, but all of our extracts were sterile filtered before treatment, and no bacterial growth was observed in our cultures.
Despite this, after treatment with etoposide, two important markers for SASP, which indicate an inflammatory response to SF treatment showed a strong induction of IL-8 and IL-6 (even on the protein level). Additionally, MMP1 is also over-regulated. SOD2, a mitochondrial antioxidant enzyme, also shows a massive induction. The simultaneous upregulation of SASP factors and SOD2 implies that SF does not prevent the establishment of SASP in senescent fibroblasts but may help the cells cope with oxidative stress. The antioxidant defenses mechanism is strengthened, which may protect the cells from further oxidative damage, but does not reverse or prevent the senescent phenotype. Substances in plant extracts can also cause oxidative stress [43]. Polyphenols may penetrate deep into cells and even induce antioxidant defense in organelles.
Acute inflammation in the tissue surrounding a tumor can have positive effects by enhancing the body’s immune response against tumors. Promote the maturation and activation of dendritic cells (DCs), which are crucial for presenting tumor antigens to T cells and initiating an effective immune response against the tumor. Promote the activation of effector T cells, that can directly attack and destroy tumor cells. Help eliminate damaged cells, pathogens, and irritants, thereby maintaining tissue homeostasis and possibly limiting tumor growth in the early stages [44].
4. Materials and Methods
4.1. Extract Preparation
The chemotherapeutic drugs used for the experiments in this study comprised 5-Fluorouracil (Sigma-Aldrich F6627) and Etoposide (Sigma-Aldrich E1383).
As phytochemical treatments, plant extracts prepared from the following plant drug material were selected for this study: Pharmacopeia quality Chamomile Tea (Matricariae Flos, Kottas Kräuterhaus), dried seed pods of Sutherlandia frutescens (generously provided by Prof. Mag. rer. nat. Karl Rumbold, PhD, FH Campus Wien) and a nutraceutical product (“Ballonerbse Vitalstoff Kapseln”, Hirundo Products) of the same plant.
Extracts of the plant materials were produced with the same adjustments due to the individual manufacturing instructions for the products. The medicinal product chamomile tea, consisting of dried chamomile flowers, was used directly to produce an aqueous extract. According to the manufacturer`s recommendations, a quantity of 4 g was extracted in 250 mL of deionized water. A protocol to produce Sutherlandia capsule extract (SPE) (Dr. Carl Albrecht, 2021) was followed for the dried Sutherlacapsules.capsules. 0.5 g of the seed capsules were weighed and blended with a Tristar blender (Tristar BL-4435) before being extracted in 100 mL of deionized water. The Ballonerbse capsules were opened and the content of 2 capsules, which correspond to 1.29 g, were extracted in 250 mL of deionized water. The resulting extract concentrations were therefore 16.01 g/L for the chamomile extract, 5.01 g/L for the Sutherlandia pod extract, and 10.32 g/L for the Ballonerbse product.
A tea was prepared by stirring herbs after reaching the boiling point for 10 min. Extraction was done with continuous stirring. The fresh extracts were first filtered through fluted filters (Macherey-Nagel 531018) to remove particles, followed by sterile filtration using syringe filters (cobetter SFM13PE0022 VIPUR GmbH Vienna). The extracts were then treated as sterile reagents. They were stored in 15 mL tubes or sterilized glass bottles at 4 °C protected from light.
The extracts were characterized by osmolality measurement with a cryoscopic osmometer (Osmomat 030-D), and the dry weight residues were determined after drying 1 mL samples in glass test tubes in a sterilisation oven (Binder type 9010-0003) for 11 days. For each plant extract, 6 samples were used for the dry weight residue analysis, three replicates from the extract stored in 15 mL tubes and three replicates from the extract stored in a Schott glass bottle.
4.2. Cell Lines
For all cell culture experiments, the cell lines CaCo-2 (ATCC HTB-37) and PANC-1 (ATCC CRL-1469) were used. Both were cultured in DMEM/F-12 medium (Gibco 32500-043) that was enriched with 2.438 g/L sodium bicarbonate (Roth HN01.2) and foetal bovine serum (SAFC 12003C), according to the manufacturer’s instructions. Initially, the cells were cultured with 10% FBS, as recommended by the ATCC for PANC-1. However, since the CaCo-2 cells showed equal or better growth at 5% FBS, the standard medium for both lines was adjusted to 5% FBS, unless otherwise stated. To prevent bacterial contamination, 1% penicillin-streptomycin (Gibco 15140122, 100 U/mL penicillin) was added to all cultures.
The medium was adjusted to a pH- of 7.2–7.4 using a pH meter (WTW pH/cond 3320) and sterilized with a 0.2 µm bottle-top filter (Cobetter VFF500SLES) and a vacuum pump (VWR). For sterility control, 5 mL of freshly prepared nutrient solution was incubated in a T25 flask under standard conditions for at least 24 hours and checked for microbial growth before use in experiments.
The cells were maintained at 37 °C with 90% humidity and 5% CO2 in humidified incubators (memmert, via Linder Labortechnik). Details about sub cultivation are described in Routine Culture 3.1.1. For the cell bank, both lines were stored in medium with an additional 10% FBS and 10% DMSO (Sigma D2650-5X10ML) as q cryoprotectant, with 3 million cells per cryovial (Roth AEH8.1), and stored in liquid nitrogen tanks (Chart Inc, Ref 10743351).
Reusable vessels for cell culture reagents were sterilized by autoclaving (20 min, 121 °C, 2 bar). All procedures were performed in a Class 2 Biosafety cabinet (Thermo Scientific MSc Advantage 1.8 51025430). Microscopy was performed with an Olympus CKX53 microscope with a 10X objective, unless otherwise stated. Reagents that require 37 °C, such as trypsin, were thawed or warmed in a water bath (VWR 462-0557) before use.
The primary cell line, human skin fibroblasts, was obtained from ATCC. All cells were cultured in a nutrient medium (Dulbecco’s modified Eagle’s medium, prepared and sterile filtered (0.2 µm)) with 10% foetal calf serum (FCS), 100 U/ml streptomycin, and 100 U/ml penicillin in a humidified incubator at 37 °C and 5% CO2. The cells were cultured until they reached 90% to 95% confluence and passaged every 3 to 4 days. The total cell count, and the number of viable cells were determined using a Spark® Tecan microplate reader (Männedorf, Seestrasse 103, Switzerland) and a trypan blue exclusion assay. The cell cultures were tested for mycoplasma using a MycoSPY® (Biontex, Munich, Germany) PCR detection kit. The cells were passaged three times to obtain the cell bank for the experiments. For all treatments, the cells were seeded at 3500 cells/cm2 in all well plate and bottle formats [38].
4.3. Chemotherapeutic Drug Treatment and Assay Procedures
The chemotherapeutic agents used in this study were 5-fluorouracil (Sigma-Aldrich F6627) and etoposide (Sigma-Aldrich E1383). Experiments were conducted using non-senescent, proliferating CaCo-2 and PANC-1 cells in 96-well plates (Thermo Scientific, 167542). To determine the optimal seeding density for achieving complete confluence in untreated controls at the assessment point, preliminary experiments were conducted with seeding densities of 1,000 to 25,000 cells per culture dish, each in 12 replicates. The plates were incubated under standard conditions for four days, and the daily confluence was measured using the confluence measurement function of the Tecan Spark plate reader.
A density of 5,000 cells per culture dish was chosen for both cell lines. For all subsequent treatments, cells were seeded at this density in 100 µL of medium per well and incubated for 24 hours at 37 °C, 90% humidity, and 5% CO2. After confirming cell adhesion and growth, 100 µL of two-fold concentrated drug dilutions were added to each well in the medium. The plates were then incubated for three more days with daily measurements of confluence. On the final day, cell proliferation assays were used to evaluate the treatment results. To evaluate the effect of 5-fluorouracil, a 96-well plate assay was performed with the same protocol as the solvent control. For each cell line, two plates were inoculated with 5,000 cells per well (except for the top and bottom rows as cell-free controls). 5-Fluorouracil was added in a dilution series at a ratio of 1:2, starting at 250 µM and ending at 0.49 µM. To ensure a uniform DMSO concentrations in all wells, the initial 50 mM 5-fluorouracil in DMSO was serially diluted in DMSO and then further diluted 1:100 with basal medium to create solutions with a twofold concentration. These were added to the wells at a 1:1 ratio, resulting in final concentrations of 250 µM to 0.5 µM. Each concentration was tested in 12 replicates (6 wells per plate). Three days after treatment, cell viability and growth were evaluated using the XTT Assay (Cell Proliferation Kit II, Roche 11465015001), according to the manufacturer’s instructions. The XTT working solution was freshly prepared by mixing the labelling reagent and electron-coupling reagent in a 5:0.1 ratio. From each well, 100 µL medium were removed and replaced with 100 µL of XTT working solution. Then the plates were incubated under standard conditions for four hours, and the absorbance was measured at 450 nm with a 650 nm reference (Figure 19).
The absorption signal of the untreated control was set to 100% and the relative signal of the 5-fluorouracil-treated replicates was calculated as a measure of the number of viable cells per well. These values were plotted against 5-fluorouracil concentration to calculate the concentration that caused a 50% reduction in the signal for viable cells compared to the untreated control, i.e., the IC50 value for each cell line.
To evaluate the effects on cell viability and growth, CaCo-2 and PANC-1 cells were seeded in 96-well plates at 5,000 cells per well. After 24 hours, plant extracts were added to the base medium in a dilution series 1:3 (starting with undiluted), with each dilution tested in 12 replicates. The daily confluence was measured, and after three days, cell count, and viability were evaluated using the XTT Assay.
In addition to the XTT Assay, interleukin-6 (IL-6) secretion was measured as a marker for cytokine release. The conditioned medium from treated cells was analyzed with the ELISA (Human IL-6 Uncoated ELISA Kit, Invitrogen 88-7066-88) in the same plates as in the XTT Assay. For ELISA, 96-well plates were coated with antibodies overnight, washed, and samples (100 µL per well, removed during XTT setup) were added alongside standards and blanks. After incubation, detection antibodies, HRP-enzyme, and TMB substrate were added in succession, with washing between steps. The reaction was stopped with 1 M H2SO4, and absorbance was read at 450 nm with 750 nm as reference (Figure 20.).
A 24-well plate format was used to investigate the sub-lethal concentrations of 5-fluorouracil on CaCo-2 and PANC-1 cells. Four plates with 25,000 cells per well in 500 µL medium were inoculated per cell line. After 24 hours for cell adhesion, three plates per cell line were treated with 5-fluorouracil and one with etoposide. The drug stocks were prepared in DMSO and diluted in culture medium before use. 5-Fluorouracil was tested at concentrations of 32, 16, 8, 4, 2, and 1 µmol/L, with each concentration applied to three wells per plate (a total of nine replicates). Three wells per plate received 1% DMSO as a vehicle control, and three wells remained untreated as negative controls. On the control plates for etoposide, nine wells were treated with 25 µM and 50 µM etoposide, and six wells were treated with 1% DMSO. After two days of treatment with etoposide and all PANC-1 plates, or three days for CaCo-2 plates treated with 5-fluorouracil, the medium was replaced with 1 mL fresh culture medium. The plates were then incubated for 21 days under standard conditions (37 °C, 90% humidity, 5% CO2). Cell growth was monitored daily by measuring confluence (Monday until Friday) with a Tecan plate reader. The medium was completely replaced twice a week, and medium samples were taken before each exchange, pooled by treatment group, and stored at –20 °C for later cytokine analysis. The end-point assessment included protein lysis, SAβ-Gal staining, and plant treatment of presumably senescent cells, followed by PrestoBlue proliferation test and an IL-6 ELISA of the conditioned medium. For each assay,a 5-fluorouracil-treated plate was used per cell line. Two wells per concentration were used for protein lysis, two for SAβ-Gal staining, and five for plant treatment for the etoposide plate. Phytochemical treatments involved adding 0.1 g/L chamomile extract, 1 g/L Sutherlandia extract, and 1 g/L Ballonerbse extract to two wells per 5-fluorouracil concentration, as well as to one well of DMSO and untreated controls. On the etoposide plate, higher concentrations (1 g/L chamomile, 2.5 g/L Sutherlandia) were also tested, with each extract dilution added to a well per etoposide concentration. After four days of phytochemical treatment, the medium was replaced and removed for ELISA analysis of IL-6. Seven days after treatment with phytochemicals, viable cell counts were measured using the PrestoBlue cell viability assay, and DNA content was evaluated using Hoechst staining to confirm the results (Figure 21.).
After the screening experiment, 5-fluorouracil at 2 µM and 4 µM, and etoposide at 50 µM, were selected for further treatment of CaCo-2 cells in T75 flasks. Sixteen T75 flasks were inoculated with 0.75 million cells each (0.01 million cells/cm2). After 24 hours, twelve flasks were treated with chemotherapy: four with 4 µM 5-fluorouracil, 2 µM 5-fluorouracil, and 50 µM etoposide. The treatment duration was three days for 5-fluorouracil and two days for etoposide, after which the medium was changed to mark the end of treatment., 1 mL of conditioned medium was removed from each flask and stored at –20 °C for later analysis, and 15 mL of fresh medium was added.
Since cell density could not be measured with a plate reader in T75 flasks, - cell growth was microscopically monitored and documented with images at 10X magnification. After three days of-treatment, cells treated with 2 µM and 4 µM 5-fluorouracil showed no visible growth inhibition or morphological changes compared to untreated controls. To ensure a measurable effect, a second three-day pulse with 8 µM 5-fluorouracil was performed.
Flasks were then kept under standard conditions for 14 days, with the medium being changed twice a week. After this time, phytochemical treatments were performed: half of the flasks received 0.1 g/L chamomile extract, the other half 1 g/L Sutherlandia extract, which was added to the fresh medium during the exchange. Four additional flasks (two with chamomile, two with Sutherlandia) served as non-senescent controls, receiving the same phytochemical treatments without prior chemotherapy exposure.
The herbal treatment lasted four days. At the end of this period, cells were harvested for analysis. The harvesting process involved removing the medium, rinsing with PBS, incubating with trypsin-EDTA at 37 °C for 5 minutes, and microscopically verifying the detachment. The cell suspension was collected, centrifuged, and the pellet resuspended in PBS. This suspension was divided into three parts for protein lysis, RNA extraction, and flow cytometry to confirm senescence (Figure 22.).
4.4. PrestoBlue & Hoechst Assay
In addition to continuous growth tracking, the endpoint of cell growth for phytochemically treated cells was examined on the last day of the screening experiment, using a PrestoBlue assay to measure the viable cell count, and subsequently with a Hoechst Assay to quantify the DNA per well. The PrestoBlue assay was performed with the PrestoBlue HS Cell Viability Reagent (Invitrogen P50201) according to the manufacturer’s instructions. In short, the medium was removed from all wells and 450 µL of fresh medium was added to each well to ensure an exact volume that allows for a precise concentration of the PrestoBlue reagent. A total volume of 50 µL of PrestoBlue dye was added to each well to achieve the recommended 1:5 dilution. The plates were incubated at 37 °C for one hour. After incubation, the medium contents of each well were transferred to a 24-well black plate (ibidi 82406) to measure the fluorescence of the PrestoBlue product at 560 nm (excitation) and 590 nm (emission). The fluorescence intensity was taken as a measure of the number of viable cells per well. The cells treated with DMSO- were chosen as control, because the plates treated with etoposide did not contain an untreated control. The control signal was set to 100% and the signal measured for cells after various treatments was calculated in relation to it.
The emptied culture plates were used for the Hoechst assay. Immediately after transferring the medium for the PrestoBlue measurement, the plates were frozen at –80 °C for one hour and then left to thaw for one hour. After thawing, 100 µL of deionized water was added to each well, and the plates were incubated at 37 °C for one hour. The plates were frozen/incubated a second time at -80 °C and allowed to thaw for one hour each. The Hoechst dye (BD Hoechst 33342 Solution, BD 561908) was diluted 1:400 in TNE buffer (10 mM Tris, 2 M NaCl, 1mM EDTA, 2mM NaN3, pH 7.4) and added to the assay plates at 100 µL per well for 15 minutes at room temperature. Finally, fluorescence was measured at 352 nm for excitation and 461 nm for emission.
4.5. Senescence-Associated-β-Galactosidase Detection
An SAβ-Gal Assay was performed on a 5-fluorouracil-treated plate per cell line, and on 2 wells per etoposide test concentration on the etoposide-treated plates. The untreated depressions in the plates served as confluent, quiescent control. To include a young, growing control, two wells on an additional 24-well plate were seeded with 10,000 CaCo-2 cells, and two wells with the same number of PANC-1 cells one day before the SAβ-Gal assay. All steps of the assay procedure were performed equally for test plates and young control plates.
X-Gal substrate (Roche 03117073001) was used in the form of a pre-dissolved DMSO working medium (100 mg/mL). A dye solution was prepared with K3[Fe(CN)6] (5 mM), K4[Fe(CN)6] (5 mM) and MgCl2 (2 mM). These components were initially prepared as 10X-solutions in deionized water and then diluted to the required final concentration in staining buffer (0.1 M citric acid/phosphate buffer pH 6.0). The X-Gal stock was added to a final concentration of 1 mg/mL immediately before use.
For the analysis, the medium was completely removed from the plates using a pi-pette. The cells were then washed twice with PBS at room temperature before being fixed. ROTI®Histofix 4% formaldehyde (Roth P087.6) was used as a fixative. 250 µL fixative was added to each well, and the plates were incubated at room temperature for 10 minutes. After removing the fixative solution, the cells were washed again twice with PBS. A third wash was performed with a dye buffer to ensure the correct pH of 6.0 for analysis. After adding the X-Gal reagent to the staining solution, 200 µL was added to each well. The plates were incubated at 37 °C for a total of 6 hours. A different incubator (memmert) was used for this incubation, to prevent the buffer effect of the CO2 atmosphere from al-tering the assay pH. Once an hour, the plates were removed from the incubator for micro-scopic observation, and a picture was taken of each well. The images were selected from areas with the strongest blue SAβ-Gal staining. The incubation was stopped after 6 hours as all wells except the young control well had developed a strong blue colour
4.6. Flow-Cytometric Cell Cycle Analysis
One third of the pellets obtained from senescent flask cultures were used for cell cycle analysis by flow cytometry. The cells were suspended in 1 mL PBS in a 15 mL falcon tube. After removing the aliquots for protein analysis and RNA extraction as described above, the remaining 330 µL of the cell suspension was stained with propidium iodide according two different protocols. For the first flow cytometry experiment, cells that only had received a phytochemical treatment without prior exposure to chemotherapeutic agents were fixed by adding cooled 70% ethanol during vortexing. They were washed twice with 1 mL PBS, then centrifuged at 500 g for 5 minutes and the supernatant was discarded. 300 µL of 1 mg/mL propidium iodide in PBS (1:20) staining solution was added (Roth).
A different protocol was adapted for flow cytometry of cells that were exposed to chemotherapeutic agents and then to plant-based chemical treatments, Instead of being fixed with ethanol, the cells were washed with ethanol and then resuspended in 400 µL of a 1:20 solution of propidium iodide concentration (1mg/mL) in hypotonic fluorochrome solution HSF buffer (0.1% Triton X-100, 0.1% sodium citrate in PBS). Due to time constraints, the etoposide-treated cells were stained overnight at 4 °C, while the 5-fluorouracil-treated cells were stained for only 3 hours at 4 °C (with 600 µL propidium iodide staining solution due to higher cell concentration).
The cell cycle analysis was performed by Professor Marlene Gerner, BSc MSc PhD, using a Cytoflex LX Flow Cytometer (Beckman Coulter Life Sciences) and evaluated with Kaluza software. The propidium iodide signal was detected with a blue laser and a PE bandpass filter. A histogram of forward scattering versus sideways scattering was used to distinguish cells from debris. Pulse shape analysis was used to remove doublets. The gates were set up to exclude uncoloured cells that were measured separately. Using markers defined in the analysis program, the percentage of cells in each cell cycle phase was quantified. Figure 18 provides an overview of the various analytical methods used to characterize post-harvest senescent bottle cultures.
4.6. qPCR
After the harvesting of the cells, their RNA was extracted using the RNeasy Mini Kit from (QIAGEN, Hilden, Germany) following the protocol of Quiagen. The Invitrogen™ Qubit™ RNA BR Assay Kit (Thermo Fisher Scientific, Waltham, MA, USA, 02451) was used to determine contamination with the Qubit 2.0 fluorometer. Reverse transcription was performed with iScript™ Reverse Transcriptase (Bio-Rad, Hercules, CA, USA) and 4 µL 5x iScript Reaction according to the manual. For incubation, we used the MJ Research PTC-200 Gradient Thermal Cycler. Results were calculated using the delta-delta-Ct methode as in previous publications [38,40].
4.7. Statistical Analysis
Statistical analysis was performed using Graphpad Prism 10, version 10.2.3 (403). Non-linear regression was applied to plot a sigmoidal dose-response curve (Asymmetric Sig-moidal, 5PL, X is log/concentration). This fit was used to calculate the IC50 values. Error bars in graphs represent means ± standard deviations.
5. Conclusions
While SF and other plant extracts do not inhibit cell proliferation as effectively as drugs like 5-FU or etoposide, they can improve cell regeneration after chemotherapy, likely by promoting an age-related - growth inhibition rather than causing direct cell death. These extracts also robustly induce pro-inflammatory SASP factors such as IL-6, IL-8, and MMP1 in fibroblasts, along with upregulation of the antioxidant enzyme SOD2, suggesting that while they do not prevent the establishment of a senescent, inflammatory phenotype, but can help cells better cope with oxidative stress. The effects of both chemotherapy and phytochemicals on cell cycle progression and inflammatory signal transduction are highly dependent on the cell line, and acute inflammation in the tumor microenvironment can even support tumor defense under certain conditions. Overall, plant extracts like SF are not substitutes for chemotherapeutic agents in terms of direct cytotoxicity, but they can favorably influence cellular stress responses and recovery, which could be important for both cancer therapy and tissue homeostasis.
Author Contributions
For research articles with several authors, a short paragraph specifying their individual contributions must be provided. The following statements should be used “Conceptualization, AE, MS, KR and HK.; methodology, AE, KR and HK.; formal analysis, MS and MS(1).; investigation, AE, MS and MS(1).; resources, MM.; data curation, MS, MS(1), HK and BF.; writing—original draft preparation, MS and HK.; writing—review and editing, AE, MS, KR, BF and HK.; visualization, MS and HK.; supervision, AE, HK, BF and KR.; project administration, HK.; funding acquisition, HK.
Funding
This research received no external funding.
Institutional Review Board Statement
Not applicable
Informed Consent Statement
Not applicable just commercial cell lines were used
Acknowledgments
This Project was funded internally by Anschubfinanzierung FH Campus Wien We thank for technical assistance Lukas Herzog and Laurentius Orsolic. GenAI Perplexity and DeepL has been used for purposes such as generating text, some graphics were Created with BioRender.com. During the preparation of this manuscript/study, the author(s) used [Perplexity AI. July 11, 2025. https://www.perplexity.ai.] for the purposes of improving and generating text. The authors have reviewed and edited the output and take full responsibility for the content of this publication.”
Conflicts of Interest
The authors declare no conflicts of interest
Abbreviations
The following abbreviations are used in this manuscript:
| MDPI | Multidisciplinary Digital Publishing Institute |
| DOAJ | Directory of open access journals |
| TIS | Tumor induced senescence |
| SASP | Senescence associated secretory phenotype |
| SF | Sutherlandia frutescence |
| XTT | 2,3-bis(2-methoxy-4-nitro-5-sulfophenyl)-5-carboxanilide-2H-tetrazolium |
| qPCR | Quantitative polymerase chain reaction |
| SOD2 | Superoxide dismutase 2 |
| IL-6 | Interleukin 6 |
| IL-8 | Interleukin 8 |
| ELISA | Enzyme linked immune sorbend assay |
| MMP1 | Metalloprotease 1 |
| PANC-1 | Pancreas cancer cell line |
| CaCo-2 | Colon cancer cell line |
| 5-FU | 5 Fluorouracil |
| PI | Propidium iodide |
| DMSO | dimethyl sulfoxide |
| CYP3A4 | is a key enzyme in the human body, belonging to the cytochrome P450 superfamily. It is primarily found in the liver and intestine and is encoded by the CYP3A4 gene |
| P16 | stands for cyclin-dependent kinase inhibitor 2A (CDKN2A), also known as p16^INK4a^, CDK4 inhibitor, or multiple tumor suppressor 1 |
References
- López-Otín, C.; Pietrocola, F.; Roiz-Valle, D.; Galluzzi, L.; Kroemer, G. Meta-Hallmarks of Aging and Cancer. Cell Metab 2023, 35, 12–35. [CrossRef]
- Laconi, E.; Marongiu, F.; DeGregori, J. Cancer as a Disease of Old Age: Changing Mutational and Microenvironmental Landscapes. Br J Cancer 2020, 122, 943–952. [CrossRef]
- Mattiuzzi, C.; Lippi, G. Current Cancer Epidemiology. J Epidemiol Glob Health 2019, 9, 217. [CrossRef]
- Azzani, M.; Atroosh, W.M.; Anbazhagan, D.; Kumarasamy, V.; Abdalla, M.M.I. Describing Financial Toxicity among Cancer Patients in Different Income Countries: A Systematic Review and Meta-Analysis. Front Public Health 2024, 11. [CrossRef]
- Liu, B.; Zhou, H.; Tan, L.; Siu, K.T.H.; Guan, X.-Y. Exploring Treatment Options in Cancer: Tumor Treatment Strategies. Signal Transduct Target Ther 2024, 9, 175. [CrossRef]
- Antunes, N.; Kundu, B.; Kundu, S.C.; Reis, R.L.; Correlo, V. In Vitro Cancer Models: A Closer Look at Limitations on Translation. Bioengineering 2022, 9, 166. [CrossRef]
- Vodenkova, S.; Buchler, T.; Cervena, K.; Veskrnova, V.; Vodicka, P.; Vymetalkova, V. 5-Fluorouracil and Other Fluoropyrimidines in Colorectal Cancer: Past, Present and Future. Pharmacol Ther 2020, 206, 107447. [CrossRef]
- Wigmore, P.M.; Mustafa, S.; El-Beltagy, M.; Lyons, L.; Umka, J.; Bennett, G. Effects of 5-FU. In; 2010; pp. 157–164.
- Mader, R.M.; Müller, M.; Steger, G.G. Resistance to 5-Fluorouracil. General Pharmacology: The Vascular System 1998, 31, 661–666. [CrossRef]
- Sinkule, J.A. Etoposide: A Semisynthetic Epipodophyllotoxin Chemistry, Pharmacology, Pharmacokinetics, Adverse Effects and Use as an Antineoplastic Agent. Pharmacotherapy: The Journal of Human Pharmacology and Drug Therapy 1984, 4, 61–71. [CrossRef]
- Le, T.T.; Wu, M.; Lee, J.H.; Bhatt, N.; Inman, J.T.; Berger, J.M.; Wang, M.D. Etoposide Promotes DNA Loop Trapping and Barrier Formation by Topoisomerase II. Nat Chem Biol 2023, 19, 641–650. [CrossRef]
- Hande, K.R. Etoposide: Four Decades of Development of a Topoisomerase II Inhibitor. Eur J Cancer 1998, 34, 1514–1521. [CrossRef]
- Galmarini, D.; Galmarini, C.M.; Galmarini, F.C. Cancer Chemotherapy: A Critical Analysis of Its 60 Years of History. Crit Rev Oncol Hematol 2012, 84, 181–199. [CrossRef]
- DeVita, V.T.; Chu, E. A History of Cancer Chemotherapy. Cancer Res 2008, 68, 8643–8653. [CrossRef]
- Behranvand, N.; Nasri, F.; Zolfaghari Emameh, R.; Khani, P.; Hosseini, A.; Garssen, J.; Falak, R. Chemotherapy: A Double-Edged Sword in Cancer Treatment. Cancer Immunology, Immunotherapy 2022, 71, 507–526. [CrossRef]
- Anand, U.; Dey, A.; Chandel, A.K.S.; Sanyal, R.; Mishra, A.; Pandey, D.K.; De Falco, V.; Upadhyay, A.; Kandimalla, R.; Chaudhary, A.; et al. Cancer Chemotherapy and beyond: Current Status, Drug Candidates, Associated Risks and Progress in Targeted Therapeutics. Genes Dis 2023, 10, 1367–1401. [CrossRef]
- Hayflick, L. The Limited in Vitro Lifetime of Human Diploid Cell Strains. Exp Cell Res 1965, 37, 614–636. [CrossRef]
- Hayflick, L.; Moorhead, P.S. The Serial Cultivation of Human Diploid Cell Strains. Exp Cell Res 1961, 25, 585–621. [CrossRef]
- Ewald, J.A.; Desotelle, J.A.; Wilding, G.; Jarrard, D.F. Therapy-Induced Senescence in Cancer. JNCI: Journal of the National Cancer Institute 2010, 102, 1536–1546. [CrossRef]
- Saleh, T.; Tyutyunyk-Massey, L.; Murray, G.F.; Alotaibi, M.R.; Kawale, A.S.; Elsayed, Z.; Henderson, S.C.; Yakovlev, V.; Elmore, L.W.; Toor, A.; et al. Tumor Cell Escape from Therapy-Induced Senescence. Biochem Pharmacol 2019, 162, 202–212. [CrossRef]
- Faget, D. V.; Ren, Q.; Stewart, S.A. Unmasking Senescence: Context-Dependent Effects of SASP in Cancer. Nat Rev Cancer 2019, 19, 439–453. [CrossRef]
- Birch, J.; Gil, J. Senescence and the SASP: Many Therapeutic Avenues. Genes Dev 2020, 34, 1565–1576. [CrossRef]
- Ohtani, N.; Takahashi, A.; Mann, D.J.; Hara, E. Cellular Senescence: A Double-Edged Sword in the Fight against Cancer. Exp Dermatol 2012, 21 Suppl 1, 1–4. [CrossRef]
- Yang, J.; Liu, M.; Hong, D.; Zeng, M.; Zhang, X. The Paradoxical Role of Cellular Senescence in Cancer. Front Cell Dev Biol 2021, 9. [CrossRef]
- van Wyk, B.-E.; Albrecht, C. A Review of the Taxonomy, Ethnobotany, Chemistry and Pharmacology of Sutherlandia Frutescens (Fabaceae). J Ethnopharmacol 2008, 119, 620–629. [CrossRef]
- Faleschini, M.T.; Myer, M.S.; Harding, N.; Fouchè, G. Chemical Profiling with Cytokine Stimulating Investigations of Sutherlandia Frutescens L. R. (Br.) (Fabaceae). South African Journal of Botany 2013, 85, 48–55. [CrossRef]
- Aboyade, O.M.; Styger, G.; Gibson, D.; Hughes, G. Sutherlandia Frutescens: The Meeting of Science and Traditional Knowledge. The Journal of Alternative and Complementary Medicine 2014, 20, 71–76. [CrossRef]
- Dwarka, D.; Agoni, C.; Mellem, J.J.; Soliman, M.E.; Baijnath, H. Identification of Potential SARS-CoV-2 Inhibitors from South African Medicinal Plant Extracts Using Molecular Modelling Approaches. South African Journal of Botany 2020, 133, 273–284. [CrossRef]
- Skerman, N.B.; Joubert, A.M.; Cronjé, M.J. The Apoptosis Inducing Effects of Sutherlandia Spp. Extracts on an Oesophageal Cancer Cell Line. J Ethnopharmacol 2011, 137, 1250–1260. [CrossRef]
- Grandi, M.; Roselli, L.; Vernay, M. Lessertia (Sutherlandia Frutescens) et La Fatigue En Cancérologie*. Phytotherapie 2005, 3, 110–113. [CrossRef]
- Gouws, C.; Smit, T.; Willers, C.; Svitina, H.; Calitz, C.; Wrzesinski, K. Anticancer Potential of Sutherlandia Frutescens and Xysmalobium Undulatum in LS180 Colorectal Cancer Mini-Tumors. Molecules 2021, 26, 605. [CrossRef]
- Zonyane, S.; Fawole, O.A.; la Grange, C.; Stander, M.A.; Opara, U.L.; Makunga, N.P. The Implication of Chemotypic Variation on the Anti-Oxidant and Anti-Cancer Activities of Sutherlandia Frutescens (L.) R.Br. (Fabaceae) from Different Geographic Locations. Antioxidants 2020, 9, 152. [CrossRef]
- Weng, A.; Thakur; Melzig; Fuchs Chemistry and Pharmacology of Saponins: Special Focus on Cytotoxic Properties. Botanics 2011, 19. [CrossRef]
- Ganzera, M.; Schneider, P.; Stuppner, H. Inhibitory Effects of the Essential Oil of Chamomile (Matricaria Recutita L.) and Its Major Constituents on Human Cytochrome P450 Enzymes. Life Sci 2006, 78, 856–861. [CrossRef]
- Minocha, M.; Mandava, N.K.; Kwatra, D.; Pal, D.; Folk, W.R.; Earla, R.; Mitra, A.K. Effect of Short Term and Chronic Administration of Sutherlandia Frutescens on Pharmacokinetics of Nevirapine in Rats. Int J Pharm 2011, 413, 44–50. [CrossRef]
- Pacifico, F.; Magni, F.; Leonardi, A.; Crescenzi, E. Therapy-Induced Senescence: Novel Approaches for Markers Identification. Int J Mol Sci 2024, 25, 8448. [CrossRef]
- Prasanna, P.G.; Citrin, D.E.; Hildesheim, J.; Ahmed, M.M.; Venkatachalam, S.; Riscuta, G.; Xi, D.; Zheng, G.; Deursen, J. van; Goronzy, J.; et al. Therapy-Induced Senescence: Opportunities to Improve Anticancer Therapy. JNCI: Journal of the National Cancer Institute 2021, 113, 1285–1298. [CrossRef]
- Kühnel, H.; Seiler, M.; Feldhofer, B.; Ebrahimian, A.; Maurer, M. Ganoderma Lucidum Extract Modulates Gene Expression Profiles Associated with Antioxidant Defense, Cytoprotection, and Senescence in Human Dermal Fibroblasts: Investigation of Quantitative Gene Expression by QPCR. Curr Issues Mol Biol 2025, 47, 130. [CrossRef]
- Kühnel, H.; Pasztorek, M.; Kuten-Pella, O.; Kramer, K.; Bauer, C.; Lacza, Z.; Nehrer, S. Effects of Blood-Derived Products on Cellular Senescence and Inflammatory Response: A Study on Skin Rejuvenation. Curr Issues Mol Biol 2024, 46, 1865–1885. [CrossRef]
- Imb, M.; Véghelyi, Z.; Maurer, M.; Kühnel, H. Exploring Senolytic and Senomorphic Properties of Medicinal Plants for Anti-Aging Therapies. J. Mol. Sci 2024, 25. [CrossRef]
- Tobwala, S.; Fan, W.; Hines, C.J.; Folk, W.R.; Ercal, N. Antioxidant Potential of Sutherlandia Frutescens and Its Protective Effects against Oxidative Stress in Various Cell Cultures. BMC Complement Altern Med 2014, 14, 271. [CrossRef]
- Sharpe, E.; Farragher-Gnadt, A.P.; Igbanugo, M.; Huber, T.; Michelotti, J.C.; Milenkowic, A.; Ludlam, S.; Walker, M.; Hanes, D.; Bradley, R.; et al. Comparison of Antioxidant Activity and Extraction Techniques for Commercially and Laboratory Prepared Extracts from Six Mushroom Species. J Agric Food Res 2021, 4, 100130. [CrossRef]
- Bao, J.; Huang, B.; Zou, L.; Chen, S.; Zhang, C.; Zhang, Y.; Chen, M.; Wan, J.-B.; Su, H.; Wang, Y.; et al. Hormetic Effect of Berberine Attenuates the Anticancer Activity of Chemotherapeutic Agents. PLoS One 2015, 10, e0139298. [CrossRef]
- Kuhnel, H.; Adilijiang, A.; Dadak, A.; Wieser, M.; Upur, H.; Stolze, K.; Grillari, J.; Strasser, A. Investigations into Cytotoxic Effects of the Herbal Preparation Abnormal Savda Munziq. Chin J Integr Med 2015. [CrossRef]
- Zhao, H.; Wu, L.; Yan, G.; Chen, Y.; Zhou, M.; Wu, Y.; Li, Y. Inflammation and Tumor Progression: Signaling Pathways and Targeted Intervention. Signal Transduct Target Ther 2021, 6, 263. [CrossRef]
Figure 1.
Antioxidative potential was measured by DPPH assay. SF was measured for 45 days and the average antioxidant potential was compared with that of vitamin C.
Figure 1.
Antioxidative potential was measured by DPPH assay. SF was measured for 45 days and the average antioxidant potential was compared with that of vitamin C.

Figure 3.
Graphs showing the growth curve (by number of viable cells) of PANC-1 and CaCo-2 cells under routine culture conditions over a culture period of 80 days.
Figure 3.
Graphs showing the growth curve (by number of viable cells) of PANC-1 and CaCo-2 cells under routine culture conditions over a culture period of 80 days.
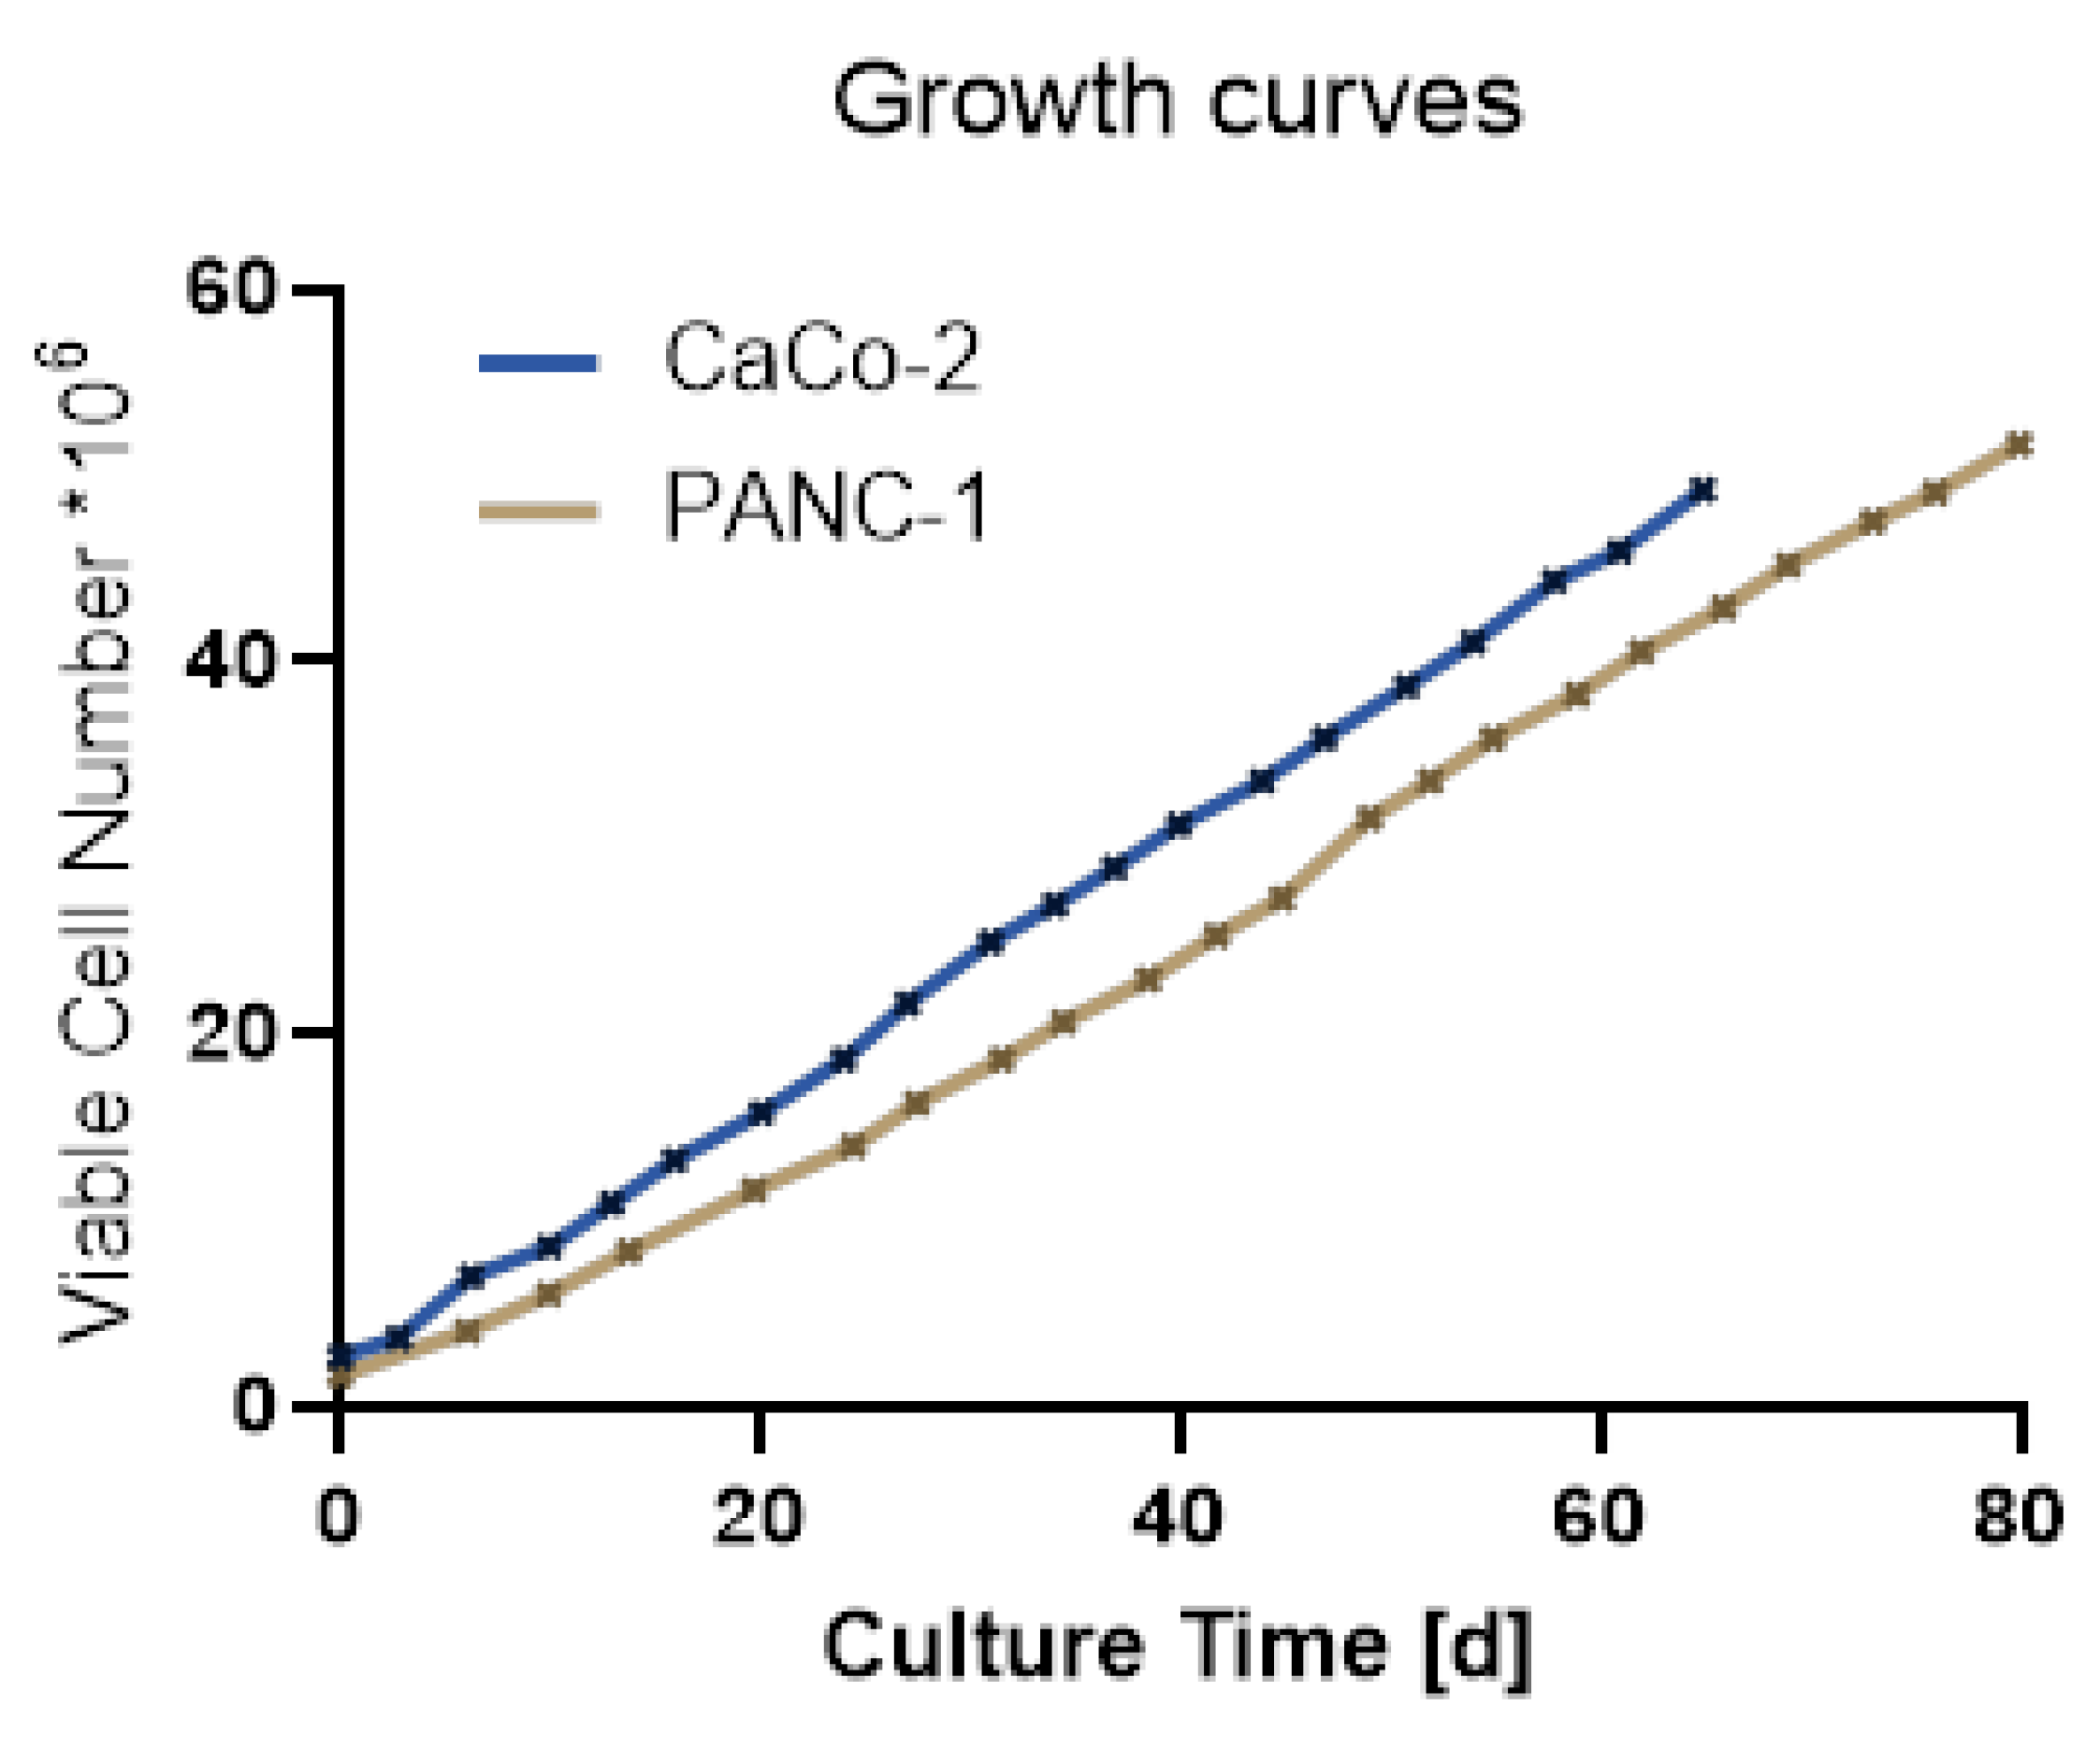
Figure 4.
Relative absorbance as percentage of untreated control for IC50-determination of 5-fluorouracil for CaCo-2 and PANC-1 cell lines. Error bars represent mean and standard deviation of 6 replicates (n=6).
Figure 4.
Relative absorbance as percentage of untreated control for IC50-determination of 5-fluorouracil for CaCo-2 and PANC-1 cell lines. Error bars represent mean and standard deviation of 6 replicates (n=6).
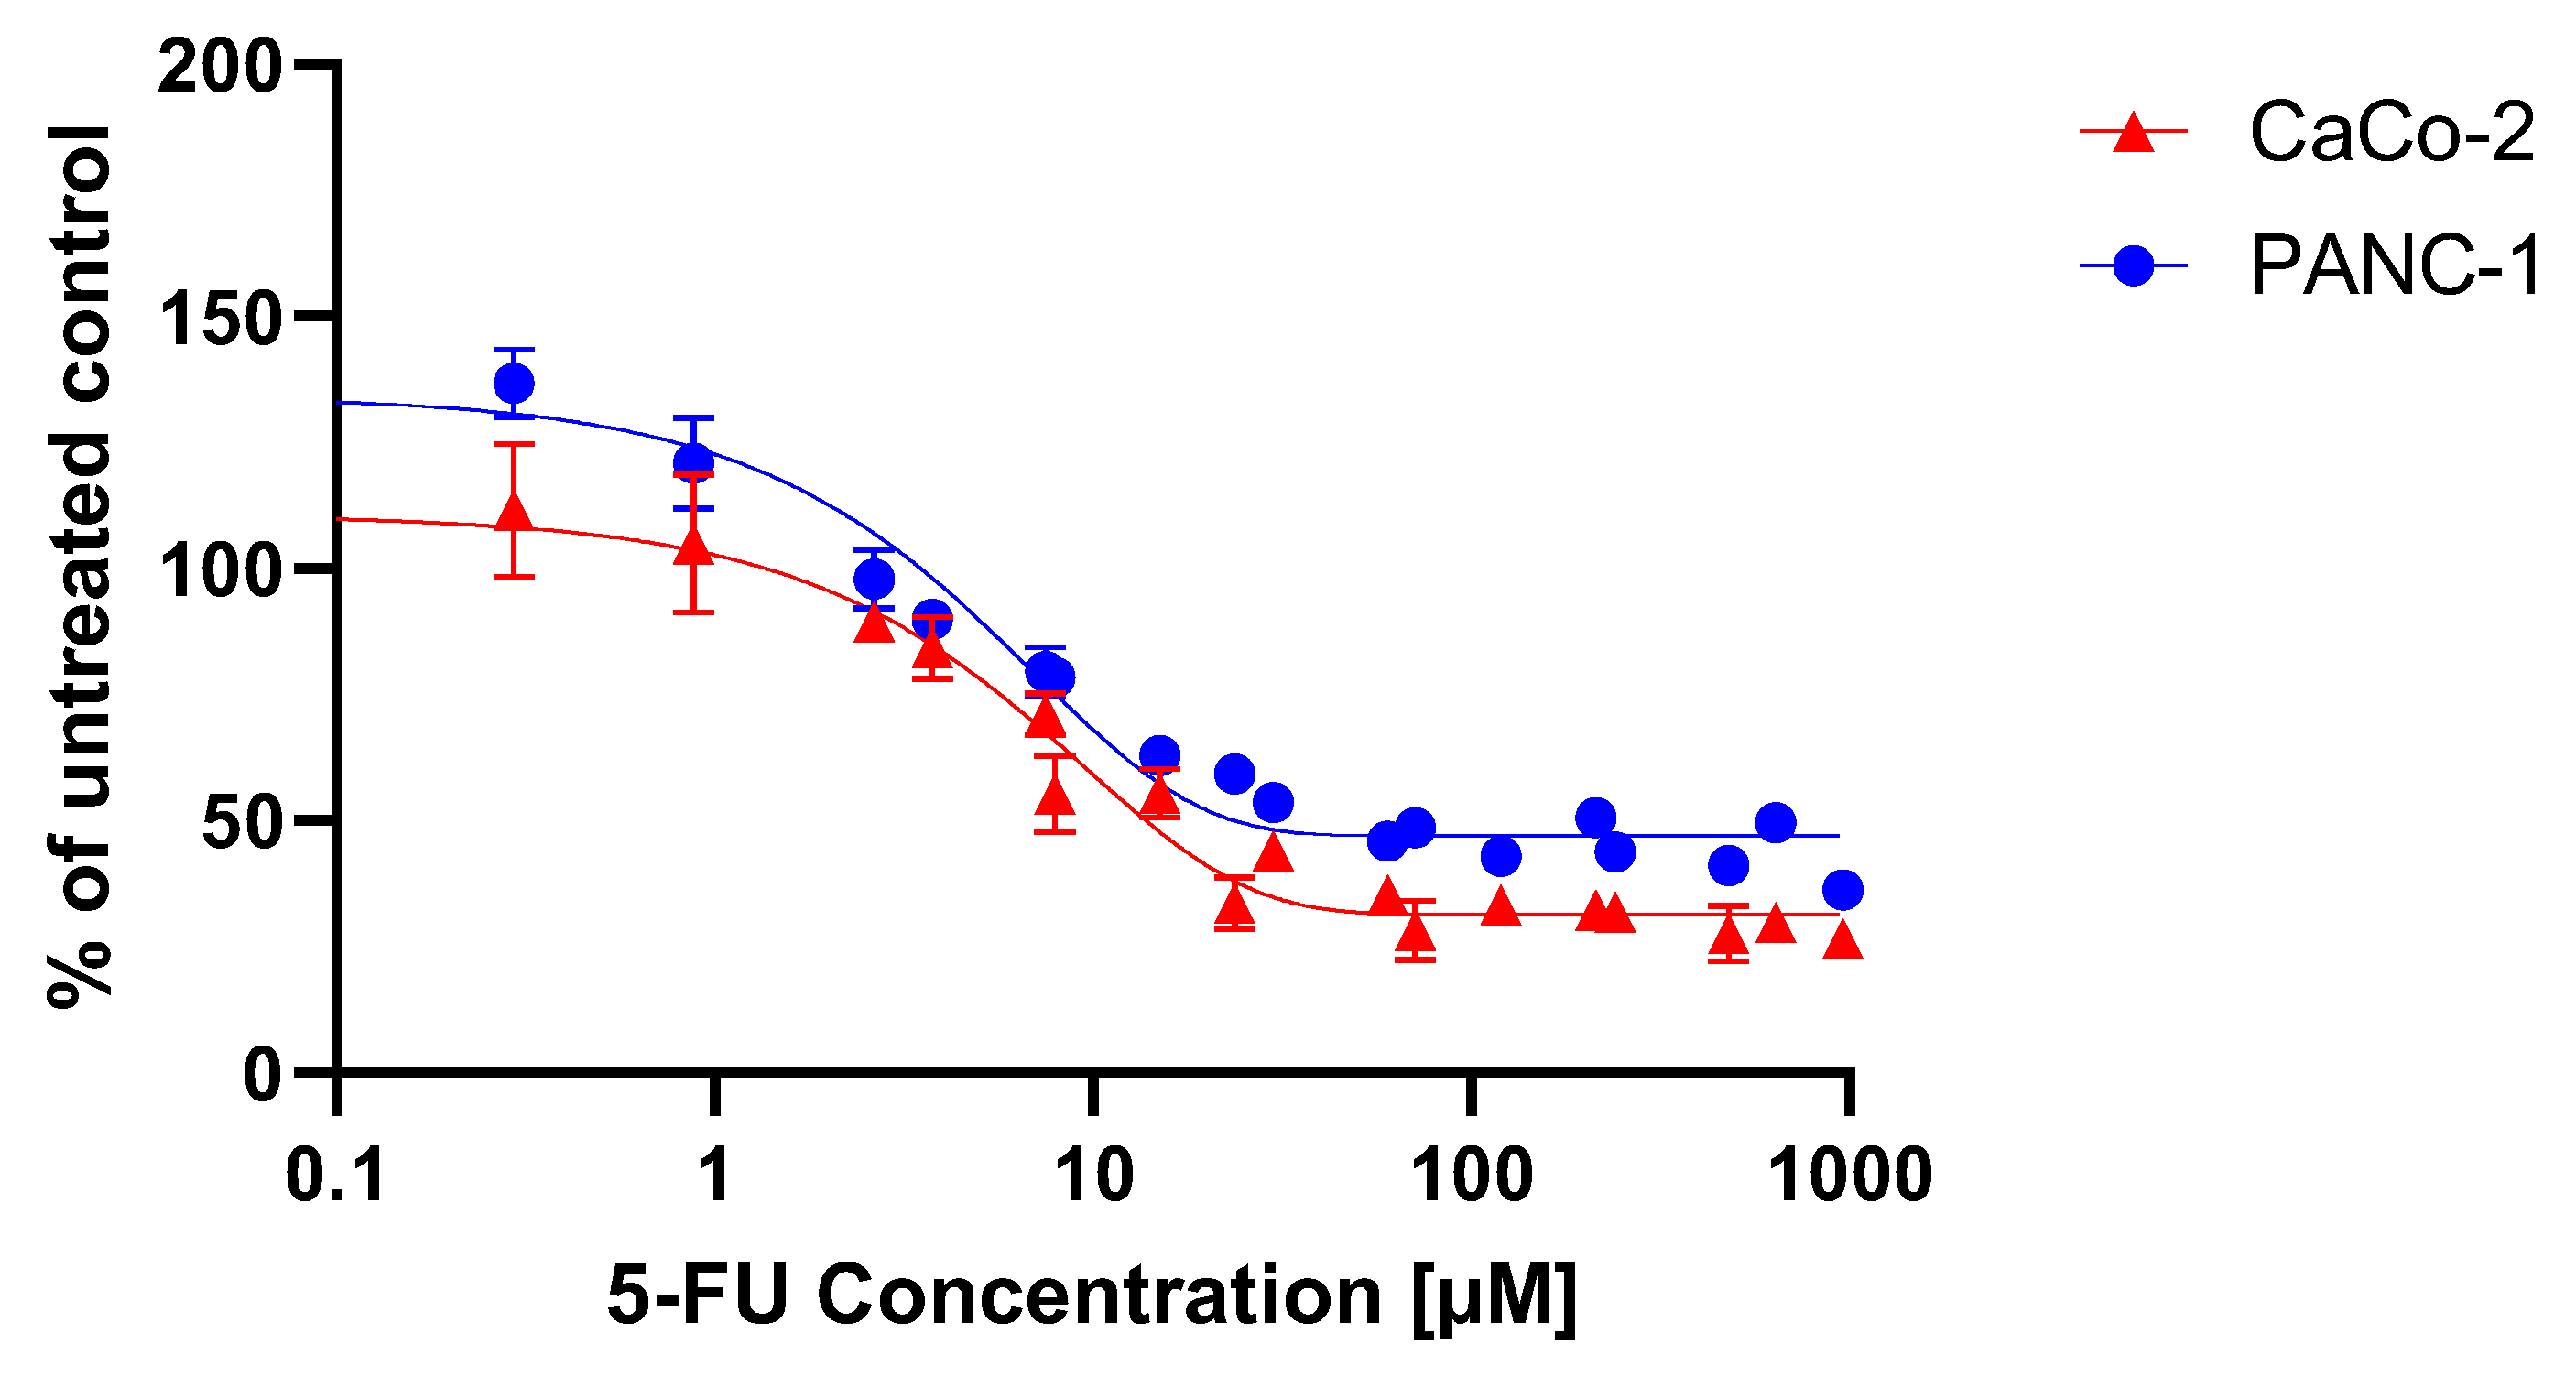
Figure 5.
The graphs show the response of the cells to the phytochemical treatment according to XTT Assay, the relative absorbance values are calculated as a percentage of the untreated control. The error bars represent the mean and standard deviation of four replicates (n=4). The graphs show (a) Chamomile (b) Sutherlandia and (c) Ballonerbse; CaCo-2 (red) and PANC-1 (blue) were tested for their response to herbal extracts.
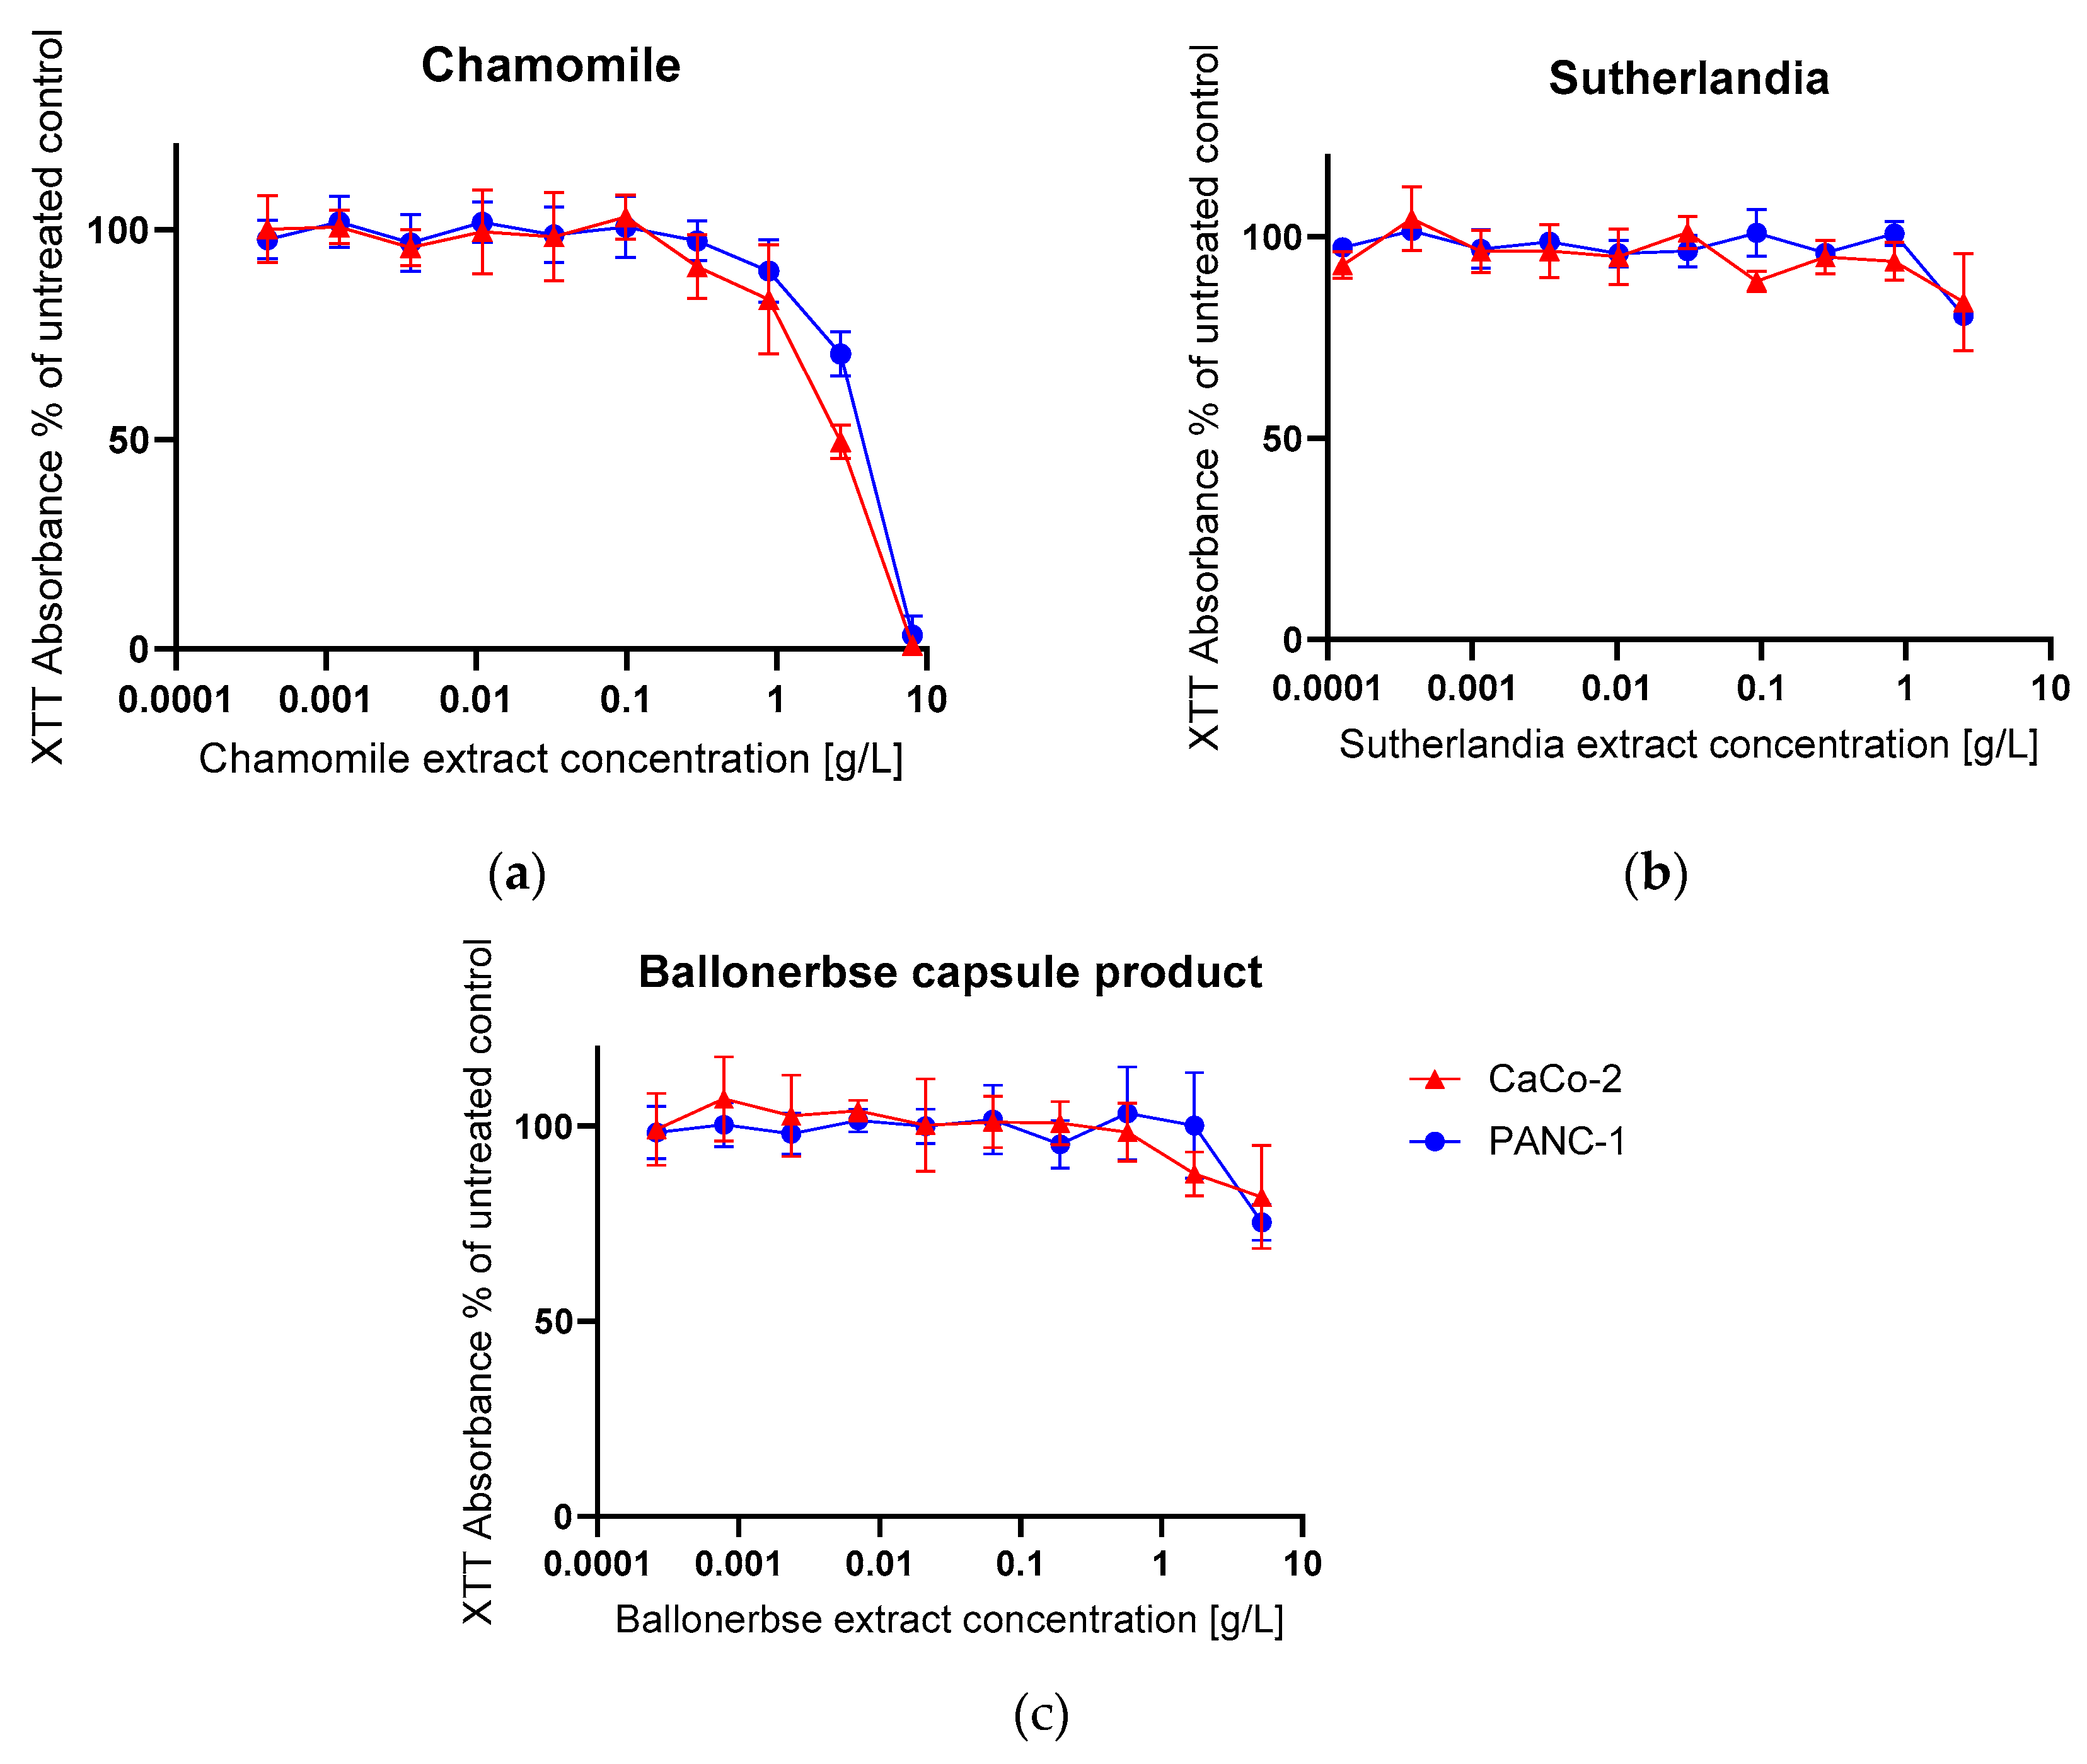
Figure 6.
Growth curves of CaCo-2 and PANC-1 cells treated with different 5-fluorouracil and etoposide concentrations to induce senescence, generated from daily confluence measurements over a culture period of 21 days (screening experiment). The error bars represent the mean and error of nine replicates (n=9). (a) CaCo-2 treated with 5FU (b) PANC-1 treated with 5FU (c) CaCo-2 treated with Etoposide (d) PANC-1 treated with Etoposide.
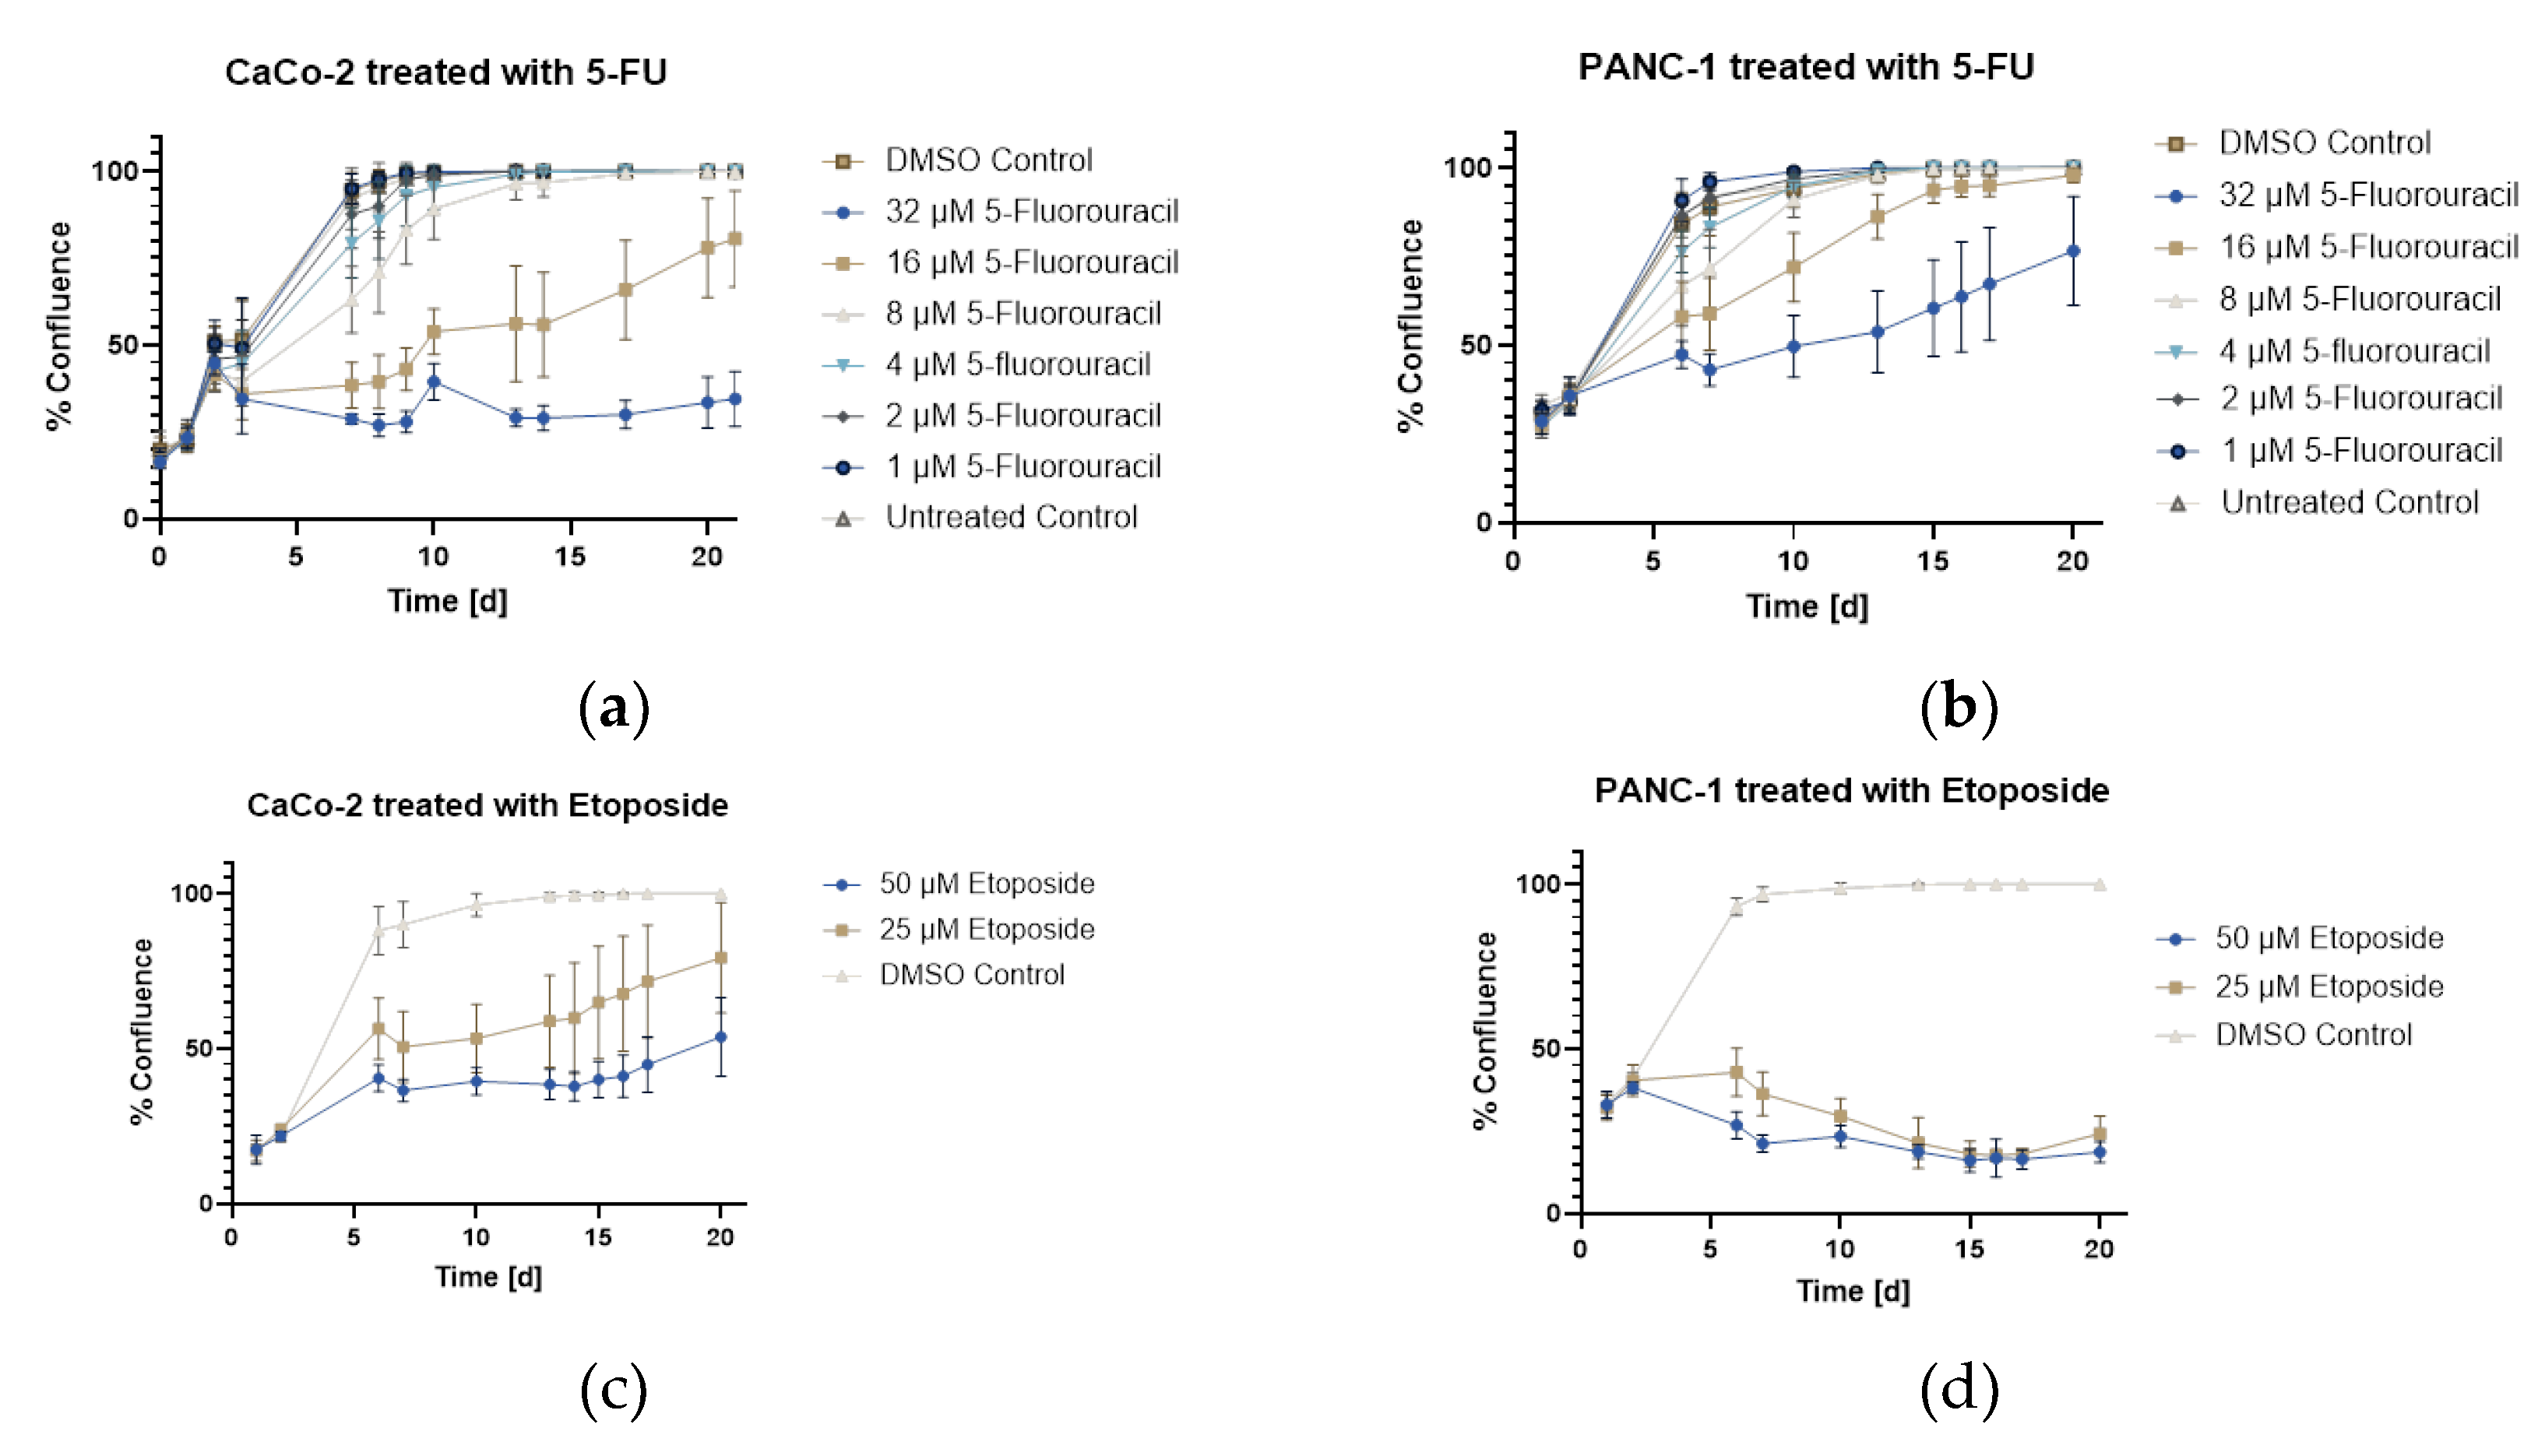
Figure 8.
Total cell count and viability, measured after harvesting the senescent flask cultures. The error bars represent the mean and standard deviation of duplicate measurements (n=2). Blue columns show cell count and green columns viability.
Figure 8.
Total cell count and viability, measured after harvesting the senescent flask cultures. The error bars represent the mean and standard deviation of duplicate measurements (n=2). Blue columns show cell count and green columns viability.
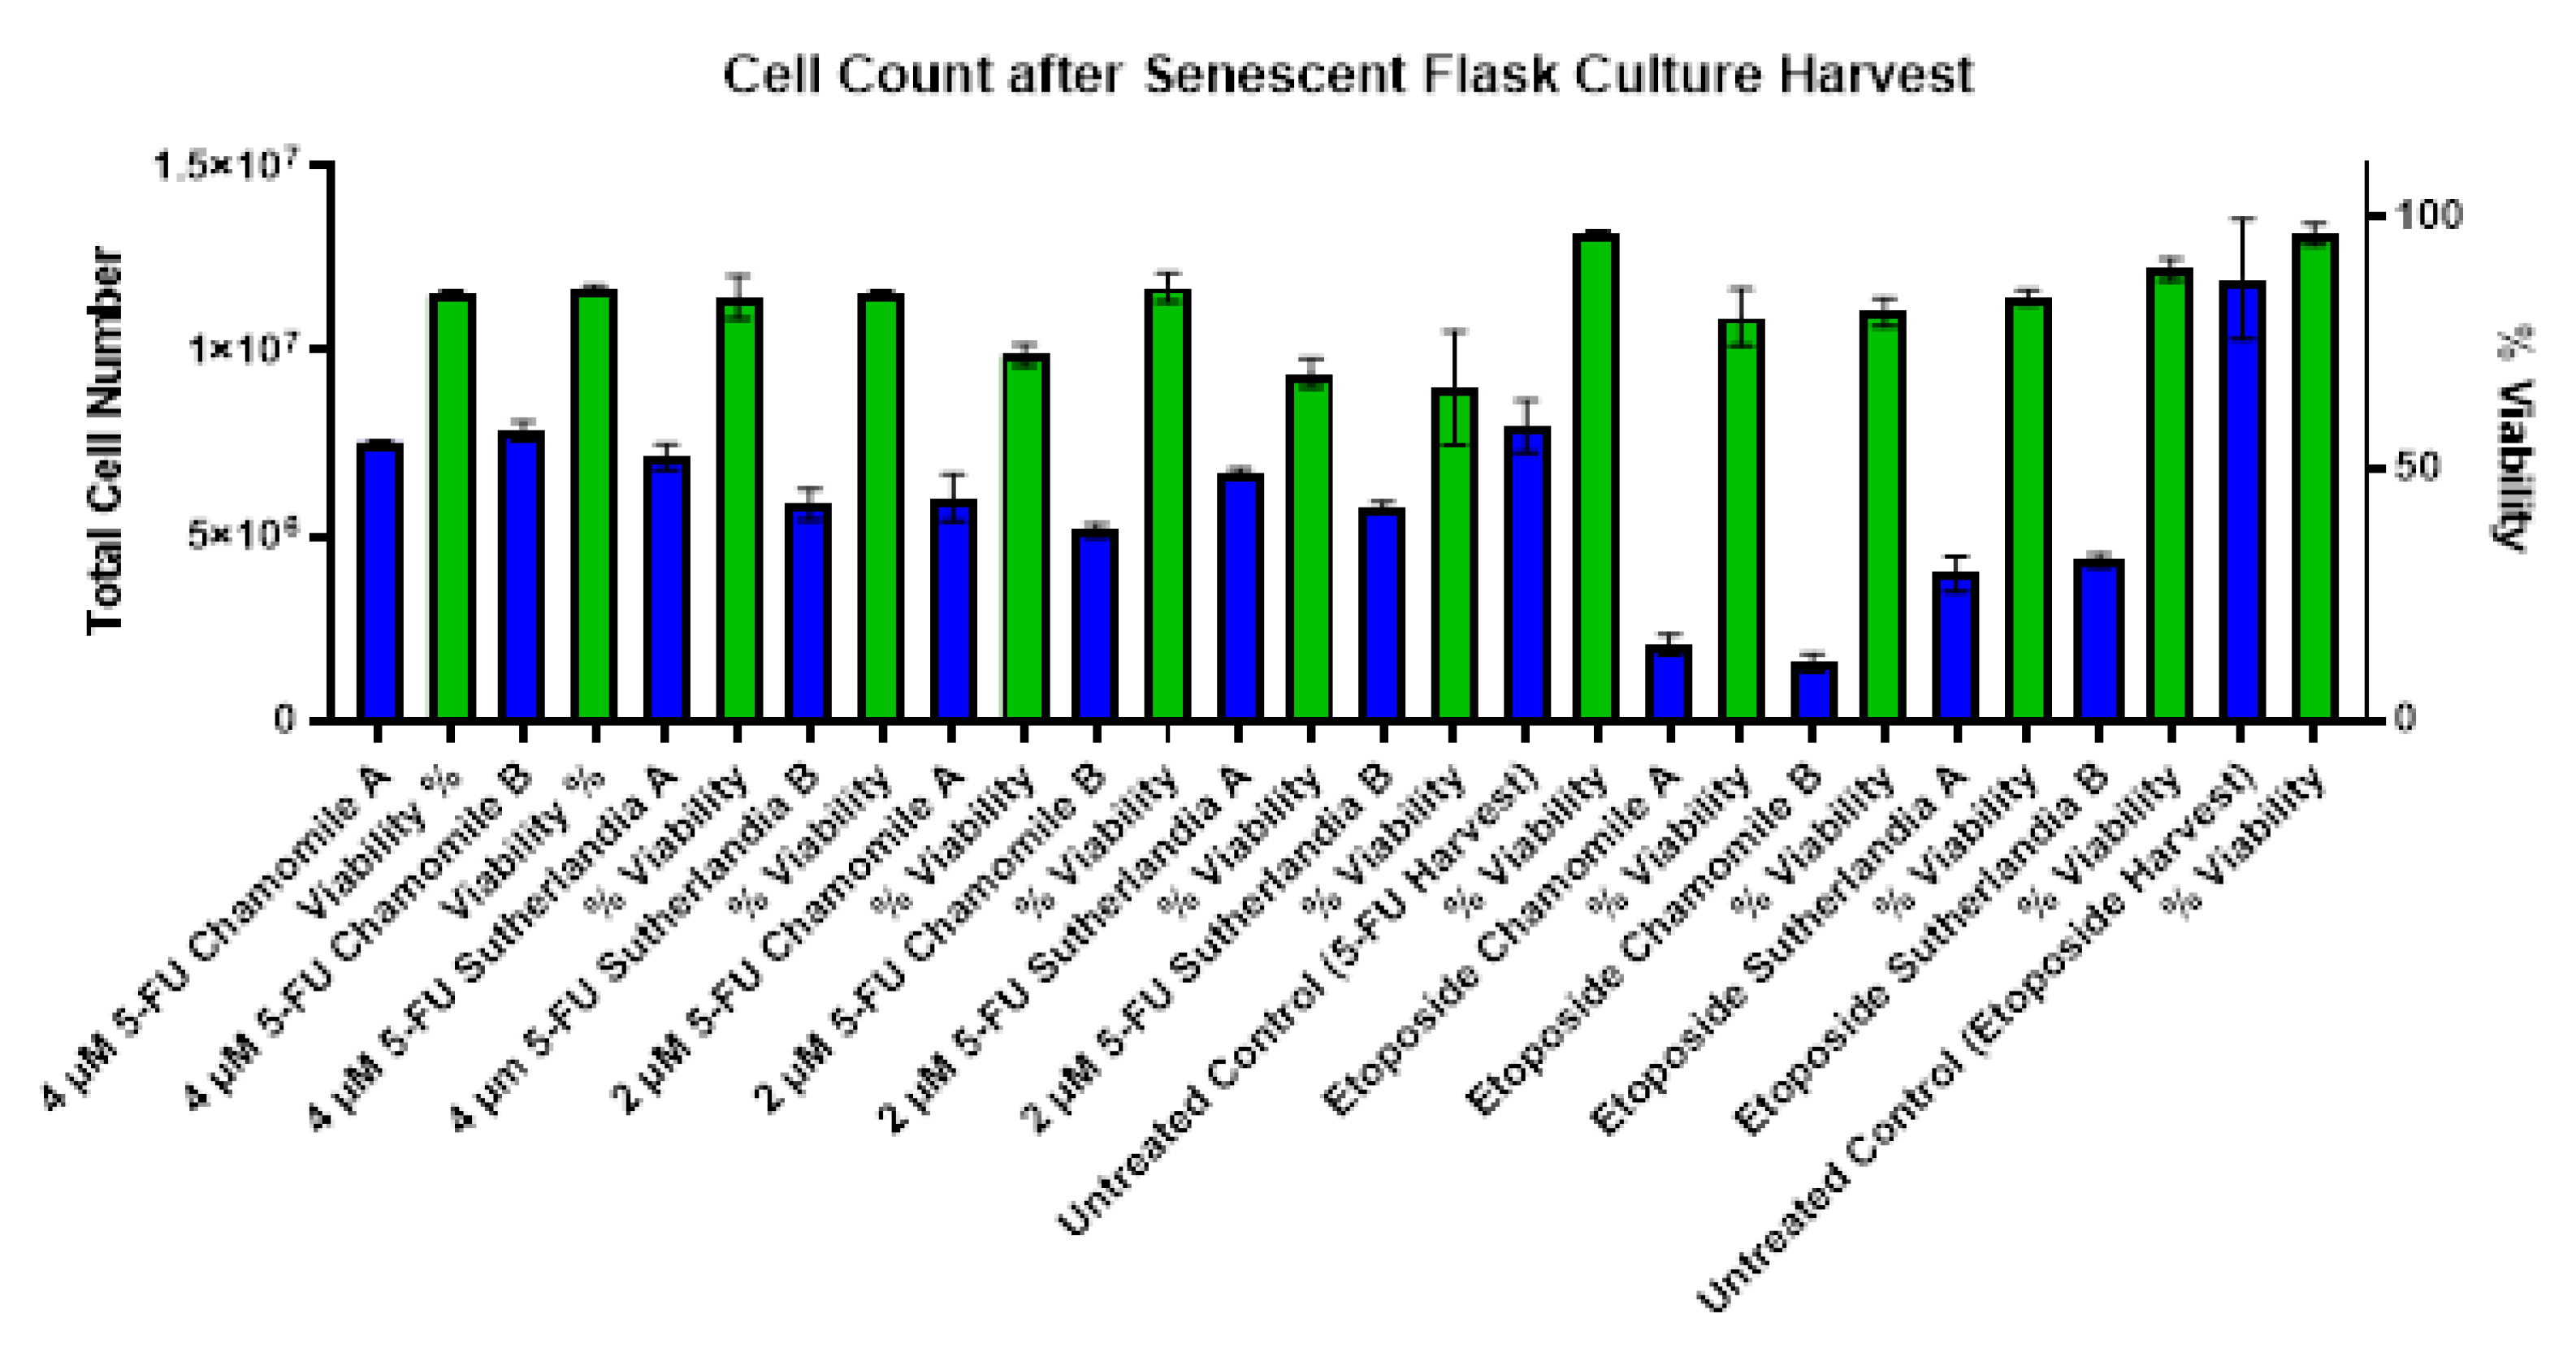
Figure 9.
Viability and DNA content of CaCo-2 cells after chemotherapeutic treatment and subsequent treatment with phytochemicals in a screening experiment according to PrestoBlue Cell Viability Assay (a) and Hoechst Assay (b). The treatment with chamomile contained 0.1 g/L chamomile extract, the treatment with Sutherlandia and Ballonerbse contained 1 g/L extract.
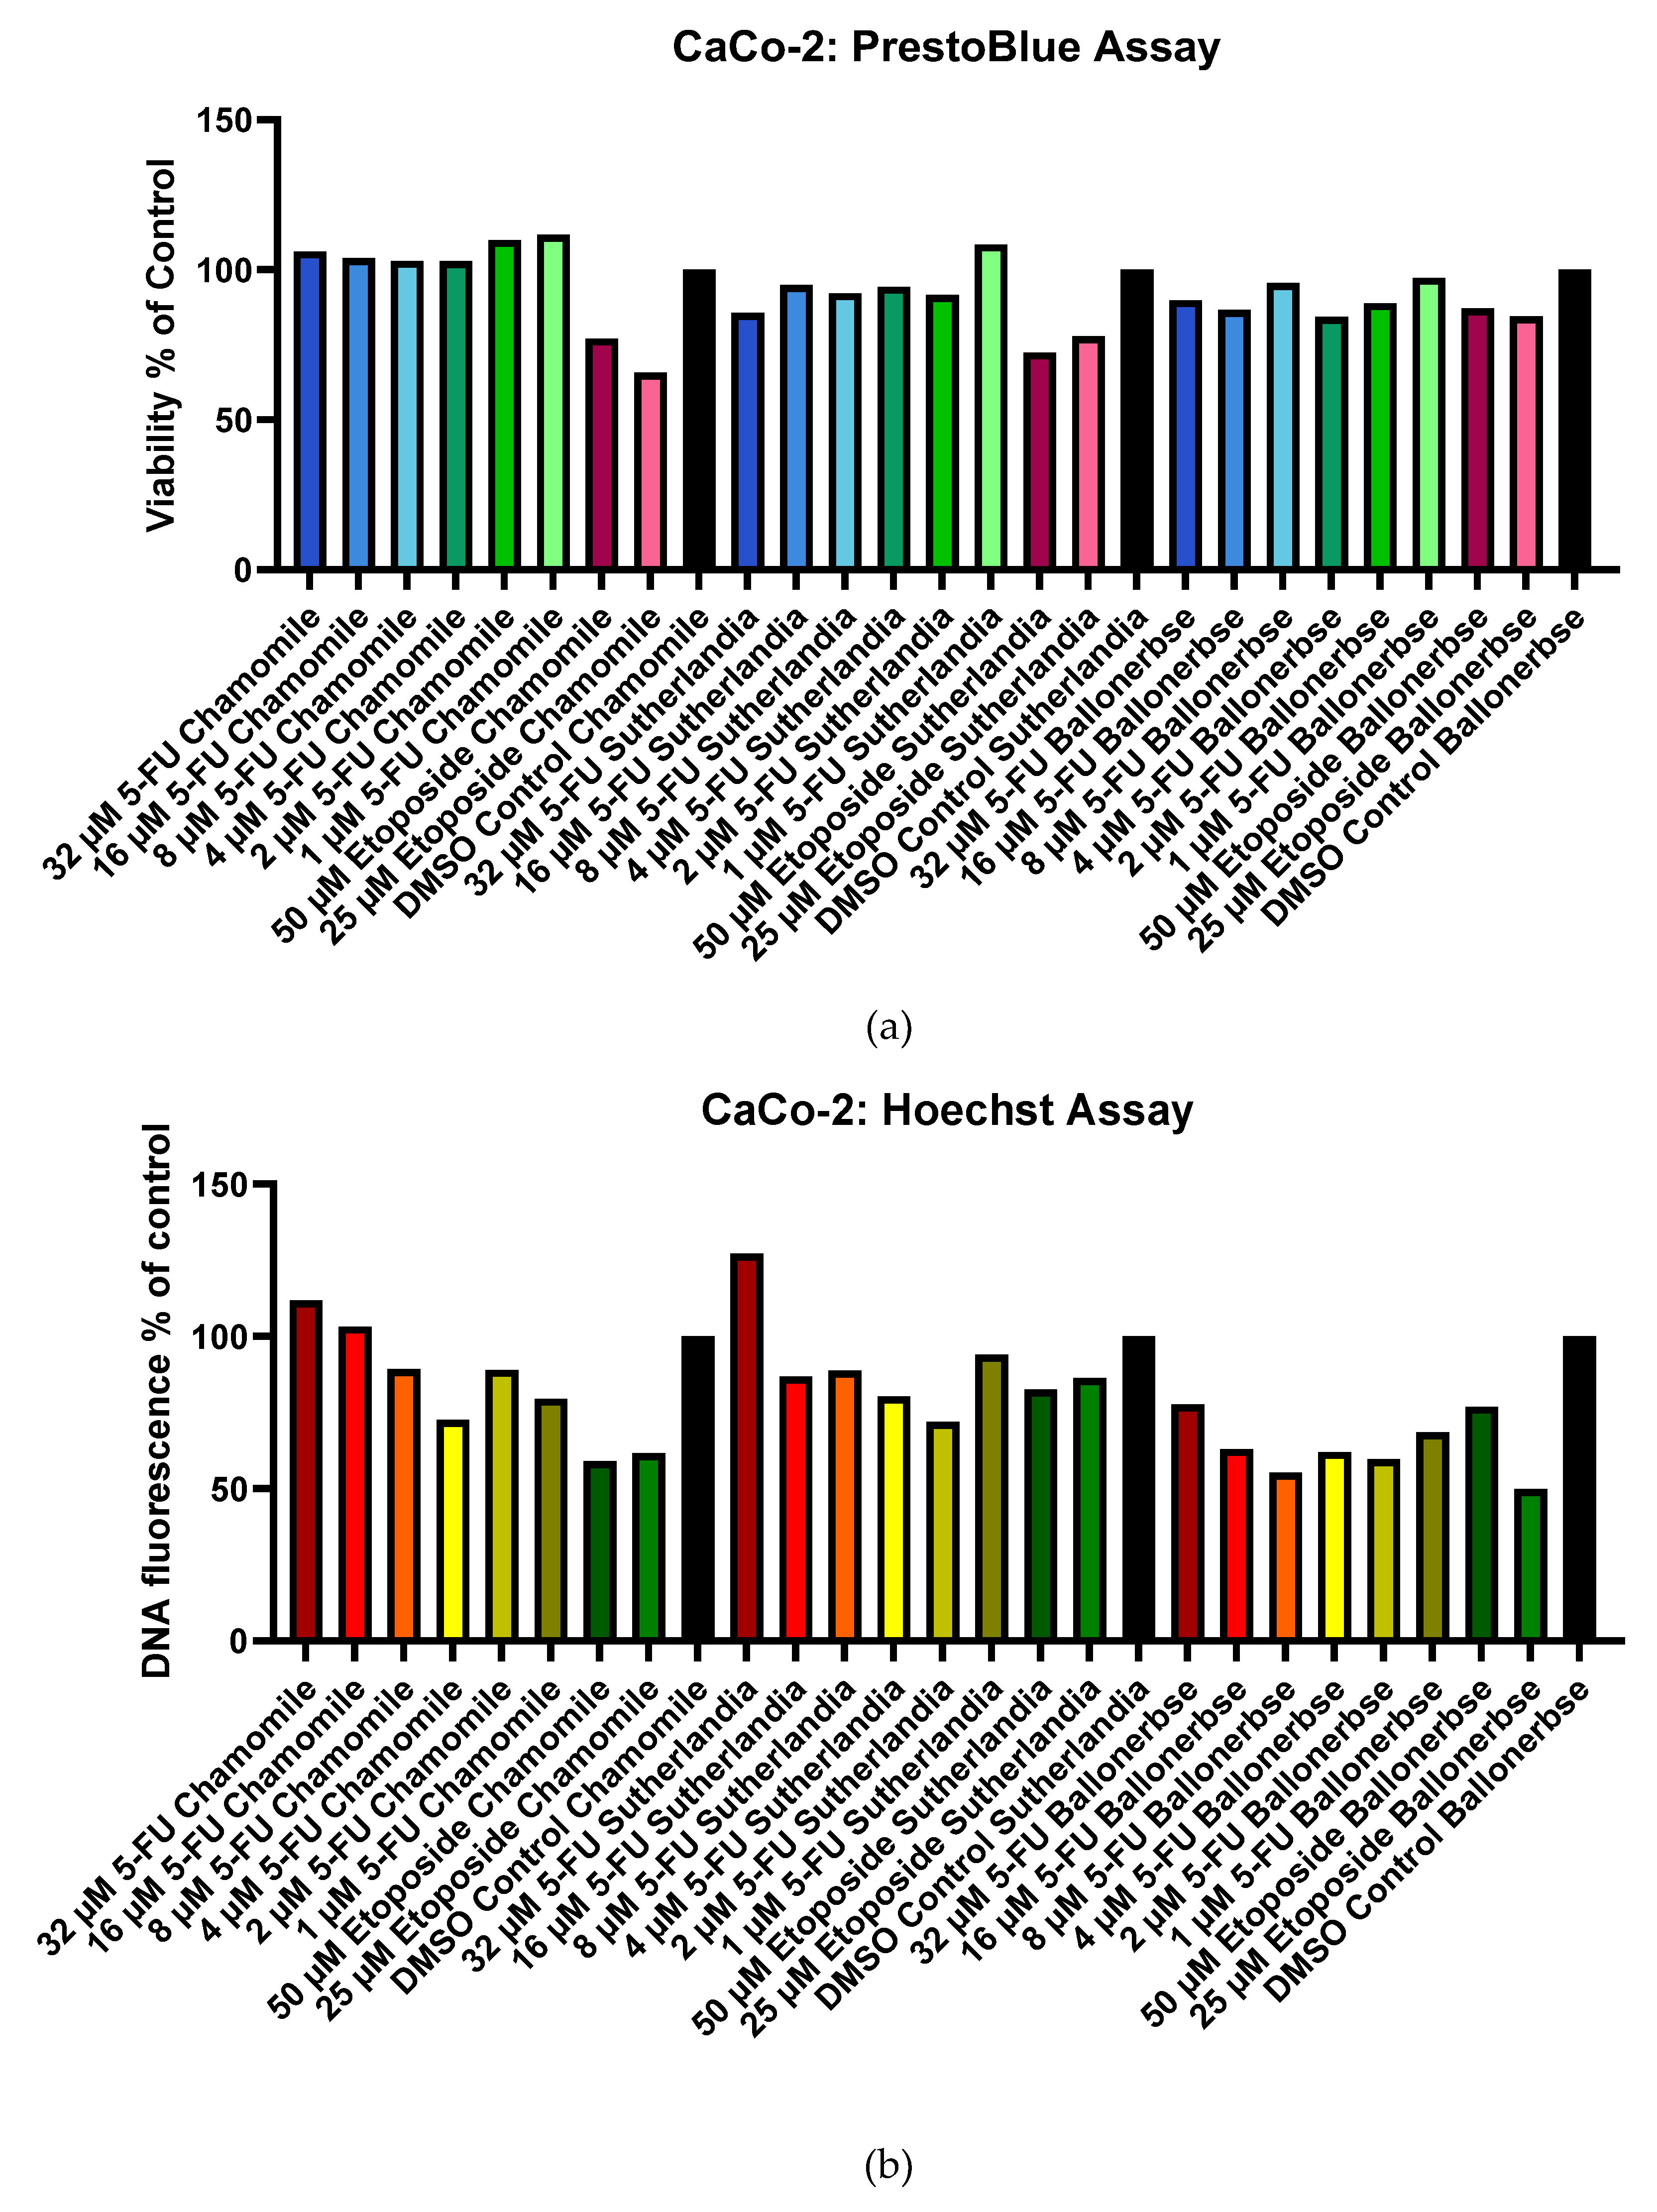
Figure 10.
Viability and DNA content of PANC-1 cells after chemotherapeutic treatment and subsequent treatment with phytochemicals in a screening experiment according to PrestoBlue Cell Viability Assay (a) and Hoechst Assay (b). The treatment with chamomile contained 0.1 g/L chamomile extract, the treatment with Sutherlandia and Ballonerbse contained 1 g/L extract each.
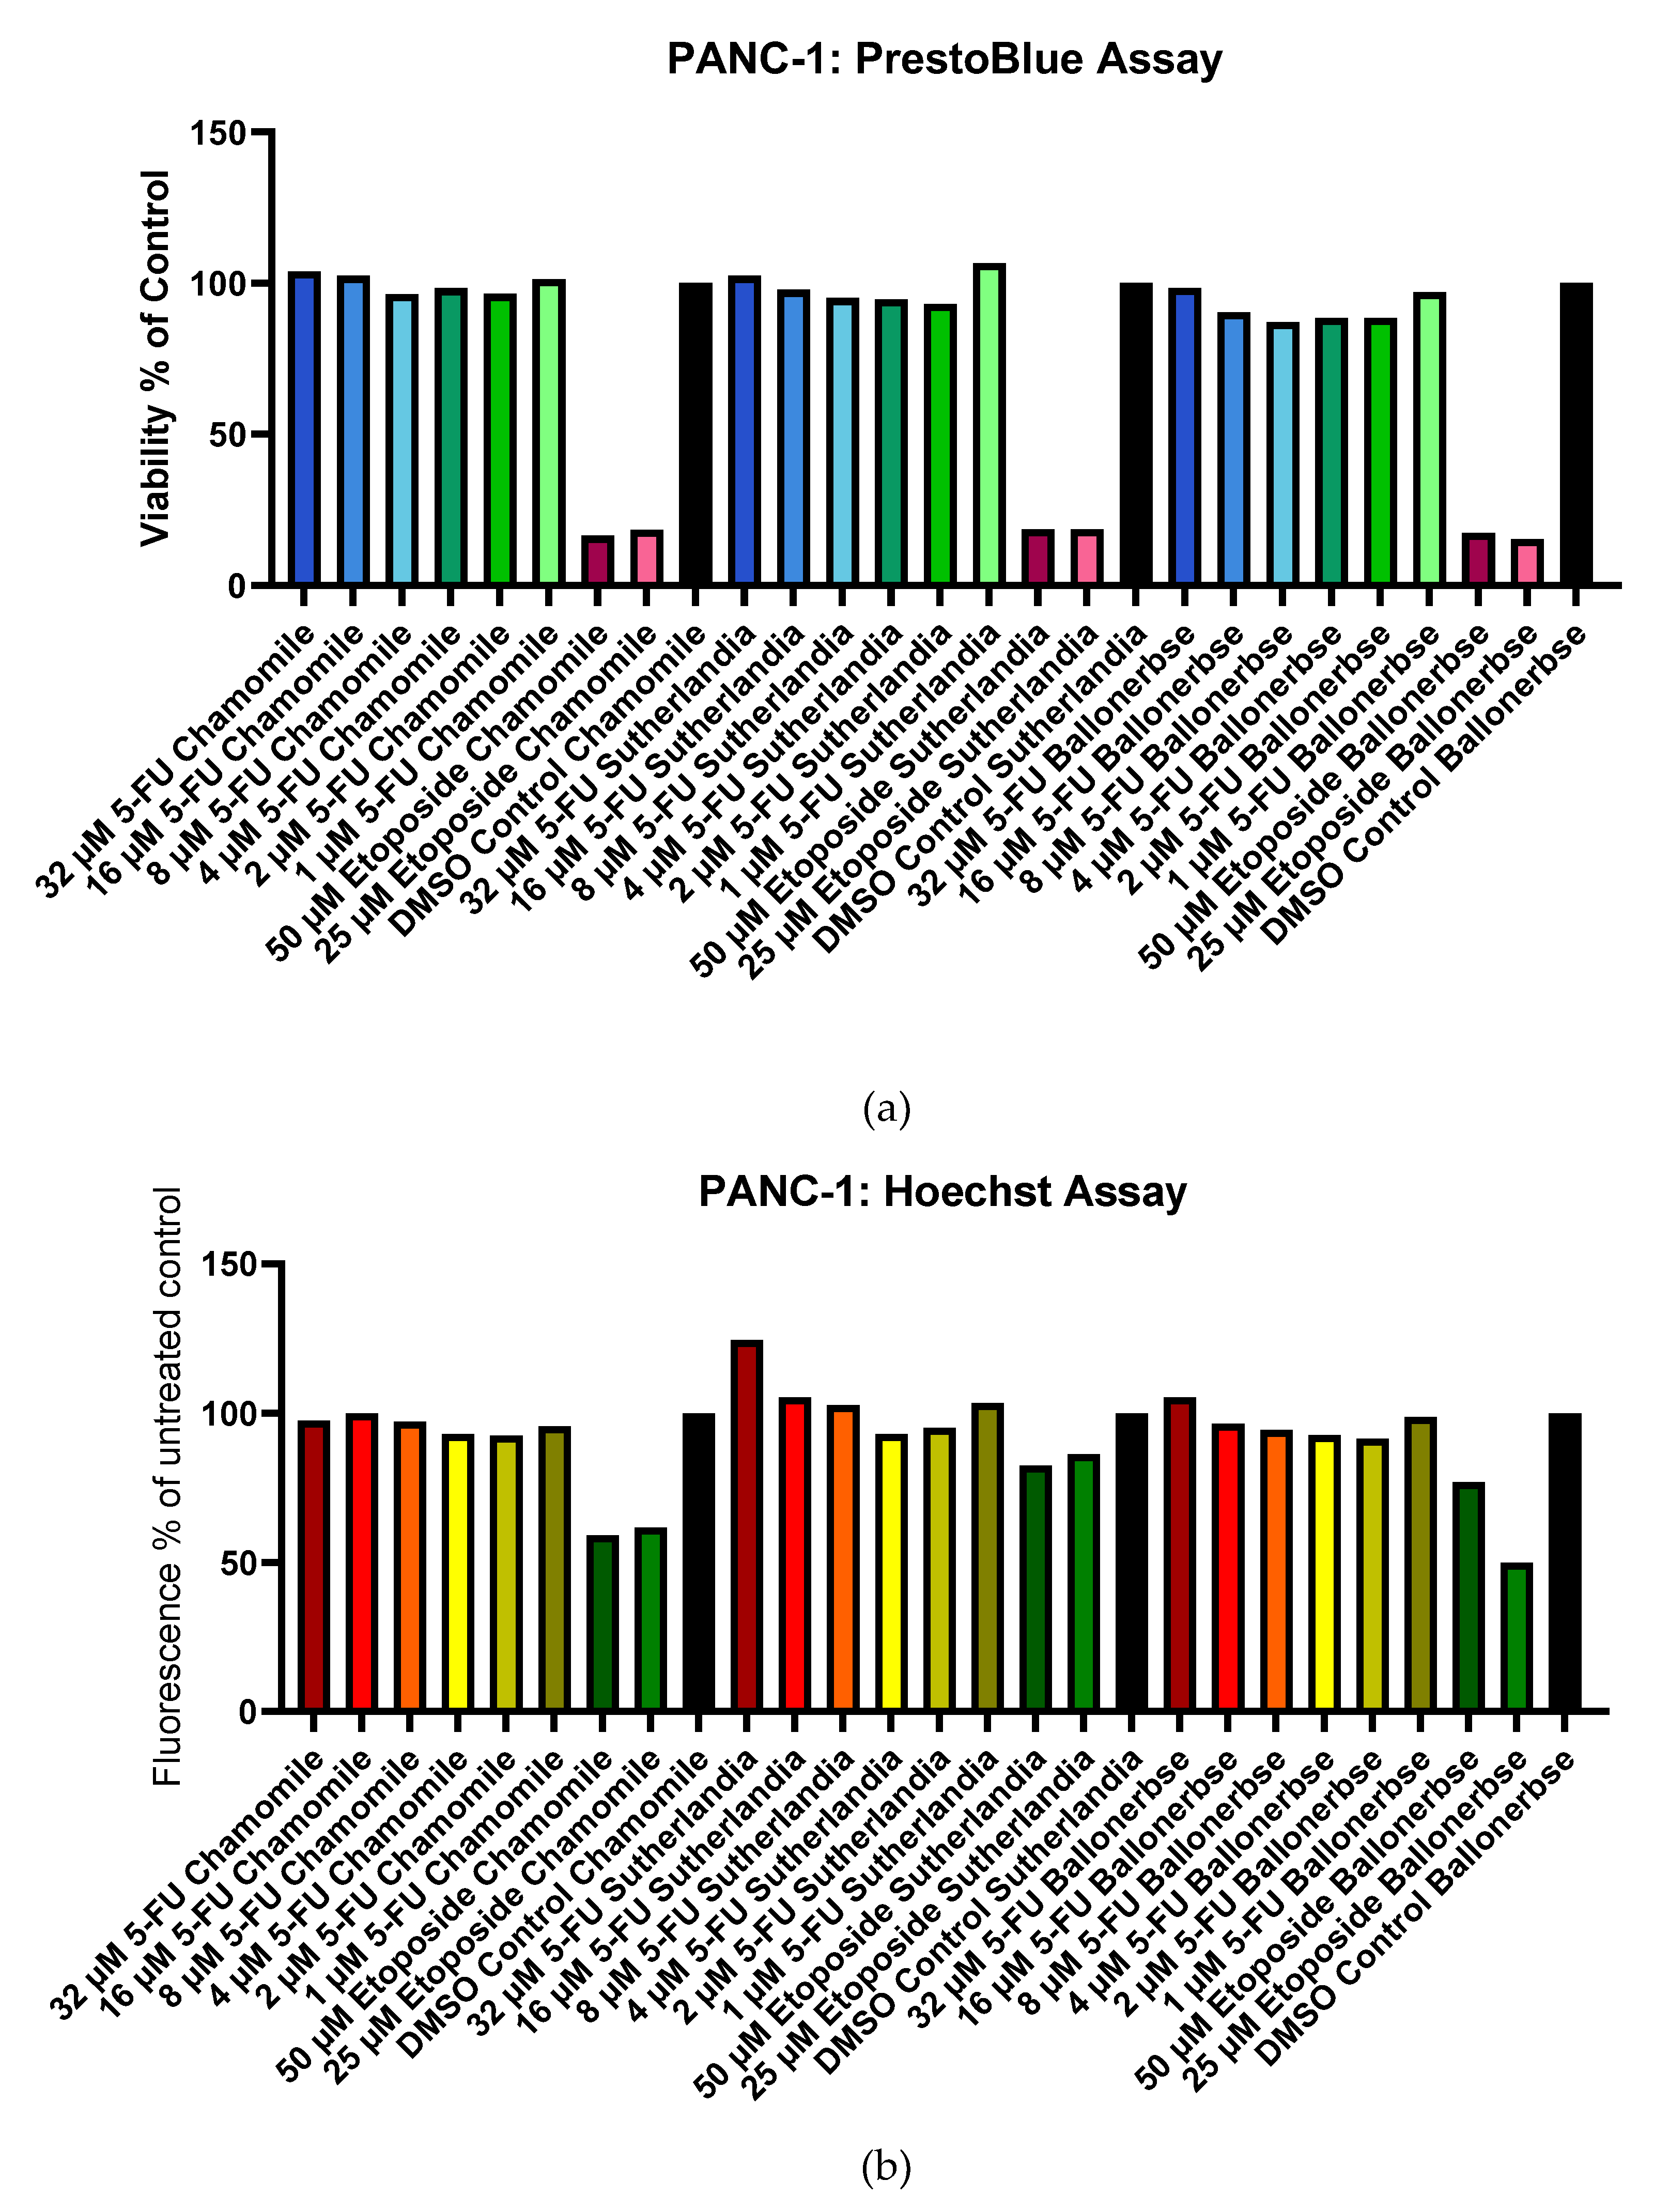
Figure 11.
Microscope images (brightfield, 10X objective) of SAβ-Gal stained (a) CaCo-2 and (b) PANC-1 cells after 6 hours of incubation showing the blue color of the cleaved X-Gal chromogen that labels β-galactosidase activity.
Figure 11.
Microscope images (brightfield, 10X objective) of SAβ-Gal stained (a) CaCo-2 and (b) PANC-1 cells after 6 hours of incubation showing the blue color of the cleaved X-Gal chromogen that labels β-galactosidase activity.
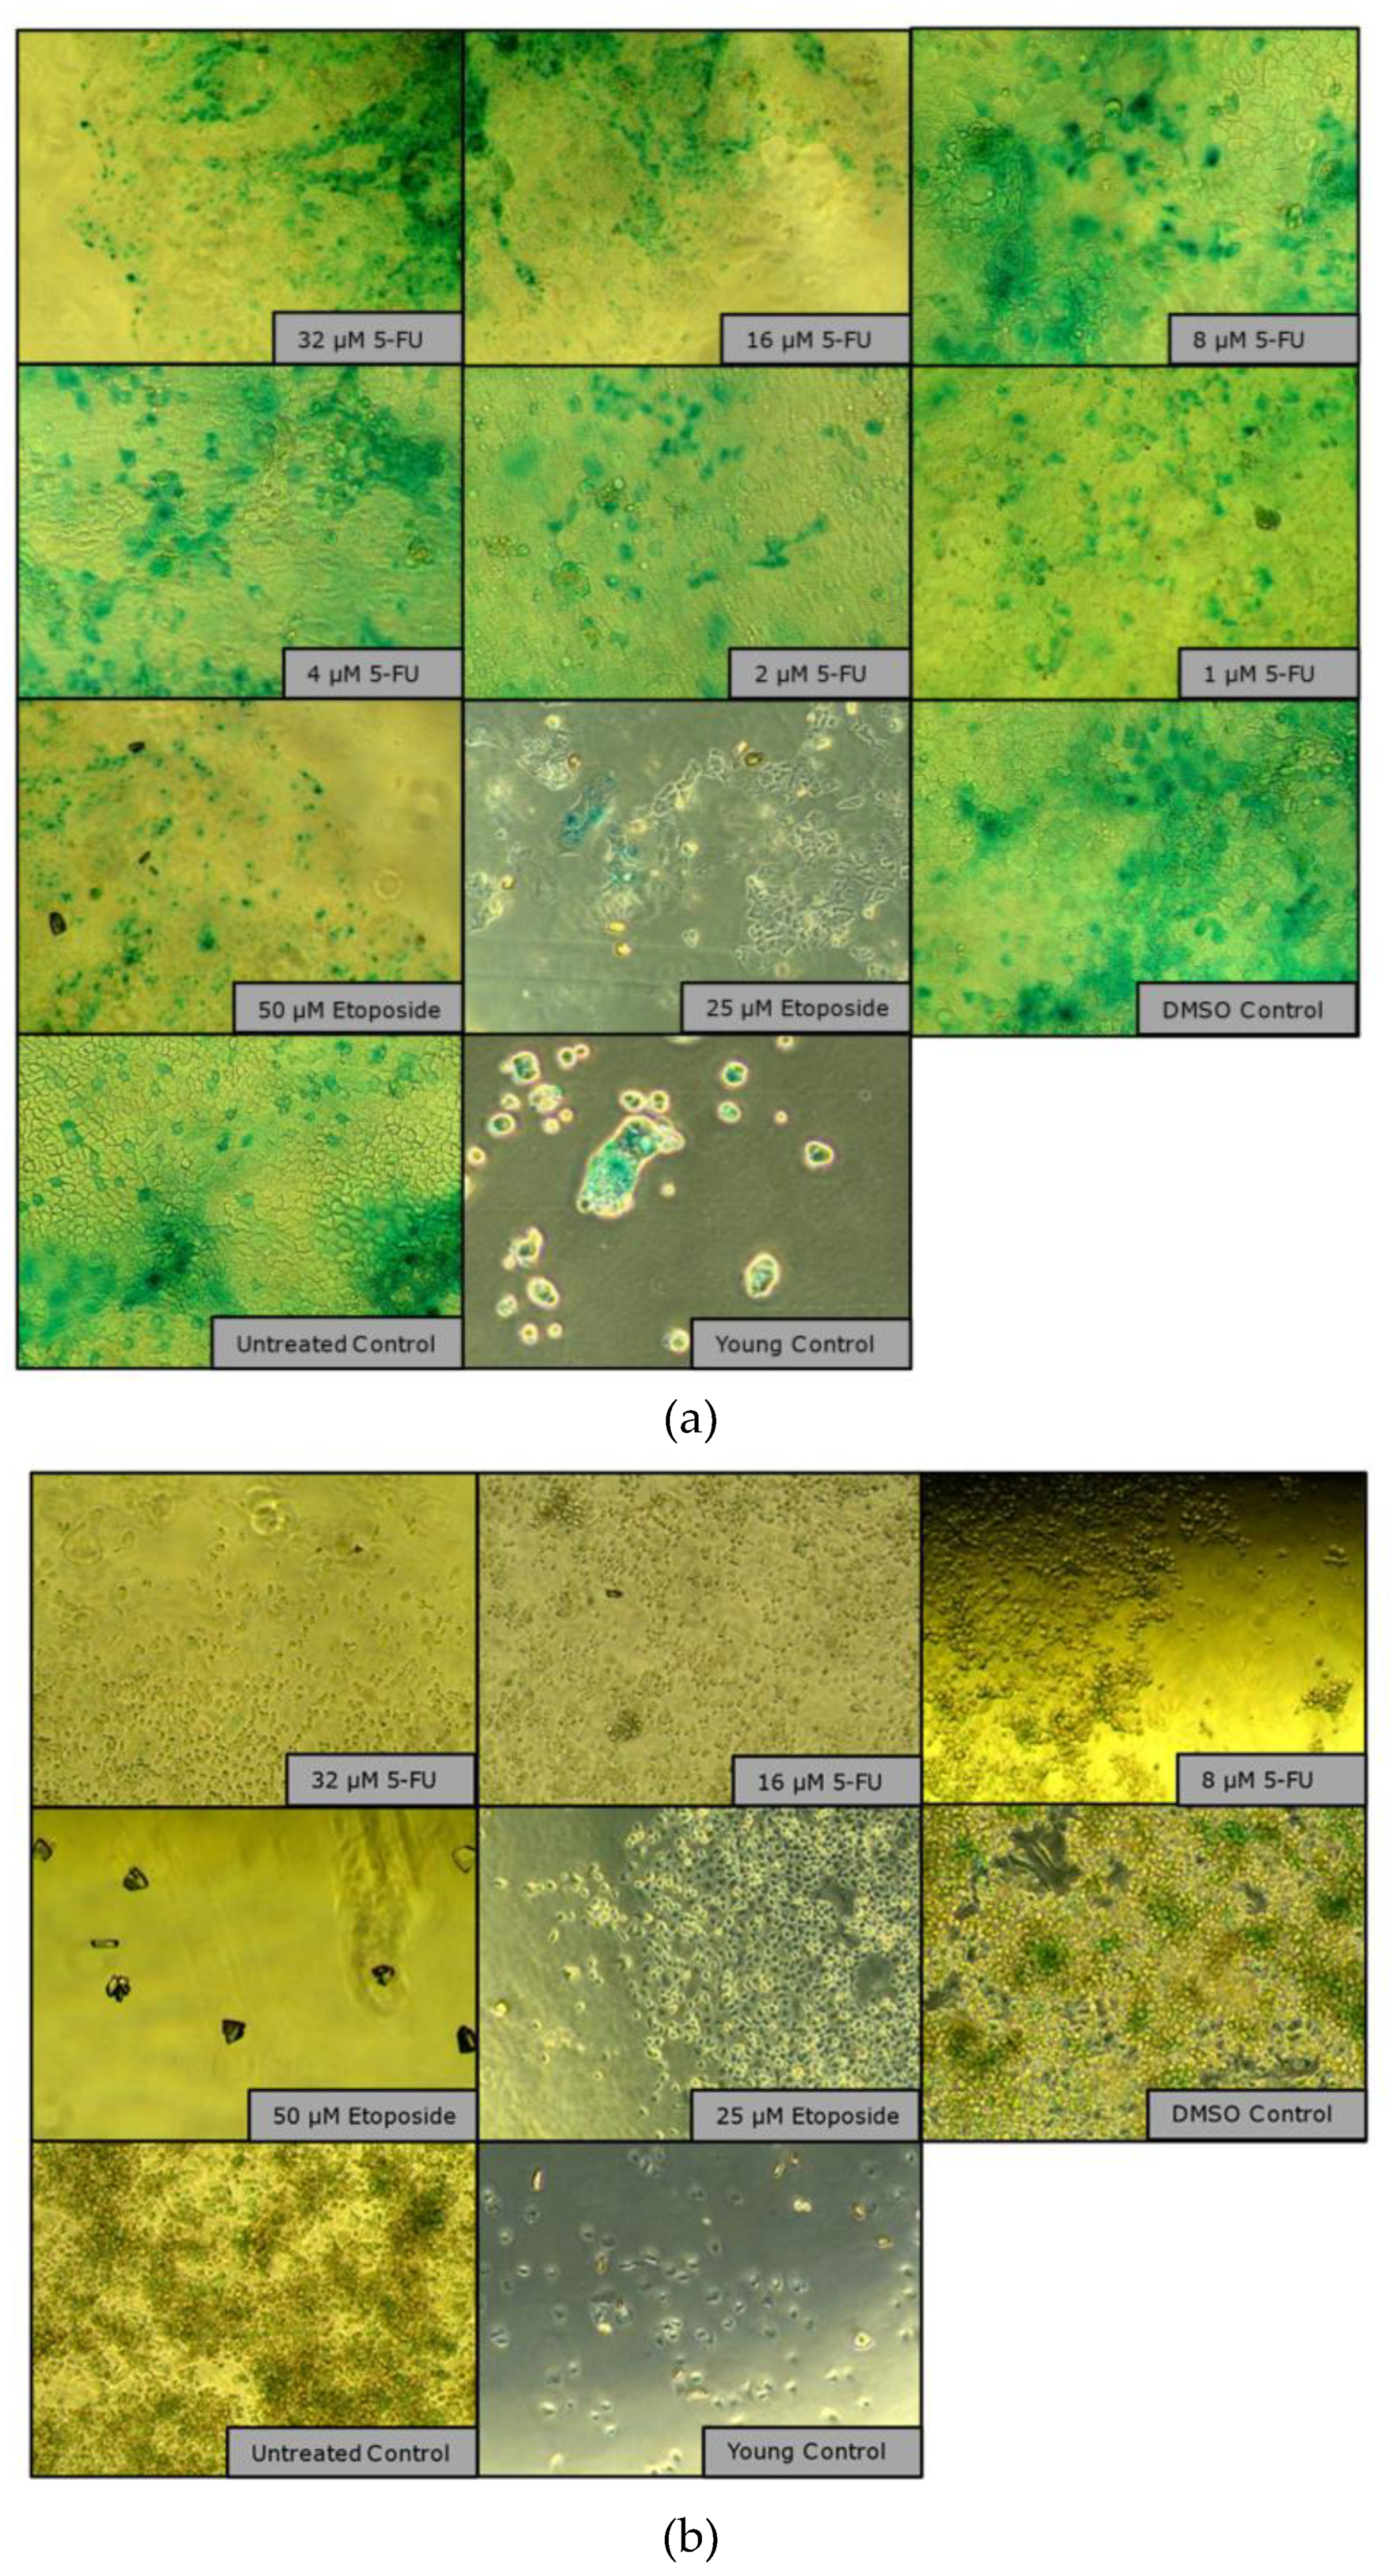
Figure 12.
IL-6 concentrations detected in conditioned medium of CaCo-2 (a) and PANC-1 (b) cells after chemotherapeutical treatment and subsequent phytochemical treatment in the screening experiment. The error bars in the control columns indicate the error and standard deviation of two replicates consisting of conditioned medium from two wells with the same treatment (n=2).
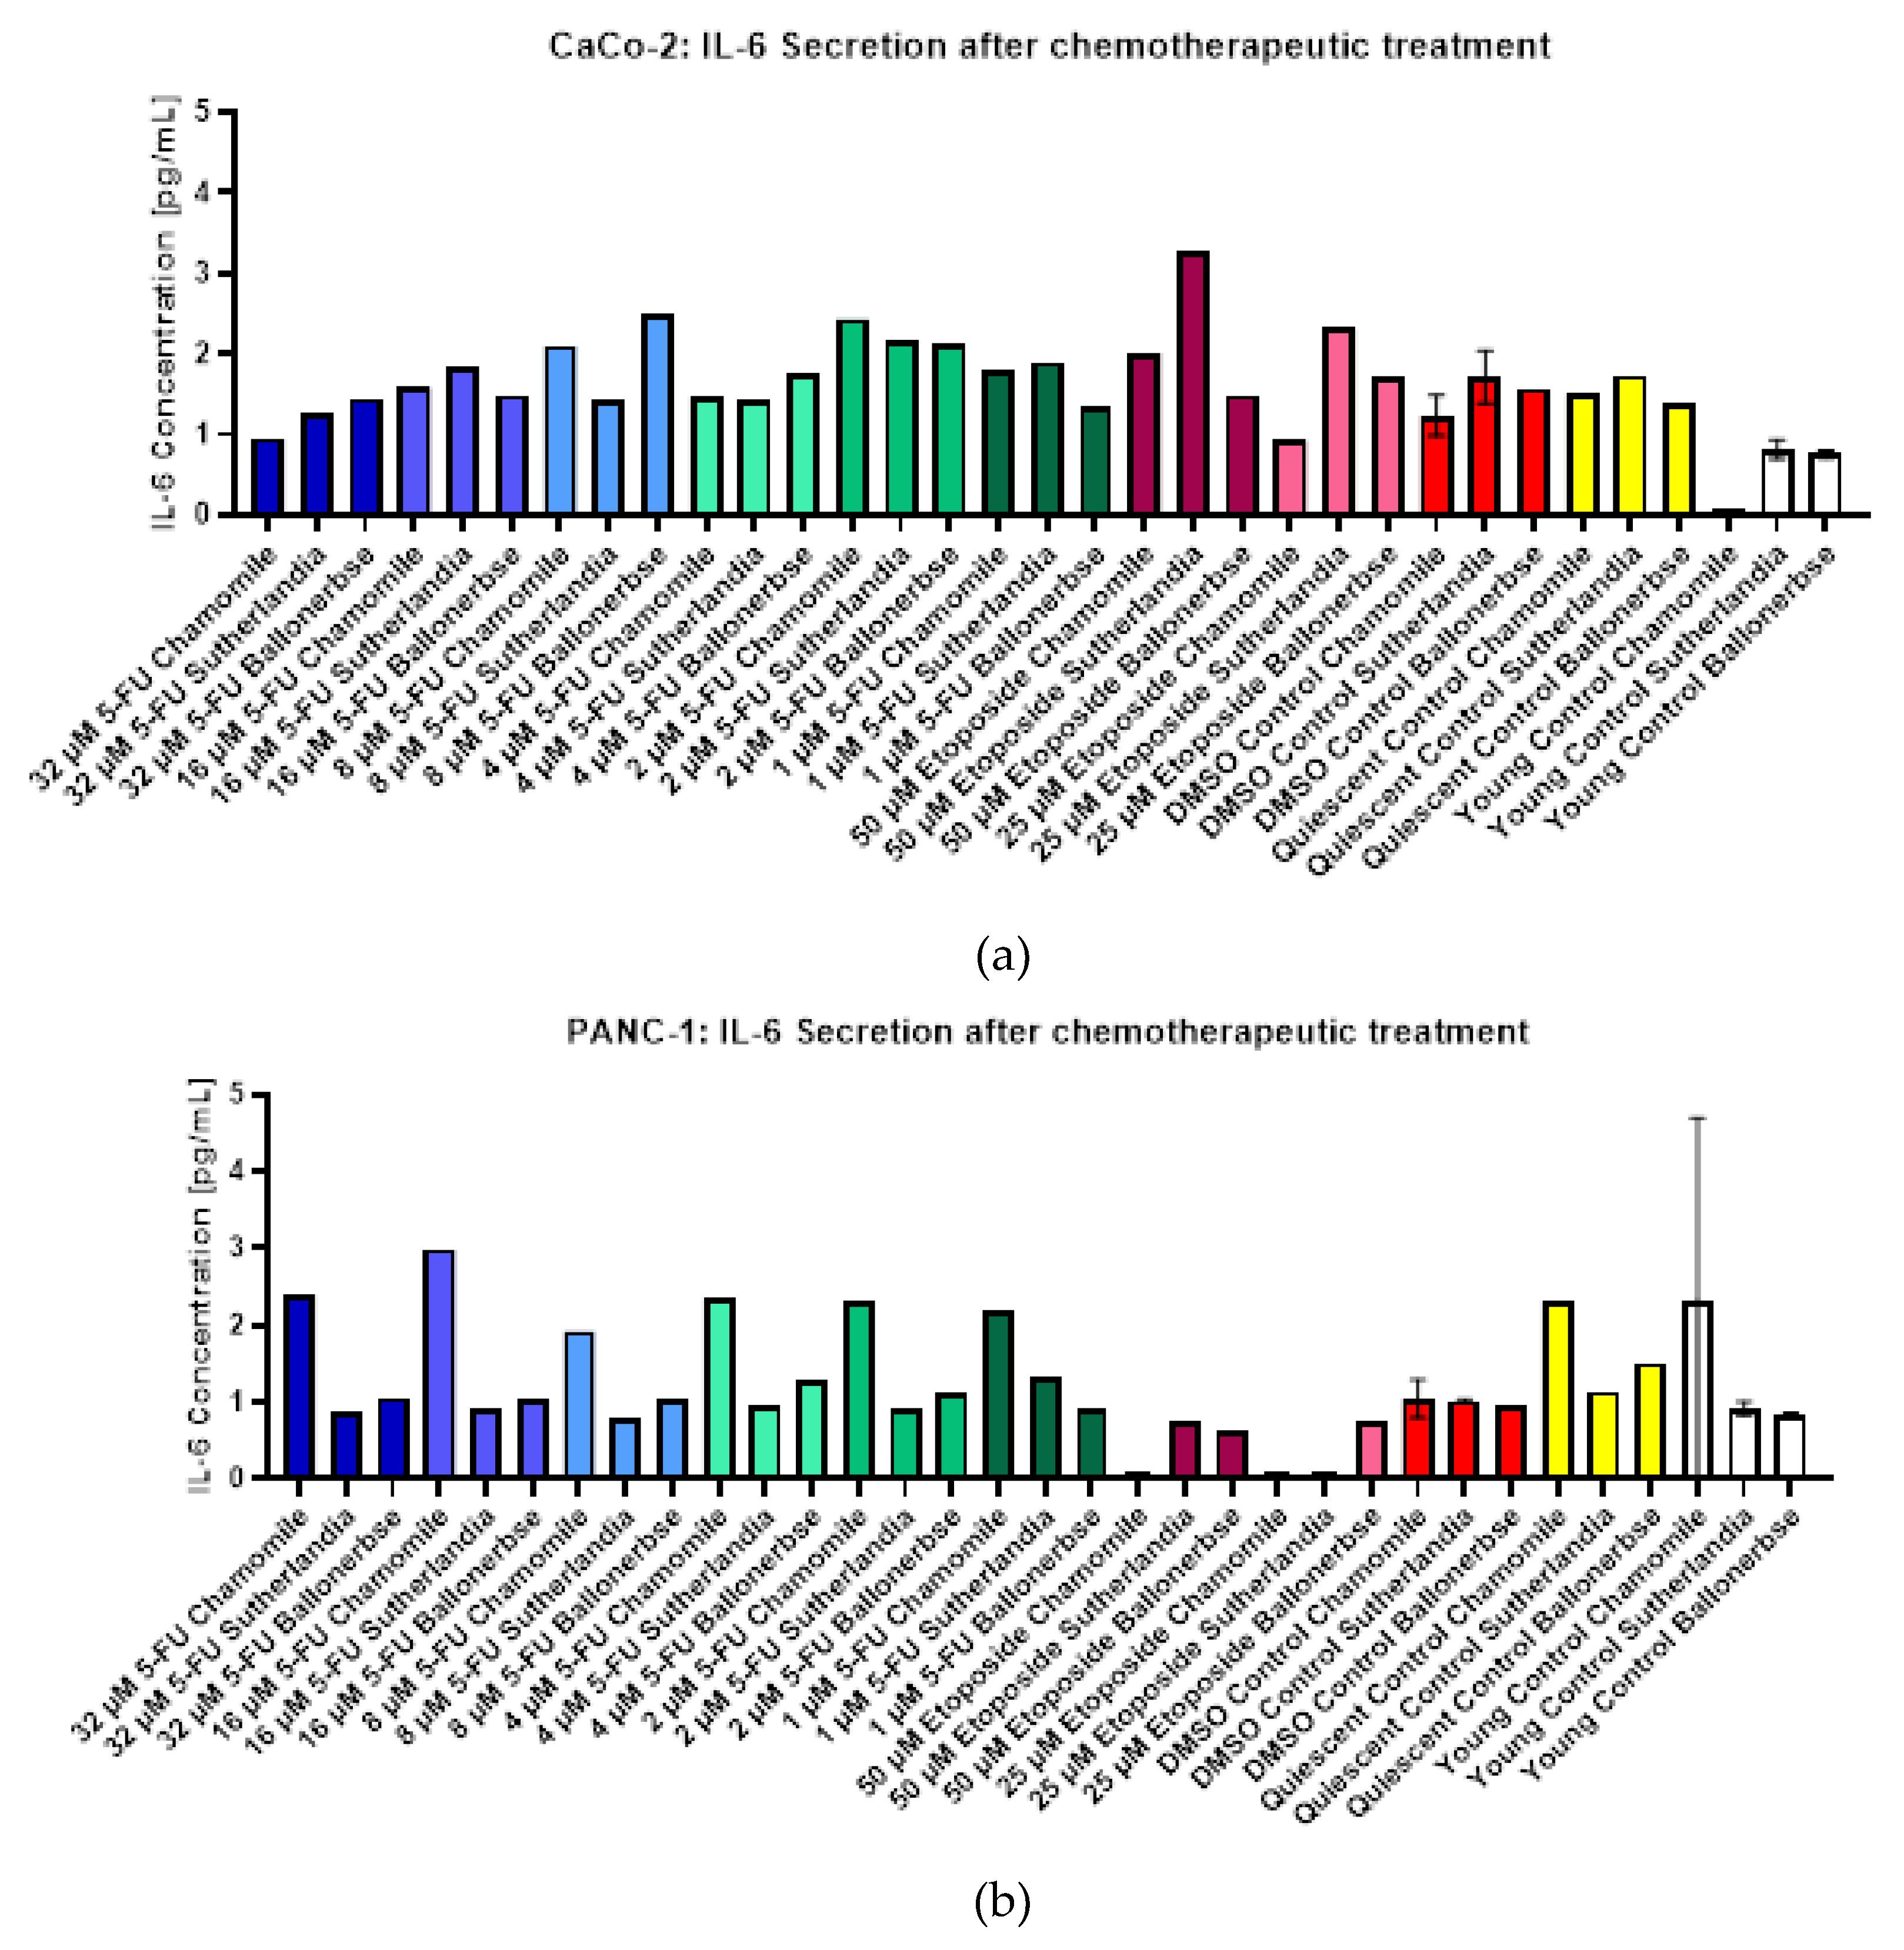
Figure 13.
Analysis plots included in the flow cytometry sample report for cells treated with 4 μM 5-fluorouracil followed by 0.1 g/L chamomile.
Figure 13.
Analysis plots included in the flow cytometry sample report for cells treated with 4 μM 5-fluorouracil followed by 0.1 g/L chamomile.
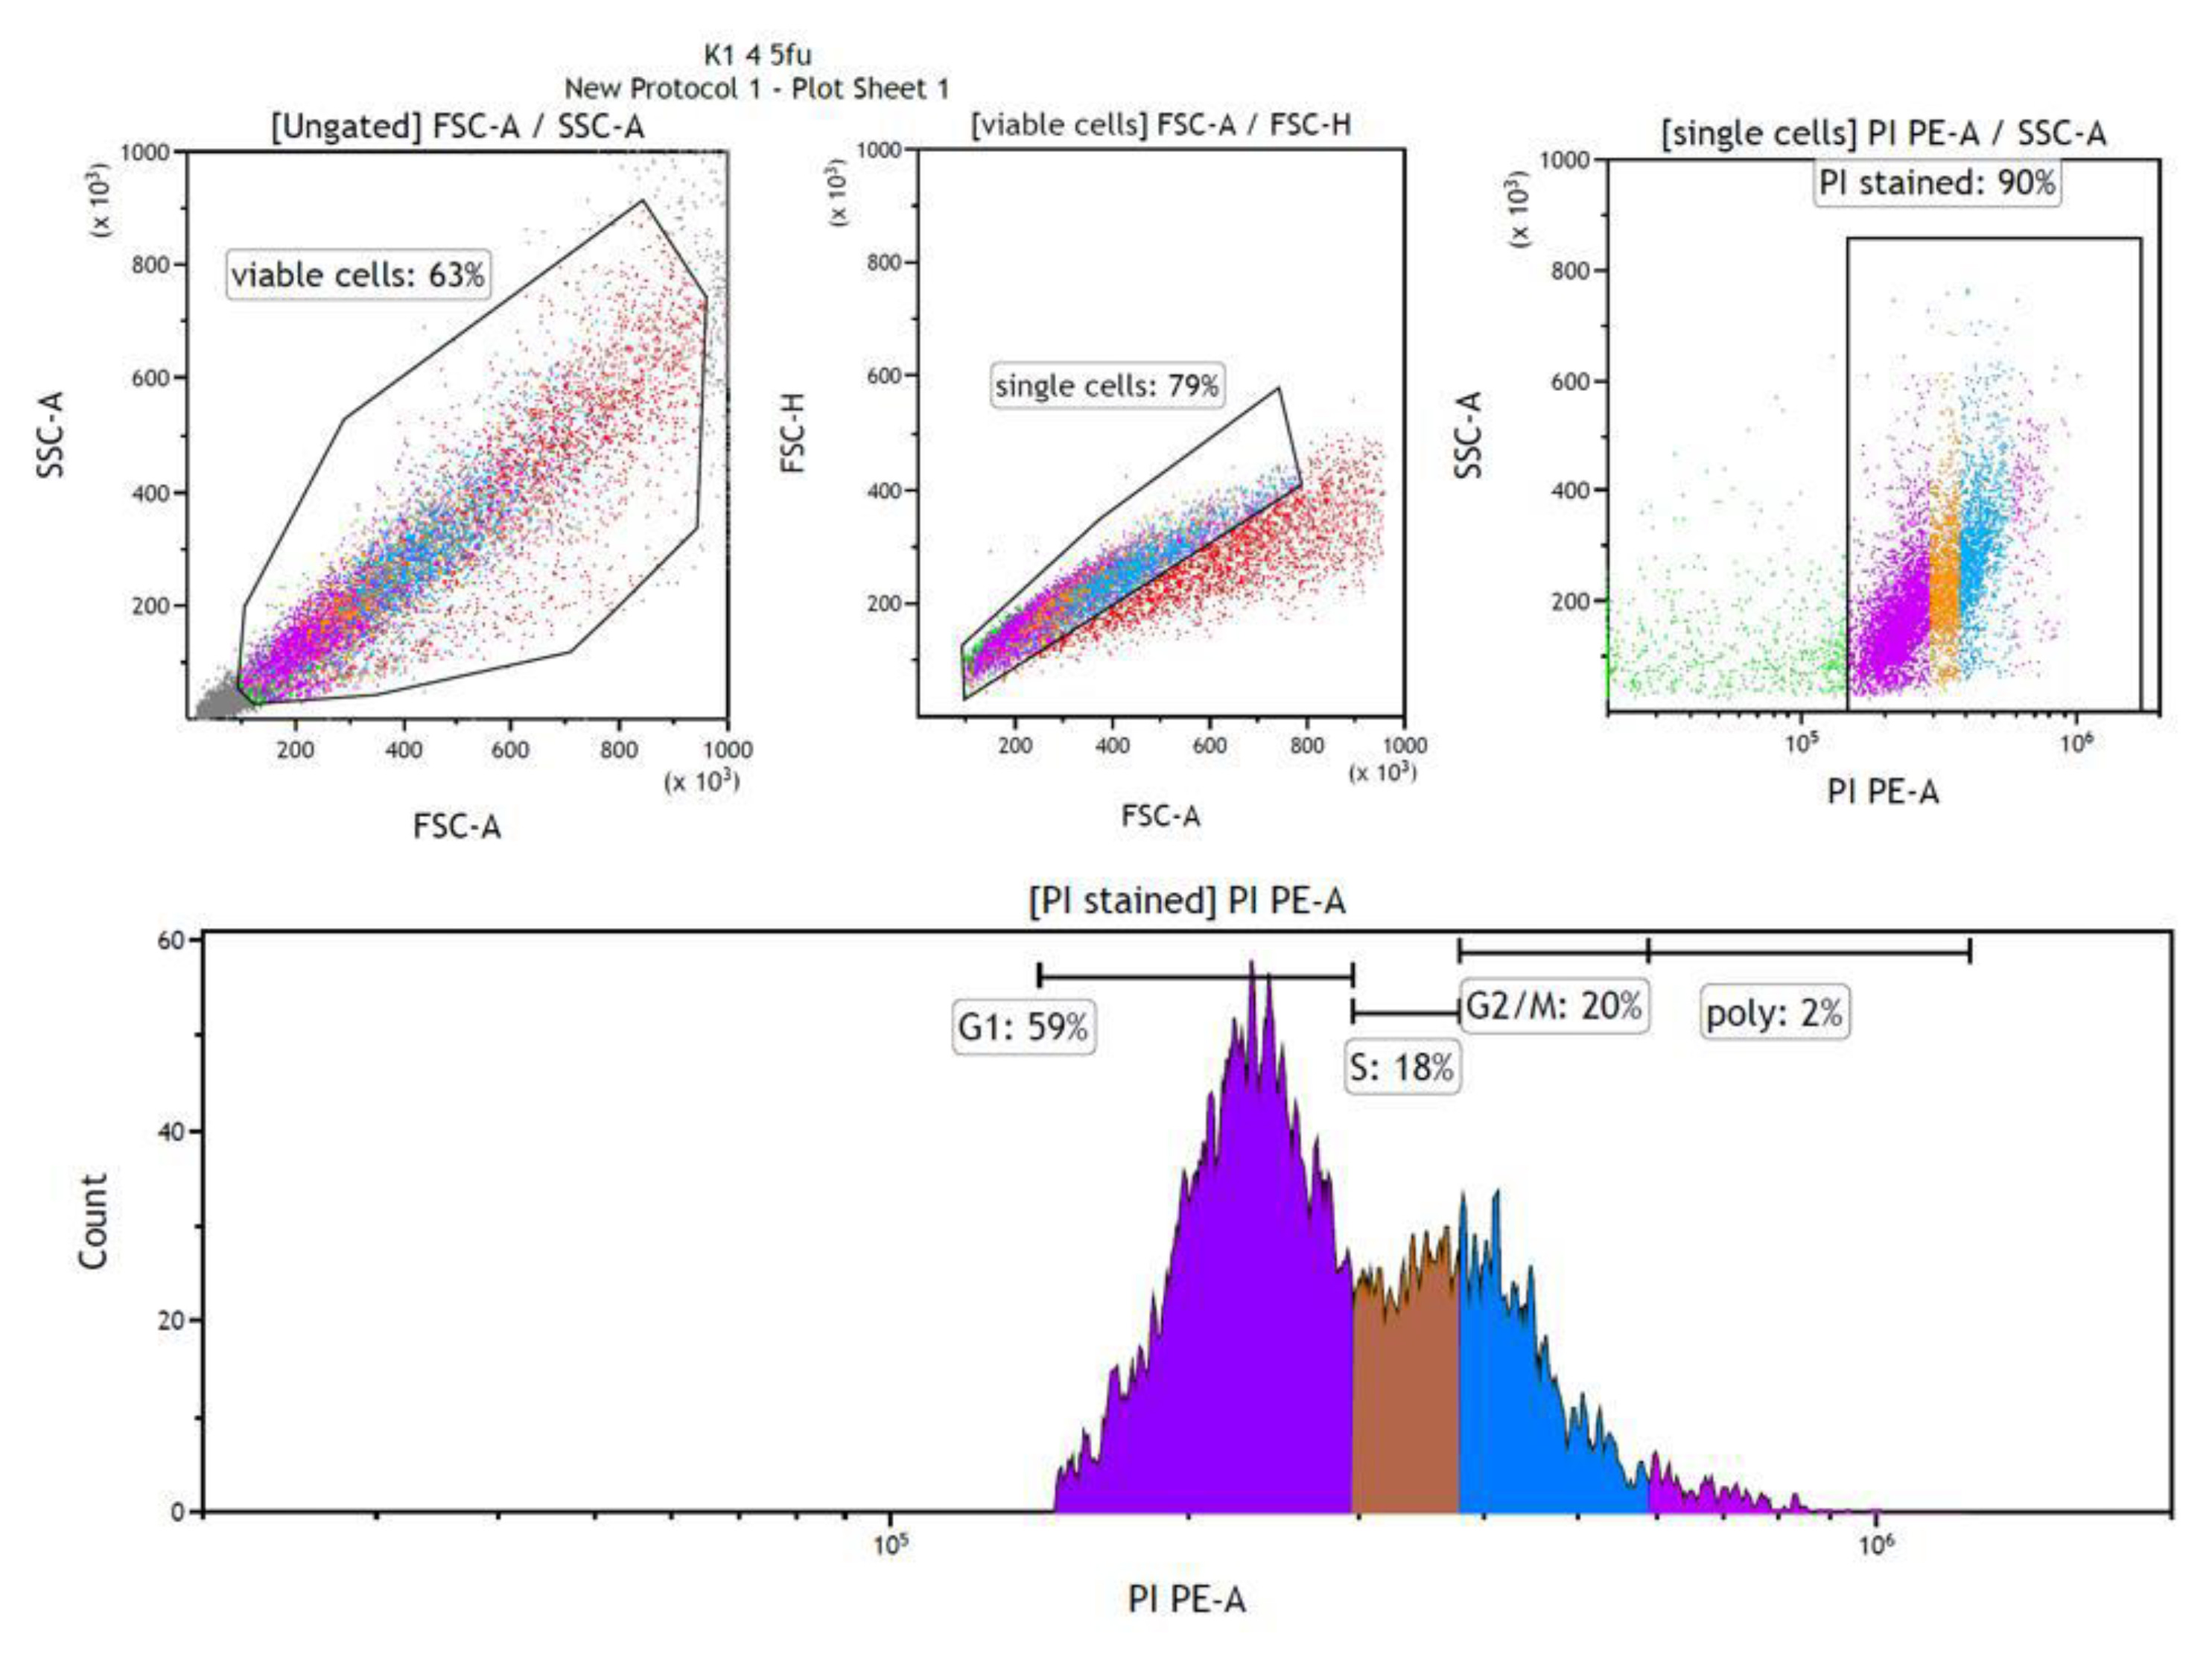
Figure 14.
Results of flow cytometric cell cycle analysis for senescent flask culture cells. Values for cells in G1, S and G2/M stages of the cell cycle are expressed as a percentage of PI-stained cells. The error bars show the mean and standard deviation of two replicates (n=2).
Figure 14.
Results of flow cytometric cell cycle analysis for senescent flask culture cells. Values for cells in G1, S and G2/M stages of the cell cycle are expressed as a percentage of PI-stained cells. The error bars show the mean and standard deviation of two replicates (n=2).
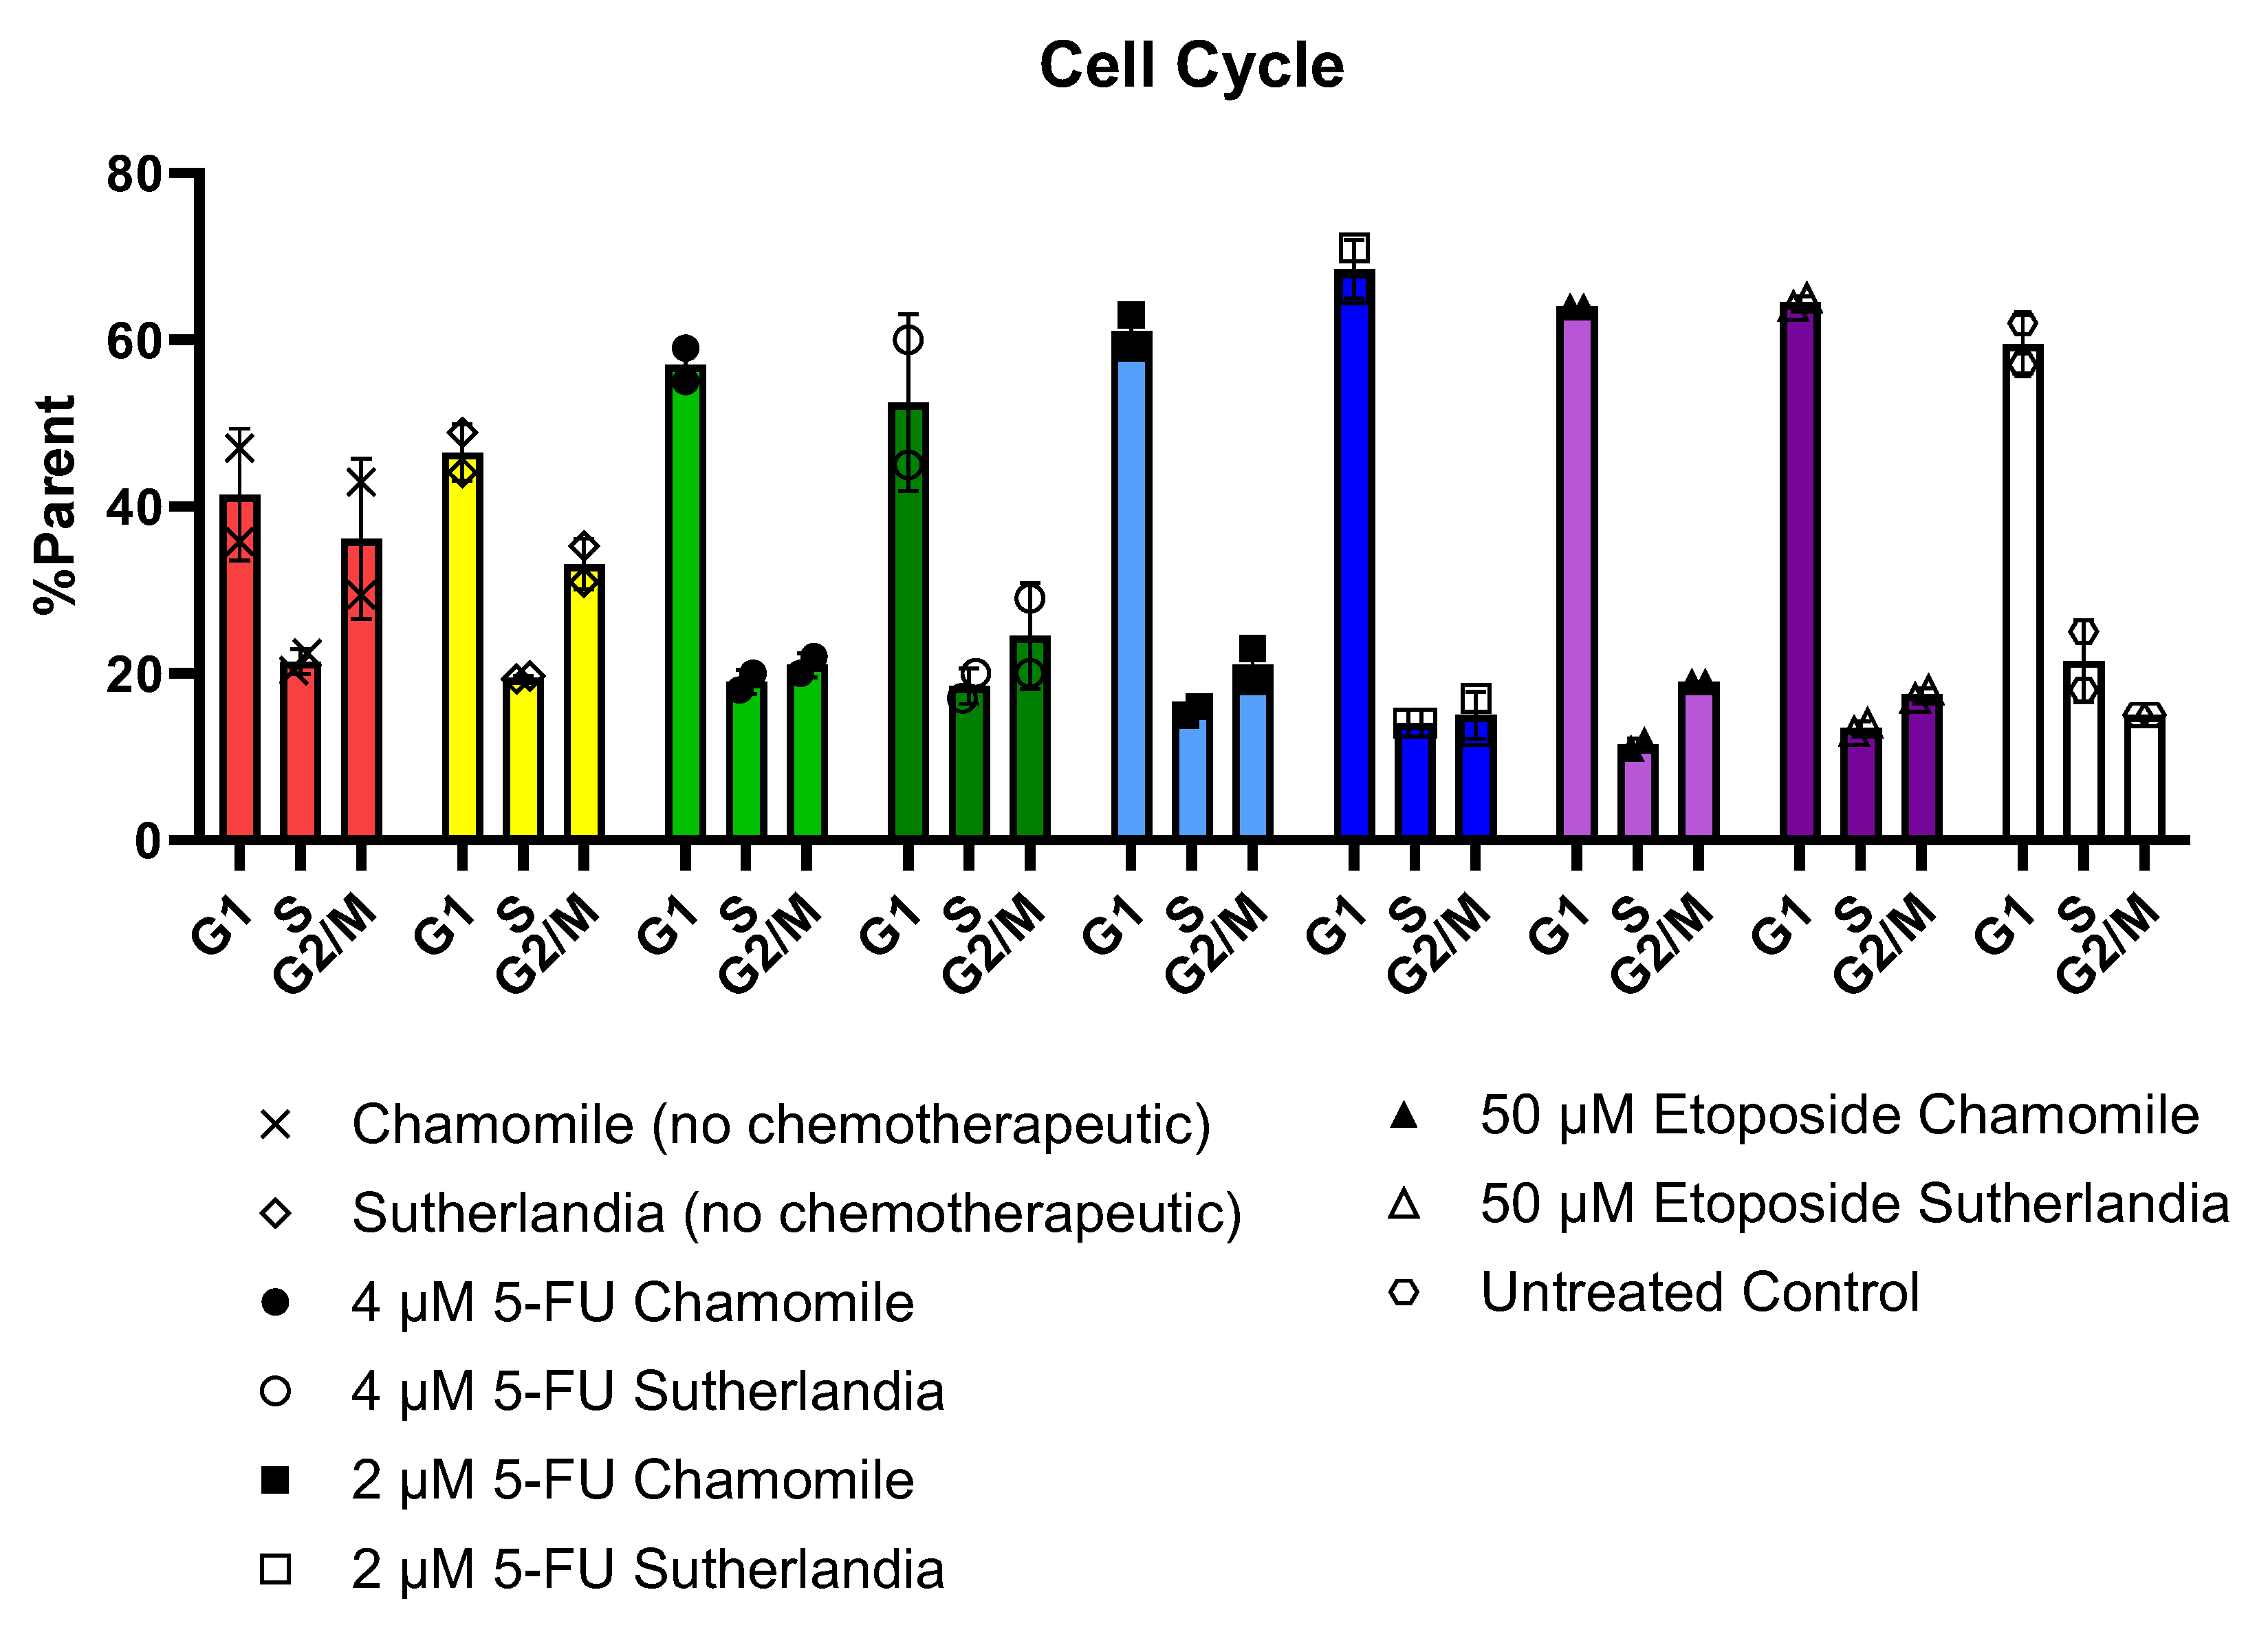
Figure 15.
Scheme of the treatment procedure of HDF-cells. Created in BioRender. Kühnel, H. (2025) https://BioRender.com/b93l3i3.
Figure 15.
Scheme of the treatment procedure of HDF-cells. Created in BioRender. Kühnel, H. (2025) https://BioRender.com/b93l3i3.
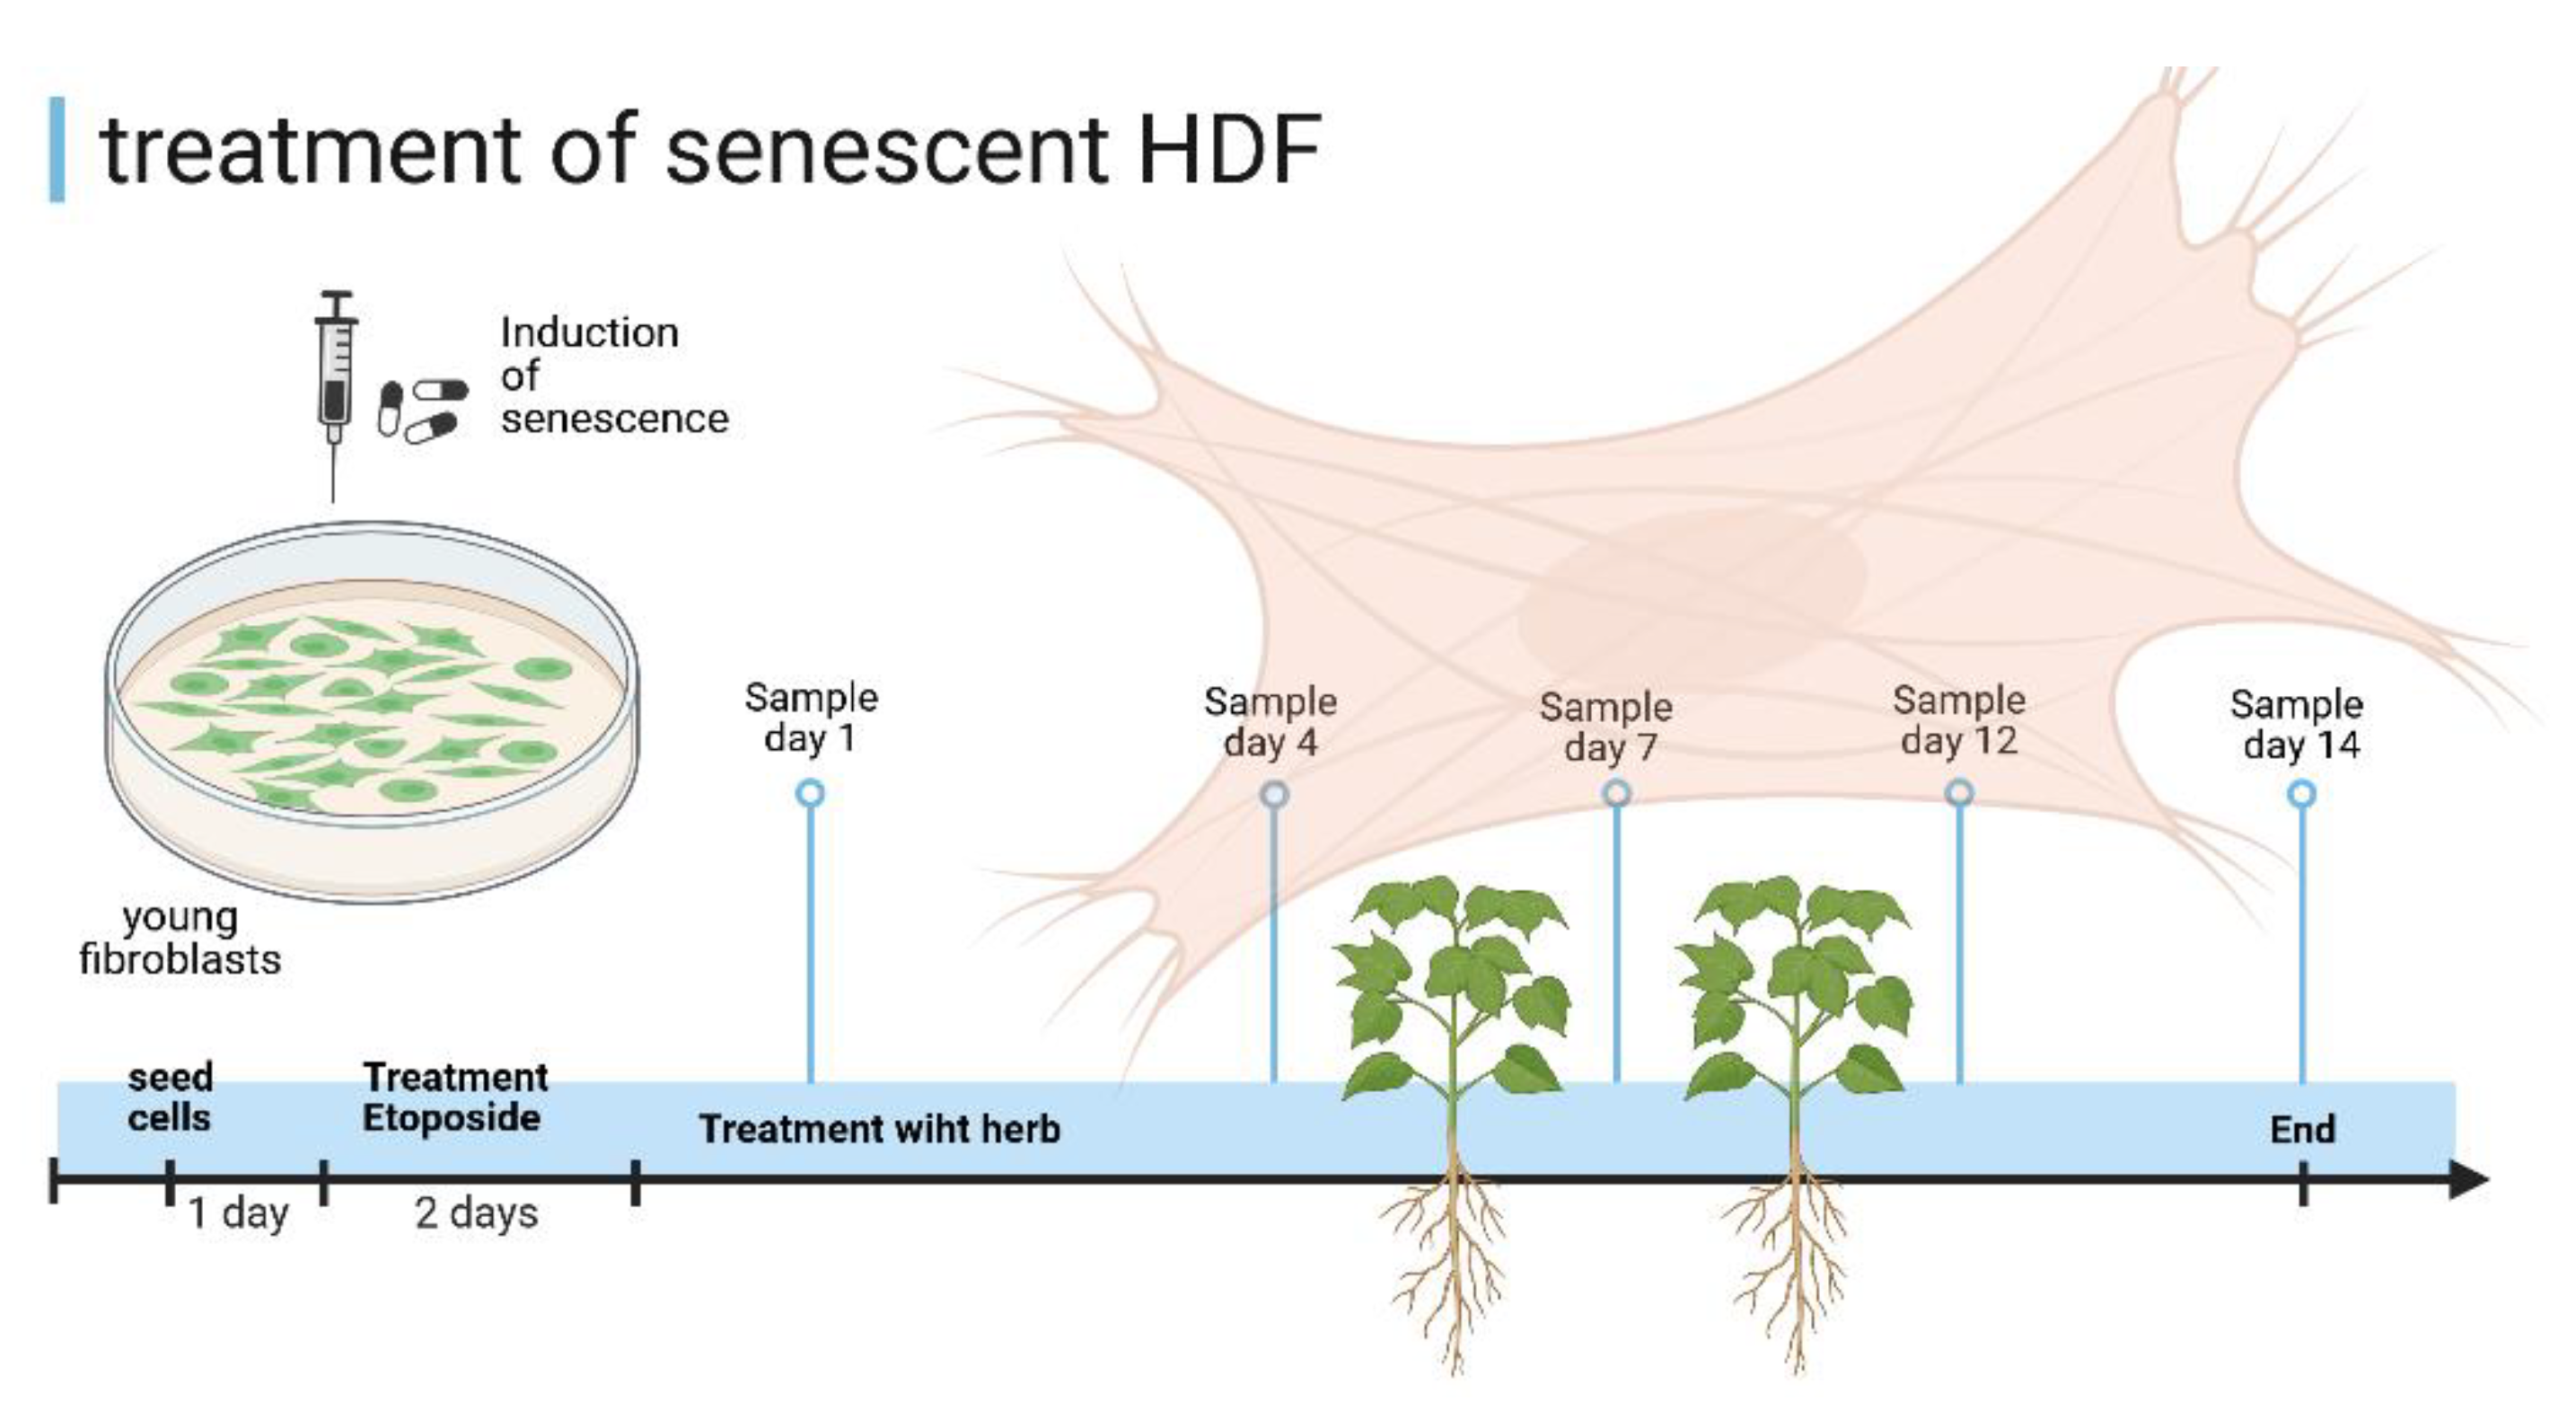
Figure 16.
Growth curve of HDF treated with Etoposide (“eto” blue area) followed by herb and control treatments.
Figure 16.
Growth curve of HDF treated with Etoposide (“eto” blue area) followed by herb and control treatments.
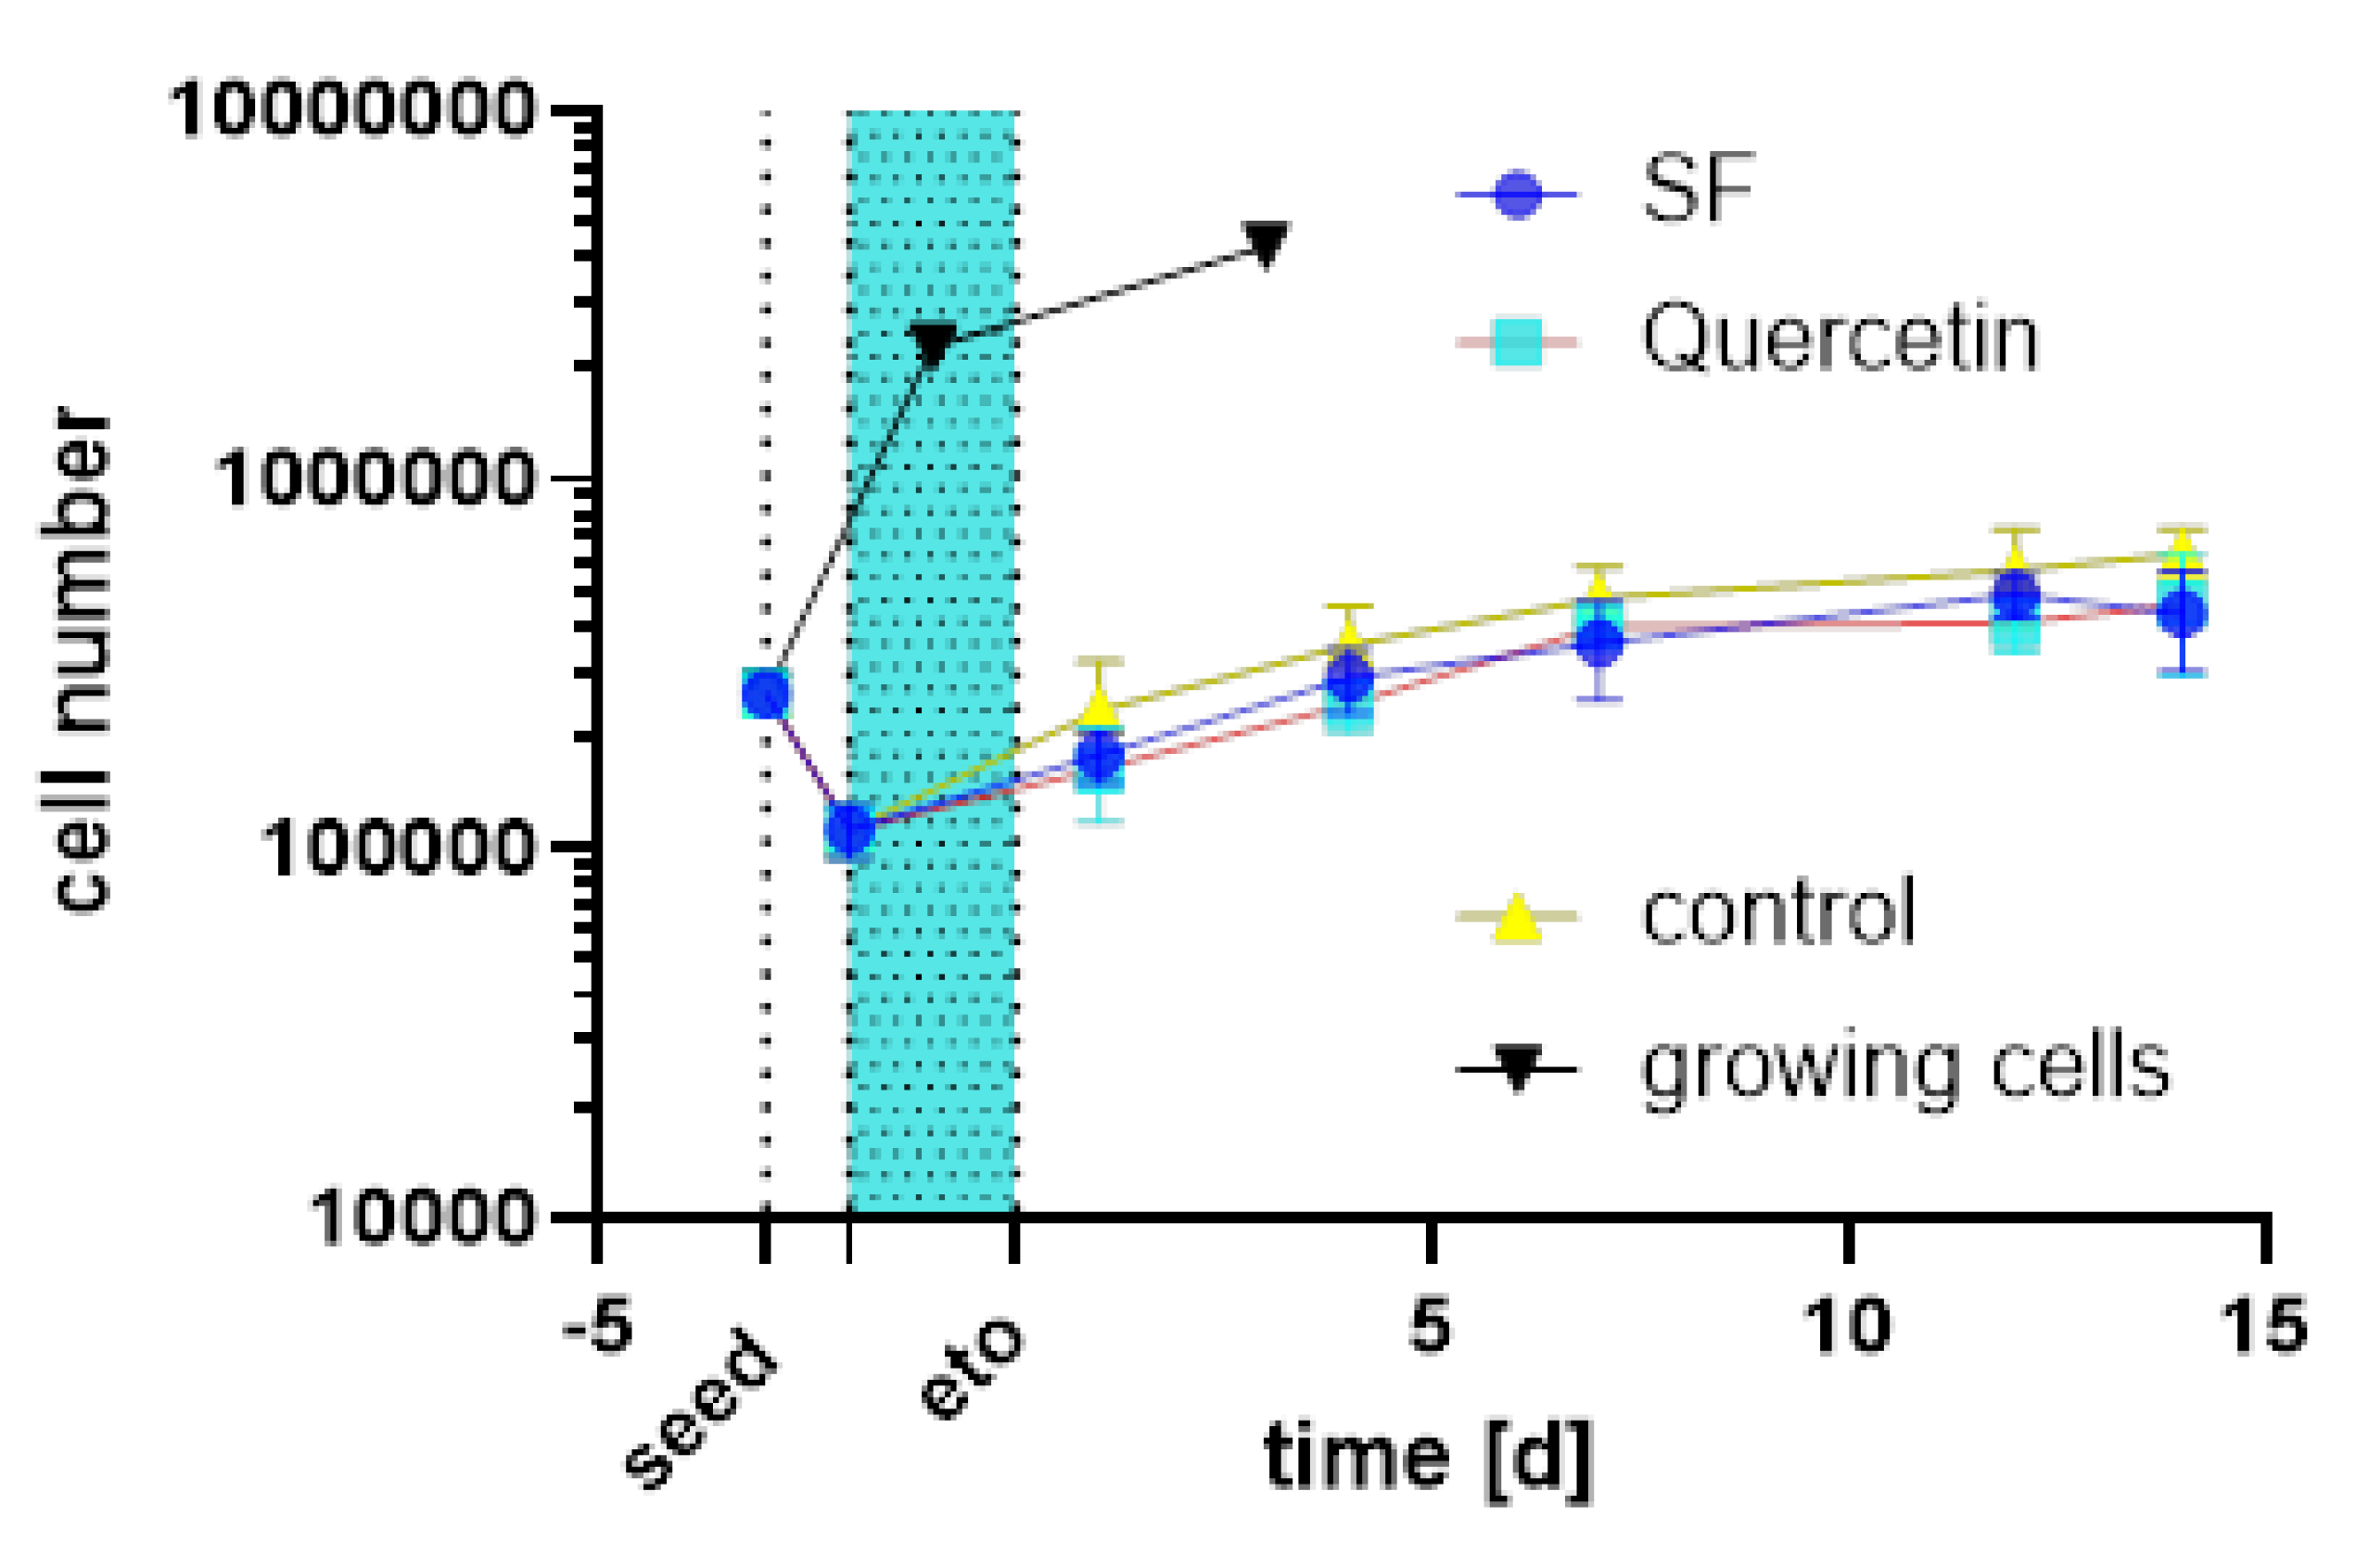
Figure 17.
qPCR analysis of relevant cytokines and SASP factors as well as antioxidant gene SOD2: (a) IL-1a mRNA expression; (b) IL-8 mRNA expression; (c) TGF-β1 mRNA expression; (d) MMP1 mRNA expression.; (e) SOD2 mRNA expression.; (f) IL-6 Protein expression by ELISA.
Figure 17.
qPCR analysis of relevant cytokines and SASP factors as well as antioxidant gene SOD2: (a) IL-1a mRNA expression; (b) IL-8 mRNA expression; (c) TGF-β1 mRNA expression; (d) MMP1 mRNA expression.; (e) SOD2 mRNA expression.; (f) IL-6 Protein expression by ELISA.
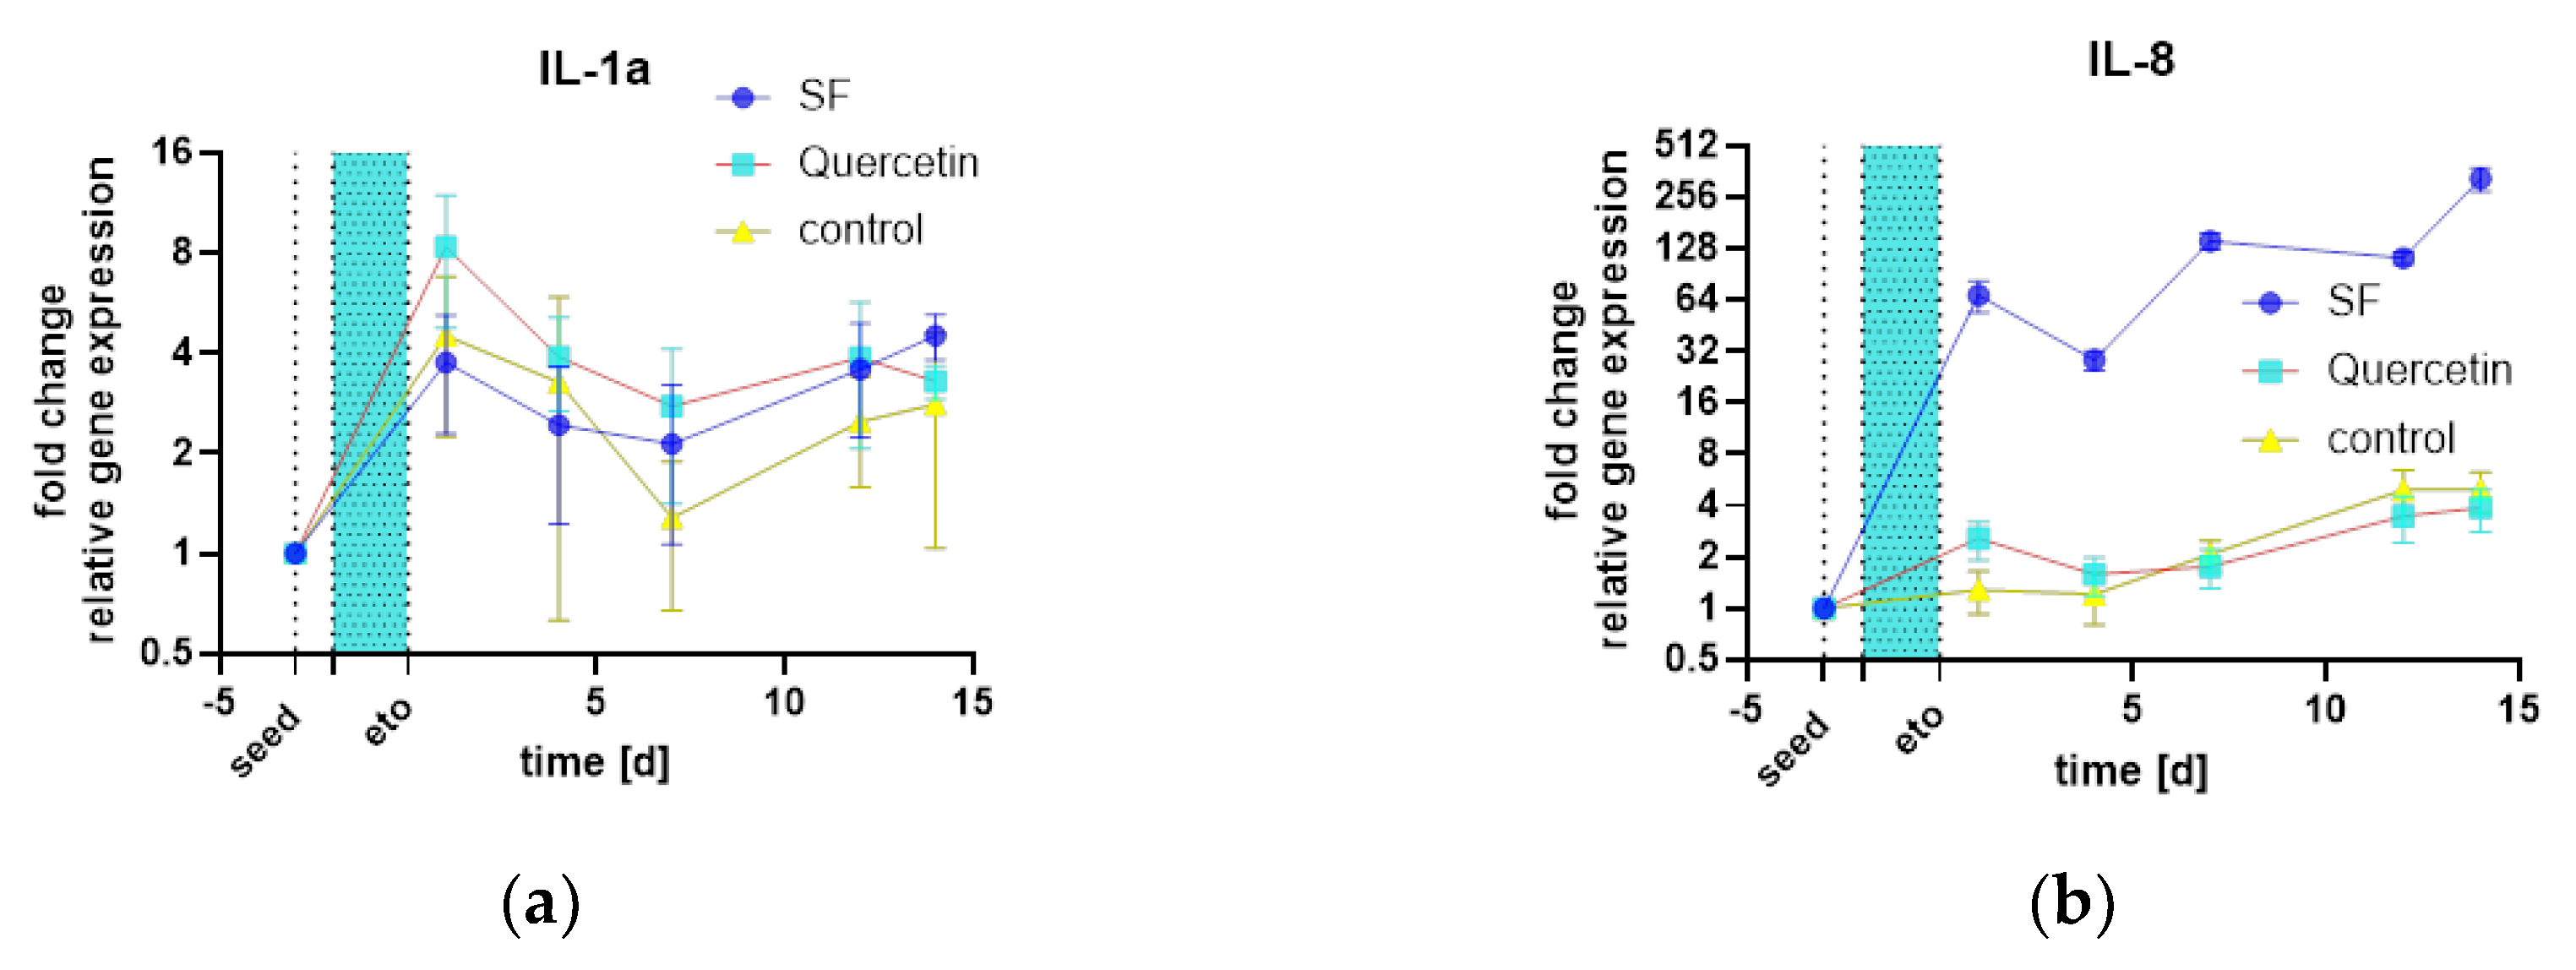
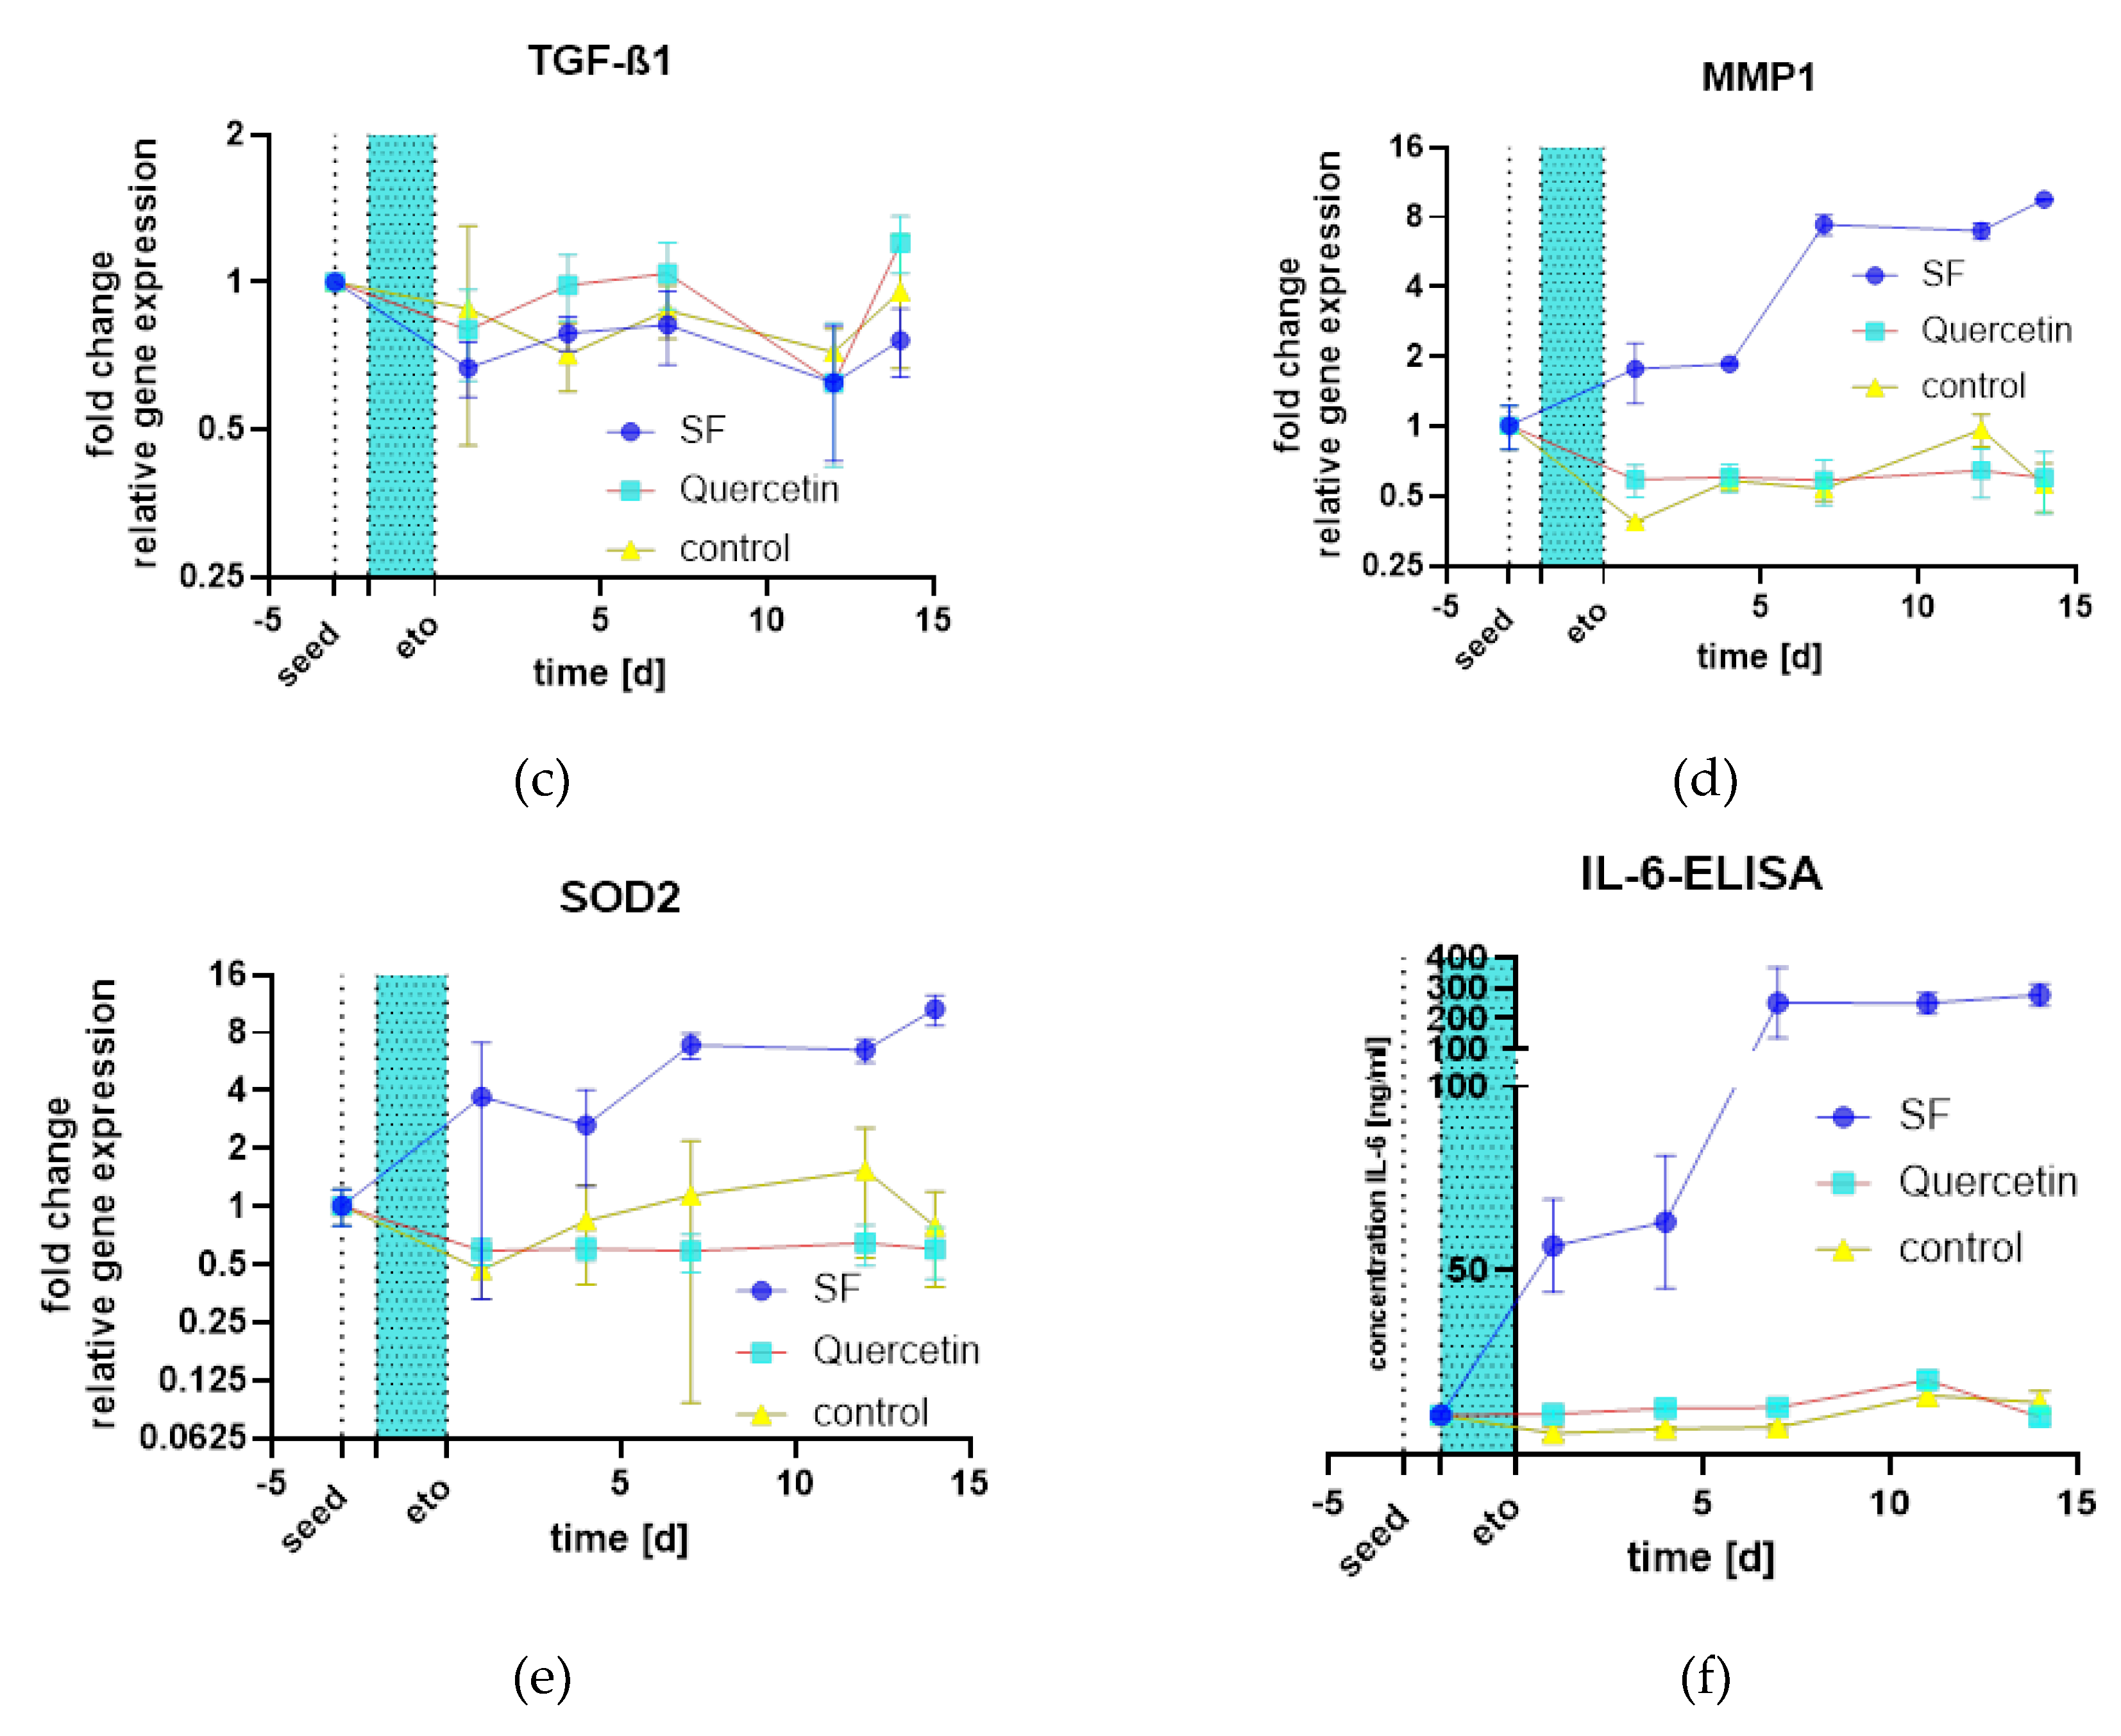
Figure 18.
In addition, the analyzed genes that showed no difference to the water control were subtracted from SF fold-change values (n=3) and differences, were poured in. All results are around the zero difference to the control, except HO1, but here the standard deviations are so high that no effect can be reliably detected.
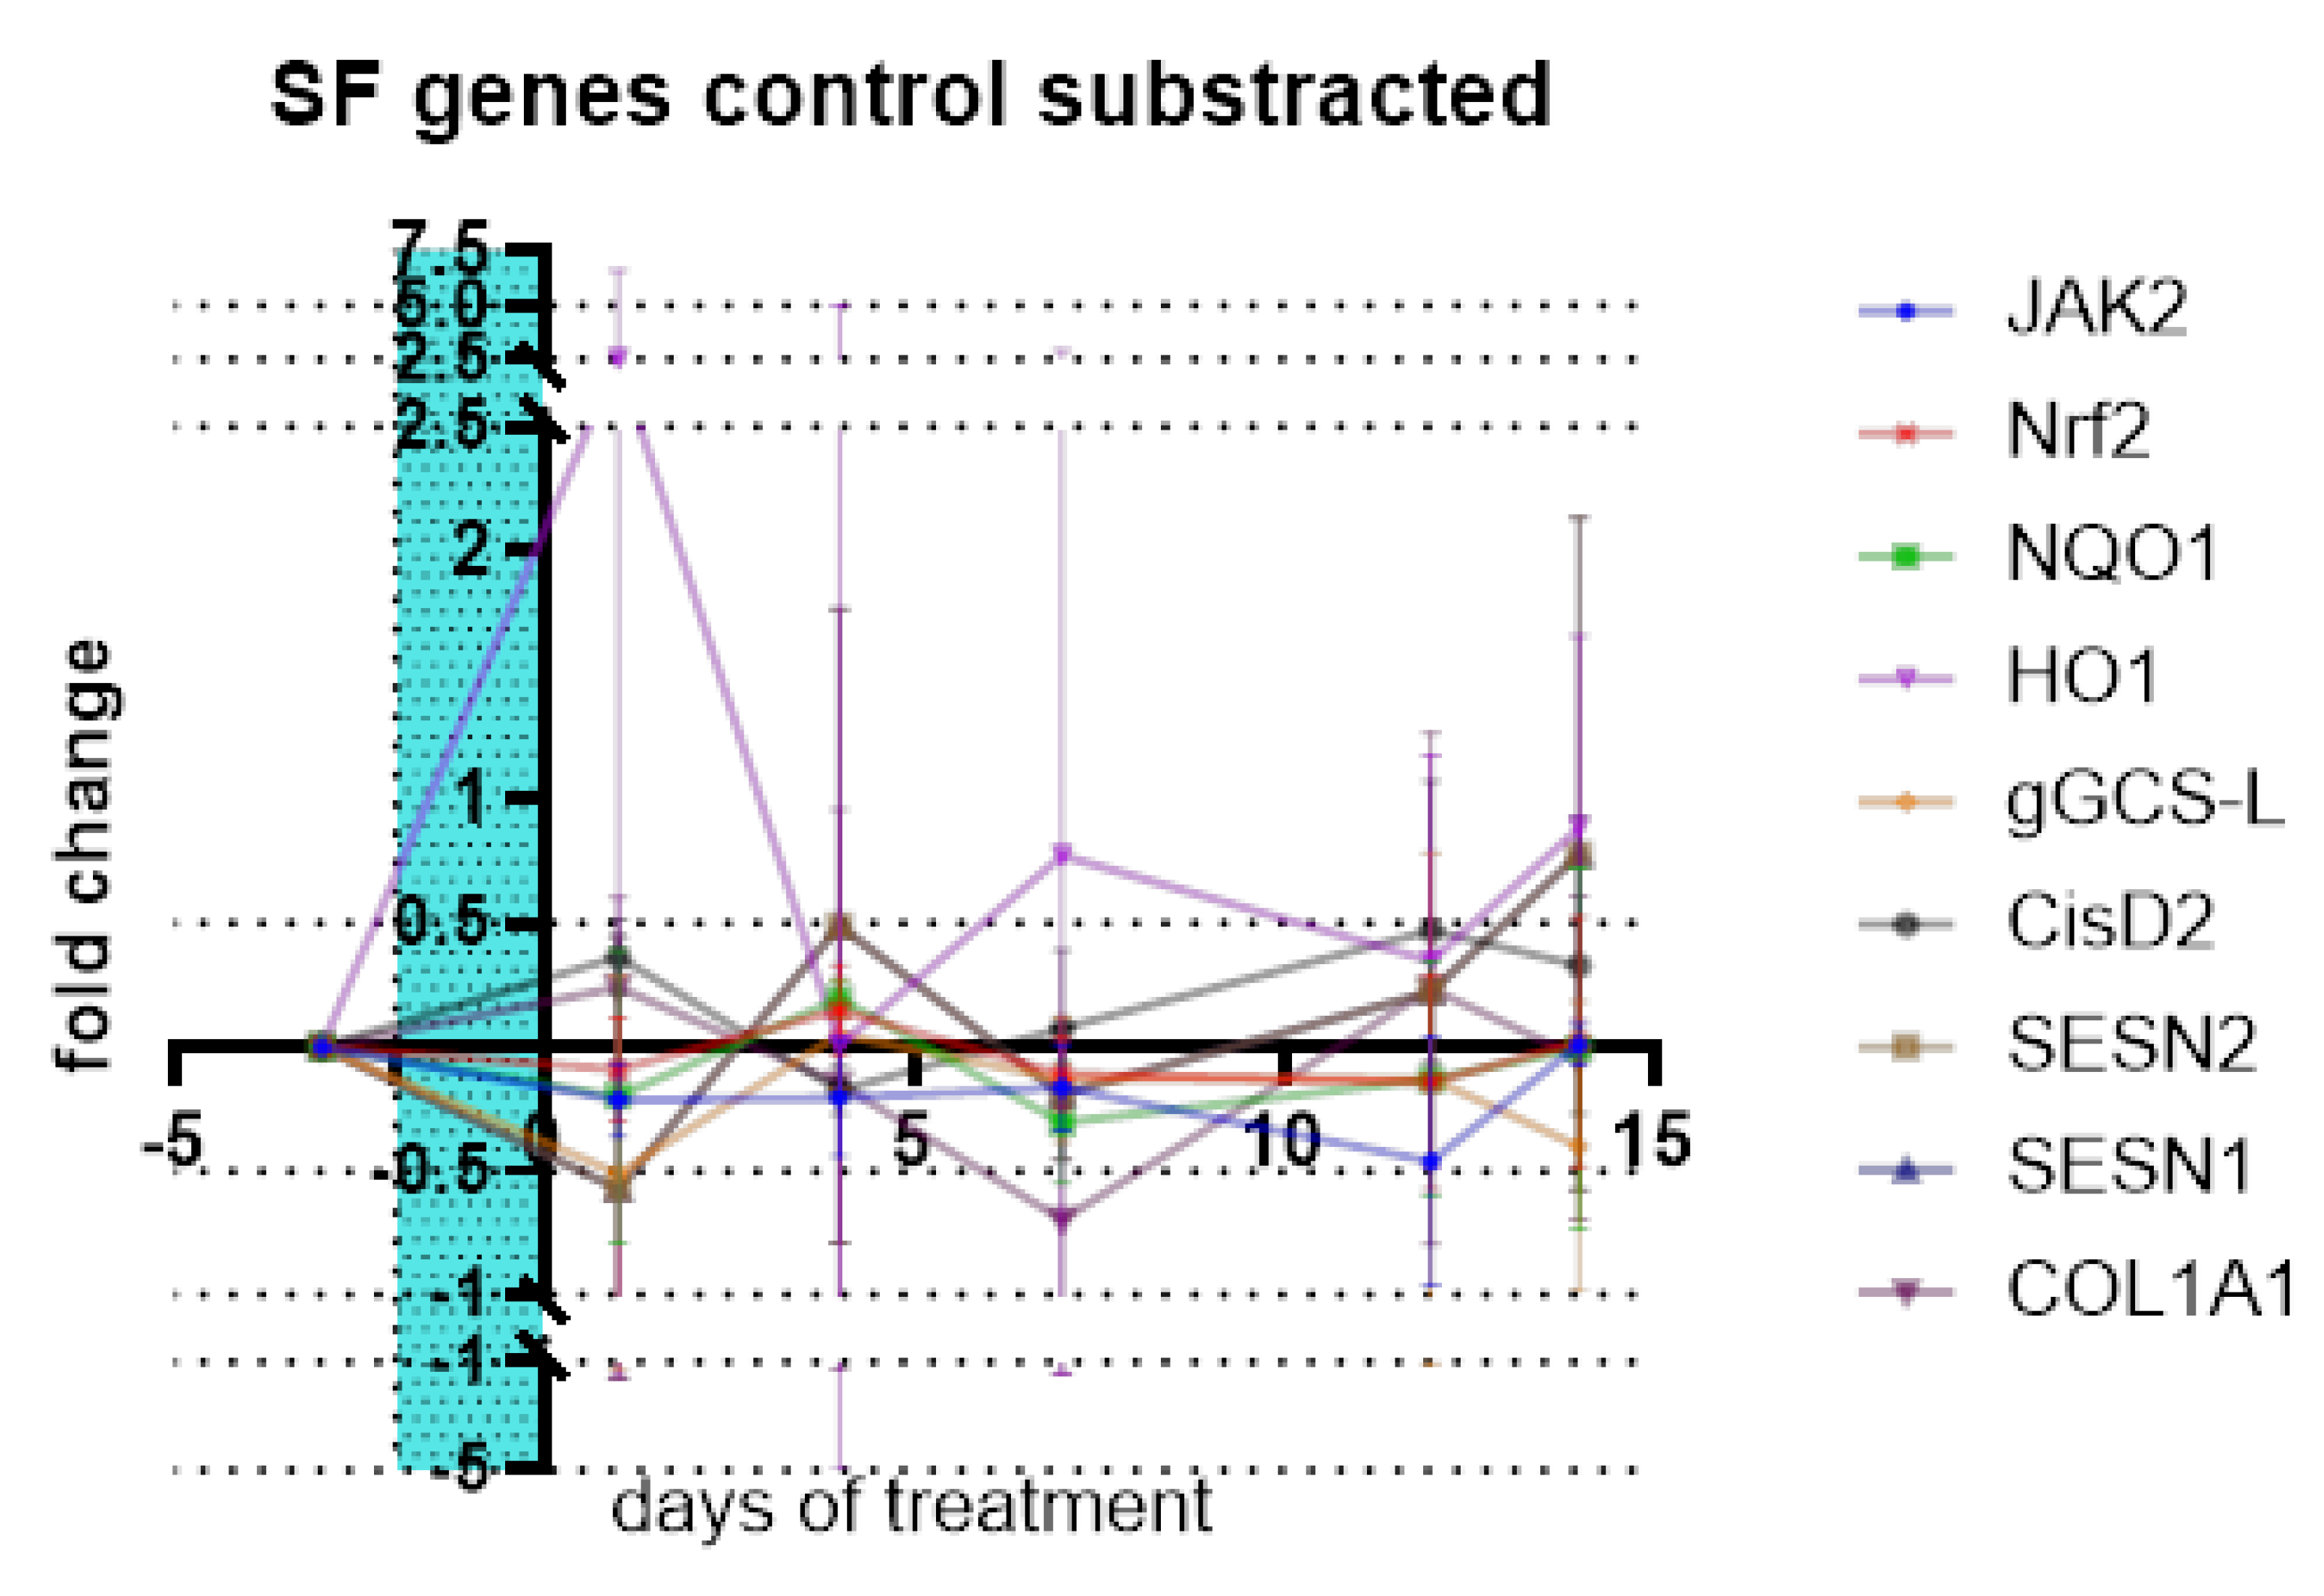
Figure 19.
Experiment timeline of drug treatment experiments, specifically IC50 determination of 5-fluorouracil for CaCo-2 and PANC-1 cell lines Created in BioRender. Kühnel, H. (2025) https://BioRender.com/pu961oc.
Figure 19.
Experiment timeline of drug treatment experiments, specifically IC50 determination of 5-fluorouracil for CaCo-2 and PANC-1 cell lines Created in BioRender. Kühnel, H. (2025) https://BioRender.com/pu961oc.
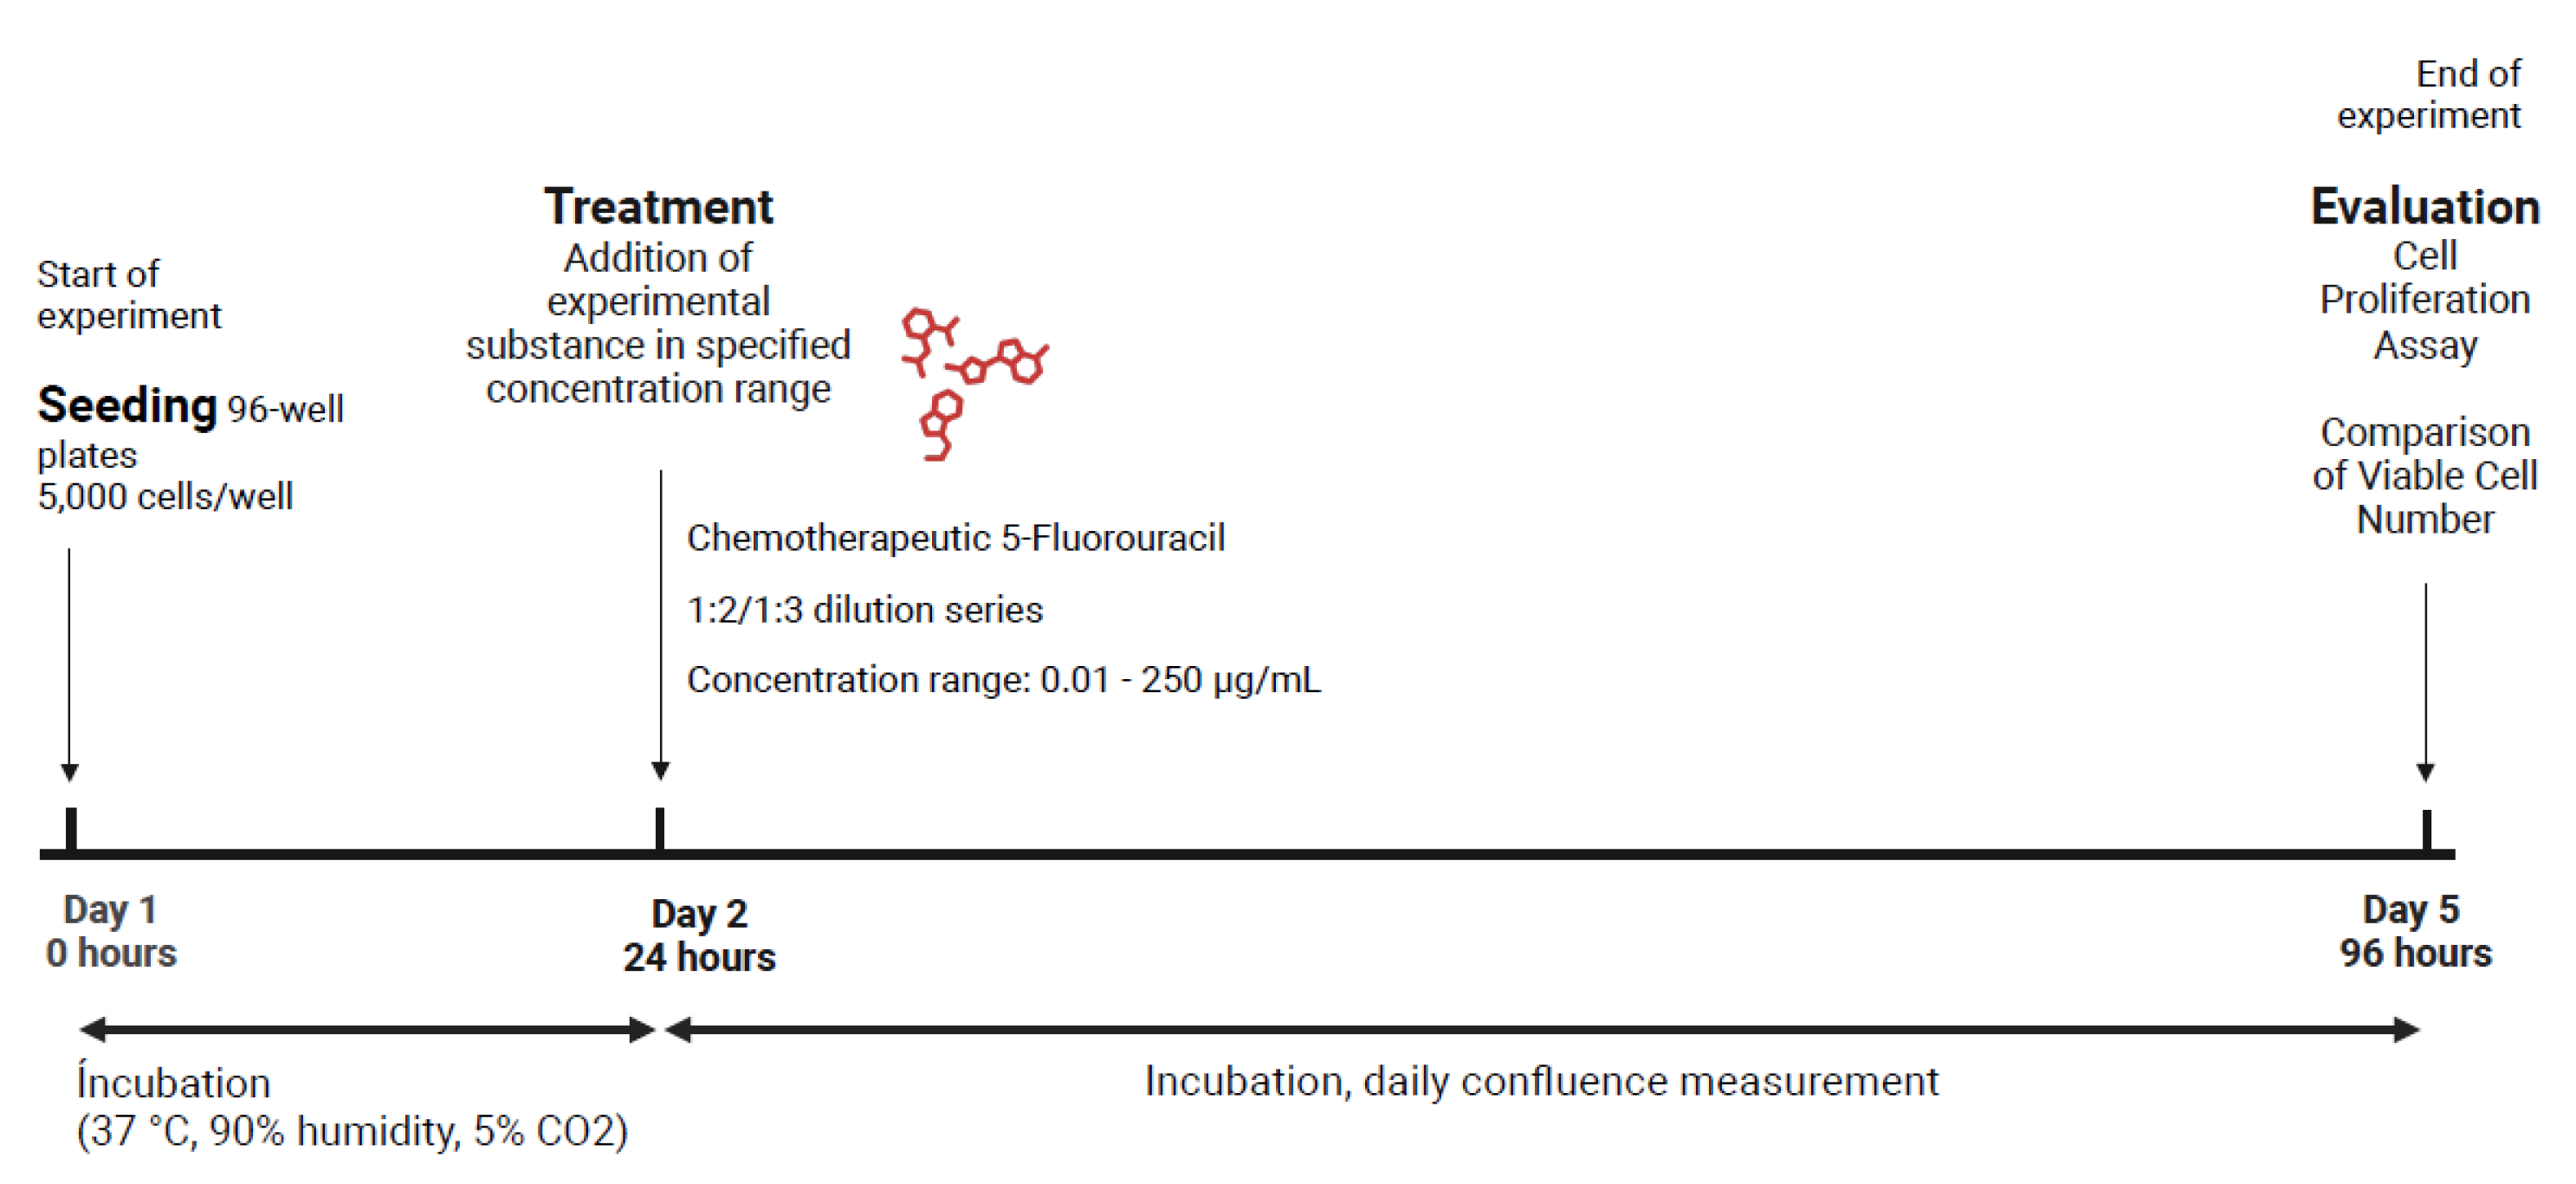
Figure 20.
Experimental timeline, set-up and relation of XTT Assay and IL-6 ELISA performed to evaluate cell response to phytochemical treatments Created in BioRender. Kühnel, H. (2025) https://BioRender.com/7hjysik.
Figure 20.
Experimental timeline, set-up and relation of XTT Assay and IL-6 ELISA performed to evaluate cell response to phytochemical treatments Created in BioRender. Kühnel, H. (2025) https://BioRender.com/7hjysik.
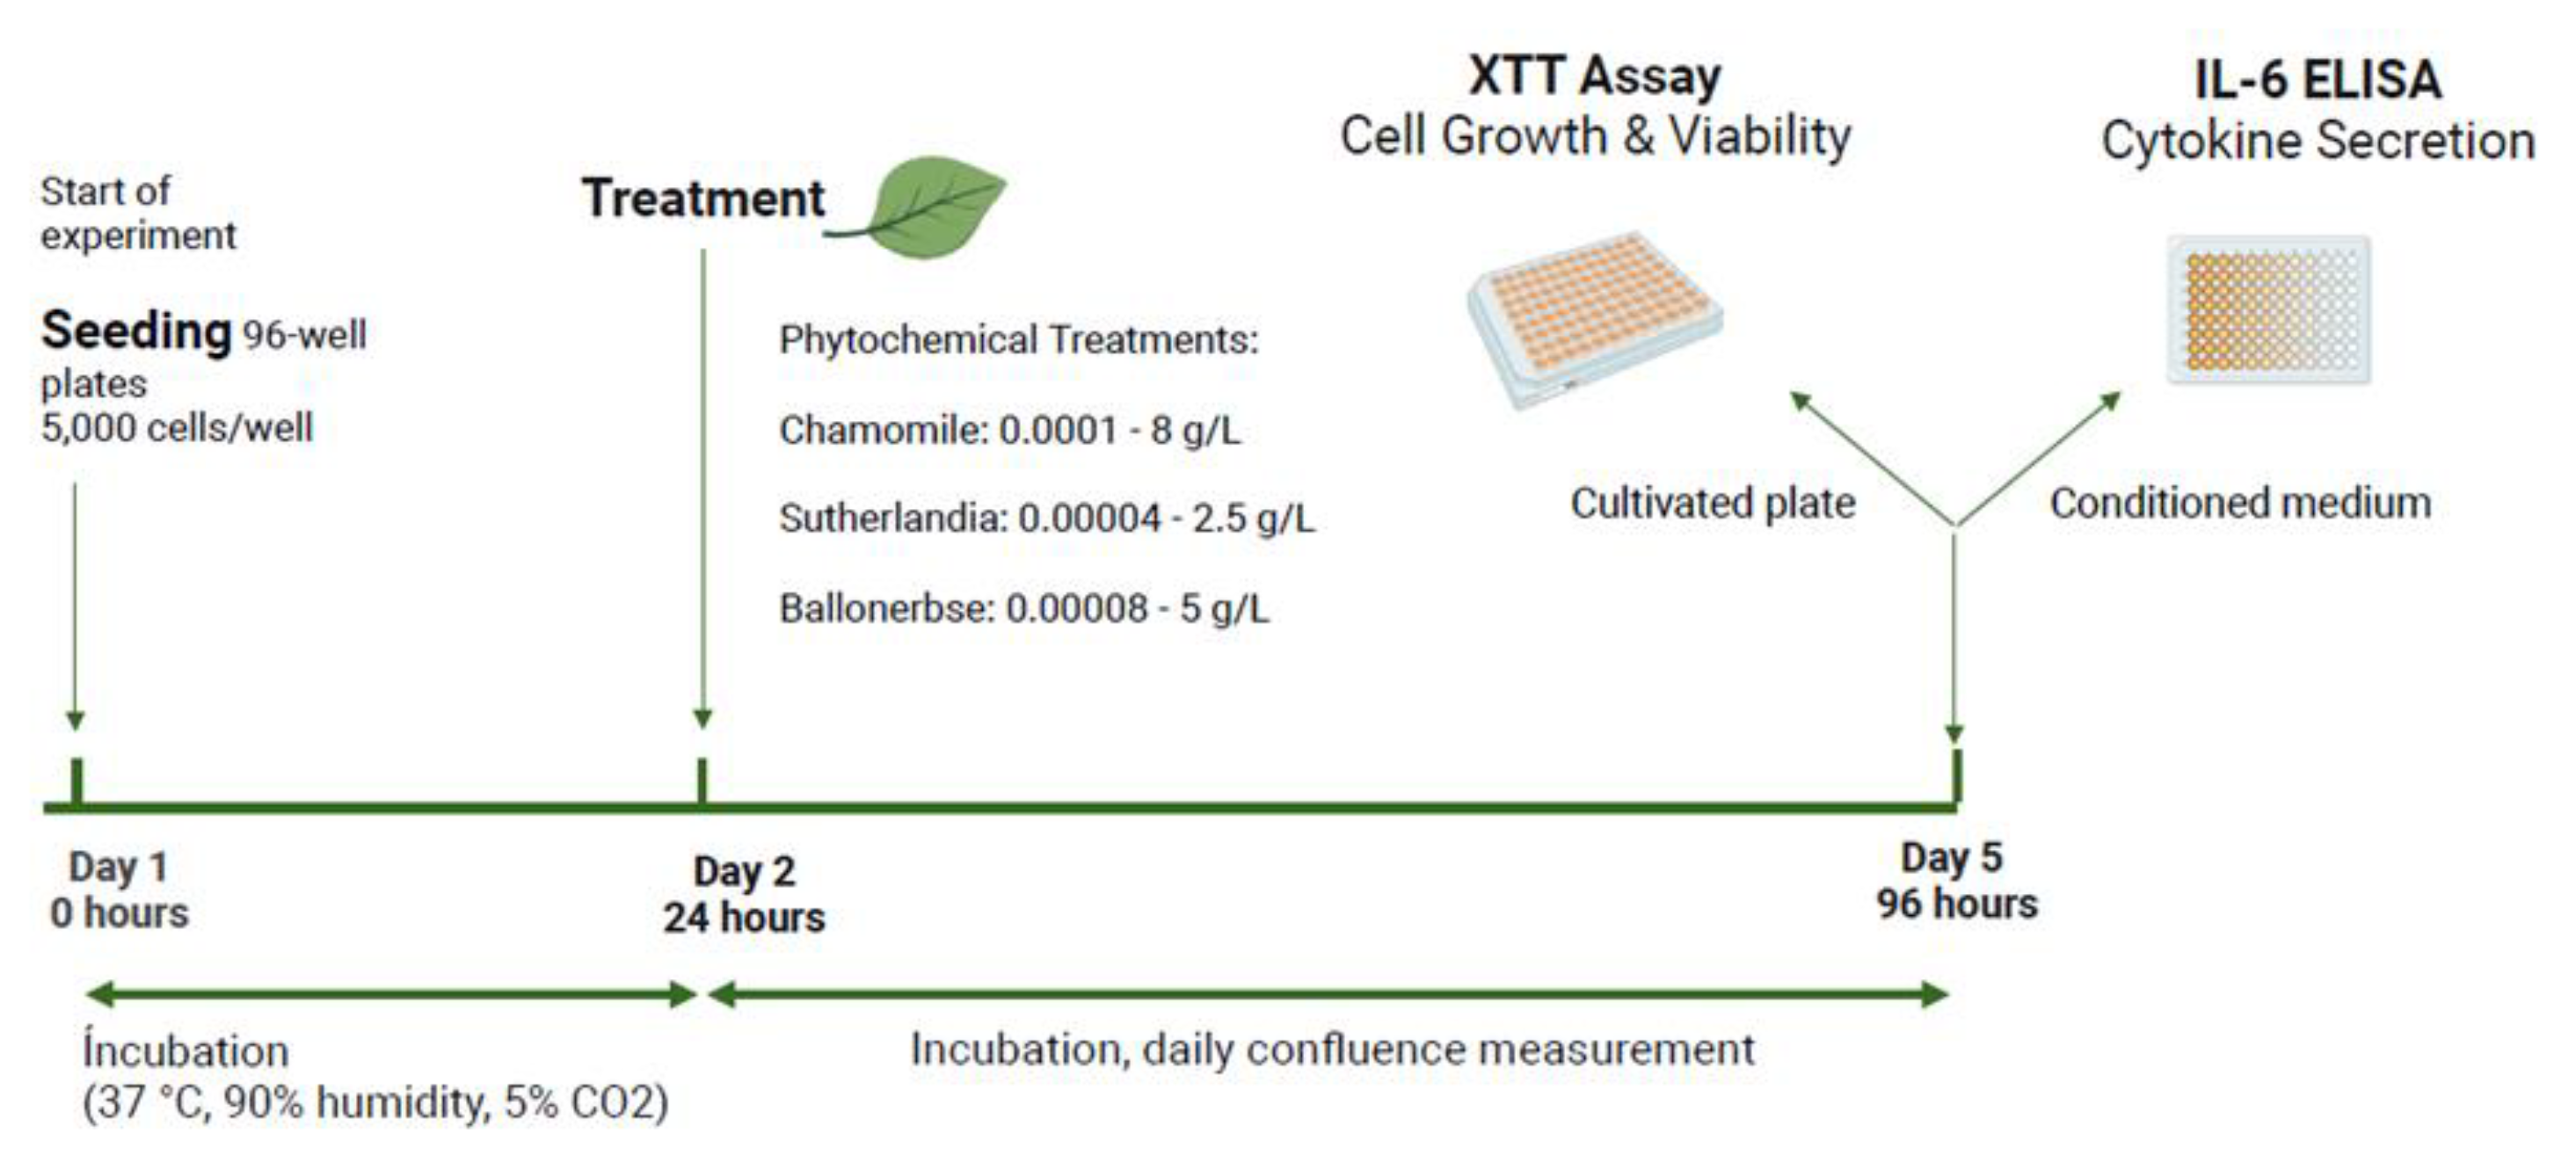
Figure 21.
The timeline and implementation of the screening experiment for senescence induction carried out over a total cultivation period of 26 days Created in BioRender. Kühnel, H. (2025) https://BioRender.com/ifyoql2.
Figure 21.
The timeline and implementation of the screening experiment for senescence induction carried out over a total cultivation period of 26 days Created in BioRender. Kühnel, H. (2025) https://BioRender.com/ifyoql2.
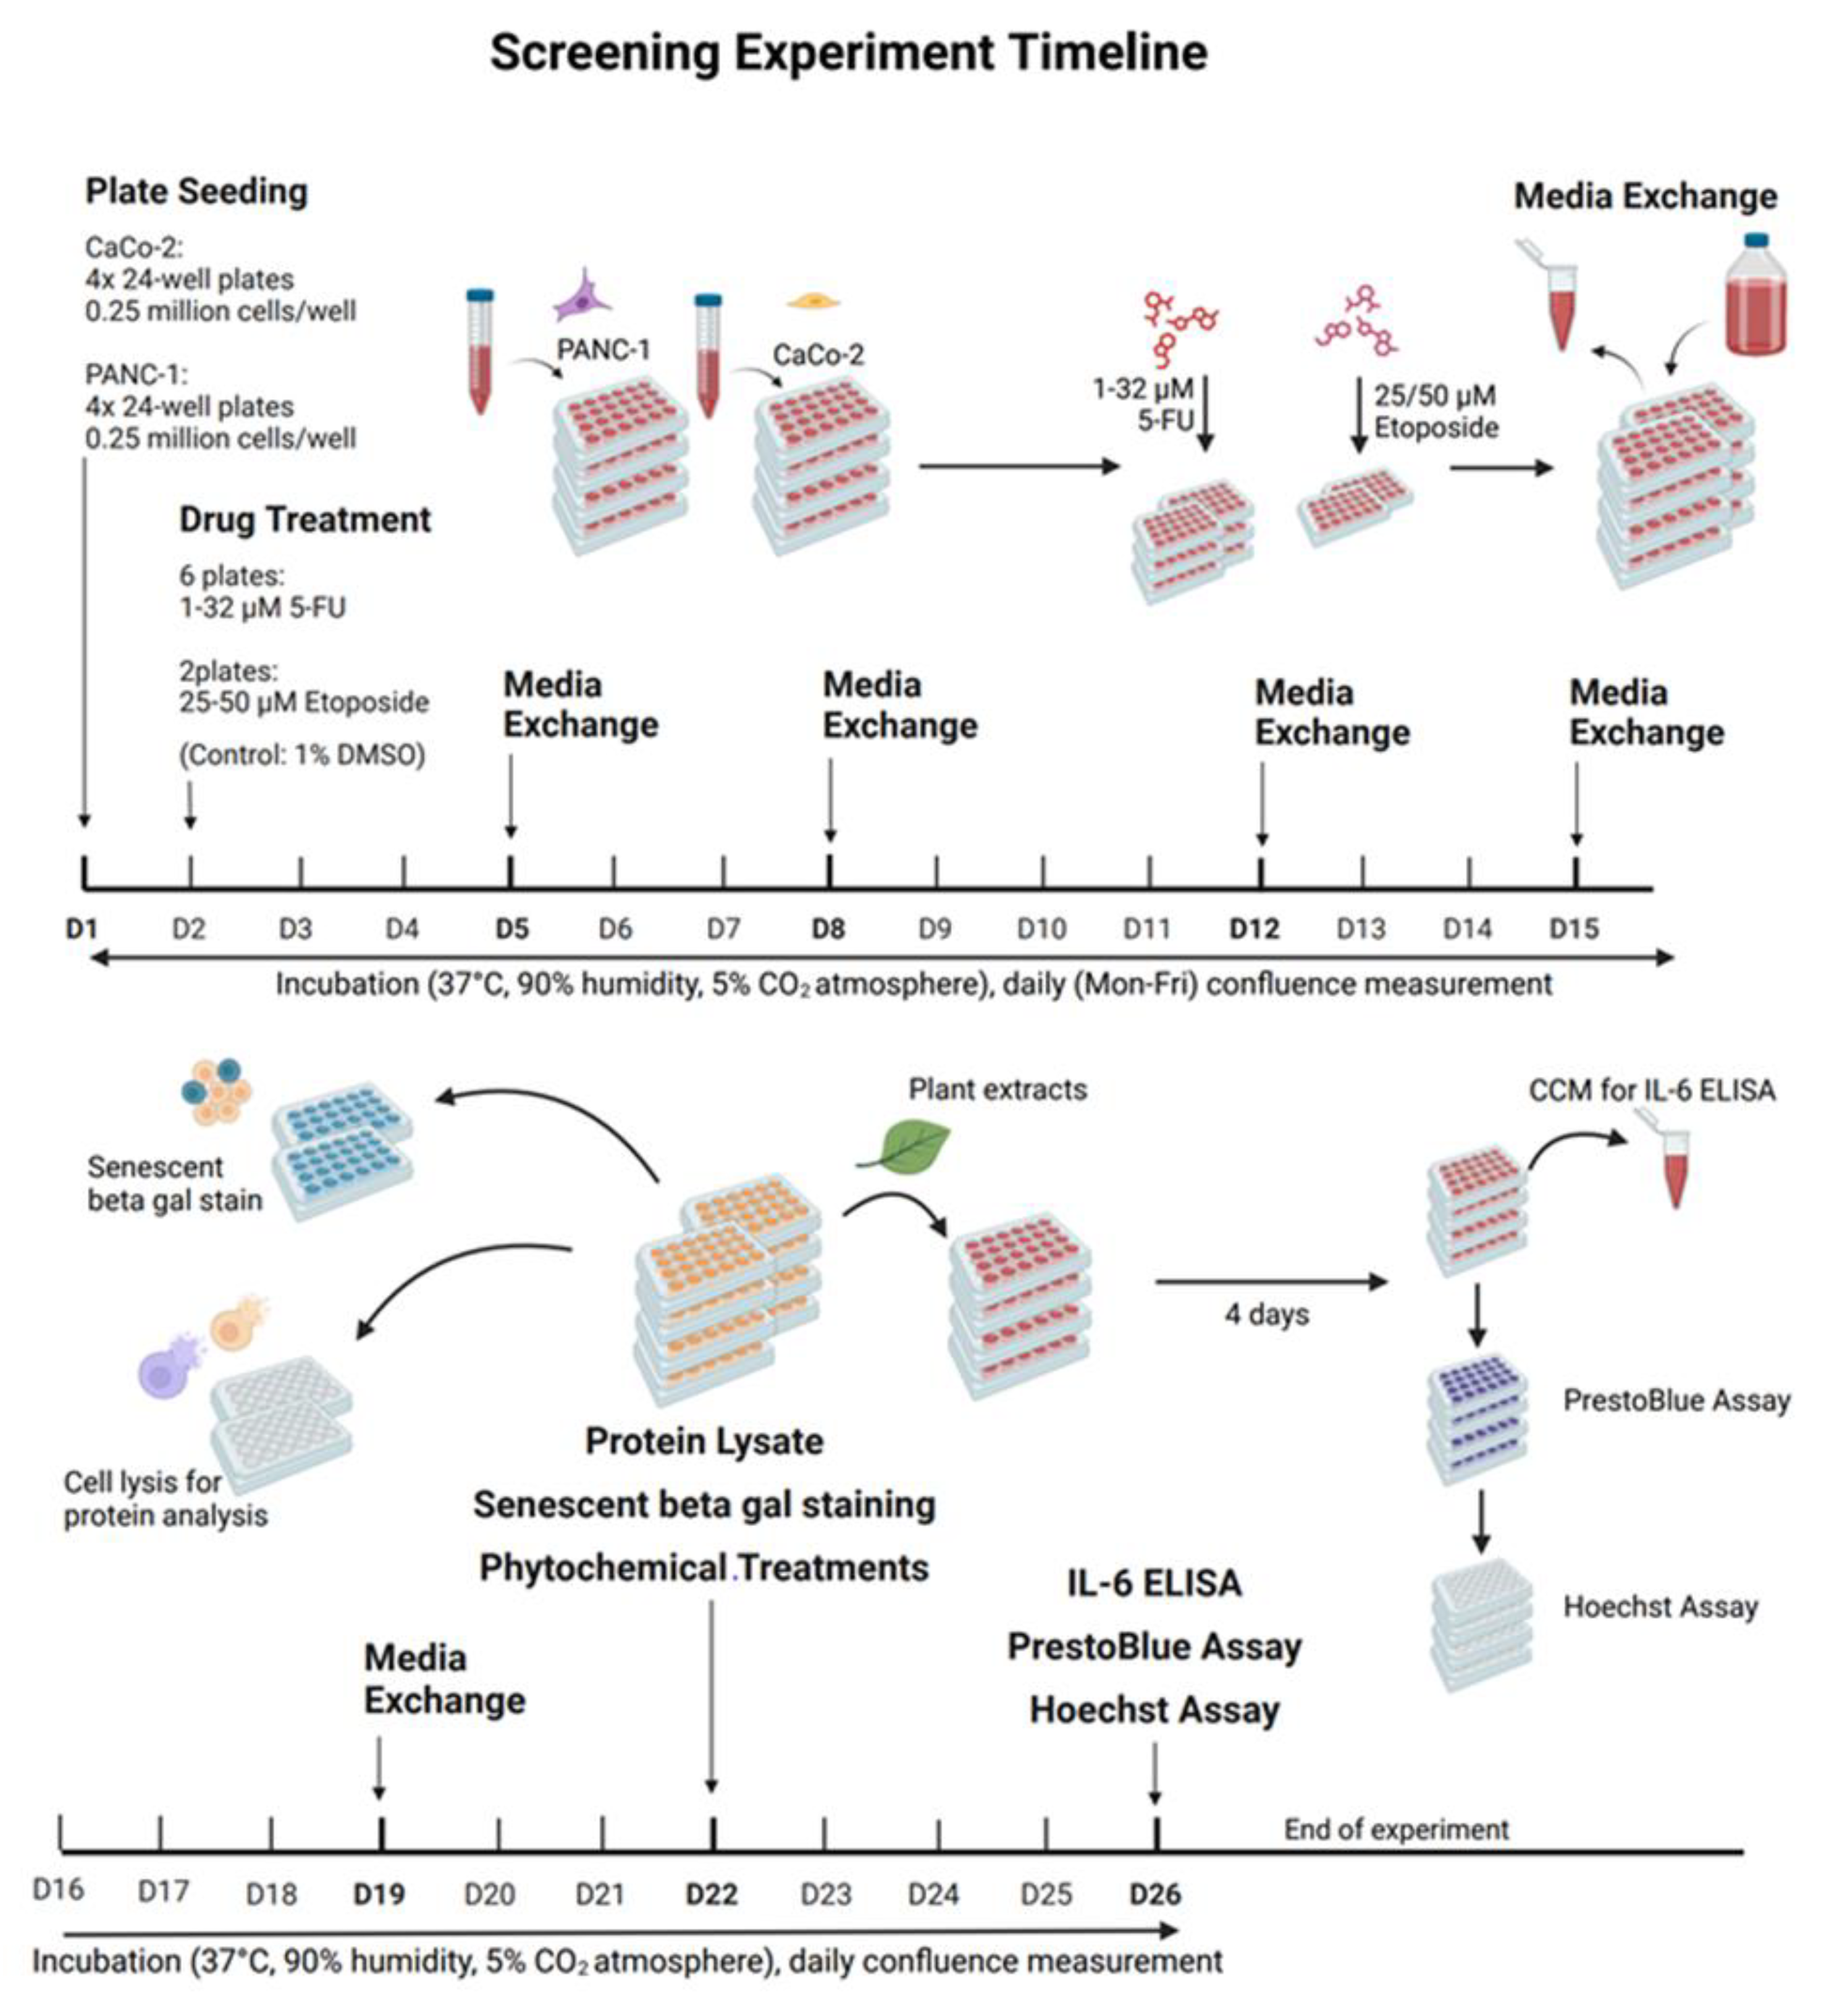
Figure 22.
Timeline and sequence of senescence induction, phytochemical treatments and evaluation method implementation for T-flask cultures. Created in BioRender. Kühnel, H. (2025) https://BioRender.com/ldq5myu.
Figure 22.
Timeline and sequence of senescence induction, phytochemical treatments and evaluation method implementation for T-flask cultures. Created in BioRender. Kühnel, H. (2025) https://BioRender.com/ldq5myu.
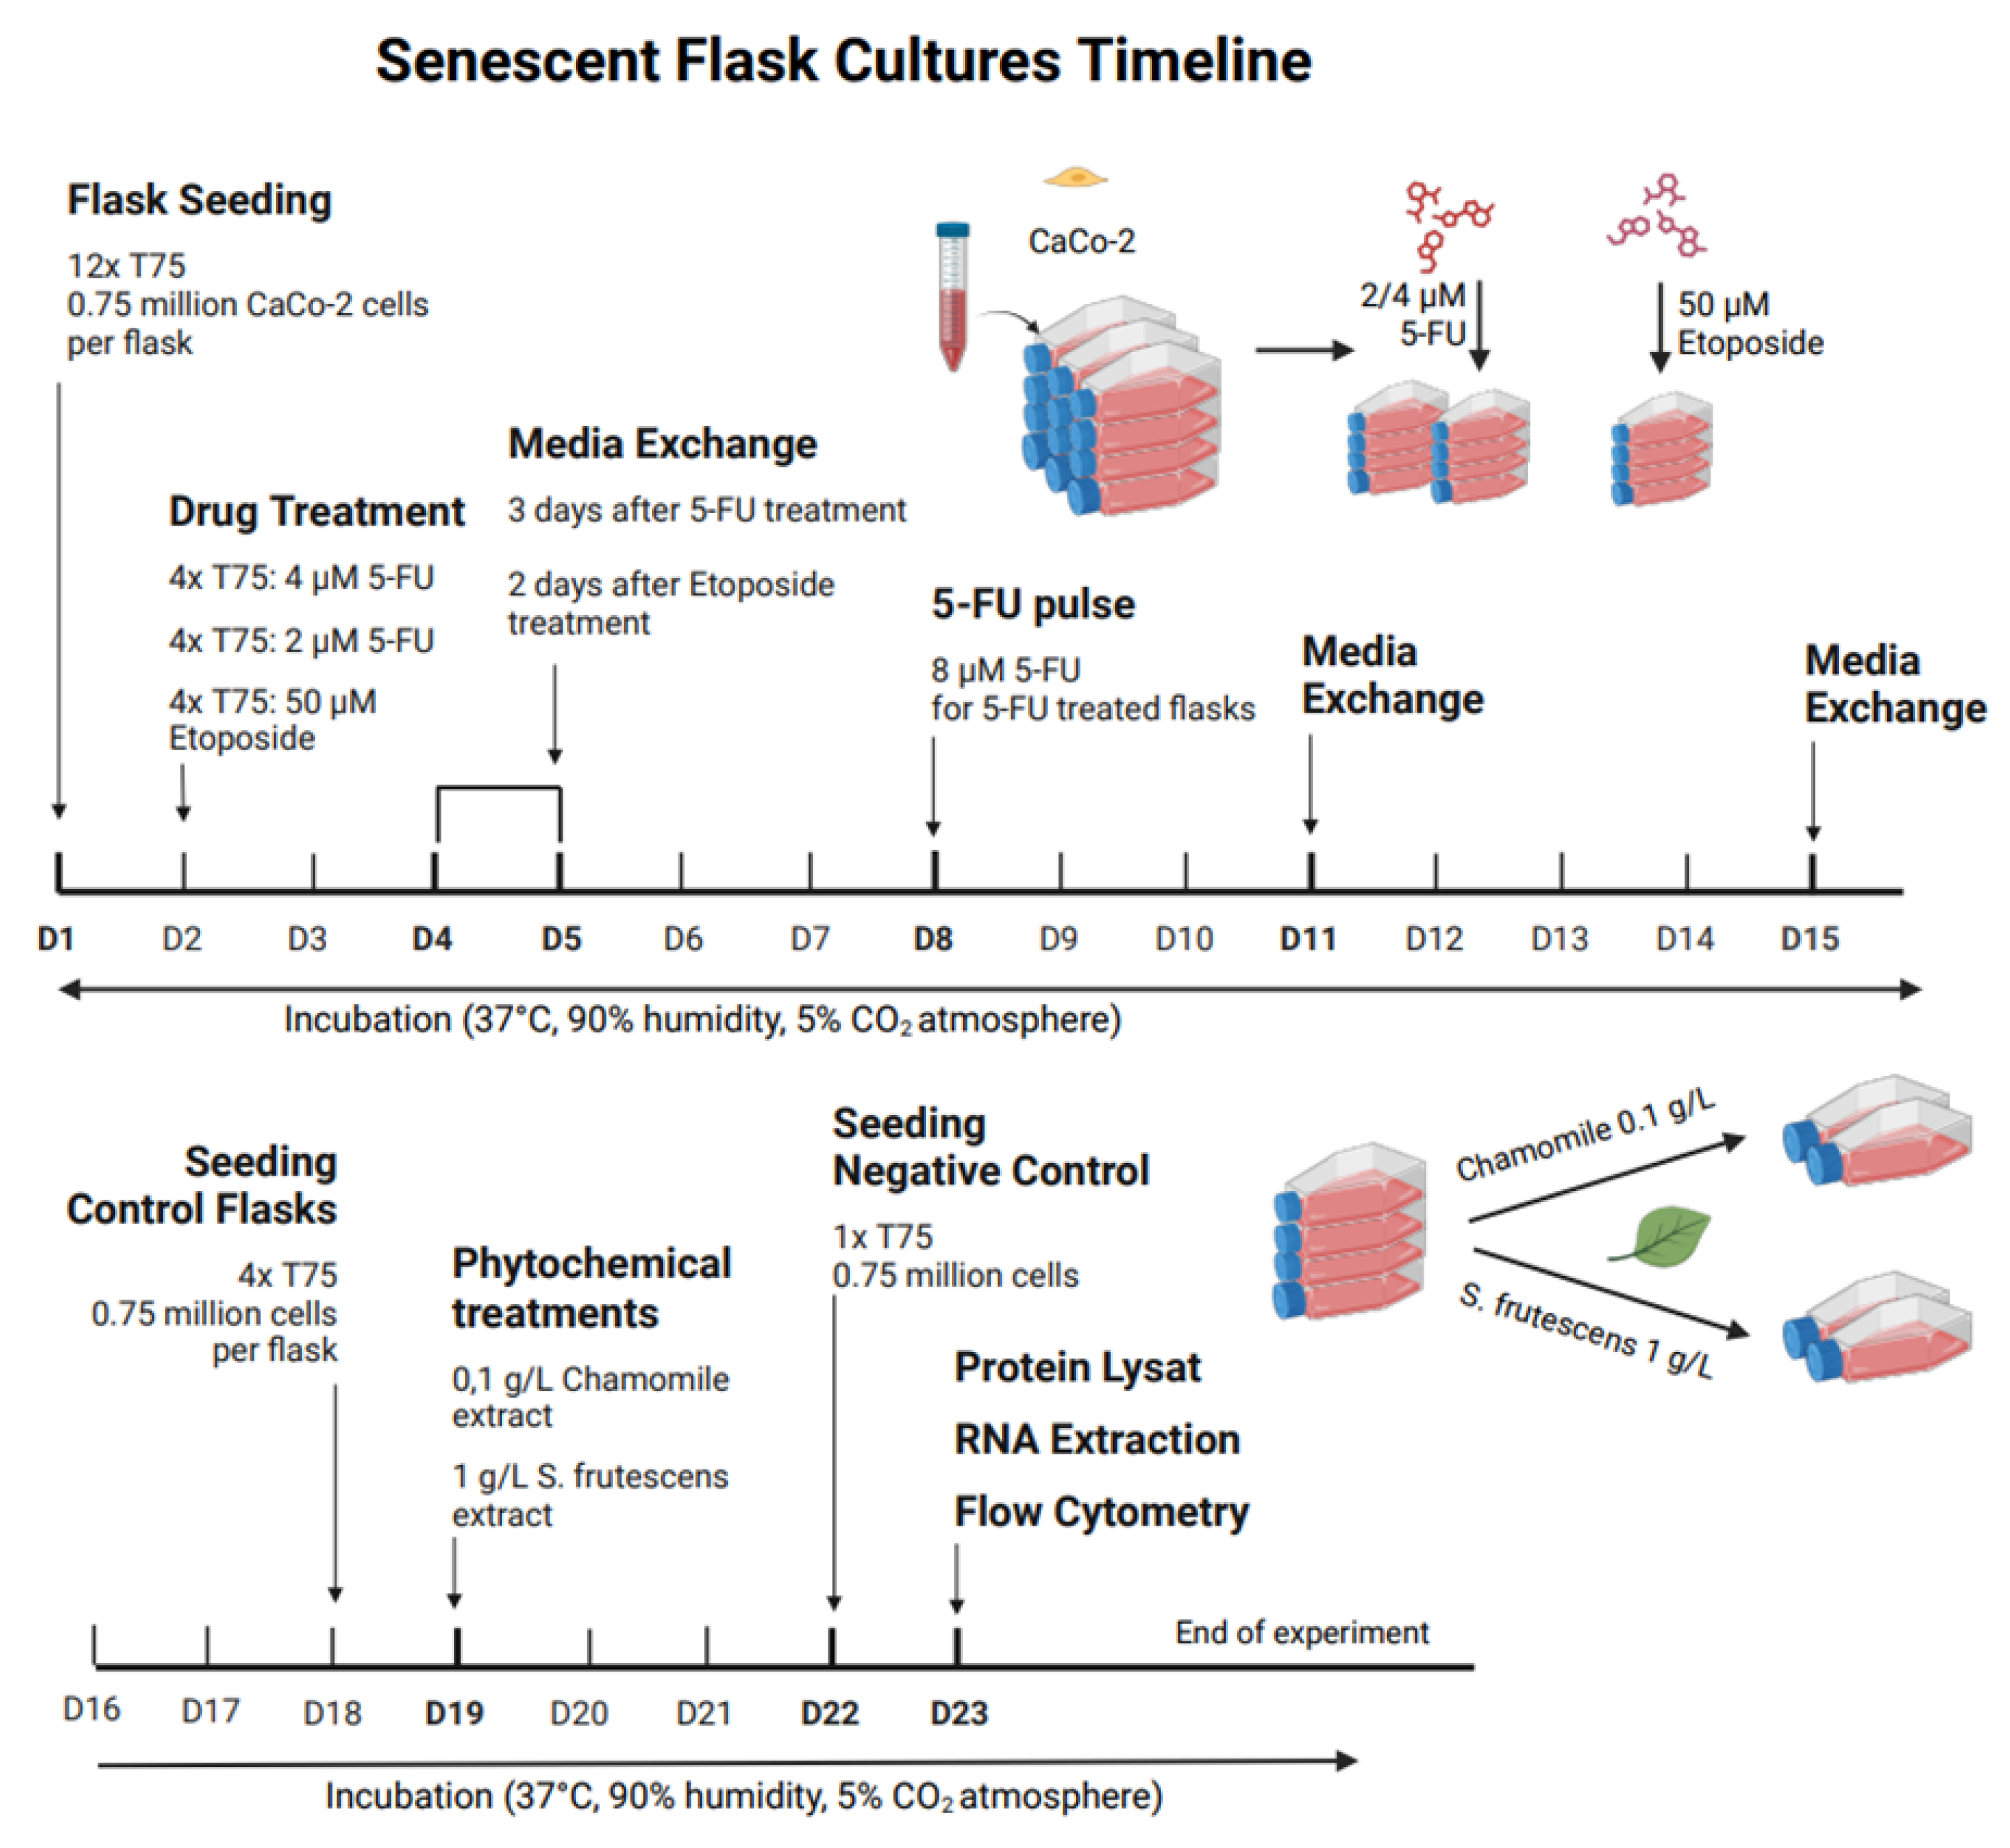
Disclaimer/Publisher’s Note: The statements, opinions and data contained in all publications are solely those of the individual author(s) and contributor(s) and not of MDPI and/or the editor(s). MDPI and/or the editor(s) disclaim responsibility for any injury to people or property resulting from any ideas, methods, instructions or products referred to in the content. |
© 2025 by the authors. Licensee MDPI, Basel, Switzerland. This article is an open access article distributed under the terms and conditions of the Creative Commons Attribution (CC BY) license (http://creativecommons.org/licenses/by/4.0/).
Copyright: This open access article is published under a Creative Commons CC BY 4.0 license, which permit the free download, distribution, and reuse, provided that the author and preprint are cited in any reuse.


