Preprint
Article

This version is not peer-reviewed.

Ganoderma lucidum Extract Modulates Gene Expression Profiles Associated with Antioxidant Defense, Cytoprotection, and Senescence in Human Dermal Fibroblasts: A Transcriptomic Analysis

Submitted:

02 December 2024

Posted:

03 December 2024

You are already at the latest version

Abstract

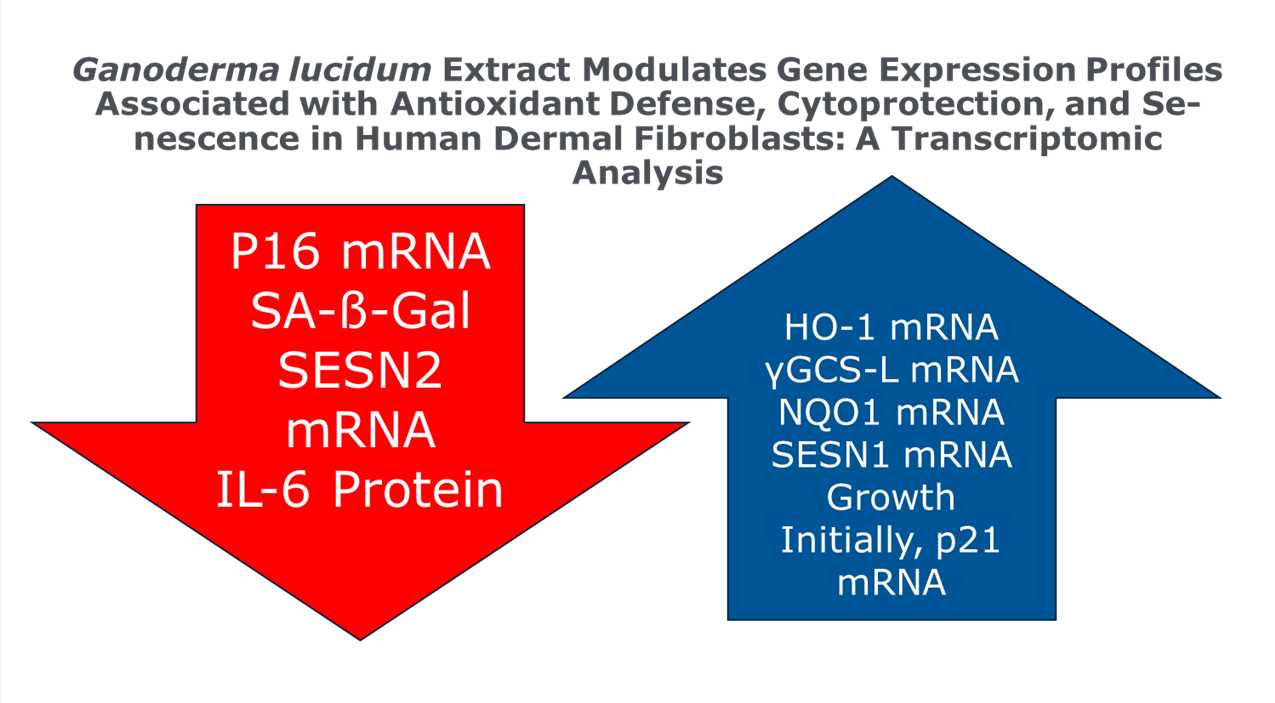
Cellular senescence plays a crucial role in skin aging, with senescent dermal fibroblasts contributing to reduced skin elasticity and increased inflammation. This study investigated the potential of Ganoderma lucidum (Reishi) extract to modulate the senescent phenotype of human dermal fibroblasts. Etoposide-induced senescent fibroblasts were treated with Reishi extracts from two commercial sources for 14 days. Gene expression analysis was performed using qPCR to assess markers of senescence, antioxidant defense, and extracellular matrix remodeling. Results showed that Reishi extracts significantly upregulated antioxidant and cytoprotective genes, including HO-1, γGCS-L, and NQO1, compared to untreated controls. Importantly, Reishi treatment suppressed the expression of p16, a key marker of cellular senescence, while transiently upregulating p21. The extracts also demonstrated potential senolytic properties, reducing the percentage of senescent cells as measured by SA-β-Gal staining. However, Reishi treatment did not mitigate the upregulation of matrix metalloproteinase-1 (MMP1) induced by senescence. These findings suggest that Ganoderma lucidum extract may help alleviate some aspects of cellular senescence in dermal fibroblasts, primarily through enhanced antioxidant defense and cytoprotection, potentially offering a novel approach to combat skin aging.

Keywords: 
;  ;  ;  ;  ;  

1. Introduction

Cellular senescence is a complex biological process characterized by a stable cell cycle arrest accompanied by distinct phenotypic alterations [1,2]. This phenomenon plays crucial roles in various physiological and pathological processes, including embryonic development, tissue repair, tumor suppression, and aging. Senescent cells undergo significant changes in gene expression, metabolism, and secretory profile, with the latter known as the senescence-associated secretory phenotype (SASP)[3].
Dermal fibroblasts are mesenchymal cells that reside in the dermis, the layer of skin beneath the epidermis. These cells play critical roles in maintaining skin homeostasis, synthesizing and remodeling the extracellular matrix (ECM), and participating in wound healing processes. Dermal fibroblasts produce various ECM components, including collagens, elastin, and proteoglycans, which are essential for skin structure and function [4]. In the context of cellular senescence, dermal fibroblasts are of particular interest due to their involvement in skin aging and age-related skin disorders. As these cells undergo senescence, they exhibit characteristic changes such as enlarged and flattened morphology, increased expression of senescence-associated β-galactosidase (SA-β-gal), and activation of cyclin-dependent kinase inhibitors p16 (INK4a) and p21 (CIP1) [5,6]. Senescent dermal fibroblasts contribute to skin aging through various mechanisms. They show reduced proliferative capacity and altered ECM production, leading to decreased skin elasticity and wrinkle formation. Additionally, the SASP of senescent fibroblasts includes pro-inflammatory cytokines, matrix metalloproteinases, and growth factors that can further modify the skin microenvironment and influence neighboring cells [4,7].
Etoposide-induced senescence in fibroblast cells serves as a well-established model for studying cellular senescence. This process involves the use of etoposide, a topoisomerase II inhibitor, which induces DNA damage, particularly double-strand breaks. When administered at appropriate concentrations to fibroblasts, etoposide triggers a senescence response rather than apoptosis [8,9] . The characteristics of etoposide-induced senescence in fibroblasts include a stable cell cycle arrest, typically in the G1 phase, accompanied by distinct morphological changes, as well as other hallmarks of senescence [10,11]. Etoposide-induced senescent fibroblasts develop a senescence-associated secretory phenotype (SASP), characterized by the secretion of various factors including pro-inflammatory cytokines, growth factors, and matrix-degrading enzymes. However, the specific SASP profile can vary depending on the fibroblast type and experimental conditions.
This model of senescence in fibroblasts has significant applications in research. It provides a valuable tool for studying the mechanisms of cellular senescence, DNA damage responses, and the impact of senescent cells on tissue microenvironments [12]. Furthermore, it allows for the exploration of potential interventions to modulate senescence. One of the key advantages of using etoposide to induce senescence is its ability to generate a relatively homogeneous population of senescent cells within a short timeframe, allowing for more controlled and reproducible experiments compared to replicative senescence models.
Importantly, this model also provides insights into the relationship between DNA damage, oxidative stress, and senescence, as the DNA damage response triggered by etoposide can lead to increased reactive oxygen species (ROS) production, further exacerbating cellular senescence. Etoposide treatment reliably induces DNA damage-related senescence in human articular chondrocytes, evidenced by loss of proliferative capacity, DNA damage accumulation, and expression of some SASP components [13].
Oxidative stress and ROS play a crucial role in the induction and maintenance of cellular senescence in dermal fibroblasts. Studies have shown a significant increase in ROS levels in aged human fibroblasts in vitro and in aged rat skin in vivo, indicating that ROS accumulation is a key regulator of the aging process in the dermis. This excessive ROS production is often associated with mitochondrial dysfunction in fibroblasts, creating a vicious cycle where mitochondrial-derived ROS activates the mammalian target of rapamycin complex 1 (mTORC1), leading to further mitochondrial dysfunction and ROS production [14]
The nuclear factor erythroid 2-related factor 2 (Nrf2) pathway, which regulates antioxidant responses, is reduced during photoaging and chronological aging of fibroblasts [14,15]. Enhancement of Nrf2 signaling can attenuate aging and inflammation in dermal fibroblasts. Senescent fibroblasts can also induce senescence in neighboring cells through paracrine signaling, creating a self-perpetuating cycle of senescence in the dermis [14].
Oxidative stress, caused by an imbalance between reactive oxygen species (ROS) production and elimination, is a key driver of cellular senescence and aging [16,17] Oxidative stress caused by reactive oxygen species (ROS) leads to cellular senescence, which is associated with various age-related diseases, but targeting senescent cells can extend lifespan and health span [17].
Ganoderma lucidum, commonly known as Reishi mushroom, has garnered significant attention for its potential anti-aging properties and ability to combat cellular senescence and oxidative stress. This medicinal fungus contains a variety of bioactive compounds, including polysaccharides, triterpenes, and phenolic compounds, which contribute to its diverse therapeutic effects. Research has demonstrated that Reishi extracts can effectively promote resistance to oxidative stress and extend lifespan in model organisms such as Caenorhabditis elegans. The mushroom's antioxidant properties help protect cells against damage caused by reactive oxygen species (ROS) and other free radicals, which are major contributors to the aging process Ganoderma lucidum has been shown to activate multiple signaling pathways involved in stress response and longevity. For instance, it can modulate the diet restriction pathway and the mTOR/S6K signaling pathway to protect against oxidative insults. Additionally, Reishi extracts have been found to influence the germline signaling pathway, which plays a crucial role in regulating lifespan [18]
At the cellular level, Reishi and its compounds, such as ganoderic acid D, have demonstrated the ability to inhibit senescence in various cell types, including stem cells. These effects are mediated through the activation of antioxidant defense mechanisms, such as the PERK/NRF2 signaling pathway, which enhances the expression of cytoprotective genes. Furthermore, Ganoderma lucidum has shown promise in mitigating age-related oxidative damage in animal models. It can enhance the activity of antioxidant enzymes like superoxide dismutase (SOD) and glutathione peroxidase (GSH-Px) while reducing the levels of oxidative stress markers such as malondialdehyde (MDA) [19,20].
In light of these findings, Ganoderma lucidum extract shows promise as a potential modulator of cellular senescence and oxidative stress in dermal fibroblasts. To investigate this further, we conducted a series of experiments to evaluate the effects of Reishi extract on etoposide-induced senescent human dermal fibroblasts, focusing on gene expression profiles associated with antioxidant defense, cytoprotection, and senescence markers.

2. Results

2.1. Definition of Reagents

2.1.1. Mushroom Extracts

Mushroom extracts were prepared with powder of two different commercial online-suppliers Sunday Natural (Sunday Natural Products GmbH; Potsdamer Straße 83; 10785 Berlin, Germany) and Nature’s finest (Nutrisslim d.o.o; Obrtniška ulica 4, 1292 Ig, Slovenija). The names of suppliers were kept for labelling of different Extracts prepared.
Figure 1 a shows the results of the DPPH assay. Reishi extracts were compared to vitamin C. Anti-oxidative potential of Reishi extracts was observed for three different Sunday Natural extracts (Sunday Natural 1, 2, 3) and one Natures Finest extract over three months and the oxidative potential did not change a lot deviation within analyses were quite large as can be seen in standard deviations of vitamin C were samples were prepared with a pure substance freshly as a control. Considering this the standard deviation of mushroom extract over this long period is not that large.
Polyphenol content (Figure 1b) is relatively low compared to herbal extracts. Data of this figure was already published in a former publication [11].
The transition of molecules in solution was observed by doing dry weight estimations of the different Reishi extracts. We wanted to know how long it takes till al soluble substances pass over to liquid (ethanolic) phase. The powder from Sunday Natural showed better solubility, more substance was transferred from the powder into the ethanolic solution. Natures Finest had a lower dry substance although the same amount was weighed in (Figure 1c). Values are expressed in % radical scavenging activity (formula can be found in methods section).
Resihi extract has only minor antioxidative capacity indicated by DPPH assay. Compared to common antioxidant substances like vitamin C, Tempo or gallic acid. Polyphenol content is also lower than in common herbal extracts (data already published in [11].

2.1.2. Cells

Human dermal fibroblast primary cell line (HDF) was obtained by ATCC and was used in former studies by authors [10,11]. All experiments were performed at at least 50% before the tested end of growth potential. This cell line, which had quite a low doubling rate was passaged for about 40 population doublings. Primary cell line did not reach RS in the time that it was cultivated.

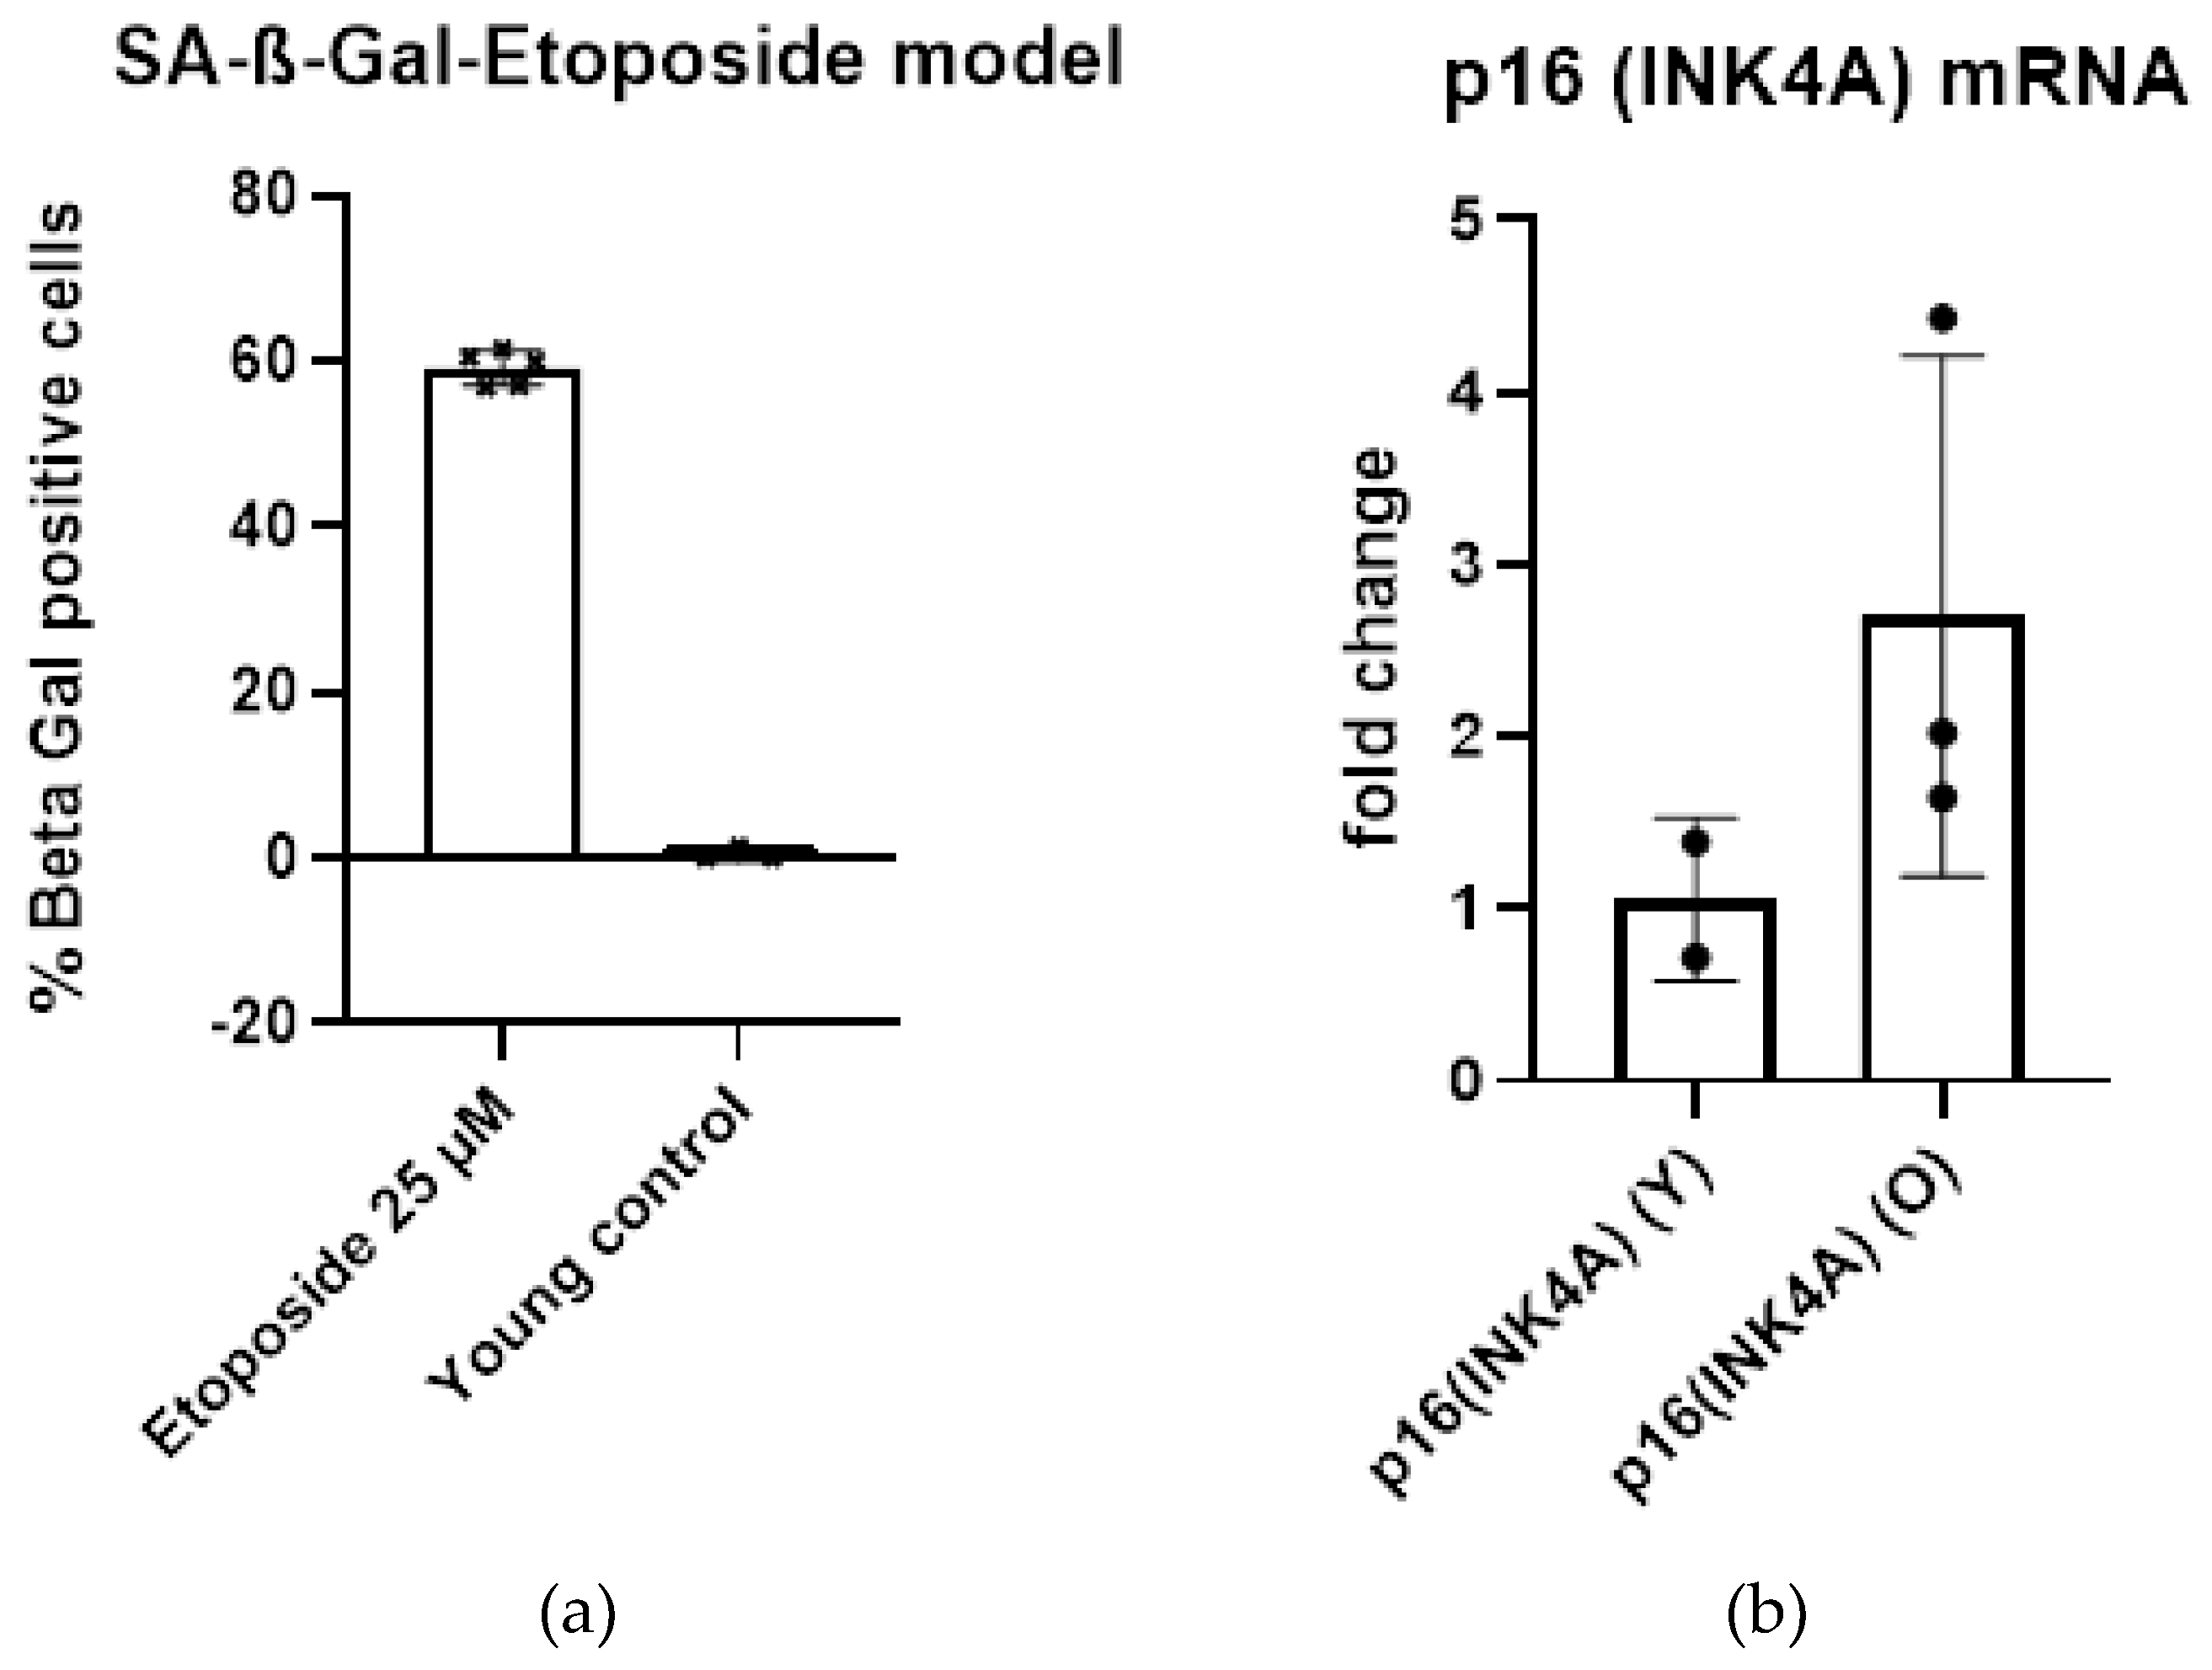
2.1.3. Definition of Senescent State

Etoposide induced cellular senescence was proven by үH2AX staining (Figure 2) and senescence associated-ß-galactosidase assay (SA-ß-Gal) (Figure 3a) as well as qPCR of p16 (INK4A) mRNA (Figure 3b). Furthermore, this cell line and the induction of cellular senescence was confirmed several times in our former publications [10,11]

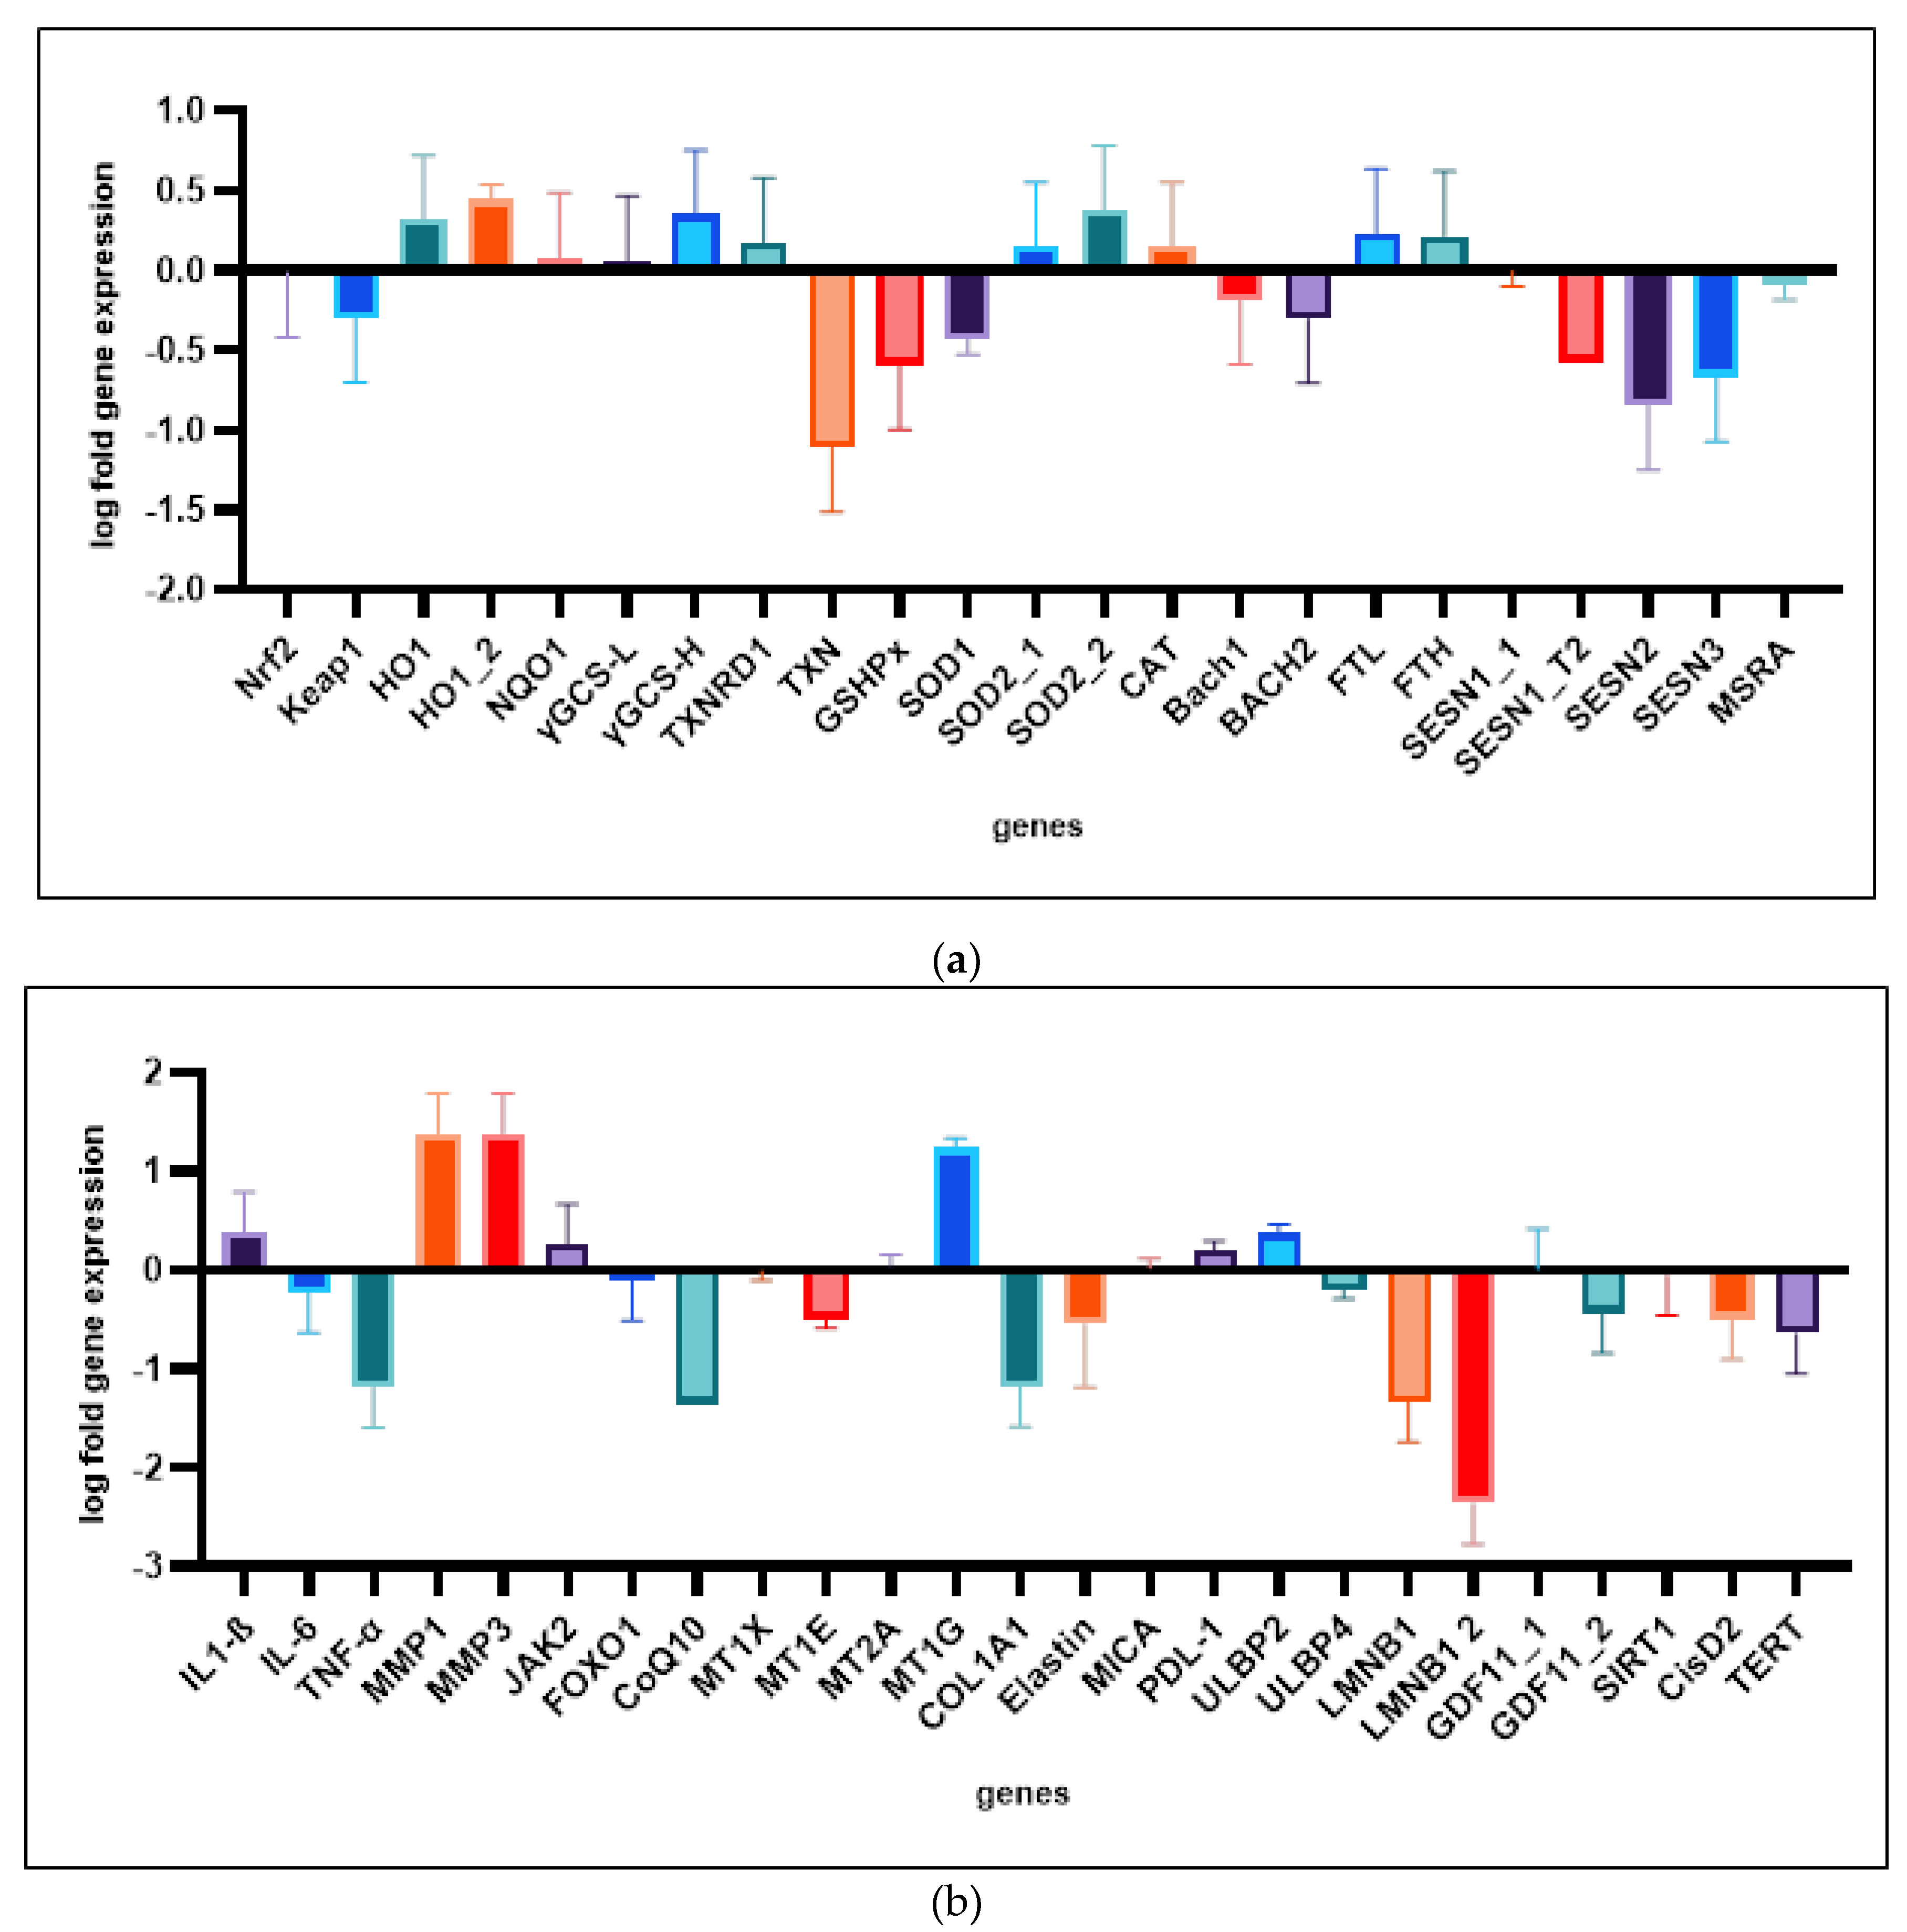
2.1.4. Expression of Relevant Genes in Etoposide Senescent Cells

A variety of gens involved in aging, antioxidative metabolism and SASP were tested for their expression in Etoposide induced senescence. Two samples with low population doublings and two Etoposide induced senescence samples were analyzed.
Relevant genes were analyzed for exact definition of senescent state of HDF. Furthermore, we found out which genes are relevant for our following gene expression studies. We evaluated different primers (sequences can be found in the material and method section). Some of the regulations could not be confirmed in our time course experiments.

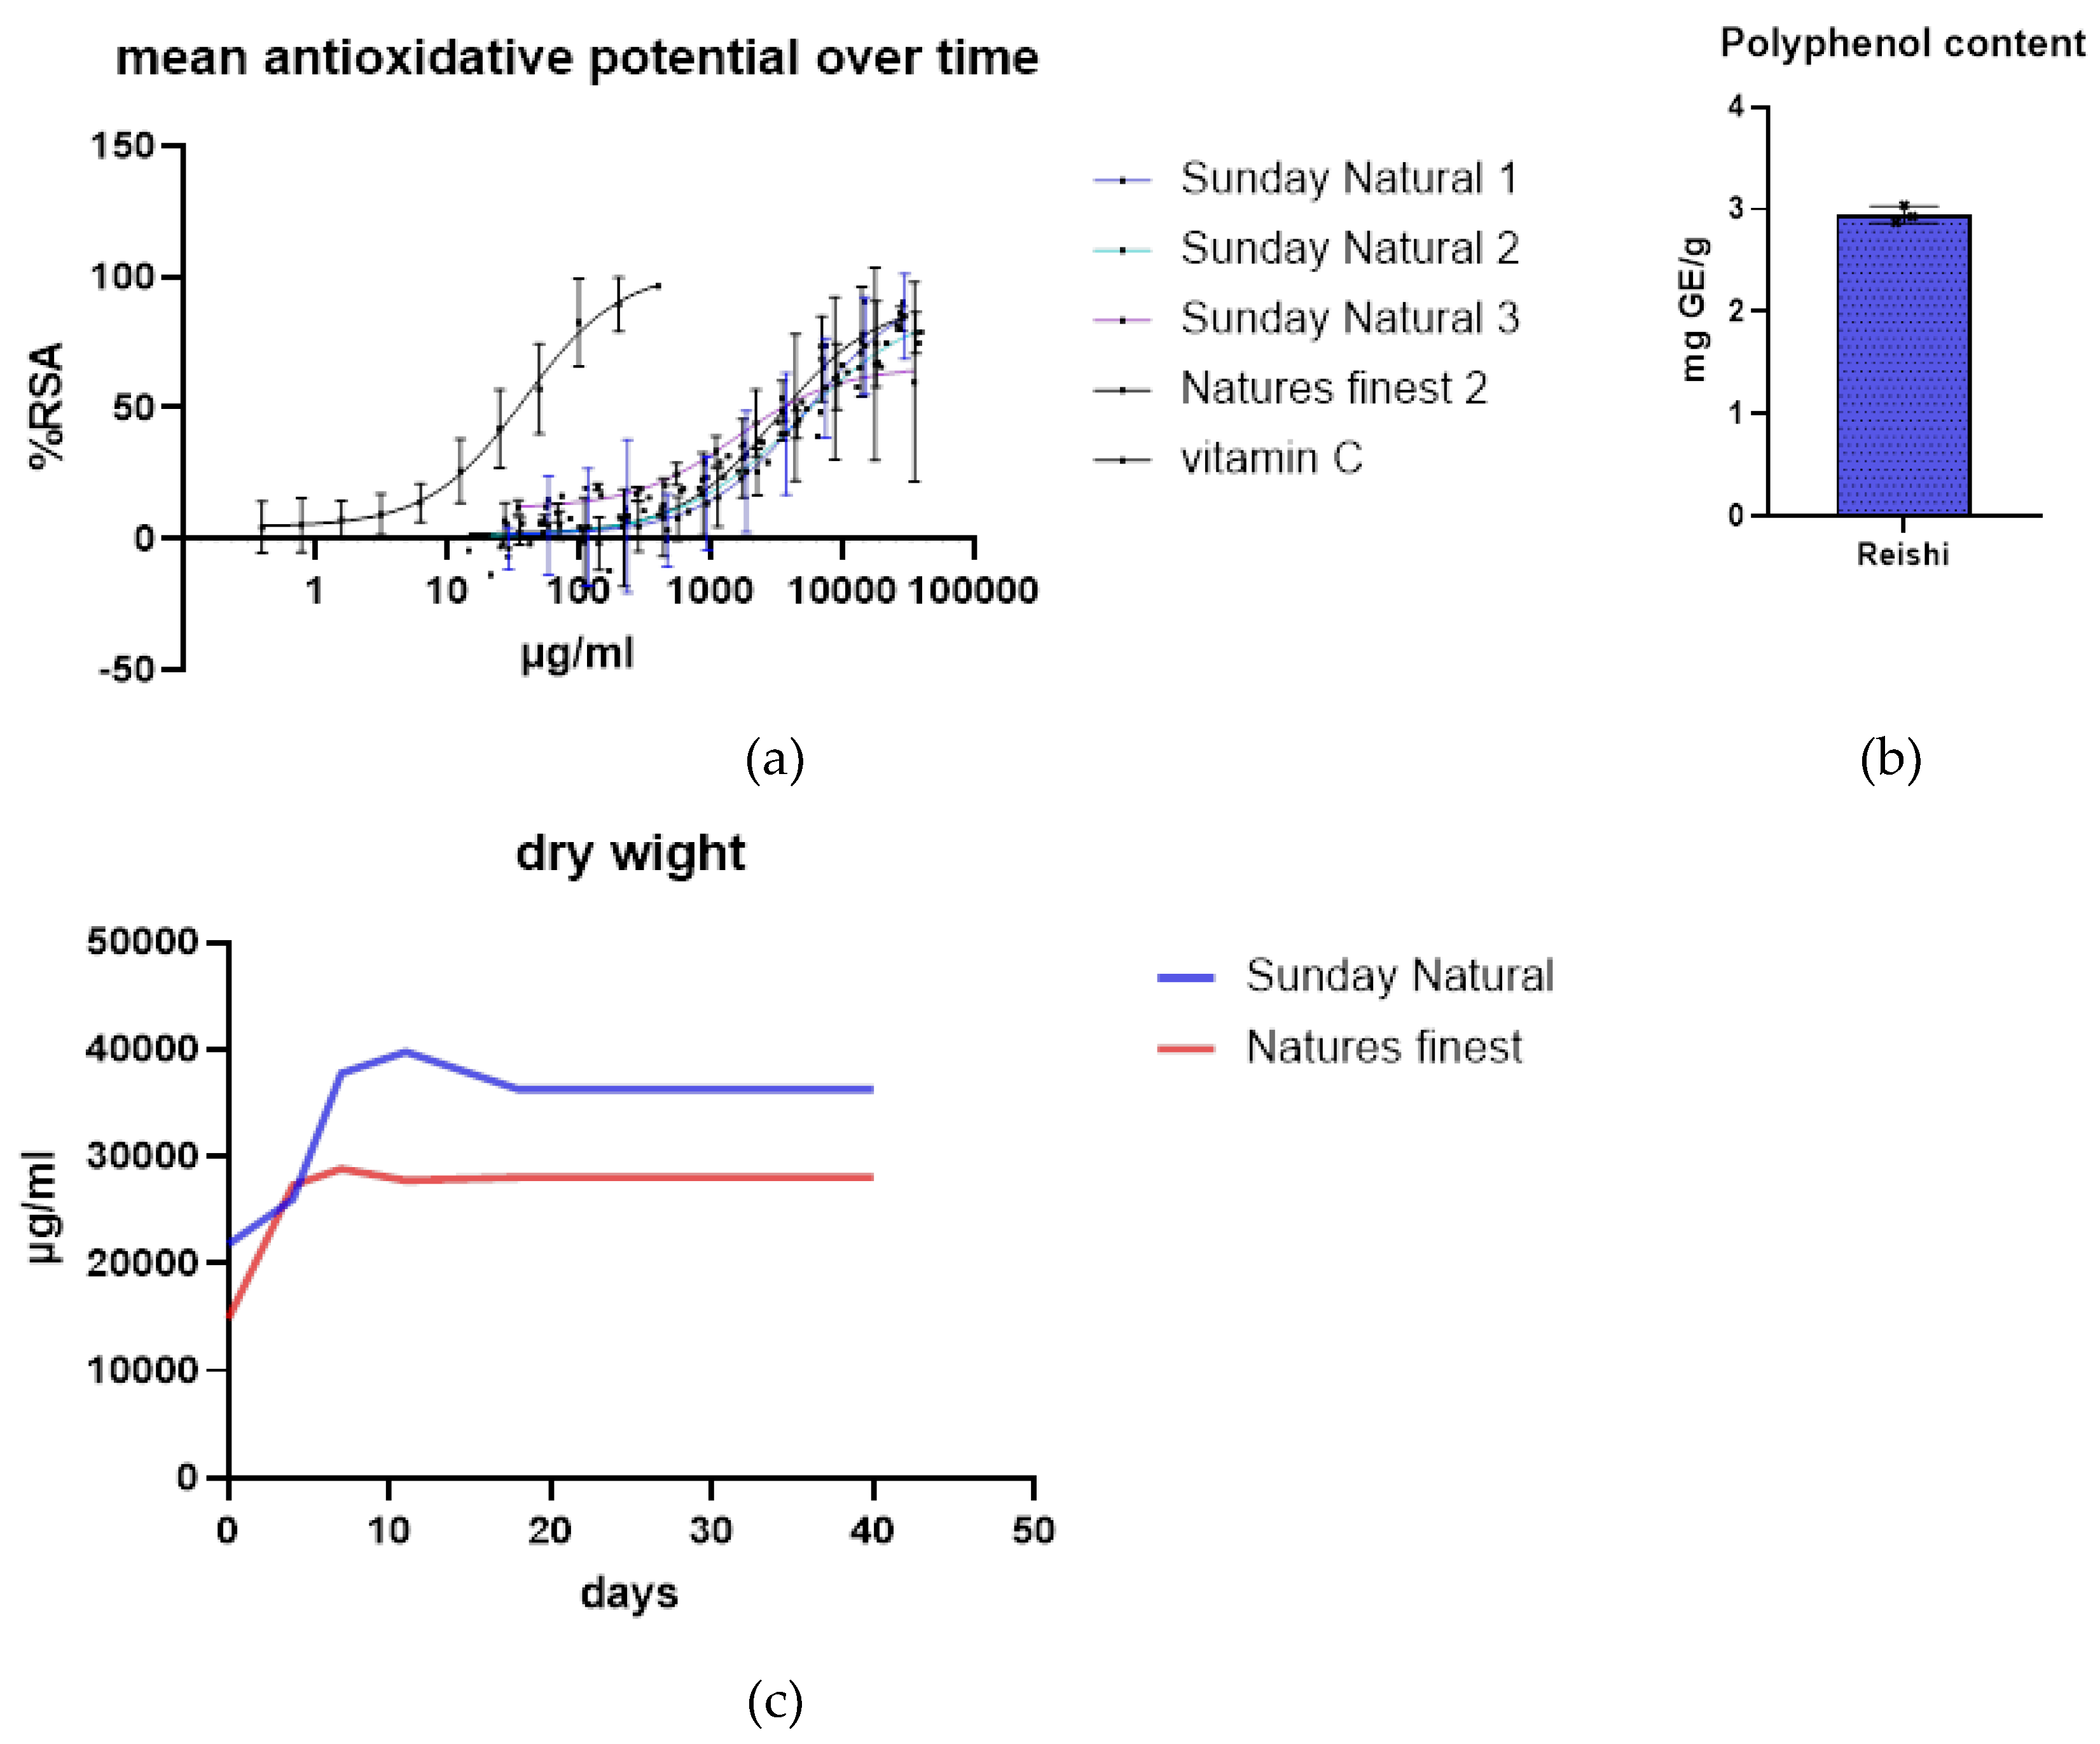
2.1.5. Growth Curves

Treatments were performed over a period of 17 days. Cells were seeded and after adherence to the t-flask for one day they were treated with Etoposide 25 µM for 48 h (treatment is indicated by a red area in the graphs). This treatment was performed for all controls and Reishi treated samples except growing cells control. Controls were prepared like this: “control without” (triangles) was Etoposide treated but obtained no extract but water instead in a nontoxic concentration determined in former Publication [11]. “Control ethanol” (diamonds) was also Etopside treated but received Ethanol in the same amount as it was used in the Reishi extracts (this control was only analyzed one time and served as solvent control). “Sunday natural” circles and “Nature’s Finest” (cubes). all other treatments were performed in duplicates. After exposure to Etoposide cellular senescence was established for 14 days.
Growth curves were produced by counting harvested cells after each timepoint. Gene expression data and IL-6 protein data were obtained in the same experiments. Treatment groups were:
Reishi extracts were used for cell treatment after exposure to Etoposide; control without is an Etoposide treated group which obtained instead of extract just water. Control ethanol is the solvent control group where we treated cells with the same amount of ethanol as we did in Reishi treatments.
Figure 5 a shows that Etoposide is lowering down growth rate, but cells are still alive which indicates successful induction of cellular senescence in most of the cells. Figure is in logarithmic scale to also show the growth of not Etoposide treated cells which continue growth until they get dense in the T-flask.
These experiments were conducted twice with duplicate counts. What can be seen is that Reishi is somehow beneficial for growth of HDF under these harsh conditions of Etoposide treatment (Figure 5b). In all cases Growth is not absolutely inhibited but as can be seen in growing cells group, non-Etoposide treated cells do grow to massively higher cell numbers than the treated cells.

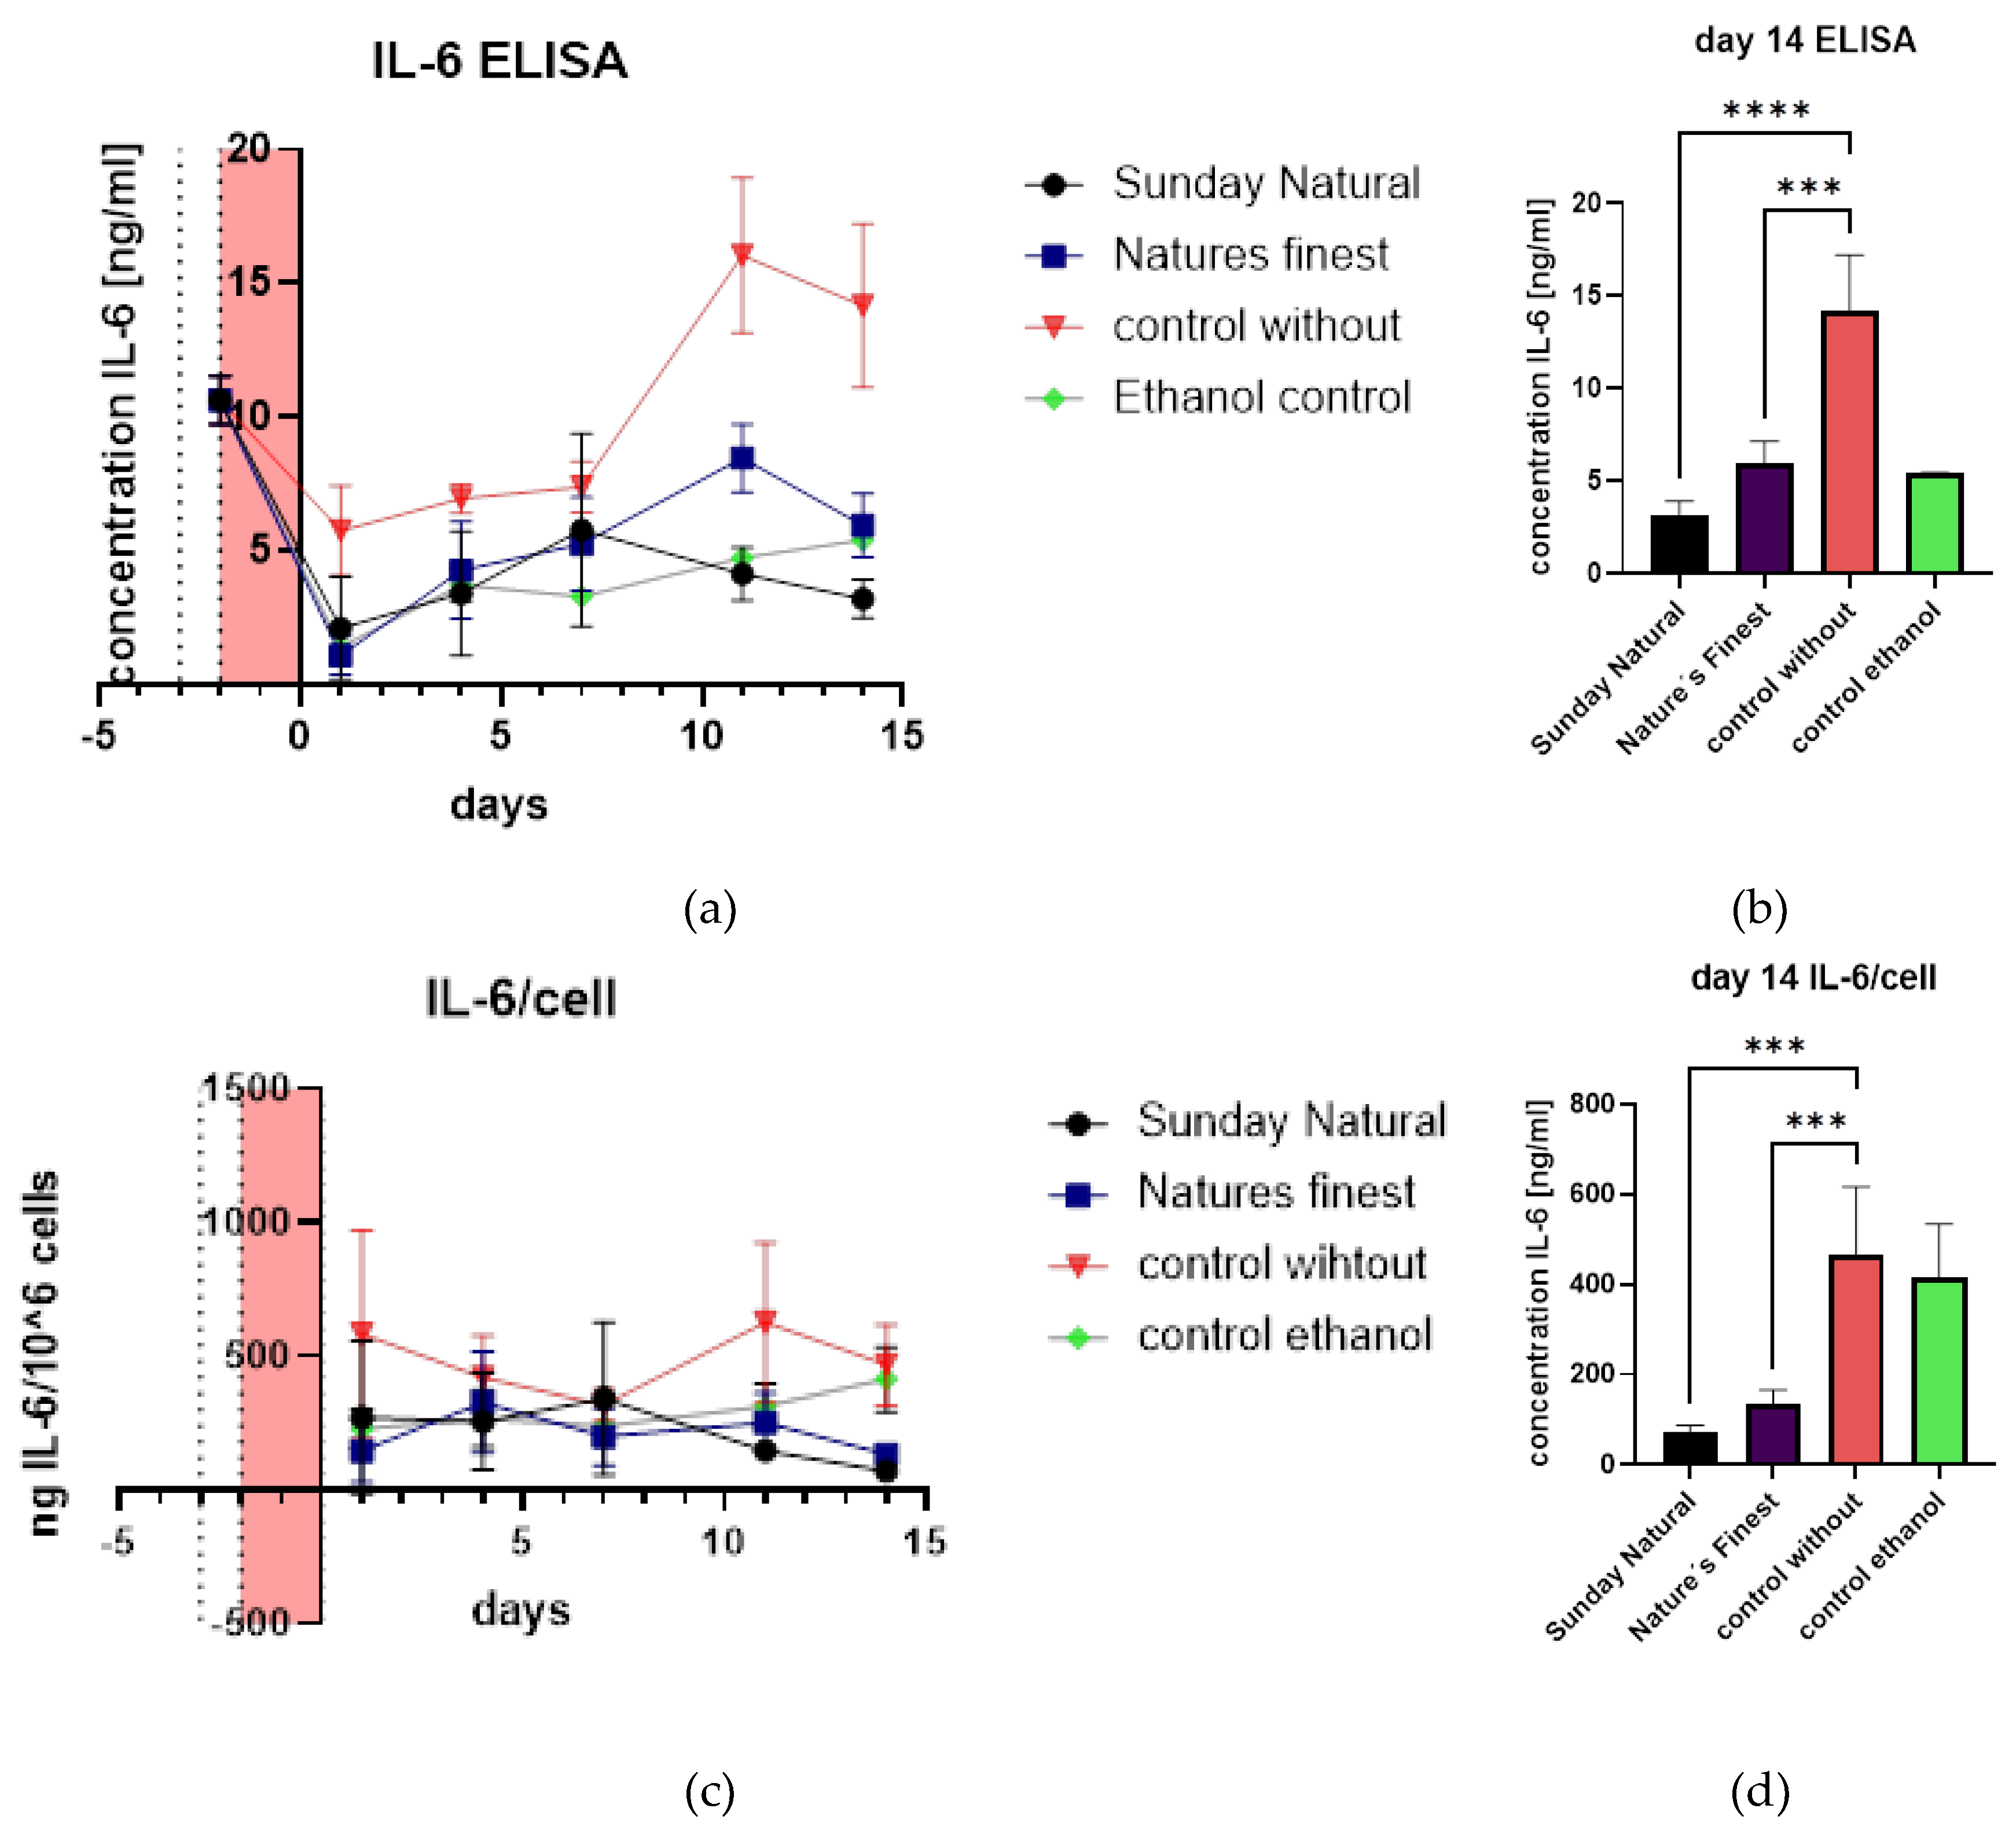
2.2. Ganoderma Lucidum and the SASP Senomorphic Properties

Regarding SASP we analyzed IL-6 expression by ELISA. IL-6 was not highly expressed in control without group, but a slight increase was observed. Compared to this slight increase we saw significantly less IL-6 Protein in Reishi Groups (Sunday Natural and Nature’s Finest) indicating also senomorphic properties of these extracts (Figure 6a,b).
When relating IL-6 concentrations to cell numbers differences get confirmed (Figure 6c,d). In general IL-6 was not highly induced in this treatment series. Nevertheless, a decrease in IL-6 can be observed by Reishi treatment with both extracts.

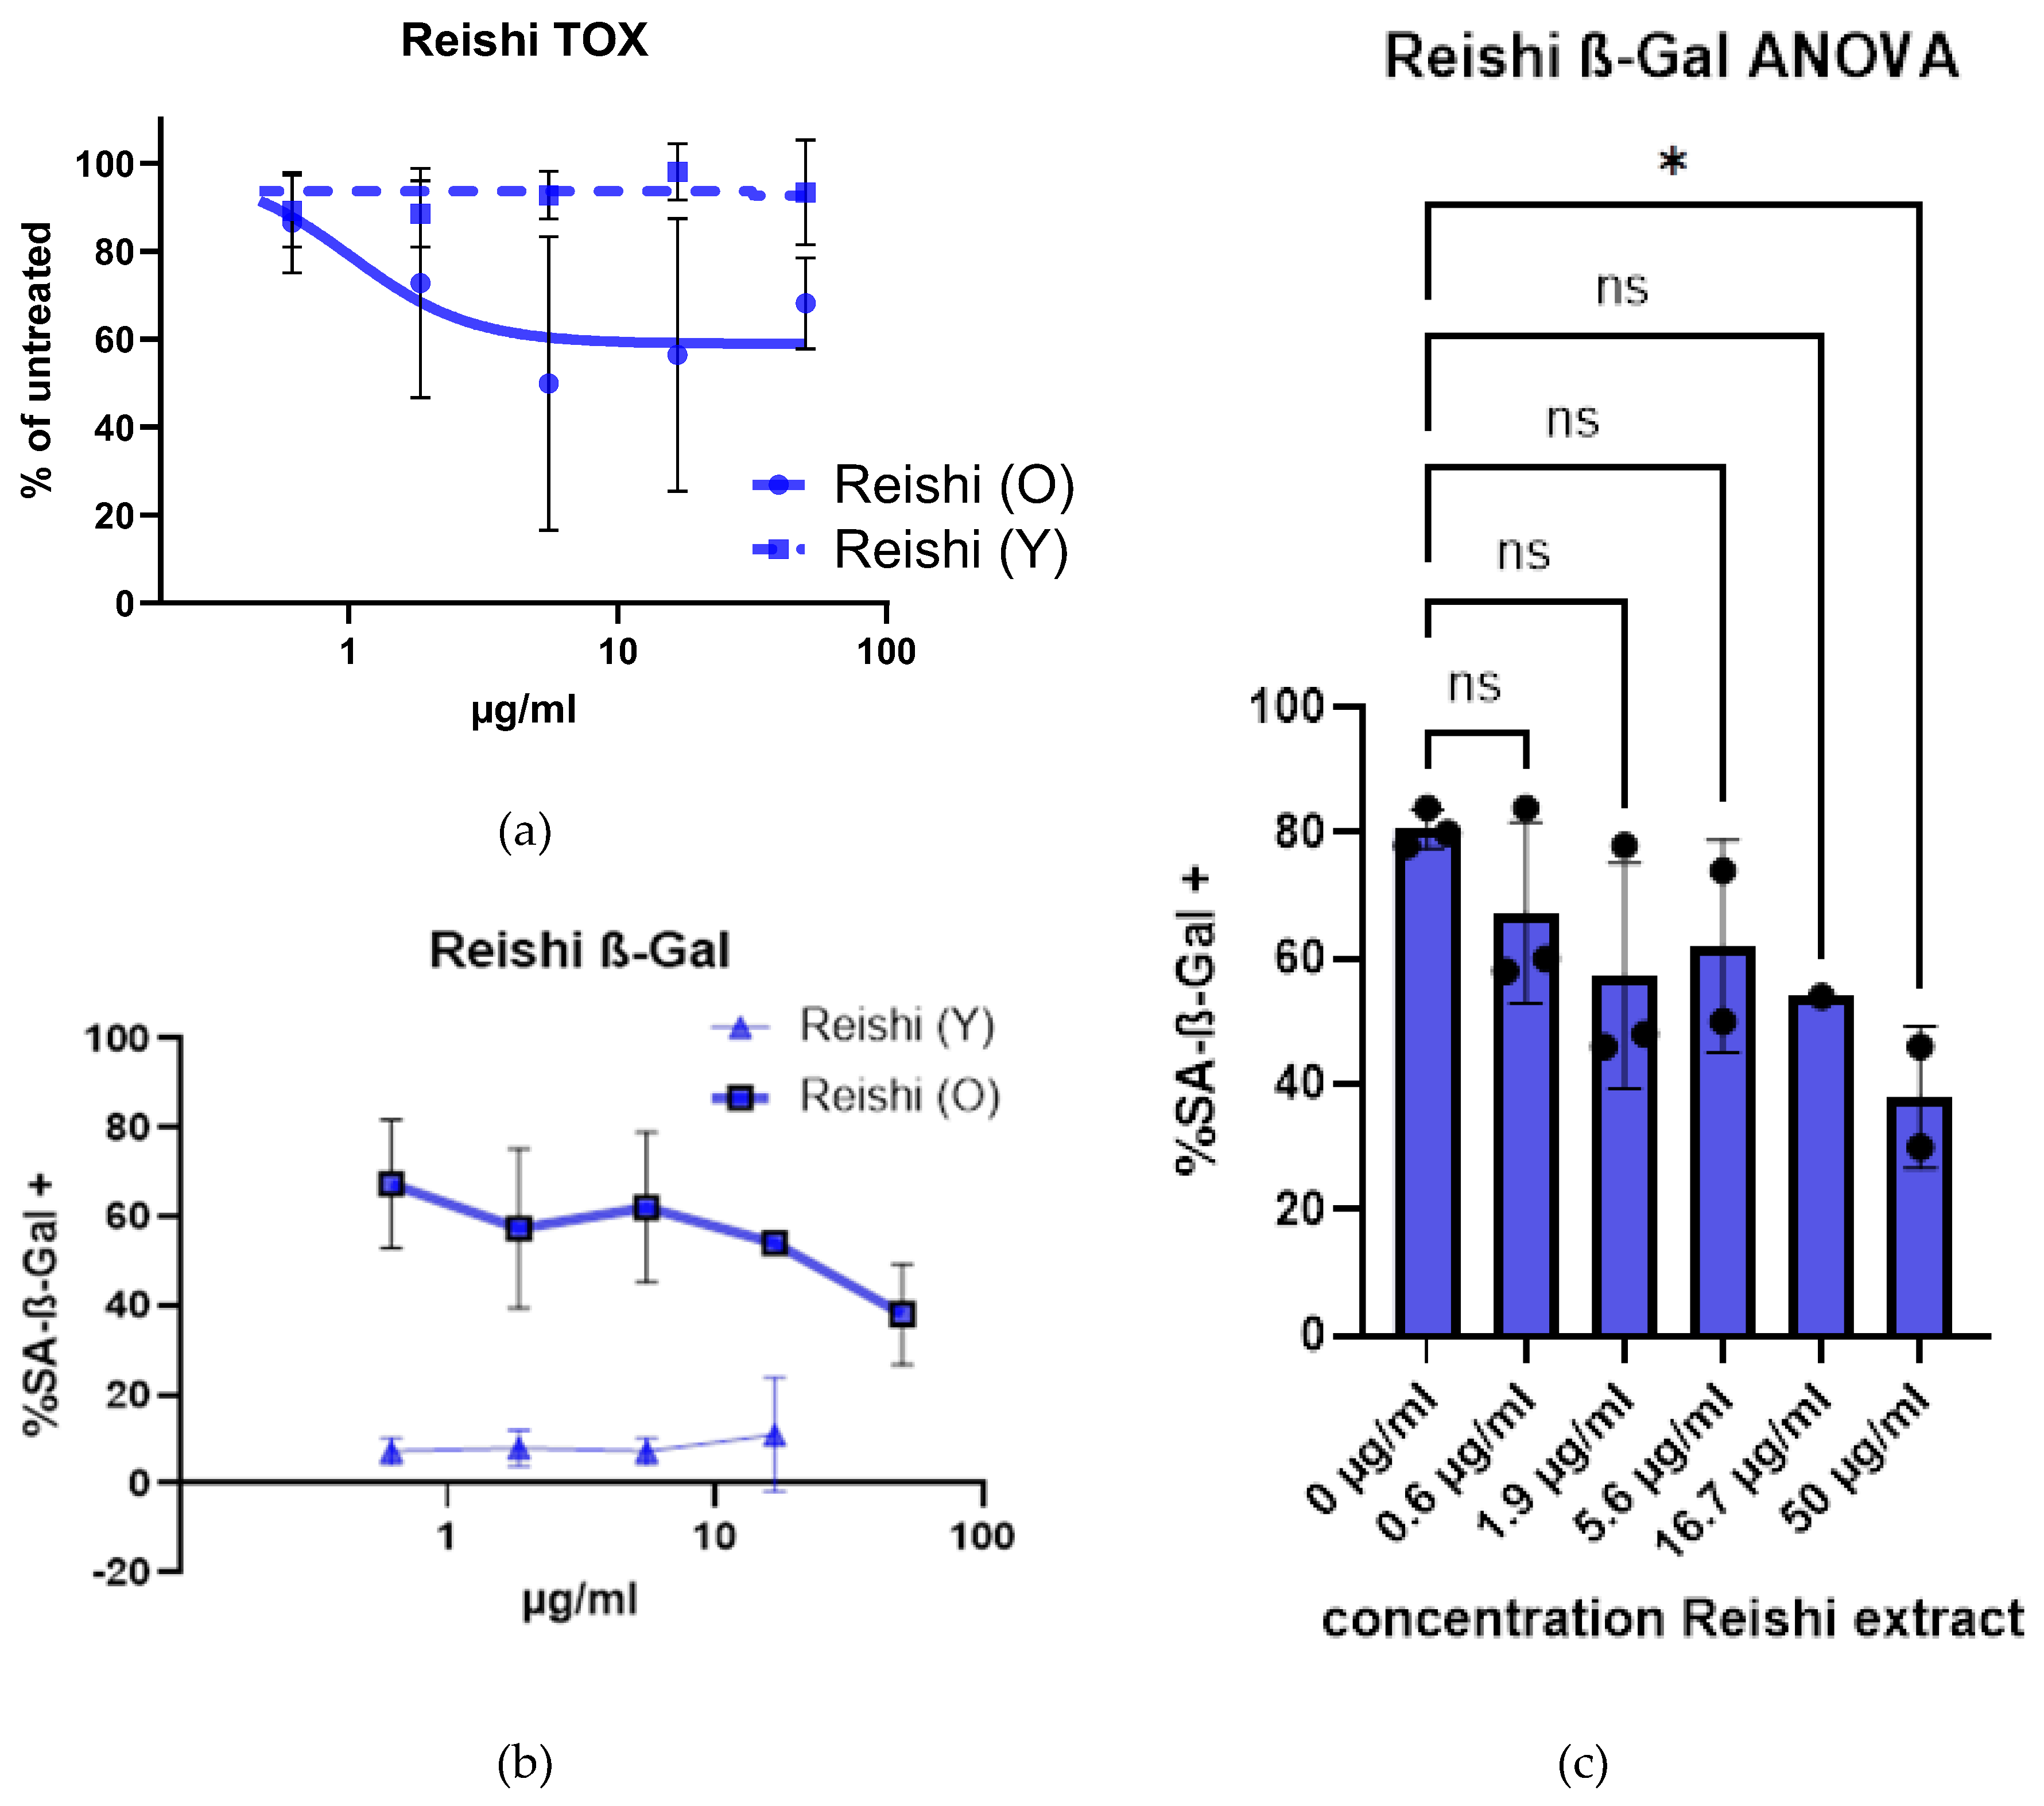
2.3. Senolyotic Properties of Reishi

In Figure 7a senolytic effect can be seen determined by presto blue assay. Reishi seems to be non-toxic to fibroblast cells with low population doublings in the tested concentrations up to 50 µg/ml. With a high standard deviation there is a hint to senolysis in Etoposide treated (48 h pulse of Etoposide and an establishment duration of senescence of about 14 d) old cells measured same way as the young cells (data already published in [11]).
In Figure 7b cells were treated with different concentrations of Reishi extract. SA-ß-Gal staining showed that the percentage of senescent cells decreased by treatment. When performing an ANOVA (Figure 7c) even the highest concentration is significantly decreased (50 µg/ml) (data already published in [11]).

2.4. Analysis of Gene Expression

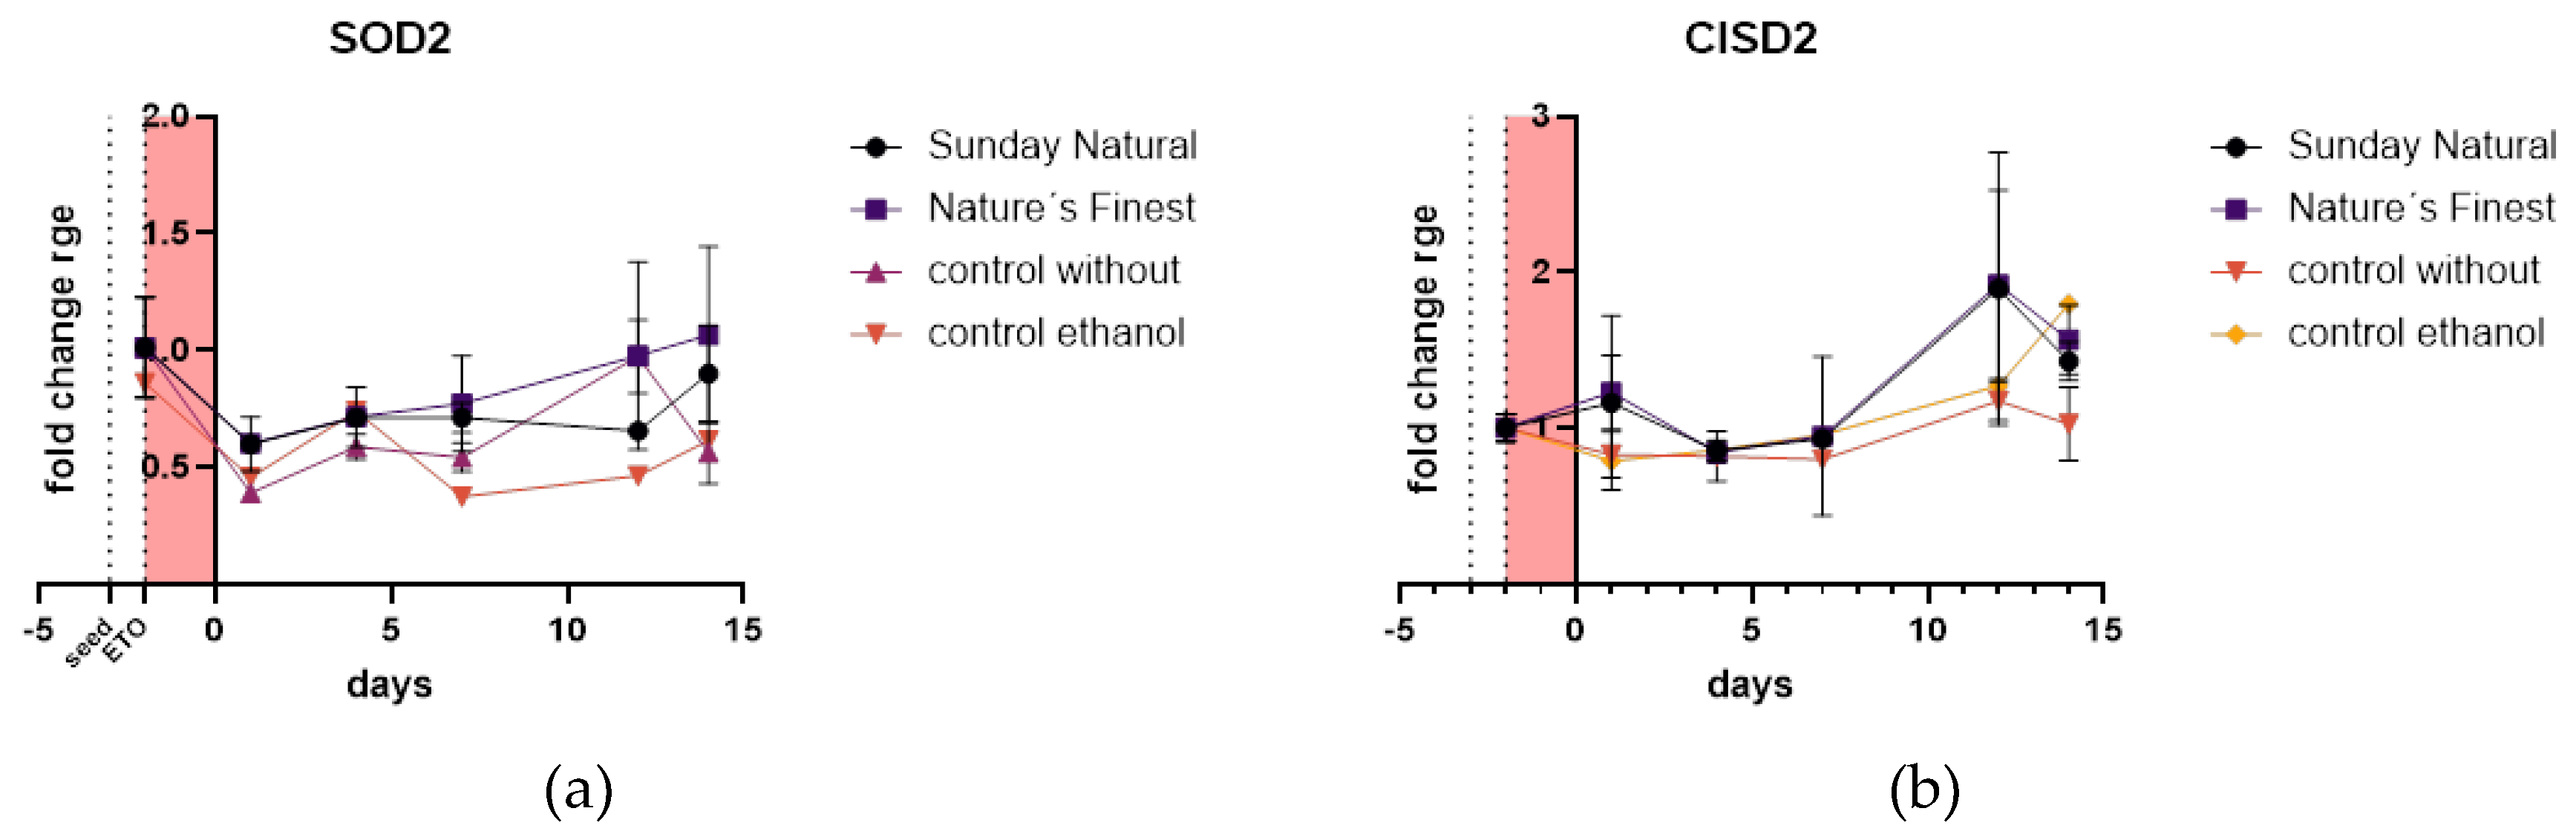
2.4.1. Superoxide Dismutase 2, Mitochondrial (SOD2) and CDGSH iron-Sulfur Domain-Containing Protein 2 (CISD2) Are Not Affected Neither by Etoposide Treatment Nor by Treatment with Reishi Extracts

The mitochondrial SOD2 is not regulated by Reishi extracts compared to control (Figure 8a), there is a slight downregulation of this gene by Etoposide treatment. CISD2 encodes a protein found in the outer membrane of mitochondria and is also not affected by Etoposide treatment (Figure 8b).

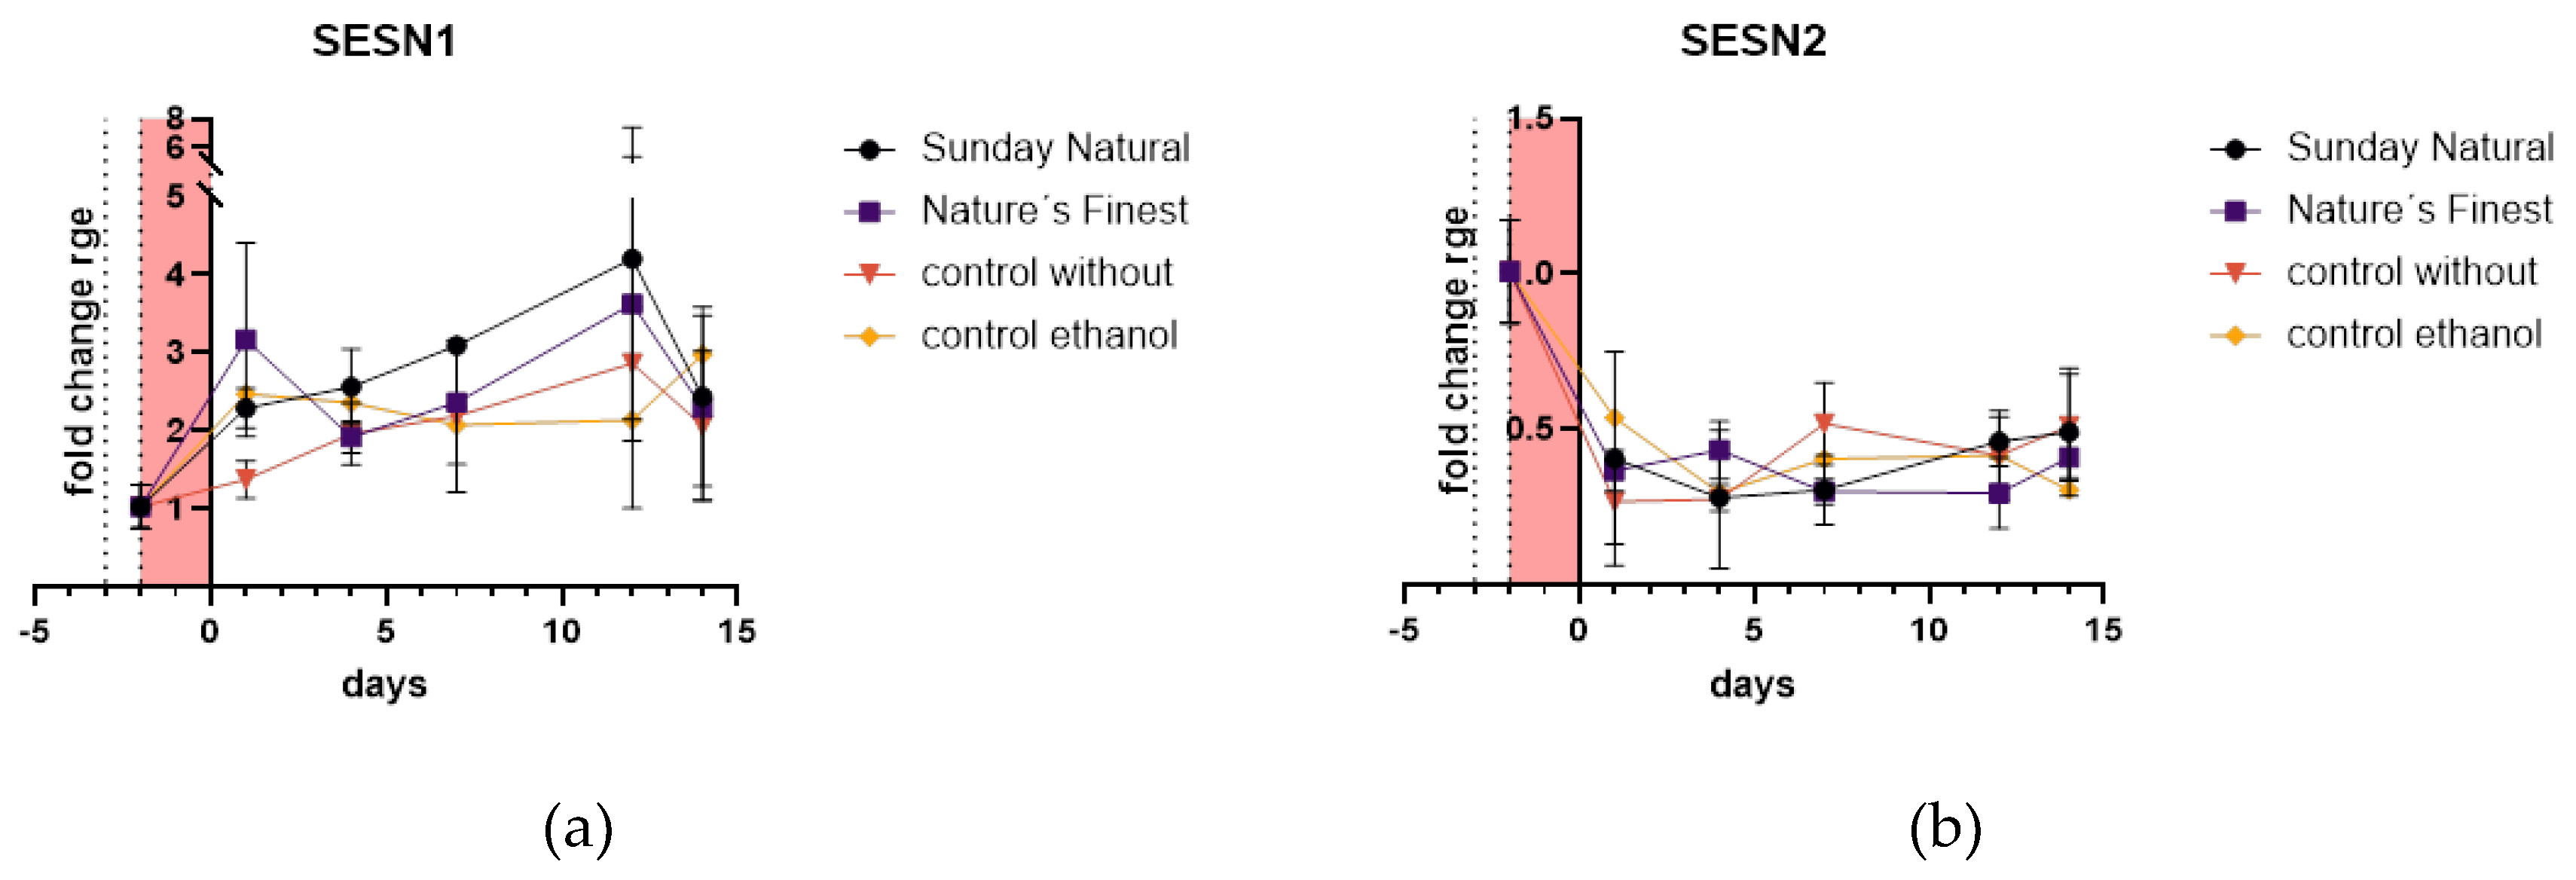
2.4.2. Sestrins 1 and 2 are Regulated in Different Directions

Sestrin 1 (SESN1) is upregulated in all conditions tested. The immediate response of day 1 after Etoposide treatment of the two different sources of Reishi is higher than the response of the not extract treated control. Ethanol control shows a similar pattern like the Reishi ethanolic extracts on this day. Over the whole timeframe of 14 days post Etoposide treatment Reishi extracts are inducing more or equal SESN1 than not extract treated control (Figure 9a). Sestrin 2 (SESN2) is downregulated in all treatments and over the whole time course of 14 days (Figure 9b).

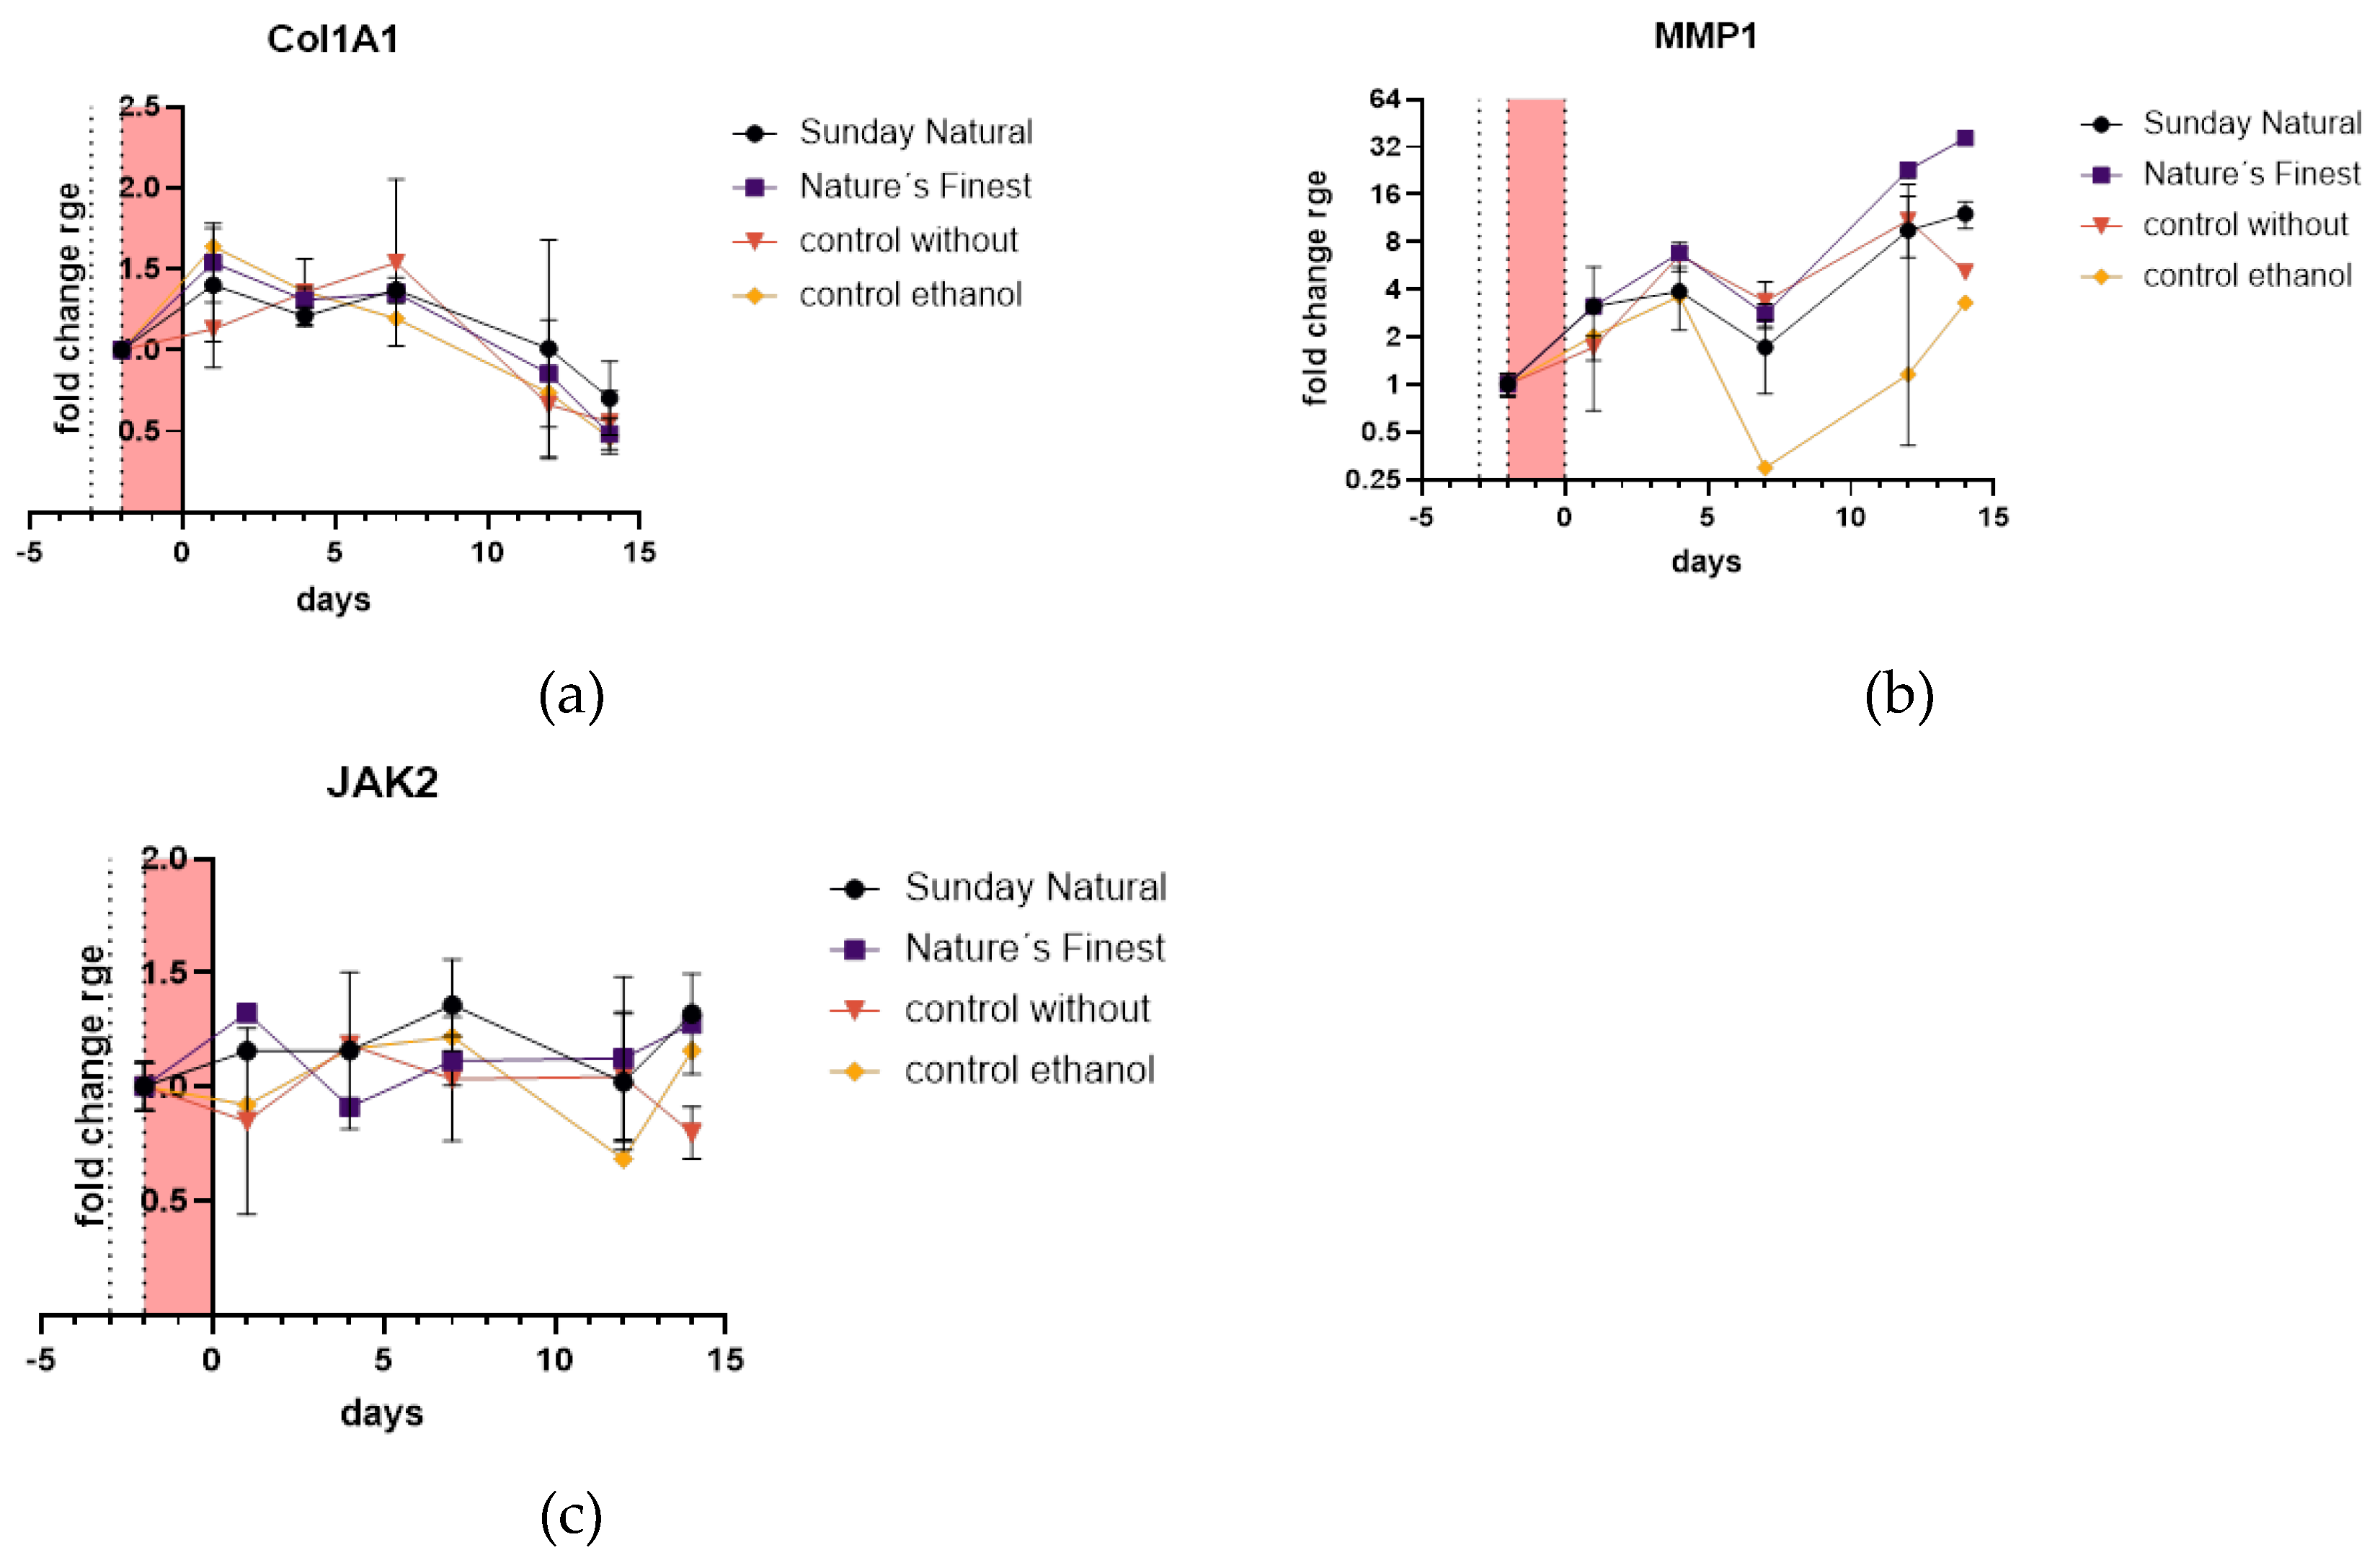
2.4.3. Extracellular Matrix Related Genes Are Not Differentially Expressed Between Control and Reishi Treated Groups

Collagen 1 is upregulated in the first reaction to Etoposide treatment but as establishment of cellular senescence goes on, on day 10 - 14 it is downregulated in all treatments and controls, there is no difference between samples tested and controls (Figure 10a). Contrary, MMP1 is massively upregulated as can be seen in Figure 10b. The expression from Reishi extract prepared from powder purchased at Nature’s Finest increases expression about 36-fold after day 14. Janus kinase 2 (JAK2) (Figure 10c) is not affected by treatments performed on mRNA level.

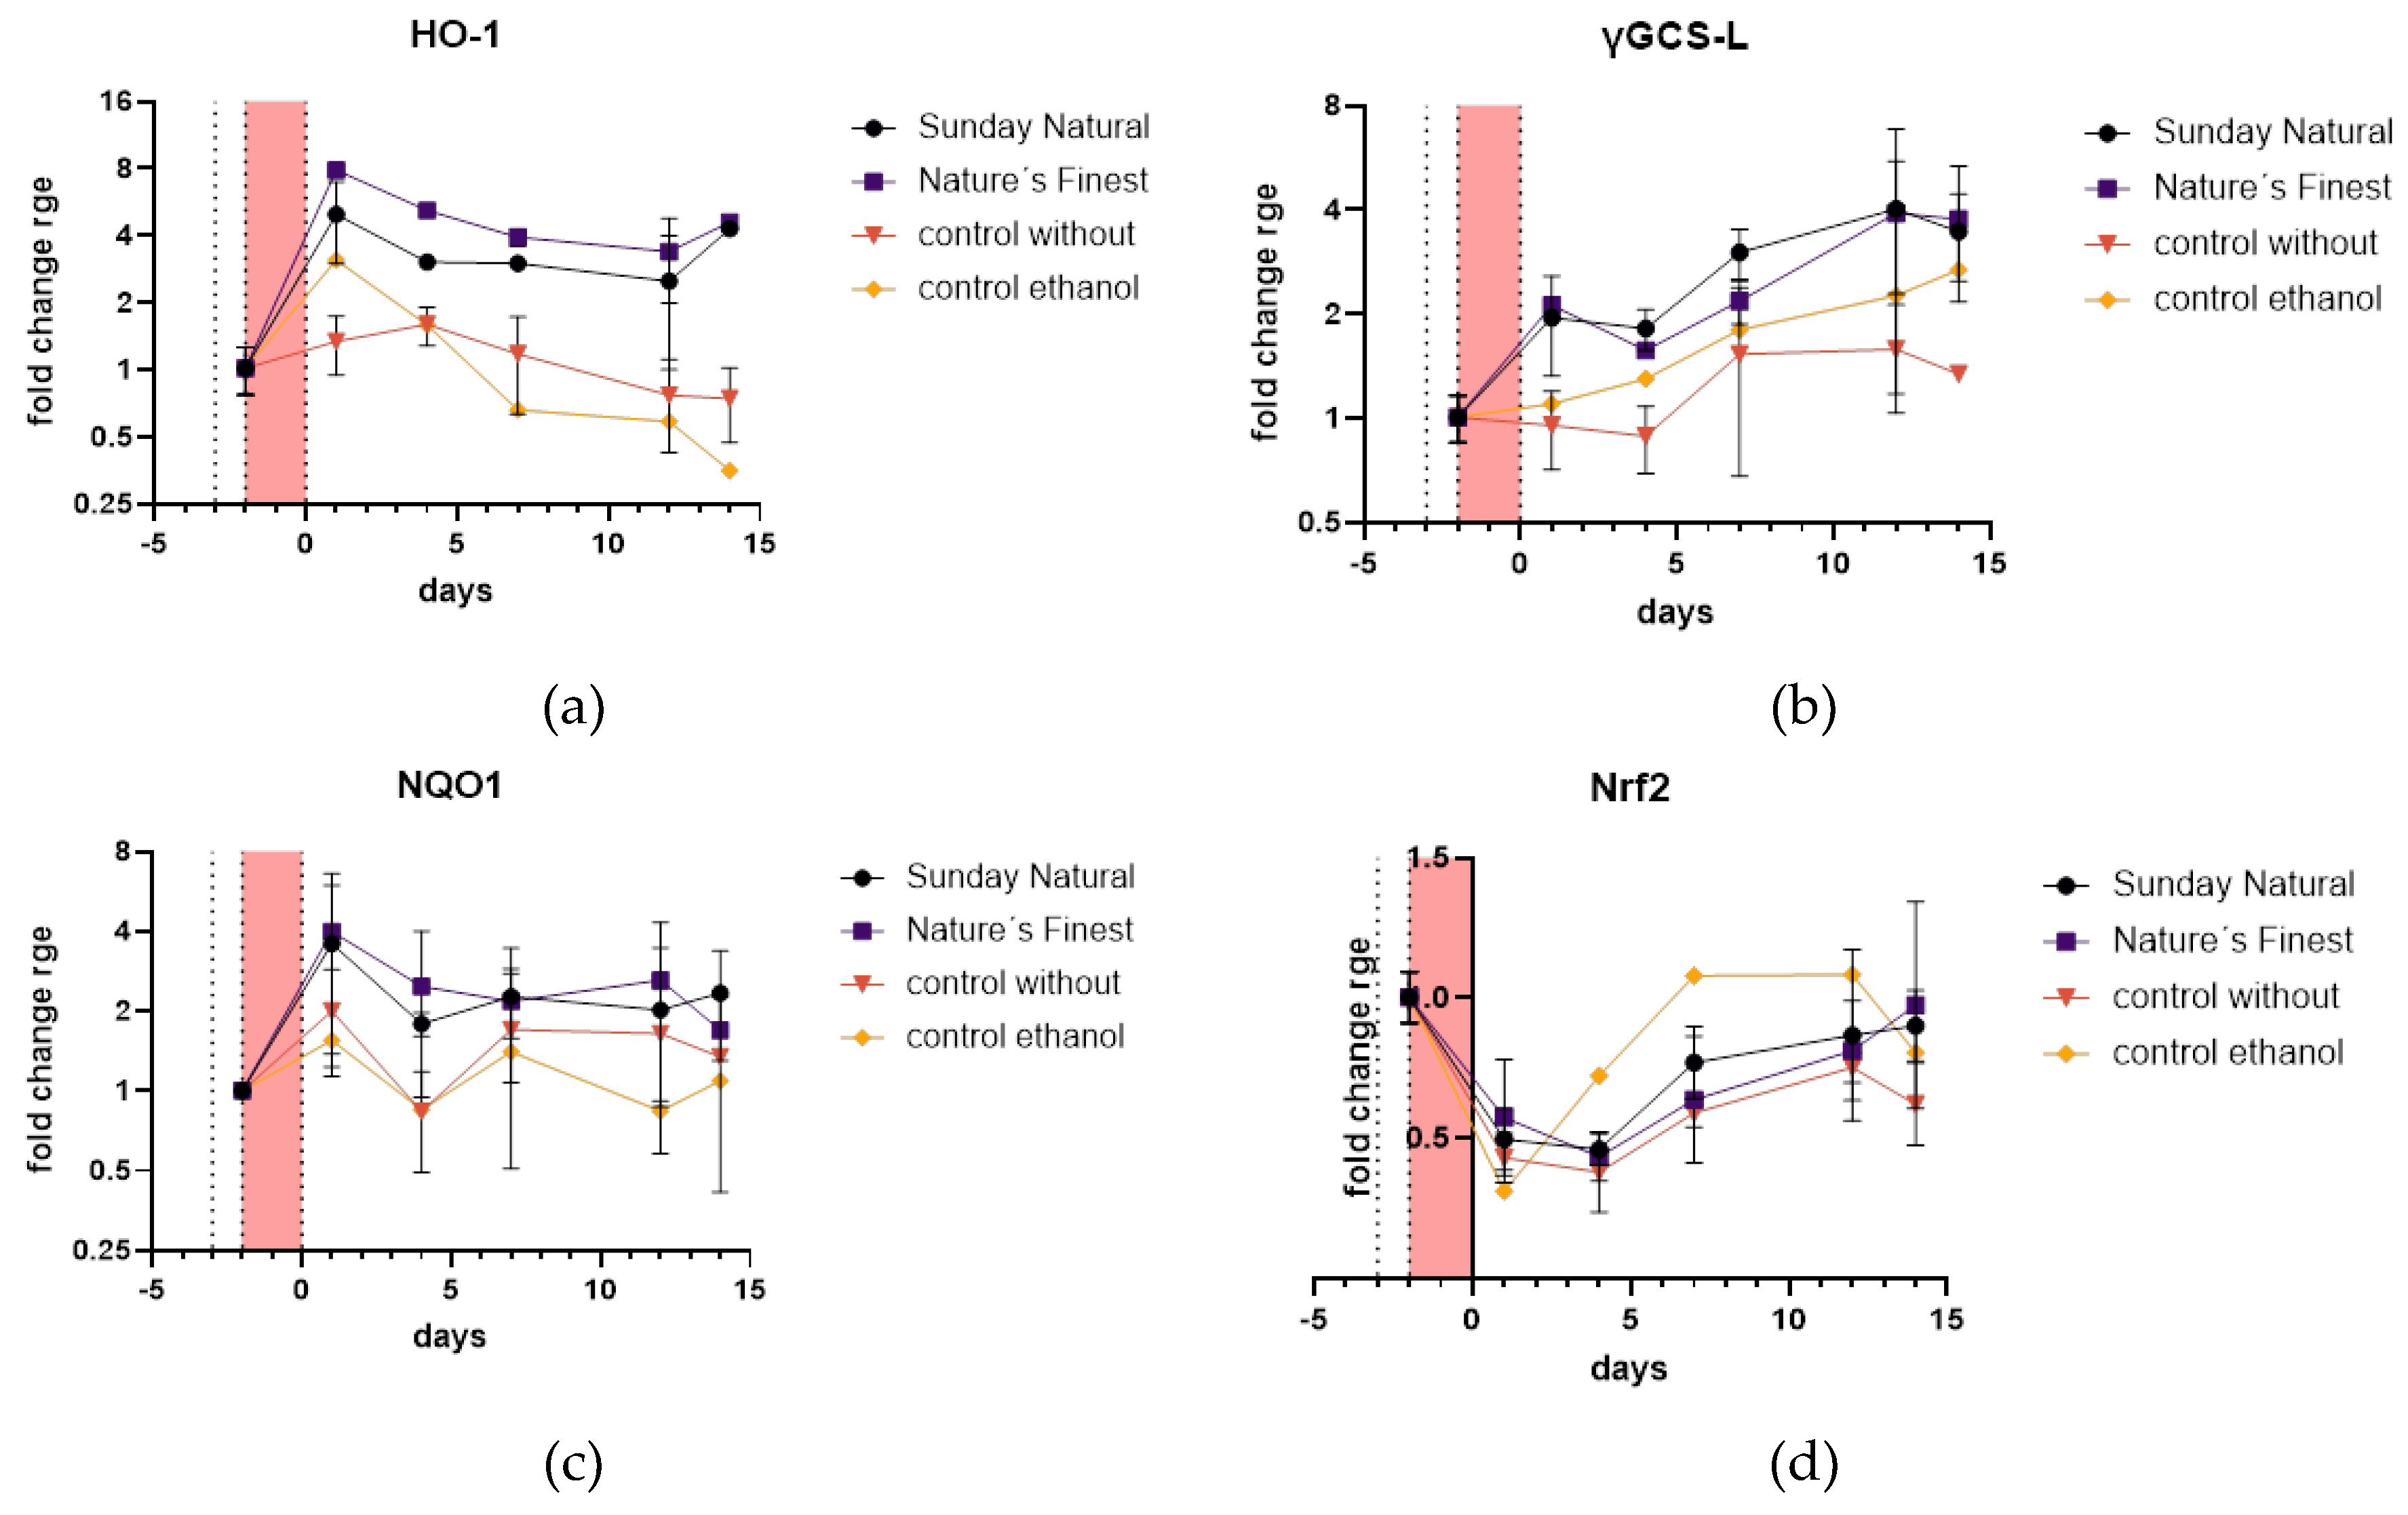
2.4.4. Antioxidant Defense and Cytoprotection of HDF is Upregulated

Nuclear factor erythroid 2-related factor 2 (NRF2) is the master regulator of the antioxidant response. When activated, it translocates to the nucleus and induces the expression of heme oxygenase-1 (HO-1), gamma-glutamylcysteine synthetase light subunit, also known as GCLM (γGCS-L), and NAD(P)H quinone oxidoreductase 1 (NQO1), among many other cytoprotective genes. HO-1 catalyzes the breakdown of heme into biliverdin, iron, and carbon monoxide, which have antioxidant and anti-inflammatory properties [21]. γGCS-L is involved in glutathione synthesis, a major cellular antioxidant. NQO1 catalyzes the two-electron reduction of quinones, preventing the formation of reactive oxygen species [22].
HO-1 is extremely upregulated compared to non-extract treatment control (Figure 11a) in the beginning phase of the treatment there is a nearly 8-fold upregulation of HO-1 in both Reishi extract groups compared to a slight upregulation in control group. The high values of HO-1 keep upregulated for the whole period of 14 days post Etoposide treatment.
Same in γGCS-L expression pattern, but here it is a continuous growth of expression during the 14-day period. There is also a big difference in both Reishi values and the control without extract treatment indicating upregulated antioxidant defense and cytoprotection (Figure 11b).
The values of NQO1 of Reishi extracts are double of the control without extract treatment over the whole period of 14 days indicating a constant upregulation of this gene (Figure 11c).
Nrf2 is downregulated at the beginning of the 14 days but gets back to normal before the end of the investigation (Figure 11d).

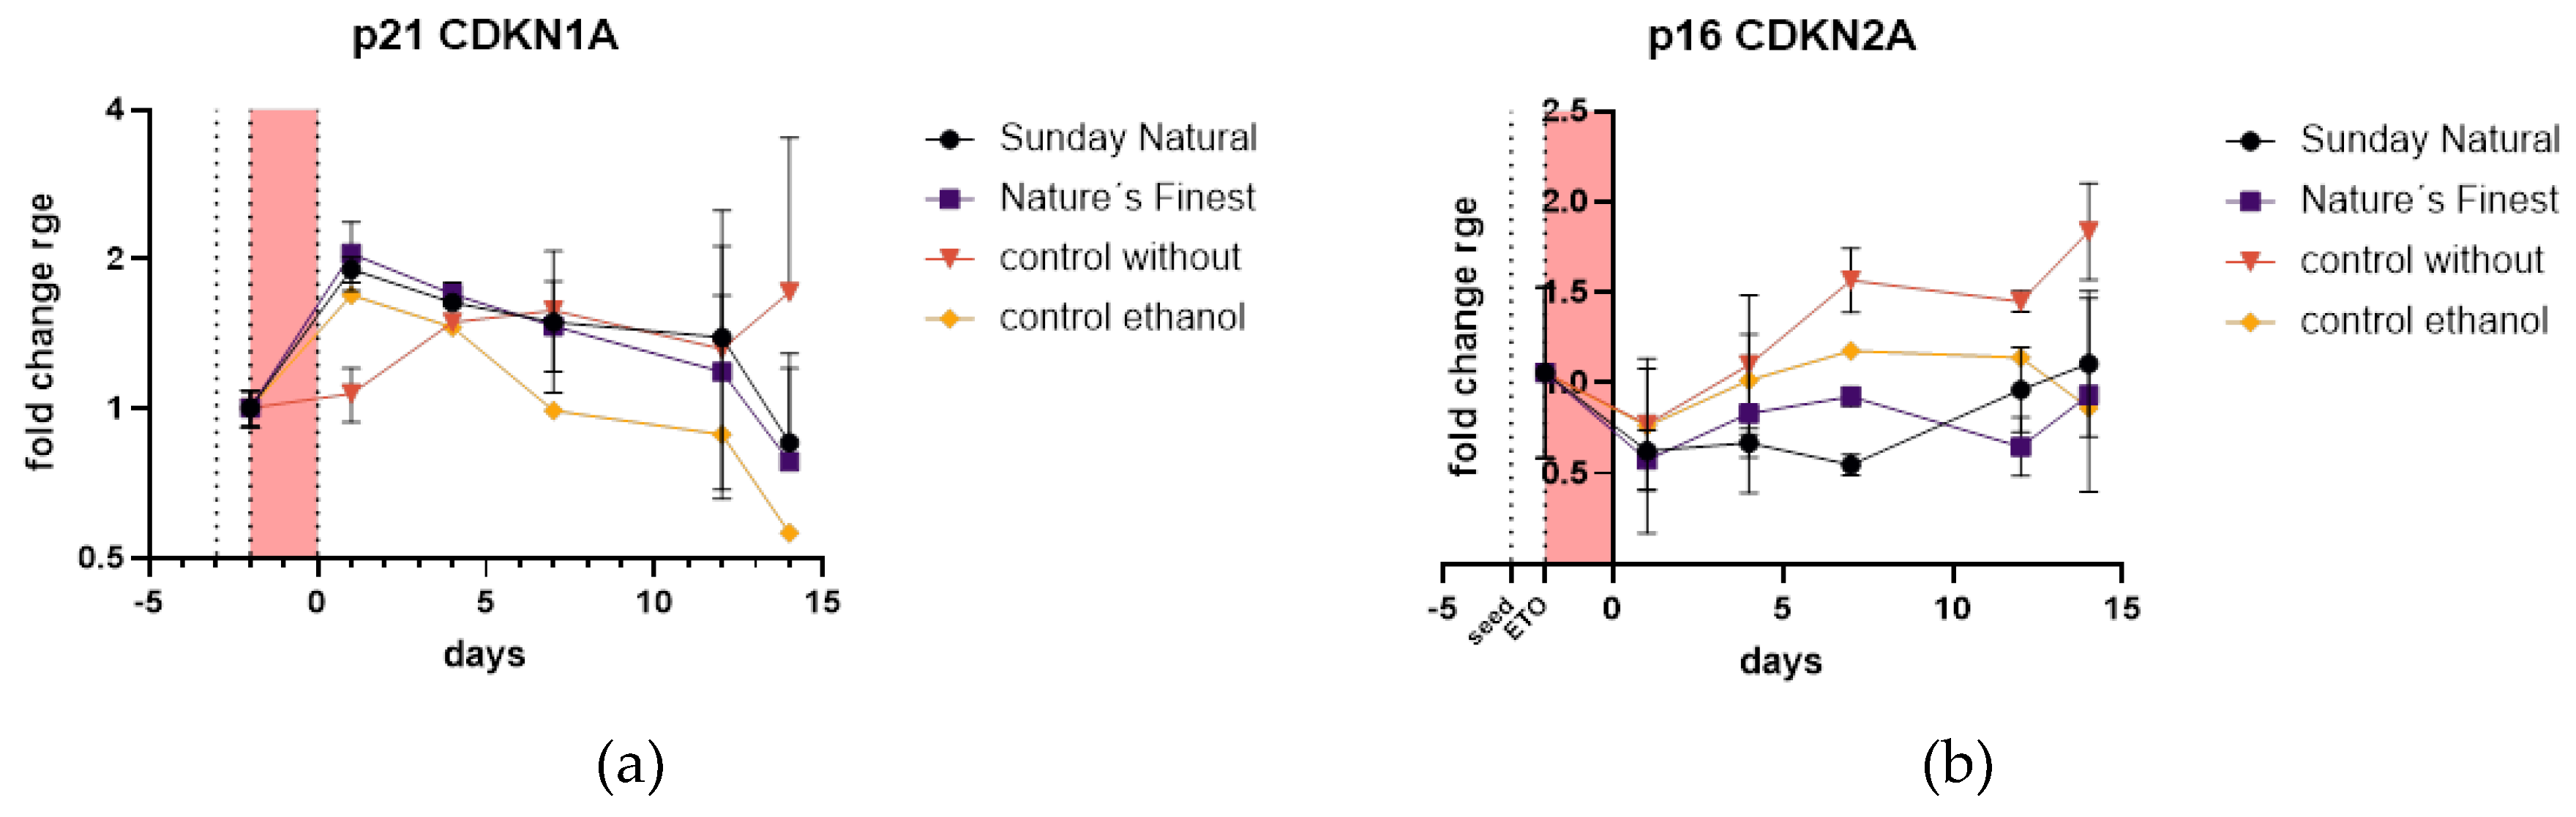
2.4.5. Reishi is Downregulating p16 Expression and Initiates Early Upregulation of p21

Initially, p21 is upregulated by Reishi, at the first day after Etoposide pulse, about two-fold compared to control treatment without Extracts. Later, the pattern aligns to control and stays nearly the same (Figure 12a).
Most importantly p16 (CDKN2A) is clearly not upregulated and stays near zero induction compared to slowly increasing p16 mRNA in control without. So, despite clear initial upregulation of p21 there is no detection of the most important marker of cellular senescence namely p16 (Figure 12b).

3. Discussion

By defining the reagents, we found out that Ganoderma lucidum (Reishi) ethanolic extracts did not have a high anti-oxidative potential. The antioxidative potential stayed nearly constant over the time period we were treating the cells. High standard deviations also in the vitamin C standard tests indicate a big deviation from assay to assay of DPPH assay. Nevertheless, a rough estimate of anti-oxidative potential can be made and also that this potential was maintained over a long period of time (three months) keeping extracts cool and dark. During the extraction period of 40 days, we observed the solving of substances in 40 % ethanol. This showed that more substances were dissolved in the Sunday Natural group which is to be considered in the following experiments. As we do not know the active ingredients, we focused on this summative parameter for measuring the ability of ethanol 40 % to extract substances out of the powdered Mushroom preparations.
Common hallmarks of senescence are expressed in Etoposide treatment as we repeatably proved in former publications [10,11]. үH2AX staining was positive for foci of DNA repair or stand breaks in the nuclei of HDF cells. SA-ß-Gal staining showed increased staining in Etoposide treatment group (25 µM). In these experiments we raised the concentration of Etoposide treatment to 50 µM which is the double concentration of former experiments [10,11]. The expression of p16 is increased in Etoposide treatment which was measured by qPCR of mRNA levels in HDF cells.
We tested a high number of genes (and their primers from the literature) representing a detailed gene pattern for Etoposide treatment. Unfortunately, IL-6 expression was not really affected by 50 µM Etoposide treatment. The other genes mostly show similar expression like prognosed in the literature. A qPCR gene expression analysis of Etoposide induced senescence in this detail was not done by others before to our knowledge.
Massive exposure to chemo therapeutic Etoposide 50 µM leaded to growth arrest. A little residual growth is observed as never all the cells get cellular senescent. Interestingly, both Reishi groups show increased growth compared to water treated control indicating moderate alleviation of damaging effects of Etoposide.
Despite the low expression of IL-6 in these treatment conditions we observed also a decrease in expression of this inflammatory cytokine which is normally the most significantly expressed component of the SASP. Reduction of IL-6 was observed also when IL-6 concentrations were related to cell numbers. In a similar study IL-6, IL-1β, and IL-1α were markedly reduced after triterpenoid complex of Ganoderma lucidum, as evidenced by qPCR. We confirmed findings on protein level by Abdelmoaty et al. [23].
The results suggest that Reishi extract exhibits senolytic properties, as evidenced by the decrease in senescent cells observed in the SA-β-Gal assay. This effect was concentration-dependent and statistically significant at the highest concentration. These findings indicate that Reishi may have potential in targeting and eliminating senescent cells, which could be beneficial in combating skin aging. Additionally, there is a more toxic effect of these extracts to old (Etoposide treated) than to cells with low population doublings. Again, referring to Abdelmoaty et al. we, in contrast, did use a primary HDF cell line which should be quite untransformed in comparison to cancer cells. And also, senescence in somatic cells plays a role in cancer progression. Additionally, the study of Abdelmoaty et al. induced scnescence just for 5 days which is not optimal duration of establishment of cellular senescence to our knowledge.
This recent already mentioned study on triterpenoid complex from Ganoderma lucidum found also a senolytic effect against senescent hepatocellular carcinoma cells. They found out that the triterpenoid complex from G. lucidum had senolytic effect, which could selectively eliminate adriamycin-induced senescent cells of hepatocellular carcinoma cells via caspase-dependent and mitochondrial pathways-mediated apoptosis and reduce the levels of senescence markers [23]. Adriamycin (Doxorubicin) belongs to the group of intercalants. Its effect is based on intercalation into the DNA. Doxorubicin acts as an intercalant on planar compounds in DNA and RNA. DNA synthesis is disturbed, and, like etoposide, topoisomerase II is inhibited, and radical formation occurs. This study and the one of Abdelmoaty et al. show comparable results, this study also goes into more detail but regarding gene expression we offer also interesting new results as follows.
The expression of mitochondria-associated genes (SOD2 and CISD2) was not significantly affected by Reishi treatment. This indicates that the observed effects of Reishi on antioxidant defense may be primarily mediated through non-mitochondrial anti-oxidative pathways.
Sestrins (SESN), are cysteine sulfinyl reductases that play critical roles in the regulation of oxidant defense. SESN1 and SESN2 share some common functions, SESN2 appears to have a broader range of effects and is more extensively studied in various physiological and pathological contexts [24,25]. SESN1 seems to be more specifically associated with genotoxic stress response, while SESN2 has more diverse roles in cellular homeostasis and stress adaptation. In some contexts, SESN1 and SESN2 may have overlapping functions and could potentially compensate for each other, but this is not always the case and depends on the specific cellular context and stress conditions. While SESN1 is primarily regulated by p53 and responds to genotoxic stress in a p53-dependent manner, SESN2 can be regulated by multiple factors including p53, Nrf2, ATF4, C/EBPβ, JNK/c-Jun, AP-1, and HIF1 [26]. The upregulation of SESN1 might indicate that Etoposide is inducing sharply distinguished damage to HDF cells inducing strand breaks and p53, without additional oxidative stress or starving that SESN2 might not be induced. Additionally, if SESN2 fails to be appropriately upregulated in senescent cells, it could potentially lead to reduced autophagy activation as published recently[23].
MMP-1 degrades collagen I, which in turn can affect the expression of collagen I genes. Fibroblasts cultured in MMP-1-fragmented collagen lattices showed reduced collagen production [27]. MMP-1 (Collagenase-1) expression is generally inversely related to collagen I expression [28] so it is also in our experiments. Unfortunately, this effect of skin aging could not be alleviated by Reishi extract. JAK2 plays a crucial role in the activation and profibrotic behavior of human dermal fibroblasts [29]. It is involved in collagen synthesis, response to growth factors and cytokines, and signal transduction pathways that contribute to fibrosis. Cytokine stimulation induces phosphorylation of JAK2 at multiple residues, which regulate its activity either positively or negatively [30] Generally spoken it is regulated post translationally so no changes in expression doesn’t mean that it isn’t involved in this process. This suggests that while Reishi may have beneficial effects on cellular senescence and antioxidant defense, it may not directly modulate extracellular matrix remodeling in this context.
The study demonstrated a significant upregulation of key antioxidant and cytoprotective genes in Reishi-treated cells compared to controls. Specifically: a) HO-1showed a rapid and sustained upregulation in Reishi-treated groups, indicating an enhanced antioxidant response. γGCS-L expression increased continuously over the 14-day period, suggesting improved glutathione synthesis capacity. Furthermore, γGCS-L was higher in Reishi treated extracts. NQO1 expression was consistently higher in Reishi-treated cells, further supporting an enhanced antioxidant defense mechanism. These findings suggest that Reishi extract may help protect dermal fibroblasts against oxidative stress, which is a key factor in cellular senescence and skin aging.
Interestingly, our study found that Reishi treatment affected the expression of key senescence markers. Most interesting, p16 (CDKN2A) expression, a critical marker of cellular senescence, was suppressed in Reishi-treated cells compared to controls. This suggests that Reishi may help prevent or delay the onset of senescence in dermal fibroblasts. Additionally, p21 (CDKN1A) showed an initial upregulation in Reishi-treated cells, followed by a return to control levels. This transient increase in p21 might indicate a temporary cell cycle arrest, possibly allowing for cellular repair mechanisms to take effect.
In sum, we have observed very interesting effects of Reishi (Ganoderma lucidum) pointing in the direction that traditional medicine is able to alleviate signs of aging. It would be very interesting to see if dieting with Reishi would affect signs of aging in human individuals.
Many traditional medicines have long histories of use in human populations, often spanning centuries. This provides valuable long-term safety data that is difficult to obtain for newly developed drugs [31]. Since many traditional medicines are already approved as dietary supplements or foods, they may face fewer regulatory restrictions compared to novel pharmaceutical compounds. This can potentially accelerate the research process and make it easier to conduct clinical studies. Traditional medicines often have higher levels of acceptance among older populations due to cultural familiarity. This can aid in recruitment for clinical trials and improve compliance, which is crucial for studying long-term effects on aging [32]. Traditional medicines are often more affordable than newly developed drugs. This can be beneficial for conducting large-scale, long-term clinical studies needed to assess effects on aging processes. Some traditional medicines may already have data on their effects in age-related conditions. This existing research can provide a foundation for investigating their potential senolytic properties, potentially streamlining the research process.
However, it's important to note that traditional medicines still require rigorous scientific evaluation to establish their efficacy and safety as senolytics. While they may offer some advantages in the research process, they should be held to the same standards of evidence as other interventions. Additionally, standardization of traditional medicine formulations can be challenging, which needs to be addressed in clinical studies.

4. Materials and Methods

4.1. Definition of Reagents

4.1.1. Preparation of Extract and Standard Substances

Two Reishi mushroom powders from different brands, Sunday Natural (Berlin, Germany) and Nature´s Finest (Dobrava, Slovenia), were dissolved in 40 % ethanol, which was prepared prior with pure water and 99.9 % ethanol (Australco, Spillern, Austria) to a concentration of 100 mg / ml, respectively. Thereafter the mixtures were stored in 250 ml Duran® Schott bottles, in the dark at room temperature, for three to four weeks to let them fully extract potent substances to the liquid phase. After that period, the extractions got filtrated by means of a pleated filter (MN 615 1/4, Macherey-Nagel®) and stored in the fridge at 4 °C until use. Overall, three extracts of both Reishi powders were prepared in the course of all experiments. In the preparation of the second and third ones, the Schott bottles were additionally shaken two times per week in the extraction phase to enhance its process of extraction. Vitamin C, Gallic Acid (Roth) and Quercetin (Sigma-Life Science, St. Louis, USA) stock solutions were prepared by dissolving 20 mg of the respective powder in 10 ml 40 % ethanol. Until use, they were stored in the fridge at 4 °C as well.

4.1.2. Dry Matter Determination

Empty glass eprouvettes were heated and weighed till weight constancy, before they were filled with 2 ml of supernatant or final Reishi and Sutherlandia extract each and incubated for at least three days at 70 - 80 °C. When all the water-ethanol liquid was evaporated, the solid remainings got cooled down in a desiccator and subsequently also weighed till weight constancy. Because the weight of the empty eprouvettes after heating them in a sterilization cabinet did hardly change in the first three dry matter determinations, this step was skipped for the following measurements. All measurements were performed at least in double determinations.

4.1.3. DPPH-Assay

First a DPPH stock solution was created by dissolving 394 mg of DPPH in 10 ml 99,9 % methanol (100 mM) by means of an ultra-wave bath. The received solution then got diluted 1:100 freshly before every new analysis. Thereafter 100 µl of the to be analyzed extract or solution was pipetted in a transparent 96 well plate (Greiner Bio-One) and diluted 11 times in 1:2 steps with its corresponding medium (ethanol or water). For a control, this step was repeated and for blanks, 100 µl of either 40 % ethanol or pure water was given into the wells. Subsequently, the same amount of the 1:100 DPPH-solution was pipetted to each filled well except of the controls, for which 40 % ethanol or pure water was used. For better mixing, the plates got shaken for 20 seconds in the TECAN Spark® Multimode Microplate Reader, before they were incubated at room temperature for half an hour in the dark. Next, the absorbance of each well was measured (TECAN) at a wavelength of 517 nm and the radical scavenging activity calculated from them using the following formula:
rsa [%]=(1-(A-C)/B)*100,
whereas A is the absorbance of the measured sample, C the control (absorbance of samples with ethanol or water instead of DPPH) and B the blank (ethanol or water instead of the samples).

4.2. Cell Culture

4.2.1. Medium Preparation

First 11.996 g/l of Gibco™ DMEM/F-12 powder and 2.438 g/l NaHCO3 were dissolved in pure water with the help of a magnetic stirrer. Then 1 % (of the total volume) of thawed Gibco™ Pen Strep (Cat. No. 15-140-122) was added to the mixture while stirring and together with 10 % SAFC® FBS (Cat. No. 12003C) it got sterile filtrated with a bottle top filter. Before use, FBS was heat sterilized in a water bath for half an hour at 56 °C.

4.2.2. Cells

Human dermal fibroblasts (Krems, Austria) were thawed at a passage number of 7 and cultivated in Greiner Bio-One T-flasks (Cellstar® TC) in DMEM medium. At a passage number of 13 a WCB was established by aliquoting and freezing them in liquid nitrogen at -196°C. When cells were needed for an experiment, individual vials were thawed and passaged to the desired number of cells. For the creation of a growth curve, cells were passaged continuously till passage 26. The calculations for the creation of the graph were as followed:
PDL=〖PDL〗_(n-1)+PD
PD=df/(logPreprints 141568 i001(2))
PD… population doubling
PDL… population doubling level
〖PDL〗_(n-1)…population doubling level passage before
df… dilution factor

4.2.3. Thawing of Cells

Thawing was done by warming the frozen cells in a heated water bath for at least one minute, before they could be filled in a Falcon® tube and centrifuged at 500 rcf for 5 minutes. Afterwards, the received cell pellet was resuspended in fresh DMEM medium and transferred to a new 25 cm2 T-flask with medium already filled in.

4.2.4. Passaging/Harvesting of Cells

Cells were transferred to another flask when they reached a confluency of about 80 %. For this procedure, first the medium of the cells was discarded. Then the cells were washed with PBS (VWR) and treated with 2 ml thawed Trypsin-EDTA (Thermo Fisher Scientific) per 175 cm2 T-flask. After 2–4 minutes incubation at 37 °C, cells were transferred to a centrifugation tube and centrifuged for 5 min at 500 rcf. The received cell pellet then was resuspended in new medium and transferred to another flask with fresh medium already filled in and distributed equally.

4.2.5. Freezing of Cells

After harvesting and centrifuging the cells, they were resuspended in new DMEM medium containing 20 % FBS and pipetted into 1.5 ml cryogenic vials. At last, 10 % DMSO was added, before they were transferred to Nalgene® Mr. Frosty and frozen at -80 °C for one day. Thereafter they were taken to liquid nitrogen at -196 °C.

4.2.6. Cell Counting

To measure the amount of total and viable cells, 20 µl of the cell suspension got mixed with the same amount of trypan blue (Roth) and measured with either the Countess 3 FL Automated Cell Counter (main experiment) or the TECAN Spark® Multimode Microplate Reader (prior experiments).

4.2.7. PrestoBlue™-Assay

Cells got seeded in two transparent 24 well plates (Greiner Bio-One) at a cell density of 3500 cells per cm2 with 1 ml growth medium per well and incubated at 37 °C for one day. Next, one plate was treated with the Sunday Natural, and the other one with the Nature´s Finest extract, 25 µl per well in declining concentrations, beginning undiluted and decreasing in 1:3 steps 5 times. 3 wells on each plate were left out for the untreated controls and in other 3 per plate only 40 % ethanol was added as negative control. After three days of treatment, 100 µl of PrestoBlue™ HS Cell Viability Reagent (Invitrogen, Cat. No. P50200) was pipetted to each well and the plates were incubated again at 37 °C for 3 and a half hours. Lastly, the absorbance of both plates got measured in a 96 well plate in double determination at an excitation wavelength of 560 nm and an emission wavelength of 610 nm (reference wavelength). The viability of the cells was calculated with the following formula:
Viability = (A_sample )/(average A_control )
A… absorbance

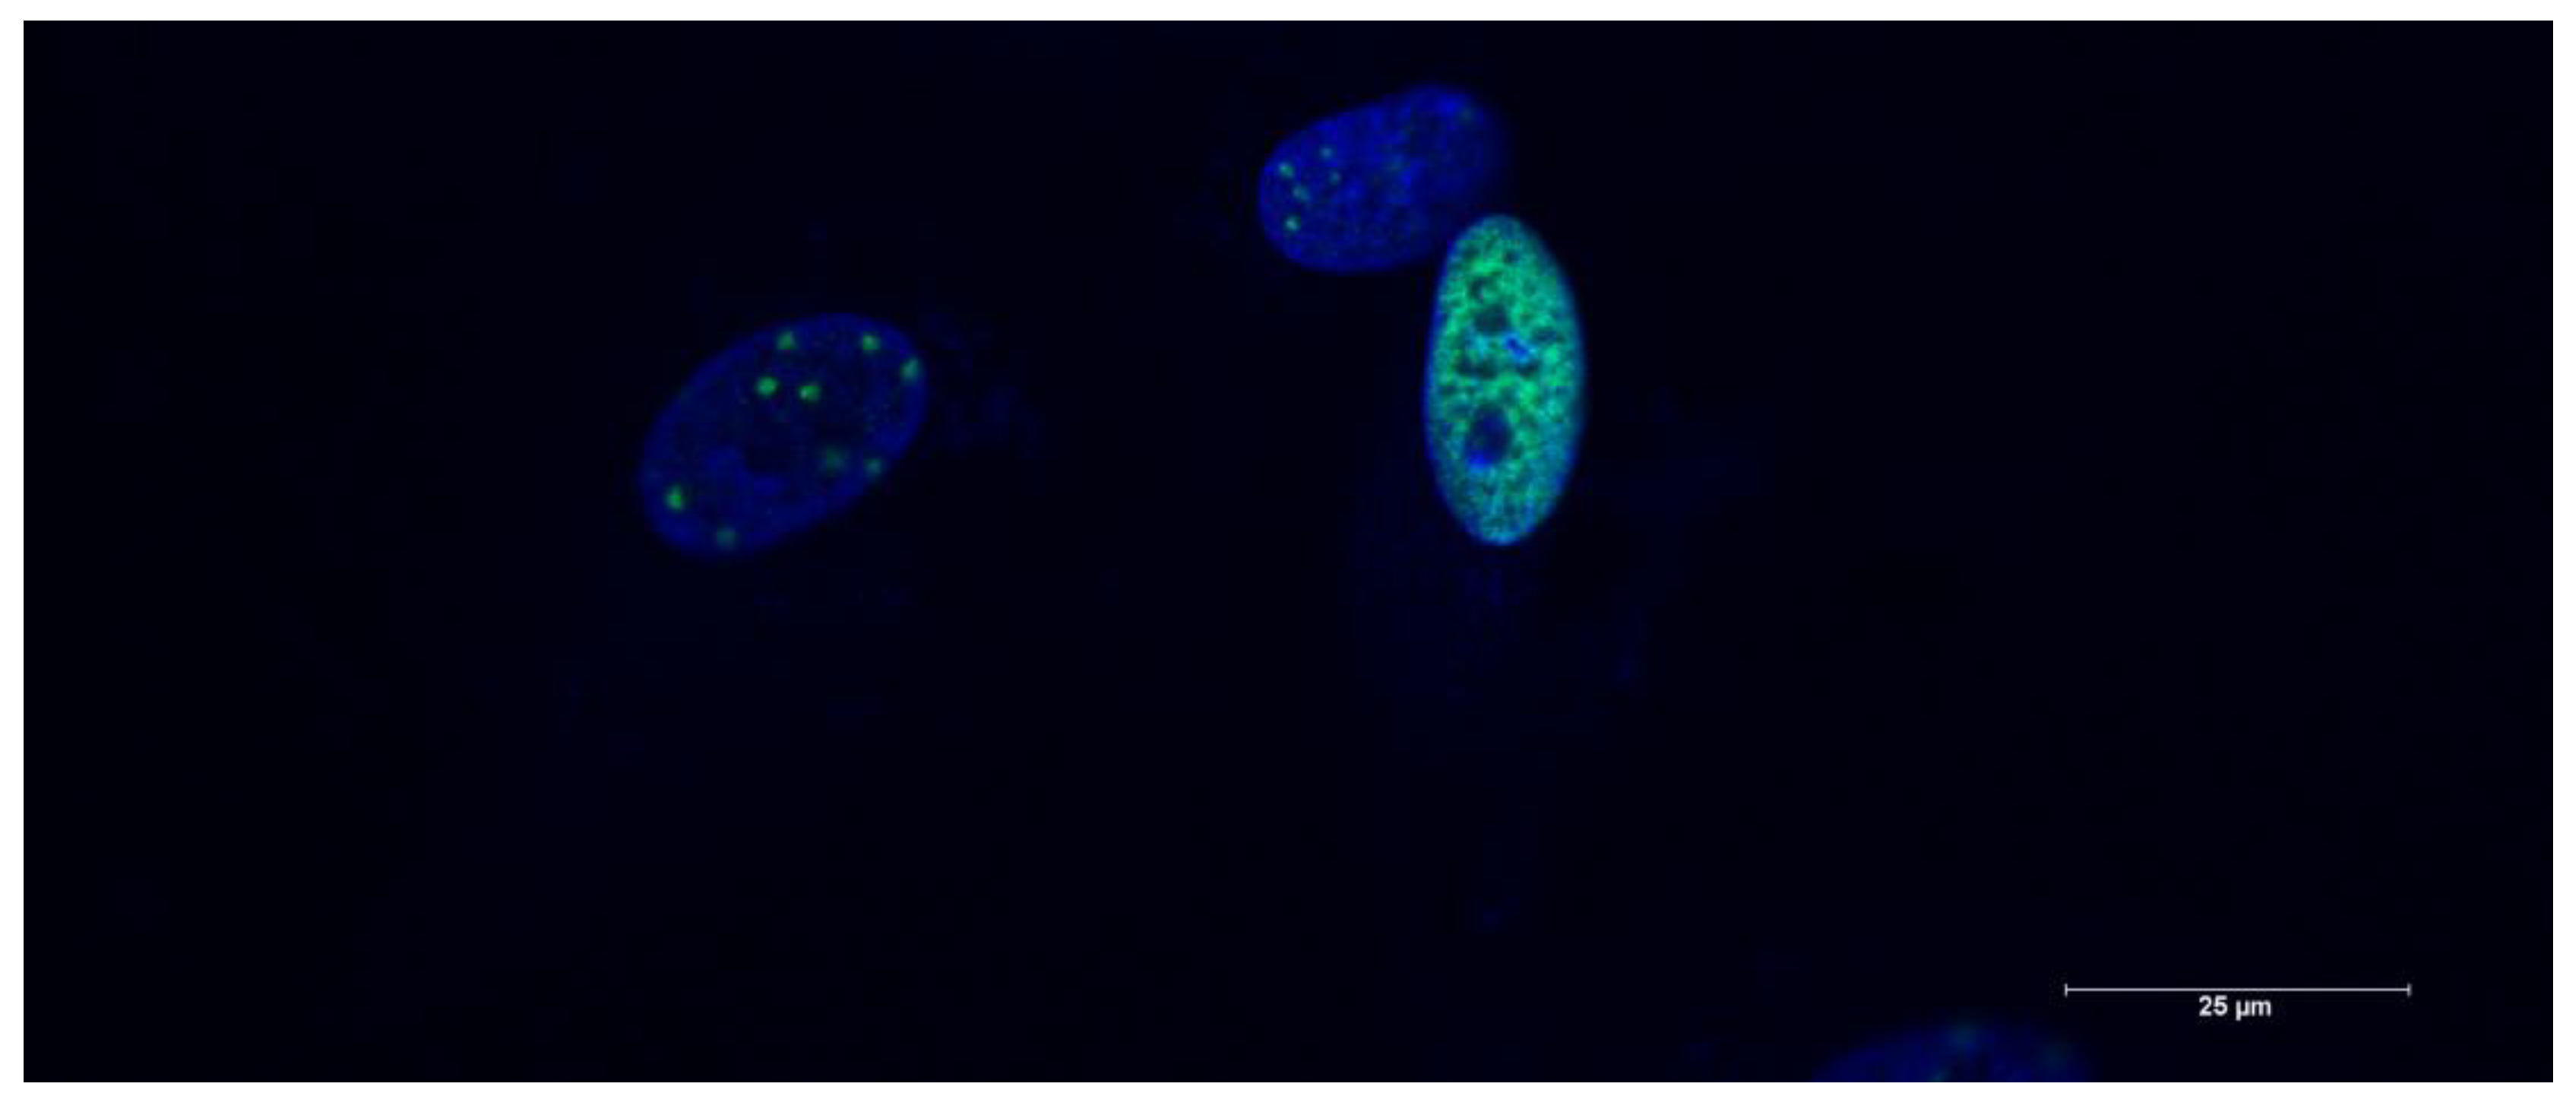
4.2.8. Phospho-Histone H2A.X assay

Was performed the as in Harald Kühnel et al. [10]

4.2.9. Senescence Model

HDFs were treated with 50 µM etoposide in 75 cm2 T-flasks and after two days the medium was changed with regular DMEM growth medium, but cells were still incubated at 37 °C for three to four weeks to let them get fully senescent. During this period the medium was changed twice a week. At the end, cells were harvested by treating them with 2 ml Trypsin-EDTA for around 20 minutes. They were centrifuged and from the received cell pellet RNA was extracted.

4.2.10. Main Experiment

For the main cell culture experiment, cells got passaged till they reached the required cell number for 5 75 cm2 T-flasks (CELLSTAR®) of each treatment group plus 1 for the young untreated control. Before the start of the experiment, cells were harvested and counted, so that the exact volume of cell suspension for the same cell seeding concentration as in the prior cell viability experiments for each flask could be calculated. Then the calculated amount was pipetted to each flask filled with exact 20 ml DMEM growth medium. The next day when the cells were adherent, they got treated with 25 µM etoposide and after two days of incubation the media was changed with for the respective group specific media. There were 6 groups in experiment 1 and 2 and 5 in experiment 3. 4 always were treatment groups, consisting of not only the Reishi “Sunday Natural” and “Nature´s Finest” groups but also of the Sutherlandia and Gallic acid (experiment 1) or Quercetin (experiment 2 and 3) ones, and 1 or two, “medium only without any additional substances” and “ethanol only” (experiment 1 and 2) were controls. The day after and in the following two weeks twice a week, cells from one flask of each group were harvested for qPCR-analyses, 10 ml medium of the same ones frozen to
-80 °C for further analyses and of the respective remaining flasks their group specific medium was changed. Also, cells were counted in the Countess Cell Counter after harvesting them, right before their RNA was extracted. Specific media for the respective group was prepared in freshly autoclaved Duran® Schott bottles and the amount of extract used was proportionally the same as in the first cell culture assays PrestoBlue™ and XTT. Microscopic observations: For observing morphological changes of the cells throughout the cell culture experiments and for microscopic pictures a camera (Olympus) attached to the transmitted light microscope was used.

4.2.11. IL-6 ELISA

For the measurement of IL-6 content in cell-conditioned media, an ELISA kit (Human IL-6 CytoSet™ from Invitrogen™, Carlsbad, CA, USA) was used. An anti-human IL-6 antibody (0.125 mg/0.125 mL) was used as the coating antibody. For detection, an anti-human IL-6 biotin antibody (0.25 mg/0.125 mL) was employed, with streptavidin–HRP facilitating detection. Recombinant human IL-6 was used for calibration. The IL-6 ELISA was carried out following the supplier’s instructions.

4.3. qPCR-Analysis

4.3.1. RNA-Extraction

After harvesting of cells, their RNA was extracted using the RNeasy Mini Kit from QIAGEN. First the samples got centrifuged and their supernatant discarded. Then the received cell pellet was dissolved in 300 or 650 µl RLT buffer containing 10 mol DTT (Roth), depending on the number of cells used. Of DTT a stock solution was prepared, which was then used for all RNA extractions. Subsequently, the same amount of 70 % ethanol was added to every mixture and after homogenizing by pipetting, they were centrifuged for 15 seconds at 8 g. The flowthrough after this and the following three steps always got discarded. Thereafter, 700 µl of wash buffer was added to each spin column and centrifuged for 15 seconds again. Next, 500 µl RLT buffer was given to the columns twice, with the first time a centrifugation of 15 sec and the second time for two minutes. Afterwards the spin columns were dried in new collection tubes while centrifuging for one minute at max speed and lastly, in a new smaller collection tube the RNA got eluted with 40 µl of pure water at a centrifugation of 1 minute at 8 g and immediately frozen to -80 °C if not subsequently synthesized to cDNA.

4.3.2. Measurement of RNA and DNA

For the measurement of the extracted RNA, the Invitrogen™ Qubit™ RNA BR Assay Kit was used. First a working solution was prepared by diluting the Qubit™ RNA BR Reagent 1:200 with its RNA BR Buffer. Then, for measurement of the samples, 2 – 10 µl of them were added to 198 –190 µl (total 200 µl) of the freshly prepared working solution and 10 µl of each of the two standards to 190 µl working solution as well. They were vortexed for 4 seconds and after a two-minute incubation at room temperature, the RNA content was measured with the Qubit 2.0 fluorometer. For the DNA measurement, the Qubit™ 1X dsDNA BR Assay Kit with premade working solution was utilized, involving the same procedure as for the RNA measurement.

4.3.3. cDNA-Synthesis

The measured RNA concentration was used to calculate the RNA-sample volume + additional nuclease free water (Roth) for a concentration of 100 ng or 1 µg per 15 of 20 µl reaction volume. per. The remaining 5 µl were composed of 1 µl iScript™ Reverse Transcriptase (Bio-Rad) and 4 µl 5x iScript Reaction Mix. After mixing all substances in 0.2 ml PCR SingleCap reaction tubes (Biozym) together, they were taken into the MJ Research PTC-200 Gradient Thermal Cycler and incubated according to Table 1. Lids were set to heated.

4.3.4. Core Procedure

4.3.4.1. Primer Preparation

Before the bought primer pairs (Microsynth) could be used, they were centrifuged shortly and afterwards the stated amount of nuclease free water for reaching 100 µM was pipetted to the respective forward and reverse primers. Then the primer pairs were diluted in 1.5 ml Eppendorf tubes® 1:10 (per individual primer), 1:100 as final concentration for the qPCR analyses and stored at -20 °C till use.

4.3.4.2. qPCR Execution and Evaluation

The reaction volume of each PCR 0.1 ml Tube (Biozym) was 10 µl, consisting of 5 µl iTaq Universal SYBR® Green Supermix (Bio-Rad), 3 µl of the respective 1:100 diluted primer pair and 2 µl of the respective diluted cDNA sample. For most of the analyses a master mix was created with SYBR® Green and the diluted primer pair and the cDNA sample was added last to the qPCR tubes. After all tubes were filled, they got closed and subsequently transferred to the Corbett (Qiagen) Research Rotor-Gene 6000 Real-Time PCR machine for the amplification and detection process (Table 2). All operations till this step were performed on ice. Also, the AriaMx Real-Time PCR System was utilized for a few analyses due to a defect of the monitor for the Rotor-Gene System, but the main experiments were still carried out on this machine.
The Melt Curve Analysis was ramped from 65 °C to 95 °C in 0.5 °C steps, 5 seconds each. Both qPCR melt and quantitation curves were created with the program of the Rotor-Gene machine. The threshold of the quantitation curves was always set to 0.02.

4.3.5. Screening of Genes

4.3.5.1. Comparison of Gene Expression Between Young and Old Cells

Primers for many genes associated with oxidative stress, skin matrix and aging in general as well as for suitable reference genes for human dermal fibroblasts were searched in the literature (Table 3) and tested for their gene-expression in not only young but also senescent cells with qPCR in duplicates. The formula used was as followed:
fold change=2^((-∆∆Ct))
∆∆Ct=〖∆Ct〗_(treated sample)-〖∆Ct〗_(untreated sample)
〖∆Ct〗_(treated s.)=〖Ct〗_(GOI treated)-〖Ct〗_(ref.gene treated )
〖∆Ct〗_(untreated s.)=〖Ct〗_(untreated GOI)-〖Ct〗_(untreated ref.gene)
GOI…gene of interest
Table 3: Primer-sequences of all used reference genes and genes of interest.

4.3.5.2. Further Evaluation through Standard Curves

Of most of the genes, especially of those which had a high difference in expression and rather low Ct values, primers were tested further for their efficiency and standard curve linearity. Standard curves were created by making a dilution series of at least 9 1:10 steps with nuclease free water (Roth) in 1.5- or 2.0-ml Eppendorf tubes. Also, special attention has been paid to the linear range of them, since the Ct-values of the treated and untreated samples had to lie in that zone for their eligibility. The formula for the calculation of the efficiencies was as followed:
E=(〖10〗^((-1/slope) )-1)*100
Whereas E is the efficiency in % and slope the gradient of the calibration curve.

4.3.6. Main Experiment

RNA samples were synthesized to cDNA at a concentration of 1 µg per 20 µl assay volume. Thereafter they were diluted 1:30 and aliquoted before they were frozen at -80 °C for the following qPCR analyses.
The formular for calculating the relative gene expression of every tested gene in the final main experiment was as followed:
relative gene expression=〖RQ〗_GOI/(geom.mean[RQ]_(ref.genes) )
〖RQ〗_GOI=(E+1)^(∆Ct GOI)
〖RQ〗_(ref.genes)=(E+1)^(∆Ct ref.gene)
∆Ct GOI=average Ct control-〖Ct〗_GOI
∆Ct ref.gene=average 〖Ct〗_control -〖Ct〗_(ref.gene)
RQ…relative quantities
GOI…gene of interest
E…efficiency of the standard curve

4.4. Statistics

All analyses were done by Prism 10 for Windows 64-bit Version 10.4.0 (621) Oktober 23, 2024. Normality was checked by Shapiro-Wilk test, differences between groups were calculated by simple ANOVA. As well as linear and non linear regression was also performed nonlinear regression for ELISA was done by variable slope (four parameters).

5. Conclusions

Nevertheless, in conclusion, the results suggest that Ganoderma lucidum extract may have potential in modulating cellular senescence in dermal fibroblasts, primarily through enhanced antioxidant defense and cytoprotection mechanisms. The suppression of p16 expression and the senolytic properties observed are particularly promising. However, the lack of effect on extracellular matrix-related genes suggests that Reishi's benefits may be limited to certain aspects of cellular aging. Further research is needed to fully elucidate the mechanisms of action and potential applications of Reishi extract in combating skin aging.

6. Patents

Not applicable.

Author Contributions

For research articles with several authors, a short paragraph specifying their individual contributions must be provided. The following statements should be used “Conceptualization, M.S and H.K.; methodology, M.S , A.E. and H.K.; validation, M.S.; formal analysis, M.S..; investigation, M.S and H.K.; resources, H.K and M.M.; data curation, A.E., H.K, B.F. and M.S..; writing—original draft preparation, H.K..; writing—review and editing, A.E. M.S., B.F. and M.M. visualization, H.K., A.E, B.F. and M.S.; supervision M.M. H.K., A.E. and B.F; project administration, H.K. A.E.; funding acquisition, H.K. All authors have read and agreed to the published version of the manuscript

Funding

This research was funded by FH Campus Wien, Anschubfinanzierung no grant number and The APC was funded by Publikationsscheck of FH Campus Wien

Institutional Review Board Statement

Not applicable. Human cell line was purchased from a commercial company.

Informed Consent Statement

Not applicable

Data Availability Statement

Not applicable

Acknowledgments

We want to thank Tuja Munkh for technical assistance during her bachelor thesis.

Conflicts of Interest

The authors declare no conflicts of interest.

References

  1. Hayflick, L. The Limited in Vitro Lifetime of Human Diploid Cell Strains. Exp Cell Res 1965, 37, 614–636. [Google Scholar] [CrossRef] [PubMed]
  2. Hayflick, L.; Moorhead, P.S. The Serial Cultivation of Human Diploid Cell Strains. Exp Cell Res 1961, 25, 585–621. [Google Scholar] [CrossRef]
  3. Velarde, M.C.; Demaria, M.; Campisi, J. Senescent Cells and Their Secretory Phenotype as Targets for Cancer Therapy. In Cancer and Aging: From Bench to Clinics; 2013 ISBN 9783318023077.
  4. Zorina, A.; Zorin, V.; Isaev, A.; Kudlay, D.; Vasileva, M.; Kopnin, P. Dermal Fibroblasts as the Main Target for Skin Anti-Age Correction Using a Combination of Regenerative Medicine Methods. 2023. [CrossRef]
  5. Chin, T.; Er Lee, X.; Yi Ng, P.; Lee, Y.; Dreesen, O. The Role of Cellular Senescence in Skin Aging and Age-Related Skin Pathologies. 2023. [CrossRef]
  6. Herranz, N.; Gil, J. Mechanisms and Functions of Cellular Senescence. Journal of Clinical Investigation 2018, 128, 1238–1246. [Google Scholar] [CrossRef] [PubMed]
  7. Di Micco, R.; Krizhanovsky, V.; Baker, D.; dAdda di Fagagna, F. Cellular Senescence in Ageing: From Mechanisms to Therapeutic Opportunities. [CrossRef]
  8. Waters, D.W.; Schuliga, M.; Pathinayake, P.S.; Wei, L.; Tan, H.-Y.; Blokland, K.E.C.; Jaffar, J.; Westall, G.P.; Burgess, J.K.; Prêle, C.M.; et al. A Senescence Bystander Effect in Human Lung Fibroblasts. 2021. [CrossRef]
  9. Petrova, N. V; Velichko, A.K.; Razin, S. V; Kantidze, O.L. Small Molecule Compounds That Induce Cellular Senescence. Aging Cell 2016, 15, 999–1017. [Google Scholar] [CrossRef]
  10. Kühnel, H.; Pasztorek, M.; Kuten-Pella, O.; Kramer, K.; Bauer, C.; Lacza, Z.; Nehrer, S. Effects of Blood-Derived Products on Cellular Senescence and Inflammatory Response: A Study on Skin Rejuvenation. Curr Issues Mol Biol 2024, 46, 1865–1885. [Google Scholar] [CrossRef]
  11. Imb, M.; Véghelyi, Z.; Maurer, M.; Kühnel, H. Exploring Senolytic and Senomorphic Properties of Medicinal Plants for Anti-Aging Therapies. J. Mol. Sci 2024, 25. [Google Scholar] [CrossRef]
  12. Odeh, A.; Dronina, M.; Domankevich, V.; Shams, I.; Manov, I. Downregulation of the Inflammatory Network in Senescent Fibroblasts and Aging Tissues of the Long-Lived and Cancer-Resistant Subterranean Wild Rodent, Spalax. Aging Cell 2020, 19, e13045. [Google Scholar] [CrossRef]
  13. Georget, M.; Defois, A.; Guiho, R.; Bon, N.; Allain, S.; Boyer, C.; Halgand, B.; Waast, D.; Grimandi, G.; Fouasson-Chailloux, A.; et al. Development of a DNA Damage-Induced Senescence Model in Osteoarthritic Chondrocytes. Aging 2023, 15, 8576–8593. [Google Scholar] [CrossRef]
  14. Zhang, J.; Yu, H.; Man, M.; Hu, L. Aging in the Dermis: Fibroblast Senescence and Its Significance. Aging Cell 2024, 23. [Google Scholar] [CrossRef]
  15. Huang, W.; Hickson, L.J.; Eirin, A.; Kirkland, J.L.; Lerman, L.O.; Kogod, A. Cellular Senescence: The Good, the Bad and the Unknown. Nat Rev Nephrol 2022, 18, 611. [Google Scholar] [CrossRef]
  16. Nousis, L.; Kanavaros, P.; Barbouti, A. Oxidative Stress-Induced Cellular Senescence: Is Labile Iron the Connecting Link? Antioxidants 2023, 12, 1250. [Google Scholar] [CrossRef] [PubMed]
  17. Nandita H; Manohar M; Gowda DV Recent Review on Oxidative Stress, Cellular Senescence and Age-Associated Diseases. International Journal of Research in Pharmaceutical Sciences 2020, 11, 1331–1342. [CrossRef]
  18. Cuong, V.T.; Chen, W.; Shi, J.; Zhang, M.; Yang, H.; Wang, N.; Yang, S.; Li, J.; Yang, P.; Fei, J. The Anti-Oxidation and Anti-Aging Effects of Ganoderma Lucidum in Caenorhabditis Elegans. Exp Gerontol 2019, 117, 99–105. [Google Scholar] [CrossRef]
  19. Yuan, H.; Xu, Y.; Luo, Y.; Zhang, J.; Zhu, X.; Xiao, J. Ganoderic Acid D Prevents Oxidative Stress-induced Senescence by Targeting 14-3-3ε to Activate CaM / CaMKII / NRF2 Signaling Pathway in Mesenchymal Stem Cells. Aging Cell 2022, 21. [Google Scholar] [CrossRef]
  20. Xu, Y.; Yuan, H.; Luo, Y.; Zhao, Y.-J.; Xiao, J.-H. Ganoderic Acid D Protects Human Amniotic Mesenchymal Stem Cells against Oxidative Stress-Induced Senescence through the PERK/NRF2 Signaling Pathway. Oxid Med Cell Longev 2020, 2020, 1–18. [Google Scholar] [CrossRef]
  21. Araujo, J.A.; Zhang, M.; Yin, F.; Maines, M.D. Heme Oxygenase-1, Oxidation, Inflammation, and Atherosclerosis. 2012. [CrossRef]
  22. Kim, H.J.; Zheng, M.; Kim, S.-K.; Cho, J.J.; Shin, C.H.; Joe, Y.; Chung, H.T. CO/HO-1 Induces NQO-1 Expression via Nrf2 Activation. Immune Netw 2011, 11, 376. [Google Scholar] [CrossRef]
  23. Abdelmoaty, A.A.A.; Chen, J.; Zhang, K.; Wu, C.; Li, Y.; Li, P.; Xu, J. Senolytic Effect of Triterpenoid Complex from Ganoderma Lucidum on Adriamycin-Induced Senescent Human Hepatocellular Carcinoma Cells Model in Vitro and in Vivo. Front Pharmacol 2024, 15. [Google Scholar] [CrossRef]
  24. Wanqing, S.; Yishi, W.; Yang, Z.; Nanhu, Q. The Emerging Role of Sestrin2 in Cell Metabolism, and Cardiovascular and Age-Related Diseases. Aging Dis 2020, 11, 154. [Google Scholar] [CrossRef]
  25. Pan, C.; Chen, Z.; Li, C.; Han, T.; Liu, H.; Wang, X. Sestrin2 as a Gatekeeper of Cellular Homeostasis: Physiological Effects for the Regulation of Hypoxia-related Diseases. J Cell Mol Med 2021, 25, 5341–5350. [Google Scholar] [CrossRef]
  26. Gonzalez-Mercado, V.J.; Fridley, B.L.; Saligan, L.N. Sestrin Family of Genes and Their Role in Cancer-Related Fatigue. Supportive Care in Cancer 2018, 26, 2071–2074. [Google Scholar] [CrossRef]
  27. Xia, W.; Hammerberg, C.; Li, Y.; He, T.; Quan, T.; Voorhees, J.J.; Fisher, G.J. Expression of Catalytically Active Matrix Metalloproteinase-1 in Dermal Fibroblasts Induces Collagen Fragmentation and Functional Alterations That Resemble Aged Human Skin. [CrossRef]
  28. Hayami, T.; Kapila, Y.L.; Kapila, S. MMP-1 (Collagenase-1) and MMP-13 (Collagenase-3) Differentially Regulate Markers of Osteoblastic Differentiation in Osteogenic Cells. Matrix Biology 2008, 27, 682–692. [Google Scholar] [CrossRef] [PubMed]
  29. Milara, J.; Hernandez, G.; Ballester, B.; Morell, A.; Roger, I.; Montero, P.; Escrivá, J.; Lloris, J.M.; Molina-Molina, M.; Morcillo, E.; et al. The JAK2 Pathway Is Activated in Idiopathic Pulmonary Fibrosis. Respir Res 2018, 19, 24. [Google Scholar] [CrossRef] [PubMed]
  30. Silvennoinen, O.; Hubbard, S.R. Molecular Insights into Regulation of JAK2 in Myeloproliferative Neoplasms. Blood 2015, 125, 3388–3392. [Google Scholar] [CrossRef] [PubMed]
  31. Kirkland, J.L.; Tchkonia, T. Senolytic Drugs: From Discovery to Translation. J Intern Med 2020, 288, 518–536. [Google Scholar] [CrossRef] [PubMed]
  32. Wong, L.P.; Alias, H.; Tan, K.M.; Wong, P.F.; Murugan, D.D.; Hu, Z.; Lin, Y. Exploring the Perspectives of Pharmaceutical Experts and Healthcare Practitioners on Senolytic Drugs for Vascular Aging-Related Disorder: A Qualitative Study. Front Pharmacol 2023, 14. [Google Scholar] [CrossRef]
  33. Hernandez-Segura, A.; Rubingh, R.; Demaria, M. Identification of Stable Senescence-associated Reference Genes. Aging Cell 2019, 18. [Google Scholar] [CrossRef]
  34. Marionnet, C.; Pierrard, C.; Lejeune, F.; Sok, J.; Thomas, M.; Bernerd, F. Different Oxidative Stress Response in Keratinocytes and Fibroblasts of Reconstructed Skin Exposed to Non Extreme Daily-Ultraviolet Radiation. PLoS One 2010, 5, e12059. [Google Scholar] [CrossRef]
  35. Patwardhan, J.; Bhatt, P. Flavonoids Derived from Abelmoschus Esculentus AttenuatesUV-B Induced Cell Damage in Human Dermal Fibroblasts ThroughNrf2-ARE Pathway. Pharmacogn Mag 2016, 12, 129. [Google Scholar] [CrossRef]
  36. Marcheggiani, F.; Kordes, S.; Cirilli, I.; Orlando, P.; Silvestri, S.; Vogelsang, A.; Möller, N.; Blatt, T.; Weise, J.M.; Damiani, E.; et al. Anti-Ageing Effects of Ubiquinone and Ubiquinol in a Senescence Model of Human Dermal Fibroblasts. Free Radic Biol Med 2021, 165, 282–288. [Google Scholar] [CrossRef]
  37. Caporarello, N.; Meridew, J.A.; Jones, D.L.; Tan, Q.; Haak, A.J.; Choi, K.M.; Manlove, L.J.; Prakash, Y.S.; Tschumperlin, D.J.; Ligresti, G. PGC1α Repression in IPF Fibroblasts Drives a Pathologic Metabolic, Secretory and Fibrogenic State. Thorax 2019, 74, 749–760. [Google Scholar] [CrossRef]
  38. Varma, S.R.; Sivaprakasam, T.O.; Mishra, A.; Kumar, L.M.S.; Prakash, N.S.; Prabhu, S.; Ramakrishnan, S. Protective Effects of Triphala on Dermal Fibroblasts and Human Keratinocytes. PLoS One 2016, 11, e0145921. [Google Scholar] [CrossRef] [PubMed]
  39. Noh, E.-M.; Lee, G.; Lim, C.-H.; Kwon, K.B.; Kim, J.-M.; Song, H.-K.; Yang, H.J.; Kim, M.J.; Kim, M.; Lee, Y.-R. Protective Effects of Evodiae Fructus Extract against Ultraviolet-Induced MMP-1 and MMP-3 Expression in Human Dermal Fibroblasts. J Herb Med 2022, 35, 100586. [Google Scholar] [CrossRef]
  40. Lin, C.-C.; Chiang, T.-H.; Chen, W.-J.; Sun, Y.-Y.; Lee, Y.-H.; Lin, M.-S. CISD2 Serves a Novel Role as a Suppressor of Nitric Oxide Signalling and Curcumin Increases CISD2 Expression in Spinal Cord Injuries. Injury 2015, 46, 2341–2350. [Google Scholar] [CrossRef] [PubMed]
  41. Yu, S.-L.; Lee, S.-I.; Park, H.-W.; Lee, S.K.; Kim, T.-H.; Kang, J.; Park, S.-R. SIRT1 Suppresses in Vitro Decidualization of Human Endometrial Stromal Cells through the Downregulation of Forkhead Box O1 Expression. Reprod Biol 2022, 22, 100672. [Google Scholar] [CrossRef] [PubMed]
  42. Xie, L.; Yin, W.; Tang, F.; He, M. Pan-Cancer Analysis of TERT and Validation in Osteosarcoma Cell Lines. Biochem Biophys Res Commun 2023, 639, 106–116. [Google Scholar] [CrossRef]
  43. Frohlich, J.; Mazza, T.; Sobolewski, C.; Foti, M.; Vinciguerra, M. GDF11 Rapidly Increases Lipid Accumulation in Liver Cancer Cells through ALK5-Dependent Signaling. Biochimica et Biophysica Acta (BBA) - Molecular and Cell Biology of Lipids 2021, 1866, 158920. [Google Scholar] [CrossRef]
  44. Wu, H.; Wang, J.; Zhao, Y.; Qin, Y.; Chen, X.; Zhou, Y.; Pang, H.; Xu, Z.; Liu, X.; Yu, Y.; et al. Extracellular Vesicles Derived from Human Dermal Fibroblast Effectively Ameliorate Skin Photoaging via MiRNA-22-5p-GDF11 Axis. Chemical Engineering Journal 2023, 452, 139553. [Google Scholar] [CrossRef]
  45. Freund, A.; Laberge, R.-M.; Demaria, M.; Campisi, J. Lamin B1 Loss Is a Senescence-Associated Biomarker. Mol Biol Cell 2012, 23, 2066–2075. [Google Scholar] [CrossRef]
  46. Freund, A.; Laberge, R.-M.; Demaria, M.; Campisi, J. Lamin B1 Loss Is a Senescence-Associated Biomarker. Mol Biol Cell 2012, 23, 2066–2075. [Google Scholar] [CrossRef]
  47. Liew, E.L.; Araki, M.; Hironaka, Y.; Mori, S.; Tan, T.Z.; Morishita, S.; Edahiro, Y.; Ohsaka, A.; Komatsu, N. Identification of AIM2 as a Downstream Target of JAK2V617F. Exp Hematol Oncol 2015, 5, 2. [Google Scholar] [CrossRef]
  48. Sagiv, A.; Krizhanovsky, V. Immunosurveillance of Senescent Cells: The Bright Side of the Senescence Program. Biogerontology 2013, 14, 617–628. [Google Scholar] [CrossRef] [PubMed]
  49. Zeisbrich, M.; Chevalier, N.; Sehnert, B.; Rizzi, M.; Venhoff, N.; Thiel, J.; Voll, R.E. CMTM6-Deficient Monocytes in ANCA-Associated Vasculitis Fail to Present the Immune Checkpoint PD-L1. Front Immunol 2021, 12. [Google Scholar] [CrossRef] [PubMed]
  50. Duan, F.; Wang, X.; Wang, H.; Wang, Y.; Zhang, Y.; Chen, J.; Zhu, X.; Chen, B. GDF11 Ameliorates Severe Acute Pancreatitis through Modulating Macrophage M1 and M2 Polarization by Targeting the TGFβR1/SMAD-2 Pathway. Int Immunopharmacol 2022, 108, 108777. [Google Scholar] [CrossRef] [PubMed]
  51. Stavreva, D.A.; Varticovski, L.; Levkova, L.; George, A.A.; Davis, L.; Pegoraro, G.; Blazer, V.; Iwanowicz, L.; Hager, G.L. Novel Cell-Based Assay for Detection of Thyroid Receptor Beta-Interacting Environmental Contaminants. Toxicology 2016, 368–369, 69–79. [Google Scholar] [CrossRef] [PubMed]
Figure 1. Definition of reagent mushroom extract (Reishi, Ganoderma lucidum): (a) comparisons of different extracts of Reishi over time, mean anti-oxidative power is shown by the curves. Standard deviations are quite high but comparable to the vitamin C standard indicating not the best reproducibility of DPPH assay. Values are expressed in % radical scavenging activity (formula can be found in methods section); (b) Polyphenol content determination expressed in mg galic acid equivalents per g of weighted in powder of mushroom; (c) checking dry weight to estimate the optimal extraction time for mushroom extracts the same amount of mushroom powder was weighted in but different amounts of substances got dissolved in ethanolic extraction solution (40 %).
Preprints 141568 g001
Figure 2. image of Etoposide treated dermal Fibroblast cells stained for үH2AX green dots indicating foci of positive staining due to strand-break formation blue nuclei were stained by DAPI.
Preprints 141568 g002
Figure 3. Verifying the establishment of senescent state (a) counting of SA-ß-Gal positive cells in low population doubling (Y) cells and Etoposide treated cells (O); (b) pPCR results of comparison of Y and O cells regarding p16 (INK4A) expression. 14 days after exposure to Etoposide for 48 h cells are senescent.
Preprints 141568 g003
Figure 4. Gene expression in Etoposide senescent cells: (a) relevant genes of antioxidative stress response; (b) genes of the SASP and extracellular matrix and markers of cellular senescence.
Preprints 141568 g004
Figure 5. Growth curves of HDF (a) Growth curve of HDF in logarithmic scale Growing cells are cells that were not Etoposide treated. These cells continue growth until they get dense. Other treatments were Etoposide treated and a clear decrease in growth rate can be observed; (b) day 14 of treatment is presented in right image. Columns represent different treatments. Here, significant differences between Reishi (Nature’s Finest and Sunday Natural) treatments and control without can be observed. Solvent treatment (control ethanol) shows an even lower growth rate. Significances mean: < 0.05 (*); < 0.01 (**); < 0.001 (***);.
Preprints 141568 g005
Figure 6. SASP (a) IL-6 expression on protein levels uncovers a slight expression of IL-6 in all groups but a clear lesser expression in Reishi treated groups; (b) day 14 of treatment show significant differences in IL-6 expression between control and Reishi treated groups; (c) When IL-6 is related to cell numbers the senomorphic effect can also be seen and in (d) the bar graph it is even more visible. Significances mean: < 0.05 (*); < 0.01 (**); < 0.001 (***).
Preprints 141568 g006
Figure 7. Senolytic properties of Reishi extract: (a) Toxicity study of ethanolic Reishi extract, Etoposide treated (O) cells show a response in this presto blue assay with an IC50 value of 38,5 µg/ml; (b) decrease in senescent HDF by Reihi treatment is observed in a SA-ß-Gal assay; (c) ANOVA of data of b * indicates a significance level of 95 % (data already published in [11]). Significances mean: < 0.05 (*); < 0.01 (**); < 0.001 (***);.
Preprints 141568 g007
Figure 8. Mitochondria associated gene expression: (a) the dotted line labeled with seed is indicating the beginning of the experiment where cells were seeded in the T-flask and ETO (Etoposide) at the beginning of the red area indicating the Etoposide treatment for 48 h. SOD2 if any it is about the half downregulated by Etoposide treatment but there is no difference in the extract or control treatments; (b) CISD2 is also not affected by treatment and the pattern is quite equal between groups.
Preprints 141568 g008
Figure 9. Sestrin expression: (a) Sestrin 1 (SESN1) expression is induced in all treatemts and comparably higher in Reishi treated cells than in non-extract treated control; (b) Sestrin 2 (SESN2) expression is downregulated in all treatment groups. There are no differences between groups.
Preprints 141568 g009
Figure 10. extracellular matrix associated gene expression: (a) Collagen 1 (ColA1) is moderately upregulated in all treatment groups in the beginning of the treatment but downregulated at day 14 also in all treatment and control conditions; (b) MMP1 is massively induced by Etoposide treatment, while there is no difference between control without extract and Reishi treated samples ethanol control is behaving differently but after 14 d it is also upregulated. Axis is in logarithmic scale due to big differences in expression; (c) JAK2 mRNA expression is not affected by all treatments.
Preprints 141568 g010
Figure 11. Antioxidant defense and cytoprotection gene expression: (a) HO-1 is upregulated in Reishi treated groups compared to control without extract treatment the expression rises fast and stays high over the whole period tested; (b) γGCS-L is also upregulated but rises the whole period Reishi values are about double than control group (c) NQO1 has a similar pattern like HO-1 but is not that differentially express compared to control group; (d) Nrf2 is equal between control group and Reishi treated group and a little downregulated by Etoposide treatment but rises to norma condition after 14 days.
Preprints 141568 g011
Figure 12. Cell cycle and senescence associated genes: (a) p21 (CDKN1A) the upregulation of p21 is delayed in the control without group compared to Reishi extract groups; (b) p16 (CDKN2A) is kept at negative to no induction by Reishi treatment.
Preprints 141568 g012
Table 1. Steps for the thermocycler.
Priming Reverse Transcription Inactivation Hold
Temperature [°C] 25 46 95 4
Duration [min] 5 20 1 10
Table 2. temperature program.
Polymerase activation Denaturation Annealing
Temperature [°C] 95 95 60
Duration [sec] 30 5 30
Cycles 1 40
Table 3. Genes, primers and references that were analyzed in qPCR experiments in fat letters are the used housekeeping genes.
Gene name Forward sequence (5´-3´) Backwards sequence (5´-3´) Ref.
TUBA1A1 CTTCGTCTCCGCCATCAG CGTGTTCCAGGCAGTAGAGC [33]
VAMP7 CAAACATGCTTGGTGTGGAG AAATTAAAGGCTCGGGAACG [33]
TMEM199 CACCAGCATCTGAGAGAAAGG CCGTGGAGGCTTCACAAC [33]
L3MBTL2 CCAAGACCAAGAGGTTCTGC TTTGGTCGGTGGTTTTCC [33]
NRF2 CGGTATGCAACAGGACATTG GTTGGGGTCTTCTGTGGAGA [34]
KEAP1 CACAGCAATGAACACCATCC TGTGACCATCATAGCCTCCA [34]
BACH1 TGTGCTTAGAGAAGGATGCTGCTC TCTTCGTTTCTTCAGGTTCCATTGC [34]
HO-1 1 GAGACGGCTTCAAGCTG GTGTGTAGGGGATGACC [34]
HO-1 2 GAGGAGTTGCAGGAGCTGCT GAGTGTAAGGACCCATCGGA [35]
FTL TCTCGGCCATCTCCTGCTTCTG CGCCTTCCAGAGCCACATCATC [34]
FTH GCCGCCGCCTCTCCTTAGTC CAGTTTCTCAGCATGTTCCCTCTCC [34]
NQO1 CGGCTTTGAAGAAGAAAGG CTCGGCAGGATACTGAA [34]
γ GCS-L TCACCTCCTATTGAAGATGG GGTTACTATTTGGTTTTACCTGT [34]
γ GCS-H GCAGAGGAGTACACCC CCACTTCCATGTTTTCAAGG [34]
TXNRD1 CCTATGTCGCTTTGGAG CCCTACGGTTTCTAAGCC [34]
TXN CTGCTTTTCAGGAAGCCTTG ACCCACCTTTTGTCCCTTCT [34]
GSHPx GGCTACTCTCTCGTTTCCTTTC GTTCTTGGCGTTCTCCTACAG [34]
SOD1 AGTGCAGGGCATCATCAATTTCGAGCAG GATGCAATGGTCTCCTGAGAGTGAGATC [34]
SOD2 1 GTCACCGAGGAGAAGTACCAGGAG CACCAACAGATGCAGCCGTCAG [34]
CAT CATTCGATCTCACCAAGGTTTGGCC AGCACGGTAGGGACAGTTCACAGG [34]
SESN1-T1 GGCAAACCATTTTGAGGAAA TGGTCCCTGTCCTAGTGGTC [34]
SESN1-T2 GCTGGGCTGCAAGCAGTG CCAAGTTCCTCGTCCTGGT [34]
SESN2 GCACCTACACCCCCTAGTGA GTCTTCCACAAAGCACAGCA [34]
SESN3 AGTGCTGCGGAAGGATAAAA CCATGCGCAACATGTAAAAC [34]
Col1A1 1 AGACATCCCACCAATCACCTG GGCAGTTCTTGGTCTCGTCAC [36]
Col1A1 2 AAGGGACACAGAGGTTTCAGTGG CAGCACCAGTAGCACCATCATTTC [37]
ELN GCCCCTGGATAAAAGACTCC GTCCTCCTGCTCCTGCTGT [38]
MMP1 AGTGACTGGGAAACCAGATGCTGA CTCTTGGCAAATCTGGCCTGTAA [39]
MMP3 CTGGACTCCGACACTCTGGA CAGGAAAGGTTCTGAAGTGACC [39]
CISD2 TCCCAGTCCCTGAAAGCATT ACGAACTGCAAGGTAGCCAAGA [40]
SIRT1 AGCCTTGTCAGATAAGGAAGGA ACAGCTTCACAGTCAACTTTGT [41]
TERT CACCTGCCGTCTTCACTTCC GTGAACAATGGCGAATCTGG [42]
GDF11 1 CCACCACCGAGACCGTCATT GAGGGCTGCCATCTGTCTGT [43]
GDF11 2 GCAAACTGCGGCTCAAGG GCTAATGACGGTCTCGGTGG [44]
FOXO1 TCATGTCAACCTATGGCAG CATGGTGCTTACCGTGTG [41]
LMNB1 1 AAGCAGCTGGAGTGGTTGTT TTGGATGCTCTTGGGGTT [45]
LMNB1 2 GGGAAGTTTATTCGCTTGAAGA ATCTCCCAGCCTCCCATT [46]
JAK2 TCTGGGGAGTATGTTGCAGAA AGACATGGTTGGGTGGATACC [47]
MICA TAAAATCCGGCGTAGTCCTG GCATGTCACGGTAATGTTGC [48]
PD-L1 TGGCATTTGCTGAACGCATTT TGCAGCCAGGTCTAATTGTTTT [49]
ULBP1 CCTGGAGCCTTCTCATCATC AGGCCTTGAACTTCACACCA [48]
ULBP2 CGCTACCAAGATCCTTCTGTG GGGATGACGGTGATGTCATA [48]
ULBP4 GACCTCAGGATGCTCCTTTG GTGCACCGTTCTGCTTCAC [48]
MT1X GCTCCTGTGCCTGTGCCG AGCAAACGGGTCGGGTTGTAC [34]
MT1E GCCCGACCTCCGTCTATAA AACAAGCAGTCAGGCAGTTG [34]
MT2A CGCCGCCGGTGACTCCTG ACGGTCACGGTCAGGGTTGTAC [34]
MT1G TCCTGTGCCGCTGGTGTCTC ACGGGTCACTCTATTTGTACTTGGG [34]
IL-1β GGACAGGATATGGAGCAACAAGTGG TCATCTTTCAACACGCAGGACAGG [50]
IL-6 GACAGCCACTCACCTCTTCAGAAC GCCTCTTTGCTGCTTTCACACATG [50]
TNF-α AAGGACACCATGAGCACTGAAAGC AGGAAGGAGAAGAGGCTGAGGAAC [50]
hCOQ10A TTTCAAGGATGCTGGCTCTT GGCCTCAGCTTGTCAAATTC [51]
MSRA TGGTTTTGCAGGAGGCTATAC GTAGATGGCCGAGCGGTACT [34]
Disclaimer/Publisher’s Note: The statements, opinions and data contained in all publications are solely those of the individual author(s) and contributor(s) and not of MDPI and/or the editor(s). MDPI and/or the editor(s) disclaim responsibility for any injury to people or property resulting from any ideas, methods, instructions or products referred to in the content.
Copyright: This open access article is published under a Creative Commons CC BY 4.0 license, which permit the free download, distribution, and reuse, provided that the author and preprint are cited in any reuse.
Prerpints.org logo

Preprints.org is a free preprint server supported by MDPI in Basel, Switzerland.

Subscribe

Disclaimer

Terms of Use

Privacy Policy

Privacy Settings

© 2026 MDPI (Basel, Switzerland) unless otherwise stated