Submitted:
17 July 2025
Posted:
21 July 2025
You are already at the latest version
Abstract
Agrophotovoltaic (APV) or agrivoltaic (AV) systems, which combine the crop cultivation with solar energy production, emerge as a promising solution by leveraging the dual use of land. This two-year study (2023 and 2024) investigated APV system impacts on rice production. The findings indicated that APV arrays created spatially variable light envi-ronments, with shadow lengths following predictable solar azimuth patterns, cloudy conditions mitigated shading effects via enhanced diffuse light. Compared to CK (non shadow area), inter-panel plots (BP) maintained 77% photosynthetic efficiency and 85.4 % plant height, while beneath panel areas showed significant declines of SPAD values, photosynthesis rate and yield. BP plots preserved 78% fruiting rate through adaptive sto-matal regulation, while LP zones (directly under the low eave) showed 35% higher inter-cellular CO₂ due to limited assimilation in shading. Rice yield losses correlated with shading intensity, driven by reduced panicles and grain filling. In addition, the APV sys-tem achieved high land equivalent ratio of 1.48–1.49, which was combining 65-66 % rice yield with 82.5 % photovoltaic output. Based on the microenvironment created by the APV system, an optimal crop types and fertilization management are essential to enhance ag-ricultural yields and to improve land use efficiency.
Keywords:
agrophotovoltaic system
; sunlight hours
; photosynthetic property
; land equivalen ratio
1. Introduction
The integration of photovoltaic (PV) systems with agricultural production, known as agrophotovoltaics (APV), has emerged as a promising strategy to address the dual challenges of renewable energy generation and sustainable land use [1,2]. As global energy demand continues to rise, the deployment of large-scale solar farms has intensified competition for arable land, particularly in regions with high solar insolation [3,4]. It is estimated that even less than 1% of cropland converted to an agrivoltaic system would offset global energy demand [5]. There are two types of APV system, involving pre-existing PV array or designed APV systems intentionally [6]. The APV systems offer a synergistic solution by co-locating solar panels with crop cultivation, thereby optimizing land use efficiency and potentially enhancing ecosystem services such as water conservation and microclimate regulation [7,8]. However, microclimatic heterogeneities and their impact on crop production are complex and vary [9], the success of APV systems hinges on understanding the trade-offs between energy production and agricultural productivity, particularly for staple crops like rice, which are highly sensitive to light availability [10,11].
Recent studies have systematically explored the impacts of APV shading on various crops, revealing a complex situation of opportunities and challenges. Studies demonstrated that the partial shading reduces evapotranspiration and soil moisture loss, benefiting significant agronomic benefits in arid or semi-arid regions under APV panels [2,12]. However, the reduction in photosynthetically active radiation (PAR) beneath PV arrays often leads to decreased biomass accumulation and yield, particularly for light-sensitive crops such as maize and rice. Specifically for the reports of rice cultivation under APV systems, have shown yield reductions ranging in 13–30%, which depending on shading intensity and panel configuration [11,13]. These findings highlight the need for site-specific optimization of APV designs to balance energy output and agricultural productivity. Despite current advances have established, gaps remain in understanding how dynamic shading patterns under APV systems influence rice growth physiology, particularly in terms of photosynthetic efficiency and yield formation.
Rice has long been the most crucial agricultural crop in China, particularly in the southern region. Consequently, the emergence of interest in APV in the south of China has resulted in an urgent need on investigating its influence on rice growth and yield. This study aims to investigate the spatial and temporal variations in solar radiation beneath the APV array and their impacts on rice growth, photosynthesis, and yield components. Specifically, we seek to: (1) characterize the shading patterns and photosynthetic photon flux density (PPFD) distribution under the APV array; (2) evaluate the effects of different light regimes on rice growth parameters and photosynthetic characteristics; and (3) analyze yield components respond to varying light conditions. By addressing these objectives, this study will provide critical insights for optimizing APV system designs while maximizing land-use efficiency in rice-growing regions.
2. Materials and Methods
2.1. Study Area and Site Conditions
This experiment was conducted during June 2023 - Oct 2023 and June 2024 – Oct 2024 at the 99 MW agrivoltaic project in Qizhou Town, Qichun County, China (30°0′23.64″N, 115°23′15.37″E). The experiment site located in the northern subtropical monsoon climate zone of the middle-lower Yangtze River basin. The agrivoltaic arrays cover an area of 140 hectares, at an elevation of 24 meters above sea level. The site receives abundant solar radiation with 2,025.8 annual sunshine hours, classifying as a solar-rich resource area [14].
The local main soil type is yellowish clay loam soil exhibiting favorable agricultural properties, including slightly acidic pH (5.8-6.3), 3% organic matter content, and a cation exchange capacity of 18 cmol(+)/kg, indicating strong nutrient retention capacity. Prior to the agrivoltaic project implementation, the land was primarily utilized for rice cultivation, representing typical agricultural land use in this subtropical paddy field ecosystem. The combination of high solar resource availability and fertile soil conditions makes the site particularly suitable for evaluating the dual-use potential of agrivoltaic systems in China’s intensive agricultural regions.
The daily temperature and rainfall data in rice growing period in 2023 (A)and 2024 (B) were indicated in Figure 1. The highest and lowest average monthly temperatures were recorded in July (29.03 ℃) and October (19.90 ℃) in 2023, and in August (31.17 ℃) and October (19.73 ℃) in 2024. The precipitation in 2023 and 2024 were 676.8 mm and 635.6 mm, respectively.
2.2. APV Array and Experimet Design
The experimental area featured fixed-tilt bifacial photovoltaic arrays arranged in north-south oriented rows with 7.5 m spacing between adjacent racking centers. The PV silicon pannels maintained a 28° fixed tilt angle, with the front (southern) eave positioned at 2.5 m vertical height and the rear (northern) eave at 4.5 m above ground level. The agricultural cultivation zones were established in three distinct positions relative to the APV arrays showing in Figure 2: (1) HP plots - directly beneath the high edge ( rear side of southern APV panels), defined by the vertical height of the 4.5 m edge; (2) LP plots - directly under the low edge (front side of northern APV panels) corresponding to the 2.5 m edge height; and (3) BP plots - the inter-row space between the southern arrays and northern arrays. An adjacent APV system with full sun was control plots (CK). This configuration created three distinct microenvironments for comparative analysis of crop performance under varying shading conditions, while maintaining uniform soil management practices across all treatments.
To maximize the available cultivation area within the agrivoltaic system, the planting zones were systematically designed according to the fixed APV array dimensions in both north-south and east-west orientations. The HP and LP cultivation areas each measured 40 m in length and 2 m in width, creating individual plot sizes of 80 m². The BP zone spanned 40 m in length with a 3.5 m width, providing 140 m² of cultivation space per plot. To ensure statistical validity, each treatment (HP, LP, BP and CK ) was replicated three times, resulting in a total of twelve experimental plots (4 treatments × 3 replicates) distributed in the study area.
The experiment utilized the indica hybrid rice cultivar Liangyou 1928, a two-line hybrid variety characterized by high yield potential, superior grain quality, and enhanced stress resistance. Rice cultivation trials were conducted during identical growing seasons in both 2023 and 2024, with sowing on June 6 and harvesting on October 21, corresponding to a 135-day complete growth cycle. The direct seeding method was employed following standardized field preparation including fertilization, puddling, rotary tillage, leveling, and drainage. Crop management followed regional best practices: shallow flooding (3-5 cm) during seedling emergence, thin water layer maintenance during tillering, field drying at maximum tillering stage, deeper flooding (8-10 cm) at panicle initiation, maintained irrigation during grain filling, and moist soil conditions during grain maturation. Fertilization consisted of nitrogen, phosphorus and potassium compound fertilizer application at 450 kg/ha according to standard local protocols.
2.3. The Evulation of Photovoltaic Panel Layout on Crop Sunlight Exposure
2.3.1. Calculation of Solar Declination, Altitude Angle, and Azimuth Angle
The solar declination varies seasonally, reaching 0° during the spring equinox and autumn equinox, and peaking at 23°23′ during the summer solstice and winter solstice. According to the reported references of Shan et al. [15], the solar declination (δ), altitude angle (α) and azimuth angle (β) are calculted as follows:
δ=0.3730+23.2567sinθ+0.1149sin2θ-0.1717sin3θ-0.7580cosθ+0.3650cos2θ+0.0201cos3θ
Where δ is solar declination, θ is solar position angle, θ=2πt/365.2422, t=N-N0, N is the day of the year, N0=79.6764+0.2422*(Year-1985)-INT[(Year-1985)/4].
sinα=sinφsinδ+cosφcosδcosω
Where α is altitude angle, φ is geographic latitude of observation site, δ is solar declination, ω is hour angle, ω=15°(t-12), forenoon (08:00-12:00) is negative value, afternoon (12:00-16:00) is positive values.
cosβ=(sinαsinφ-sinδ)cosαcosφ
Where β is azimuth angle, α is altitude angle, φ is geographic latitude of observation site, δ is solar declination.
2.3.2. Calculation of Shadow Length of Photovoltaic Panel and Effective Shadow Length
The shadow length of photovoltaic panels (L) on the ground refers to the length of the shadow cast by PV panels due to sunlight obstruction, it depends on solar altitude angle (α) and height of the PV (H), which as calculated as follow:
L= H / tanα
Where L is the shadow length of photovoltaic panels, H is the height of the PV, α is solar altitude.
Effective shadow length ( L’ ) refers to the shadow cast by photovoltaic panels along the north-south direction, whick creats functional shading for crops planted between panel rows. It can be calculated as follow:
Where L’ is the effective shadow lenth, L is the shadow length of photovoltaic panels, β is azimuth angle.
2.3.3. Measurement of Light Intensity in Agrivoltaic System
The photosynthetic photon flux density (PPFD) in the agrivoltaic field was measured using a TES-1399P illuminometer (TES Electrical Electronic Corp, China Taiwan). During the rice growth period from June 15 to October 21, daylight intensity measurements were conducted under three characteristic weather conditions: sunny, cloudy, and rainy days. For each hourly measurement interval, five sampling points were established within each treatment plot, with the arithmetic mean of these measurements recorded as the representative light intensity value for that specific treatment at the given time.
2.4. Rice Growth, Photosynthetics and Yield
Rice progresses through distinct developmental phases from seed germination to maturity, encompassing root establishment, leaf expansion, tillering, stem elongation (jointing), panicle formation, flowering, grain filling, and final maturation. This study examined four critical growth stages—seedling emergence, tillering, stem elongation-panicle initiation, and heading-grain filling—to evaluate growth patterns and photosynthetic performance. Plant height was determined by measuring the vertical distance from the soil surface to the tallest leaf tip of three randomly selected plants per plot using a measuring tape, with mean values calculated for each treatment. Tillering capacity was assessed during the tillering stage by counting tillers from three representative plants per plot. SPAD values of the fully expanded penultimate leaf was measured with a SPAD-502 chlorophyll meter (five readings per leaf, averaged). Photosynthetic parameters—including net photosynthetic rate (Pn), transpiration rate (Tr), stomatal conductance (Gs), and intercellular CO₂ concentration (Ci)—were monitored at 10:00, 12:00, 14:00, and 16:00 on sunny and clear days using Li-6400 (Lincoln, Nebraska, USA) photosynthesis system. Five readings were taken on each leaf and averaged over three replicate plants per plot.
At physiological maturity, grain yield and its components were quantified within 1 m² sampling areas across all treatments. Yield parameters included: (1) productive panicle density (panicles/m²), determined by manual counting; (2) seed-setting rate (%), calculated as (number of filled grains/total florets × 100); (3) grain weight per panicle (g), measured by oven-drying at 80°C until constant weight and weighing all filled grains from sampled panicles; and (4) 1000-grain weight (g), deternined from three replicates of randomly selected filled grains.
2.5. Land Equivalen Ratio (LER)
According to the LER calculation equation reported by Trommsdorff et al [16], calculate and evulate the land use efficiency of agrivoltaic system per unit area relative to single systems (pure agriculture or pure photovoltaics). LER is calculated as follow:
In this equation, a and b are the production of crop and electricity generating capacity, dual is the environment of agrivoltaic system, mono is the environment of pure argiculture or photovoltaics.
2.6. Statistical Analysis
All experimental data were recorded and processed using Microsoft Excel 2016, analyzed for statistical significance with SPSS 25, and visualized using Origin 2025 for graphical representations. ANOVA in SPSS 25 was conducted to assess the difference among 4 plots on measurement data at probability leves of 0.05.
3. Results
3.1. Impact of APV Array Shading on Daily Variation of Direct Sunlight Exposure Duration
The solar altitude angle, azimuth angle, and effective shadow length generated by photovoltaic panels in the agrivoltaic system on June 15, 2023, as influenced by seasonal and diurnal variations, are presented in Table 1. As shown in Table 1, during mid-June, the solar altitude angle gradually increased from 8.2° at 06:00 to its peak of 83.1° at 12:00, then progressively decreased to 8.7° by 18:00. Concurrently, the solar azimuth angle exhibited distinct directional changes: at sunrise, the sun was positioned in the northeast direction at 61.3°, shifted to due east (90.1°) around 09:00, and reached due south (180.5°) by noon. In the afternoon, the sun continued its westward trajectory, arriving at due west (approximately 270°) near 16:00 before further moving toward the northwest, culminating at 298.4° relative to true north by 18:00.
The effective shadow length cast by the photovoltaic panel array exhibited systematic variations due to the combined influence of solar altitude and azimuth angles. At 06:00, with the sun positioned in the northeast at a low altitude angle, the shadow length reached approximately 15.00 m. As the day progressed, the increasing solar altitude angle and shifting azimuth angle caused the shadow length to decrease rapidly. By 08:00, when the sun was due east, the effective shadow length shortened to 0.68 m. At solar noon (12:00), with the sun directly south at its highest elevation, the shadow length minimized to 0.54 m. In the afternoon, the shadow length followed a symmetrical pattern to the morning trend, gradually lengthening as the sun descended, reaching 13.99 m by 18:00.
Taking the time points from Table 1 as the x-axis and the corresponding effective shadow lengths of the PV array as the y-axis, a point-line graph (Figure 3) was plotted. As shown in Figure 3, the effective shadow length exhibited monotonic variations across four distinct azimuth angle intervals: 0°–90°, 90°–180°, 180°–270°, and 270°–360°.
Curve fitting of the effective shadow length over moments was performed at each monotonic interval furtherly. The resulting fitted curves are shown in Table 2.
3.2. Changes in Daylight Hours and Photosynthetic Photon Flux Density of APV Array Shading During the Rice Reproductive Period
Utilising the fitted curves of shadow lengths in various solar angle intervals presented in Table 2, the initial moments of sunshine time for distinct planting plots of rice in the area of PV array can be ascertained. Consequently, the number of sunshine hours can be determined. The number of sunshine hours in the whole day for each rice cultivation treatment in the agricultural and photovoltaic complementary area is shown in Table 3, combined with the solar orientation and the shadow length of the PV array on 15 June. As demonstrated in Table 3, the sequence of sunshine hours on 15 June was as follows: CK > BP > HP > LP. In comparison with the control group, a decline of 10.80% in the number of sunshine hours per day was observed in the boardroom. Furthermore, a significant decrease of 84.37% and 97.56% in the number of sunshine hours per day was recorded in the front and back of the boardroom, respectively. The period of light availability was constrained to a shorter duration after sunrise or before sunset.
In order to further quantify the effect of PV array deployment on crop photosynthesis, the changes in photosynthetic photon flux density (PPFD) of different planting treatment plots in the PV array area were compared under three typical weather conditions, namely, sunny, cloudy, and rainy days during the rice growth period. The photonic fluxes during one day of typical weather conditions during the growth of rice are demonstrated in Figure 4. As demonstrated in Figure 4, under three distinct weather conditions, PPFD at 6-18 moments during the daytime exhibited a single-peak curve, which increased with the rise in solar altitude angle from 8:00 to 14:00, and subsequently decreased after reaching its peak at 14:00 to 15:00, thereby reflecting the daily variation pattern of solar radiation. The data demonstrates significant fluctuations on days with high levels of sunlight, less pronounced variations on days with precipitation, and intermediate levels on days with overcast conditions. This observation suggests a weakening effect of cloud cover on light energy.
In clear weather conditions, the light characteristics of the PV array area exhibit variations such as oblique shadow light, partially shaded areas, light leakage from the edges of the PV panels, direct light shaded areas, and shadows that vary with the movement of the sun. The shadow area reaches its maximum at midday, after which shadows begin to shorten. The oblique light is then shaded again, and shadows are completely covered by sunset, resulting in a shade rate of 30-80%. The PPFD is dominated by scattered light from clouds on cloudy days, with no direct light peaks, and is approximately 30-50% of that on sunny days. The proportion of PPFD that is weakened by PV panel shading is lower than that of sunny days, and the contribution of diffuse light reflection between PV panels is significant. In conditions of precipitation, the PPFD is reduced to a mere 10-20% of its value during periods of sunlight, and this may be further diminished in instances of dense rainfall, where the light is scattered and absorbed to a significant extent, resulting in direct light levels approaching zero. The impact of PV panel shading is concomitantly diminished.
3.3. Rice Growth in the APV System
The alterations in rice plant height during the 2023 and 2024 growing seasons are illustrated in Figure 5. The deployment of photovoltaic arrays had a significant effect on the height of the rice plants. The results demonstrated that the rice plant height of each treatment increased with the advancement of the fertility period. At the seedling stage, no significant differences were observed between the treatments. However, at the end of the tillering stage, the rice plant height increased rapidly, and no significant differences were observed between the rice plant height of the treated plants and that of the control plants. Nevertheless, the rice plant height of the treated plants was significantly lower than that of the control plants and significantly higher than that of the plants following the panels. A substantial disparity in the stature of the rice plants was observed among the four treatments during the stages of tasseling and spikelet. At the tasseling and grouting stages, the control treatment exhibited the greatest height, which was significantly higher than that observed in the APV arrays area. The height of rice plants in the control treatment was the greatest, and was significantly greater than that of rice planted in the APV array area. The control treatment exhibited the highest rice plant height, which was significantly higher than that observed in the APV array planting area. During the four periods of rice growth, the plant heights were in the following order: CK> BP > LP > HP, and at maturity, the height of the rice plants in BP was about 85.4% of the height of CK.
The number of stem sprouts at the end of tillering directly correlates with the number of effective spikes and the final yield of rice. The incidence of stem damage at the conclusion of tillering in rice plants exhibited substantial variation among the various treatments, attributable to the impact of shading caused by APV arrays on the light environment conducive to rice growth. The number of stem sprouts incidents at the end of tillering in rice plants during the years 2023 and 2024 are presented in Table 4. As demonstrated in Table 4, the number of stem sprouts in rice exhibited a sequential order of CK > BP > LP > HP. The number of stem sprouts in the control treatment was found to be significantly higher than the number of stem sprouts in the LP, BP, and HP treatments under the shading condition of APV boards, which was 1.18 times higher than that of BP. The number of stem sprouts in LP and BP did not differ significantly from each other, but it was significantly higher than HP.
3.4. Photosynthesis Parameters of the Expanded Leaf in Rice in APV System
3.4.1. Changes in SPAD Values in Rice
SPAD values, serving as a proxy for leaf chlorophyll content, have been found to indirectly reflect nitrogen levels in rice and thus guide field management decisions.The SPAD values of the rice penultimate leaf during rice growth in 2023 and 2024 are presented in Figure 6. As demonstrated in Figure 6, the SPAD values of rice in all treatments exhibited an increase with the progression of the fertility period. Subsequent to the onset of the tassel-filling stage, the SPAD values of rice in the control treatment demonstrated a gradual decline, while the SPAD values of rice at various locations within the APV array area continued to demonstrate a modest increase trend. In comparison with the SPAD values of rice in CK, the SPAD values of plants between and under the APV panels decreased by 9.36% to 46.05% during the entire reproductive period. The SPAD values of rice in each treatment at different reproductive periods were in the order of CK > BP > HP> LP, and the SPAD values of rice penultimated leaves in APV arrays area were significantly reduced.
3.4.2. Daily Variation of Photosynthetic Parameters in Rice Penultimated Leaves
The penultimate leaf is a significant functional leaf during the rice filling period, and its photosynthetic capacity exerts a direct influence on the grain filling degree and ultimate yield. Its photosynthetic characteristics can reveal the light energy utilisation efficiency of the lower and middle leaves in the canopy of the rice population, and provide a pivotal physiological basis for the management of rice. In 2023, the daily changes of the net photosynthesis rate (Pn) and transpiration rate (Tr) of the penultimate leaf during the full bloom period to the beginning of the filling period during a sunny day are shown in Table 5. As demonstrated in Table 5, Pn and Tr of rice penultimate leaf in different planting areas of APV system exhibited significant variations. The photosynthetic efficiency was optimal in BP, which was close to 77% of CK, and showing significant reduction compared with CK (P < 0.05). The Pn values of HP and LP were significantly lower than BP, indicating the significant reduction of shade (Pn was only 30-40% of the CK). The trend of Tr was consistent with that of Pn, and Tr was maintained at a high level in BP plot in APV systems, although they were significantly lower than CK (P < 0.05).
The daily variation of net photosynthetic rate and transpiration rate of penultimate leaf during sunny days from bloom to early filling stage of rice in 2024 is shown in Table 6. As demonstrated in Table 6, the Gs value was observed to be at its peak in BP plot, with the value was up to 0.40 mmol-m-²-s-¹ at 10:00, which was significantly higher than that of CK (0.35); conversely, it was at its lowest in LP (only 0.15 at 12:00), which indicates that intense shading severely impeded stomatal function. Gs decreased from 10:00 to 12:00 in all groups, which was 20% of CK and recovered slightly in the late afternoon (14:00). Ci of LP was found to be consistently the highest, the value was up to 350 μmol-m-²-s-1 at 12:00, 35% higher than CK, suggesting that shading significantly reduced the efficiency of CO2 assimilation; Ci of BP was found to be close to the control. The maximum of Ci was observed at 12:00 for all plots (photoinhibition was most pronounced) and decreased at 16:00 with decreasing light intensity. In general, there were significant difference among the four plots in Gs in the four time; there were no significant difference between CK and BP in Ci in the four time; there were significant difference between LP and HP in Ci in the four time.
3.5. Changes in Dry Matter Accumulation and Yield of Rice in Different Planting Plots of APV Arrays
The yield and composition of rice from different planting plots under APV system are presented in Table 7. As illustrated in Table 7, when compared with the control, rice in the APV system exhibited a clear yield reduction trend. The LP treatment demonstrated the most substantial yield reduction, with a two-year average reduction of 53.27%. In contrast, the BP treatment exhibited the least reduction, with an average yield reduction of 18.08%. The HP treatment group experienced an average yield reduction of 41.18%. The yield indexes of the four plots in 2024 showed slight improvement compared with 2023, while the pattern of differences between the treatments remained consistent.
According to the ANOVA analysis, compare to CK, there were significant reduction in effective spikes under the APV system both in 2023 and 2024. There were no significant reduction in thousand kernel weight between CK and BP both in 2023 and 2024. There were significant difference between BP and HP,BP and LP, HP and LP in thousand kernel weight in 2023, but there were no significant difference among four plots in the thousand kernel weight in 2024. There were no significant difference among CK, BP and HP in yield, which were significantly higher than LP.
From the perspective of the components of rice yield, the effective spike, fruiting rate, thousand grain weight and spike weight of rice under the APV array were lower than that of the control. The fruiting rate exhibited a gradient change of CK > BP > HP > LP. The thousand grain weight of rice in different planting plots under APV system was reduced by 0.28-1.26 g compared with CK, and the biggest reduction was observed in the planting plots in LP. The spike weight exhibited a similar trend to that of the yield change, and the reduction of treatment in LP was as much as 45.3%.
3.6. Analysis of Land Use Efficiency in APV Arrays Area
As demonstrated in Table 7, which presents the rice yields of different planting plots in APV arrays area and the characteristics of the APV array layout in the field area, the rice yield under agricultural and photovoltaic complementarity was measured to be 65-66% of the control rice yield. Combining this with the system efficiency of 82.5% of this PV power plant reported by Wei Wenjing et al.[14] provides an LER under agricultural and photovoltaic complementarity of 1.48-1.49, thus confirming the feasibility of an agricultural and photovoltaic complementary scheme.
4. Discussion
4.1. Impact of APV Array on Sunlight Hours
Although APV systems have similar climate, eutrophication, air quality and resource consumption as PV systems [17], the deployment of agrivoltaic arrays significantly alters the duration of direct sunlight exposure for crops, as evidenced by the observed reduction in daily sunshine hours across different planting zones (Table 3). Compared to the control, areas in front of and behind the photovoltaic panels experienced drastic decreases of 84.37% and 97.56% in sunlight hours, respectively, while the inter-panel zone showed a moderate reduction (10.80%). These findings align with previous studies demonstrating that photovoltaic pannel shading redistributes solar radiation, creating heterogeneous microclimates that affect crop growth [10,18]. The pronounced decline in sunlight availability near panels underscores the spatial variability of shading effects, which are most severe in zones where shadows persist longest due to low solar altitude angles (early morning and late afternoon).
The diurnal variation in shadow length (Figure 2) further elucidates the dynamic interplay between solar geometry and PV array configuration. The fitted curves (Table 2) reveal that shadow elongation follows predictable patterns tied to solar azimuth intervals, corroborating findings by Amaducci et al. [19], who emphasized the role of panel orientation in modulating light regimes, also coincide with Nasukawa et al. [20], who reported the lower PPFD and reduction of rice yield in the AV system field. Notably, the PPFD data (Figure 3) highlight how agrivoltaic systems shift the balance between direct and diffuse radiation, with cloudy days exhibiting less pronounced shading effects due to dominant diffuse light—a phenomenon consistent with Trommsdorff et al. [16]. Interestingly, Widmer et al proposed to define an optimal daily light integral for crop species, which would be friendly to light – demanding crops [21]. These insights underscore the need for optimized agrivoltaic system designs that mitigate shading extremes while maintaining energy output, as proposed in dual-use agrovoltaic frameworks [22]. Additionally, future agrivoltaic systems utilizing spectrally selective photovoltaic materials (e.g., organic and dye-sensitized cells) will enable concurrent crop growth and power generation, potentially increasing land productivity by >60% through dual solar energy conversion [23].
4.2. Impact of Agrivoltaic Array on Photosynthesis Property of Crop
The agrivoltaic array significantly influences the photosynthetic properties of rice, as evidenced by reduced SPAD values and altered photosynthetic parameters under shaded conditions (Figure 5, Table 5 and Table 6). The decline in SPAD values (9.36–46.05%) in APV zones compared to the control (CK) suggests that shading reduces chlorophyll content, likely due to lower light availability limiting nitrogen assimilation—a phenomenon consistent with findings by Reher et al. [24] in beet and wheat-panel systems. But in a case of rice yield study in Japan, Ruth et al. [25] showed higer SPAD value of shade area, which was different from our result. The reason could be the difference in SPAD values between the flag leaf and the penultimate leaf from the bottom of the rice plant, or the growth time being prolonged due to shading. Nevertheless, comparing and determining the proper SPAD threshold would be helpful to adjust the nitrogen fertilizer application. Notably, the BP plot exhibited higher Pn (Pn: 77% of CK) than LP or HP plots (30–40% of CK), the results was aligned with Marrou et al. [10], who reported that partial shading preserves photosynthetic efficiency better than deep shade. As reported by Weselek et al. [26], photosynthetic active radiation was reduced by about 30% average under PV. The elevated (Gs) in BP (Table 6) further indicates adaptive stomatal regulation under moderate shade, whereas severe shading (LP) suppressed Gs and increased Ci, reflecting impaired carboxylation efficiency—similar to observations in shaded maize by Trommsdorff et al. [16]. The lower photosynthesis rate in the APV shading could be the adaptation of plant in the lower solar radiation [27].
The temporal dynamics of photosynthesis (e.g., midday photoinhibition in all treatments, Table 6) underscore the interplay between AV shading and diurnal light stress. The BP zone’s resilience—maintaining higher Pn and Tr—may stem from optimized diffuse light capture, as proposed by Weselek et al. [26] for agrovoltaic crops. However, the persistent Ci accumulation in LP zones highlights chronic light limitation, corroborating Dinesh and Pearce [18], who noted that prolonged shade disrupts carbon fixation. These results emphasize the need for AV designs that balance energy production with crop physiological needs, potentially through dynamic panel spacing or spectral-filtering technologies [19].
4.3. Impact of AV Array on Growth and Yield of Crop
The APV system significantly impacted rice growth and yield, with spatial variations in shading intensity leading to differential responses across planting zones (Figure 4, Table 4 and Table 7). The observed reduction in plant height (BP: 85.4% of CK) and tiller number (BP: ~80% of CK) under moderate shading aligns with previous findings that shading delays vegetative growth but may not proportionally reduce yield [10,28,29]. However, severe shading (LP) caused drastic yield losses (53.27%), primarily due to reduced effective panicles (35% fewer than CK) and lower grain filling (49-50% vs. 84-87% in CK), consistent with reports by Dal et al. [30] in wheat-panel systems. Notably, the BP zone maintained relatively stable yields (18% reduction), suggesting that inter-panel spacing allows sufficient light for compensatory growth, as proposed by Amaducci et al. [19]. Acturally, each crop variety exhibits unique light saturation and shade tolerance for growth [31]. It is essential to choose adaptable crop species and optimal PV array in APV systems.
Crop yield is determined by a combination of genetic, management, and environmental factors. In this study, yield components analysis revealed that APV shading disproportionately affected reproductive traits, reflecting impaired photoassimilate allocation—a phenomenon also observed in shaded rice by Thum et al. [32] and Lee et al [13], indicated that photosynthetic efficacy of rice in APV systems were lower than in CK. The stronger yield decline in LP versus HP plots (53% vs. 41%) may stem from combined shade and microclimate effects, such as reduced morning light interception [16,33], which played negative role on the number of panicles and weight per panicle. These results underscore the need for optimized APV designs that minimize yield penalties, potentially through dynamic panel orientation [22] or shade-tolerant cultivars [18], seeking synergies beteen solar energy generation and crop production.
4.4. LER of AV System
The land equivalent ratio (LER) is a quantitative metric of the reduction in land use. The LER of 1.48-1.49 in this APV system demonstrates superior land-use efficiency, where the combined output of rice (65-66% of monoculture yield) and photovoltaic generation (82.5% efficiency) exceeds conventional single-use systems. This aligns with findings by Dupraz et al. [1], who proposed that LER >1.0 validates the dual-use advantage of APV systems. The results corroborate global studies showing APV systems can enhance resource-use efficiency through microclimate regulation and light redistribution [9,10,22]. However, the yield trade-off (34-35% reduction) highlights the need for optimized designs balancing energy and crop production, as suggested by Trommsdorff et al. [16] for site-specific APV implementations in Germany, which is even more advantageous in extreme conditions such as drought. As a consequence, average grain of rainfed maize was higher and more stable under AV system than full light in North Italy, which indicated that AV systems increased crop resilience to climate change [19].
5. Conclusions
This study reveals that APV systems create spatially varied light conditions affecting rice growth. While shading reduced sunlight exposure by 10.8-97.6%, between-panel zones maintained 77% photosynthetic efficiency and only 18% yield reduction. However, heavily shaded areas showed 46% lower SPAD values, 57% reduced stomatal function, and 53% yield loss. The system achieved excellent land-use efficiency (LER=1.48-1.49), confirming APV’s potential for sustainable intensification. In the future, experiments on lager areas, over more years and more crop species are needed to provide more sustainable solutions and increase the efficiency of APV systems.
Author Contributions
Conceptualization, Y.J. and X.G.; methodology, J.L., P.S. and X.S.; investigation, Y.J., J.H. and X.G.; writing-original draft preparation, Y.J. and X.G.; project administration, P.S. All authors have read and agreed to the published version of the manuscript.
Funding
This research was funded by the Natural Science Foundation of Shanxi Province (Grant number 202203021221075); The Natural Science Foundation of Shanxi Province (Grant number 20210302124370); Enterprise Research Project (Grant number RH 23000003304 and RH 2400001631).
Data Availability Statement
Not applicable.
Conflicts of Interest
The authors declare that they have no conflicts of interest.
References
- Dupraz, C.; Marrou, H.; Talbot, G.; Dufour, L.; Nogier, A.; Ferard, Y. Combining solar photovoltaic panels and food crops for optimising land use : Towards new agrivoltaic schemes. Renew Energy 2011, 36, 2725–2732. [Google Scholar] [CrossRef]
- Adeh, E.H.; Selker, J.S.; Higgins, C.W. Remarkable agrivoltaic influence on soil moisture, micrometeorology and water-use efficiency. Plos One 2018, 13, 15. [Google Scholar]
- Hernandez, R.R.; Armstrong, A.; Burney, J.; Ryan, G.; Moore-O’Leary, K.; Diedhiou, I.; Grodsky, S.M.; Saul-Gershenz, L.; Davis, R.; Macknick, J.; et al. Techno-ecological synergies of solar energy for global sustainability. Nat Sustain 2019, 2, 560–568. [Google Scholar] [CrossRef]
- Mamun, M.A.A.; Dargusch, P.; Wadley, D.; Zulkarnain, N.A.; Aziz, A.A. A review of research on agrivoltaic systems. Renew Sustain Energy Rev 2022, 161, 16. [Google Scholar] [CrossRef]
- Adeh, E.H.; Good, S.P.; Calaf, M.; Higgins, C.W. Solar PV Power Potential is Greatest Over Croplands. Sci Rep 2019, 9, 6. [Google Scholar] [CrossRef] [PubMed]
- Kumpanalaisatit, M.; Setthapun, W.; Sintuya, H.; Pattiya, A.; Jansri, S.N. Current status of agrivoltaic systems and their benefits to energy, food, environment, economy, and society. Sustain Prod Consum 2022, 33, 952–963. [Google Scholar] [CrossRef]
- Barron-Gafford, G.A.; Pavao-Zuckerman, M.A.; Minor, R.L.; Sutter, L.F.; Barnett-Moreno, I.; Blackett, D.T.; Thompson, M.; Dimond, K.; Gerlak, A.K.; Nabhan, G.P.; et al. Agrivoltaics provide mutual benefits across the food-energy-water nexus in drylands. Nat Sustain 2019, 2, 848–855. [Google Scholar] [CrossRef]
- Walston, L.J.; Li, Y.; Hartmann, H.M.; Macknick, J.; Hanson, A.; Nootenboom, C.; Lonsdorf, E.; Hellmann, J. Modeling the ecosystem services of native vegetation management practices at solar energy facilities in the Midwestern United States. Ecosyst Serv 2021, 47, 9. [Google Scholar] [CrossRef]
- Weselek, A.; Ehmann, A.; Zikeli, S.; Lewandowski, I.; Schindele, S.; Hoegy, P. Agrophotovoltaic systems : applications, challenges, and opportunities. A review. Agron Sustain Dev 2019, 39, 20. [Google Scholar] [CrossRef]
- Marrou, H.; Guilioni, L.; Dufour, L.; Dupraza, C.; Wery, J. Microclimate under agrivoltaic systems: Is crop growth rate affected in the partial shade of solar panels? Agric for Meteorol 2013, 177, 117–132. [Google Scholar] [CrossRef]
- Ko, J.; Cho, J.; Choi, J.; Yoon, C.; An, K.; Ban, J.; Kim, D. Simulation of Crop Yields Grown under Agro-Photovoltaic Panels: A Case Study in Chonnam Province, South Korea. Energies (Basel) 2021, 14, 8463. [Google Scholar] [CrossRef]
- Yajima, D.; Toyoda, T.; Kirimura, M.; Araki, K.; Ota, Y.; Nishioka, K. Estimation Model of Agrivoltaic Systems Maximizing for Both Photovoltaic Electricity Generation and Agricultural Production. Energies (Basel) 2023, 16, 16. [Google Scholar] [CrossRef]
- Lee, H.J.; Park, H.H.; Kim, Y.O.; Kuk, Y.I. Crop Cultivation Underneath Agro-Photovoltaic Systems and Its Effects on Crop Growth, Yield, and Photosynthetic Efficiency. Agronomy (Basel) 2022, 12, 15. [Google Scholar] [CrossRef]
- Wei, W.; Luo, J.; Yang, L.; Sang, Y.; Luo, X.; Sui, X. Research on Agricultural Photovoltaic Complementary Development and Profit Model. Acta Energiae Solaris Sinica 2023, 44, 457–464, [in Chinese with English abstract]. [Google Scholar]
- Shan, C.; Wang, X.; Zhang, J.; Ma, B.; Li, G.; Ni, D.; Zhu, Y.; Wang, Z. Light variation under photovoltaic-Salvia miltiorrhiza production system and its effects on Salvia growth. Shandong Agricultural Sciences 2018, 50, 73–79. [Google Scholar]
- Trommsdorff, M.; Kang, J.; Reise, C.; Schindele, S.; Bopp, G.; Ehmann, A.; Weselek, A.; Hoegy, P.; Obergfell, T. Combining food and energy production : Design of an agrivoltaic system applied in arable and vegetable farming in Germany. Renew Sustain Energy Rev 2021, 140, 13. [Google Scholar] [CrossRef]
- Agostini, A.; Colauzzi, M.; Amaducci, S. Innovative agrivoltaic systems to produce sustainable energy : An economic and environmental assessment. Appl Energy 2021, 281, 13. [Google Scholar] [CrossRef]
- Dinesh, H.; Pearce, J.M. The potential of agrivoltaic systems. Renew Sustain Energy Rev 2016, 54, 299–308. [Google Scholar] [CrossRef]
- Amaducci, S.; Yin, X.; Colauzzi, M. Agrivoltaic systems to optimise land use for electric energy production. Appl Energy 2018, 220, 545–561. [Google Scholar] [CrossRef]
- Nasukawa, H.; Kuwabara, Y.; Tatsumi, K.; Tajima, R. Rice yield and energy balance in an agrivoltaic system established in Shonai plain, northern Japan. Sci Total Environ 2025, 959, 178315. [Google Scholar] [CrossRef] [PubMed]
- Widmer, J.; Christ, B.; Grenz, J.; Norgrove, L. Agrivoltaics, a promising new tool for electricity and food production : A systematic review. Renew Sustain Energy Rev 2024, 192, 10. [Google Scholar] [CrossRef]
- Wagner, M.; Lask, J.; Kiesel, A.; Lewandowski, I.; Weselek, A.; Hoegy, P.; Trommsdorff, M.; Schnaiker, M.; Bauerle, A. Agrivoltaics : The Environmental Impacts of Combining Food Crop Cultivation and Solar Energy Generation. Agronomy (Basel) 2023, 13, 14. [Google Scholar] [CrossRef]
- Gorjian, S.; Bousi, E.; Oezdemir, O.E.; Trommsdorff, M.; Kumar, N.M.; Anand, A.; Kant, K.; Chopra, S.S. Progress and challenges of crop production and electricity generation in agrivoltaic systems using semi-transparent photovoltaic technology. Renew Sustain Energy Rev 2022, 158, 21. [Google Scholar] [CrossRef]
- Reher, T.; Lavaert, C.; Willockx, B.; Huyghe, Y.; Bisschop, J.; Martens, J.A.; Diels, J.; Cappelle, J.; Van de Poel, B. Potential of sugar beet ( Beta vulgaris ) and wheat ( Triticum aestivum ) production in vertical bifacial, tracked, or elevated agrivoltaic systems in Belgium. Appl Energy 2024, 359, 13. [Google Scholar] [CrossRef]
- Gonocruz, R.A.; Nakamura, R.; Yoshino, K.; Homma, M.; Doi, T.; Yoshida, Y.; Tani, A. Analysis of the Rice Yield under an Agrivoltaic System: A Case Study in Japan. Environments (Basel) 2021, 8, 65. [Google Scholar] [CrossRef]
- Weselek, A.; Bauerle, A.; Hartung, J.; Zikeli, S.; Lewandowski, I.; Hogy, P. Agrivoltaic system impacts on microclimate and yield of different crops within an organic crop rotation in a temperate climate. Agron Sustain Dev 2021, 41, 15. [Google Scholar] [CrossRef]
- Wei, L.; Yu, M.; Qin, N.; Huang, C.; Xie, Y.; Sun, W.; Wu, L.; Wang, W.; Wang, G. Effects of agrophotovoltaic system on field light conditions and sweet potato growth. Journal of Zhejiang University (Agriculture and Life Sciences) 2019, 45, 288–295. [Google Scholar]
- Choi, C.S.; Ravi, S.; Siregar, I.Z.; Dwiyanti, F.G.; Macknick, J.; Elchinger, M.; Davatzes, N.C. Combined land use of solar infrastructure and agriculture for socioeconomic and environmental co-benefits in the tropics. Renew Sustain Energy Rev 2021, 151, 12. [Google Scholar] [CrossRef]
- Jo, H.; Asekova, S.; Bayat, M.A.; Ali, L.; Song, J.T.; Ha, Y.; Hong, D.; Lee, J. Comparison of Yield and Yield Components of Several Crops Grown under Agro-Photovoltaic System in Korea. Agriculture 2022, 12, 619. [Google Scholar] [CrossRef]
- Dal Pra, A.; Miglietta, F.; Genesio, L.; Lanini, G.M.; Bozzi, R.; More, N.; Greco, A.; Fabbri, M.C. Determination of feed yield and quality parameters of whole crop durum wheat ( Triticum durum Desf. ) biomass under agrivoltaic system. Agrofor Syst 2024, 98, 2861–2873. [Google Scholar] [CrossRef]
- Ko, D.; Chae, S.; Moon, H.; Kim, H.J.; Seong, J.; Lee, M.; Ku, K. Agrivoltaic Farming Insights : A Case Study on the Cultivation and Quality of Kimchi Cabbage and Garlic. Agronomy (Basel) 2023, 13, 16. [Google Scholar] [CrossRef]
- Thum, C.H.; Okada, K.; Yamasaki, Y.; Kato, Y. Impacts of agrivoltaic systems on microclimate, grain yield, and quality of lowland rice under a temperate climate. Field Crops Res 2025, 326, 8. [Google Scholar] [CrossRef]
- Hasan, A.S.; Ahmed, T.; Mahjabin, M.; Abdullah, F.B.; Rejwana, Z.; Rahman, M.M.; Islam, M. Impact of Shading on Paddy Field: A Case Study in Bangladesh Towards Agrivoltaic, 2024-01-01; IEEE, 2024; 1, pp. 1–5.
Figure 1.
Daily highest and lowest temperature, precipation during the rice growth period in Qichu town.
Figure 1.
Daily highest and lowest temperature, precipation during the rice growth period in Qichu town.
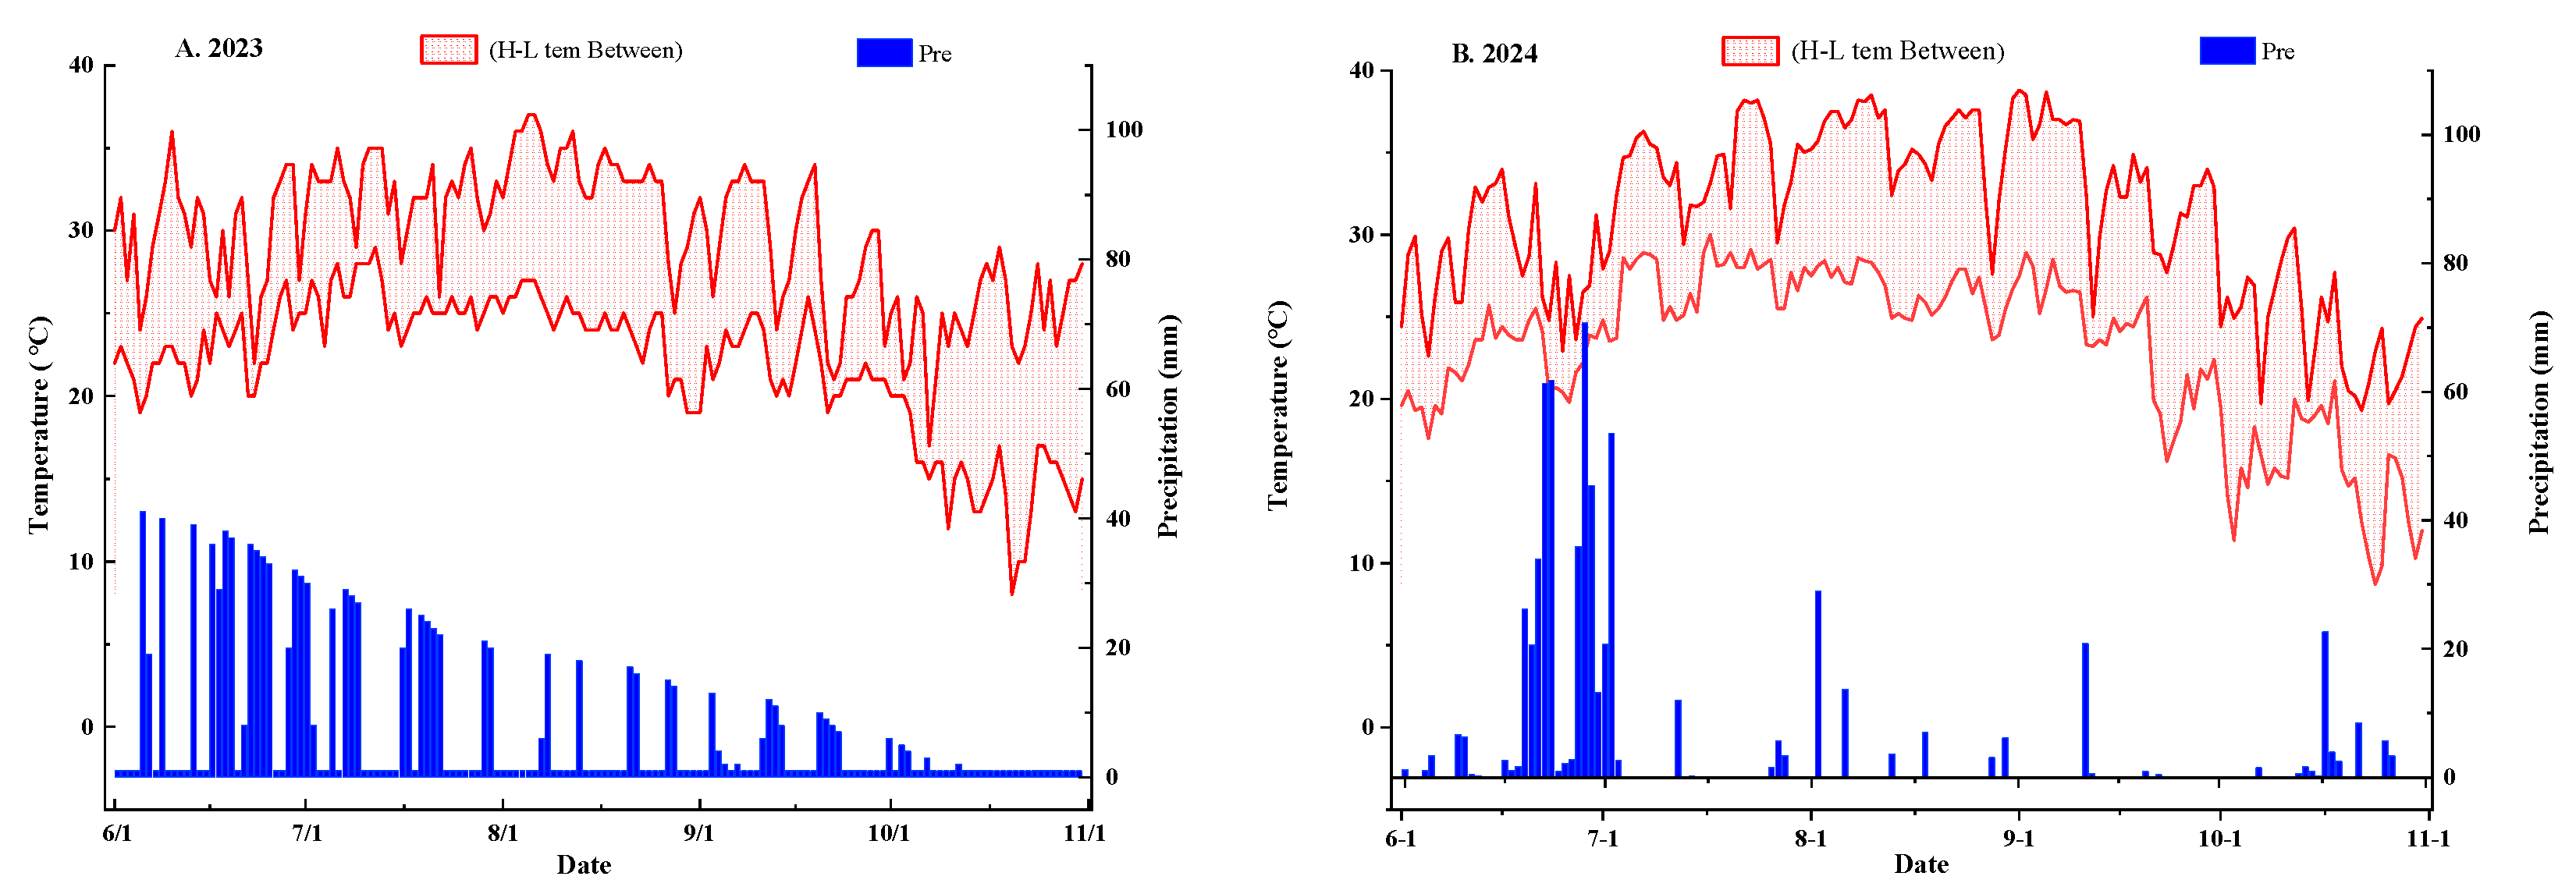
Figure 2.
APV array and experiment plots in study site.
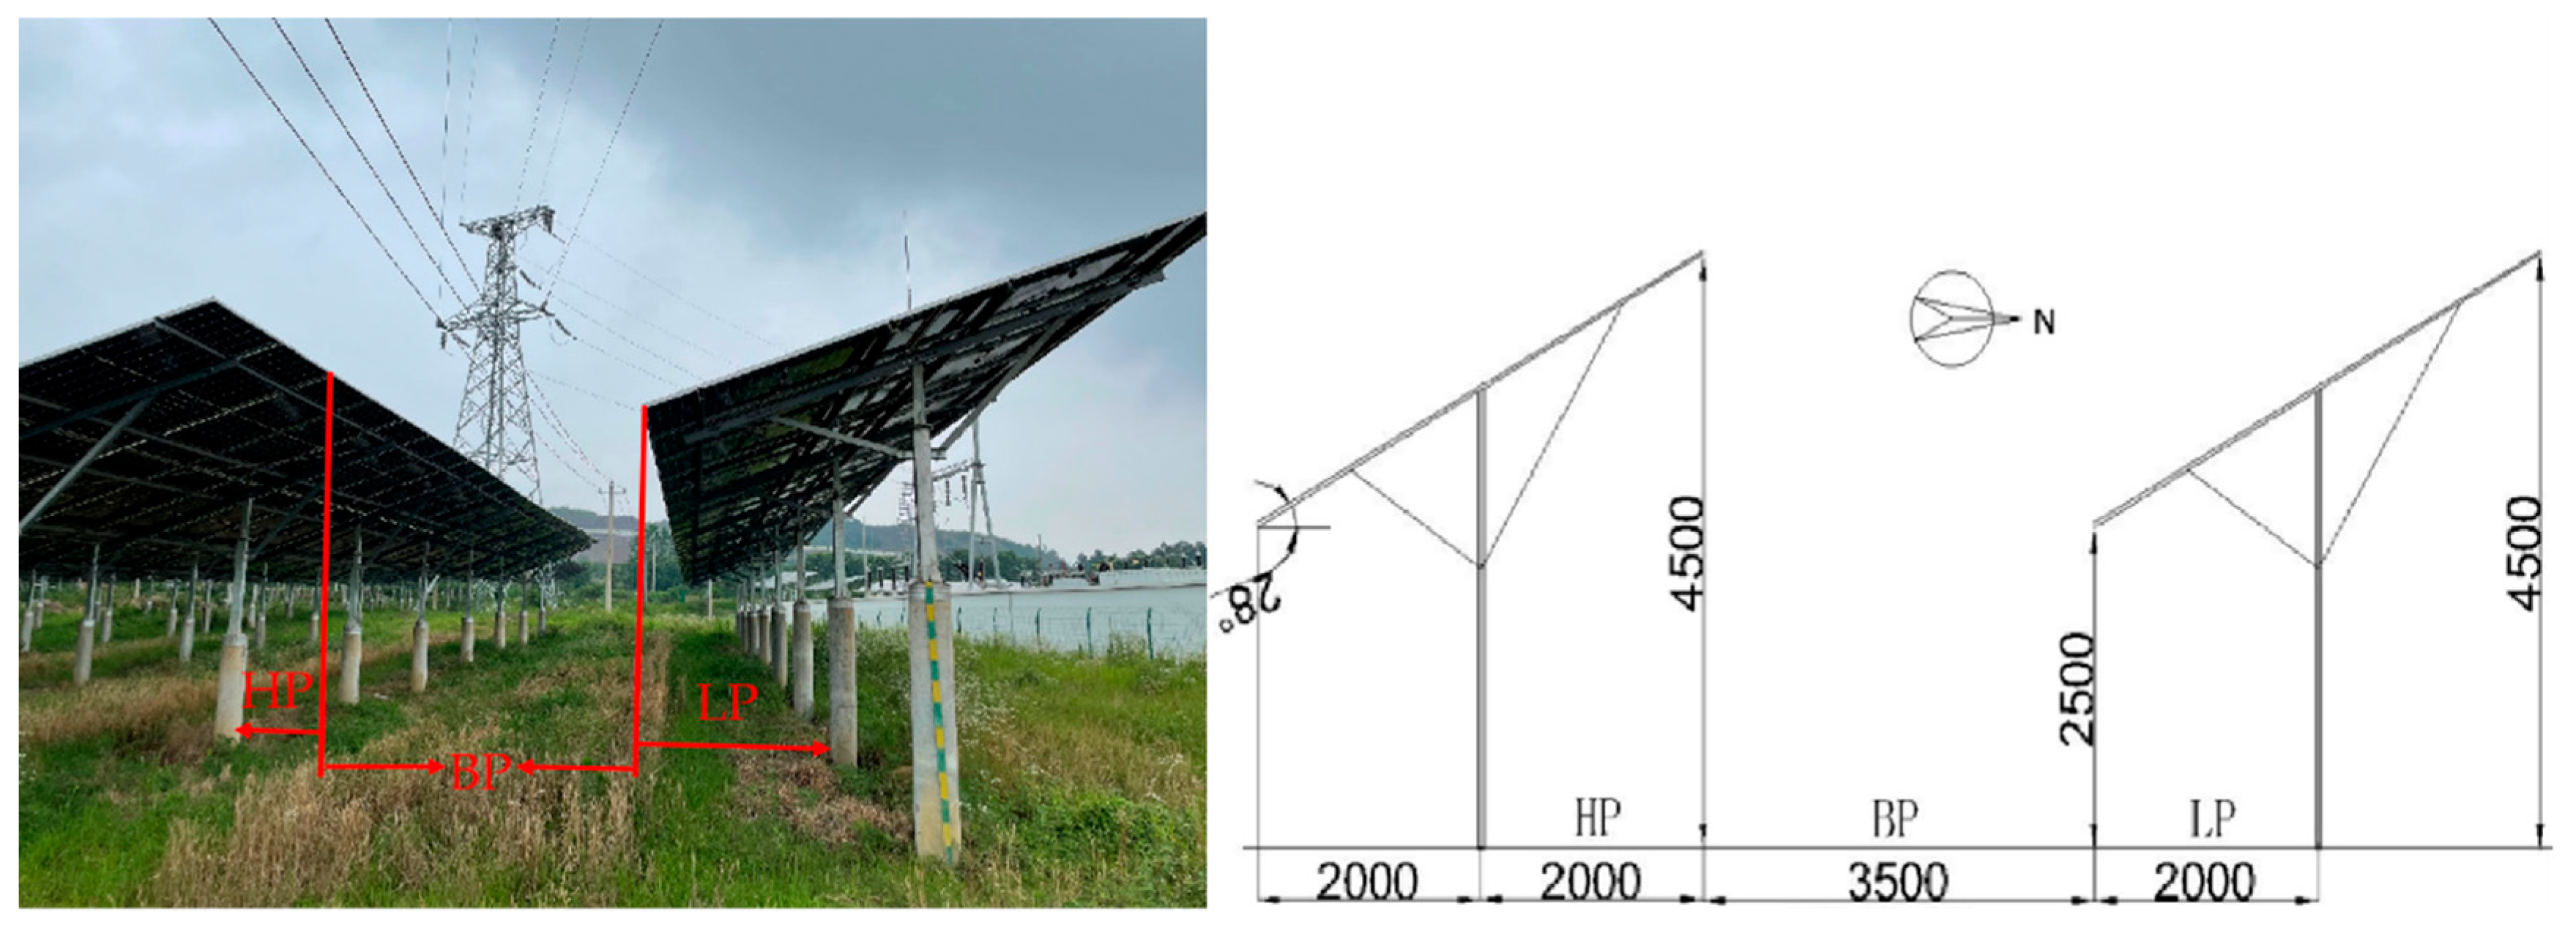
Figure 3.
Day variation of effective shadow length of PV panels in the APV area.
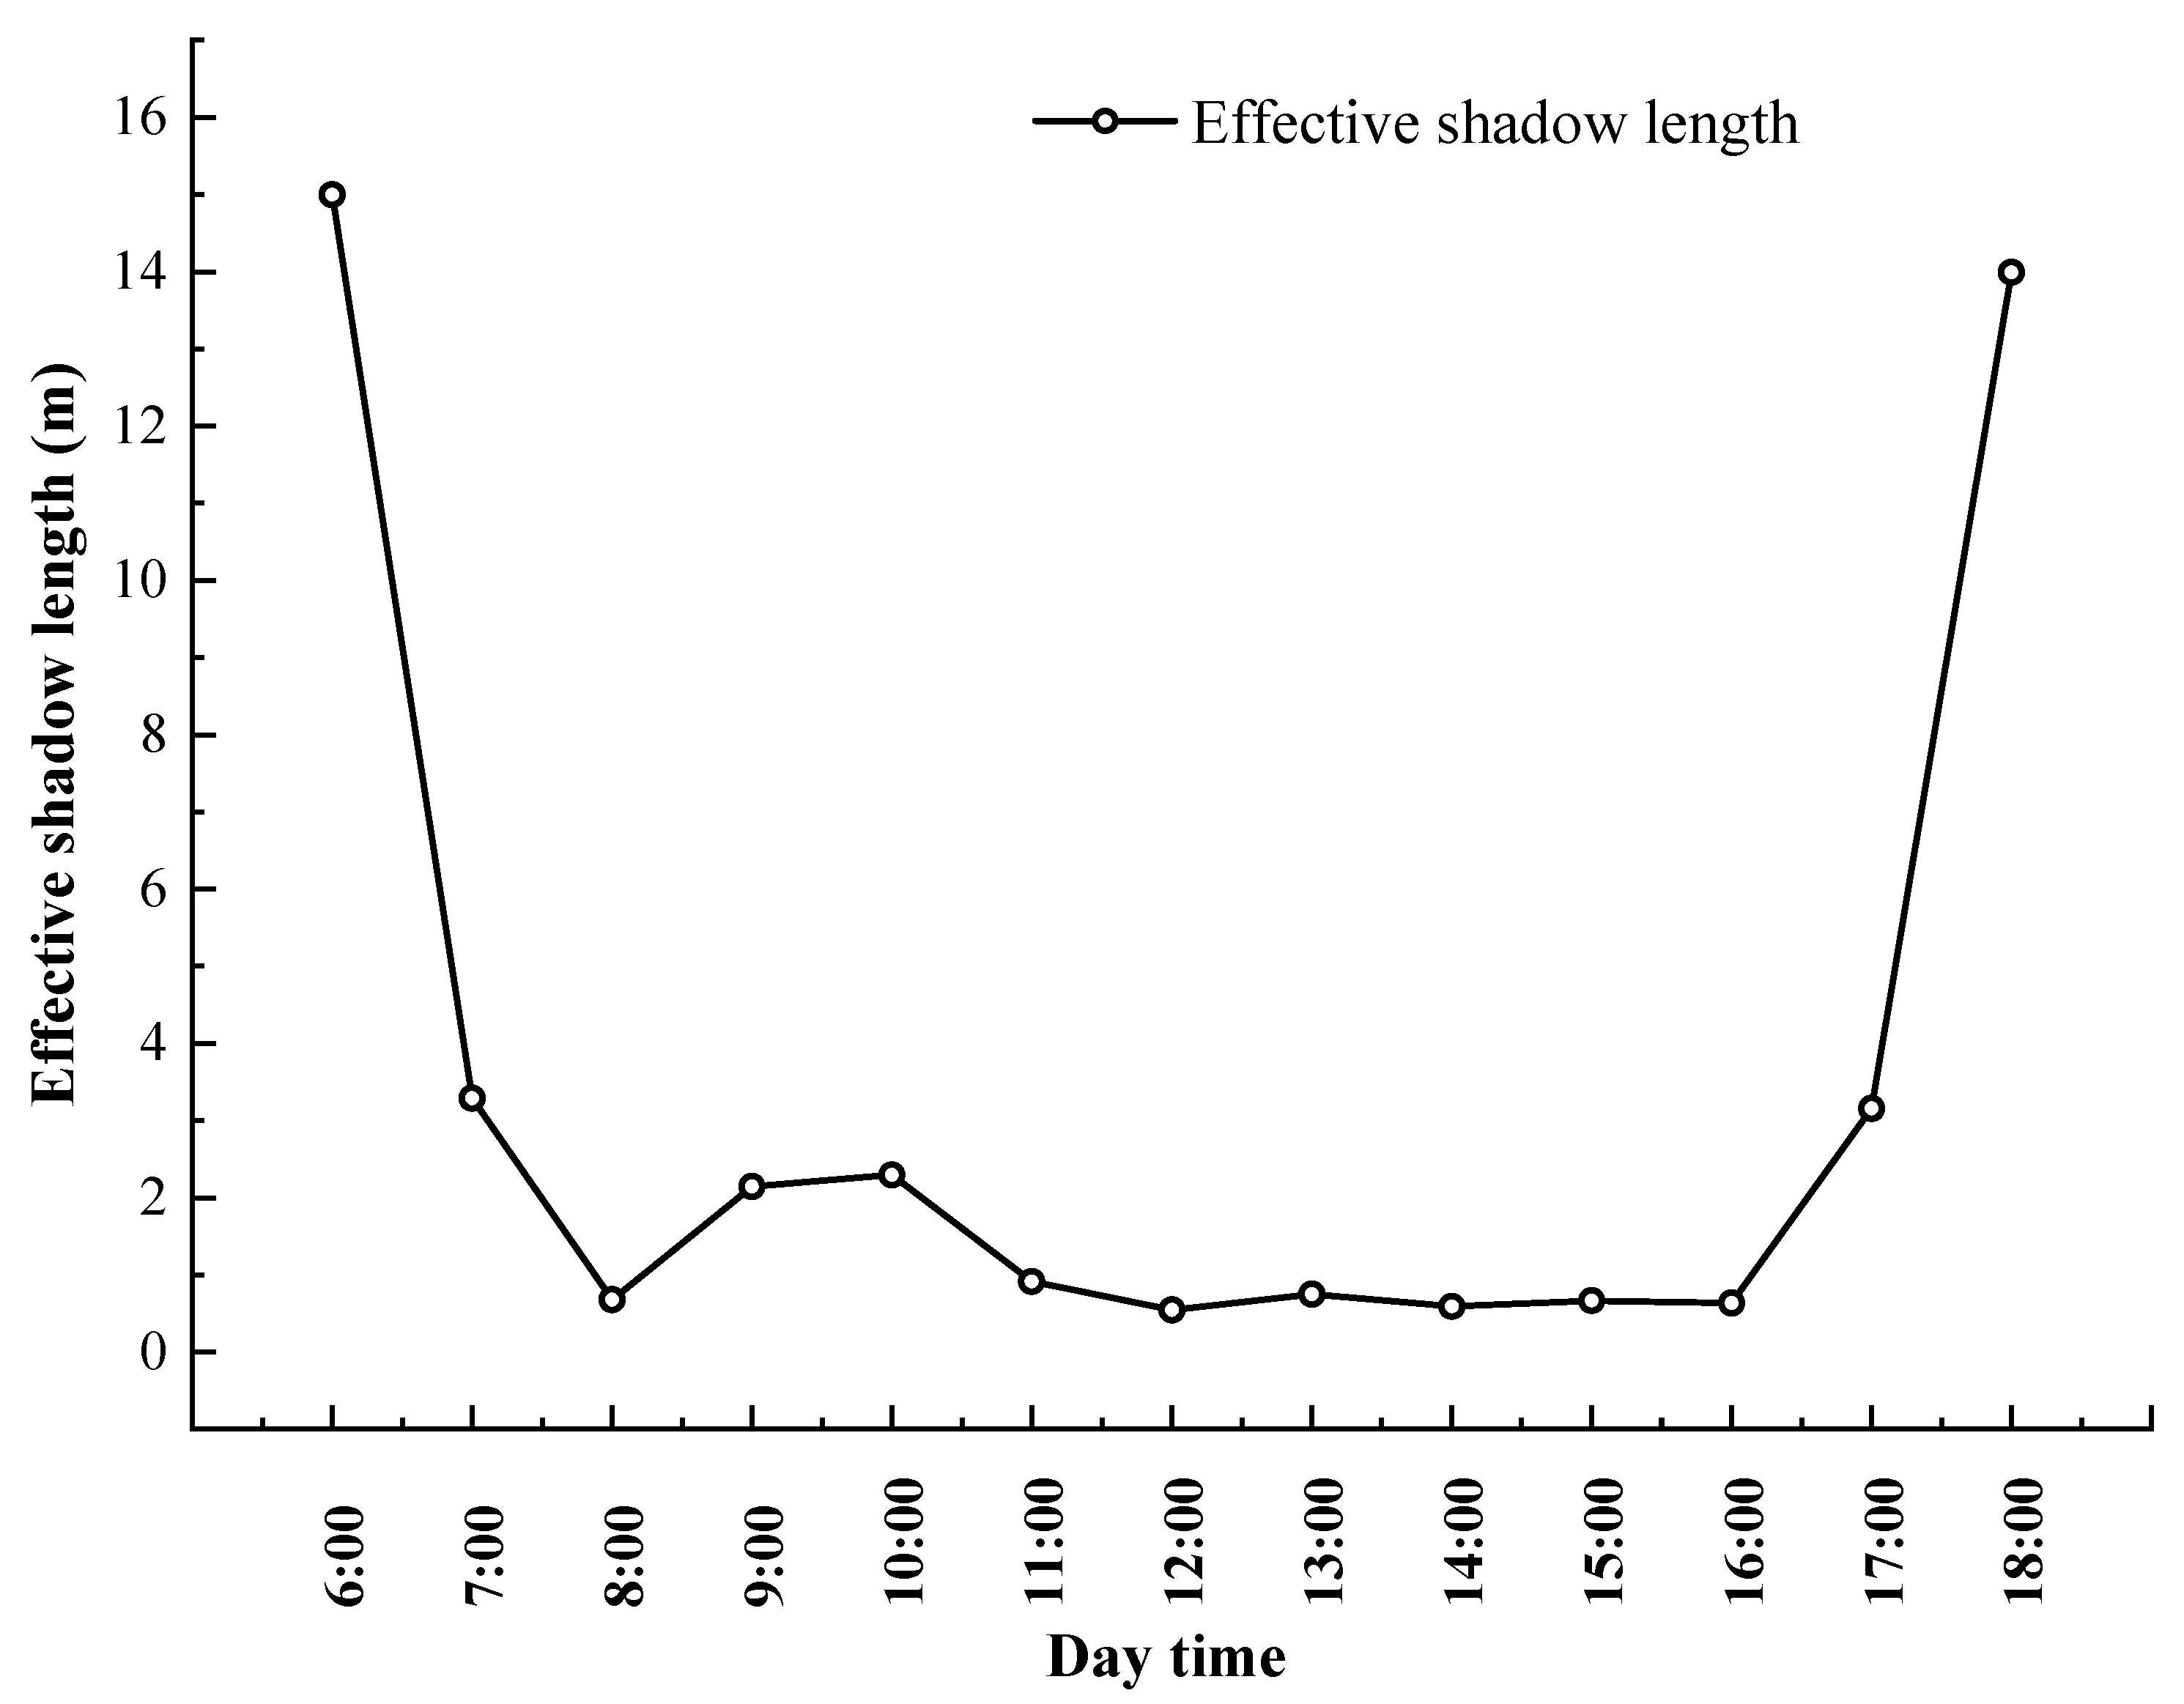
Figure 4.
Daily change of PPFD under different weather conditions in APV area (A. Sunny day, B. Cloudy day, C. Rainy day).
Figure 4.
Daily change of PPFD under different weather conditions in APV area (A. Sunny day, B. Cloudy day, C. Rainy day).
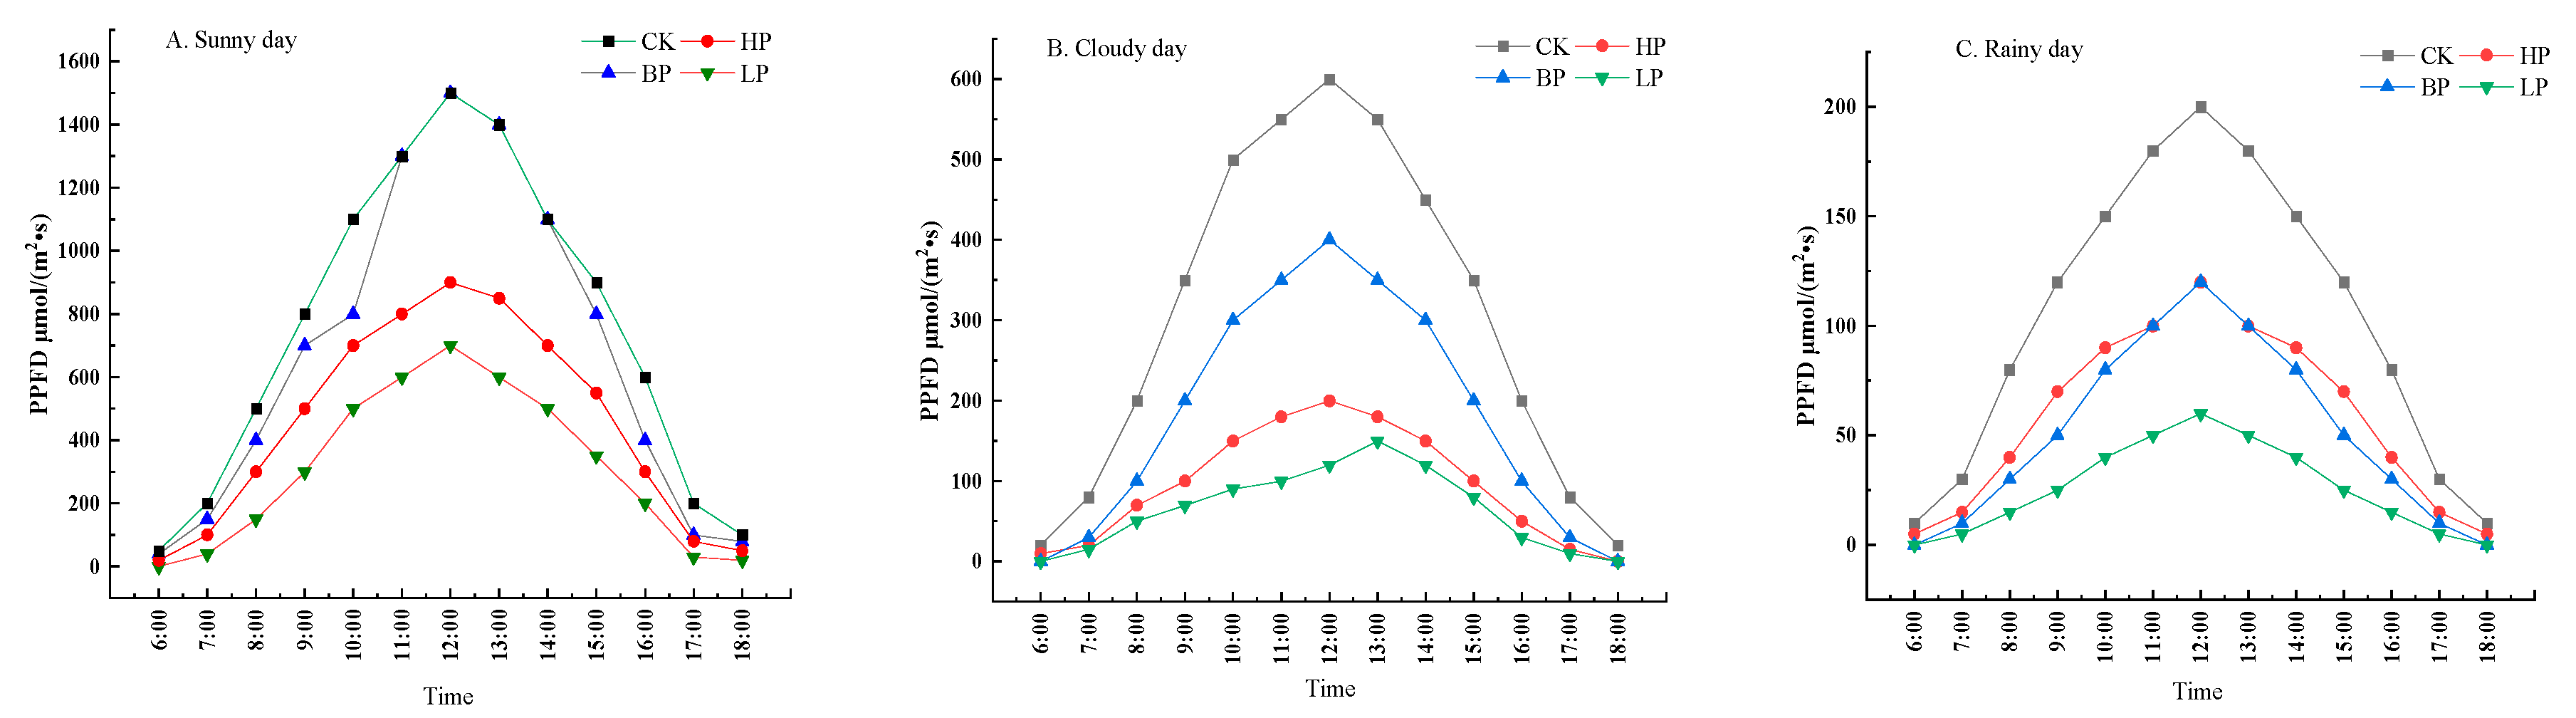
Figure 5.
Height changes during the growth and development of rice in APV system in 2023 (A) and 2024 (B). The values represent the means of each treatment, and the error bars indicate the standard deviation. Different letters indicate significant differences at p < 0.05.
Figure 5.
Height changes during the growth and development of rice in APV system in 2023 (A) and 2024 (B). The values represent the means of each treatment, and the error bars indicate the standard deviation. Different letters indicate significant differences at p < 0.05.
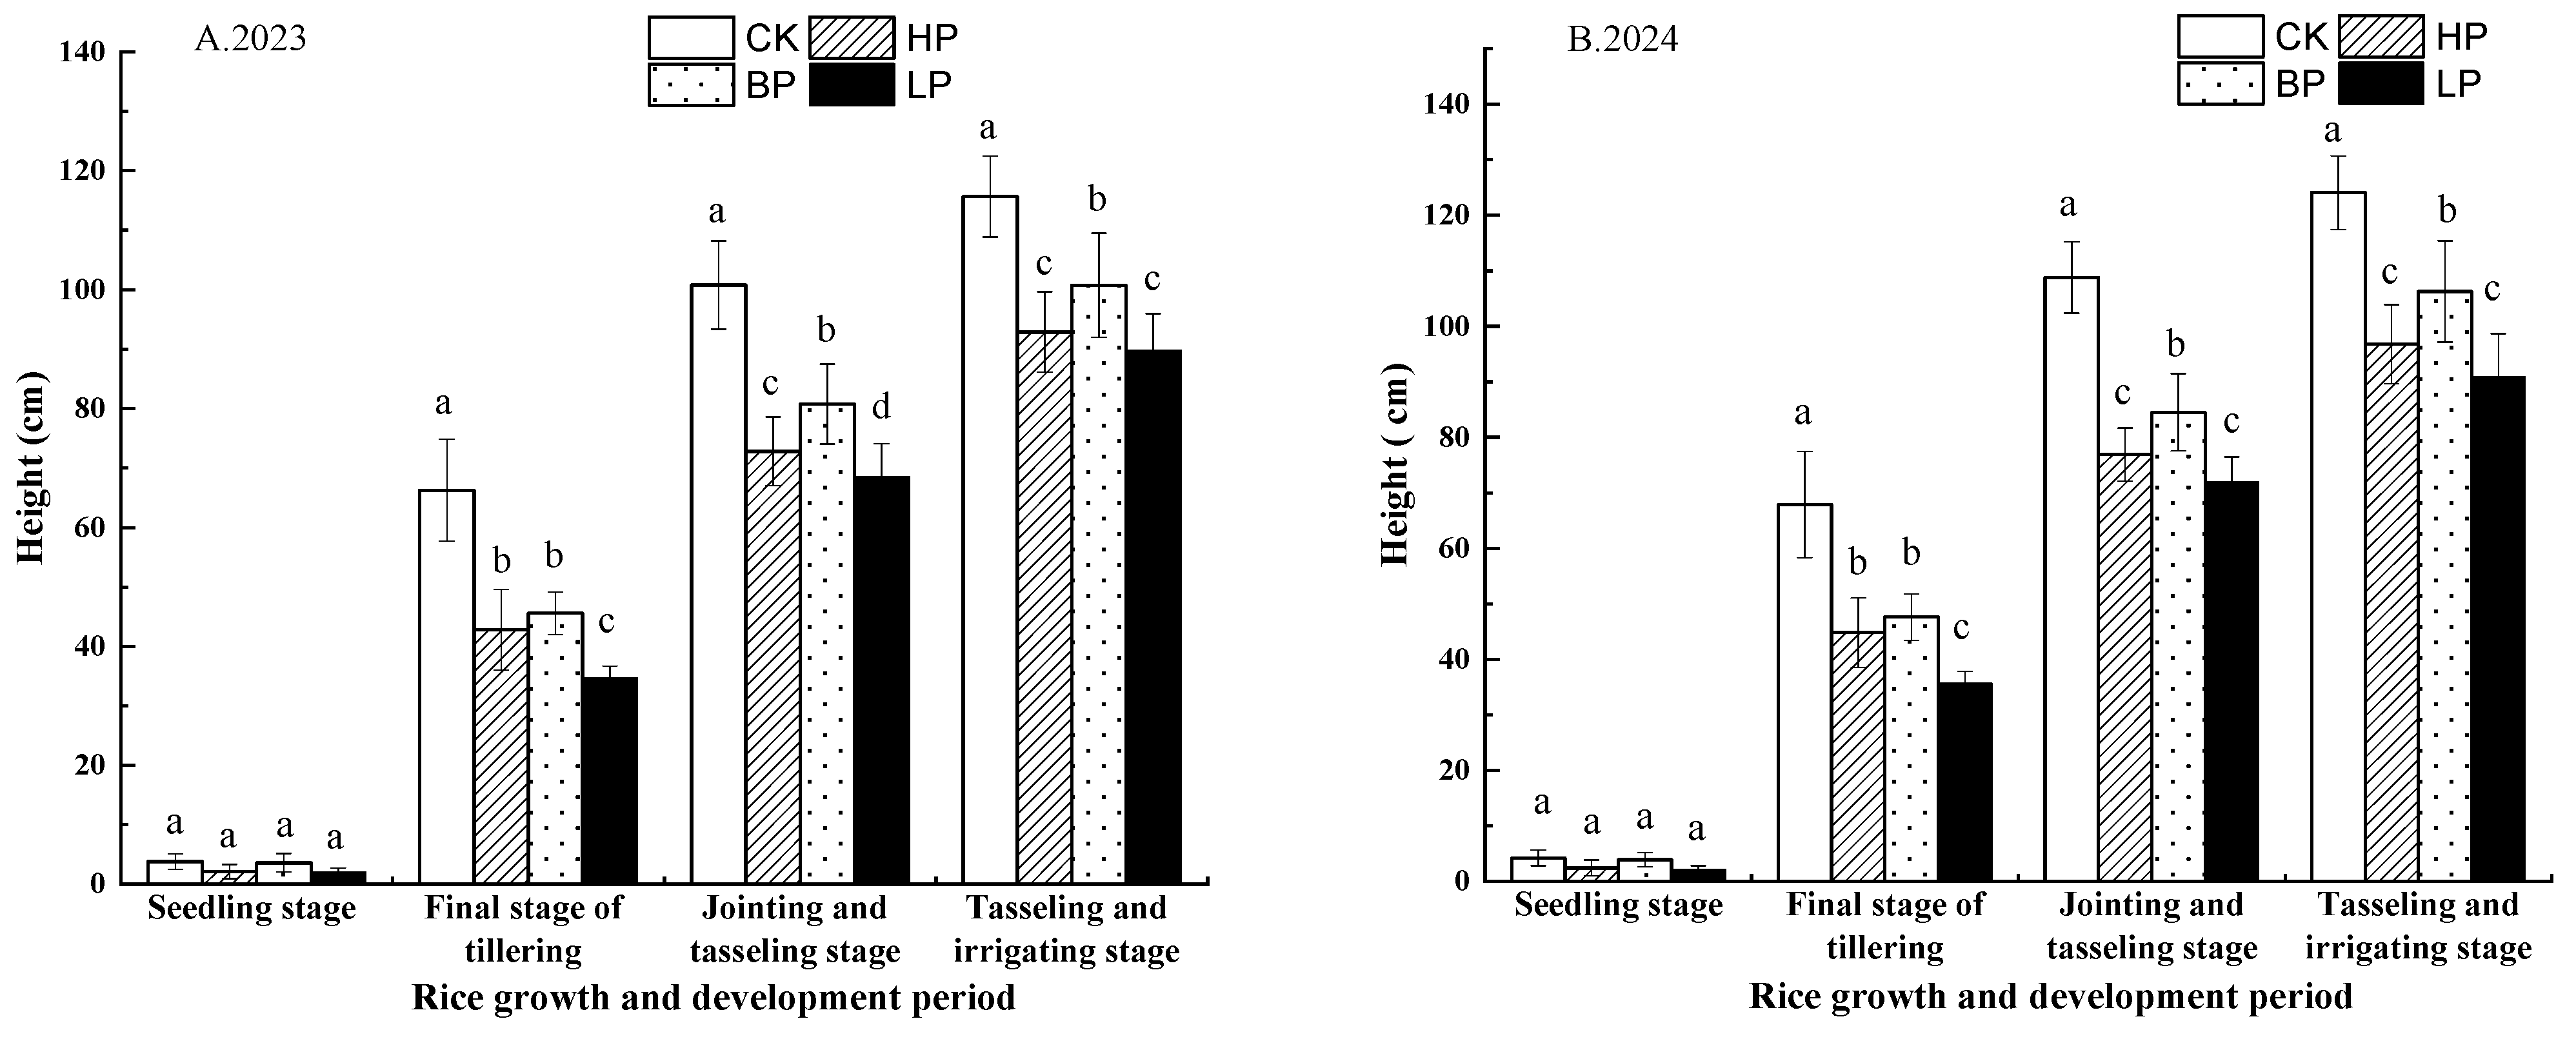
Figure 6.
SPAD values of penultimate leaves at different stages of rice in APV areas (A. 2023, B.2024). The values represent the means of each treatment, and the error bars indicate the standard deviation. Different letters indicate significant differences at p < 0.05.
Figure 6.
SPAD values of penultimate leaves at different stages of rice in APV areas (A. 2023, B.2024). The values represent the means of each treatment, and the error bars indicate the standard deviation. Different letters indicate significant differences at p < 0.05.
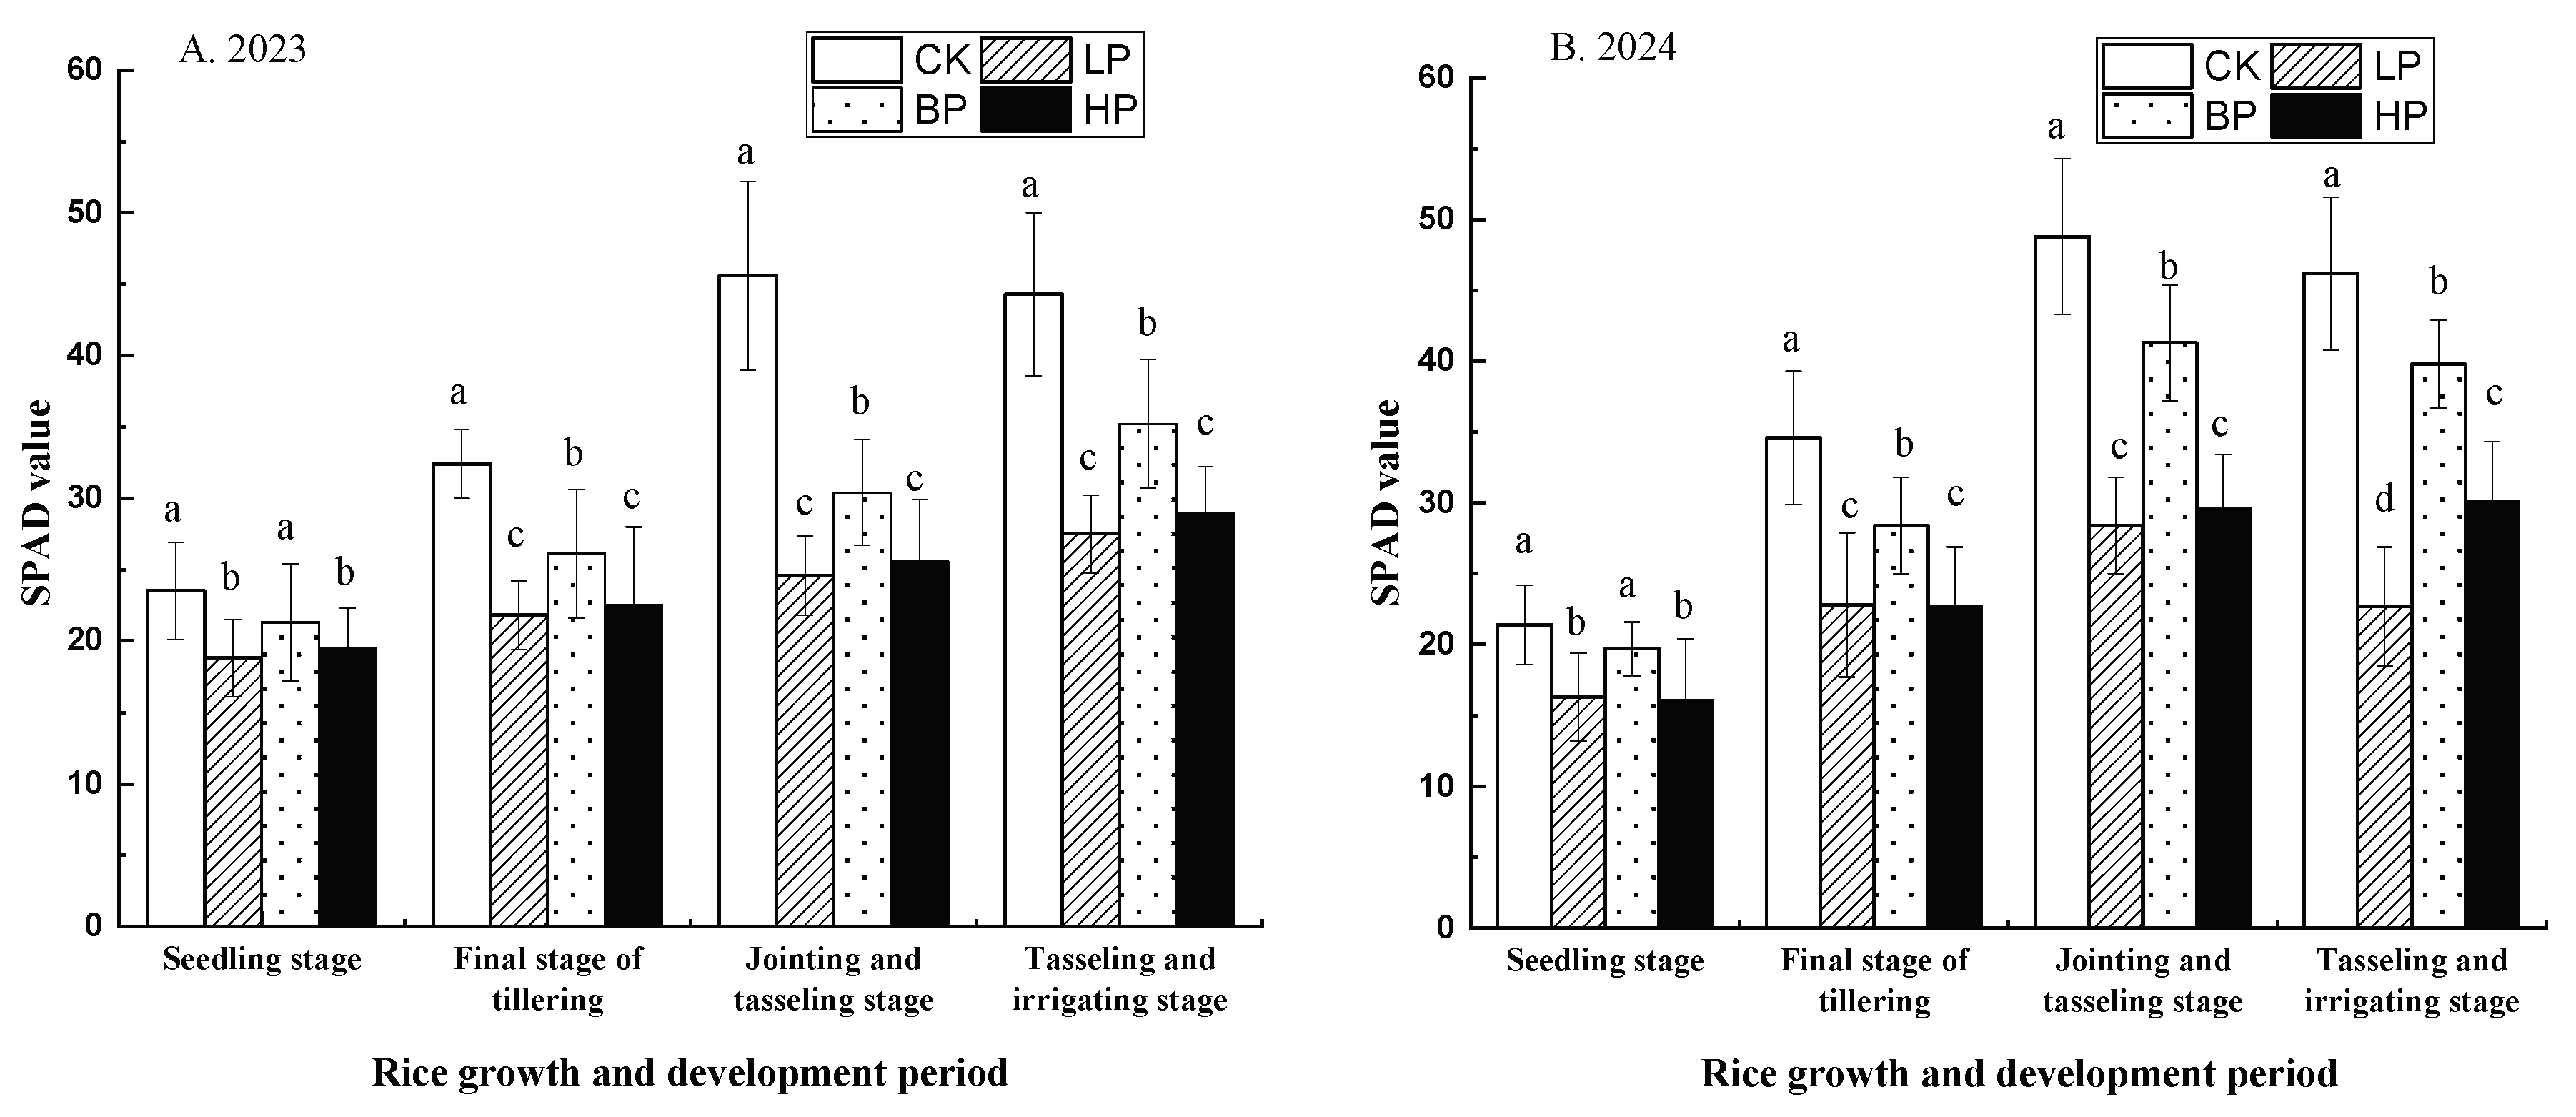

Table 1.
Solar altitude angle, azimuth and effective shadow length on 15 June 2023 in study site.
| Time | Solar declination (°) | Longitude (°) | Solar altitude angle (°) | Solar azimuth angle (°) | Effective shadow length (m) |
|---|---|---|---|---|---|
| 6:00 | 23.33 | 30.15 | 8.2 | 61.3 | 15.00 |
| 7:00 | 23.33 | 30.15 | 20.1 | 74.5 | 3.29 |
| 8:00 | 23.33 | 30.15 | 33.8 | 84.2 | 0.68 |
| 9:00 | 23.33 | 30.15 | 48.3 | 90.1 | 2.15 |
| 10:00 | 23.33 | 30.15 | 62.7 | 109.8 | 2.29 |
| 11:00 | 23.33 | 30.15 | 75.2 | 129.5 | 0.91 |
| 12:00 | 23.33 | 30.15 | 83.1 | 180.5 | 0.54 |
| 13:00 | 23.33 | 30.15 | 75.4 | 230.3 | 0.75 |
| 14:00 | 23.33 | 30.15 | 63.0 | 255.1 | 0.59 |
| 15:00 | 23.33 | 30.15 | 48.7 | 260.3 | 0.67 |
| 16:00 | 23.33 | 30.15 | 34.2 | 275.5 | 0.63 |
| 17:00 | 23.33 | 30.15 | 20.5 | 285.2 | 3.16 |
| 18:00 | 23.33 | 30.15 | 8.7 | 298.4 | 13.99 |
Table 2.
Fitting curves and determination coefficients of effective shadow length of photovoltaic panels for different solar azimuth intervals.
Table 2.
Fitting curves and determination coefficients of effective shadow length of photovoltaic panels for different solar azimuth intervals.
| No of Curve | Azimuthal interval | Fitting function | Decision coefficient R2 |
|---|---|---|---|
| 1 Curve | 0°~90° | y=3.2941x2-53.527x+217.32 | 0.9902 |
| 2 Curve | 90°~180° | y=-0.1295x2+2.1013x-6.1492 | 0.8596 |
| 3 Curve | 180°~270° | y=0.1178x2-3.3411x+24.266 | 0.9999 |
| 4 Curve | 270°~360° | y=4.1552x2-134.6x+1090.5 | 0.9999 |
Table 3.
Sunshine hours in a day for different planting plots of rice in the agro-photovoltaic field on 15 June 2023.
Table 3.
Sunshine hours in a day for different planting plots of rice in the agro-photovoltaic field on 15 June 2023.
| Plot | Azimuth: 0°~90° | Azimuth: 90°~180° | Azimuth: 180°~360° | Total sunshine hours | |||
|---|---|---|---|---|---|---|---|
| Boundary light onset moment | Boundary light end moment | Boundary light onset moment | Boundary light end moment | Boundary light onset moment | Boundary light end moment | ||
| CK | 6.00 | 9.00 | 9.00 | 12.00 | 12.00 | 19.30 | 13.50 |
| LP | 7.96 | 8.29 | - | - | - | - | 0.33 |
| BP | 7.07 | 9.17 | 9.20 | 15.37 | 17.02 | 19.16 | 9.25 |
| HP | - | - | - | - | 15.14 | 17.25 | 2.11 |
Table 4.
Number of stem tillers (mean ± SD) of rice at the end of tillering in different cropping plots in the APV system.
Table 4.
Number of stem tillers (mean ± SD) of rice at the end of tillering in different cropping plots in the APV system.
| Year\Plot | CK | LP | BP | HP |
|---|---|---|---|---|
| 2023 | 9.1±0.99 a | 5.7±0.95 c | 7.8±1.32 b | 7.2±1.14 b |
| 2024 | 9.4±1.12 a | 5.5±0.88 c | 8.0±1.28 b | 7.3±2.15 b |
Note: Different letters in the Table colunm indicate significant differences (p < 0.05) between the treatments.
Table 5.
Daily changes of Pn and Tr in penultimate leaves of rice in APV aera in 2023.
| Time | Pn (μmol·m-2·s-1) | Tr (μmol·m-2·s-1) | ||||||
|---|---|---|---|---|---|---|---|---|
| CK | LP | BP | HP | CK | LP | BP | HP | |
| 10:00 | 18.51±2.12a | 8.82±1.53c | 11.62±0.81b | 8.93±0.71c | 4.81± 0.54a | 2.04 ± 0.24d | 4.01 ± 0.41b | 3.24 ± 0.31c |
| 12:00 | 22.29±1.83a | 7.43±2.02c | 17.21±1.42b | 7.24±0.52c | 6.23 ± 0.62a | 2.41 ± 0.31d | 5.03 ± 0.52b | 3.81 ± 0.42c |
| 14:00 | 16.74±2.01a | 6.61±1.21c | 14.83±1.23b | 6.91±0.73c | 5.54 ± 0.71a | 2.23 ± 0.23d | 4.64 ± 0.61b | 3.52 ± 0.31c |
| 16:00 | 12.43±1.52a | 5.14±1.80d | 10.34±1.31b | 6.52±0.93c | 3.93 ± 0.44a | 1.83 ± 0.24c | 3.52 ± 0.34a | 2.83± 0.21b |
Note: Different letters in the Table colunm indicate significant differences (p < 0.05) between the treatments.
Table 6.
Daily changes of Gs and Ci of rice penultimate leaves in APV system in 2024.
| Time | Gs mmol·m-2·s-1 | Ci μmol·m-2·s-1 | ||||||
|---|---|---|---|---|---|---|---|---|
| CK | LP | BP | HP | CK | LP | BP | HP | |
| 10:00 | 0.35±0.05a | 0.18±0.03c | 0.40±0.06a | 0.30±0.04b | 240.15±20.27c | 320.34±40.14a | 250.34±25.22c | 280.51±30.87b |
| 12:00 | 0.28±0.04b | 0.15±0.03c | 0.35±0.05a | 0.25±0.03b | 260.67±25.15c | 350.64±45.54a | 270.85±20.28c | 310.62±35.33b |
| 14:00 | 0.32±0.06b | 0.17±0.02c | 0.38±0.04a | 0.28±0.05b | 250.19±30.34c | 33028±40.37a | 260.64±25.57c | 290.91±30.18b |
| 16:00 | 0.25±0.03b | 0.22±0.02b | 0.30±0.04a | 0.22±0.03b | 230.22±15.17c | 300.22±35.19a | 240.61±20.75c | 270.34±25.28b |
Note: Different letters in the Table colunm indicate significant differences (p < 0.05) between the treatments.
Table 7.
Yield and composition factors of rice in different plots in APV system.
| Year | Plot | Effective spikes(No/m2) | Fruit rate (%) | Thousand kernel weight (g) | Grain weight per spike (g) | Yield (kg/m2) | Yield reduction rate(%) |
|---|---|---|---|---|---|---|---|
| 2023 | CK | 241.19±4.27a | 84.36 | 26.44±1.54a | 4.13±0.21a | 0.98±0.19a | --- |
| LP | 155.78±4.34c | 49.34 | 24.85±0.88c | 2.26±0.19a | 0.46±0.18b | 53.06 | |
| BP | 188.24±4.71b | 78.15 | 26.13±1.37a | 3.93±0.20a | 0.81±0.16ab | 17.34 | |
| HP | 163.85±4.67c | 61.43 | 25.37±1.42b | 2.97±0.22a | 0.57±0.15ab | 41.18 | |
| 2024 | CK | 249.36±4.36a | 86.78 | 27.11±1.51a | 4.18±0.15a | 1.01±0.17a | --- |
| LP | 157.34±5.10 c | 50.12 | 24.91±1.22a | 2.33±0.17c | 0.47±0.14b | 53.47 | |
| BP | 192.16±4.18b | 78.34 | 27.06±0.97a | 3.98±0.14a | 0.82±0.11ab | 18.81 | |
| HP | 165.65±5.24c | 62.28 | 25.41±1.07a | 3.01±0.12b | 0.58±0.15b | 42.57 |
Note: Different letters in the Table colunm in same year indicate significant differences (p < 0.05) between plots.
Disclaimer/Publisher’s Note: The statements, opinions and data contained in all publications are solely those of the individual author(s) and contributor(s) and not of MDPI and/or the editor(s). MDPI and/or the editor(s) disclaim responsibility for any injury to people or property resulting from any ideas, methods, instructions or products referred to in the content. |
© 2025 by the authors. Licensee MDPI, Basel, Switzerland. This article is an open access article distributed under the terms and conditions of the Creative Commons Attribution (CC BY) license (http://creativecommons.org/licenses/by/4.0/).
Copyright: This open access article is published under a Creative Commons CC BY 4.0 license, which permit the free download, distribution, and reuse, provided that the author and preprint are cited in any reuse.


