
Submitted:
17 July 2025
Posted:
17 July 2025
You are already at the latest version
Abstract
Anion-Exchange Membranes (AEMs) not only enable the fabrication of catalyst-coated membranes without precious metals, but are also projected to achieve a technology-readiness level (TRL) suitable for industrial deployment before the end of this decade. Accurate and reproducible water-uptake data are essential for guiding AEM design, yet conventional gravimetric methods—relying on manual blotting and loosely defined drying steps—can introduce variabilities exceeding 20 %. Here, we present a standardized protocol that transforms water-uptake measurements from rough estimates into precise, comparable “hydration fingerprints.” By replacing manual wiping with a calibrated pressure-blotting rig (0.44 N cm⁻² for 10 s) and verifying both dry and wet states via ATR-FTIR spectroscopy, we dramatically reduce scatter and align our FAAM-PK-75 (Fumatech) results with published benchmarks in DI water, aqueous KOH (0.1–9 M), various alcohols, and controlled humidity (39–96 % RH). These uptake profiles reveal how OH⁻ screening, thermal densification at 60 °C, and PEEK reinforcement govern equilibrium hydration. A low-cost salt-bath method for vapor-phase sorption further distinguishes reinforced from unreinforced architectures. Extending the workflow to additional commercial and custom membranes confirms its broad applicability. Ultimately, this work establishes a new benchmark for AEM hydration testing and provides a predictive toolkit for correlating water content with conductivity, dimensional stability, and membrane–ink interactions during catalyst-coated membrane fabrication.
Keywords:
water uptake
; anion‐exchange membranes
; standardized blotting
; hydration fingerprint
; ATR-FTIR
1. Introduction
1.1. Introduction
Decarbonizing hard-to-electrify sectors demands not only renewable electricity but also robust methods to store, convert and transport energy in chemical form. Water electrolysis delivers green hydrogen directly from water, positioning it as a keystone for clean fuels and industrial feedstocks. Anion-exchange membrane (AEM) electrolyzers have emerged as a next-generation solution to meet the growing demand for sustainable hydrogen. Operating in alkaline media, they replace platinum-group catalysts with earth-abundant metals (e.g., nickel, iron), reducing material criticality and accelerating the oxygen-evolution reaction. This lowers costs and improves cell performance [1,2,3]. Furthermore, AEMs are also poised to benefit from stricter PFAS regulations under EU REACH. However, the performance of these devices hinges, among others, on membrane hydration: water uptake and swelling directly govern hydroxide-ion conductivity, dimensional stability and catalyst-layer morphology. Most current protocols inherit PEM standards (e.g., ANIONE [4]) that overlook hydroxide-specific solvation effects [5] and leave blotting and drying steps vaguely defined, introducing variability of ±20 % or more [6]. Without validated “dry” and “wet” reference states, comparing data across studies or labs remains unreliable. To address this, we introduce the first fully standardized and transparent protocol for measuring water uptake in AEMs. Every step—drying, blotting and soaking—is prescribed in detail, and ATR-FTIR verification confirms both hydration state and drying completeness. By systematically varying medium, temperature and relative humidity, practical “hydration fingerprints” are generated, laying the groundwork for consistent characterization, accelerated membrane development and seamless translation from academia to industry.
1.2. Background and State-of-the-Art
Accurate, reproducible measurement of water uptake and swelling in AEMs is crucial for predicting hydroxide conductivity, dimensional stability, and long-term durability in alkaline electrochemical systems. Yet a survey of the literature reveals alarming discrepancies—even for the same commercial materials under similar conditions. Recent studies highlight this divergence. Khalid et al. [6] report a 35 % thickness increase in FM-FAA3-50 at 60 °C in deionized water—derived from images and permeability testing rather than gravimetric methods—and note PK-75 damage after vacuum drying, underscoring conditioning artifacts. By contrast, Wijaya’s review [7] finds only 23–30 wt % uptake for FAA3-50, while Lee et al. [8] measure 59 % uptake in FAA-3 at 70 °C but omit critical details on soaking medium, drying and blotting. Vandiver et al. [9] distinguish vapor-phase sorption (dynamic vapor sorption, DVS) from liquid-phase swelling in FAA-PEEK, yet do not specify sample-preparation parameters. Commercial datasheets mirror these gaps: Fumatech’s FAAM-PK-75 claims 40–60 % hydration (and 40 % thickness gain) in 1M KOH at 20 °C [10] but provide no replication or handling guidance. Vapor-sorption studies similarly lack consistency. Zheng et al. [11] employed stepwise relative-humidity (RH) environments to probe hydration kinetics in custom poly(phenylene oxide) (PPO) and ethylene tetrafluoroethylene (ETFE)-based AEMs—revealing multi-stage uptake behavior and hysteresis—but did not perform liquid-phase tests or include commercial membranes. Zhang et al. [12] evaluated quaternary phosphonium-trimethylpiperidinium (QPTTP-x) copolymers by soaking in deionized water at 30–80 °C, observing monotonic uptake increases with temperature; however, they also failed to disclose blotting pressure, drying time or equilibrium criteria. Duan et al. [13] reported 10.0 wt % at 50 °C and 11.5 wt% at 80 °C under saturated vapor in an A201 membrane followed by a higher, linearly temperature-dependent uptake after 24 h liquid immersion—an elegant demonstration of Schroeder’s paradox in AEMs. Modelling efforts have likewise advanced our molecular-level understanding. Density-functional theory (DFT) and molecular dynamics (MD) simulations by Luque Di Salvo et al. [5] and Tomasino et al. [14] elucidate water clustering around charged sites, the influence of ion-exchange capacity on hydration shells, and hydrogen-bonding networks within the polymer matrix. However, these computational studies do not attempt experimental validation, omit evaluations of commercial membranes, and lack prescriptions for measurement protocols—limiting their practical impact on standardized testing. Together, these empirical and theoretical reports expose a critical gap: no harmonized, AEM-specific protocol exists for drying, blotting, equilibration or verification of “dry” and “wet” states. Here, we introduce a fully transparent, gravimetric workflow—complete with controlled blotting pressure, defined equilibration criteria and detailed handling procedures—to produce reproducible hydration fingerprints across chemistries, media, temperatures and humidities.
2. Materials and Methods
2.1. Materials
The primary membrane used was FM-FAAM-PK-75 (Fumatech BWT GmbH), which is a 75 µm-thick polysulfone membrane functionalised with quaternary ammonium groups and reinforced with PEEK [10]. For cross-validation, unsupported Fumasep membranes FAA-M-20 and FAA-3-50 (Fumatech) and a self-synthesized AEM were included. All membranes were handled in a clean-room environment, with no ion-exchange pretreatment prior to measurement. Ultrapure deionized water (≥ 18.2 MΩ·cm), analytical-grade or higher KOH solutions (0.1–9 M, Sigma-Aldrich), isopropanol and ethanol (CHEMSOLUTE), glycerol (Roth), and salts for humidity control (MgCl2, NaCl, KNO3; VWR Chemicals) were used as received.
2.2. Water Uptake Determination
Sample Preparation and Drying: Membranes were punched into 17.26×13.33 mm rectangles (Vaessen Creative) and, without any pretreatment, dried over silica gel (Chemdiscount) at ambient temperature (RH 0–5 %, TROTEC BC06) for 72 h. This low-temperature protocol avoids the microstructural changes reported at 50 °C [8]. Dryness was confirmed by ATR-FTIR (IR Affinity-1S, Shimadzu) for one batch, ensuring the absence of water-related bands, before immediate weighing on a calibrated microbalance (±0.1 mg, KERN ADJ). Soaking protocol: Dried samples were immersed for 24 h in the chosen medium—DI water, kalium hydroxide (KOH) solutions (0.1–9 M, Sigma-Aldrich) or organic solvents (isopropanol, ethanol, glycerol)—at either room temperature (in Petri dishes to prevent deformation) or elevated temperature (in sealed vials on an Ohaus HB2DG heating block to guarantee uniform temperature distribution; (see Figure S1)). Blotting and gravimetric analysis: Two blotting methods were compared:
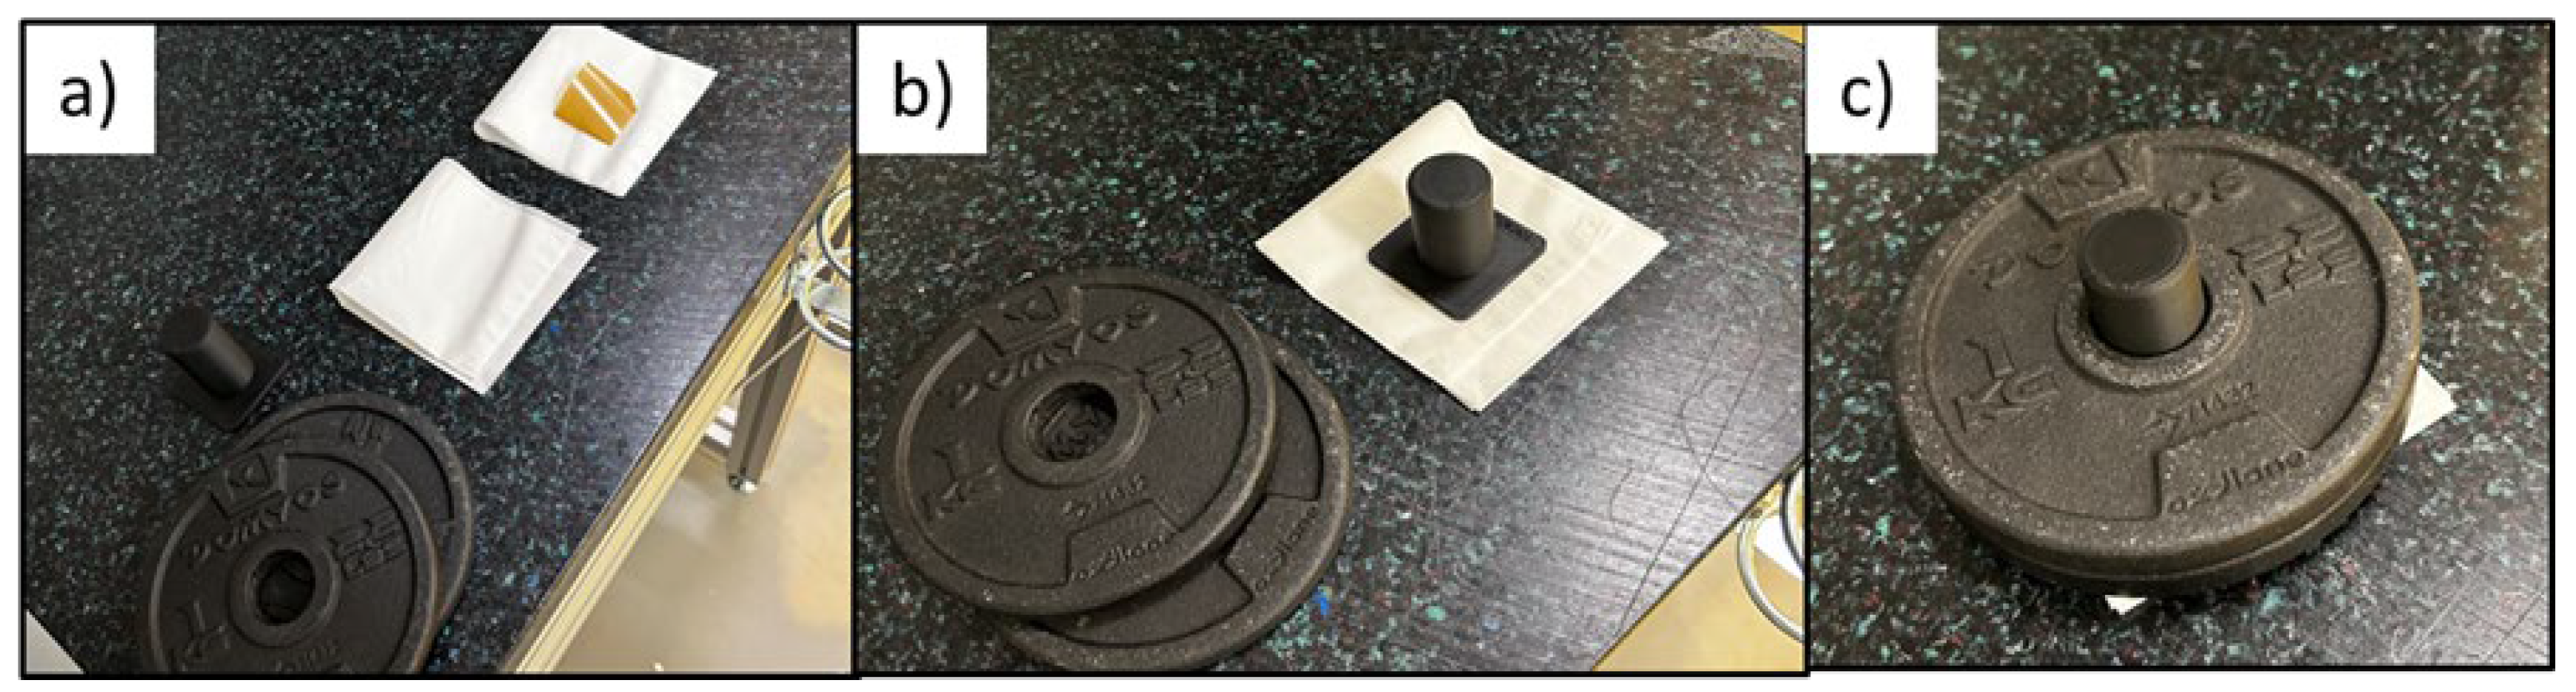
- Standardized pressure-blotting (Figure 1): Samples were sandwiched between two pre-cut Kimtech™ layers, covered with a rigid pressing cap, and compressed twice for 10 s using a 1 kg weight (~0.44 N cm−2). By fixing both pressure and dwell time, this protocol eliminates operator variability and replicates the uniform compression experienced in full-cell assemblies—preventing local deformation while ensuring consistent surface-water removal.
Figure 1.
Stepwise setup of the standardized pressure-blotting procedure used for water uptake measurements in a clean room environment. (a) Blotting materials: membrane, Kimtech layers, pressing cap, and weights. (b) Setup with pressing cap and aligned Kimtech wipes. (c) Defined pressure applied using stacked weights equivalent to 0,44 N cm-2.
After blotting, wet mass (mwet) was recorded and water uptake calculated as:
where mdry is the pre-soaking mass dried on silica gel assuming the weight gain was equal to the weight of the liquid absorbed by the membrane. The complete water-uptake workflow, from sample cutting and drying through soaking, blotting and gravimetric analysis, is illustrated in Figure 2.
WU=(mwet - mdry)/ mdry
2.3. Water Uptake Protocol Variations
To rigorously assess reproducibility and versatility, the water-uptake protocol was subjected to a series of probing experiments in which blotting method, electrolyte strength, temperature, swelling medium and humidity were each varied. First, conventional manual blotting was directly compared to the calibrated pressure-blotting rig in DI water at 23 °C over 24 h. Next, water uptake was mapped across a KOH concentration gradient (0.1–9 M) under identical conditions, and swelling behavior was evaluated at both 23 °C and 60 °C to capture thermal effects. To emulate catalyst-coating environments, membranes were immersed in isopropanol, ethanol and a 50:50 water–glycerol blend, while vapour-phase sorption over saturated salt solutions (33–93 % RH) was employed to simulate gas-exposure scenarios. Cross-validation on three distinct membranes—FAA-3-20, FAA-3-50 and a self-synthesized AEM—under standard conditions (1 M KOH, 24 h, 23 °C) confirmed broad applicability. All measurements were carried out in duplicates. In parallel, ATR-FTIR spectroscopy (IRAffinity-1S, Shimadzu, 4000–600 cm−1, 4 cm−1 resolution, transmission mode) was applied to one test row of FAAM-PK-75 samples in both hydrated (soaked in DI water at RT for 24h) and dried states (over silicagel for 72h) Particular attention was paid to the water-associated O–H stretching region (around 3400 cm−1) to verify both uptake and the completeness of drying achieved by the standardized blotting procedure. Collectively, these studies establish a systematic, application-relevant hydration workflow designed to accelerate the deployment of high-performance AEMs in next-generation energy systems. All protocol variations are summarized in Table 1.
3. Results and Discussion
Water uptake underpins both ion transport and mechanical stability in AEMs and thus governs electrolyzer performance and durability [16]. To disentangle the effects of sample handling and test conditions, FAAM-PK-75 was characterized via a fully validated gravimetric protocol (ATR-FTIR confirmation of dry and wet states). Uptake was then measured as a function of blotting technique, soaking medium, temperature and humidity. Several counter-intuitive trends emerged—most notably, a reduction in water uptake at elevated temperatures—and underscore the importance of rigorous method design. The following sections analyze these results in turn, compare them to published data, and discuss their implications for practical AEM electrolyzer operation.
3.1. Influence of Blotting on water uptake
The type and intensity of blotting exert a dramatic influence on measured water uptake, as illustrated in Figure 3 for samples soaked in DI water. In the conventional approach, blotting pressure can vary widely between operators: test row 1 (orange) and test row 2 (grey)—both using Kimtech™ wipes—yield markedly different uptakes despite identical membranes and soaking conditions. By contrast, the defined pressure-blotting setup (blue) delivers consistent values across multiple users (two users, each two testrows). These operator-dependent differences inflate the scatter and lead to large standard deviations. For DI-water-soaked membranes, uptake values of ~3–4 wt % can swing between roughly 2 wt % and 6 wt %, making it impossible to distinguish subtle trends or define a reliable “true” value. These data suggest that our controlled 0.44 N cm−2 blot reduces operator-to-operator variability by more than 80 %, compared to conventional wiping methods. Such variability, however, also plagues the literature: for instance, swelling of FM-FAA3-50 in DI water at 60 °C has been reported as approximately 35 % by Khalid et al. [6] whereas Tham & Kim [17] observed only ~10 % thickness increase. Wijaya’s review [7] further reports 23–30 wt % water uptake for FAA3-50, and Lee et al. [8] measured as high as 59 % uptake in FAA-3 at 70 °C. This fourfold range in reported values underscores the urgent need for a standardized protocol. ATR-FTIR analysis (see Methods and Figure S2 and Table S1) shows that after our silica-gel drying step, the O–H stretching band at ~3300 cm−1 [18,19] vanishes completely, confirming that both free surface water and loosely bound absorbed water have been removed. In contrast, when we apply only the controlled pressure-blotting, the 3300 cm−1 band remains, demonstrating that blotting eliminates surface moisture while preserving the water held within the polymer matrix.
3.2. Evaluation of effect of KOH concentration on water uptake
Water uptake, swelling characteristics, and conductivity of AEMs are typically evaluated in pure water—largely because existing protocols were adapted from fuel-cell research. However, AEM water electrolyzers operate under entirely different conditions, namely in the presence of supported electrolytes such as aqueous KOH. To better mimic real-world operation, we measured PK-75’s water uptake not only in deionized (DI) water but also across KOH concentrations from 0.1 M to 9 M as shown in Figure 4. The FAAM-PK-75 shows a pronounced “dip-and-rise” hydration response when different samples are soaked independently across the KOH series. In DI water, the membranes absorb roughly 9 wt % water. By contrast, immersion in 0.1 M KOH lowers uptake to about 5 wt %, after which the water content climbs steadily with increasing KOH concentration—surpassing the DI-water value above 6 M and reaching a maxium of approximately 11 wt % in 9 M KOH. It is suggested that this biphasic trend reflects two competing ionic effects. In DI water, the membrane’s interior—packed with fixed quaternary-ammonium sites and their Br− counter-ions—creates a huge osmotic pressure gradient against the pure, ion-free bath, so pure H2O floods in to relieve that imbalance and drives uptake to ≈ 9 wt % (see Figure 5b). At low to moderate [KOH], the added salt sharply reduces that osmotic gradient and the invading OH− screens the fixed charges, collapsing the hydrophilic nano-domains and producing the pronounced uptake minimum (see Figure 5c). Boström et al. [20] observed a similar monotonic decline in water uptake for PBI-based AEMs up to 2 M KOH, attributing it to this same balance of osmotic and Donnan forces. Beyond ≈ 6 M, however, the Donnan exclusion barrier [21] (i.e., the electrostatic exclusion of co-ions by the membrane’s fixed charges, which must be overcome before salt and water can freely partition) weakens: K+ co-ions begin to penetrate alongside OH−, and the overwhelming external osmotic pressure then forces water (and salt) back into the nano-channels, re-expanding the domains. Najibah et al. [21] reported that PBI based membranes show an initial drop in conductivity (in line with reduced swelling) in KOH solutions of 0.5 M, then recover at 1 M when Donnan exclusion fades and salt uptake increases (see Figure 5d). Similarly, Khalid et al. [7] measured FAAM-PK-75 (both OH- and Cl-exchanged) swelling of ≈ 7 wt % in DI water at room temperature, which fell to ≈ 5 wt % in 1 M KOH, before rebounding at higher concentrations. The quantitative agreement across these independent studies—different chemistries, measurement protocols, and property end-points—confirms that our standardized pressure-blot method faithfully captures the underlying interplay of screening and osmotic driving forces that governs AEM hydration.
3.3. Temperature-dependent water uptake behaviour
Figure 6 compares the 24 h water uptake of FAAM-PK-75 in both DI water and 1 M KOH at 23 °C versus 60 °C. In DI water, uptake falls dramatically—approximately 9 % at 23 °C down to 4.5 % at 60 °C—whereas in 1 M KOH, hydration rises slightly from about 6.4 % at 23 °C to 7.5 % at 60 °C. Most literature AEM studies report the opposite trend [16]. For example, Duan et al. [22] measured a polyamine-based AEM in pure water and saw a steady increase in uptake from 25 °C to 80 °C. Ahmed et al. [23] observed higher proton-exchange membrane hydration at elevated temperature in acidic environments. Pandey et al. [19] and Vandiver et al. [11] used vapor-phase sorption (DI water) at controlled relative humidity and noted increased water content at higher temperature (60°C compared to 30°C) under a given humidity. In DI water, PK-75 therefore contrasts these literature trends by losing nearly half its uptake at 60 °C. Thermal analysis might help explain this behaviour: TGA (Supplementary Figure S3) shows <1 % mass loss up to 200 °C, and DSC (Supplementary Figure S4) reveals only a weak, broad transition below ≈ 150 °C, making chemical degradation unlikely. Instead, it is suggested that warming to 60 °C gives just enough segmental mobility for the polysulfone backbone to relax into a slightly denser packing [14]. This “thermal tightening” would shrink the hydrophilic nano-domains, reducing the free volume available—so even though diffusion is faster at 60 °C, there simply isn’t enough space for as many water molecules, and uptake falls sharply in DI water (see Figure 6e). A directly analogous effect was observed in Nafion: when mildly annealed, its water content (λ) drops despite the temperature rise, as described by Kusoglu and Weber [24]. In 1 M KOH, however the abundant external OH− ions might already partially screen the quaternary-ammonium sites at 23 °C, so the channels can’t swell as much to begin with (see Figure 6c, Section 3.3). Heating to 60 °C then could provide faster diffusion, which might just barely outweigh any further densification, resulting in a small net increase in uptake rather than a drop (see Figure 6f). At higher KOH concentrations (≥ 6 M, Section 4.3), screening and osmotic pressure combine to re-expand the channels, so uptake climbs again—producing the minimum near 1 M. These findings, summarised schematically in Figure 6, illustrate why FAAM-PK-75 possibly behaves differently to many other AEMs in DI. It is also important to note that water uptake must be measured at the actual operating temperature and medium of interest, since both factors can drastically alter channel morphology. Potential follow-on SAXS/WAXS or DMA studies couldconfirm whether domain shrinking or modulus changes accompany the proposed thermal densification. These findings emphasize that temperature effects on FAAM-PK-75 hydration are highly dependent on the ionic environment, and that operating above room temperature—even in 1 M KOH—can improve hydration (albeit less dramatically than in DI water). Consequently, FAAM-PK-75 may require extra humidification or a higher KOH feed to maintain peak conductivity in an elevated-temperature electrolyzer.
3.4. Effect of swelling media on water uptake behaviour
To simulate conditions encountered during catalyst-coated membrane (CCM) fabrication—where uncontrolled expansion can compromise catalyst adhesion—FAAM-PK-75 samples were soaked for 24 h at 23 °C in deionized (DI) water, isopropanol (IPA; 2-propanol), ethanol (EtOH), and a 50:50 wt % glycerol/DI water blend, then pressure-blotted using our standardized protocol. As shown in Figure 7, DI water produces the highest uptake (~ 9 wt %), whereas all organic solvents induce much lower uptake: IPA (~ 1,5 wt %), glycerol/DI (~ 4 wt %) and EtOH (~ 5 wt %). These rankings (IPA < EtOH < DI water) echo literature findings for ion-exchange membranes in alcohols. Laín and Barragán [15] measured four commercial AEMs at 30 °C in water, methanol (MeOH), EtOH, and 1-propanol (IPA). They explained that heterogeneous AEMs swell more in aqueous mixtures than in neat alcohols because their larger, more tortuous hydrophilic domains absorb water readily, while longer-chain or more viscous alcohols form larger hydrogen-bonded aggregates that cannot penetrate those domains as easily—yielding the observed order (IPA ≈ 3–4 wt % < EtOH ≈ 5–6 wt % < H2O). Godino et al. [25] reported –(althouth for a proton-exchange membrane (PEM)) Nafion 117 at 25 °C—tested both in pure alcohols and in the same alcohols containing 1 M KOH—that uptake follows IPA (~ 3.0 wt %) < 2-PrOH (~ 3.5 wt %) < MeOH (~ 5.1 wt %) < EtOH (~ 7.2 wt %), even under 1 M KOH. There, OH− partial screening modestly collapses channels across all solvents but does not change the ranking. Yi and Bae [26] found for PEMs at 273 K that swelling decreases as alcohol chain length and steric bulk increase (MeOH ≈ 132 % > EtOH ≈ 90 % > 1PA ≈ 60 % > 2-PrOH ≈ 55 %), attributing this to lower polarity (dielectric constant ε) and increased steric hindrance reducing hydrogen-bonding affinity with sulfonic groups. Mechanistically, three factors dominate:
- Polarity (dielectric constant ε). DI water (ε ≈ 80) strongly solvates quaternary-ammonium sites and OH− counter-ions, generating high osmotic pressure and maximal swelling. EtOH (ε ≈ 24) has lower polarity, so it cannot solvate ionic sites as effectively—yielding moderate uptake (~ 5 wt %). IPA (ε ≈ 18) is less polar still, so it forms fewer hydrogen bonds with ionic centers, resulting in minimal uptake (~ 3 wt %). A lower dielectric constant means the solvent cannot screen fixed charges or stabilize ion clusters as well, so its affinity for sulfonic-acid (or quaternary-ammonium) sites is reduced and swelling is suppressed [26].
- Molecular size and viscosity. IPA’s branched structure and higher viscosity (≈ 2 cP at 20 °C) hinder its diffusion into sub-nanometer hydrophilic channels, limiting uptake. EtOH (≈ 1.2 cP) diffuses more readily, while glycerol/DI (ε ≈ 50–55; high viscosity from glycerol’s three –OH groups) swells moderately (~ 6 wt %) by partially hydrating without full domain expansion [15].
- Hydrogen-bonding affinity. Glycerol’s multiple –OH groups support strong hydrogen-bond networks that partially hydrate and plasticize the polymer backbone. EtOH forms fewer hydrogen bonds, and IPA’s single –OH (in a branched environment) yields a weaker, less extensive network, reducing its ability to open ionic channels [15]. All relevant paramters of the solvents are summarized in table S2 in the supplementary. From a practical standpoint, these uptake measurements could guide the selection of ink composition (e.g., ratio DI to solvent – “dry ink” versus “liquid medium” ratios) or solvent type to minimize swelling and optimize the catalyst-membrane interface. In particular, pre-treatment in any solvent immediately before ink application may help preserve membrane planarity, reduce delamination risk, and improve catalyst adhesion. Further studies—examining water uptake in different “DI to solvent ratios”, mixed-solvent systems, or extended exposure times—are necessary to identify a more clear correlation between water uptake and the ideal ink formulation.
3.5. Effect of relative humidity on water uptake behaviour
Figure 8 shows FAAM-PK-75’s water uptake under three controlled RH atmospheres (≈ 39 %, 74 % and 96 % at 23 °C). Strikingly, the membrane absorbs a nearly constant ~ 5 wt % water at all humidity levels. This near-invariance suggests that the PEEK reinforcement mechanically caps swelling of the hydrophilic network: regardless of how much water the vapor phase supplies, the stiff support prevents further domain expansion, locking in ~ 5 wt % hydration. These data suggest that PEEK reinforcement effectively limits vapor-phase swelling, although testing across a broader set of temperatures and chemistries will be needed to confirm the universality of this behavior. A literature precedent supports this interpretation—Vandiver et al. [9] likewise observed a ~ 5 wt % plateau in gas-phase uptake for a PEEK-reinforced AEM at 30 °C—whereas an unsupported, dual-domain ionomer showed monotonic uptake increases as RH rose [19]. To test the protocol’s sensitivity to structural differences, proof-of-concept studies were carried out on a PEEK-reinforced PEM (FM-F-990-PK) and on unreinforced Nafion™ N117 (Supplementary Figure S5). The reinforced PEM plateaued at ~ 2 wt %, while Nafion™ swelled from ~ 5 wt % at 39 % RH to ~ 14 wt % at 96 % RH—mirroring Pandey’s findings. These side experiments confirm that our simple, salt-controlled vapor-sorption protocol can discriminate between reinforced and unreinforced membranes. While these proof-of-concept studies demonstrate the protocol’s sensitivity to structural differences, additional experiments on diverse AEM formulations will be required to fully establish its discriminative power. Overall, this straightforward, low-cost screening tool offers a rapid estimate of vapor-phase hydration under both water-electrolysis conditions and during coating or handling atmospheres. Extending these studies across a wider range of AEM chemistries will be essential to fully validate its general applicability.
3.6. Cross-validation wither other AEMs
To demonstrate the broad applicability of our method, we soaked four different membranes—FAAM-20, FAAM-PK-75, FAA-3-50 and a self-synthesized AEM—in 1 M KOH for 24 h at 23 °C, then applied the standardized pressure-blotting procedure. As shown in Figure 9, water uptake increases monotonically from FAAM-20 (≈12 ± 1 wt %), to FAAM-PK-75 (≈24 ± 2 wt %), FAA-3-50 (≈57 ± 3 wt %) and ultimately the self-synthesized AEM (≈62 ± 4 wt %). Importantly, the ordering of PK-75 below FAA-3-50 mirrors independent findings: Khalid et al. [27] reported ≈8 wt % uptake for PK-75 versus ≈22 wt % for FAA-3-50 in 1 M KOH, and Najibah et al. [21] observed PK-75 uptakes of ≈15 wt % (0.1 M KOH) and ≈25 wt % (1 M KOH) compared to FAA-3-50’s ≈50 wt % and ≈55 wt % under the same conditions. Even though Fumatech’s datasheets [10,28,29] report larger absolute swelling in 9–12 M KOH, they preserve the same hydration hierarchy (FAAM-20 < PK-75 < FAA-3-50-see Supplementary table S3). These cross-validation tests confirm that our controlled pressure-blotting protocol not only reproduces absolute uptake values with low scatter (SD < 5 %) but also faithfully captures the relative water-absorption trends across chemically diverse AEMs.
4. Conclusions
We have developed and validated a robust, reproducible gravimetric protocol for measuring water uptake in AEMs. By replacing ambiguous, operator-dependent blotting with a defined 0.44 N cm−2 pressure-blot and confirming complete drying via ATR-FTIR, we’ve eliminated the single largest source of scatter in conventional methods—while also reproducing key uptake benchmarks for FAA-3-20, FAA-3-50 and FAAM-PK-75. The baseline sequence is straightforward: First, membranes are dried over silica gel for 72 h; next, they are immersed in 1 M KOH at 23 °C for 24 h; finally, a 0.44 N cm−2 pressure blot is applied for 30 s to define the “wet” mass. Under these controlled conditions, each water-uptake profile becomes a unique hydration fingerprint, revealing how four factors govern equilibrium hydration:
- KOH concentration: Uptake drops from ≈ 9 wt % in DI water to ≈ 6 wt % at 1 M KOH (due to OH− screening), then climbs to ≈ 11 wt % by 9 M as osmotic swelling overtakes screening.
- Swelling medium: Organic solvents rank isopropanol (~ 1,5 wt %) < glycerol/DI (~ 4 wt %) < ethanol (~ 5 wt %) < DI water (~ 9 wt %), suggesting IPA as a low-swelling pre-soak for ink compatibility.
- Temperature: Heating from 23 °C to 60 °C roughly halves uptake in DI water (thermal densification), while in 1 M KOH a modest +2 % increase indicates that external OH− partially counteracts densification.
- Relative humidity: Vapor-phase sorption over 39–96 % RH yields a steady ≈ 5 wt % uptake for FAAM-PK-75, demonstrating that PEEK reinforcement caps gas-phase swelling—and confirming that saturated-salt environments offer a simple, reliable method for controlled-RH measurements.
These hydration fingerprints correlate directly with critical performance metrics—ionic conductivity, dimensional stability and coating compatibility—positioning gravimetric water-uptake measurements as a powerful tool for elucidating structure–property relationships in AEMs. While the baseline protocol readily distinguishes significant differences among membranes, variations in soaking medium, temperature or equilibration time can be applied to probe specific chemistries or operational scenarios in greater depth.
5. Outlook
Our standardized water-uptake protocol unlocks a host of follow-on studies. In the near term, the gravimetric + ATR-FTIR workflow can be applied directly to leading commercial AEMs (e.g., Sustainion®, Piperion®) as well as newly synthesized chemistries, allowing us to map how backbone structure, ion-exchange capacity and reinforcement strategies dictate hydration across the material landscape. Introducing mixed-salt baths will let us populate the gaps between 39–96 % RH and generate a high-resolution gas-phase sorption isotherm. By coupling precise uptake curves with ionic-conductivity measurements, it will be possible to uncover quantitative hydration–transport relationships, directly tying water content to hydroxide mobility. At the same time, systematic pre-conditioning experiments in various solvent blends—from simple alcohols to full catalyst-ink formulations—could identify pre-soaks that virtually eliminate swelling during catalyst-coated membrane fabrication. Taken together, these straightforward, low-cost water-uptake assays promise a predictive toolbox for membrane design, process optimization and the accelerated rollout of next-generation AEM electrolyzers.
Supplementary Materials
The following supporting information can be downloaded at the website of this paper posted on Preprints.org.
Author Contributions
Conceptualization, S.E.T.; methodology, S.E.T.; investigation, S.E.T., D.Ö., R.B., and J.B.; supporting IR experiments- C.S., writing—original draft preparation, S.E.T.; writing—review & editing, D.Ö., C.S., and R.W. All authors have read and agreed to the published version of the manuscript.
Funding
The research activities were conducted based on the funding programm „european fond on regional development” (EFRE), therefore the authors thanks the funding provider ministry of science and arts (county Baden-Wuerttemberg) as well as the European Union.
Data Availability Statement
The original data presented in the study are openly available in FigShare at 10.6084/m9.figshare.29571860.
Acknowledgments
We thank A.Melzer-Bartsch for his support during TGA and DSC measurements.
Conflicts of Interest
The authors declare no conflicts of interest.
Generative AI Disclosure
During the preparation of this work, the author (S.E. Temmel) used OpenAI’s ChatGPT to improve the writing and structuring of the manuscript. After using this tool, the author reviewed and edited the content as needed and takes full responsibility for the final published article.
Abbreviations
The following abbreviations and variables are used in the publication
Table of Abbreviations and variables
| Abbreviation/Variables | Definition |
| AEM | Anion-exchange membrane |
| ATR-FTIR | Attenuated total reflectance-Fourier transform infrared spectroscopy |
| CCM | Catalyst-coated membrane |
| DFT | Density-functional theory |
| DI | Deionized (water) |
| DVS | Dynamic vapor sorption |
| DSC | Differential scanning calorimetry |
| EIS | Electrochemical impedance spectroscopy |
| ETFE | Ethylene tetrafluoroethylene |
| IEC | Ion-exchange capacity |
| IPA | Isopropanol (2-propanol) |
| KOH | Potassium hydroxide |
| MeOH | Methanol |
| MD | Molecular dynamics |
| PEEK | Polyether ether ketone |
| PPO | Poly(phenylene oxide) |
| QPTTP-x | Quaternary phosphonium-trimethylpiperidinium copolymers |
| RH | Relative humidity |
| TGA | Thermogravimetric analysis |
| WU | Water uptake |
| mdry | Dried mass of the membrane |
| mwet | Wet mass of the membrane |
References
- Chatenet, M.; Pollet, B. G.; Dekel, D. R.; Dionigi, F.; Deseure, J.; Millet, P.; Braatz, R. D.; Bazant, M. Z.; Eikerling, M.; Staffell, I.; Balcombe, P.; Shao-Horn, Y.; Schäfer, H. Water Electrolysis: From Textbook Knowledge to the Latest Scientific Strategies and Industrial Developments. Chem. Soc. Rev. 2022, 51 (11), 4583–4762. https://doi.org/10.1039/D0CS01079K. [CrossRef]
- Ashdot, A.; Kattan, M.; Kitayev, A.; Tal-Gutelmacher, E.; Amel, A.; Page, M. Design Strategies for Alkaline Exchange Membrane–Electrode Assemblies: Optimization for Fuel Cells and Electrolyzers. Membranes 2021, 11 (9), 686. https://doi.org/10.3390/membranes11090686. [CrossRef]
- Henkensmeier, D.; Cho, W.-C.; Jannasch, P.; Stojadinovic, J.; Li, Q.; Aili, D.; Jensen, J. O. Separators and Membranes for Advanced Alkaline Water Electrolysis. Chem. Rev. 2024, 124 (10), 6393–6443. https://doi.org/10.1021/acs.chemrev.3c00694. [CrossRef]
- ANION CORDIS, Grant agreement ID: 875024, Doi: 10.3030/875024. [CrossRef]
- Luque Di Salvo, J.; De Luca, G.; Cipollina, A.; Micale, G. Effect of Ion Exchange Capacity and Water Uptake on Hydroxide Transport in PSU-TMA Membranes: A DFT and Molecular Dynamics Study. Journal of Membrane Science 2020, 599, 117837. https://doi.org/10.1016/j.memsci.2020.117837. [CrossRef]
- Khalid, H.; Najibah, M.; Park, H.; Bae, C.; Henkensmeier, D. Properties of Anion Exchange Membranes with a Focus on Water Electrolysis. Membranes 2022, 12 (10), 989. https://doi.org/10.3390/membranes12100989. [CrossRef]
- Wijaya, G. H. A.; Im, K. S.; Nam, S. Y. Advancements in Commercial Anion Exchange Membranes: A Review of Membrane Properties in Water Electrolysis Applications. Desalination and Water Treatment 2024, 320, 100605. https://doi.org/10.1016/j.dwt.2024.100605. [CrossRef]
- Lee, S. J.; Shin, S.-H.; Cha, M. S.; Yang, S. H.; Kim, T. H.; Cho, H. J.; Oh, K.-H.; Kim, T.-H.; Kim, S.; Lee, J. Y. Anisotropic Polyphenylene-Based Anion-Exchange Membranes with Flexible Side-Chains via Click Reaction for High-Performance Water Electrolysis. Materials Today Energy 2024, 43, 101602. https://doi.org/10.1016/j.mtener.2024.101602. [CrossRef]
- Vandiver, M. A.; Caire, B. R.; Carver, J. R.; Waldrop, K.; Hibbs, M. R.; Varcoe, J. R.; Herring, A. M.; Liberatore, M. W. Mechanical Characterization of Anion Exchange Membranes by Extensional Rheology under Controlled Hydration. J. Electrochem. Soc. 2014, 161 (10), H677–H683. https://doi.org/10.1149/2.0971410jes. [CrossRef]
- Fumasep FAAM-PK-75 Datasheet.
- Zheng, Y.; Ash, U.; Pandey, R. P.; Ozioko, A. G.; Ponce-González, J.; Handl, M.; Weissbach, T.; Varcoe, J. R.; Holdcroft, S.; Liberatore, M. W.; Hiesgen, R.; Dekel, D. R. Water Uptake Study of Anion Exchange Membranes. Macromolecules 2018, 51 (9), 3264–3278. https://doi.org/10.1021/acs.macromol.8b00034. [CrossRef]
- Zhang, S.; Li, X.; Yang, Y.; Li, J.; Zheng, J.; Zhang, S. Microporous and Low Swelling Branched Poly(Aryl Piperidinium) Anion Exchange Membranes for High-Performed Water Electrolyzers. Journal of Membrane Science 2024, 698, 122587. https://doi.org/10.1016/j.memsci.2024.122587. [CrossRef]
- Duan, Q.; Ge, S.; Wang, C.-Y. Water Uptake, Ionic Conductivity and Swelling Properties of Anion-Exchange Membrane. Journal of Power Sources 2013, 243, 773–778. https://doi.org/10.1016/j.jpowsour.2013.06.095. [CrossRef]
- Tomasino, E.; Mukherjee, B.; Ataollahi, N.; Scardi, P. Water Uptake in an Anion Exchange Membrane Based on Polyamine: A First-Principles Study. J. Phys. Chem. B 2022, 126 (38), 7418–7428. https://doi.org/10.1021/acs.jpcb.2c04115. [CrossRef]
- Laín, L.; Barragán, V. M. Swelling Properties of Alkali-Metal Doped Polymeric Anion-Exchange Membranes in Alcohol Media for Application in Fuel Cells. International Journal of Hydrogen Energy 2016, 41 (32), 14160–14170. https://doi.org/10.1016/j.ijhydene.2016.05.283. [CrossRef]
- Ge, Q.; Zhu, X.; Yang, Z. Highly Conductive and Water-Swelling Resistant Anion Exchange Membrane for Alkaline Fuel Cells. IJMS 2019, 20 (14), 3470. https://doi.org/10.3390/ijms20143470. [CrossRef]
- Tham, D. D.; Kim, D. C2 and N3 Substituted Imidazolium Functionalized Poly(Arylene Ether Ketone) Anion Exchange Membrane for Water Electrolysis with Improved Chemical Stability. Journal of Membrane Science 2019, 581, 139–149. https://doi.org/10.1016/j.memsci.2019.03.060. [CrossRef]
- Rana, Md. M.; Rajkumar, P.; Kang, B.-S.; Park, G.; Sun, H.-J.; Kim, S. Y.; Lee, H.-K.; Shim, J. Optimizing Membrane Pretreatment for Improved Performance of Anion Exchange Membrane-Unitized Regenerative Fuel Cells. J Appl Electrochem 2024, 54 (1), 53–63. https://doi.org/10.1007/s10800-023-01950-8. [CrossRef]
- Pandey, T. P.; Maes, A. M.; Sarode, H. N.; Peters, B. D.; Lavina, S.; Vezzù, K.; Yang, Y.; Poynton, S. D.; Varcoe, J. R.; Seifert, S.; Liberatore, M. W.; Di Noto, V.; Herring, A. M. Interplay between Water Uptake, Ion Interactions, and Conductivity in an e-Beam Grafted Poly(Ethylene-Co-Tetrafluoroethylene) Anion Exchange Membrane. Phys. Chem. Chem. Phys. 2015, 17 (6), 4367–4378. https://doi.org/10.1039/C4CP05755D. [CrossRef]
- Boström, O.; Choi, S.-Y.; Xia, L.; Meital, S.; Lohmann-Richters, F.; Jannasch, P. Alkali-Stable Polybenzimidazole Anion Exchange Membranes Tethered with N , N -Dimethylpiperidinium Cations for Dilute Aqueous KOH Fed Water Electrolyzers. J. Mater. Chem. A 2023, 11 (39), 21170–21182. https://doi.org/10.1039/D3TA03216G. [CrossRef]
- Najibah, M.; Tsoy, E.; Khalid, H.; Chen, Y.; Li, Q.; Bae, C.; Hnát, J.; Plevová, M.; Bouzek, K.; Jang, J. H.; Park, H. S.; Henkensmeier, D. PBI Nanofiber Mat-Reinforced Anion Exchange Membranes with Covalently Linked Interfaces for Use in Water Electrolysers. Journal of Membrane Science 2021, 640, 119832. https://doi.org/10.1016/j.memsci.2021.119832. [CrossRef]
- Duan, Q.; Ge, S.; Wang, C.-Y. Water Uptake, Ionic Conductivity and Swelling Properties of Anion-Exchange Membrane. Journal of Power Sources 2013, 243, 773–778. https://doi.org/10.1016/j.jpowsour.2013.06.095. [CrossRef]
- Ahmed, F.; Sutradhar, S. C.; Ryu, T.; Jang, H.; Choi, K.; Yang, H.; Yoon, S.; Rahman, Md. M.; Kim, W. Comparative Study of Sulfonated Branched and Linear Poly(Phenylene)s Polymer Electrolyte Membranes for Fuel Cells. International Journal of Hydrogen Energy 2018, 43 (10), 5374–5385. https://doi.org/10.1016/j.ijhydene.2017.08.175. [CrossRef]
- Kusoglu, A.; Weber, A. Z. New Insights into Perfluorinated Sulfonic-Acid Ionomers. Chem. Rev. 2017, 117 (3), 987–1104. https://doi.org/10.1021/acs.chemrev.6b00159. [CrossRef]
- Godino, M. P.; Barragán, V. M.; Villaluenga, J. P. G.; Izquierdo-Gil, M. A.; Ruiz-Bauzá, C.; Seoane, B. Liquid Transport through Sulfonated Cation-Exchange Membranes for Different Water–Alcohol Solutions. Chemical Engineering Journal 2010, 162 (2), 643–648. https://doi.org/10.1016/j.cej.2010.06.013. [CrossRef]
- Yi, Y. D.; Bae, Y. C. Swelling Behaviors of Proton Exchange Membranes in Alcohols. Polymer 2017, 130, 112–123. https://doi.org/10.1016/j.polymer.2017.09.069. [CrossRef]
- Khan, M. I.; Khraisheh, M. Synthesis and Characterization of Stable Anion Exchange Membranes for Desalination Applications. Desalination and Water Treatment 2018, 113, 36–44. https://doi.org/10.5004/dwt.2018.22277. [CrossRef]
- Fumasep-Faa-3-50-Technical-Specifications.
- Fumasep FAAM-20-Technical Specifications.
- PubChem- Isopropyl Alcohol-https://pubchem.ncbi.nlm.nih.gov/compound/Isopropyl-Alcohol#section=Viscosity.
- PubChem- Ethanol-https://pubchem.ncbi.nlm.nih.gov/compound/702.
- CAS Common Chemistry Isopropanol Data Sheet. https://commonchemistry.cas.org/detail?ref=67-63-0.
- Properties of Solvents Used in Organic Chemistry-http://murov.info/orgsolvents.htm.
Figure 2.
Water-uptake workflow used in this study. Membranes are first cut to size, dried over silica gel, and weighed to record the dry mass. They are then soaked in the chosen medium (liquid or vapor) at the specified temperature or relative humidity. After soaking, surface water is removed by the standardized pressure-blotting protocol, and the wet mass is recorded.
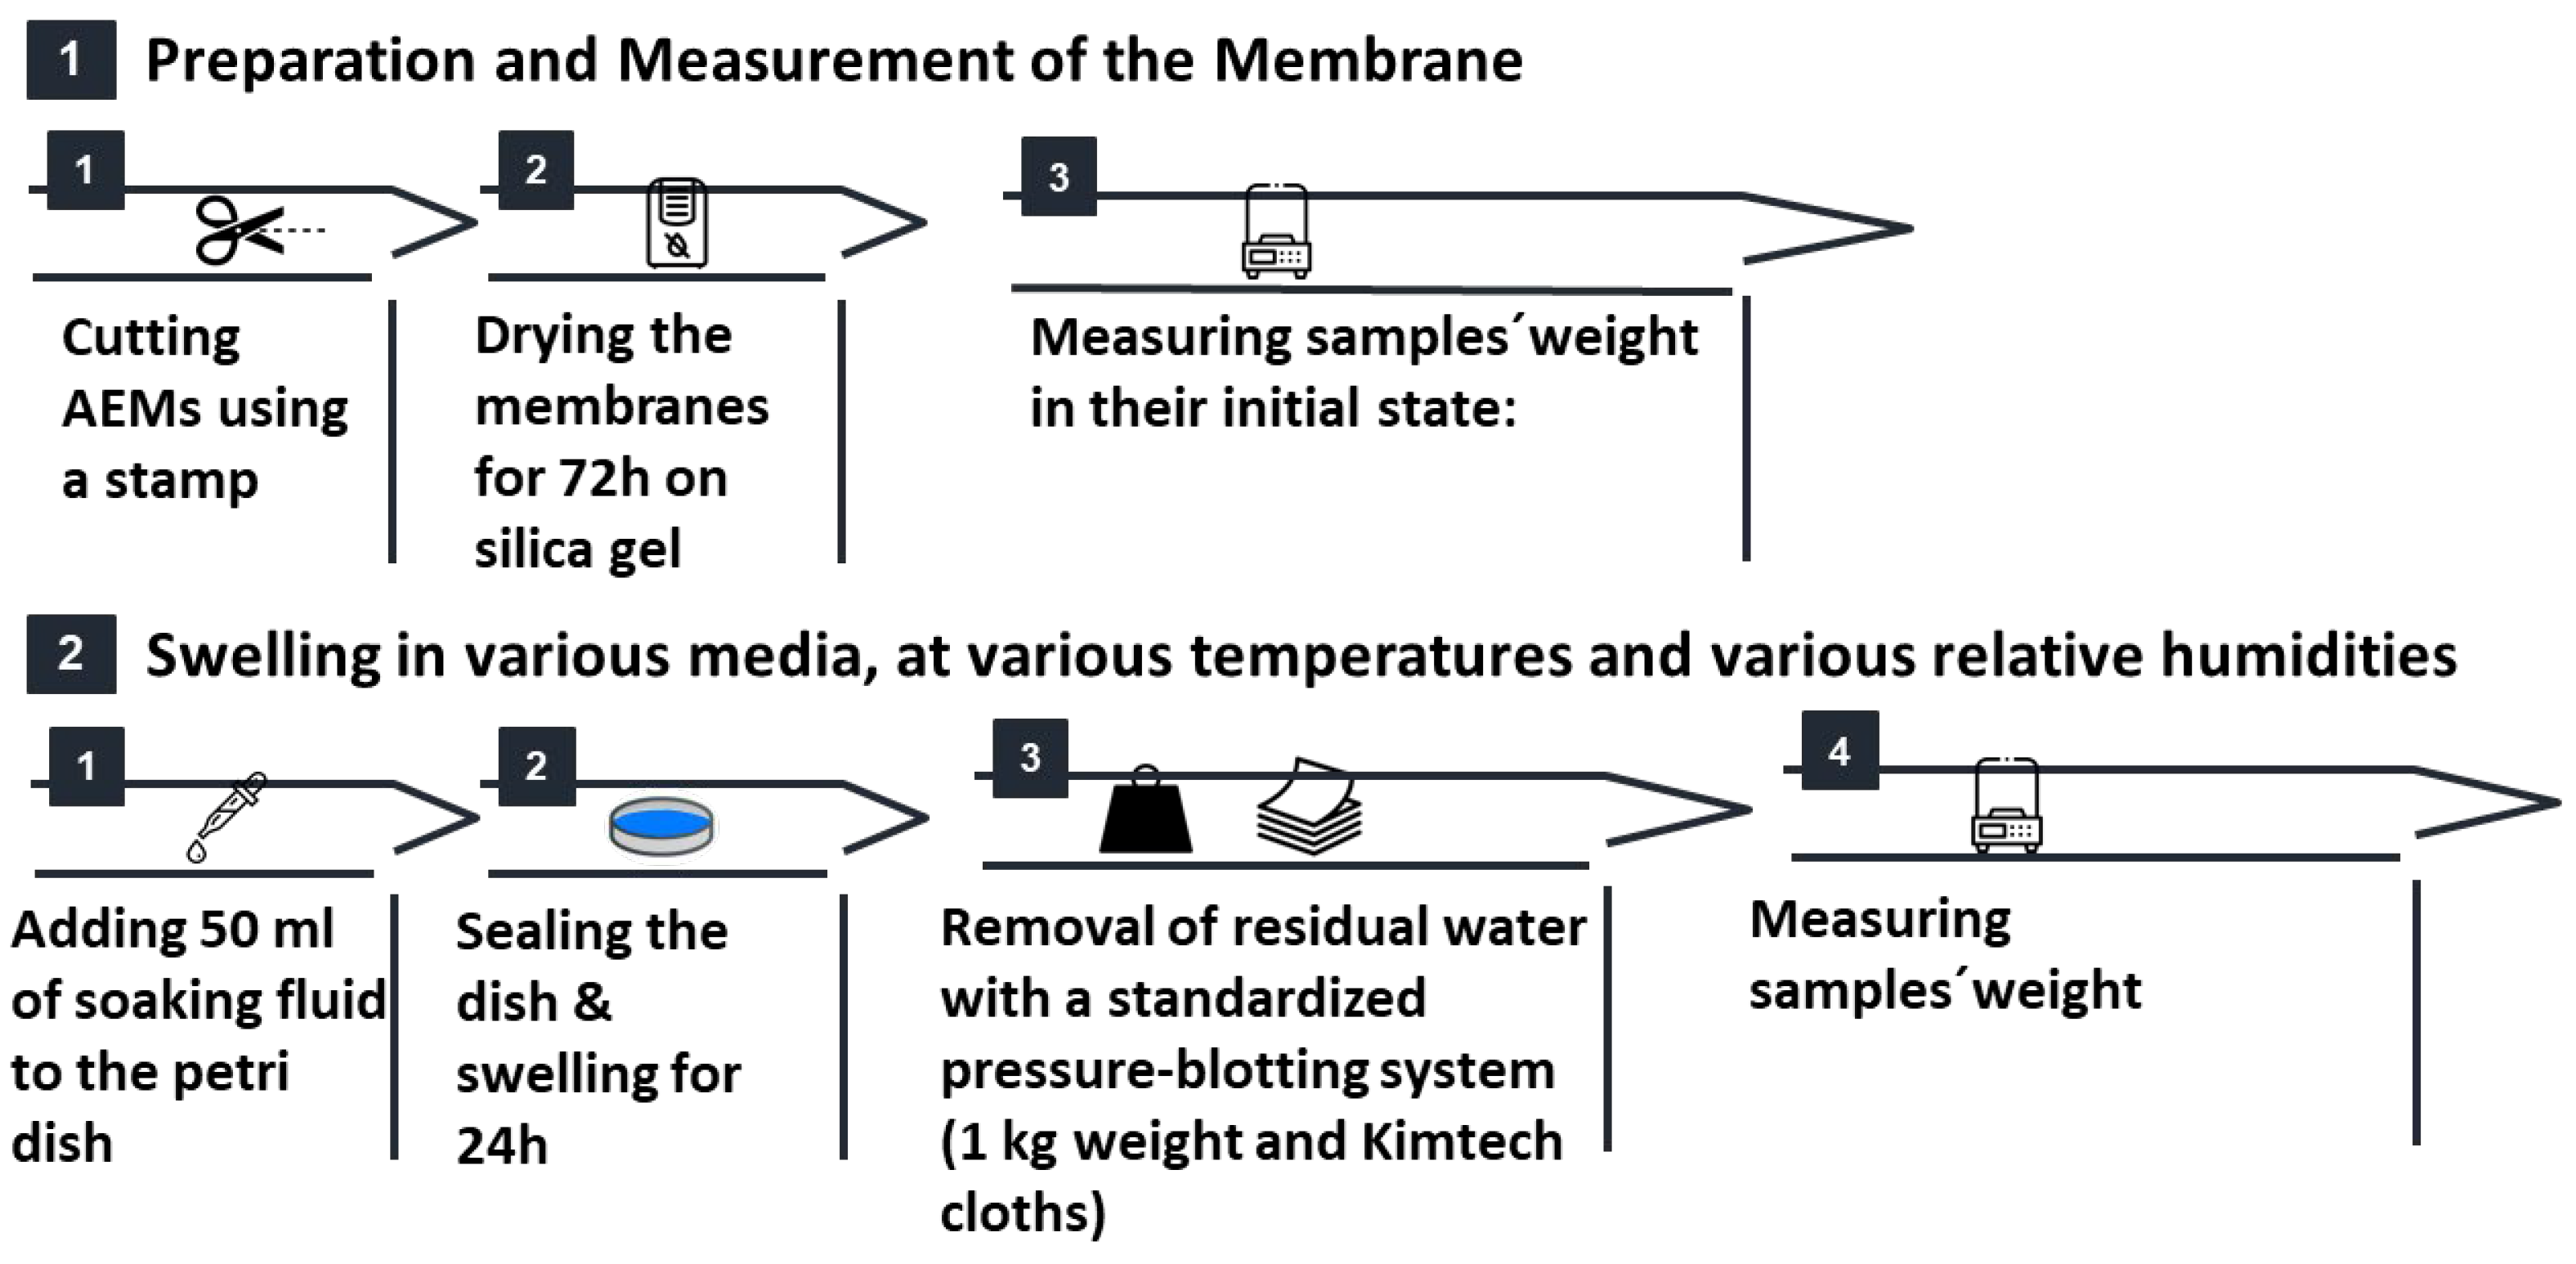
Figure 3.
Comparison of water-uptake measurements for FAAM-PK-75 membranes soaked in DI water (24 h, 23 °C, n = 2) using three blotting approaches: defined pressure-blotting setup by multiple users (blue), conventional Kimtech™ touch-blotting by Person 1 (orange) and by Person 2 (grey). Error bars represent ±1 standard deviation. The data highlight the large operator-dependent variability of manual blotting versus the consistency afforded by the standardized pressure-blotting protocol.
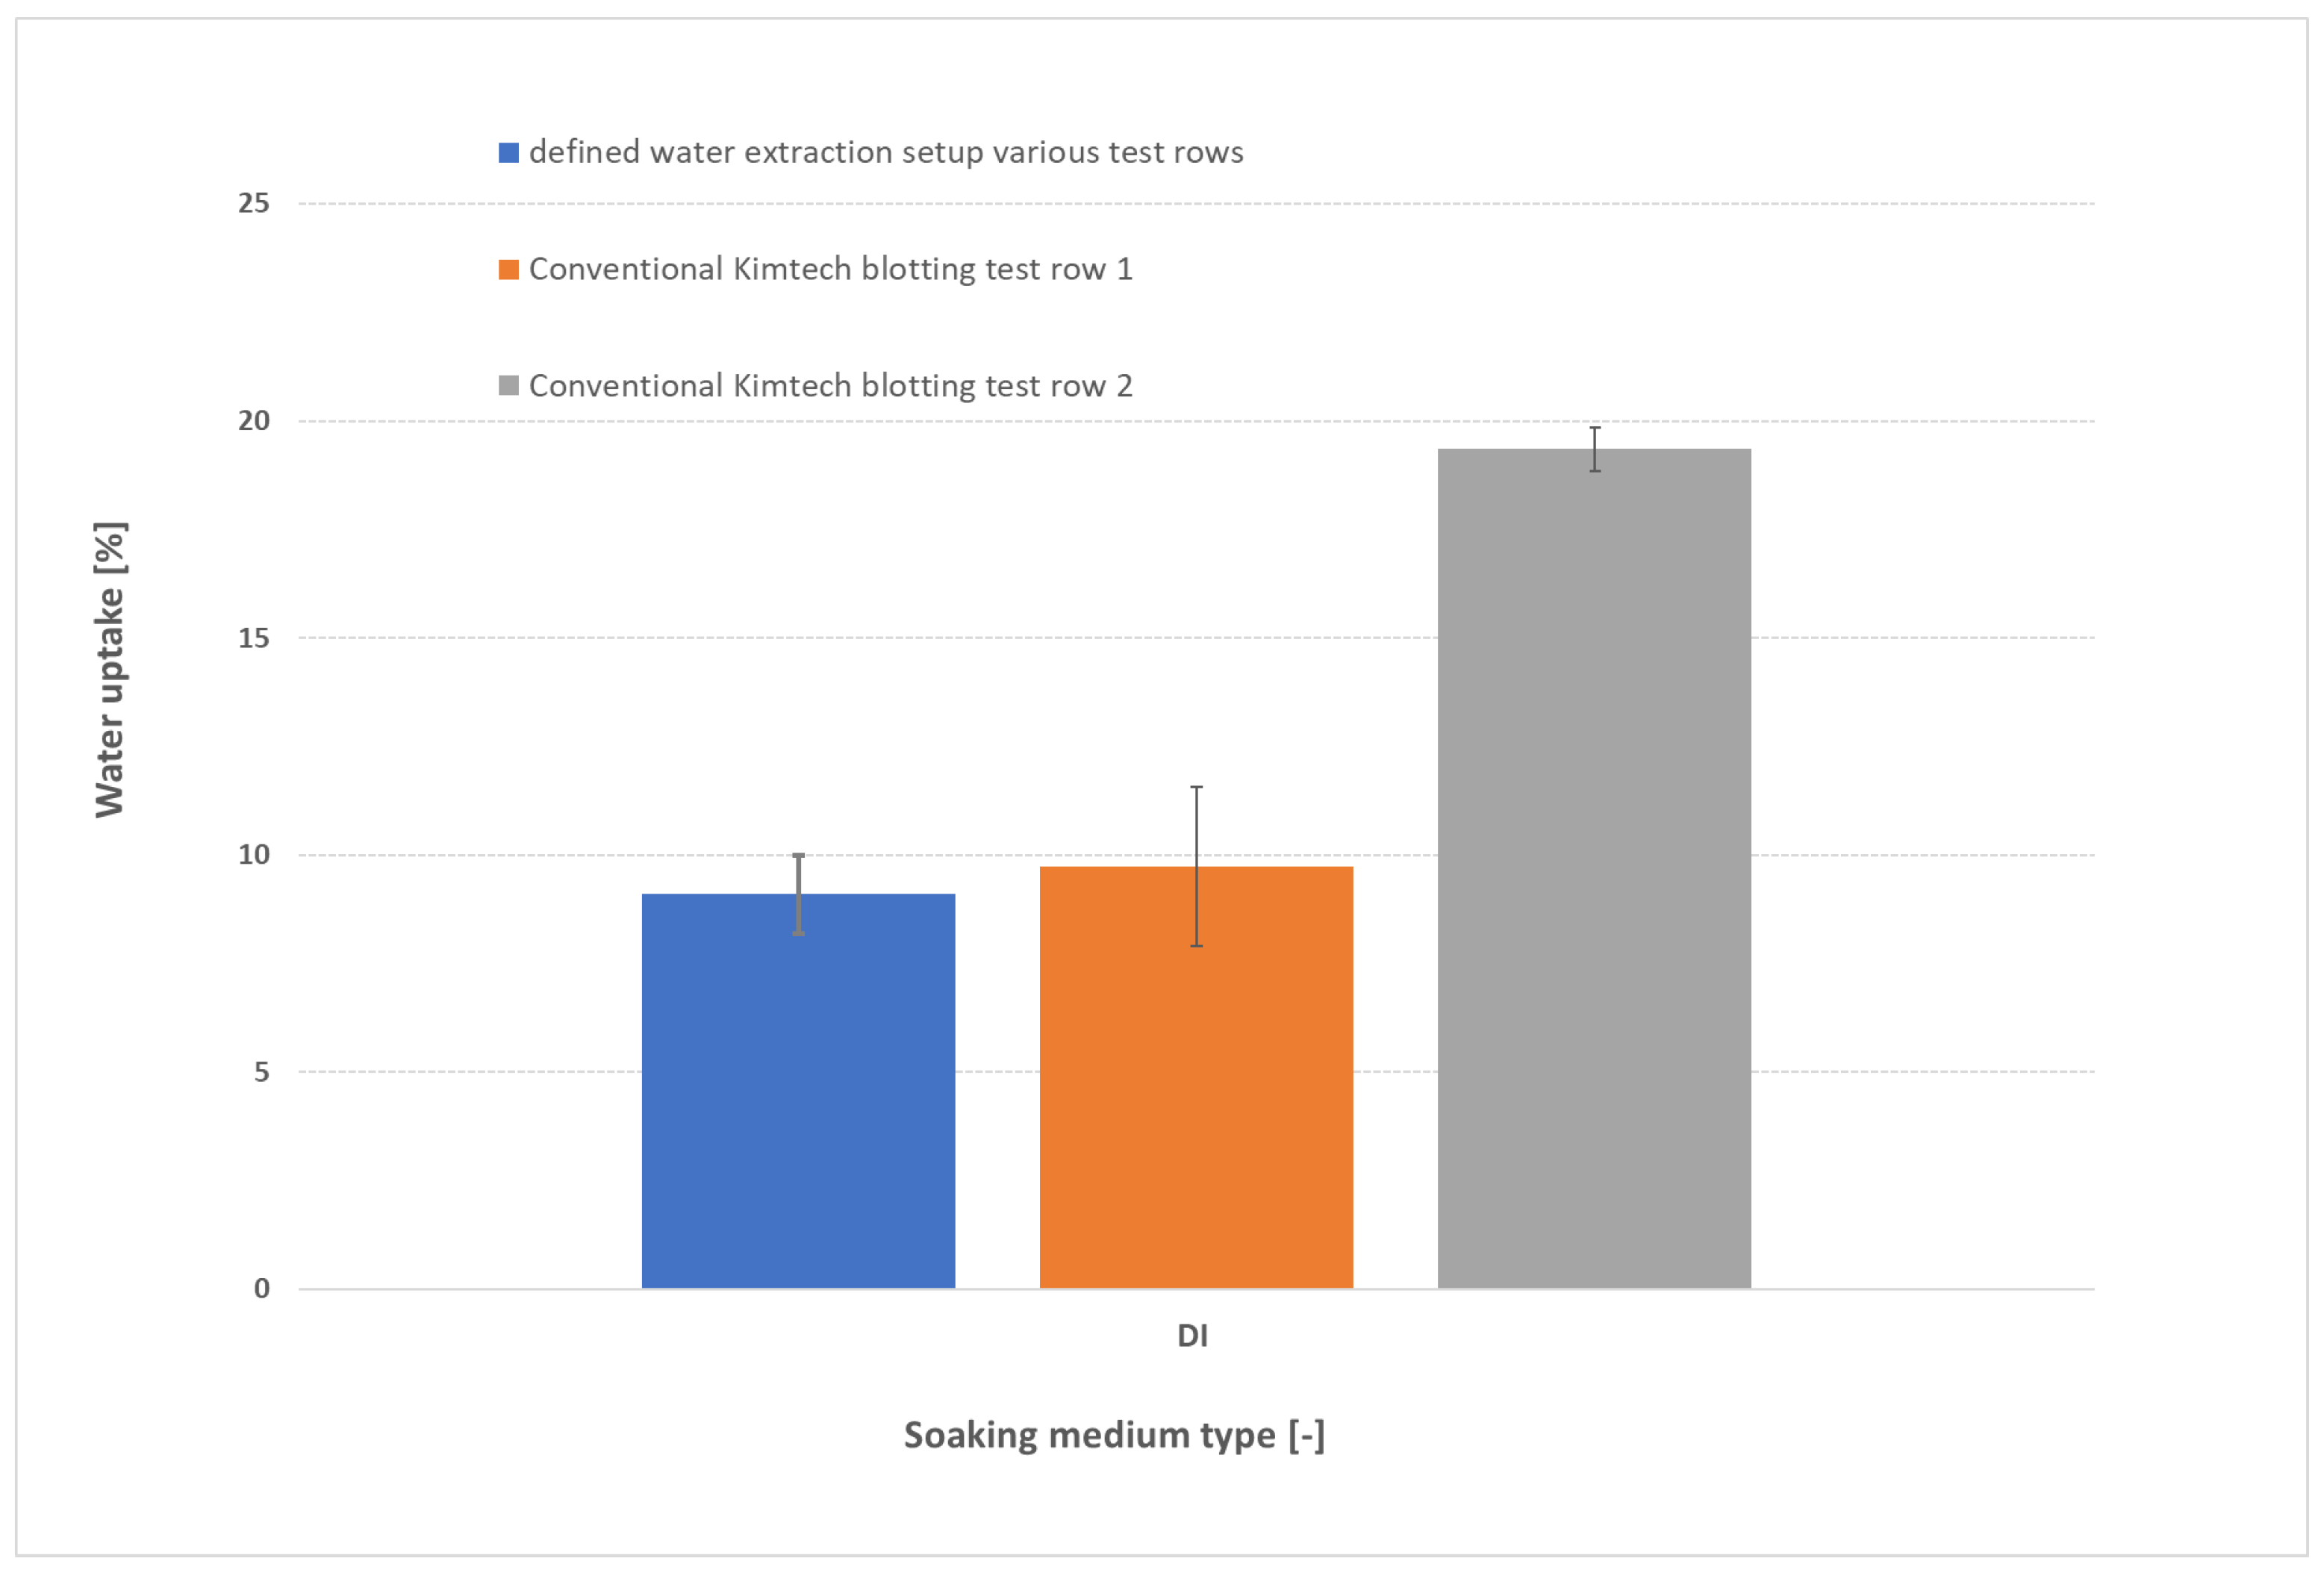
Figure 4.
Water uptake of FAAM-PK-75 after 24 h soaking at 23 °C in DI water and various KOH concentrations (0.1–9 M), measured using the standardized pressure-blotting protocol (n = 3). Bars indicate mean ± standard deviation. Uptake decreases initially from DI to 0.1 M KOH, then rises progressively at higher KOH molarities, reflecting the combined effects of OH− screening and osmotic swelling.
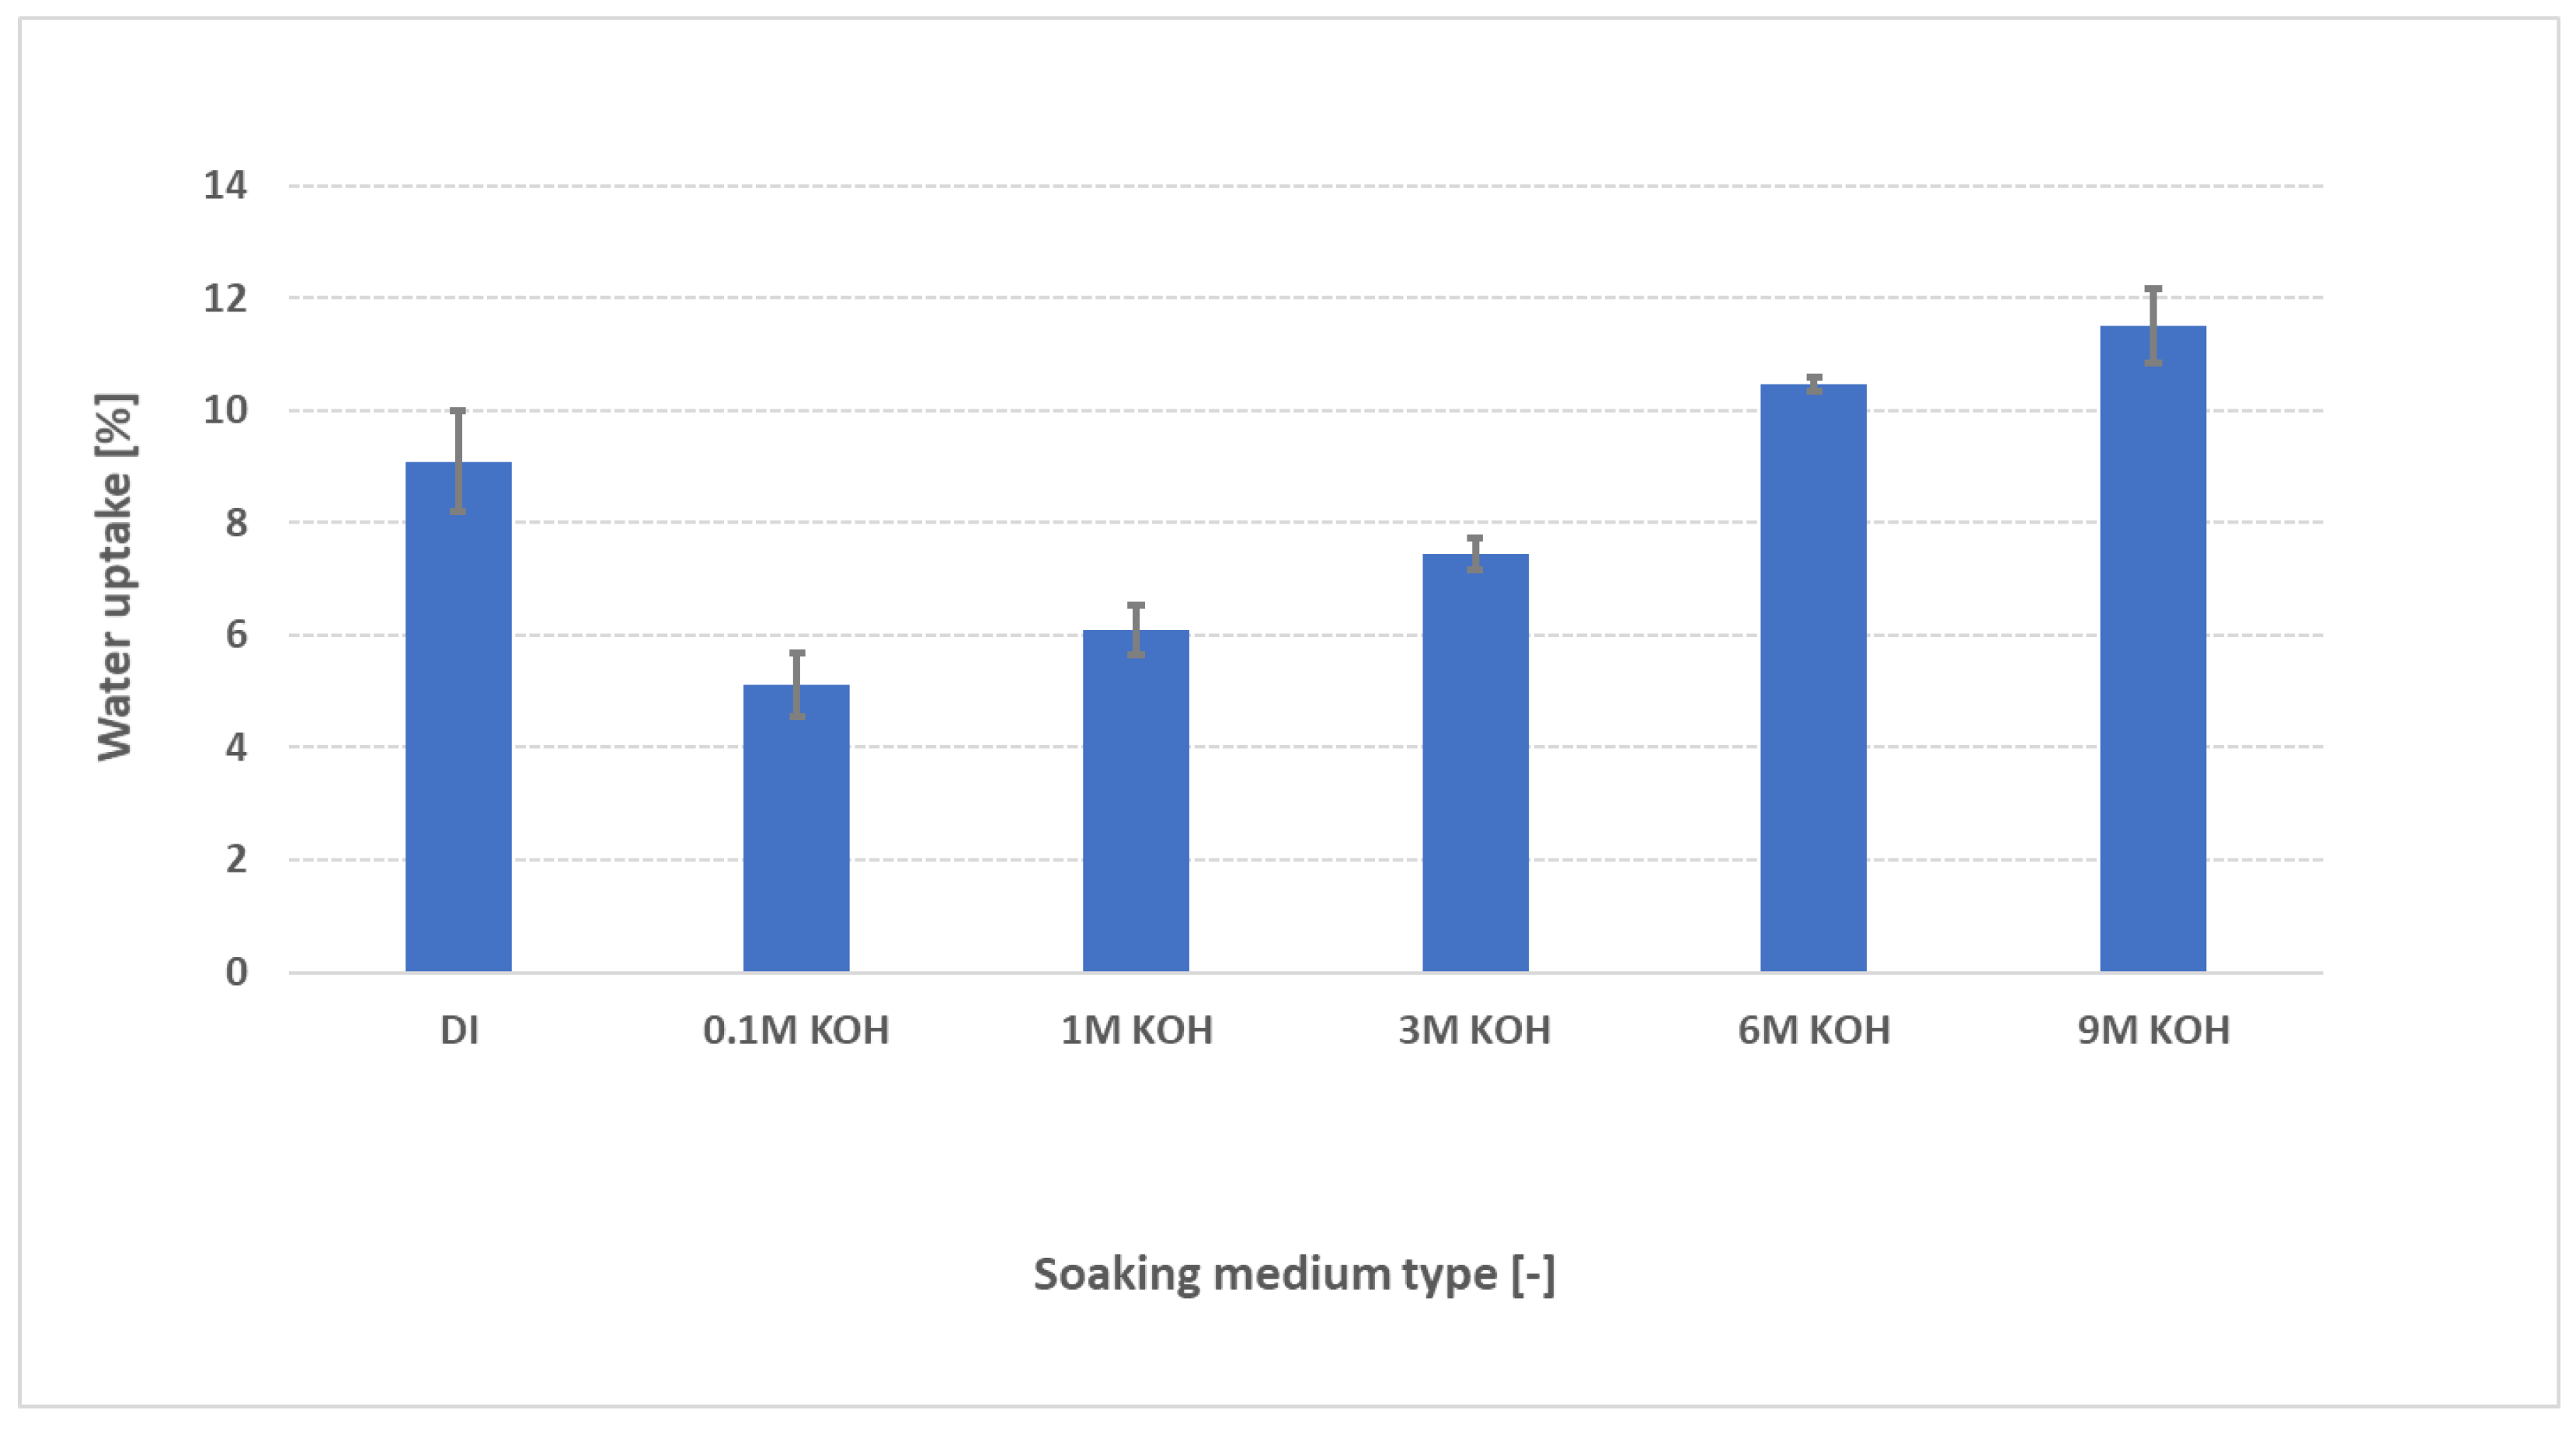
Figure 5.
Schematic of FAAM-PK-75 hydrophilic domain morphology under different hydration conditions. In all panels, yellow “+” symbols denote fixed quaternary-ammonium sites in the polymer; blue regions are water-filled nanochannels; black “OH−” and green “K+” labels indicate internal and external ions, respectively. (a) Dry membrane – no channels: Only quaternary sites are visible on a light-tan background. (b) DI water at 23 °C – swollen channels: Wide blue domains illustrate maximal osmotic swelling by H2O diffusion (black arrows indicate driving osmotic pressure). (c) 1 M KOH at 23 °C – screened channels: External K+ and OH− flood the domains, screening the “+” sites and collapsing channels (black arrows). (d) 9 M KOH at 23 °C- higher osmotic pressure leads to overcoming Donnan barrier highest swelling. (e) DI water at 60 °C – densified channels: thermal tightening leads to lower water uptake. (f) 1 M KOH at 60 °C – partial screening with thermal diffusion: Channels expand slightly versus panel (d) (red arrow indicates enhanced diffusion overcoming some screening), while remaining screened by abundant OH−.
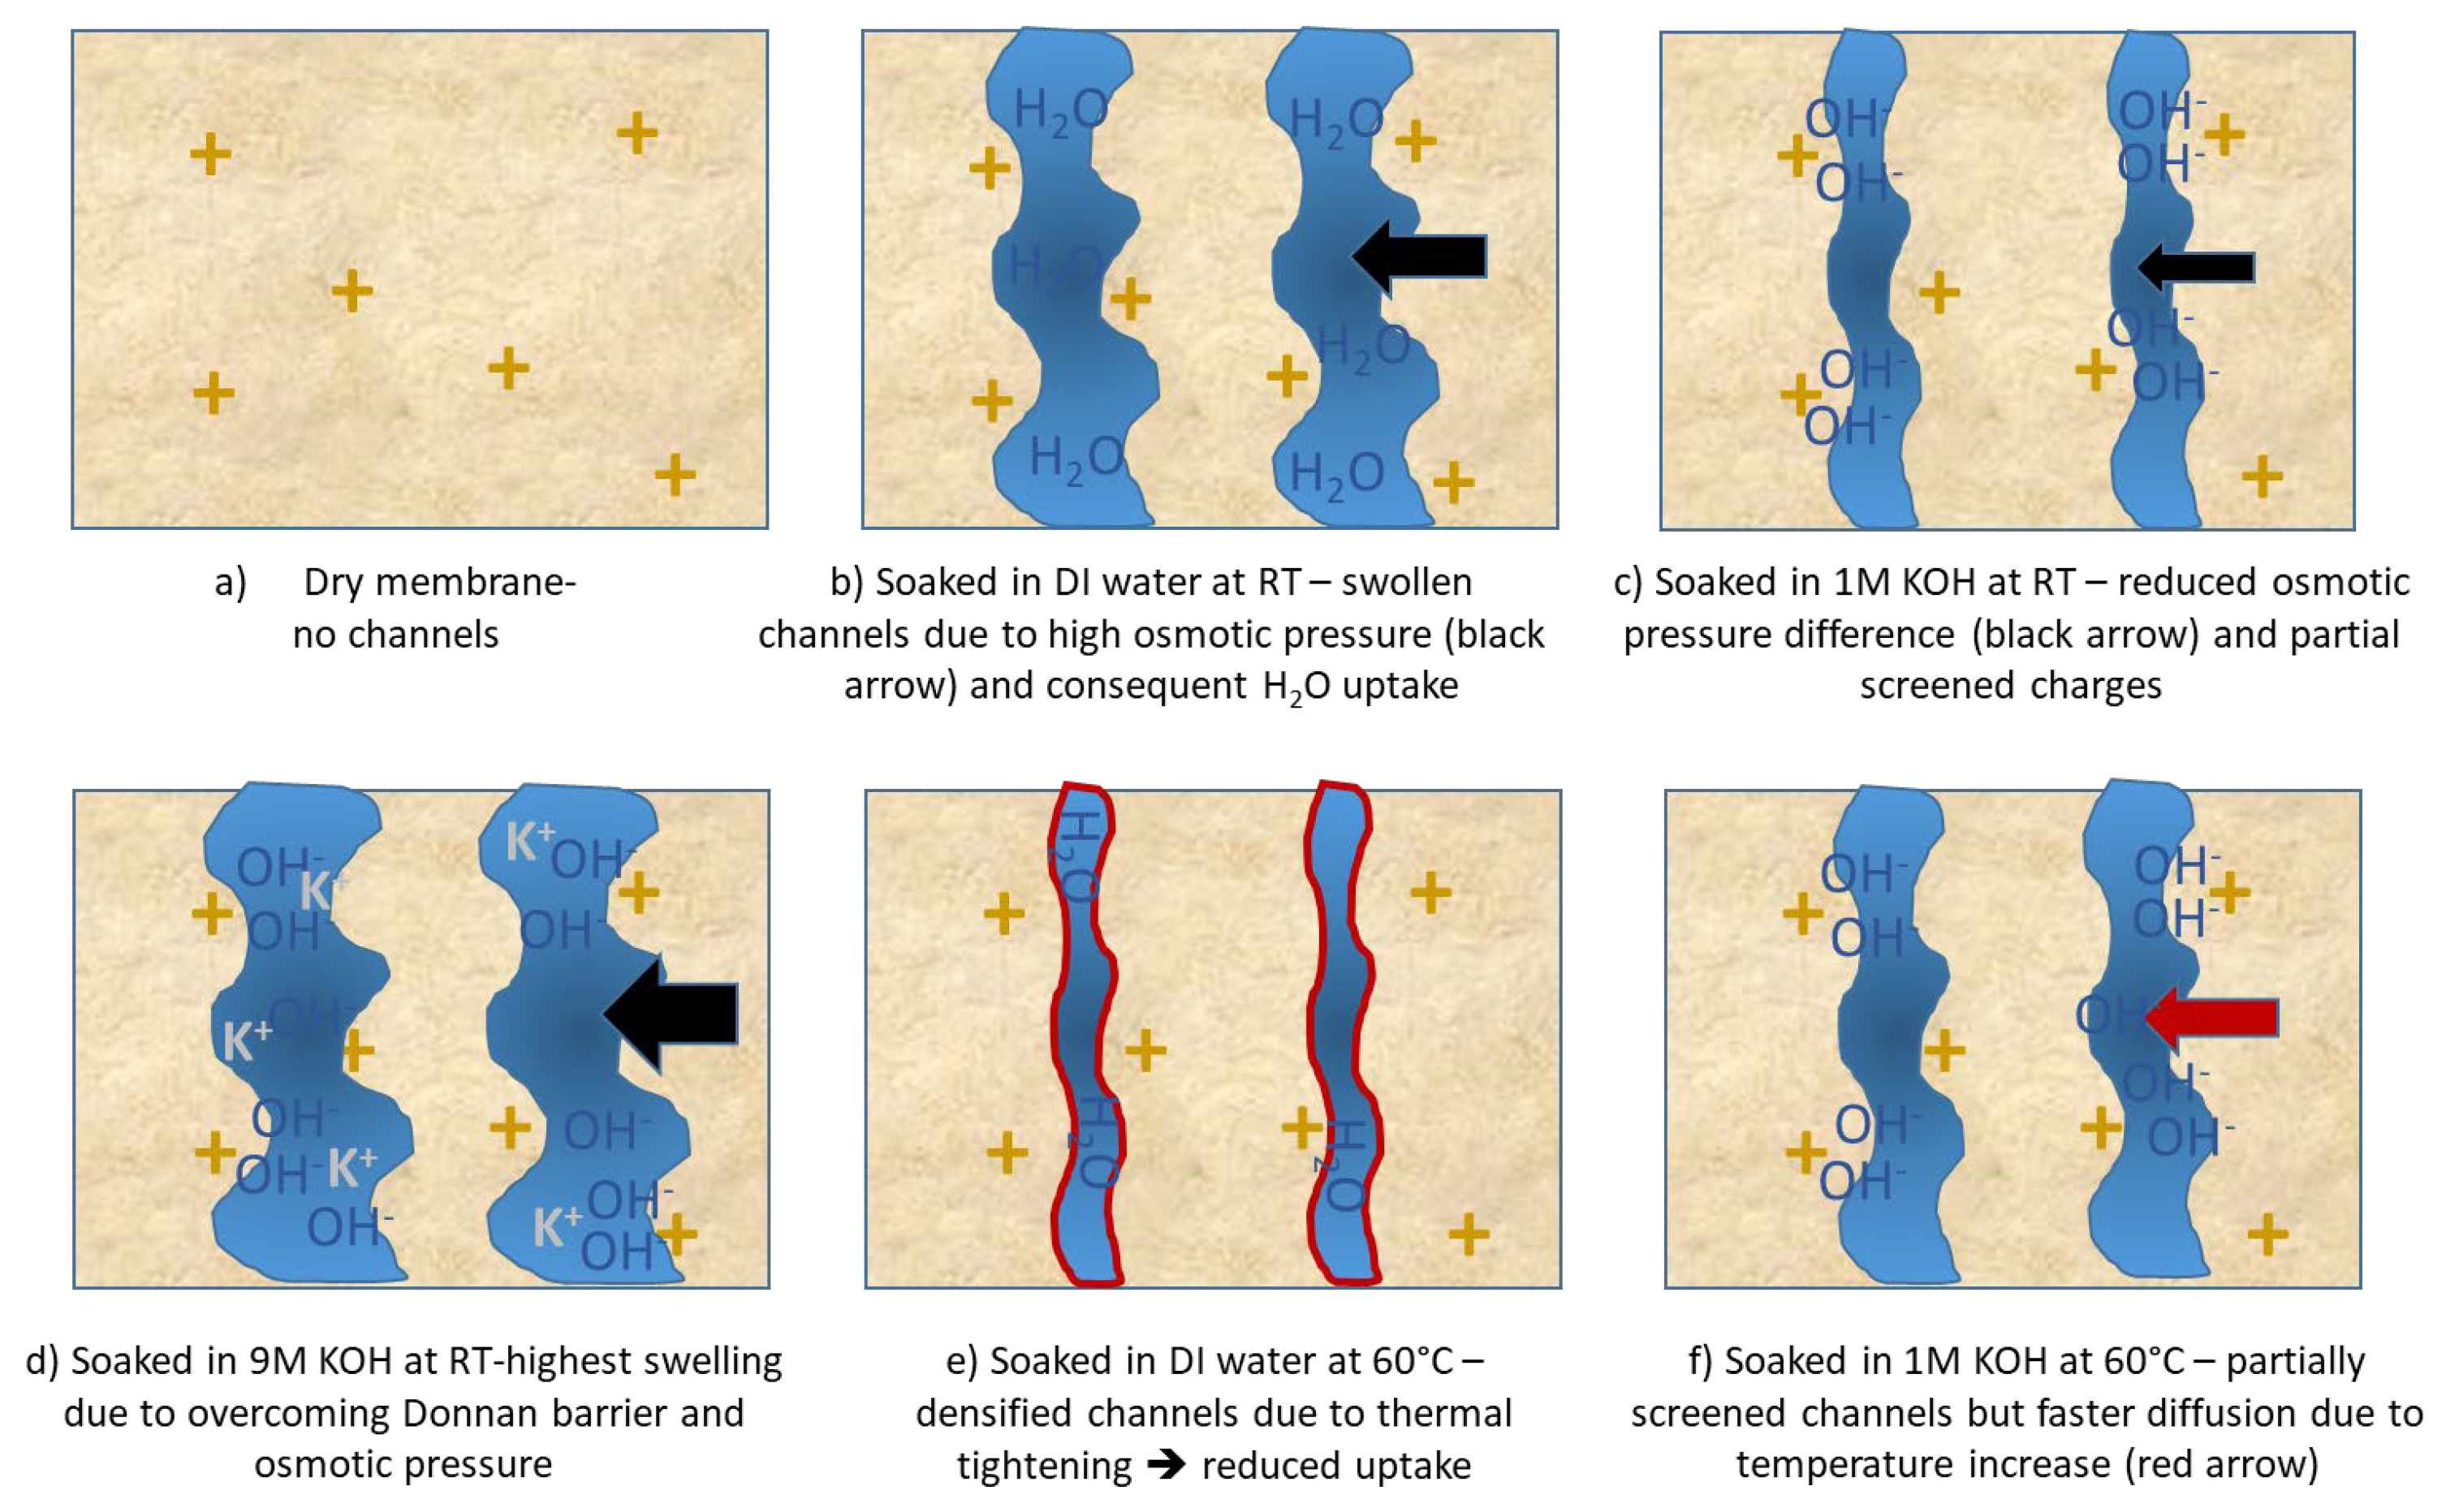
Figure 6.
Water uptake of FAAM-PK-75 after 24 h soaking in DI water and 1 M KOH at 23 °C (RT) and 60 °C, measured using the standardized pressure-blotting protocol (n = 2). Bars show mean ± standard deviation. In DI water, uptake drops sharply at 60 °C compared to RT, indicating thermal densification of hydrophilic domains. In 1 M KOH, uptake is higher at both temperatures due to screening by OH−, and it increases modestly at 60 °C as faster diffusion partially offsets densification.
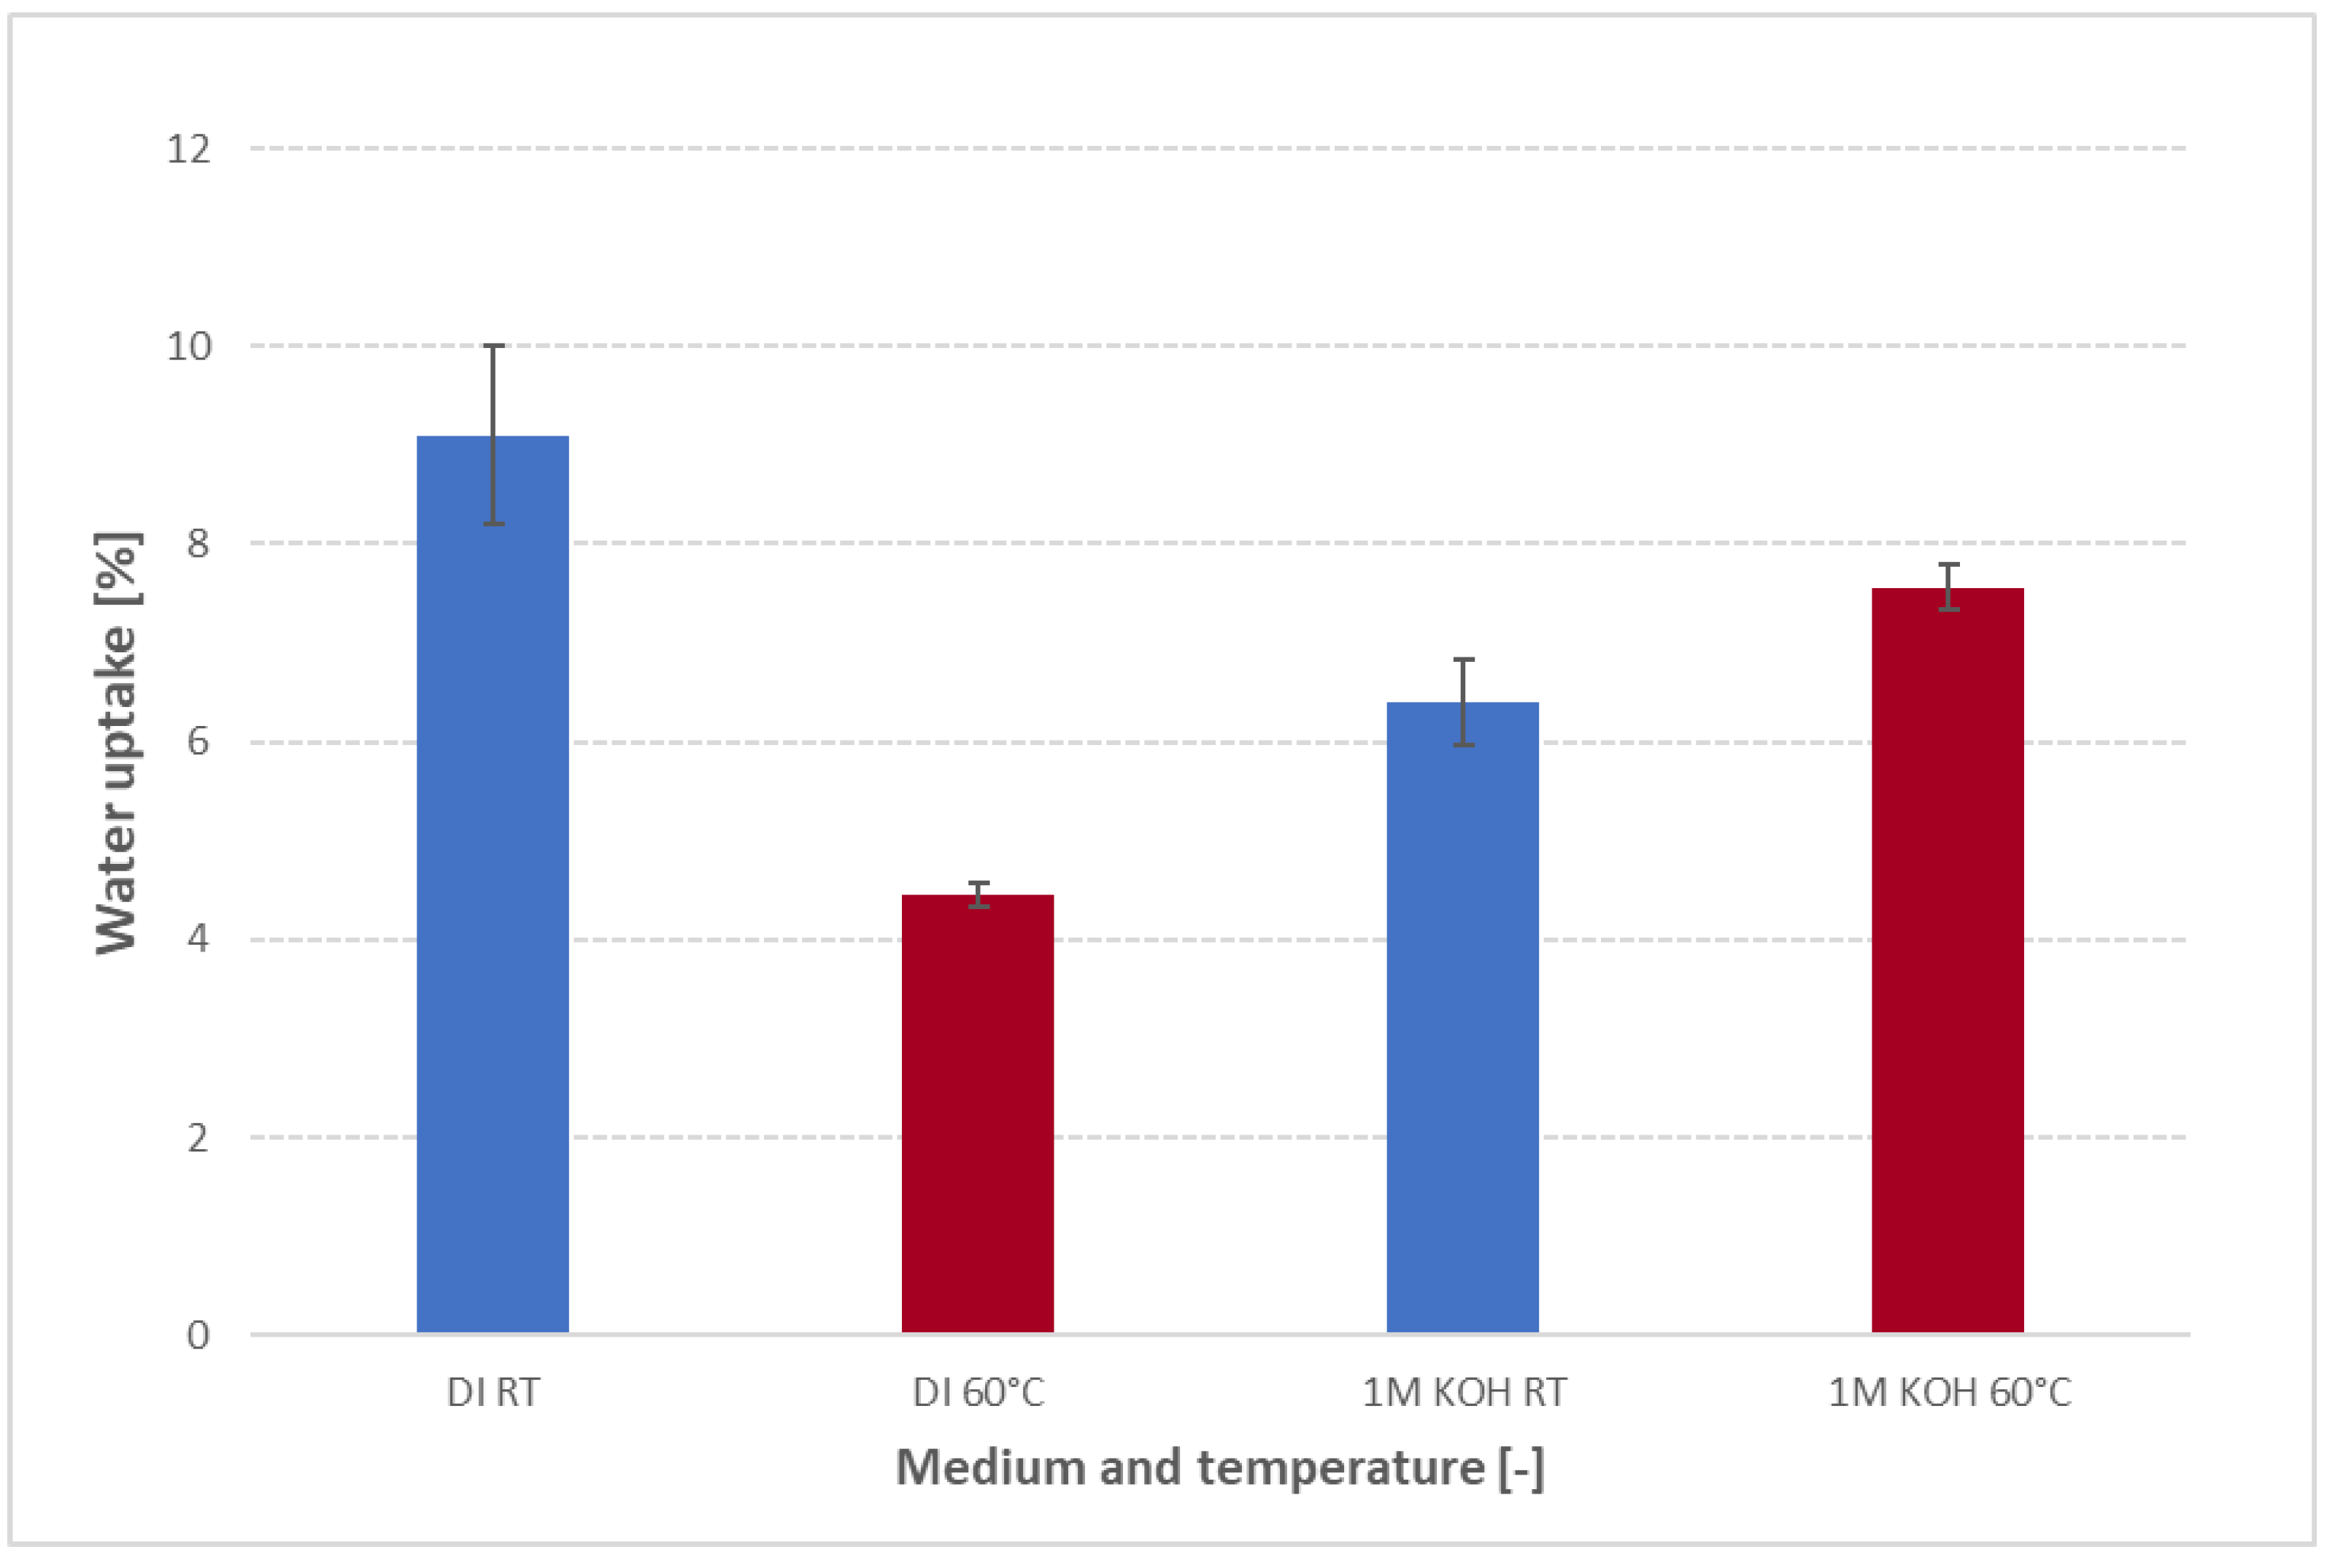
Figure 7.
Water uptake of FAAM-PK-75 after 24 h soaking in various media at 23 °C. Bars represent mean ± standard deviation (n = 2). The minimal uptake in isopropanol (IPA) suggests that using IPA as an ink solvent can reduce swelling, whereas DI water dramatically increases uptake.
Figure 7.
Water uptake of FAAM-PK-75 after 24 h soaking in various media at 23 °C. Bars represent mean ± standard deviation (n = 2). The minimal uptake in isopropanol (IPA) suggests that using IPA as an ink solvent can reduce swelling, whereas DI water dramatically increases uptake.
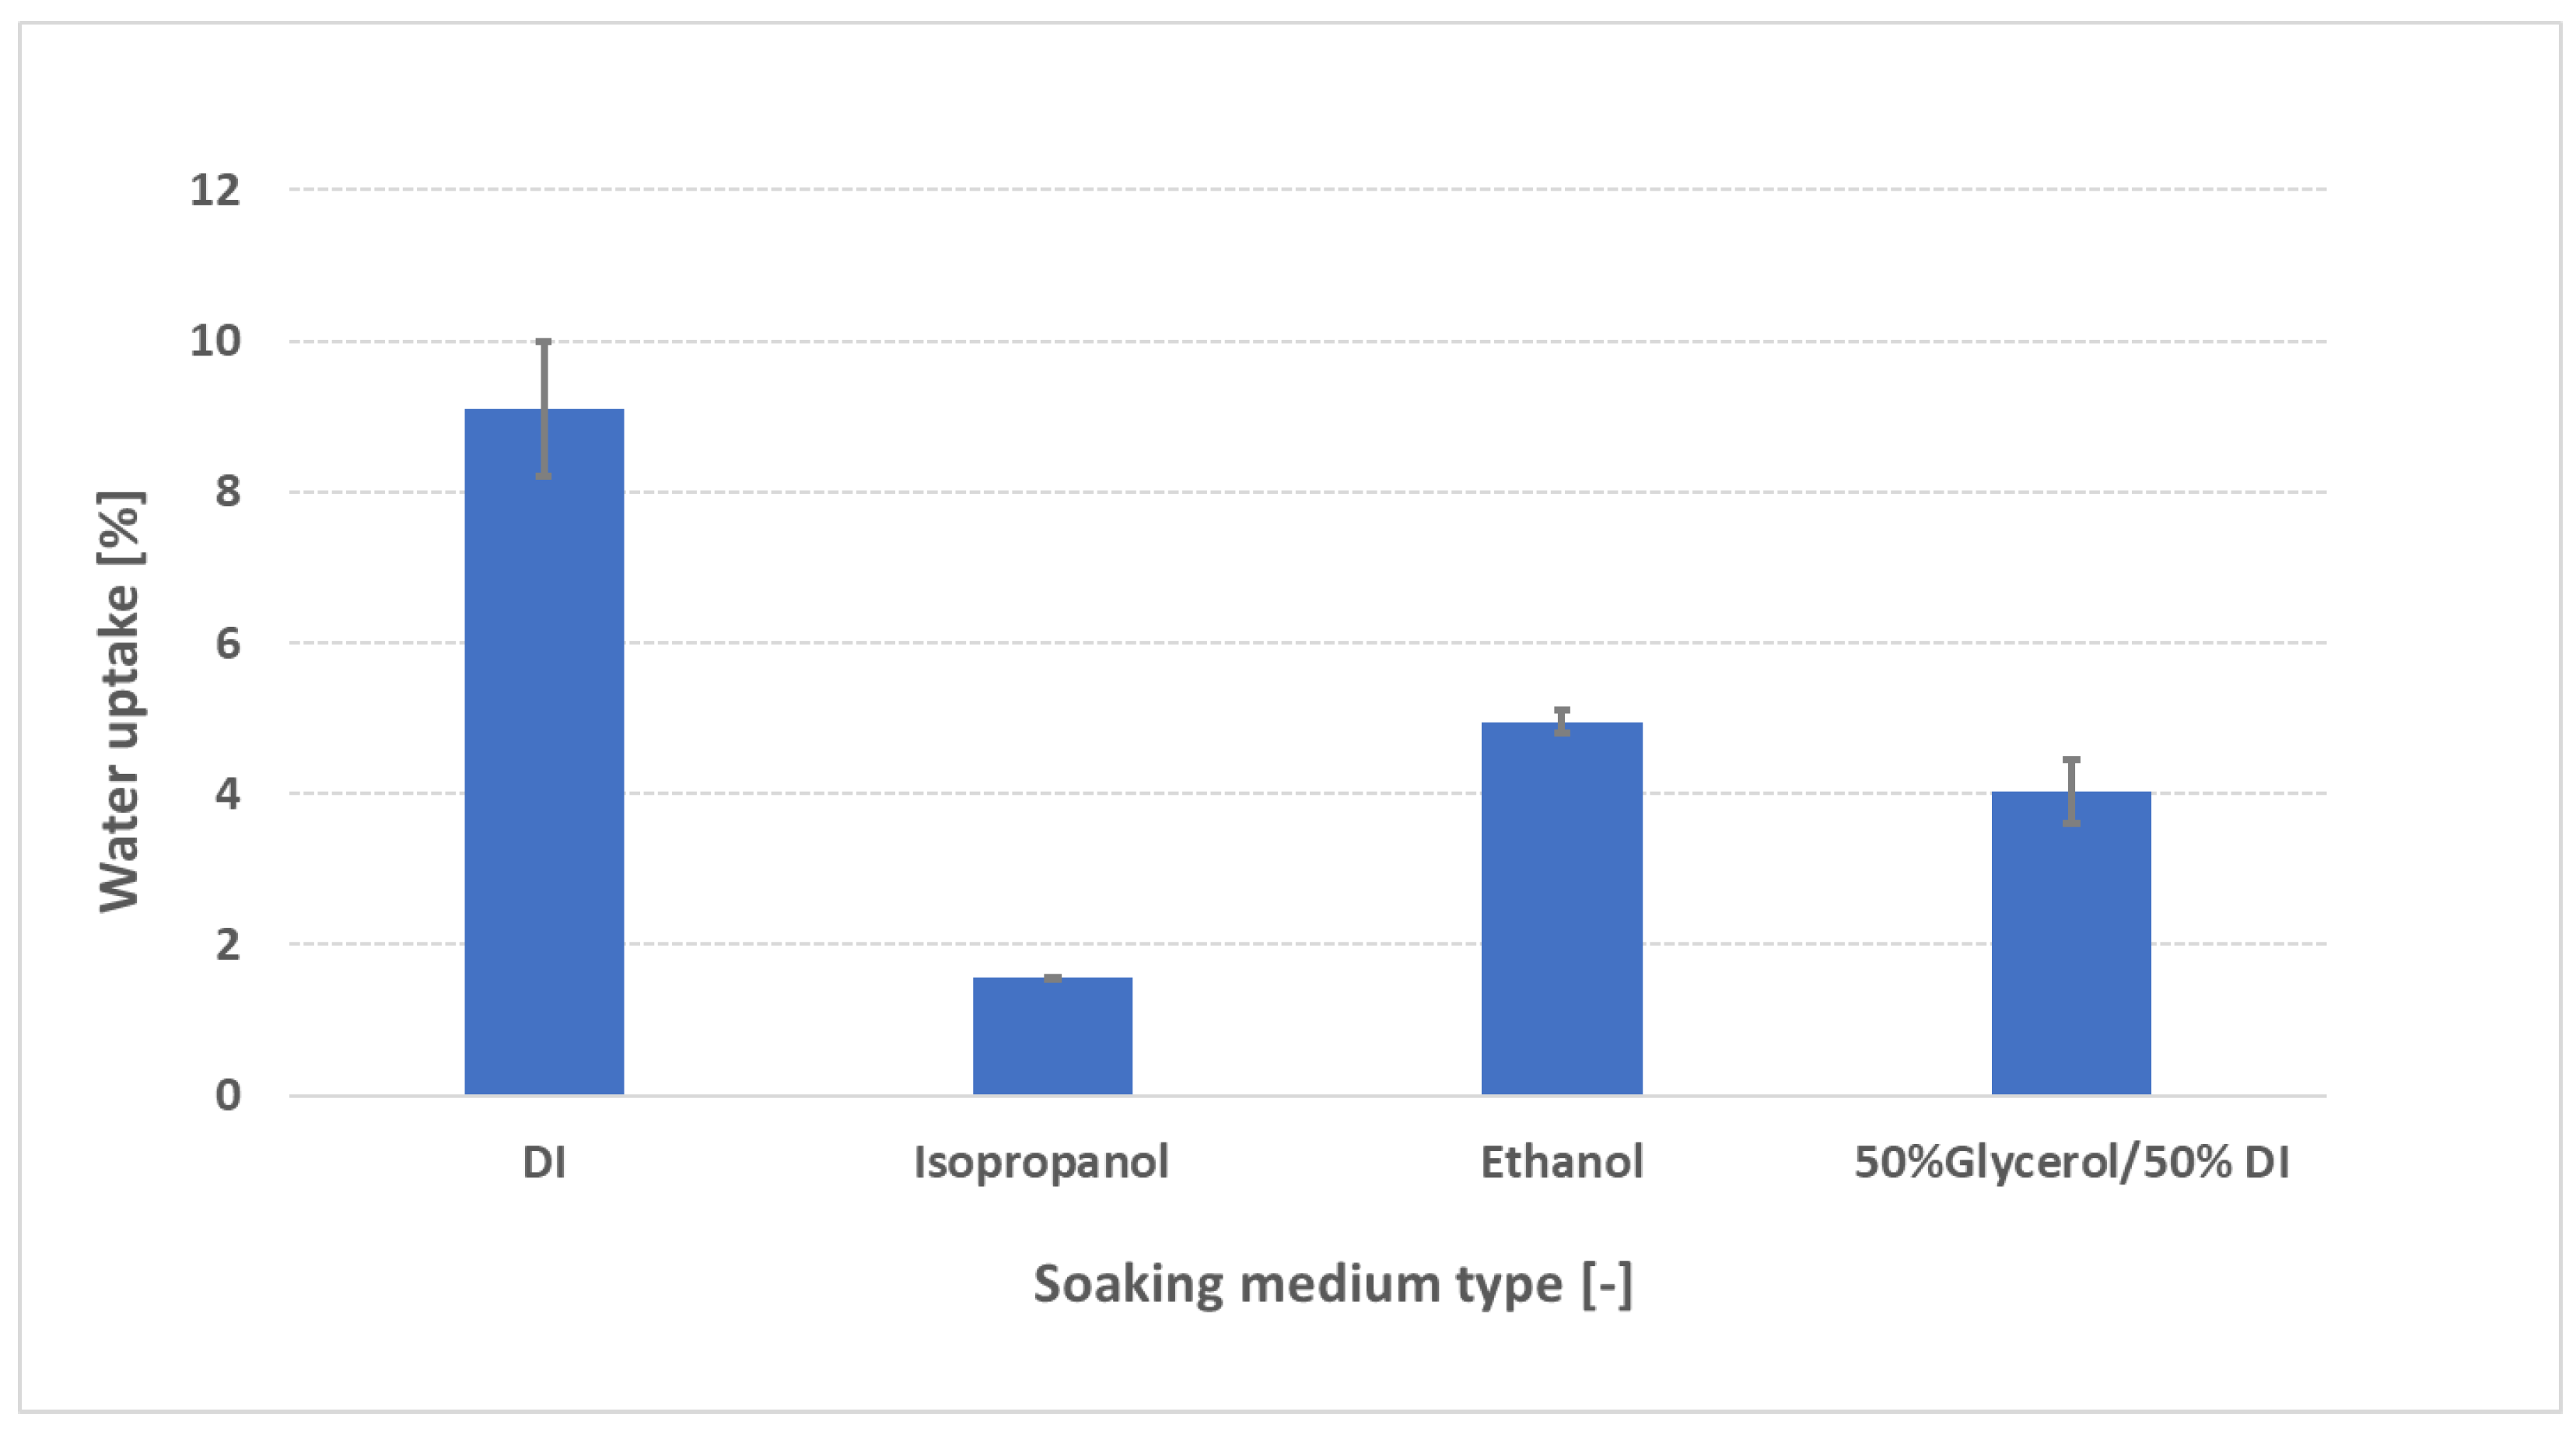
Figure 8.
Gravimetric water uptake of FAAM-PK-75 exposed to controlled vapor-phase environments at 23 °C. Samples were suspended over saturated salt solutions to achieve ≈ 39 %, 74 %, and 96 % RH for 48 h, then blotted under standardized pressure. Despite the increasing humidity, PK-75 consistently absorbs ~5 wt % water, indicating that the PEEK reinforcement mechanically limits swelling of the hydrophilic domains.
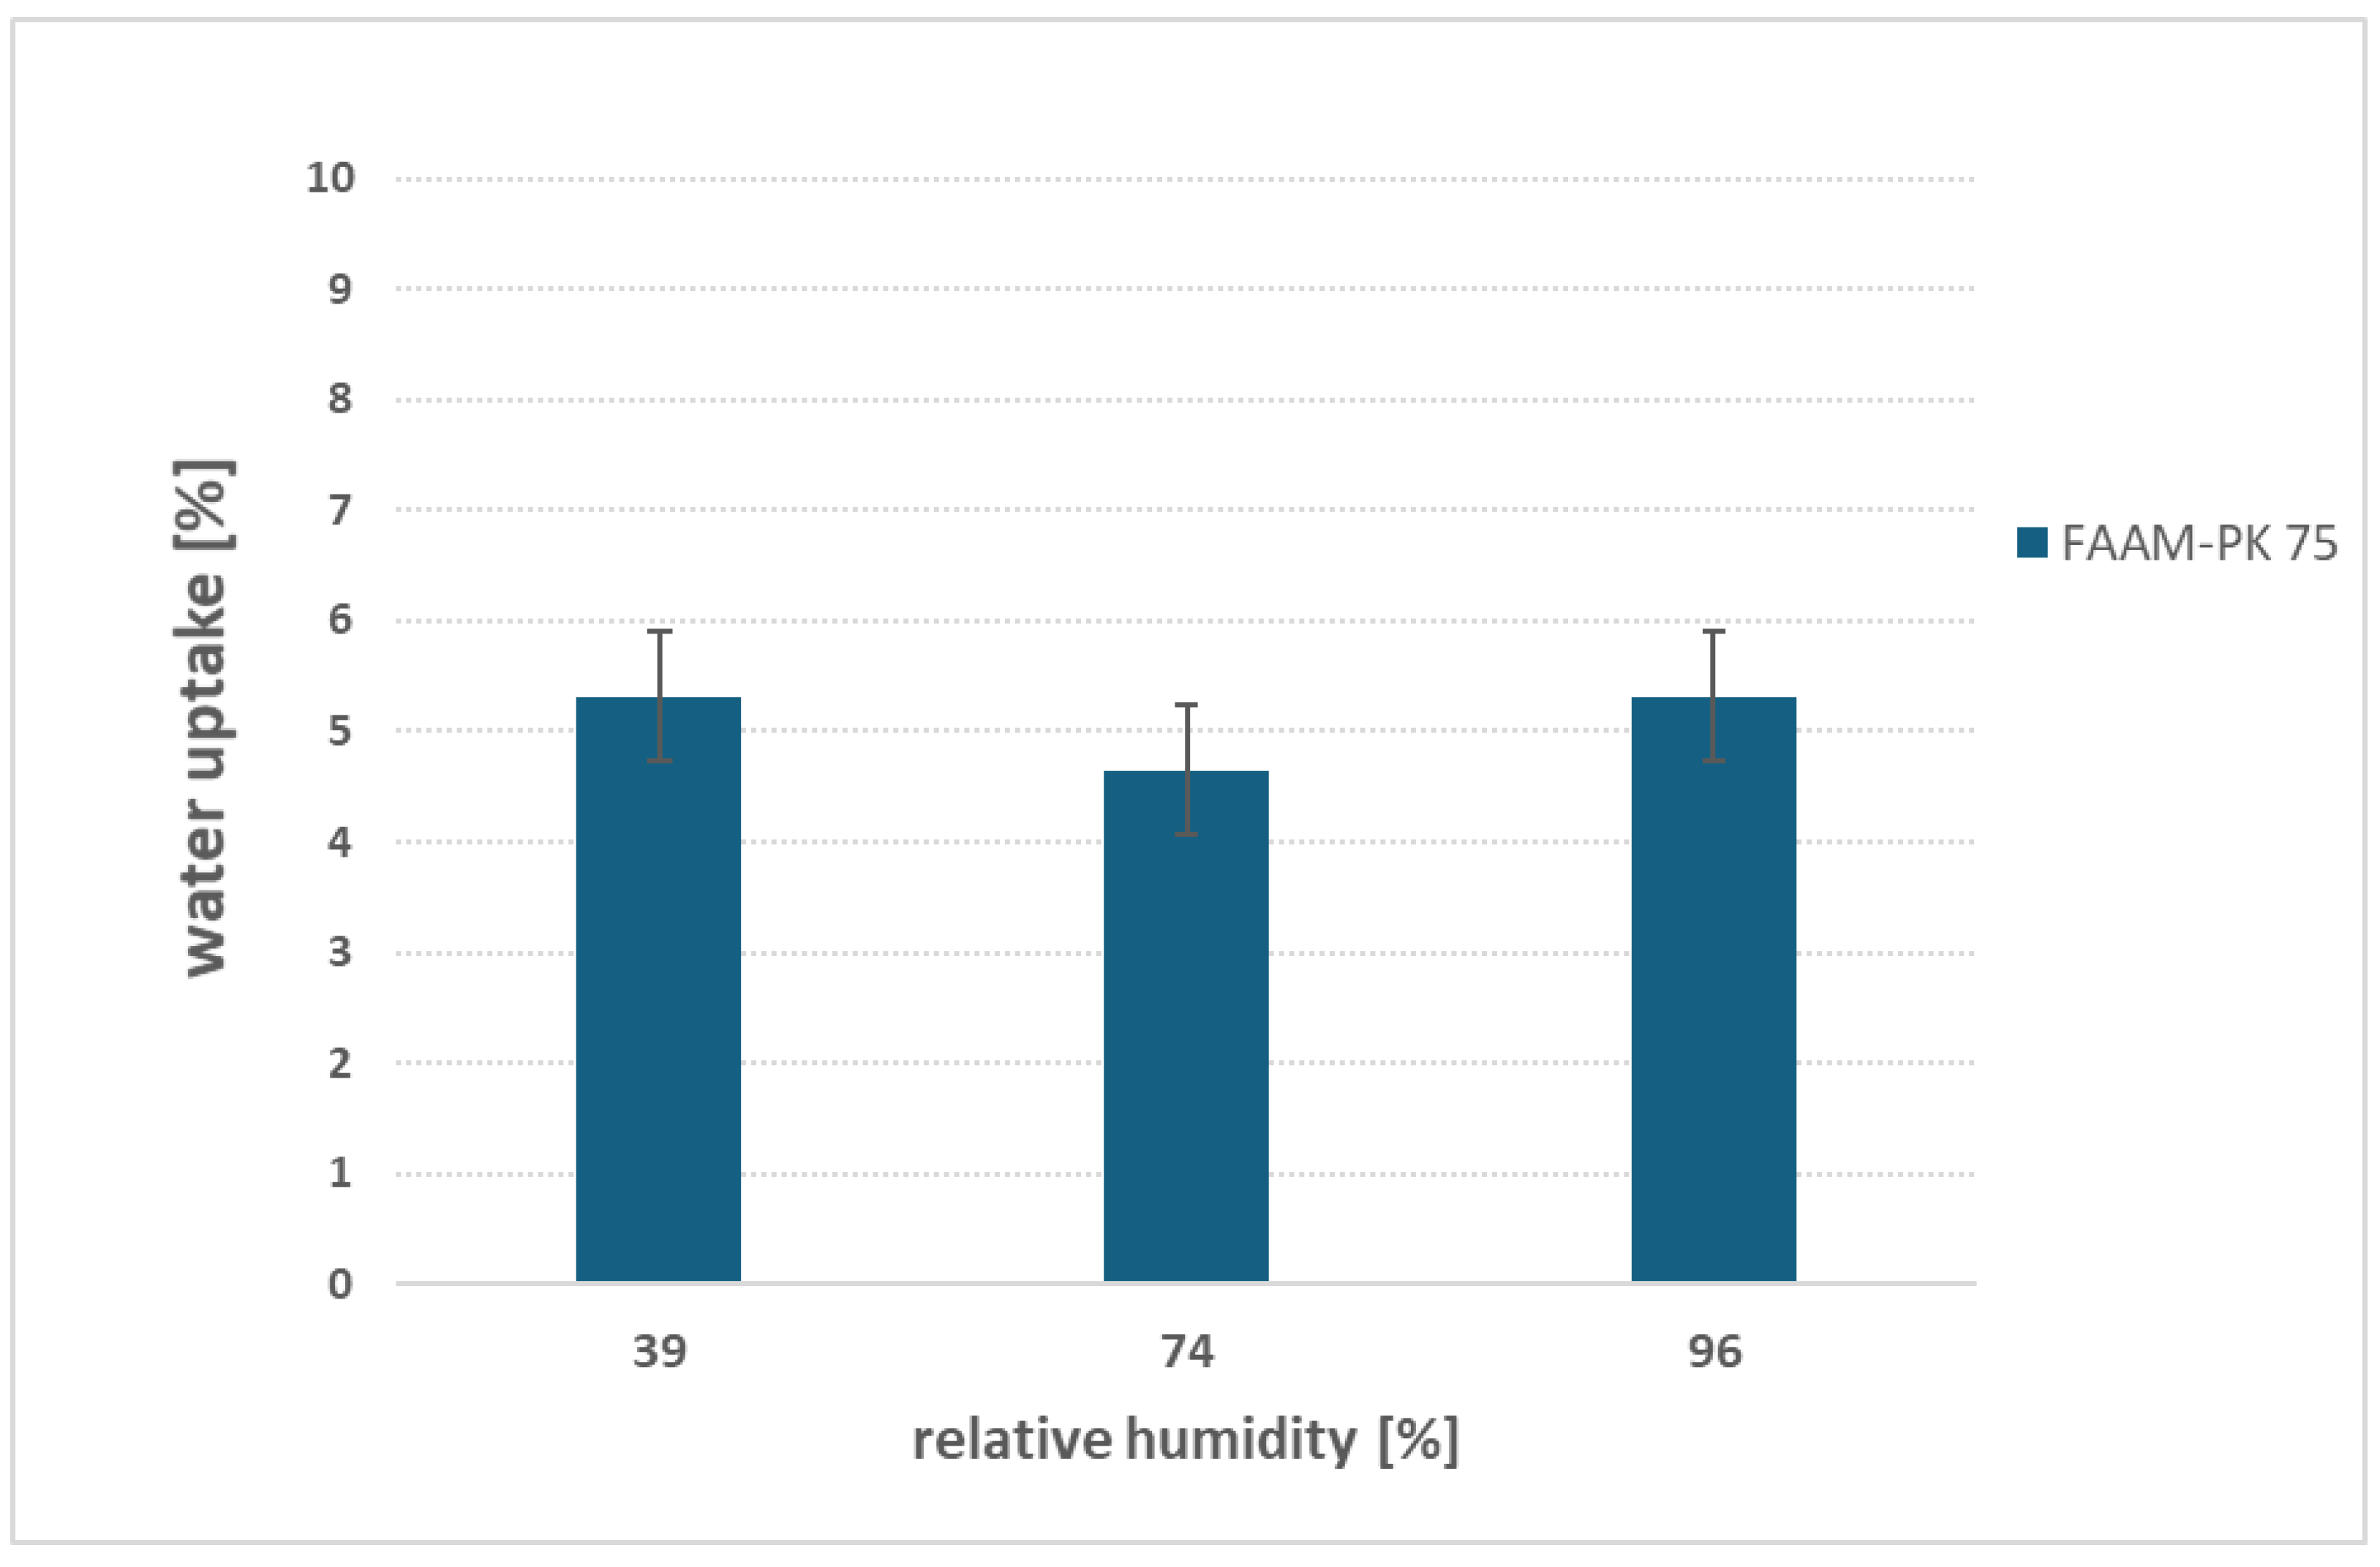
Figure 9.
Water uptake of four AEMs at 23 °C after 24 h soaking in DI water, followed by standardized pressure-blotting (mean ± standard deviation, n = 2). PK-75 exhibited 7 ± 0.5 wt %, FAA-M-20 exhibited 6 ± 0.4 wt %, FAA-3-50 exhibited 27 ± 1 wt %, and the self-synthesized AEM exhibited 46 ± 1 wt %.
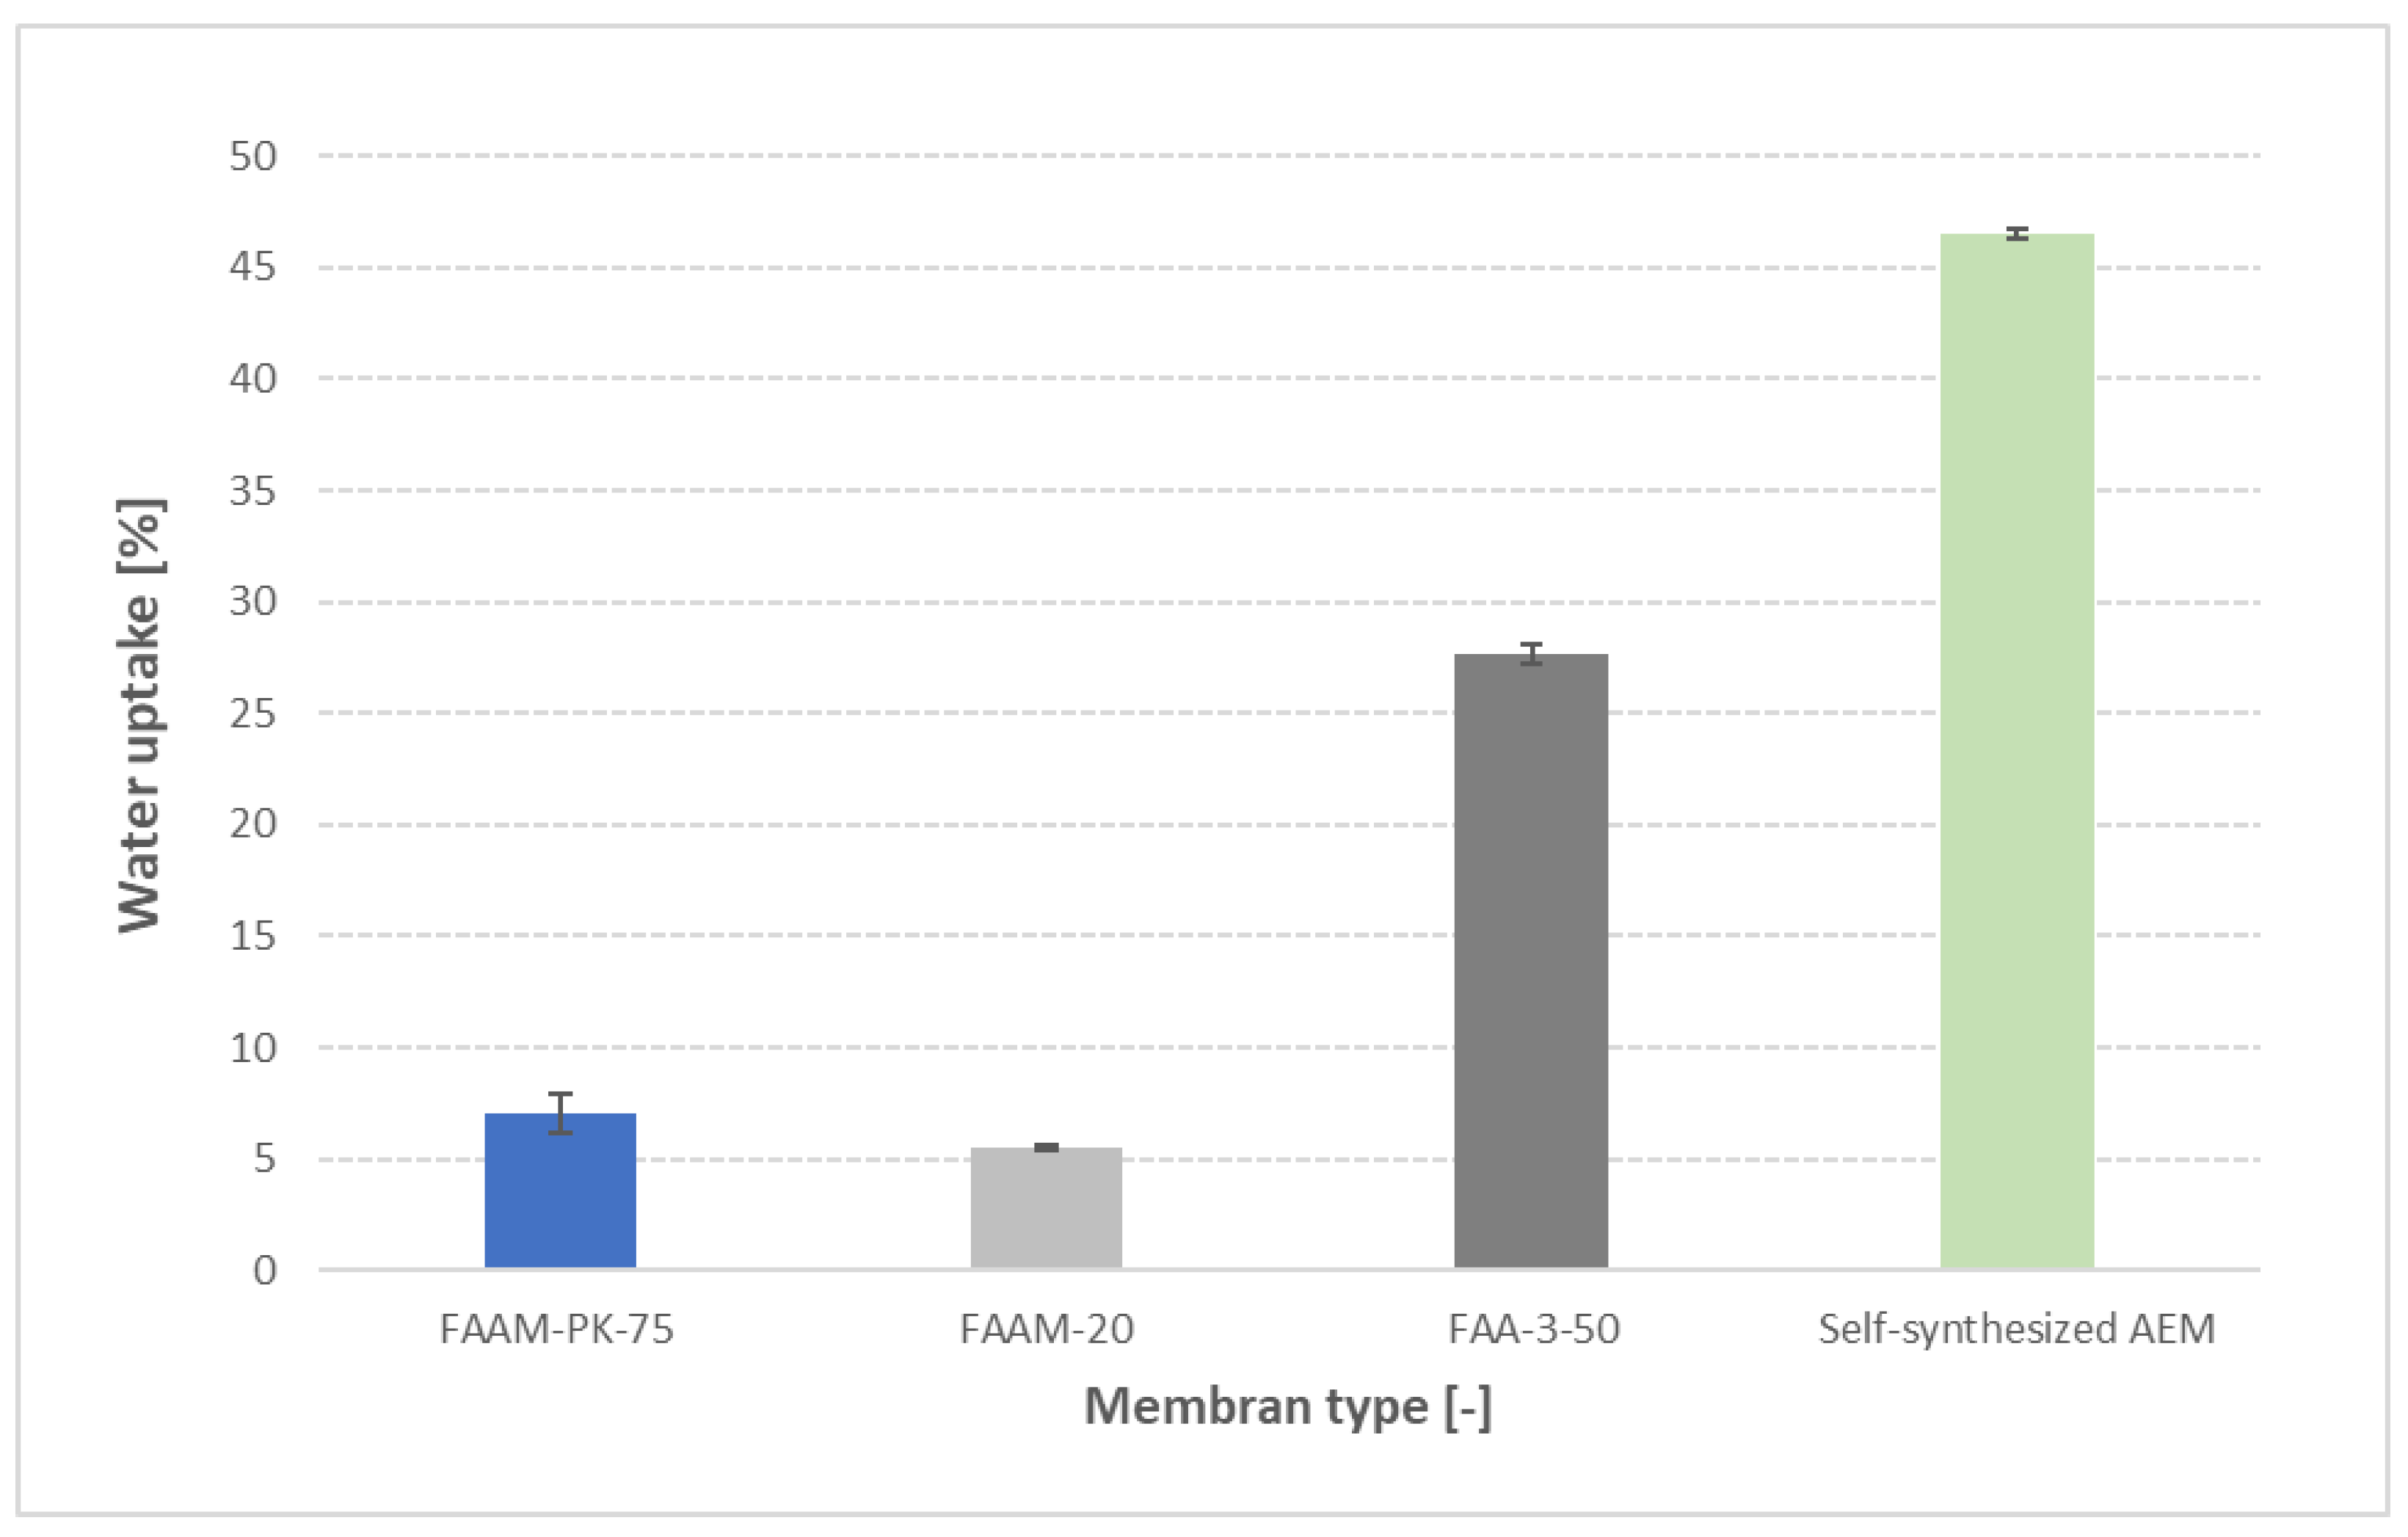

Table 1.
Summary of all water uptake protocol variations. Protocol name, membrane type, soaking. medium, duration, temperature and relative humidity(rH) are shown. For samples soaked in liquid, an rH of 100% was assumed.
Table 1.
Summary of all water uptake protocol variations. Protocol name, membrane type, soaking. medium, duration, temperature and relative humidity(rH) are shown. For samples soaked in liquid, an rH of 100% was assumed.
| Protocol | Membrane Type | Soaking Medium | Duration [h] | T [°C] | rH [%] |
|---|---|---|---|---|---|
| Blotting comparison | FAAM-PK-75 | • DI water | 24 | RT | 100 |
| KOH concentration effect | FAAM-PK-75 | KOH solutions (0.1 M – 9 M) | 24 | RT | 100 |
| Temperature-dependent swelling | FAAM-PK-75 | • DI water • 1 M KOH |
24 | RT and 60 | 100 |
| Alternative Immersion media |
FAAM-PK-75 | • Isopropanol • Ethanol • 50:50 H2O – glycerol |
24 | RT | 100 |
| RH-controlled sorption | FAAM-PK-75 | Vapor over salts: • MgCl2 (≈ 33 % RH) • NaCl (≈ 75 % RH) • KNO3 (≈ 93 % RH) |
48 h | RT | 33/ 75/ 93 |
| Cross-validation | -FAAM-20, -FAA-3-50, -self-synthesized AEM |
1 M KOH | 24 | RT | 100 |
Disclaimer/Publisher’s Note: The statements, opinions and data contained in all publications are solely those of the individual author(s) and contributor(s) and not of MDPI and/or the editor(s). MDPI and/or the editor(s) disclaim responsibility for any injury to people or property resulting from any ideas, methods, instructions or products referred to in the content. |
© 2025 by the authors. Licensee MDPI, Basel, Switzerland. This article is an open access article distributed under the terms and conditions of the Creative Commons Attribution (CC BY) license (http://creativecommons.org/licenses/by/4.0/).
Copyright: This open access article is published under a Creative Commons CC BY 4.0 license, which permit the free download, distribution, and reuse, provided that the author and preprint are cited in any reuse.


