
Submitted:
16 July 2025
Posted:
17 July 2025
You are already at the latest version
Abstract
Zeolite has been widely used as an adsorption material to reduce water and air pollution. In place of the conventional hydrothermal method, zeolite in this study was synthesized by the solvent-free method to reduce the large water solvent used and limit wastewater pollutants. In addition, fly ash was used as raw material for zeolite due to its high proportion of Si and Al. It was determined by several structural and morphological characterization tequniques that the synthesized zeolite was of the analcime type with porosity comparable to those of other known zeolite adsorbents. Several experiments with Pb2+ and Cu2+ solutions under different contact times, initial ion concentrations and temperatures were conducted to investigate the adsorption behaviors of analcime zeolite toward those heavy metals. This investigation illustrates a waste-to-value approach and a green process to produce material that reduces the impact of heavy metal pollutants on environment, thus promoting a sustainable and circular economy.
Keywords:
solvent-free synthesis
; analcime zeolite
; porous material
; fly ash
; water treatment
; heavy metal adsorption
; sustainability
; circular economy
1. Introduction
Heavy metals are widely recognized as harmful substances in the environment. Progressive accumulation of heavy metals due to uncontrolled human activities can lead to water pollution, vomiting, fatal diseases like cancer, reproductive failure, etc. [1,2,3]. To combat this issue, various methods including precipitation, ion exchange, electrolysis, flocculation, reverse osmosis membrane, and adsorption have been used for heavy metals removal among which adsorption stands out as a safe and effective approach [2,4,5]. Several different adsorbent materials have been studied, which include chitosan, clay, zeolite, etc. [6,7,8]. Among these adsorbents, zeolite has gained significant popularity not only for removing heavy metals from water but also for treating various health conditions [9,10,11,12].
A variety of raw materials including glass, rice husk ash, slag, and fly ash, have been reported for zeolite synthesis [13,14,15,16]. Among these raw materials, fly ash has been recognized as one of the most suitable materials for zeolite production. The high proportions of SiO2 (20 - 80%) and Al2O3 (1 - 55%) allow for the synthesis of various kinds of zeolites [17]. The utilization of fly ash, a readily available and affordable by-product from industrial activities, thus provides a promising solution to reduce the environmental impact of its disposal in landfills, which can be hazardous to the ecosystem. Several methods have been applied to produce zeolites from fly ash including conventional hydrothermal [18], continuous flow hydrothermal [19], microwave-assisted method [20], ultrasonic-assisted method [21], etc. However, these methods require an enormous quantity of solvent or high reaction pressure that could be risky and expensive when employing at the commercial scale [22].
The solvent-free synthesis offers an alternative to address the shortcomings of current methods. In particular, it is environment-friendly by minimization of wastewater and safer due to lower reaction pressure [23,24,25,26]. A number of research has been conducted toward using the solvent-free method to synthesize different zeolites such as ZSM-5 [27,28,29], SAPO-11 [30], beta [31], Na-P1 [28], EU-1 [32], SSZ-13 [33], mordenite [34], etc. Analcime is a natural mineral belonging to the zeolite group. Its three-dimensional framework includes SiO4 and AlO4 tetrahedra. The chemical formula of analcime is NaAlSi2O6.H2O [35]. The aluminum atoms substitute some silicon atoms in the framework creating a negatively charged structure. Thus, the presence of exchangeable sodium cations in the cages or channels of analcime structure serves to maintain the electroneutrality of the crystal structure. This unique structure of analcime as well as of the zeolite family in general allow them to be used as ion-sieves due to their high cations exchange capacity [36]. Furthermore, the ability to adsorb and release molecules over their porous structures brings up additional advantage of zeolites for filtration and purification purposes.
This study aims at synthesizing analcime zeolite from fly ash by the solvent-free method and determining the optimal condition to obtain the product. Adsorption experiments were also conducted with the heavy metal cations Cu2+ and Pb2+ and the adsorption behaviors of analcime zeolite to these ions were investigated. The authors believe that this is the first time such an extensive characterization of the structure and adsorption properties of analcime zeolite synthesized by the solvent-free method has been carried out. Thus, we hope that the results from this study would promote further interests in the solvent-free method and the utilization of analcime zeolite for water-treatment applications.
2. Experimental
2.1. Materials
The chemicals used for the synthesis of analcime zeolite included sodium metasilicate nonahydrate (Na2SiO3.9H2O, ≥ 98% ) purchased from Merck (Darmstadt, Germany) and fly ash was supplied by Vinh Tan Thermal Power Company (Binh Thuan, Vietnam). The chemicals used for adsorption experiments included copper(II) nitrate trihydrate (Cu(NO3)2.3H2O, ≥ 99%) and lead(II) nitrate (PbNO3 , ≥ 99.5%) purchased from Xilong Scientific Co., Ltd (Guangdong, China).
2.2. Characterization
X-Ray diffraction (XRD) was recorded on a LabX XRD-6100 diffractometer (Shimadzu, Japan) equipped with a LYNXEYE XE-T detector, a vertical goniometer and a sealed Cu tube to determine the crystalline phases of zeolite and fly ash. X-ray fluorescence (XRF) was performed on a S2 PUMA spectrometer (Bruker, Germany) to measure the chemical compositions of fly ash and synthesized products. The surface characteristics of the zeolites were analyzed by the Brunauer-Emmett-Teller (BET) method using Quantachrome High Speed Gas Sorption Analyzer Version 11.02 (Quantachrome, USA). The material morphologies were characterized by the Hitachi S4800 field emission scanning electron microscope (FESEM, Hitachi, Japan). Atomic absorption spectroscopy (AAS) was performed on an Agilent 280FS-AA (Agilent, USA) to measure the concentrations of heavy metal cations in adsorption experiments. The Fourier-transform infrared spectroscopic (FTIR) data of fly ash and the synthesized zeolite were determined by using a Bruker Tensor FT-IR spectrometer (Bruker, Germany). Thermogravity was conducted on a TGA55 Thermogravimetric Analyzer (PerkinElmer, USA)
2.3. Synthesis of Analcime Zeolite
Before being used, the organic components in fly ash were removed by calcination in a furnace at 850oC ±10oC for 2 hours. The calcined fly ash was then cooled and sifted through a 250-mesh sieve. Next, fly ash was ground with sodium metasilicate nonahydrate in a mortar until both reagents were mixed thoroughly according to different molar ratios of SiO2:Al2O3:Na2O as designed. The mixture then was introduced to a teflon-lined autoclave without any solvent, sealed, heated to certain temperature (100 – 200oC) and maintained at this tempearature for 24 – 96 hours. Upon completion of the reaction, the product was ultrasonicated for 15 minutes to break any remaining particle clumps, then washed multiple times by vacuum filtration with de-ionized (DI) water to remove excess Na+ cations. The filtration process was carried out continuously until the pH of the filtrate reached a value of 7. Finally, the clean product was dried at 150oC for 2 hours before being stored in a glass jar at room temperature. Figure 1 summarizes all the synthesis steps.
2.4. Heavy Metal Adsorption Experiments
All experiments were conducted with 1g analcime zeolite as adsorbent mixed with 250mL aqueous Cu2+ or Pb2+ solutions of varying concentrations. The suspension was stirred at 250 rpm for the specified period of time at the specified temperature, then the solid phase (the zeolite) was removed by centrifugation and the liquid phase (the ion solution) was collected for measuring the concentration of heavy metal ions by AAS. Three experimental conditions, including contact time, temperature and Cu2+/Pb2+ concentrations, were varied to investigate their effects on the adsorption behaviors of analcime zeolite [37].
2.4.1. The Influence of Contact Time
The influence of contact time on heavy metal adsorption was studied for regular time intervals over a total period of 1 hour at room temperature. 1g of analcime zeolite was used with 250ml of 100 mg/L Pb2+ or Cu2+ solutions. The adsorption capacity and percent removal were calculated by equation (1) and equation (2), respectively [38,39,40].
in which C0 and Ct (mg/L) are the concentrations of heavy metals before and after the adsorption time t, respectively, (L) is the solution volume, and (g) is the zeolite mass.
To understand the kinetics of Pb2+ and Cu2+ ions adsorption on the analcime zeolite, equation (3) for the description of pseudo-first-order model and equation (4) for the description of pseudo-second-order model were utilized [38,39,40].
in which, qe (mg/g) is the adsorption capacity of Cu2+ or Pb2+ on analcime zeolite at equilibrium; qt (mg/g) is the adsorbed amount of Cu2+ or Pb2+ at time t (min), t is the adsorption time (min), k1 (L/min) denotes the equilibrium rate constant of pseudo-first-order, k2 (g/mg min) is the equilibrium rate constant of pseudo-second-order.
2.4.2. The Influence of Concentration
The effect was investigated by adding 1g adsorbent to 250 ml Pb2+ or Cu2+ solutions with concentrations from 50 to 700 mg/L for 1 hour at room temperature. The adsorption capacity and percent removal were calculated by equation (1) and equation (2), respectively.
The equilibrium data were fitted using the Langmuir and Freundlich isotherm models [38,39,40]. In the Langmuir model, the adsorption is assumed to occur on a homogeneous surface with no interactions between adsorbed species and expressed mathematically as
in which (mg/L) denotes the heavy metal Cu2+ or Pb2+ concentration at equilibrium; (mg/g) denotes the adsorption capacity of Cu2+ or Pb2+ on analcime zeolite at equilibrium; (mg/g) denotes the maximum adsorption capacity of analcime zeolite; (L/mg) denotes the Langmuir binding constant related to the adsorption binding energy.
For the adsorption on a heterogeneous surface with interactions between adsorbed species, the empirical Freundlich isotherm model was employed and mathematically expressed as
and the maximum amount of separated species, Um, can be calculated from the Freundlich isotherm model as
in which c0 (mg/L) is the initial heavy metal Cu2+ or Pb2+ concentration, (mg/g) is the constant of Freundlich isotherm model, and is the factor of heterogeneity.
Um = KF (co)1/n
2.4.3. The Influence of Temperature
The effect of temperature was investigated at 25, 50 and 75°C for 1 hour using 1g of analcime zeolite with 250 ml of 100 mg/L Pb2+ or Cu2+ solutions. The obtained data from experiments were utilized for the projection of thermodynamic impacts, including the standard Gibbs free energy (), entropy (), and enthalpy(), according to equations. (8-10) [38,39,40].
in which KT is the equilibrium constant at temperature T (K), R is the ideal gas constant which is 8.314 J/mol K.
3. Results and Discussion
3.1. The Optimum Synthesis Condition
3.1.1. Molar Ratio of SiO2:Al2O3:Na2O
The molar ratio of SiO2:Al2O3:Na2O is an important factor in determining what type of zeolite synthesized. In this research, five different molar ratios were used which included, in the order of increasing SiO2 and Na2O proportions, 4.4:1.0:1.3; 4.6:1.0:1.5; 4.8:1.0:1.7; 5.1:1.0:1.9 and 5.2:1.0:2.1. As seen in Figure 2, the XRD pattern corresponding to the molar ratio of 4.8:1.0:1.7 demonstrated the purest analcime product whereas those corresponding to other ratios showed mixes of analcime peaks, mullite peaks and quartz peaks. Thus, this finding suggested that the molar ratio of 4.8:1.0:1.7 was optimum for the synthesis of analcime zeolite from fly ash by the solvent-free method at 125oC for 72h.
3.1.2. Temperature
To investigate the influence of temperature on the synthesis of zeolite, experiments were conducted at five different temperatures: 100, 125, 150, 175 and 200oC. At 100oC, the resulting XRD pattern showed a mix of analcime peaks and mullite peaks while at temperatures as high as 150 – 200oC, quartz peaks were observed in addition to those peaks of analcime and mullite. Only at 125oC, the unwanted peaks of mullite and quartz disappeared, leaving only the peaks of analcime zeolite (Figure 3). These results suggested that, like molar ratio, temperature also played a significant role in the conversion from fly ash to analcime zeolite and the optimum temperature was 125oC
3.1.3. Synthesis Time
To investigate the influence of synthesis time on the formation of analcime zeolite, we conducted experiments for 24, 48, 72 and 96 hours at 4.8SiO2:1.0Al2O3:1.7Na2O and 125oC (Figure 4). After 24 hours, weak analcime peaks appeared, indicating the formation of some initial analcime crystals. The analcime peaks continued to grow in intensity and reached their maximum intensities after 72 hours. Further increase in synthesis time introduced additional peaks of the quartz phase. Clearly, a good control of synthesis time will avoid premature collection of products or unwanted other phases, both of which will lower production yield. Our results indicated that 72 hours should be the optimum time for the synthesis of analcime zeolite under our specific condition.
3.2. Zeolite Characterization
3.2.1. X-Ray Diffraction Characterization
XRD analysis of the calcined fly ash (FA) sample revealed that it primarily consisted of an amorphous phase, with minor mullite and quartz phases. Upon reaction under the solvent-free condition at 125oC for 72 hours with the molar ratio of 4.8SiO2:1.0Al2O3:1.7Na2O, the corresponding XRD pattern in Figure 5 demonstrated the successful formation of analcime as the predominant crystalline phase in the product. A small peak at 2θ ≈ 33o was identified to be of the remaining mullite. This result aligned closely with the crystalline phases observed in analcime zeolite synthesized via the hydrothermal route [40,41].
3.2.2. Scanning Electron Microscopy Characterization
The synthesized analcime zeolite under optimum condition had the morphology and size distribution as shown in Figures 6(a-c). Most particles were quasi-spherical with relatively smooth surfaces and a few of the particles were aggregated. We manually measured the sizes of more than 300 zeolite particles using the ImageJ software and determined their mean particle size to be 2.36 ± 0.36 μm or 2.36 ± 15.25%. Their size distribution was shown by the histogram in Figure 6(c), which exhibited a bell-shaped Gaussian distribution. The chemical composition of the synthesized analcime zeolite, analyzed by EDX, was presented in Figure 6(d). The spectrum indicated the presence of four primary elements: O, Na, Al, and Si, which were also the chemical make-up of the analcime zeolite. Quantitatively, a rough estimation of the Na:Al:Si:O atomic ratio as 1:1.5:3:11 agreed quite well with the chemical formula of analcime zeolite, NaAlSi2O6.H2O, and was comparable to that of analcime zeolite synthesized via hydrothermal route [40]. The high oxygen content was attributed to the presence of water molecules in the analcime zeolite structure.
To further investigate the effects of varying synthesis parameters, including molar ratio, temperature, and time, from the optimum condition on the formation of analcime zeolite, we selected, for each parameter, one sample whose XRD result from section 3.1 showed the highest ratio of analcime peaks to other peaks. Their SEM images were shown in Figures 7(b-d). The raw calcined fly ash in Figure 7(a) appeared to be composed of compact, large, spherical particles with very smooth surfaces, likely mullite particles. The sizes of these particles were estimated from 10 to 20 μm and each particle contained within it smaller particles. Under the temperature and pressure conditions in the autoclave, large particles broke and mullite particles dissolved into the reaction mixture. At reaction conditions less than optimum, analcime zeolites still formed but in different degrees. Specifically, at non-optimum temperature (Figure 7(b)), analcime zeolite particles were obtained in very low yield. The rest were fragments of dissolved fly ash not yet converted to zeolite particles. At non-optimum molar ratio (Figure 7(c)), more zeolite particles were obtained but still with low yield and a great number of unconverted fly ash. Only when the optimum temperature and molar ratio were used, then moderate yield of analcime zeolite particles were obtained after 24 hours (Figure 7(d)) and an almost complete conversion to analcime zeolite after 72 hours.
3.2.3. FTIR Analysis
Figure 8 compared the FTIR spectra of fly ash and analcime zeolite. Considering the spectrum of fly ash, we observed a broad absorption band at 3485 cm-1 indicating the stretching vibration of the hydroxyl (-OH) groups of adsorbed water. Further to the fingerprint region (600 – 1500 cm-1), the stretching vibration of Si-O-Si bonds of the mullite structure was evident by the absorption band of fly ash at 1092 cm-1. Similarly, the absorption band at 561 cm-1 would be assigned to the Al-O stretching vibration of the AlO6 octahedral structural unit of mullite. The absorption band at 467 cm-1 was assigned to the Si-O bending vibration. Considering the spectrum of analcime zeolite, similar to fly ash, we also observed a broad absorption band at 3464 cm-1 representing the vibration of the hydroxyl groups, a strong absorption band at 988 cm-1 representing the stretching vibration of Si-O-Si bonds, and an absorption band at 447 cm-1 assigned to the Si-O bending vibration. However, the first band just mentioned was stronger for analcime and slightly shifted to the lower wavenumber. It also coupled with two other sharp bands at 1641 and 1466 cm-1, which together indicated the stretching and bending vibrations of the aluminol (Al-OH) and silanol (Si-OH) groups and the solid phase hydrate water in the zeolite channels. Additionally, analcime zeolite showed characteristic absorption bands at 737 and 623 cm-1, attributed to the external and internal asymmetric vibrations of the T-O-T units (with T = Al or Si) in the three-dimensional tetrahedral framework. Finally, a band at 571 cm-1 indicated the double ring vibrations, including the 4- and 6-membered ring vibrations in the crystal structure of analcime zeolite [32,42,43,44].
3.2.4. X-Ray Fluorescence Spectroscopy Analysis
The chemical compositions of fly ash before and after calcination were presented in Table 1. Before calcination, fly ash primarily consisted of 56.7% SiO2 and 26.7% Al2O3 and a minor amount of 0.26% Na2O, making it suitable for zeolite synthesis. Additionally, a notable presence of organic compounds was observed, as indicated by the loss on ignition (LOI) value of 0.94%. After calcination, SiO2 content slightly decreased to 51.8% while the proportions of Al2O3 and Na2O increased to 34.1% and 0.54%, respectively. Calcination also reduced the organic content, lowering the LOI to 0.06% after exposure to high temperature for 2 hours. The synthesized zeolite under optimum condition exhibited 49.78% SiO2, 29.14% Al2O3 and 9.58% Na2O, which were comparable to those of natural analcime zeolite [45].
3.2.5. Surface Characterization
The surface characteristics of analcime zeolite were analyzed by the nitrogen adsorption technique. The BET surface area of analcime zeolite in this study was determined to be 21.311 m2.g-1, surpassing the values reported for natural analcime zeolite and some ion-exchanged analcime zeolites (10.40 - 17.66 m2.g-1) [46]. The total pore volume (0.055 cm3.g-1) and average pore diameter (10.226 nm) of analcime zeolite as shown in Table 2, were also comparable to other synthetic zeolites reported in the literature [47,48]. These results underscored the potential of the solvent-free method for enhancing adsorption capacity.
3.2.6. Thermal Stability Analysis
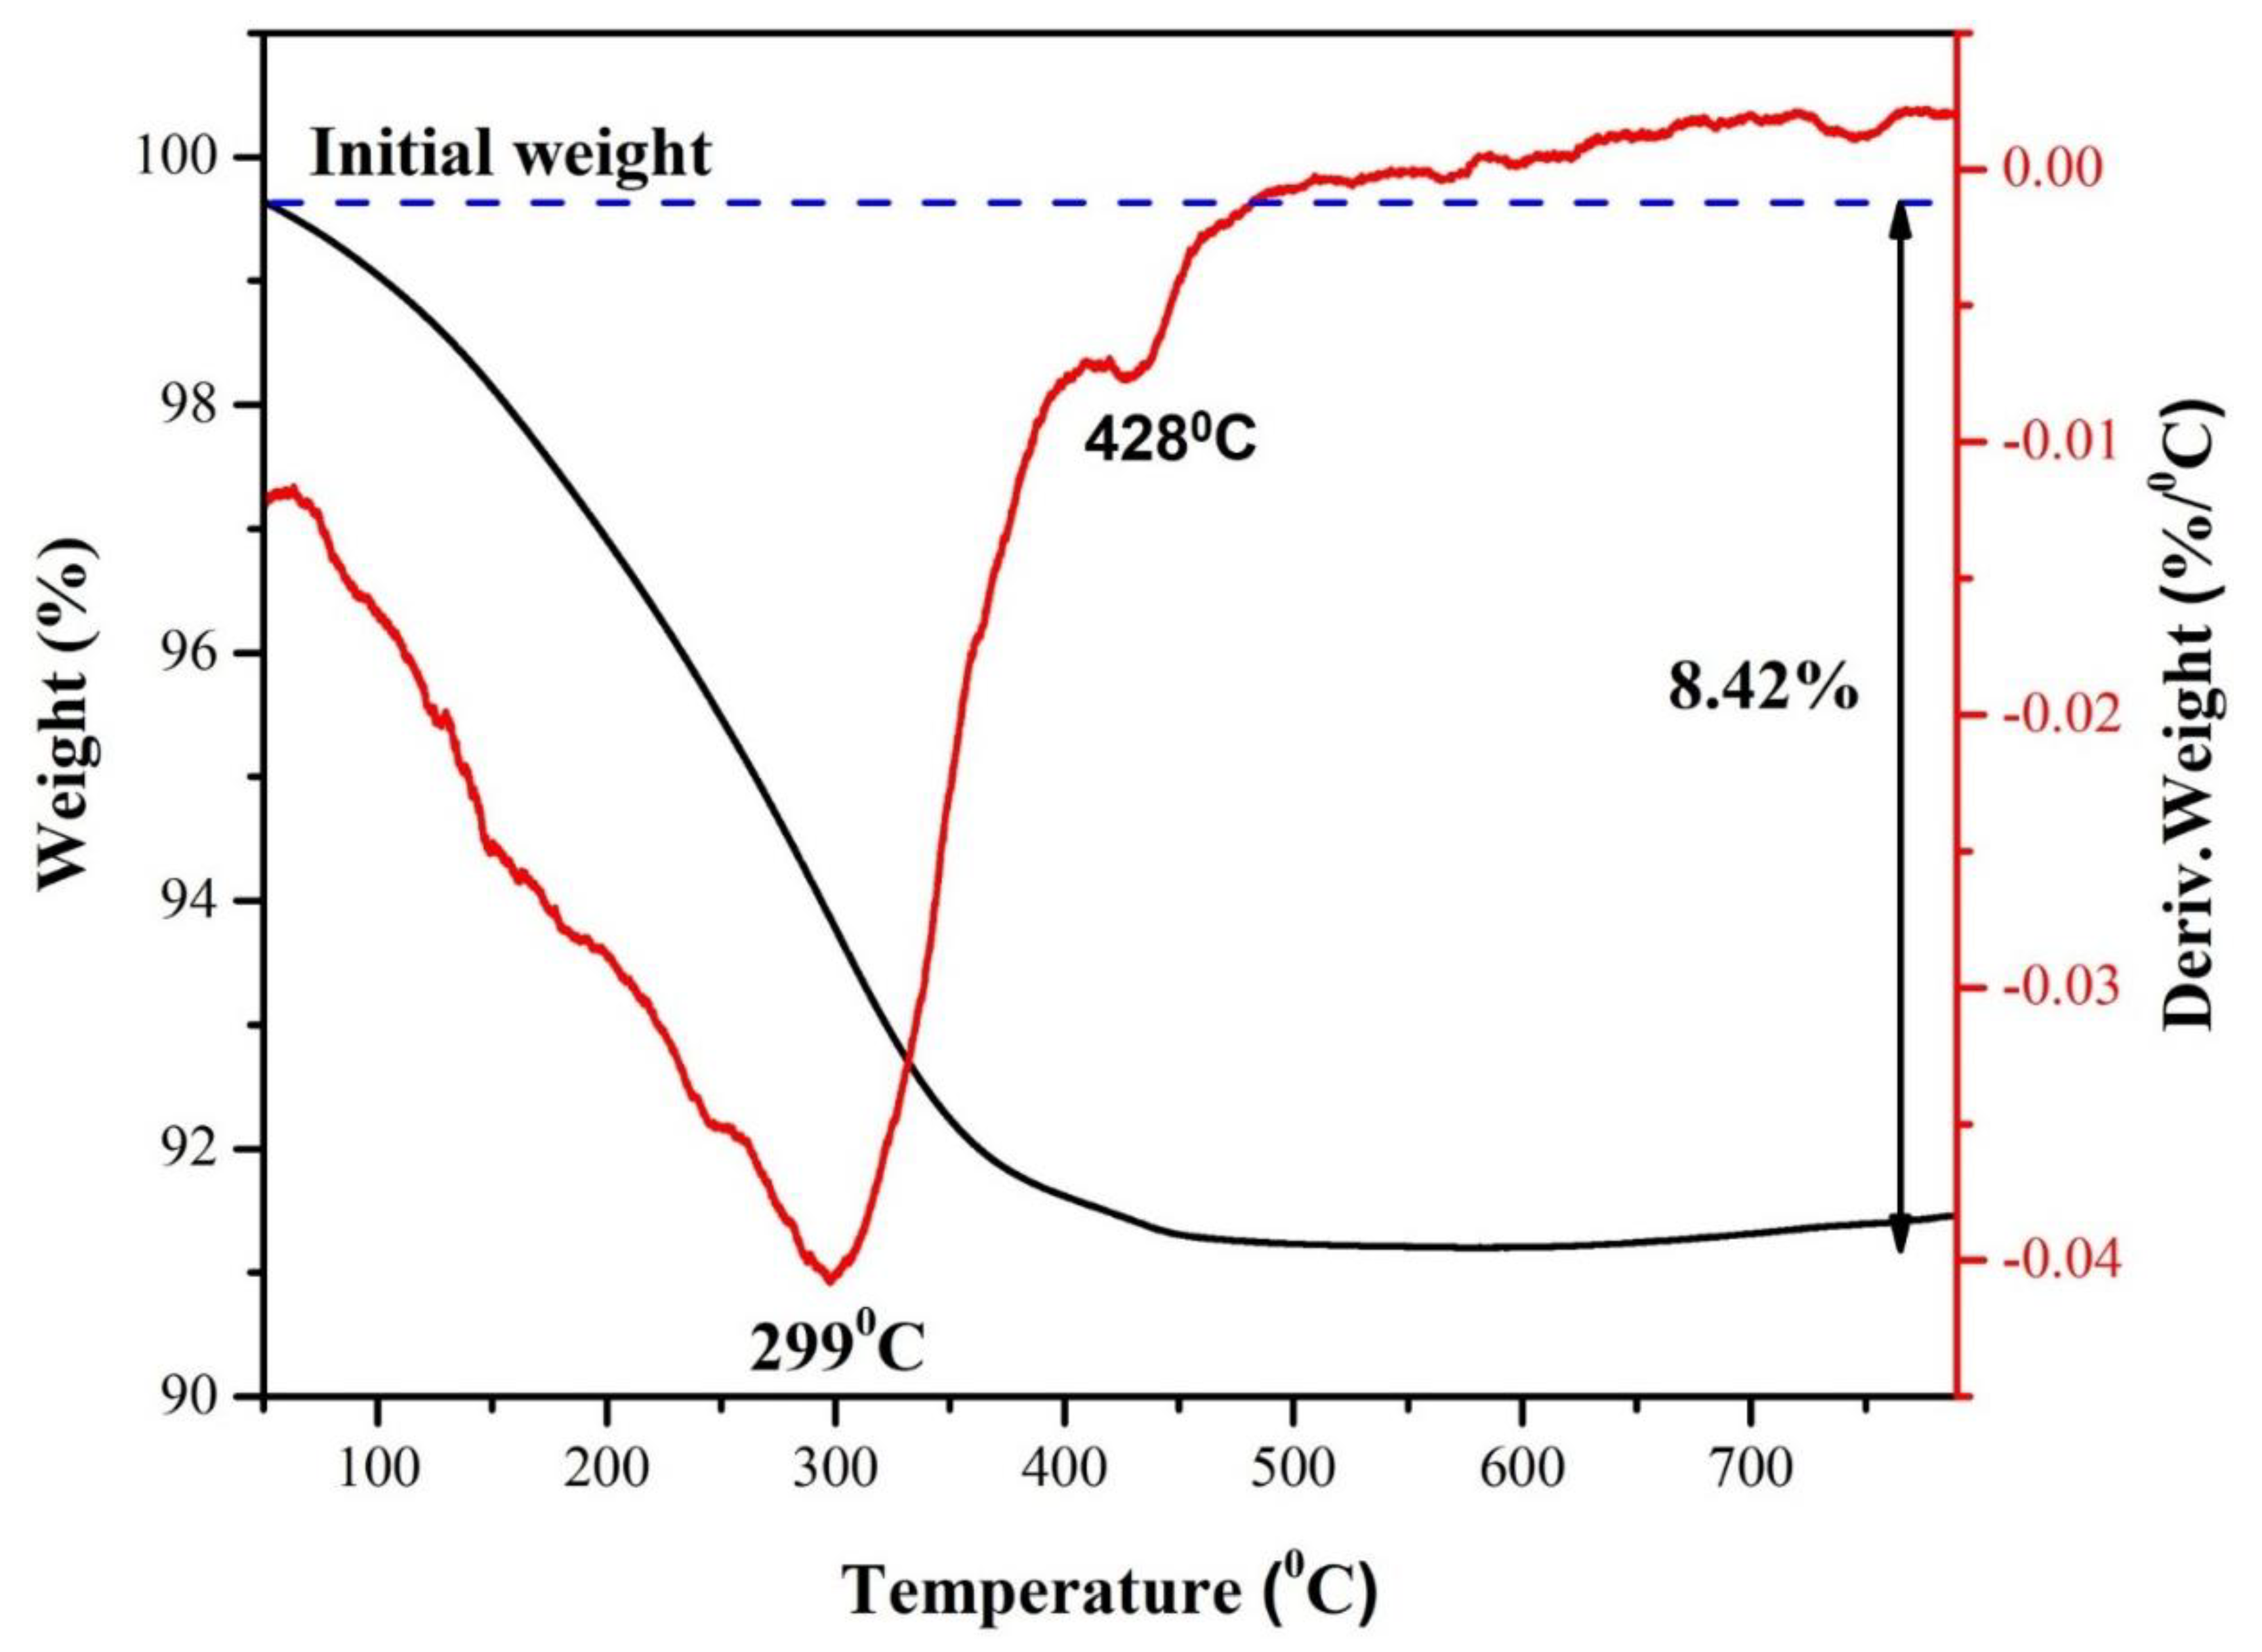
The thermal stability of analcime zeolite was evaluated by TG-DSC analysis. For the DSC, the curve revealed two endothermic peaks at 299oC and 428oC, which would be associated with the mass losses due to adsorbed water and the decomposition of the OH groups in zeolite, respectively, as observed in the TG curve. Also, the TG curve showed a total mass loss of 8.42%, which aligned closely with the LOI value of analcime. Above ~584oC, both the TG and the DSC curves showed no significant mass loss or heat flow, indicating that the analcime zeolite was stable beyond this temperature, similar to previous reports [49,50].
Figure 9.
TGA and DSC curves of analcime zeolite.
3.3. Measurements of Heavy Metal Adsorption
3.3.1. Kinetic Study
The effect of adsorption time on the removal efficiency of Pb(II) and Cu(II) cations using the synthesized analcime zeolite was evaluated based on percentage removal over time, as shown inFigure 10. For Pb2+, the perecentage removal and adsorption capacity reached the peaks of 94.227% and 21.625 mg/g, respectively, after 35 min, then almost levelled off (Figure 10(a,b)). Similarly, for Cu2+, the values were 31.150% and 4.875 mg/g at 35 min (Figure 10(c,d)). Thus, the equilibrium adsorption time for both ions under our experimental conditions was determined to be 35 minutes.
Kinetic modeling results are presented in Figure 11 for Pb(II) and Figure 12 for Cu(II) as well as in Table 3. For Pb(II), the pseudo-second-order model provides a better fit (R2 = 0.990) compared to the pseudo-first-order model (R2 = 0.979). The pseudo-second-order equilibrium adsorption capacity ( = 23.98 mg/g) calculated from the model also closely matches the experimental data (21.63 mg/g). These results suggest that Pb(II) adsorption was primarily governed by chemisorption, involving chemical bond formation between Pb(II) ions and the zeolite surface, and therefore, percentage removal would be more dependent on the adsorption capacity of the synthesized zeolite than on the initial ion concentration [51,52].
On the other hand, the Cu(II) adsorption process is better described by the pseudo-first-order (R2 = 0.995 ) (Figure 12a) than the pseudo-second-order (R2 = 0.980) (Figure 12b). The pseudo-first-order equilibrium adsorption capacity ( = 4.66 mg/g) calculated from the model also aligns with the experimental value (4.88 mg/g). These results indicate that Cu(II) adsorption was dictated by the diffusion of the adsorbates to the adsorbent surfaces and was strongly influenced by the initial concentration of the adsorbates [51,53].
3.3.2. Equilibrium Study
Figure 13a illustrates the percentage removal of Pb2+ by analcime zeolite when the Pb2+ concentrations were varied between 85 mg/L and 700 mg/L. Notably, as the initial concentrations of heavy metal solutions increased, the percentage removal of Pb2+ by analcime zeolite decreased. In order to describe the adsorption behavior, the isotherm models including Langmuir (Equation (5)) and Freundlich (Equation (6)) models were utilized. It was determined that the Langmuir adsorption isotherm provided a better fit compared to the Freundlich adsorption isotherm with KL = 0.176 (L/mg) (Figure 13b), indicated by the lower correlation coefficient of Freundlich adsorption isotherm (R2 = 0.669) (Figure 13c) compared to that of the Langmuir adsorption isotherm (R2 = 0.997).
Figure 14a illustrates the percentage removal of Cu2+ by analcime zeolite when the Cu2+ concentrations were varied between 50 mg/L to 600 mg/L. Similar to the case with Pb2+, the percentage removal of Cu2+ by analcime zeolite also decreased when initial concentrations of Cu2+ increased. Likewise, the adsorption behavior of analcime zeolite was also better fitted by the Langmuir adsorption isotherm model giving KL = 0.007 (L/mg) (Figure 14b), indicated by the higher correlation coefficient R2 = 0.996 as compared with R2 = 0.956 of the Freundlich model. These results indicated that Pb2+ and Cu2+ behaved quite similarly when adsorbing to analcime zeolite. The ions might adsorb to the active sites on analcime zeolite identically and independently, forming a near monolayer of adsorbates [51,54].

Table 4.
Parameters calculated from the Langmuir and Freundlich models for the adsorption processes of Pb2+ and Cu2+ ions.
Table 4.
Parameters calculated from the Langmuir and Freundlich models for the adsorption processes of Pb2+ and Cu2+ ions.
| Heavy metal ions | Equilibrium model | |||||
| Langmuir | Freundlich | |||||
| qmax (mg/g) | KL (L/mg) | R2 | qmax (mg/g) | KF (mg/g)(L/mg)1/n | R2 | |
| Pb2+ | 22.935 | 0.176 | 0.997 | 18.767 | 10.576 | 0.669 |
| Cu2+ | 12.853 | 0.007 | 0.996 | 3.926 | 0.5067 | 0.956 |
3.3.3. Thermodynamics Study
Data from adsorption experiments conducted at three different temperatures of 25oC, 50oC and 75oC revealed a correlation between the temperature and the percentage of heavy metal removal. Specifically, for the Pb2+ solution, we observed that as the temperature increased from 25oC to 50oC and 75oC, the percentage removal of Pb2+ slightly decreased from 89.65 to 88.02, and 86.16%, respectively. On the other hand, an opposite trend was recorded for the Cu2+ solution in which the percentage removal of Cu2+ increased substantially from 42.17% to 70.44% and 82.43% with respect to increasing temperature. Then, using equations (8) – (10), we were able to determine the standard Gibbs free energy (), entropy (), and enthalpy (), and these thermodynamic values for Pb2+ and Cu2+ adsorption processes were displayed in Table 5 and Table 6, respectively.
Figure 15.
Effect of temperature on the percentage removal of Pb2+ (a) and Cu2+ (b), and linear fitting of ln(KT) vs. 1/T for Pb2+ (c) and Cu2+ (d) adsorption.
Figure 15.
Effect of temperature on the percentage removal of Pb2+ (a) and Cu2+ (b), and linear fitting of ln(KT) vs. 1/T for Pb2+ (c) and Cu2+ (d) adsorption.

3.3.4. Comparative Study with Other Zeolites
In this section, we compared the performance of analcime zeolite synthesized in this work with those of some selected natural and fly-ash derived zeolites found in the literature. These performances were presented in Table 7 as adsorption capacities corresponding to several types of zeolites. Obviously, the synthesized analcime zeolite showed superior adsorption capacity to those of many other zeolite types, especially natural zeolites. It should, therefore, be considered as a promising type of zeolite for further performance improvement and for removing heavy metals from aqueous media.
4. Conclusion
In conclusion, analcime zeolite from fly ash was successfully synthesized by the solvent-free method. The optimal synthesis conditions were demonstrated to be 125oC and 72 hours with a molar ratio of SiO2:Al2O3:Na2O = 4.8:1.0:1.7. The analcime zeolite was characterized by several analytical techniques to confirm and investigate its composition, bulk and surface structures, morphology and porosity. We also investigated adsorption behaviors of the synthesized analcime zeolite toward heavy metals, Pb2+ and Cu2+ in particular, by conducting several experiments under varying contact times, intial ion concentrations and temperatures. It was determined that the processes of Pb2+ and Cu2+ adsorption followed the pseudo second- and first-order kinetic models, respectively, while at equilibrium, both processes followed the Langmuir model. This study contributes to the current efforts towad green production of materials by converting unwanted raw materials to high-value materials while reducing liquid waste to the environment.
Data Availability Statement
All data that support the findings of this study are included within the article.
Acknowledgements
We acknowledge Ho Chi Minh City University of Technololgy (HCMUT), VNU-HCM for supporting this study
References
- Singh, R.; Gautam, N.; Mishra, A.; Gupta, R. Indian J. Pharmacol. 2011, 43, 246. [CrossRef] [PubMed]
- Zaimee, M.Z.; Sarjadi, M.S.; Rahman, M.L. Water Res. 2021, 13, 2659.
- Mitra, S.; Chakraborty, A.J.; Tareq, A.M.; Emran, T.B.; Nainu, F.; Khusro, A.; Idris, A.M.; Khandaker, M.U.; Osman, H.; Alhumaydhi, F.A.; Simal-Gandara, J. J. King Saud Univ. Sci. 2022, 34, 101865. [CrossRef]
- Saritha, D. Mater. Today: Proc. 2022, 62, 3973–3977. [CrossRef]
- Rajendran, S.; Priya, A.K.; Senthil Kumar, P.; Hoang, T.K.A.; Sekar, K.; Chong, K.Y.; Khoo, K.S.; Ng, H.S.; Show, P.L. Chemosphere 2022, 303, 135146.
- Elboughdiri, N. Cogent Eng. 2020, 7, 1782623.
- Zhang, T.; Wang, W.; Zhao, Y.; Bai, H.; Wen, T.; Kang, S.; Song, G.; Song, S.; Komarneni, S. Chem. Eng. J. 2021, 420, 127574. [CrossRef]
- Haripriyan, U.; Gopinath, K.P.; Arun, J. Mater. Lett. 2022, 312, 131670. [CrossRef]
- Aragaw, T.A.; Ayalew, A.A. Water Pract. 2018, 14, 145–159.
- Khojaewa, V.; Lopatin, O.; Zelenikhin, P.; Ilinskaya, O. Front. Pharmacol. 2019, 10.
- Yogafanny, E.; Yohan, K.O.; Sungkowo, A. IOP Conf. Ser.: Earth Environ. Sci. 2018, 212, 012014. [CrossRef]
- Misaelides, P. Microporous Mesoporous Mater.2011, 144(1–3), 15–18.
- Khaleque, A.; Alam, M.M.; Hoque, M.; Mondal, S.; Haider, J.B.; Xu, B.; Johir, M.A.H.; Karmakar, A.K.; Zhou, J.L.; Ahmed, M.B.; Moni, M.A. Environ. Adv. 2020, 2, 100019. [CrossRef]
- Campanile, A.; Liguori, B.; Ferone, C.; Caputo, D.; Aprea, P. Sci. Rep. 2022, 12.
- Yao, G.; Lei, J.; Zhang, X.; Sun, Z.; Zheng, S. Materials 2018, 11, 906.
- Ren, X.; Qu, R.; Liu, S.; Zhao, H.; Wu, W.; Song, H.; Zheng, C.; Wu, X.; Gao, X. Aerosol Air Qual. Res. 2020, 20, 1127–1144. [CrossRef]
- Ohenoja, K.; Wigren, V.; Österbacka, J.; Illikainen, M. Waste Biomass Valori. 2018, 10, 3525–3534.
- Längauer, D.; Čablík, V.; Hredzák, S.; Zubrik, A.; Matik, M.; Danková, Z. Materials 2021, 14, 1267.
- Ahmad, S.; Mustapha, L.B.; Calvo, S.; Collignon, F.; Fernandes, A.E.; Toye, D. Chem. Eng. Process.: Process Intensif. 2023, 189, 109399. [CrossRef]
- Makgabutlane, B.; Nthunya, L.N.; Nxumalo, E.N.; Musyoka, N.M.; Mhlanga, S.D. ACS Omega 2020, 5, 25000–25008.
- Ojumu, T.V.; Du Plessis, P.W.; Petrik, L.F. Ultrason. Sonochem. 2016, 31, 342–349. [CrossRef] [PubMed]
- Derbe, T.; Temesgen, S.; Bitew, M. Adv. Mater. Sci. Eng. 2021, 2021, 1–17. [CrossRef]
- Wu, Q.; Meng, X.; Gao, X.; Xiao, F.S. Acc. Chem. Res. 2018, 51, 1396–1403. [CrossRef] [PubMed]
- Liu, J.; Yu, J. “Toward Greener and Designed Synthesis of Zeolite Materials.” Zeolites and Zeolite-Like Materials, edited by Sels, B.F.; Kustov, L.M., Elsevier, 2016, pp. 1-32.
- Al-Nahari, S.; Laurencin, D.; Alonso, B. Microporous Mesoporous Mater. 2023, 350, 112445.
- Wu, Q.; Wang, X.; Qi, G.; Guo, Q.; Pan, S.; Meng, X.; Xu, J.; Deng, F.; Fan, F.; Feng, Z.; Li, C.; Maurer, S.; Müller, U.; Xiao, F.-S. J. Am. Chem. Soc. 2014, 136, 4019–4025. [CrossRef] [PubMed]
- Li, H.; Liu, X.; Qi, S.; Xu, L.; Shi, G.; Ding, Y.; Yan, X.; Huang, Y.; Geng, J. Angew. Chem. Int. Ed. 2017, 56, 14090–14095. [CrossRef] [PubMed]
- Wu, Q.; Liu, X.; Zhu, L.; Ding, L.; Gao, P.; Wang, X.; Pan, S.; Bian, C.; Meng, X.; Xu, J.; Deng, F.; Maurer, S.; Müller, U.; Xiao, F.S. J. Am. Chem. Soc. 2015, 137, 1052–1055. [CrossRef] [PubMed]
- Jin, Y.; Chen, X.; Sun, Q.; Sheng, N.; Liu, Y.; Bian, C.; Chen, F.; Meng, X.; Xiao, F.S. Chem. Eur. J. 2014, 20, 17616−17623.
- Liu, Y.; Lyu, Y.; Zhao, X.; Xu, L.; Mintova, S.; Yan, Z.; Liu, X. Chem. Commun. 2018, 54, 10950–10953. [CrossRef] [PubMed]
- Bian, C.; Zhang, C.; Pan, S.; Chen, F.; Zhang, W.; Meng, X.; Maurer, S.; Dai, D.; Parvulescu, A.N.; Müller, U.; Xiao, F.-S. J. Mater. Chem. A 2017, 5, 2613–2618. [CrossRef]
- Liu, Y.; Yan, C.; Zhao, J.; Zhang, Z.; Wang, H.; Zhou, S.; Wu, L. J. Clean. Prod. 2018, 202, 11–22. [CrossRef]
- Shan, Y.; Shi, X.; Du, J.; Yan, Z.; Yu, Y.; He, H. Ind. Eng. Chem. Res. 2019, 58, 5397–5403. [CrossRef]
- Kornas, A.; Olszówka, J.E.; Urbanova, M.; Mlekodaj, K.; Brabec, L.; Rathousky, J.; Dedecek, J.; Pashkova, V. Eur. J. Inorg. Chem. 2020, 2020, 2791–2797. [CrossRef]
- Baur, W.H.; Baur, W.; Fischer, R.X. Microporous and other Framework Materials with Zeolite-Type Structures, Springer, 2017.
- Krstic, V. “Role of zeolite adsorbent in water treatment.” Handbook of Nanomaterials for Wastewater Treatment, edited by Bhanvase, B.; Sonawane, S.; Pawade, V.; Pandit, A., Elsevier, 2021, pp. 417-481.
- Raji, Z.; Karim, A.; Karam, A.; Khalloufi, S. Waste 2023, 1, 775-805.
- Sahoo, T.R.; Prelot, B. “Adsorption processes for the removal of contaminants from wastewater: the perspective role of nanomaterials and nanotechnology.” Nanomaterials for the Detection and Removal of Wastewater Pollutants, edited by Bonelli, B.; Freyria, F.S.; Rossetti, I.; Sethi, R., Elsevier, 2020, pp. 161-222.
- Abdelrahman, E.A.; Hegazey, R.M.; Alharbi, A. J. Inorg. Organomet. Polym. Mater. 2019, 30, 1369–1383. [CrossRef]
- Yubin, K.; Im, B.; Choi, J.J.; Yoon, J.H.; Kim, D.G. Arch. Metall. Mater. 2022, 67, 67–72.
- Novembre, D.; Gimeno, D. Sci. Rep. 2021, 11.
- Yadav, V.K.; Saxena, P.; Lal, C.; Gnanamoorthy, G.; Choudhary, N.; Singh, B.; Tavker, N.; Kalasariya, H.; Kumar, P. Int. J. Nanotechnol. 2020, 5, 10–25.
- Hameed, A.M.; Alharbi, A.; Abdelrahman, E.A.; Mabrouk, E.M.; Hegazey, R.M.; Algethami, F.K.; Al-Ghamdi, Y.O.; Youssef, H.M. J. Inorg. Organomet. Polym. Mater. 2020, 30, 4117–4128. [CrossRef]
- Beran, A.; Voll, D.; Schneider, H. J. Eur. Ceram. 2001, 21, 2479–2485. [CrossRef]
- Mattioli, M.; Cenni, M. Data Brief 2020, 31, 105791.
- Sakizci, M. Anadolu Univ. J. of Sci. and Technology – A – Appl. Sci. and Eng. 2016, 17, 724–724.
- Abdelrahman, E.A.; Hegazey, R.M.; Alharbi, A. J. Inorg. Organomet. Polym. Mater 2019, 30, 1369–1383. [CrossRef]
- Wang, P.; Sun, Q.; Zhang, Y.; Cao, J. Inorg. Chem. Commun. 2020, 111, 107639. [CrossRef]
- Chipera, S.J.; Bish, D.L. Eur. J. Mineral. 2010, 22, 787–795. [CrossRef]
- Liu, C.; Ma, H.; Gao, Y. Adv. Powder Technol. 2019, 30, 2483–2491. [CrossRef]
- Plazinski, W.; Dziuba, J.; Rudzinski, W. Adsorp. Sci. Technol. 2013, 19, 1055–1064. [CrossRef]
- Ho, Y.S.; McKay, G. Process Biochem. 1999, 34, 451–465.
- Lagergren, S. Kongl. Vetensk. Acad. 1898, 24, 1–39.
- Liu, L.; Luo, X.B.; Ding, L.; Luo, S.L. “Application of nanotechnology in the removal of heavy metal from water.” Nanomaterials for the Removal of Pollutants and Resource Reutilization, edited by Xubiao, L.; Fang, D., Elsevier, 2019, pp. 83–147.
- Karatas, M. J. Hazard. Mater. 2012, 199, 383–389. [CrossRef] [PubMed]
- Ouki, S.K.; Kavannagh, M. Water Sci. Technol. 1999, 39(10–11), 115-122.
- Nguyen, T.C.; Loganathan, P.; Nguyen, T.V.; Vigneswaran, S.; Kandasamy, J.; Naidu, R. Chem. Eng. J. 2015, 270, 393–404. [CrossRef]
- Sprynskyy, M.; Buszewski, B.; Terzyk, A.P.; Namieśnik, J. J. Colloid Interface Sci. 2006, 304, 21–28. [CrossRef] [PubMed]
Figure 1.
Schematic process for the synthesis of analcime zeolite.
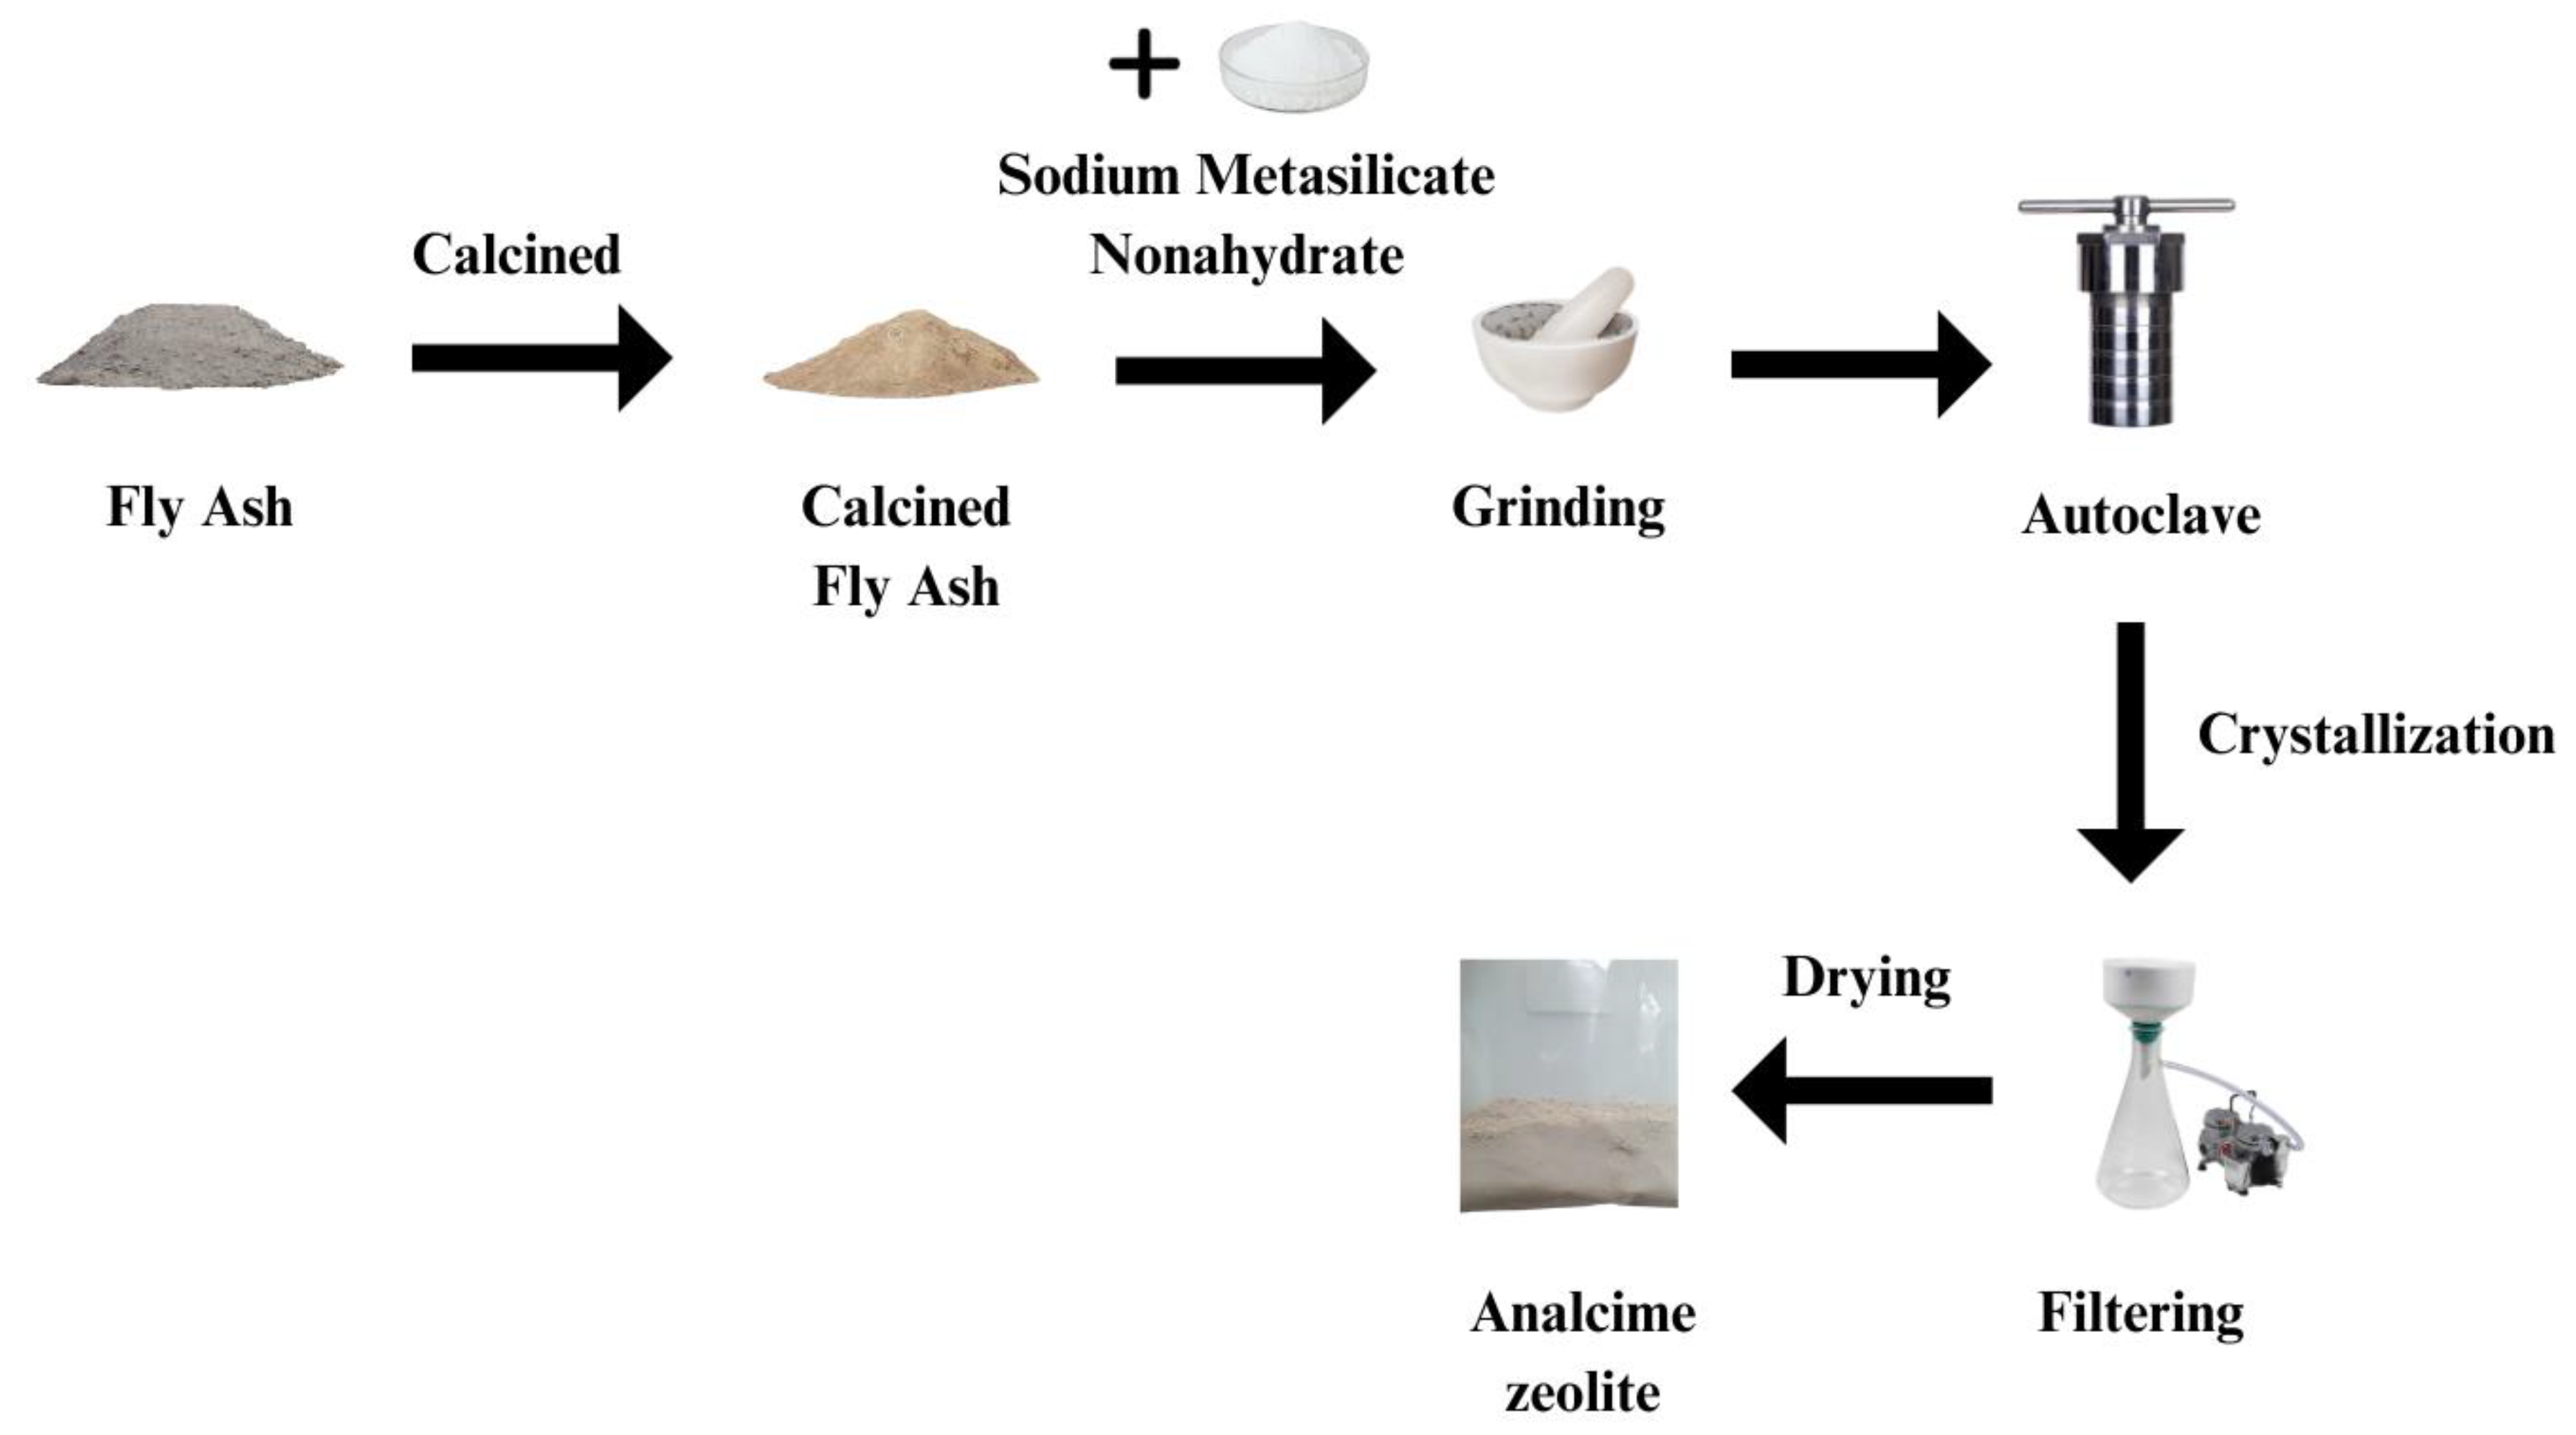
Figure 2.
XRD patterns of products synthesized at 125°C for 72 hours with five different molar ratios of SiO2:Al2O3:Na2O. A- Analcime, M - Mullite, Q - Quartz.
Figure 2.
XRD patterns of products synthesized at 125°C for 72 hours with five different molar ratios of SiO2:Al2O3:Na2O. A- Analcime, M - Mullite, Q - Quartz.
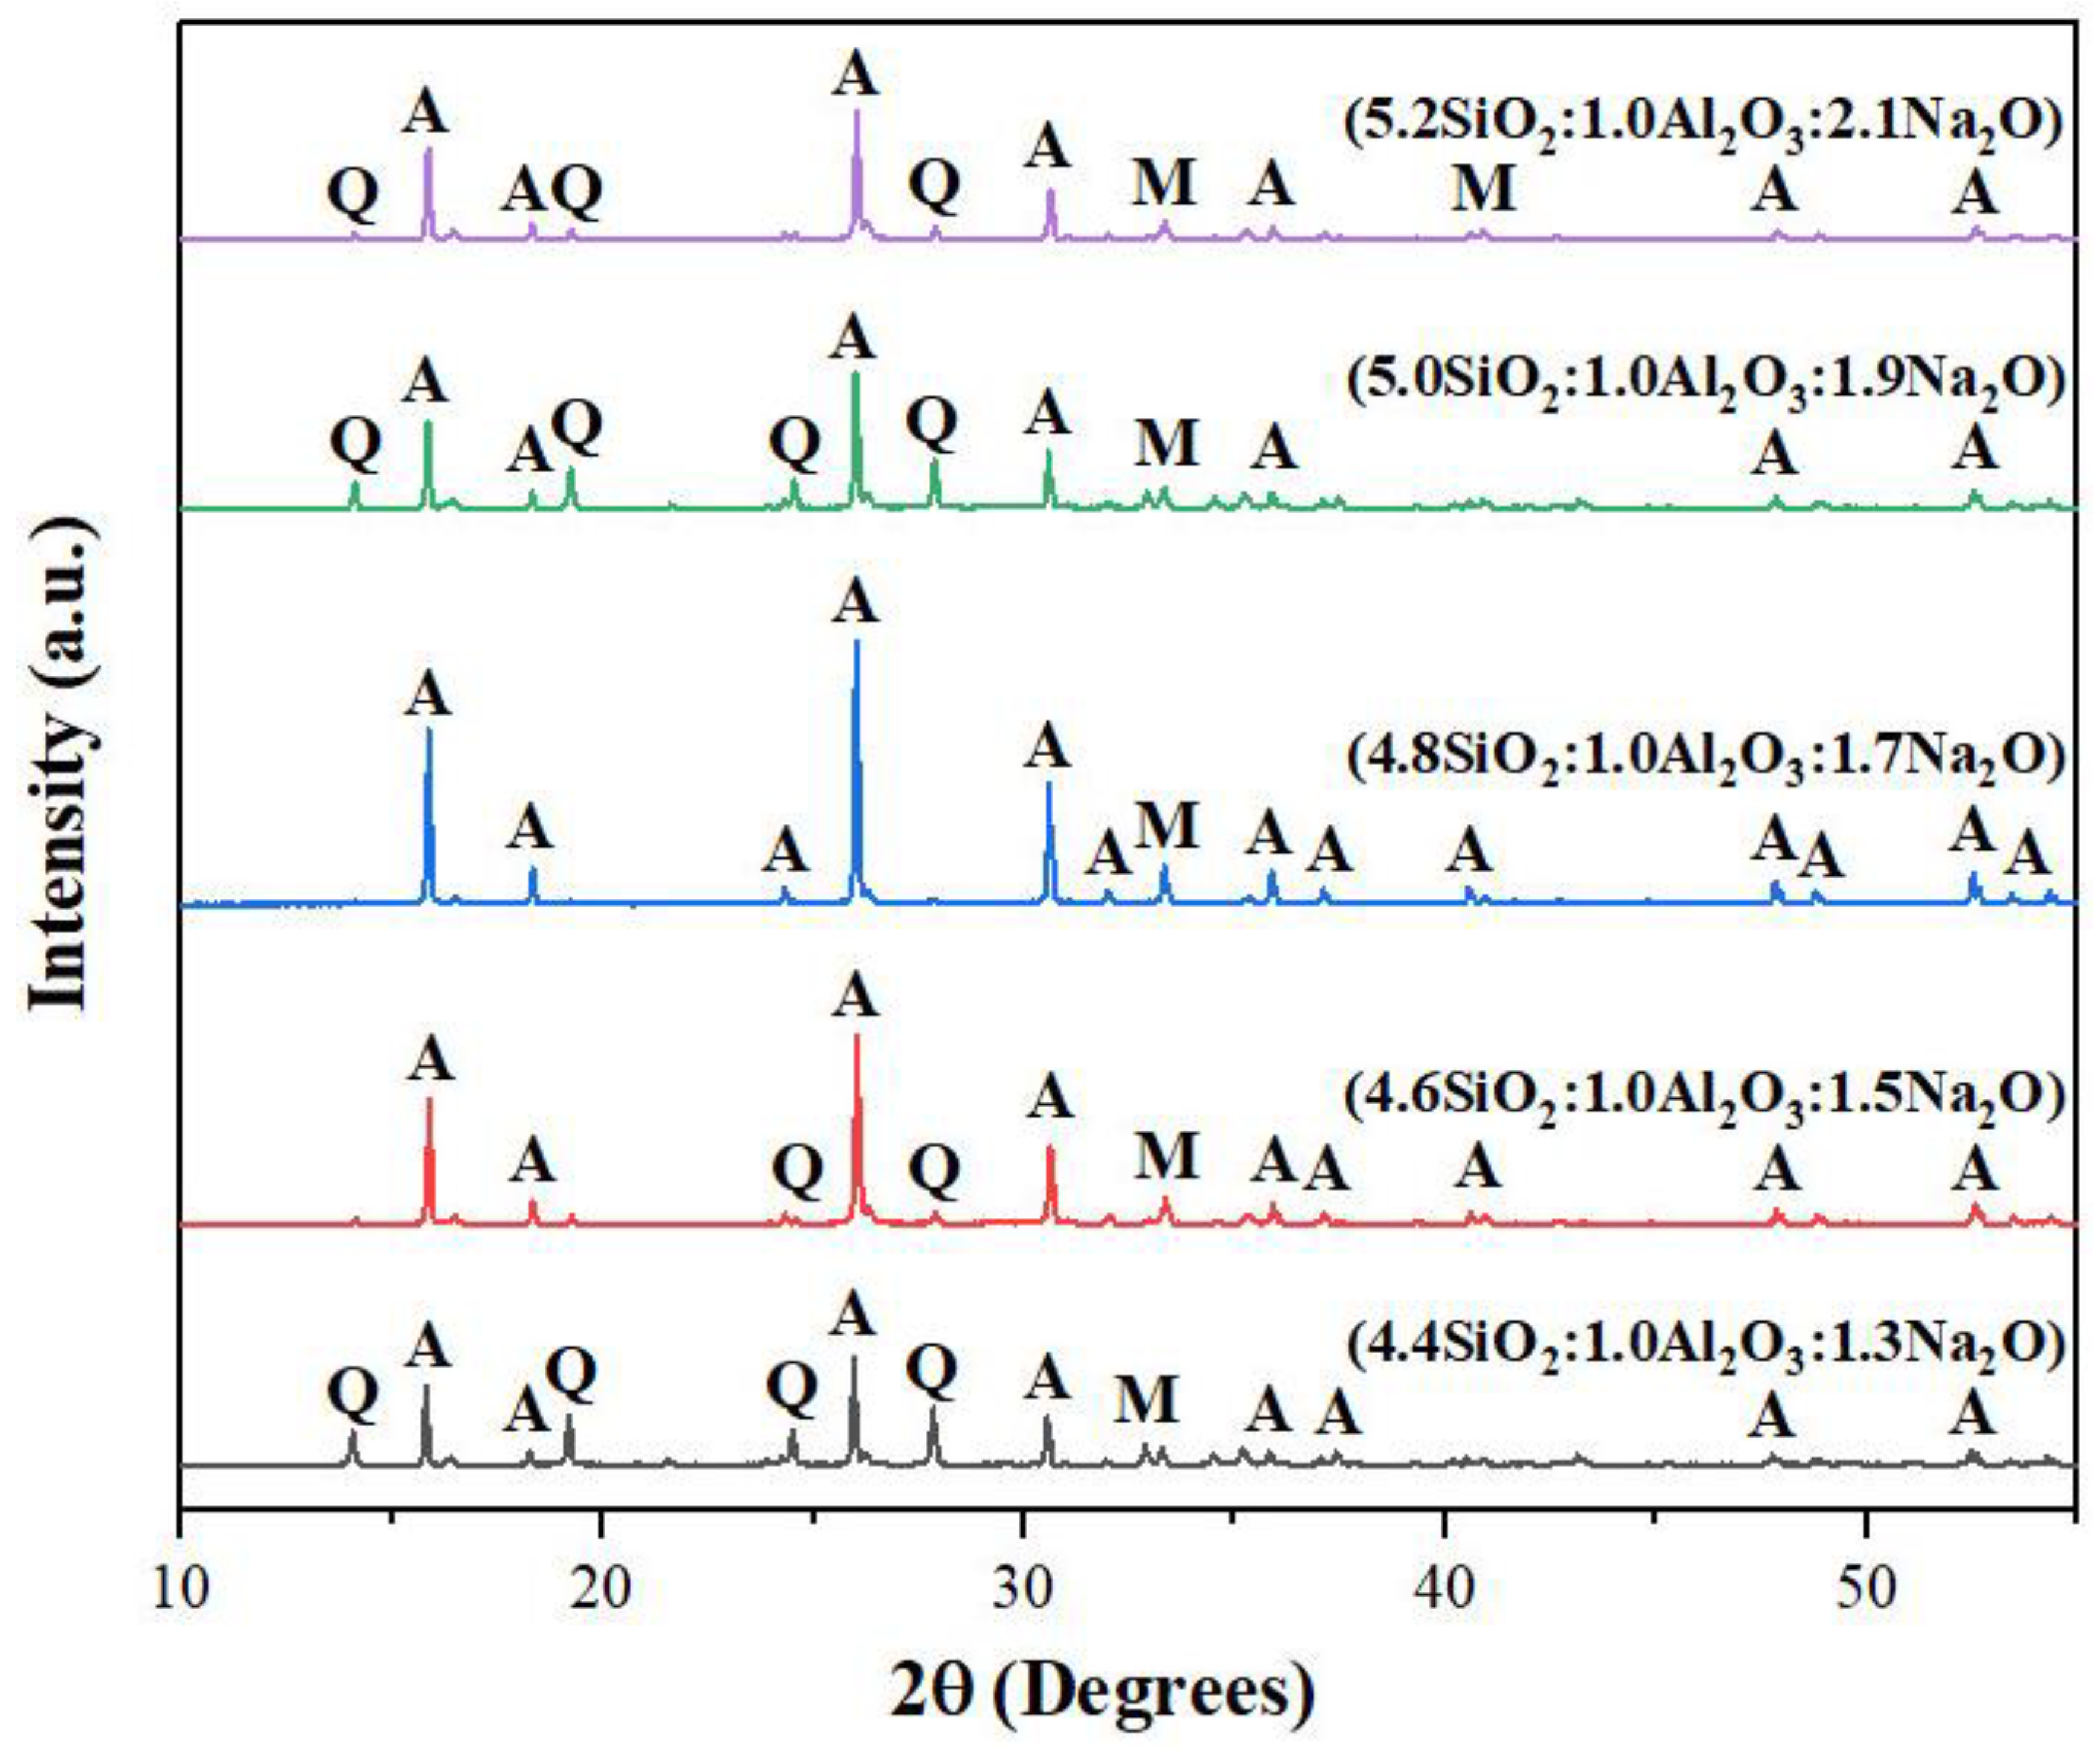
Figure 3.
XRD patterns of products synthesized at different temperatures from 100°C to 200°C with the molar ratio of SiO2:Al2O3:Na2O = 4.8:1.0:1.7 for 72 hours. A- Analcime, M - Mullite, Q - Quartz.
Figure 3.
XRD patterns of products synthesized at different temperatures from 100°C to 200°C with the molar ratio of SiO2:Al2O3:Na2O = 4.8:1.0:1.7 for 72 hours. A- Analcime, M - Mullite, Q - Quartz.
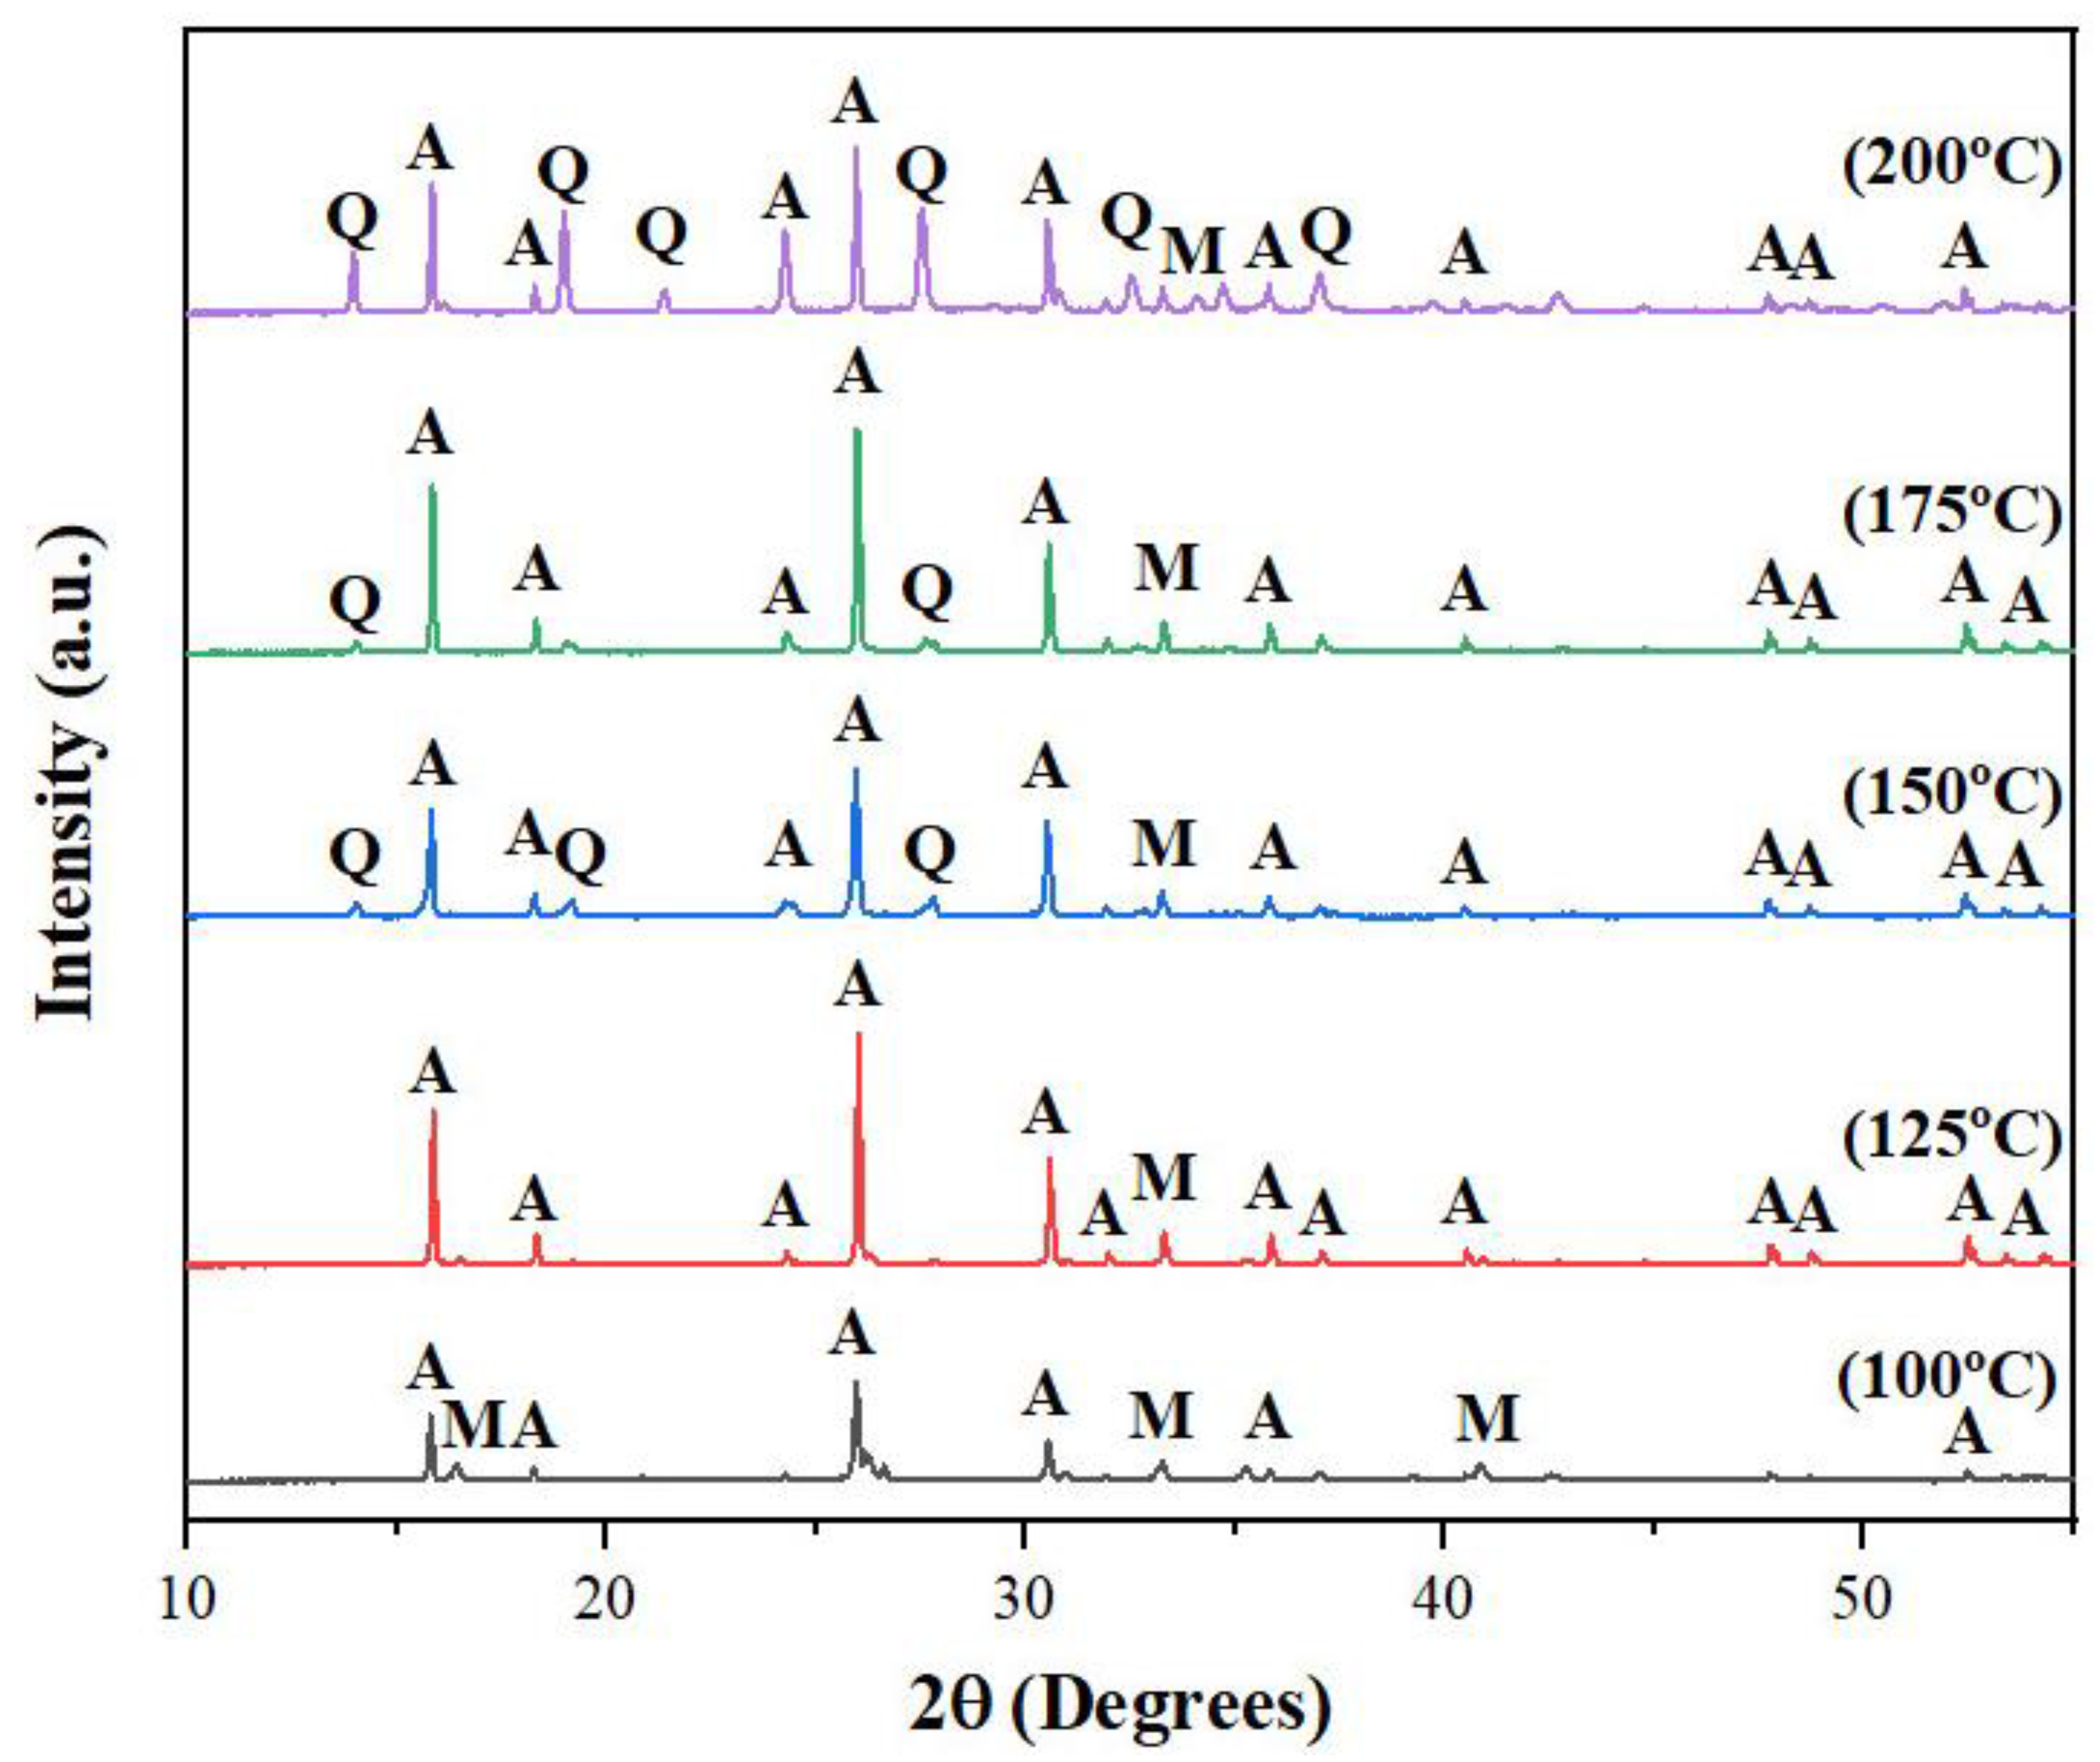
Figure 4.
XRD patterns of products synthesized for different times from 24 to 96 hours at 125oC with the molar ratio of SiO2:Al2O3:Na2O = 4.8:1.0:1.7. A- Analcime, M - Mullite, Q - Quartz.
Figure 4.
XRD patterns of products synthesized for different times from 24 to 96 hours at 125oC with the molar ratio of SiO2:Al2O3:Na2O = 4.8:1.0:1.7. A- Analcime, M - Mullite, Q - Quartz.
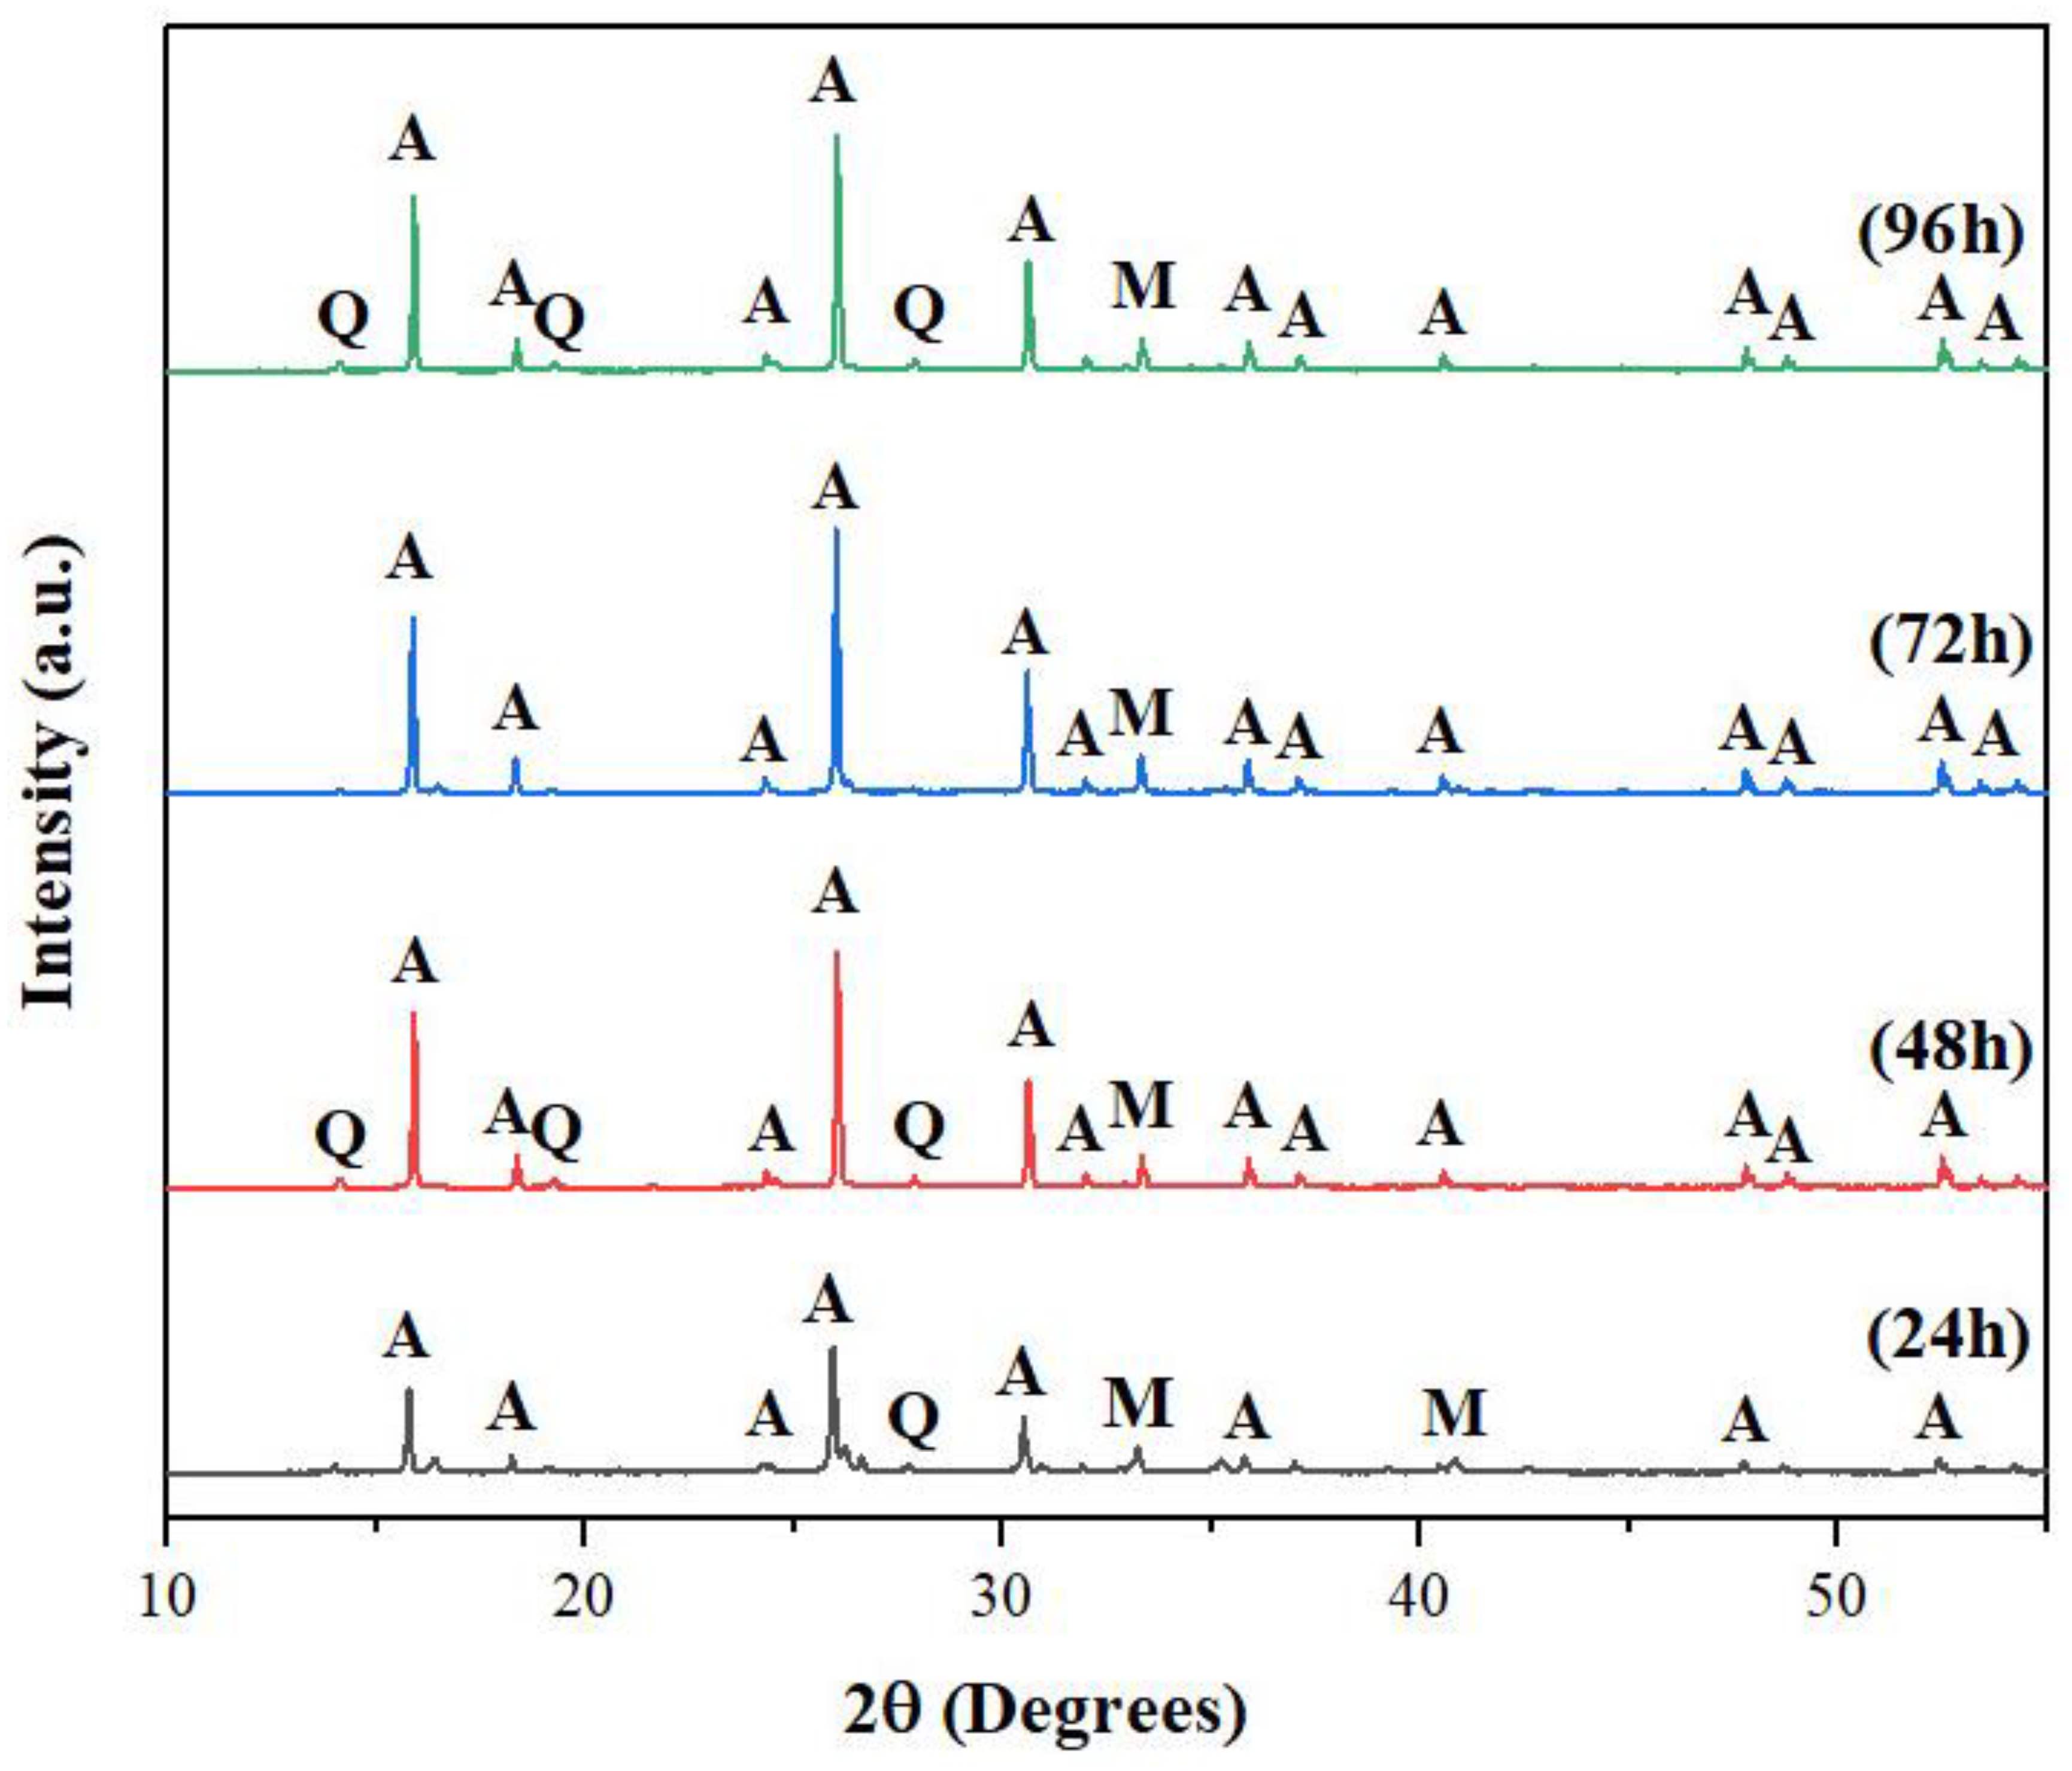
Figure 5.
XRD patterns of calcined FA and analcime zeolite synthesized at 125oC for 72 hours with the molar ratio of 4.8SiO2:1.0Al2O3:1.7Na2O. A- Analcime, M - Mullite, Q - Quartz.
Figure 5.
XRD patterns of calcined FA and analcime zeolite synthesized at 125oC for 72 hours with the molar ratio of 4.8SiO2:1.0Al2O3:1.7Na2O. A- Analcime, M - Mullite, Q - Quartz.
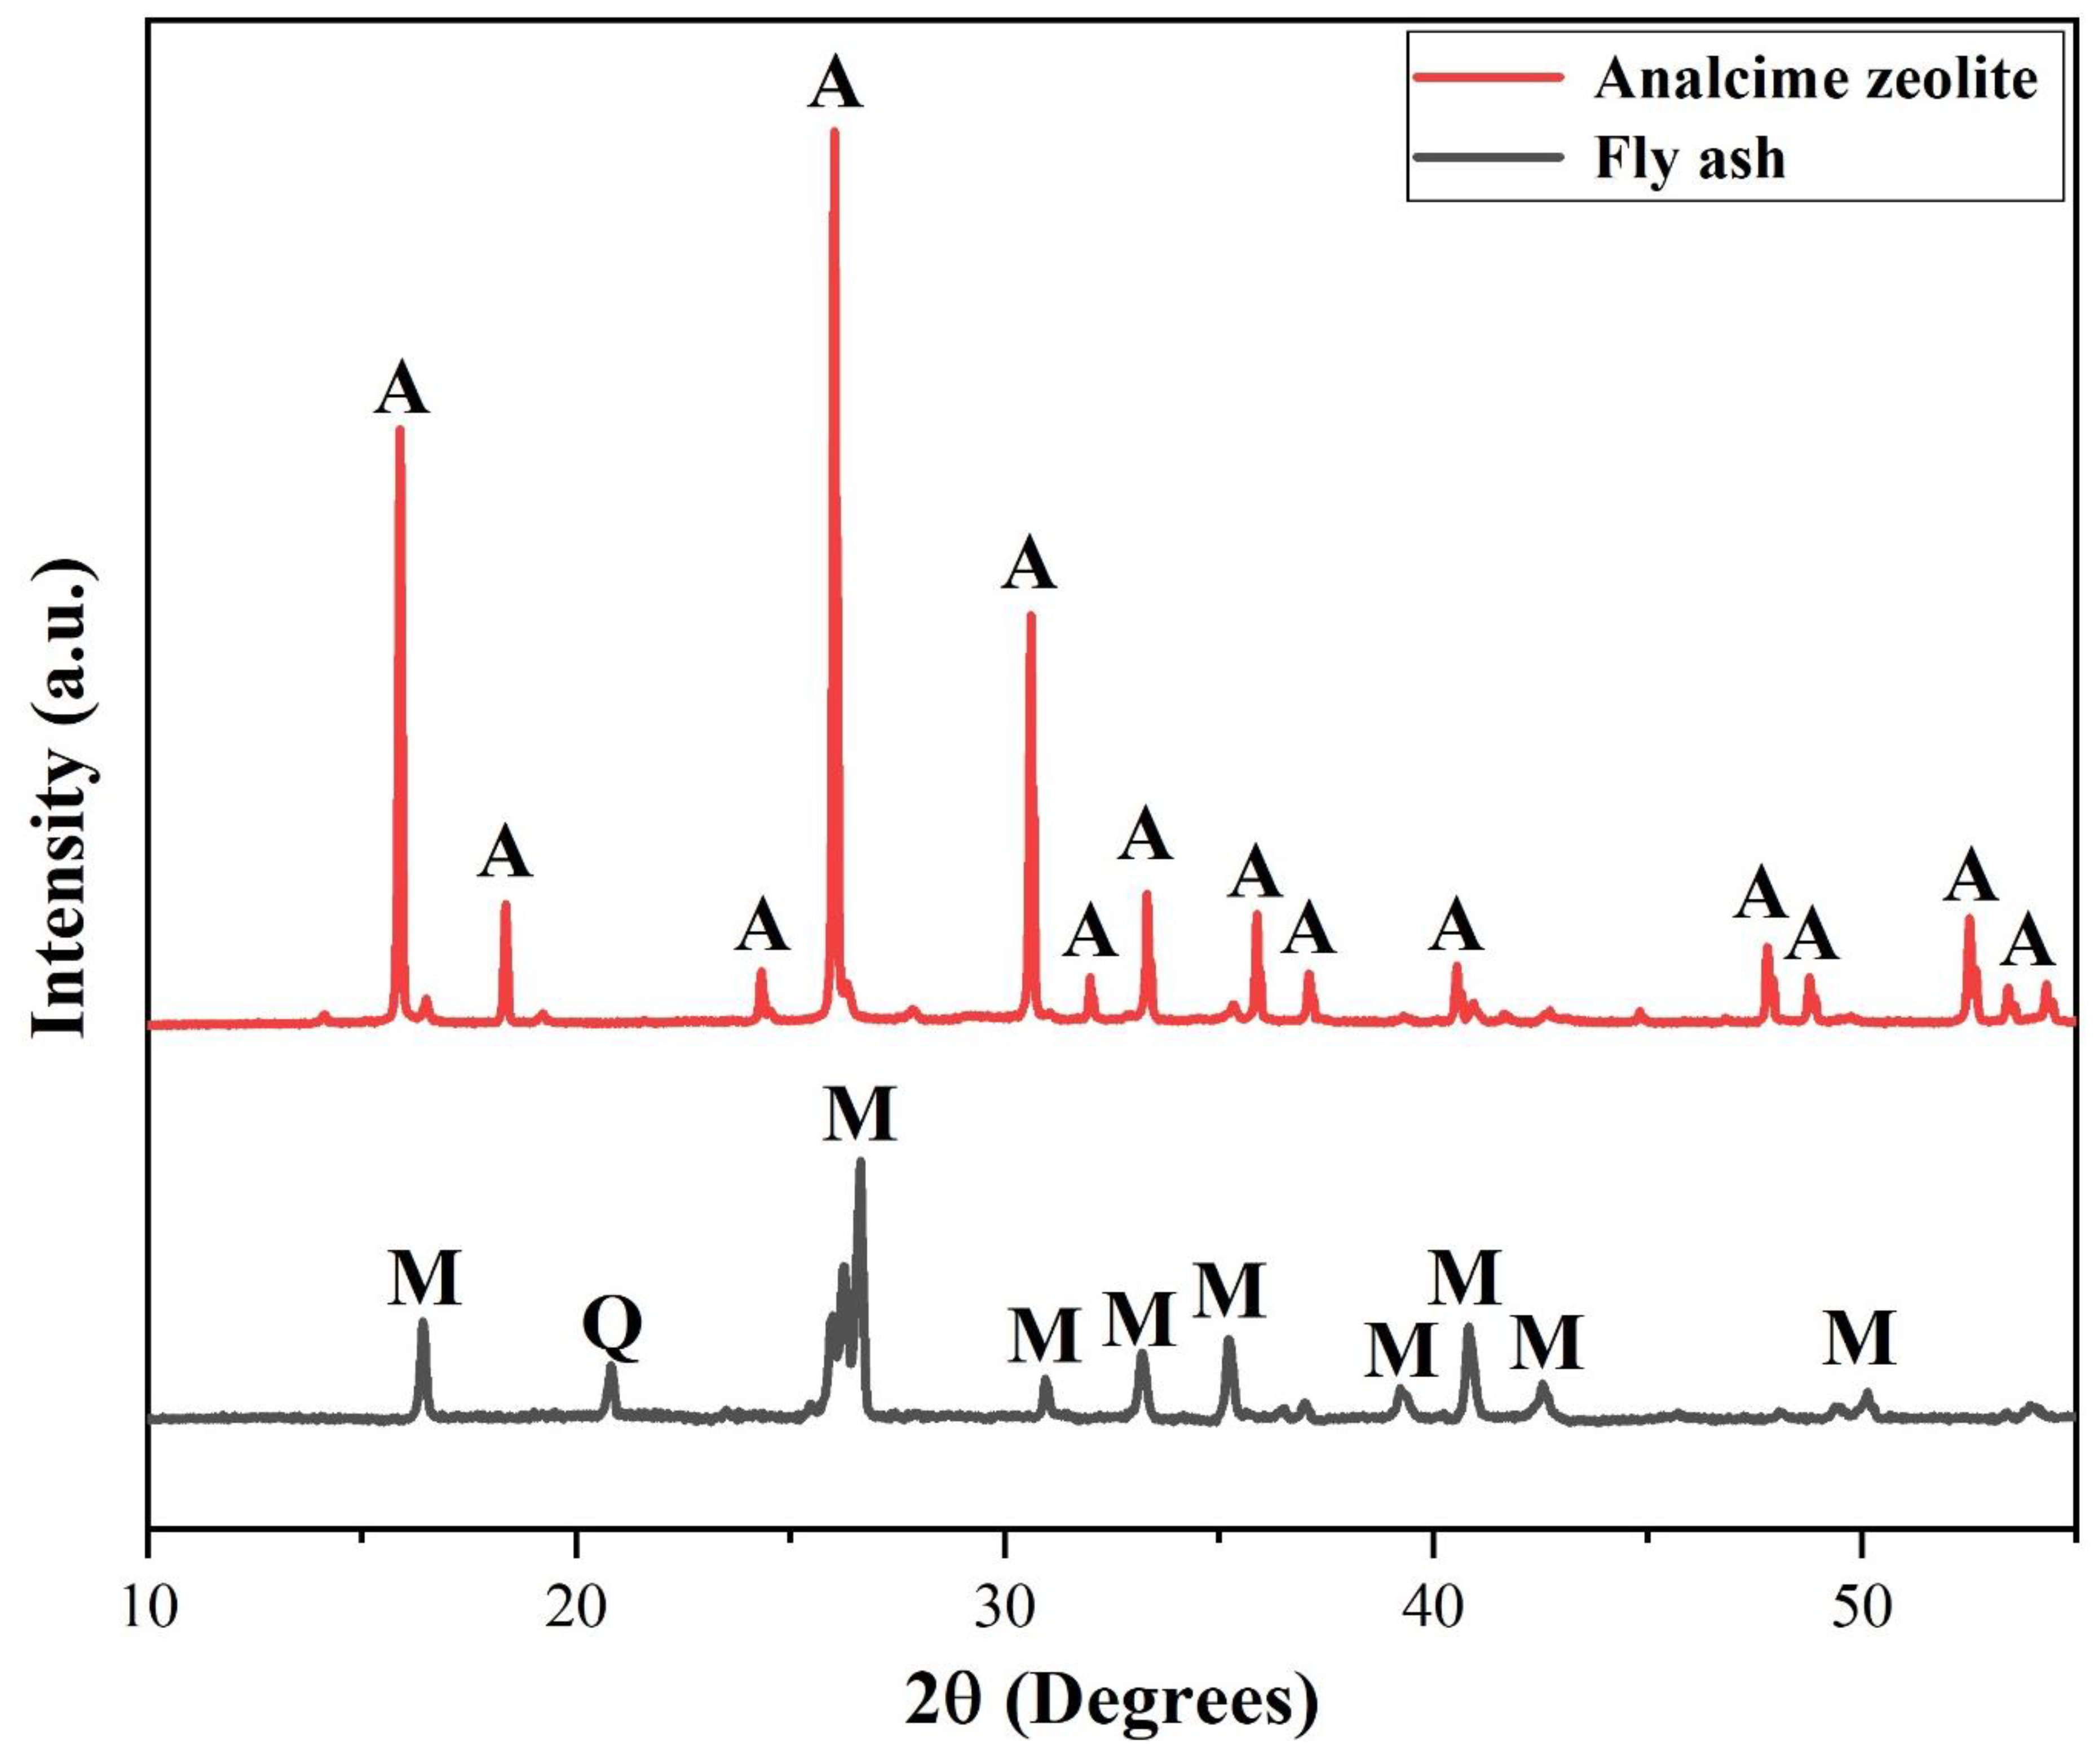
Figure 6.
SEM images of analcime zeolite synthesized under optimum condition taken at (a) lower magnification and (b) higher magnification. (c) Histogram showing size distribution of analcime zeolite particles estimated by ImageJ software. (d) EDX spectrum of (b). The red mark on (b) was the location where EDX data were recorded.
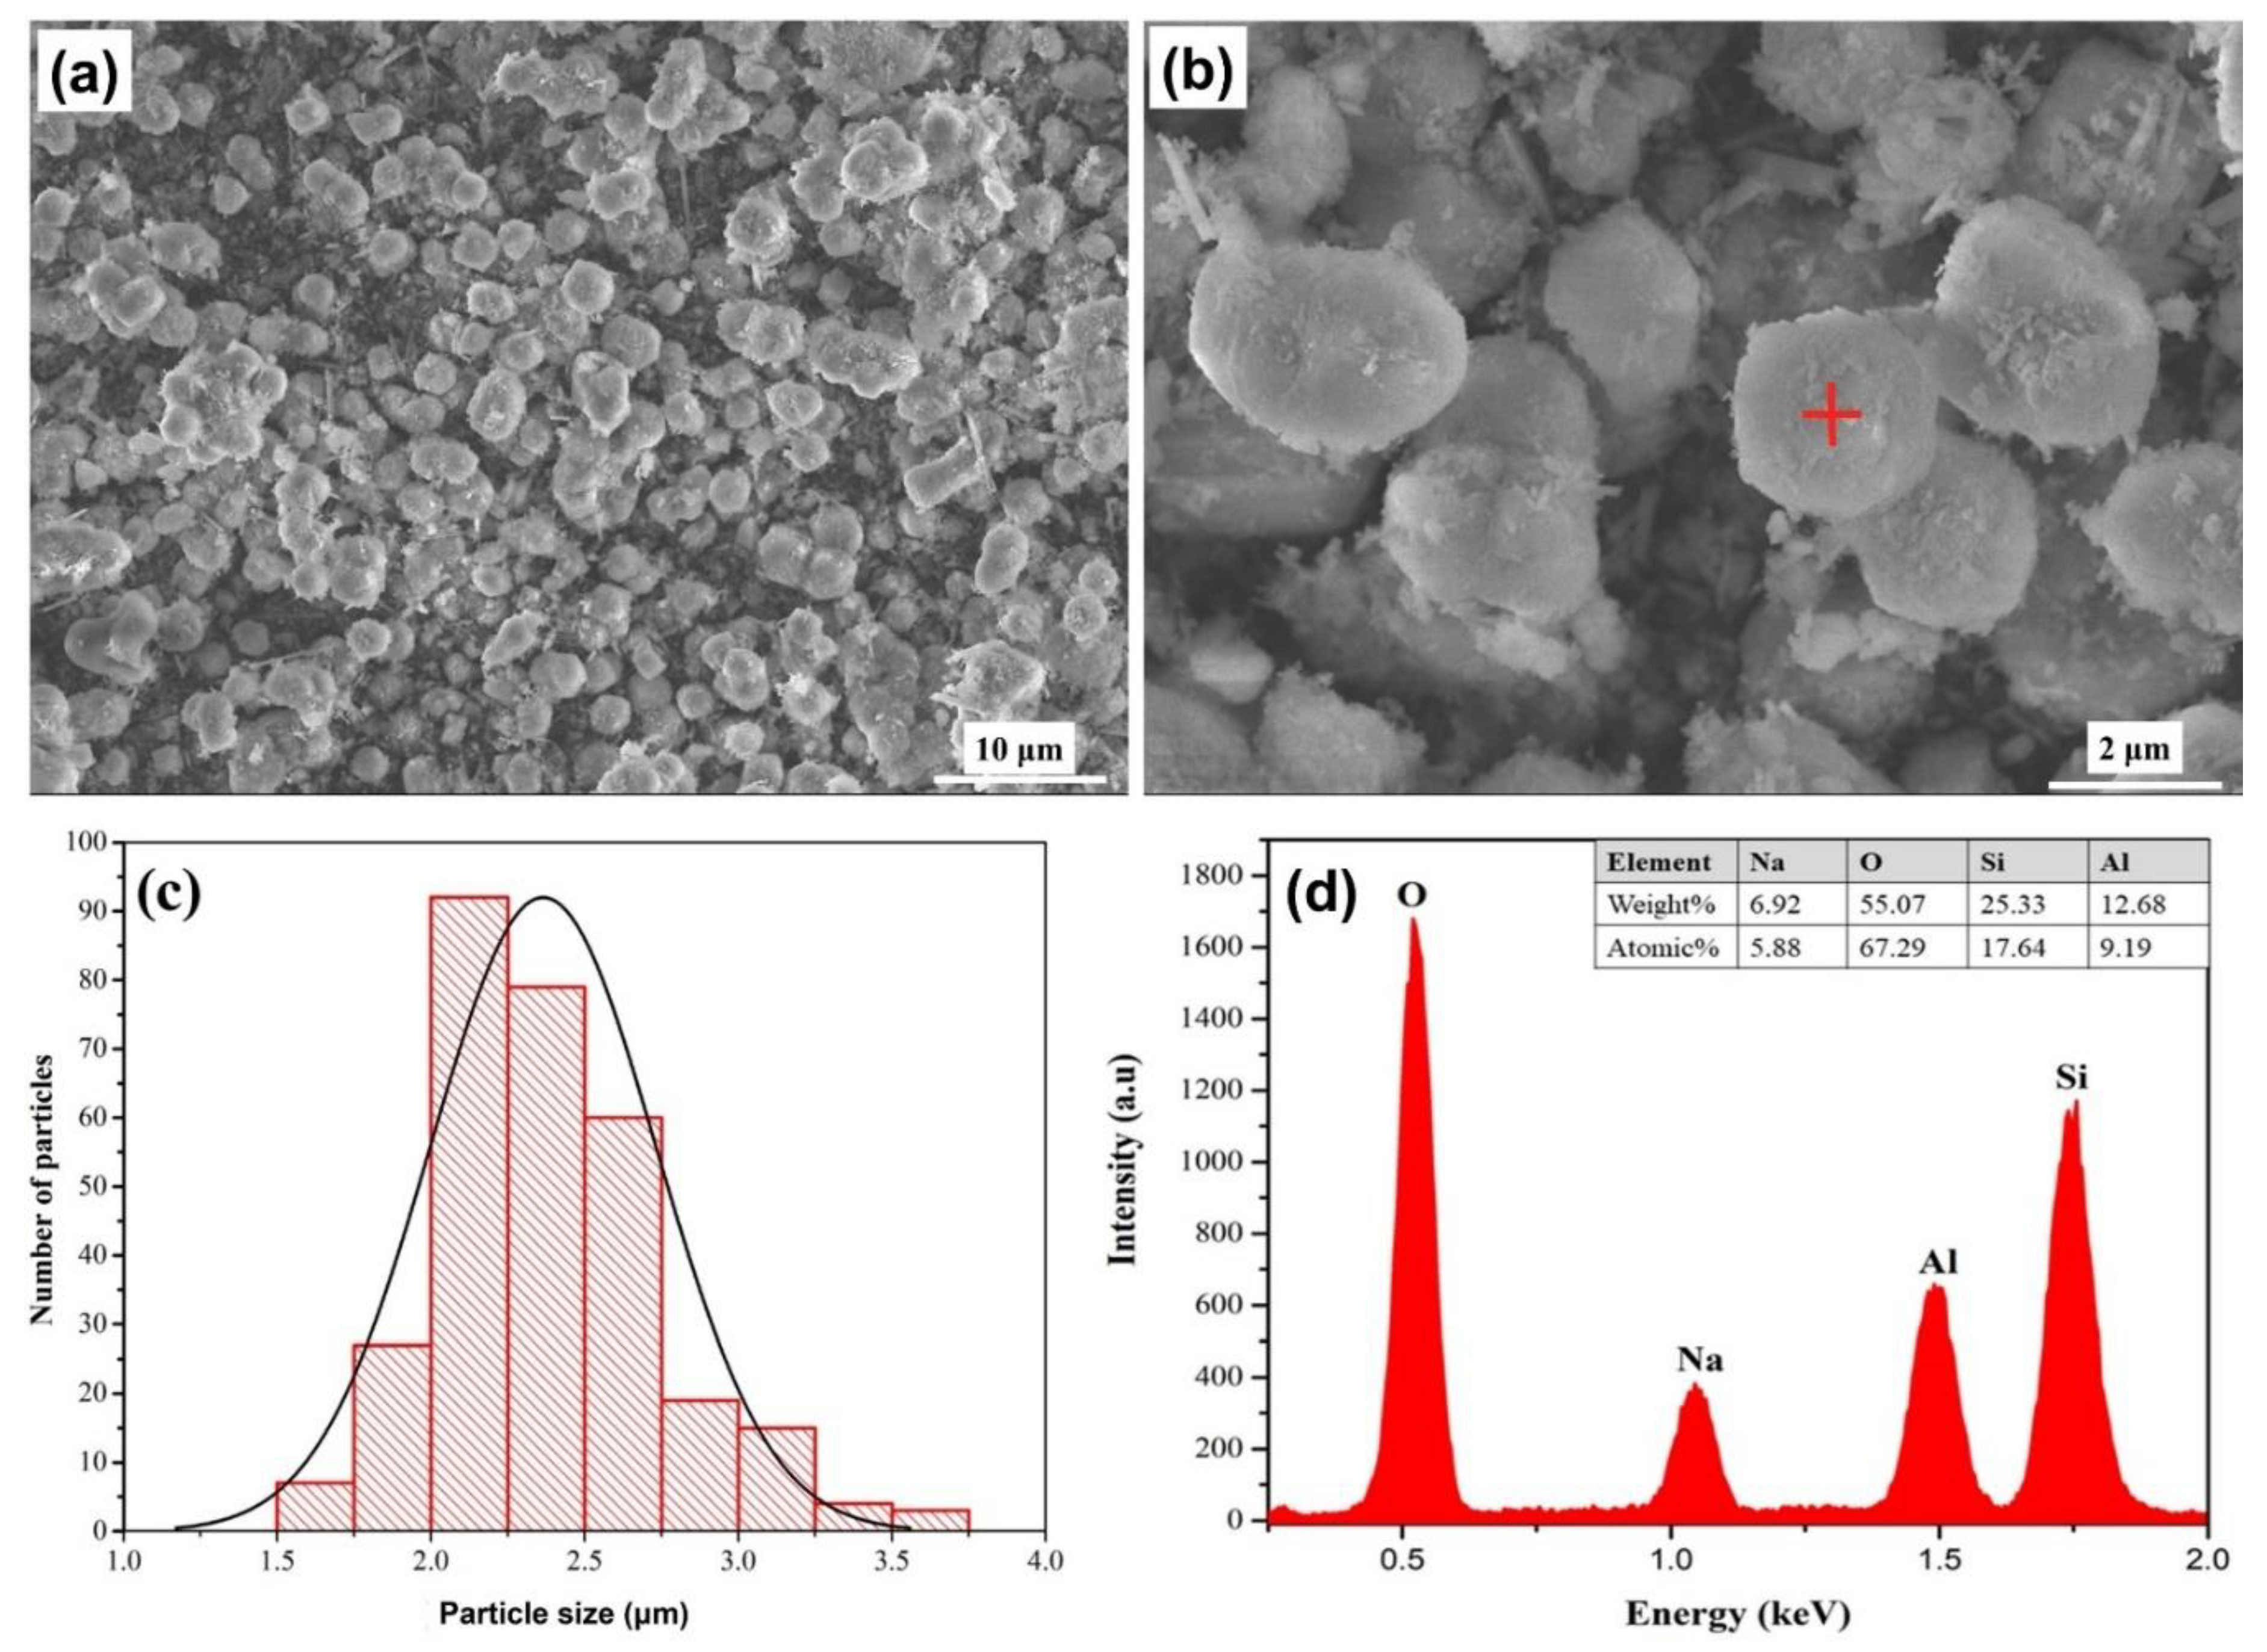
Figure 7.
SEM images of (a) calcined fly ash, (b) synthesized product at 100oC for 72h with the molar ratio of SiO2:Al2O3:Na2O = 4.8:1.0:1.7, (c) synthesized product at 125oC for 72h with the molar ratio of SiO2:Al2O3:Na2O = 5.2:1.0:2.1, and (d) synthesized product at 125oC for 24h with the molar ratio of SiO2:Al2O3:Na2O = 4.8:1.0:1.7.
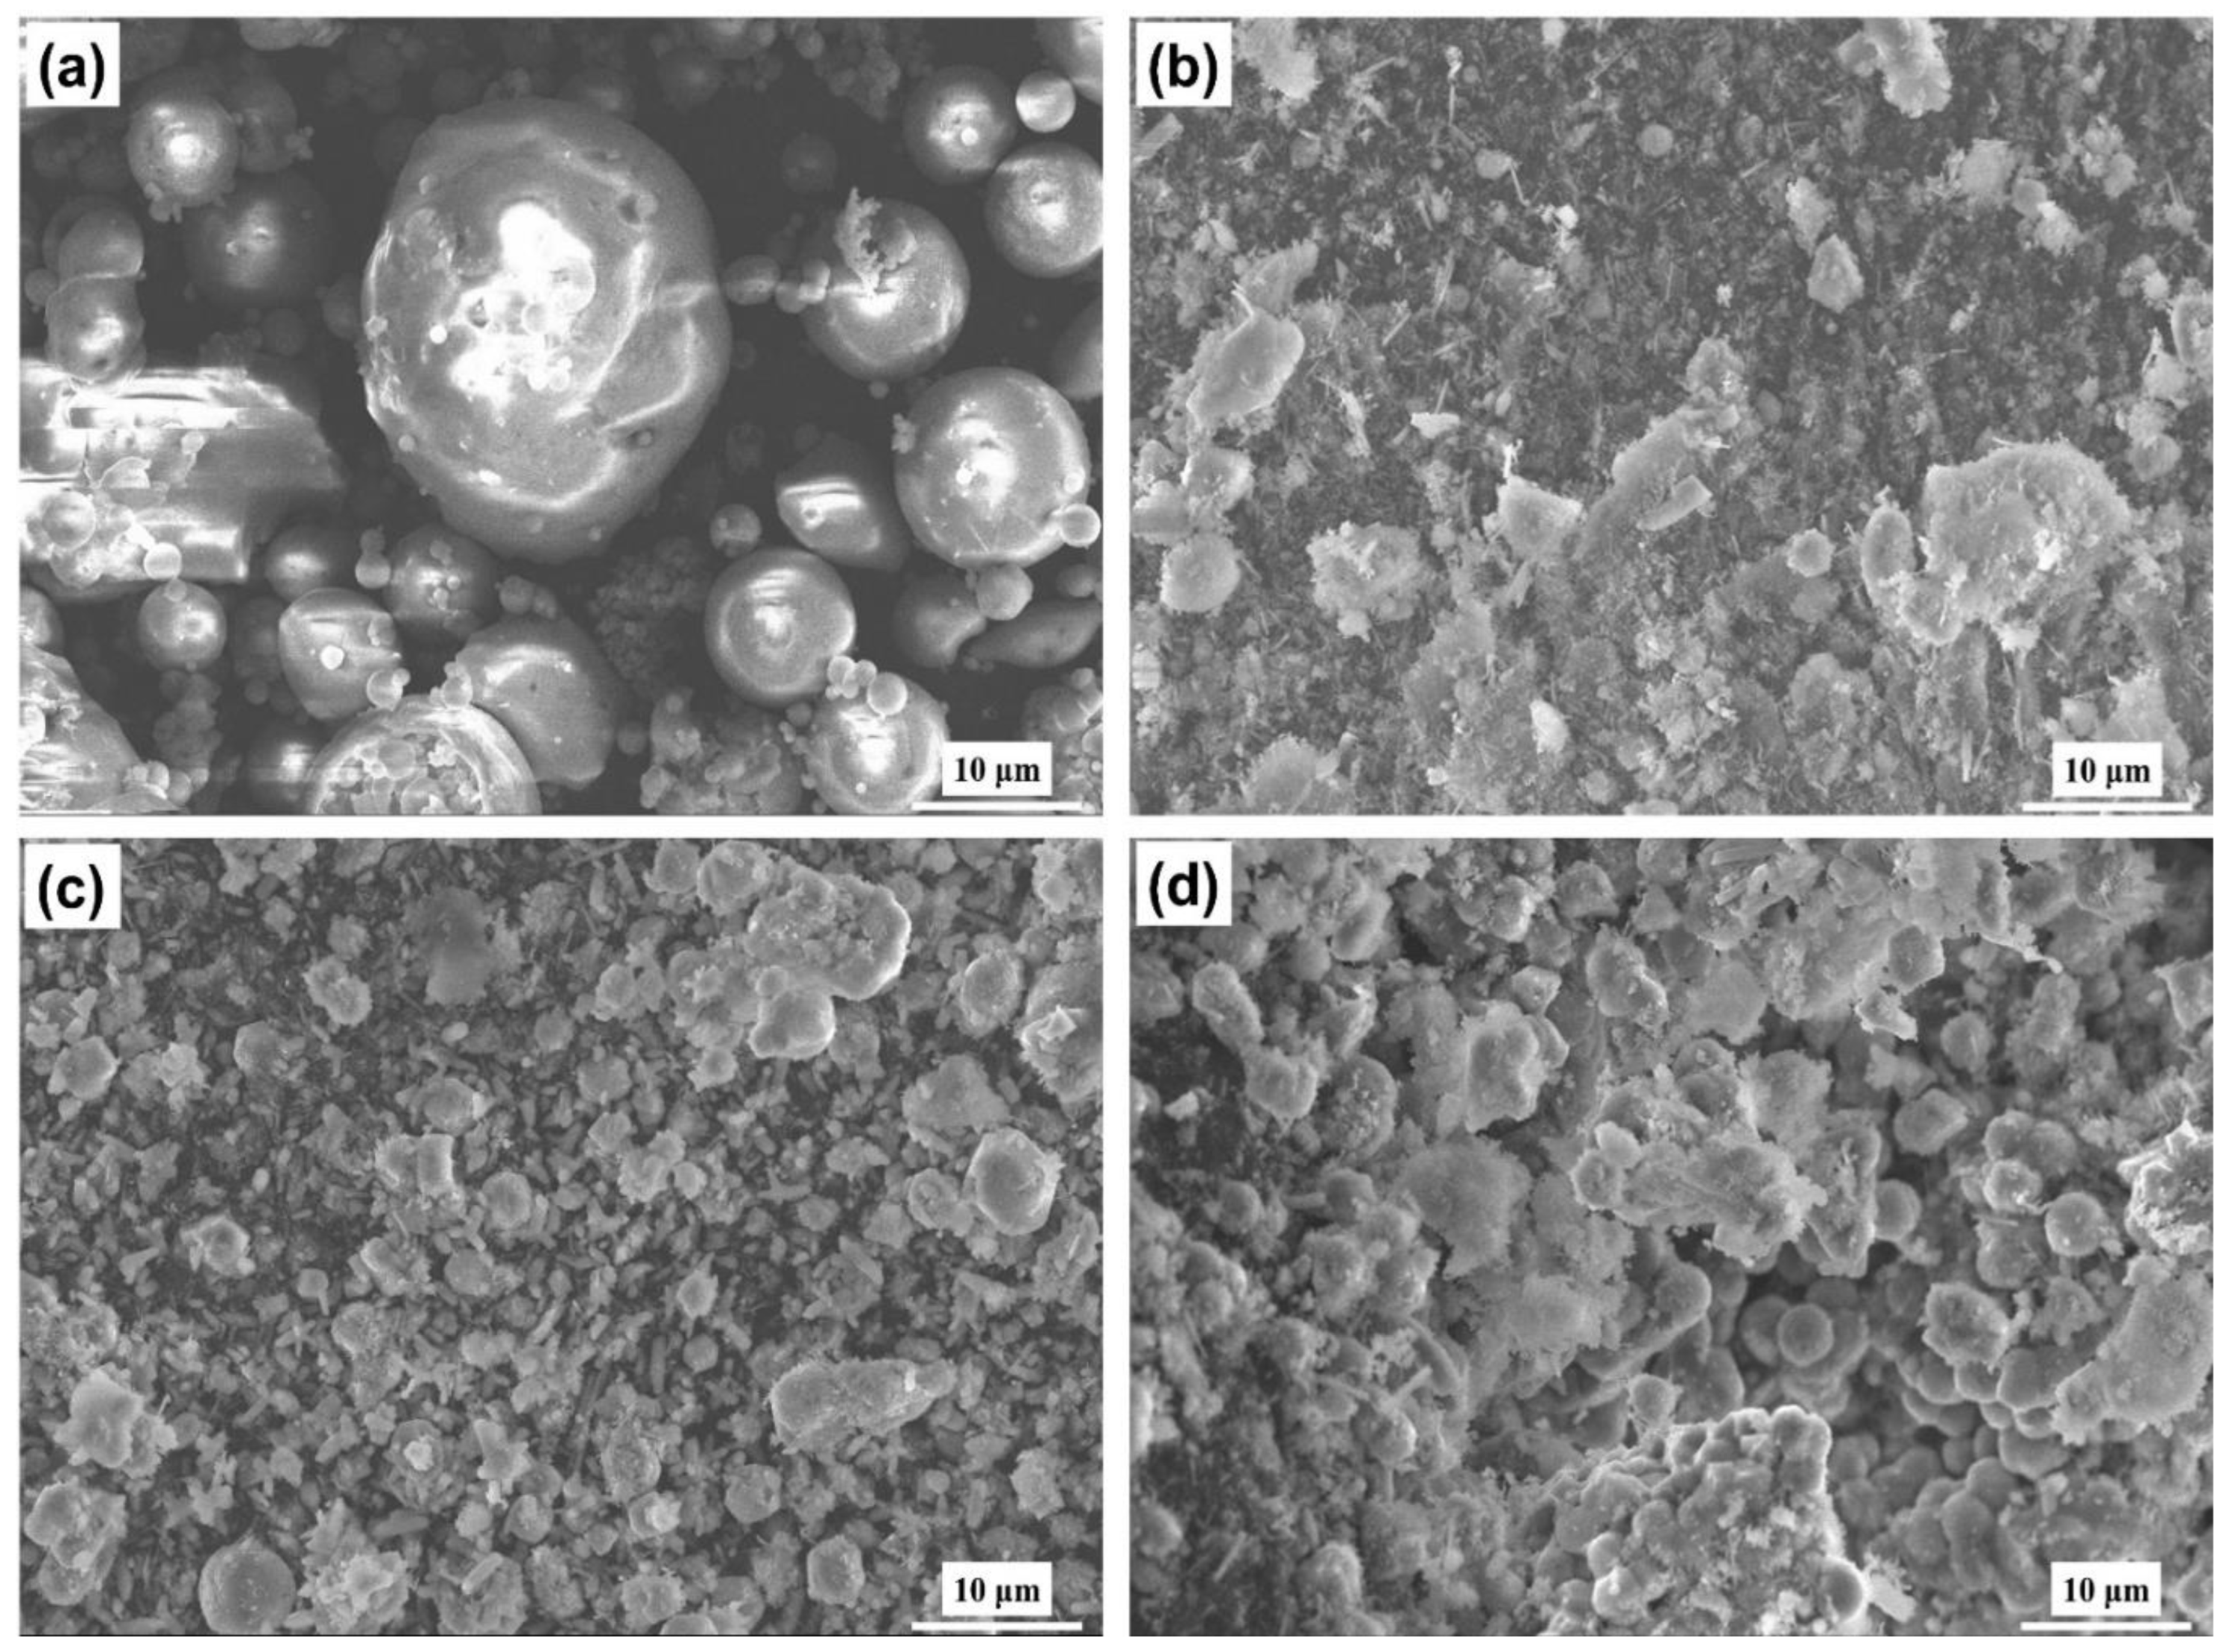
Figure 8.
FTIR spectra of fly ash and analcime zeolite.
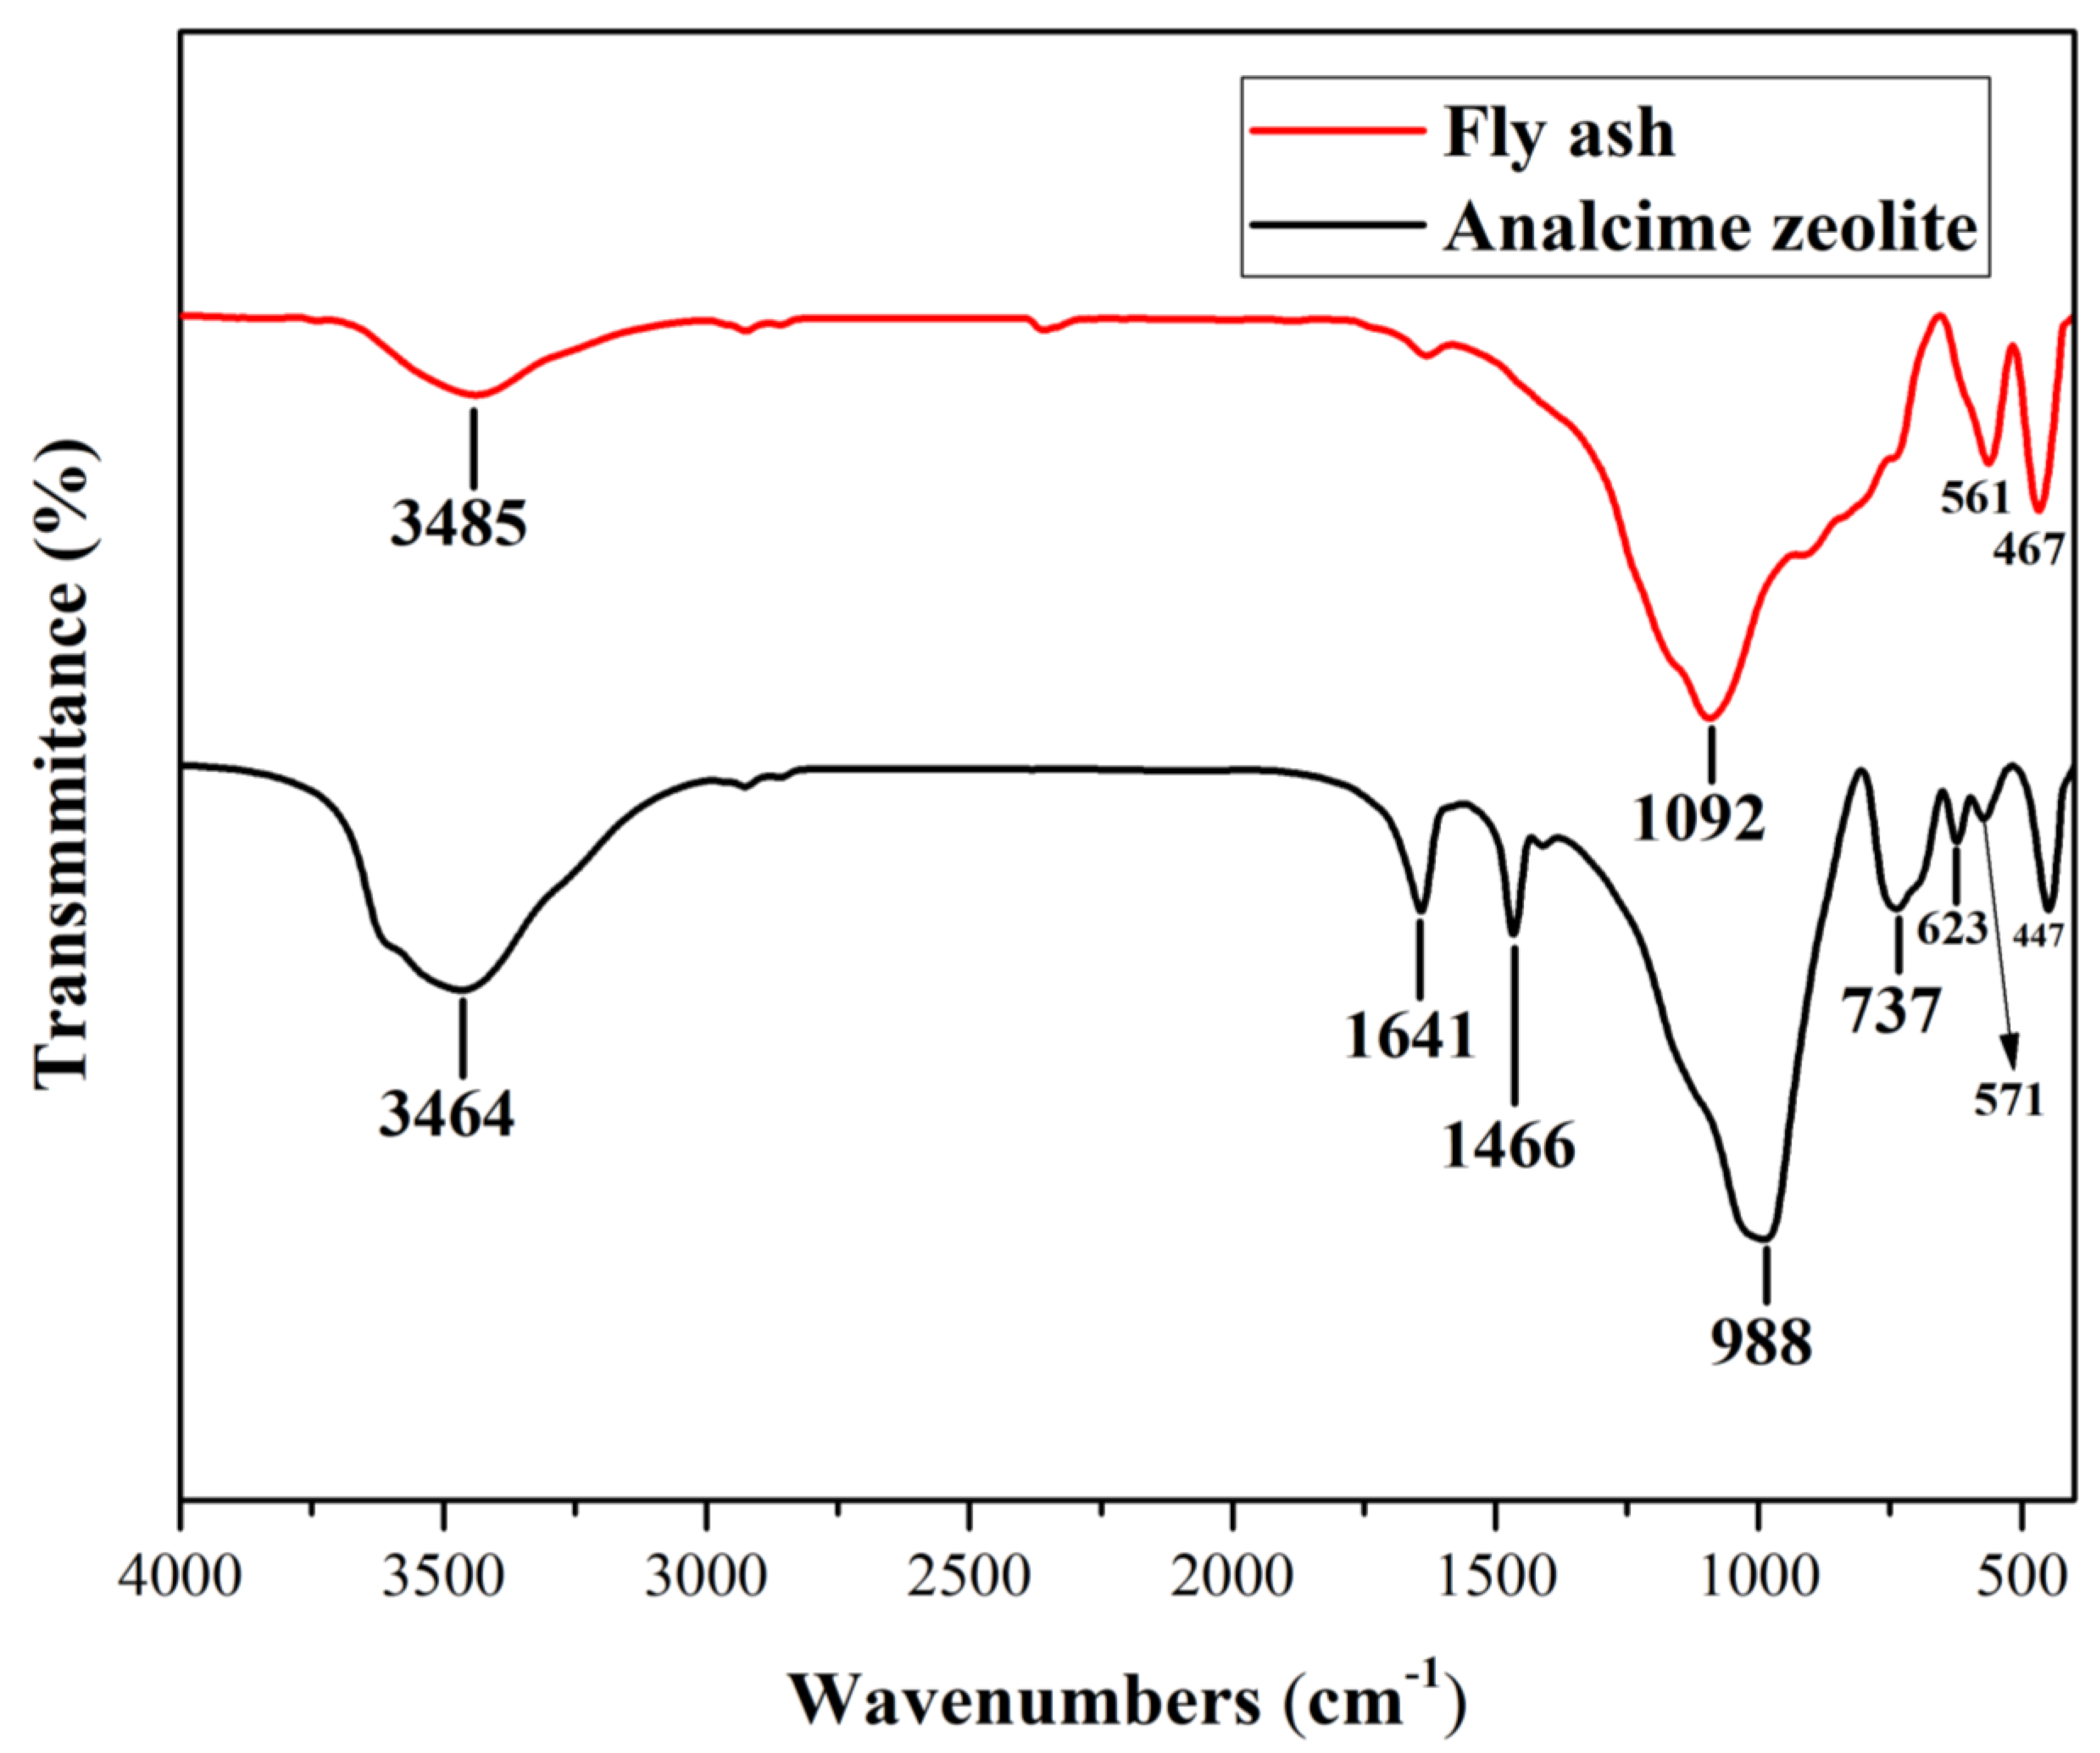
Figure 10.
Effect of adsorption time on the percentage removal and adsorption capacity of Pb2+ (a,b) and Cu2+ (c,d).
Figure 10.
Effect of adsorption time on the percentage removal and adsorption capacity of Pb2+ (a,b) and Cu2+ (c,d).
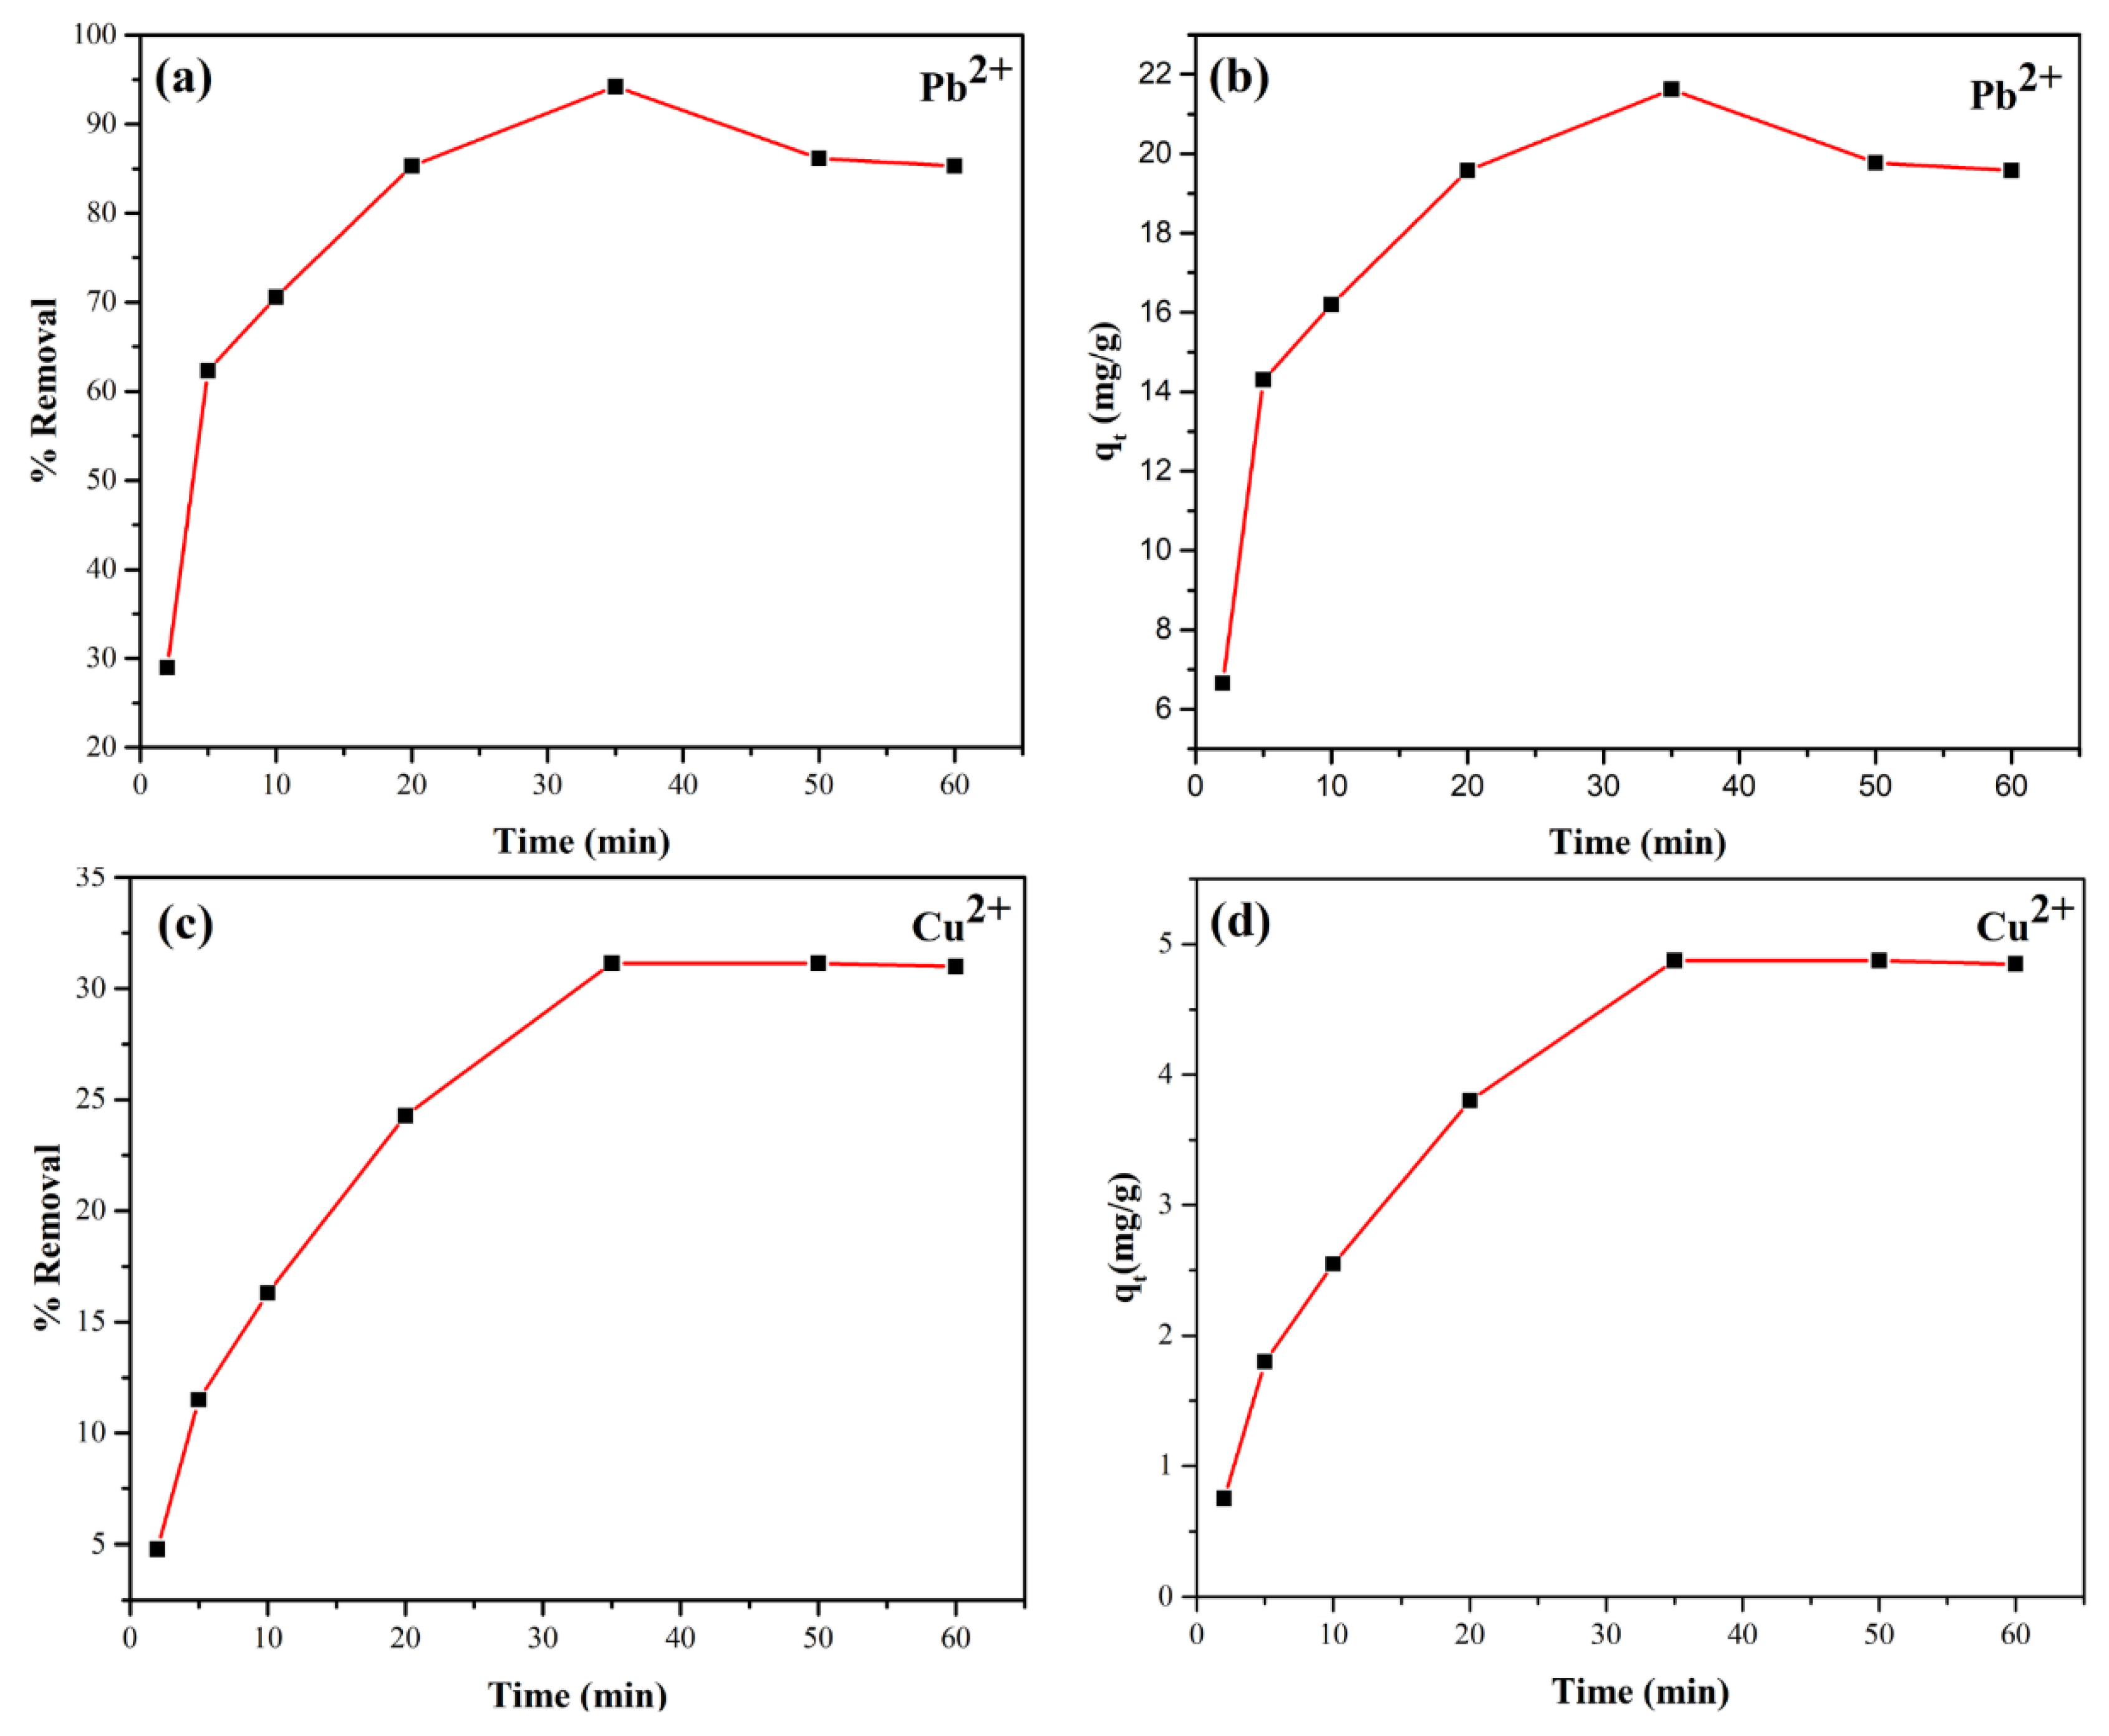
Figure 11.
Linear fitting of Pb2+ adsorption to pseudo-first-order model (a) and pseudo-second-order model (b).
Figure 11.
Linear fitting of Pb2+ adsorption to pseudo-first-order model (a) and pseudo-second-order model (b).
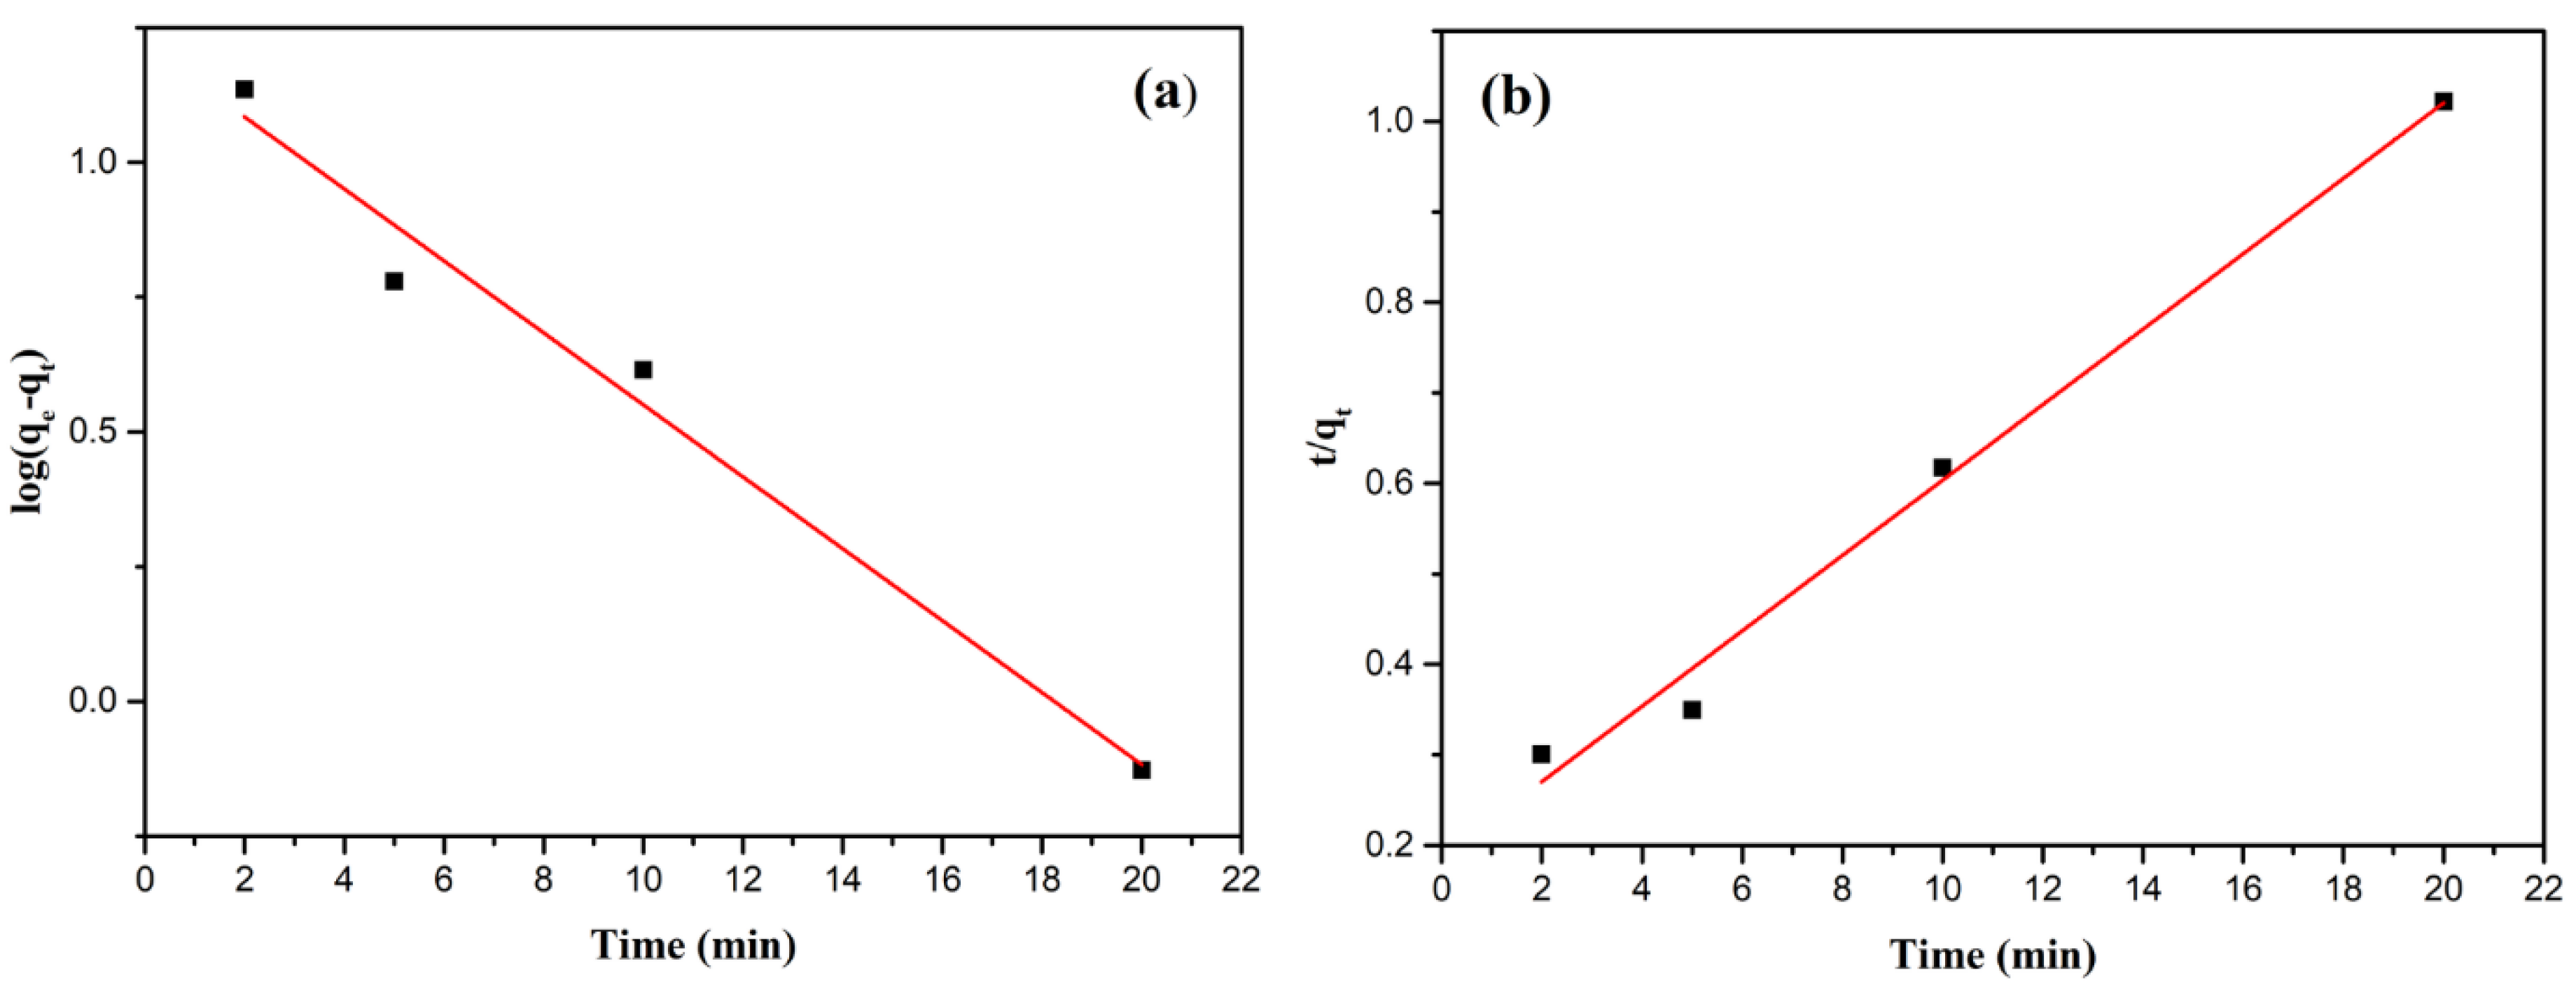
Figure 12.
Linear fitting of Cu2+ adsorption to pseudo-first-order model (a) and pseudo-second -order model (b).
Figure 12.
Linear fitting of Cu2+ adsorption to pseudo-first-order model (a) and pseudo-second -order model (b).
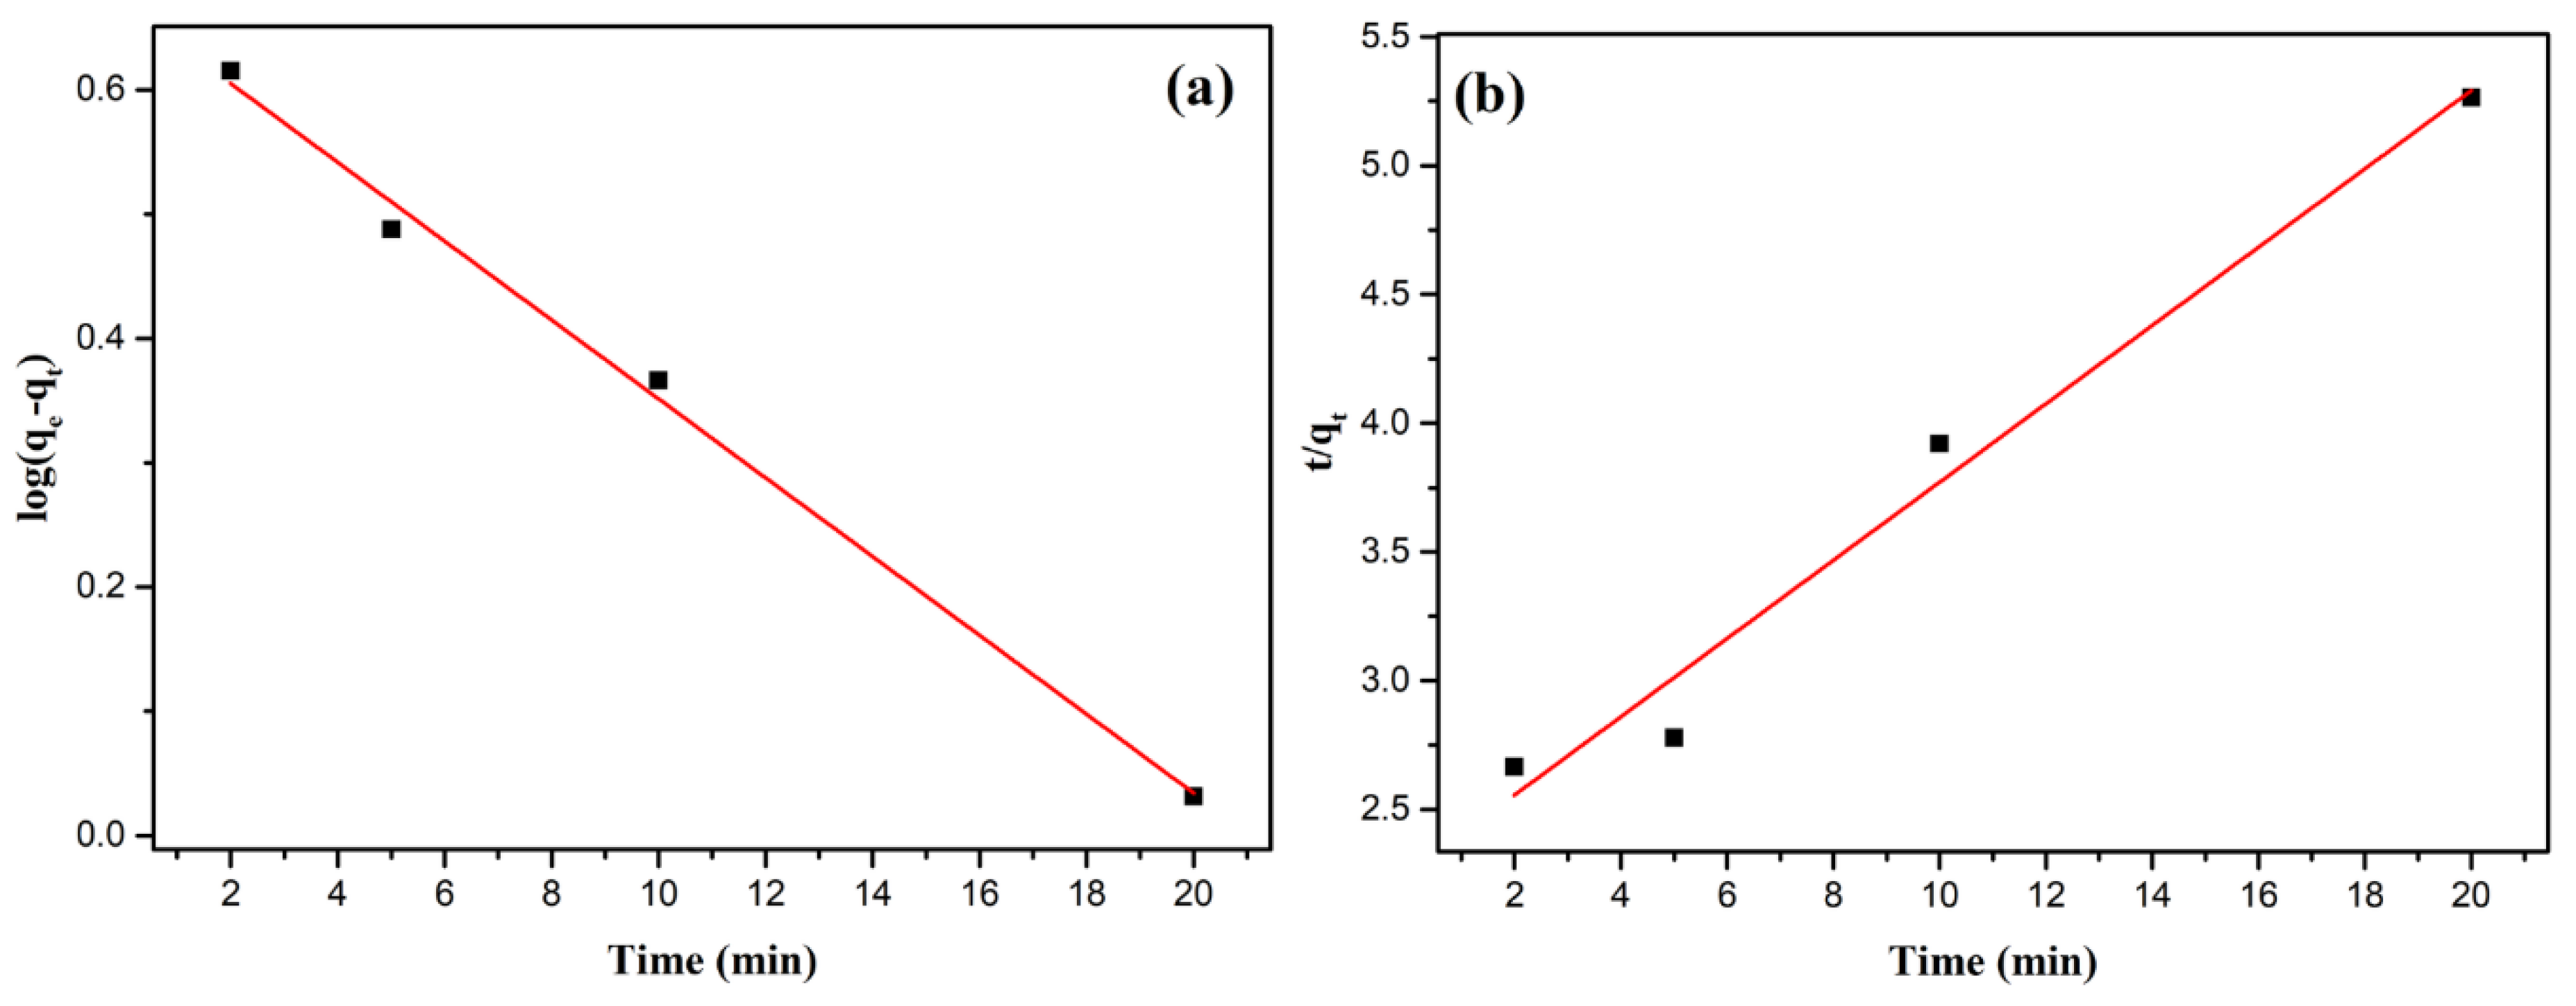
Figure 13.
Effect of Pb2+ initial concentration on the percentage removal (a), linear fitting to Langmuir model (b), and linear fitting to Freundlich model (c).
Figure 13.
Effect of Pb2+ initial concentration on the percentage removal (a), linear fitting to Langmuir model (b), and linear fitting to Freundlich model (c).
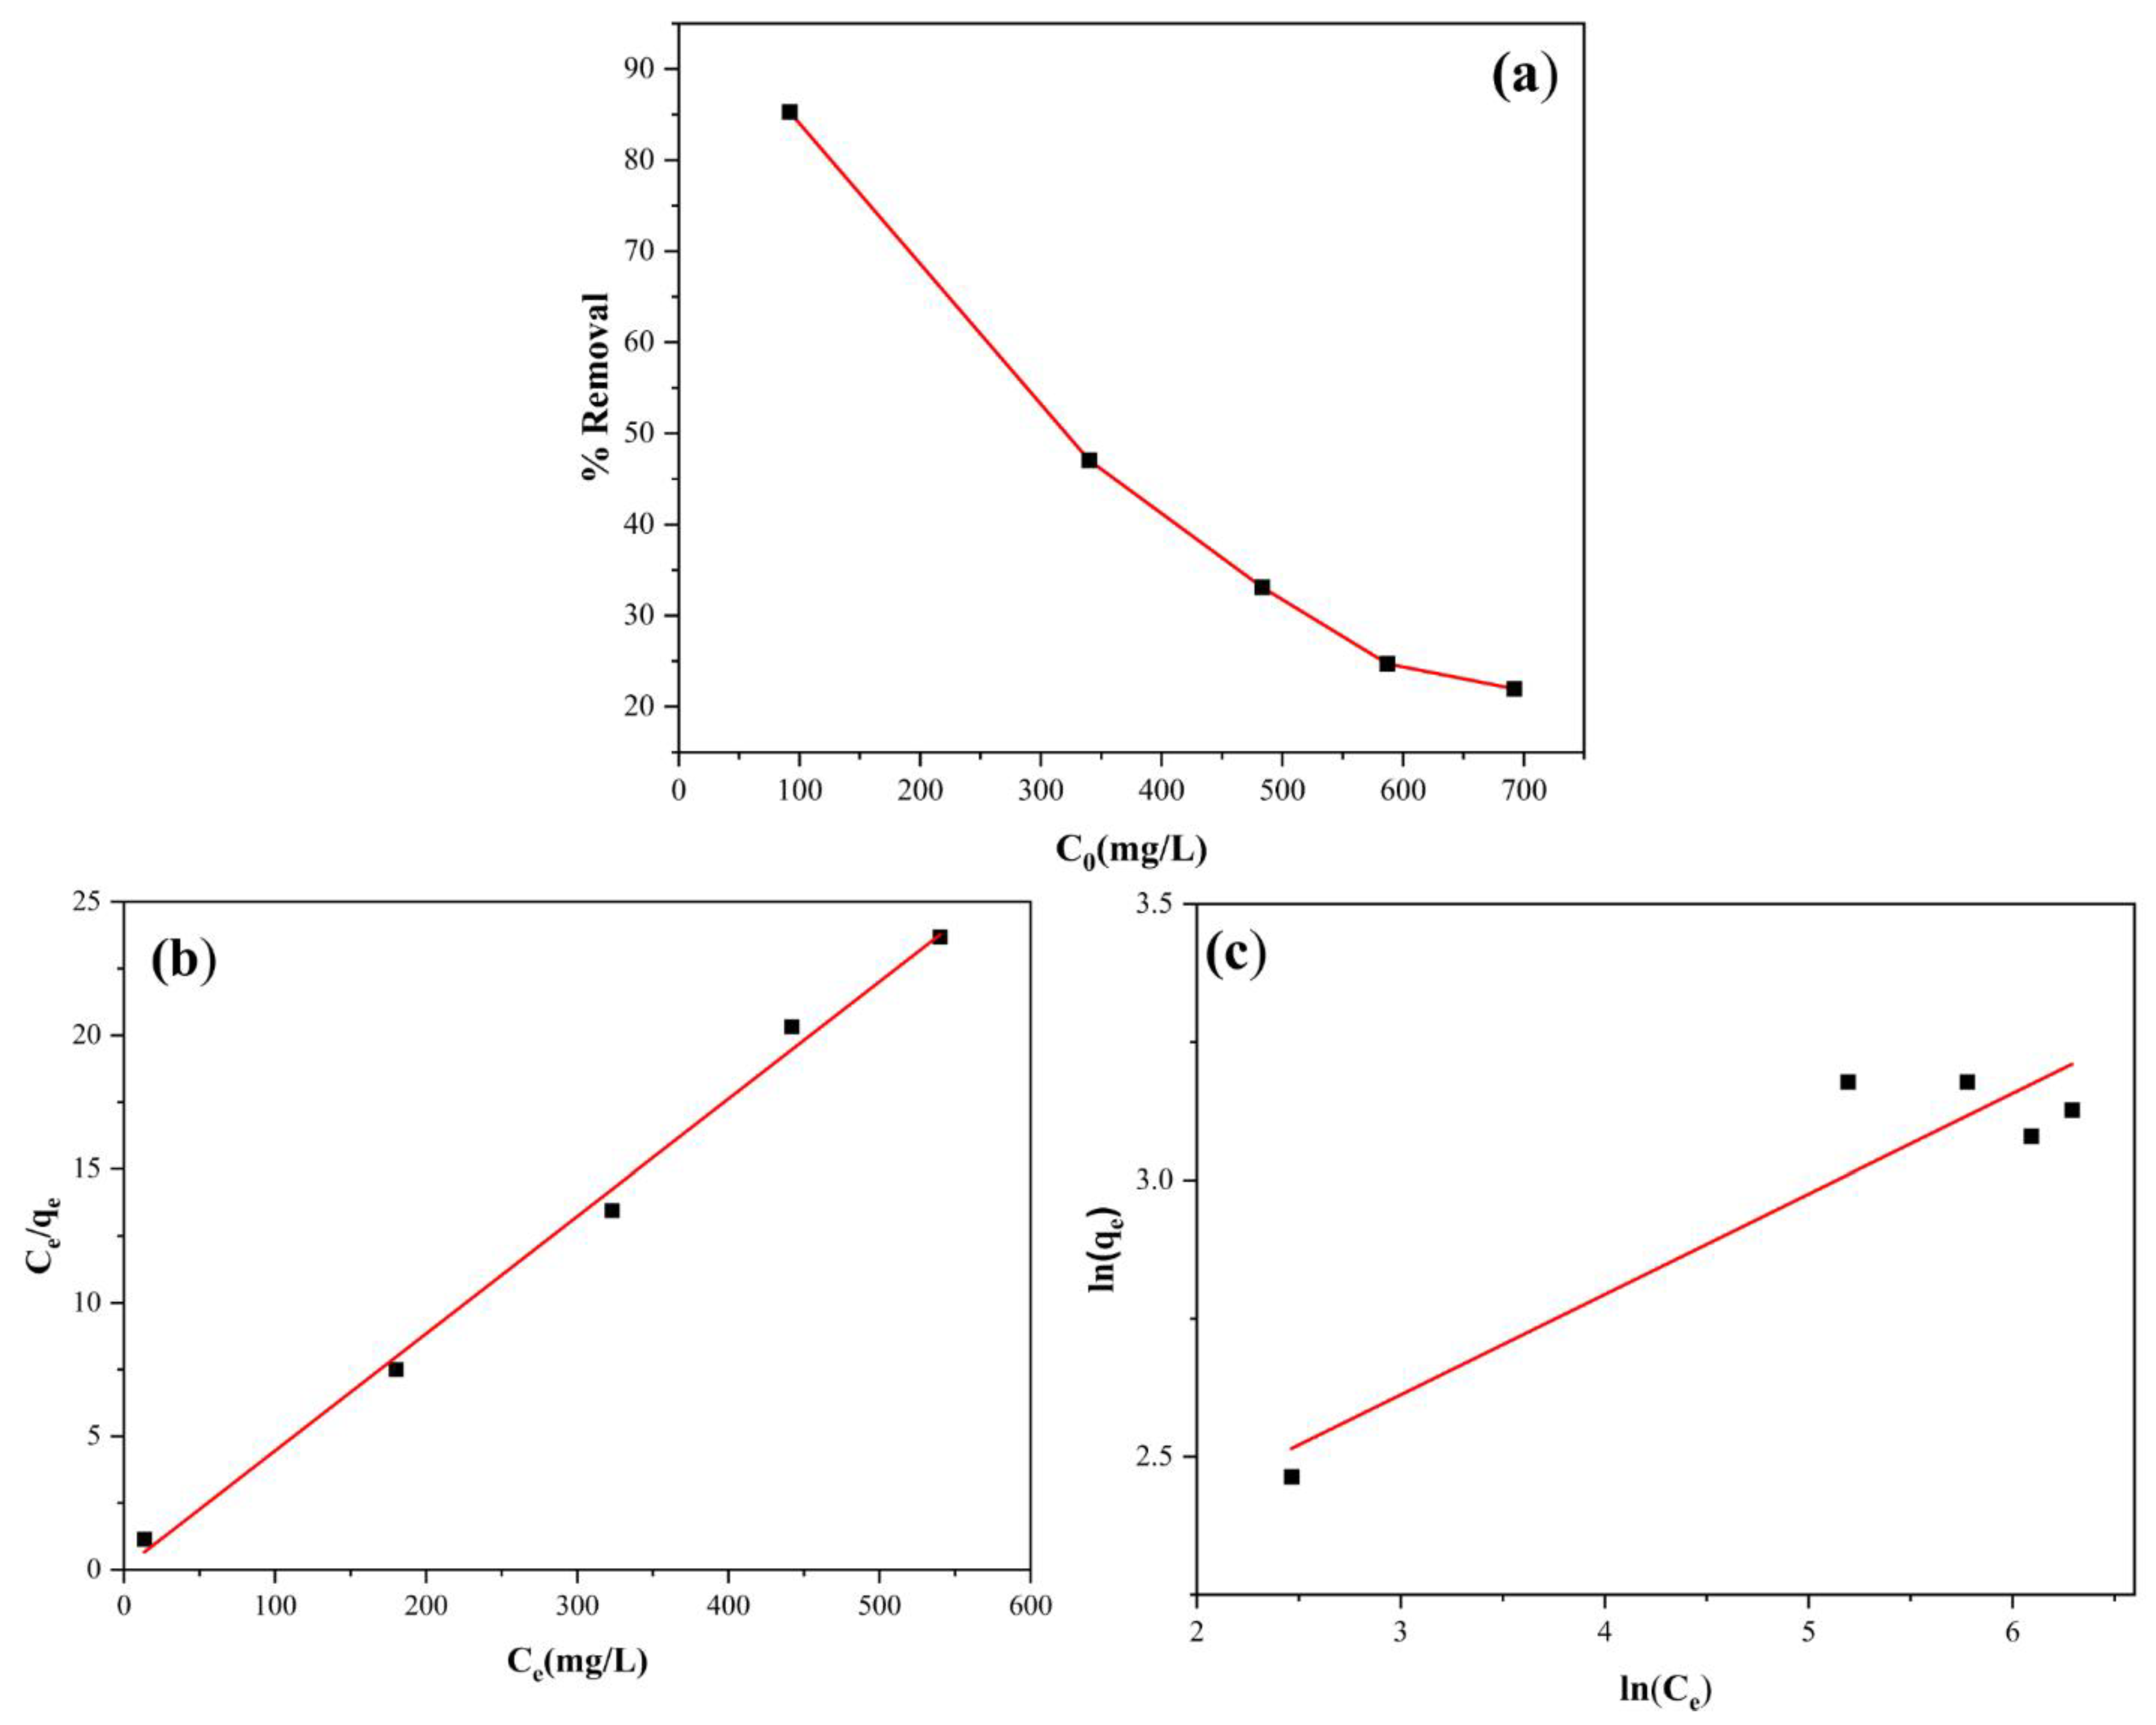
Figure 14.
Effect of Cu2+ initial concentration on the percentage removal (a), linear fitting to Langmuir model (b), and linear fitting to Freundlich model (c).
Figure 14.
Effect of Cu2+ initial concentration on the percentage removal (a), linear fitting to Langmuir model (b), and linear fitting to Freundlich model (c).
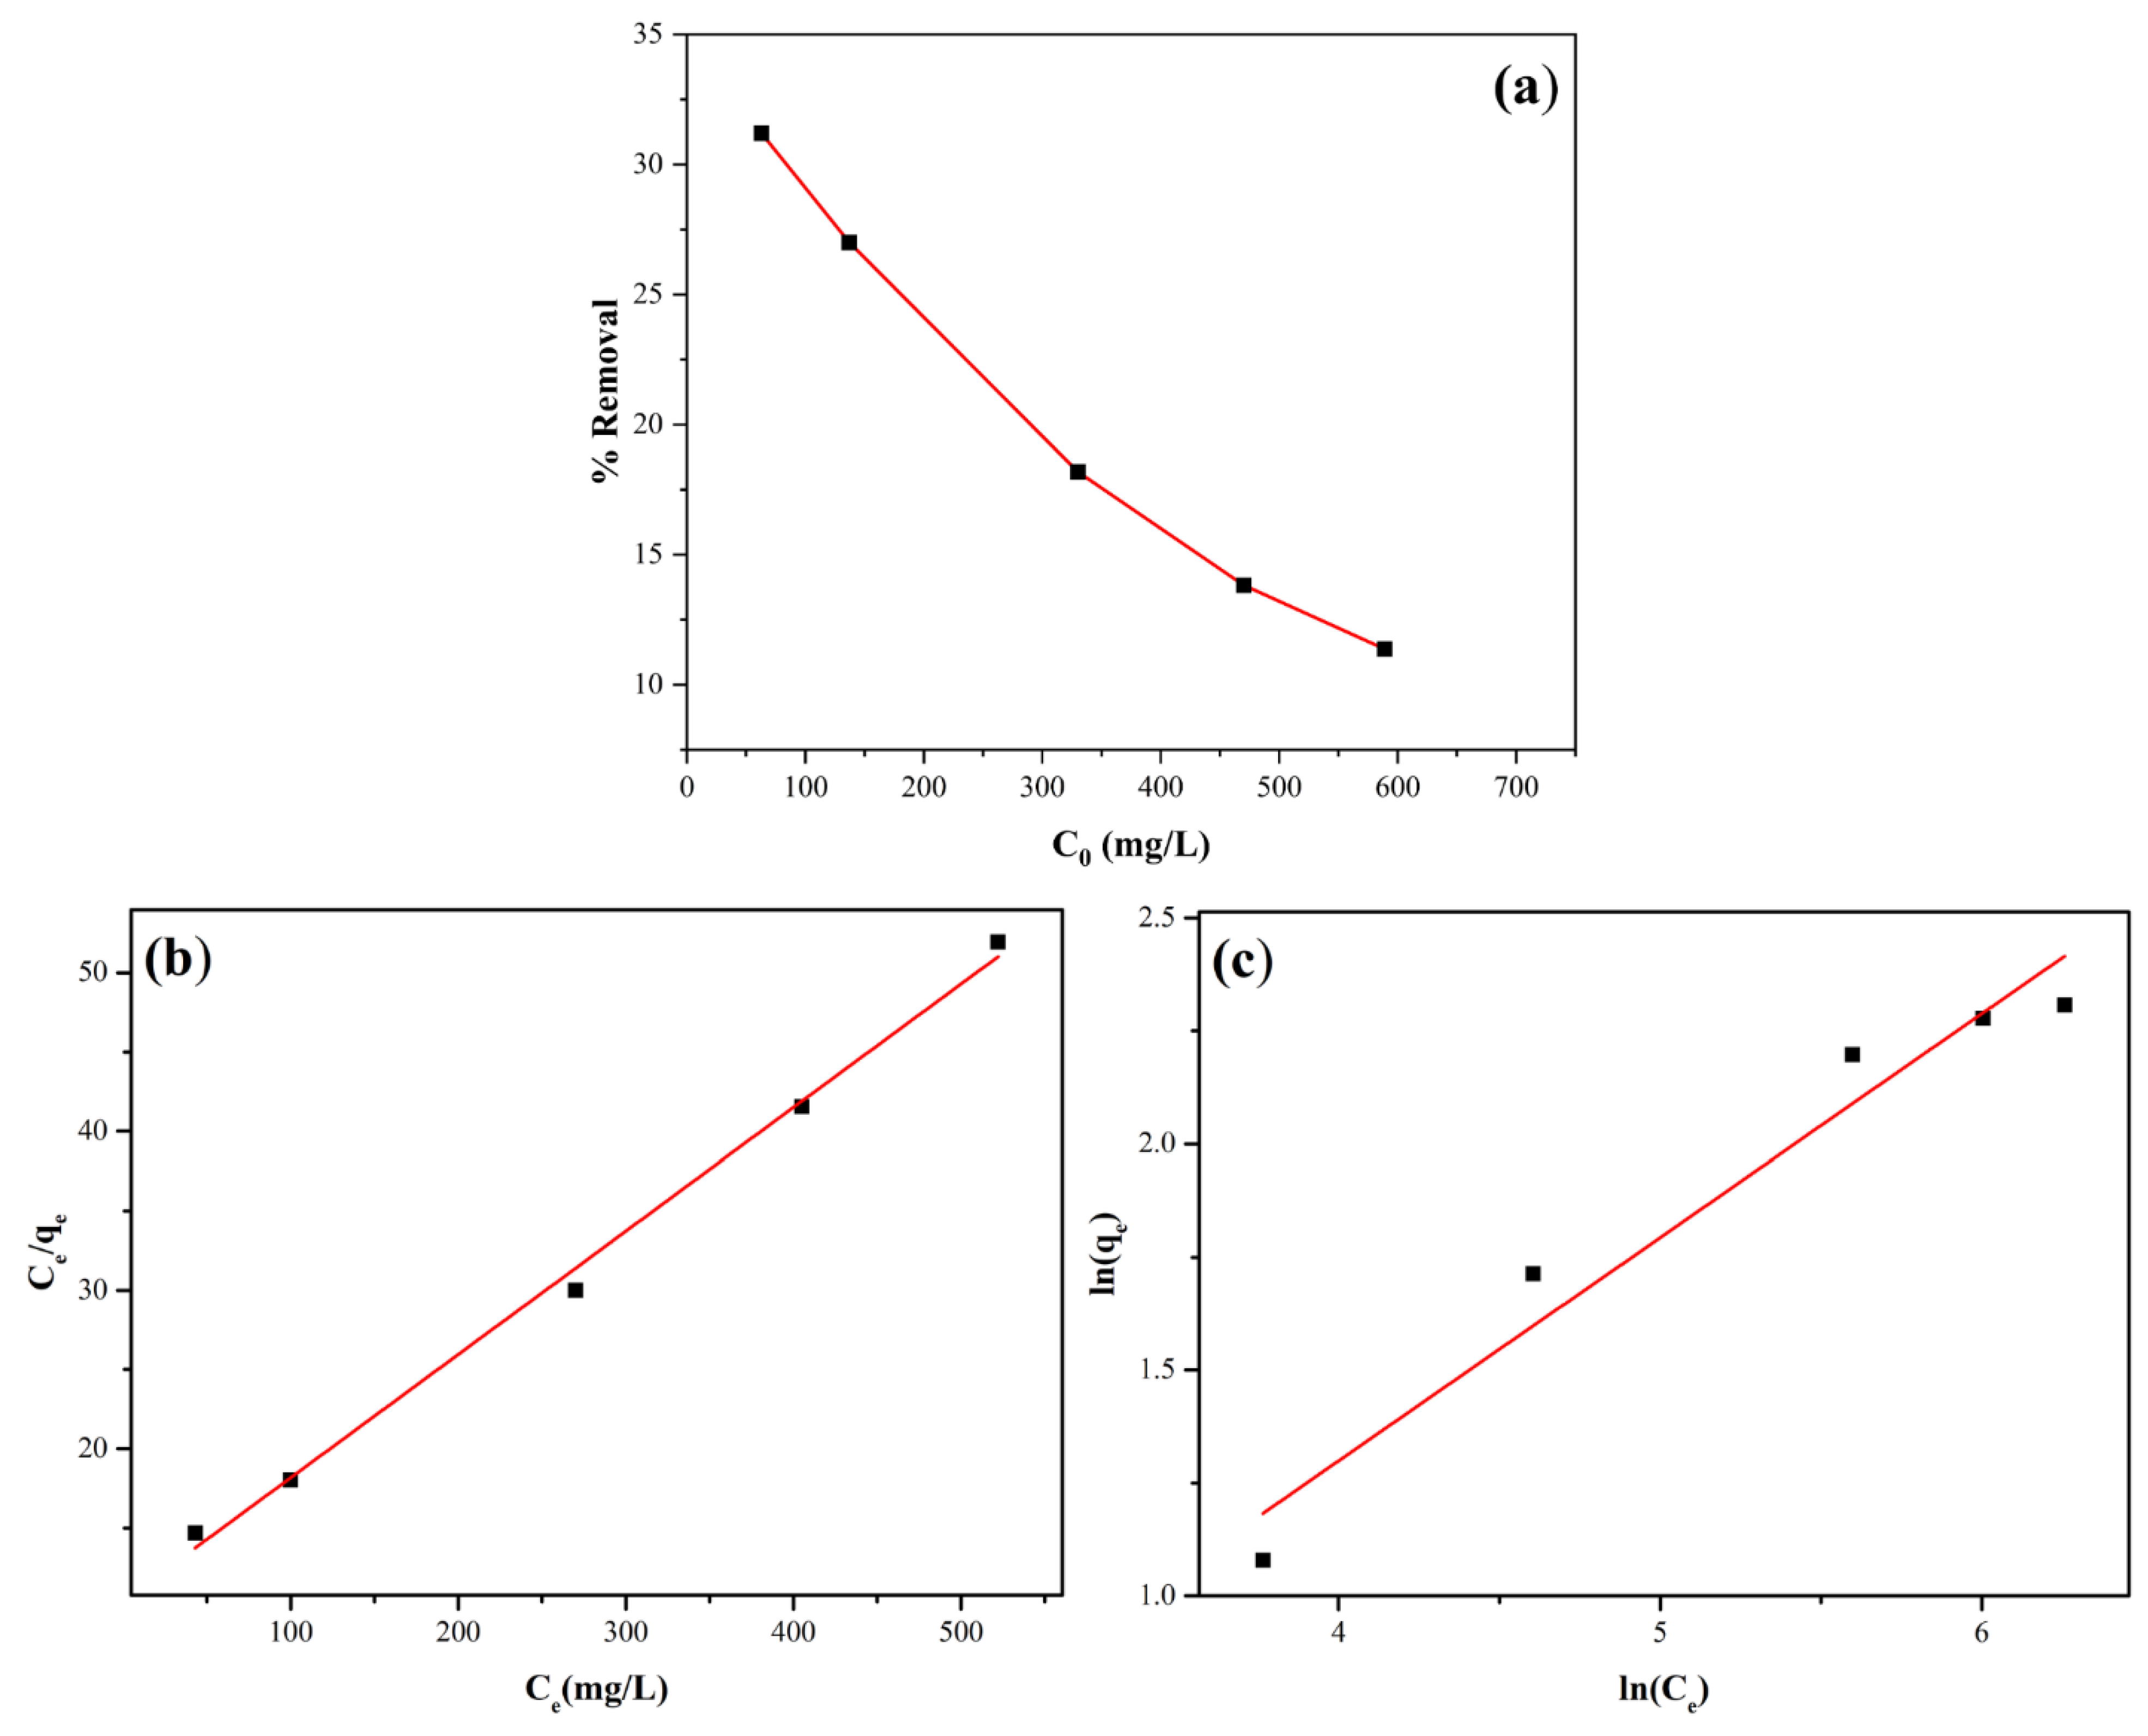
Table 1.
Chemical compositions (wt%) of fly ash (FA) before and after calcination and analcime zeolite by XRF analysis.
Table 1.
Chemical compositions (wt%) of fly ash (FA) before and after calcination and analcime zeolite by XRF analysis.
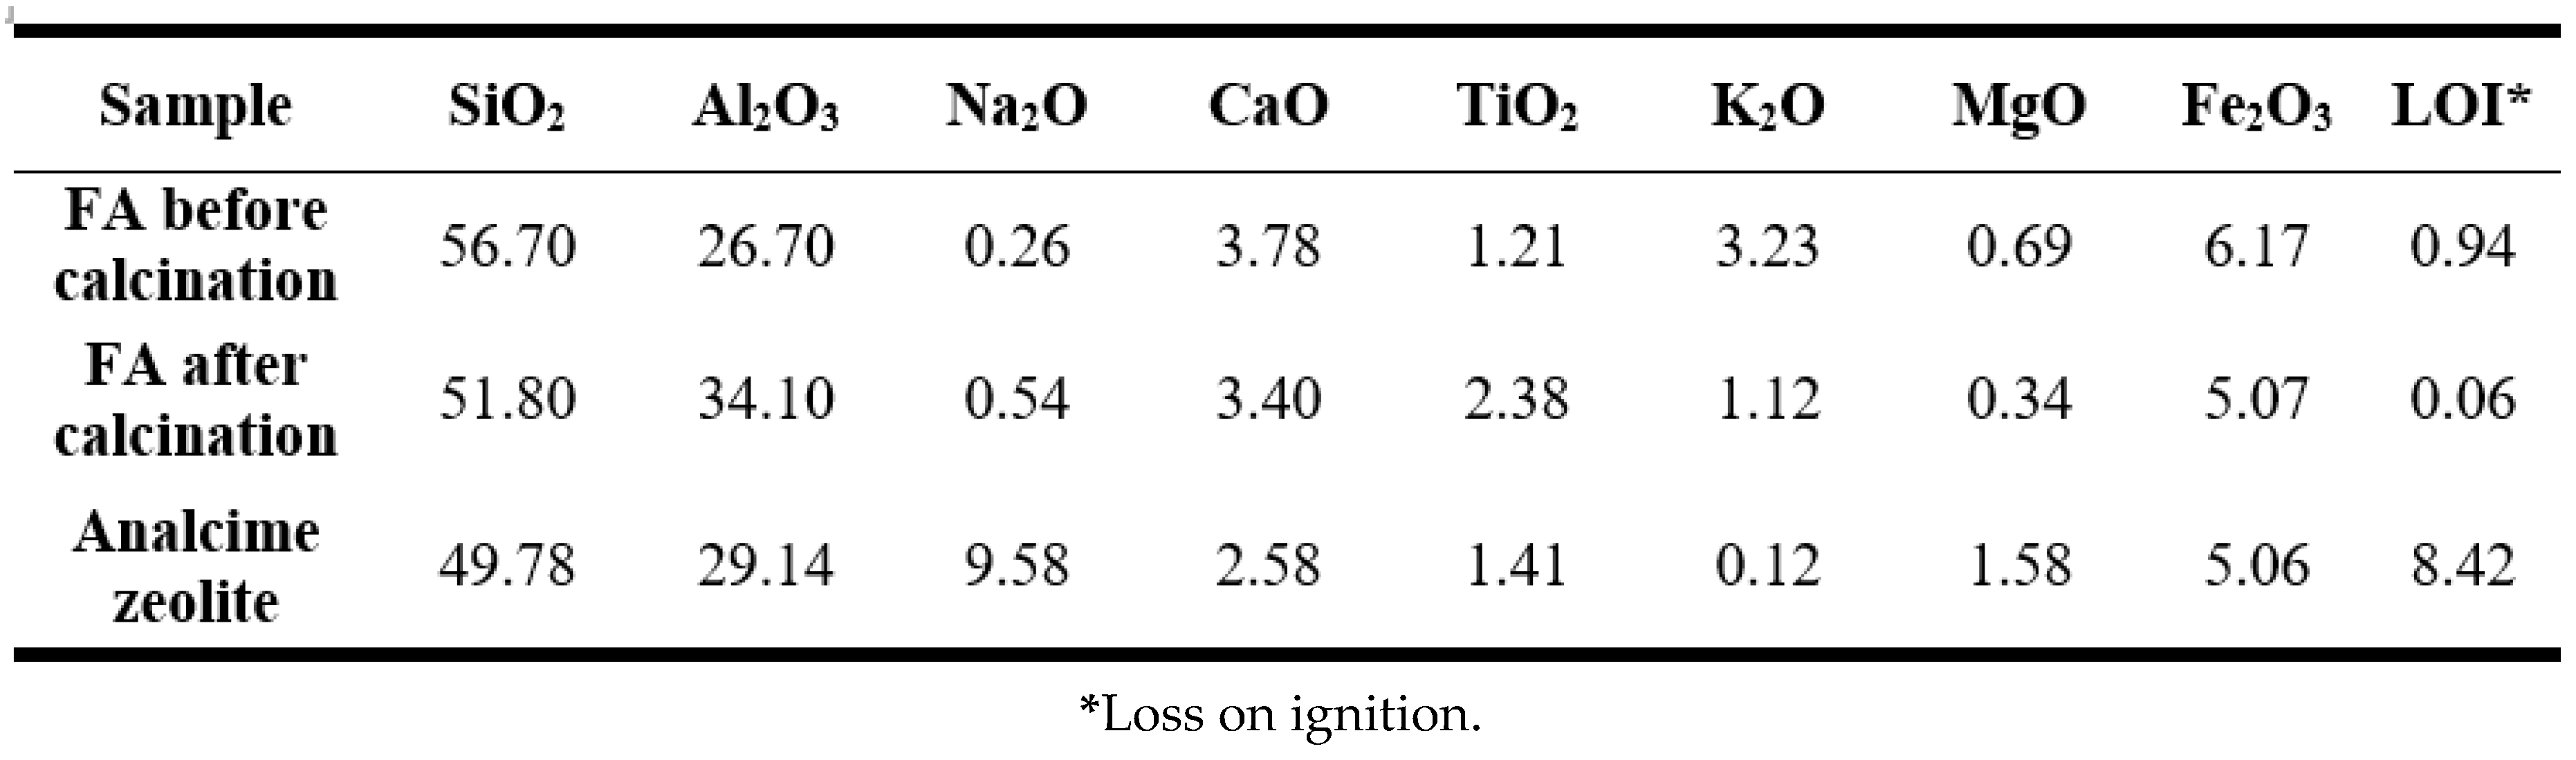 |
Table 2.
BET surface area, total pore volume and average pore diameter of analcime zeolite.
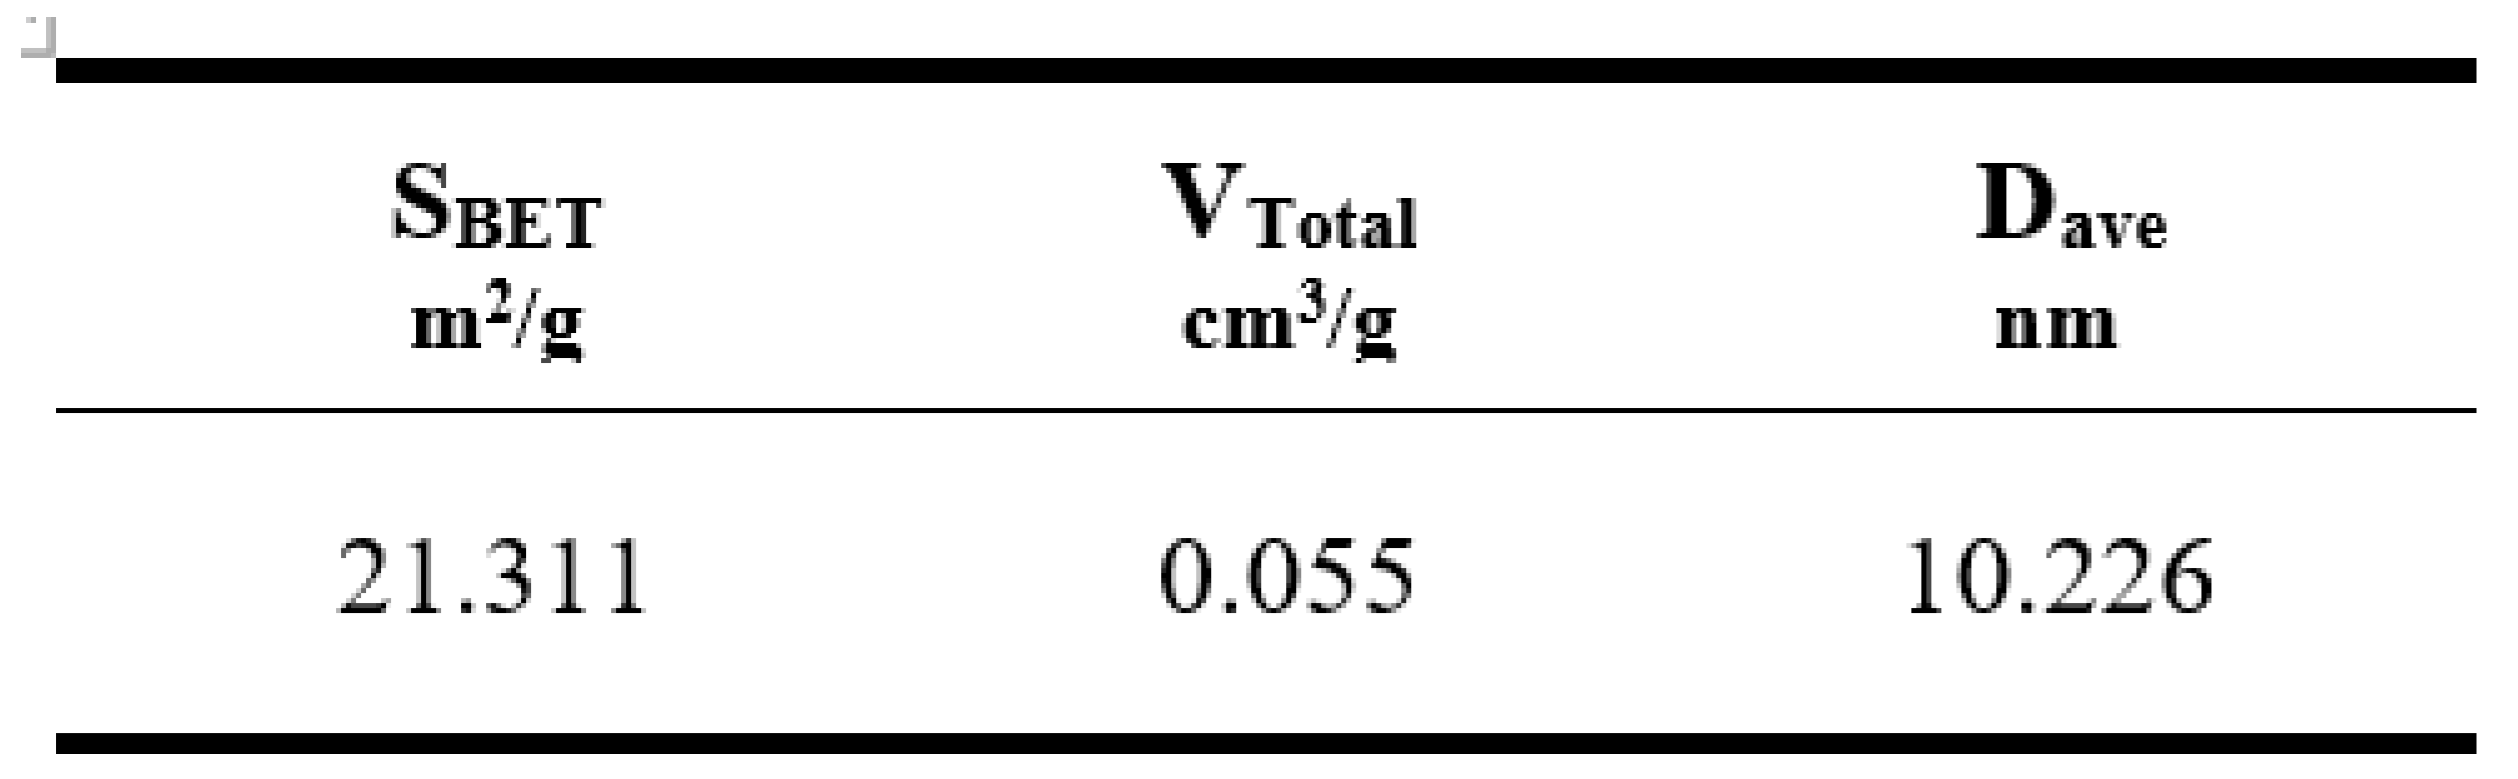 |
Table 3.
Parameters calculated from the pseudo-first-order and pseudo-second-order models for the adsorption processes of Pb2+ and Cu2+ ions.
Table 3.
Parameters calculated from the pseudo-first-order and pseudo-second-order models for the adsorption processes of Pb2+ and Cu2+ ions.
| Kinetic model | Constants | |||
| qe (mg.g-1) | K (min-1) | R2 | ||
| Pb2+ | Pseudo-first order | 16.51 | 0.154 | 0.979 |
| Pseudo-second -order | 23.98 | 0.009 | 0.990 | |
| Cu2+ | Pseudo-first -order | 4.66 | 0.073 | 0.995 |
| Pseudo-second -order | 6.58 | 0.103 | 0.980 | |
Table 5.
Calculated thermodynamic parameters for Pb2+ adsorption.
| T (K) | (kJ/mol) | (kJ/L mol) | (kJ/mol) |
| 298 | -2.075 | ||
| 323 | -1.632 | -0.0125 | -5.678 |
| 348 | -1.189 |
Table 6.
Calculated thermodynamic parameters for Cu2+ adsorption.
| T (K) | (kJ/mol) | (kJ/L mol) | (kJ/mol) |
| 298 | 5.852 | ||
| 323 | 2.077 | 0.1180 | 40.458 |
| 348 | -0.427 |
Table 7.
Adsorption capacities for Pb2+ and Cu2+ of various kinds of zeolites.
| Ion type | Adsorbent | Adsorption capacity (mg/g) | Reference | |
|
Pb2+ |
Clinoptilolite | 16.8 | [55] | |
| Chabazite | 6.00 | [56] | ||
| Heulandite | 9.97 | [57] | ||
| Mordenite nanoparticles | 17.40 | [39] | ||
| Analcime | 23.98 | This study | ||
|
Cu2+ |
Clinoptilolite | 25.69 | [58] | |
| Chabazite | 5.10 | [56] | ||
| Heulandite | 8.53 | [57] | ||
| Analcime | 12.85 | This study | ||
Disclaimer/Publisher’s Note: The statements, opinions and data contained in all publications are solely those of the individual author(s) and contributor(s) and not of MDPI and/or the editor(s). MDPI and/or the editor(s) disclaim responsibility for any injury to people or property resulting from any ideas, methods, instructions or products referred to in the content. |
© 2025 by the authors. Licensee MDPI, Basel, Switzerland. This article is an open access article distributed under the terms and conditions of the Creative Commons Attribution (CC BY) license (http://creativecommons.org/licenses/by/4.0/).
Copyright: This open access article is published under a Creative Commons CC BY 4.0 license, which permit the free download, distribution, and reuse, provided that the author and preprint are cited in any reuse.


