
Submitted:
15 May 2025
Posted:
16 May 2025
You are already at the latest version
Abstract
This paper analyses the role of electronic waste (E-waste) as a secondary source of critical and precious minerals, addressing the challenges and opportunities in transitioning towards a circular economy (CE) for electronics. The surging global demand for these essential materials, driven by technological advancements and renewable energy infrastructure, necessitates alternative supply strategies due to the depletion of natural reserves and the environmental degradation associated with primary mining. E-waste contains a rich concentration of valuable metals, making its recovery a promising solution aligned with CE principles, which can mitigate environmental impacts and ensure long-term material availability. The paper examines the environmental, economic, and technological aspects of E-waste recovery, including physical and mechanical separation, pyrometallurgical, hydrometallurgical, bio-metallurgical, and electrochemical processes. It also investigates innovative strategies for improving material recovery and sustainability, considering regulatory frameworks, technological innovations, and stakeholder engagements. The analysis highlights the significant potential of E-waste recycling to conserve natural resources, reduce environmental harm, and enhance economic resilience, while also acknowledging the technical, economic, and regulatory barriers that need to be addressed for widespread adoption.
Keywords:
E-waste
; critical minerals
; precious metals
; circular economy
; recycling
; material recovery
; technological advancements
; regulatory frameworks
1. Introduction
The global demand for critical and precious minerals has surged in recent decades, driven by rapid industrialization, advancements in digital technologies, and the expansion of renewable energy infrastructure. However, the depletion of natural reserves of these essential materials poses a significant challenge to long-term resource sustainability. Figure 1 (data from [1]) illustrates the available natural reserves, annual consumption rates, and projected depletion timelines for key metals such as gold, silver, and platinum. Figure 1a shows that for each metal, the underground reserves significantly exceed the annual consumption. Notably, copper has the highest available quantity and annual usage, while platinum has the lowest annual consumption. This suggests varying levels of resource abundance and demand across the metals. The depletion rates (Figure 1b) are derived from the available quantities and annual consumption rates shown in Figure 1a. Specifically, copper, which has the highest available quantity and annual consumption (Figure 1a), also exhibits the highest depletion rate (Figure 1b). Conversely, gold, with relatively lower values (Figure 1a), has the lowest depletion rate (Figure 1b). The finite nature of these resources necessitates a paradigm shift towards alternative supply strategies to mitigate supply chain vulnerabilities and environmental degradation associated with primary mining operations.
One promising solution is the recovery of critical and precious minerals from electronic waste (E-waste), a concept aligned with the principles of the circular economy (CE). E-waste contains a rich concentration of valuable metals, making it a viable secondary source that reduces reliance on virgin mineral extraction. The sustainable management of E-waste through enhanced recycling and resource recovery can contribute significantly to mitigating environmental impacts while ensuring long-term material availability [2,3]. Recent advancements in urban mining technologies, particularly in hydrometallurgical and bio-metallurgical recovery processes, have demonstrated substantial potential for extracting valuable metals from discarded electronic devices, reinforcing the viability of E-waste as a key component of sustainable resource management [4]. The environmental ramifications of primary mineral extraction, including habitat destruction, soil contamination, and greenhouse gas emissions, have intensified the need for alternative resource pathways [5,6]. In this context, E-waste recycling has emerged as a sustainable and economically viable alternative, reducing environmental degradation while enhancing resource security and economic resilience [7,8,9].
E-waste recovery aligns with international sustainability goals by reducing landfill waste, conserving natural resources, and minimizing carbon footprints associated with traditional mining practices [10,11,12,13]. Specifically, E-waste recovery aligns closely with several United Nations Sustainable Development Goals (SDGs) by addressing critical environmental and resource challenges. Primarily, it supports SDG 12 (Responsible Consumption and Production) by promoting recycling, reducing landfill waste, and conserving valuable materials through circular economy practices. It also contributes to SDG 13 (Climate Action) by minimizing the carbon footprint associated with traditional mining and raw material extraction, which are energy-intensive and polluting processes. Additionally, E-waste recovery enhances urban sustainability in line with SDG 11 (Sustainable Cities and Communities) by improving waste management systems and reducing environmental degradation in urban areas. From an industrial perspective, it advances SDG 9 (Industry, Innovation and Infrastructure) by encouraging innovation in green technologies and sustainable manufacturing practices. Finally, by creating opportunities for green jobs and fostering resource-efficient growth, E-waste recovery contributes to SDG 8 (Decent Work and Economic Growth), supporting the transition toward a more sustainable and inclusive economy.
Transitioning to a CE model requires an integrated approach that emphasizes material recovery, regulatory frameworks, economic incentives, technological innovations, and stakeholders’ engagements [12,13]. The rapid expansion of digital technologies and electronic consumption has led to an unprecedented surge in E-waste generation [14,15,16]. Between 2011 and 2023, global E-waste production increased from 35.8 million metric tons (Mt) to 61.3 Mt, with projections estimating it will reach 74.7 Mt by 2030 [4]. This trend underscores the urgent need for enhanced recycling efforts, as current global recycling rates remain alarmingly low. In 2019, globally, only 9.3 Mt of the 53.6 Mt of generated E-waste was recycled, representing just 17.4% of the total volume, highlighting a significant gap between waste generation and material recovery efforts [4].
This paper provides a comprehensive analysis of E-waste as a secondary source of critical minerals, examining the environmental, economic, and technological aspects of E-waste recovery. It explores the benefits and challenges associated with transitioning to a CE and investigates innovative strategies for improving material recovery and sustainability. Therefore, this paper is intended to find an answer to the following research question "How can technological advancements, policy interventions, and stakeholder engagement be synergistically leveraged to bridge the existing gaps in E-waste management, thereby optimizing the recovery of critical and precious minerals and fostering a resilient CE for electronics?" By addressing current inefficiencies in E-waste recycling systems and proposing pathways for sustainable resource management, this study aims to contribute to the broader discourse on enhancing sustainability and CE principles in mineral resource utilization.
2. Novelty
The novelty of this study lies in its synergistic and comprehensive analysis of the role of E-waste as a secondary source of critical and precious minerals. While the individual aspects of E-waste recovery, such as technological advancements, policy interventions, and stakeholder engagement, are discussed in existing literature, this study aims to understand how these three domains can be synergistically leveraged to optimize the recovery of critical and precious minerals and foster a resilient CE for electronics (Figure 2). The specific points highlighting this novelty are:
- The focused approach on the interplay between the three domains, to achieve specific outcomes (optimized mineral recovery and a resilient CE, is a central novel aspect.
- The paper provides a comprehensive analysis by examining the environmental, economic, and technological aspects of E-waste recovery. It also investigates innovative strategies for improving material recovery and sustainability, considering regulatory frameworks, technological innovations, and economic incentives. This multi-faceted approach to understanding the challenges and opportunities in transitioning to a CE for electronics, with a specific focus on mineral recovery, adds to its novelty.
- The manuscript highlights the significant gap between E-waste generation and material recovery efforts and seeks to propose pathways for sustainable resource management by addressing current inefficiencies in E-waste recycling systems. This focus on identifying and proposing solutions to existing gaps contributes to the novelty.
- The study aims to contribute to the broader discourse on enhancing sustainability and CE principles in mineral resource utilization. This ambition to not only analyze E-waste but also to link it to wider sustainability and CE principles in the context of mineral resources suggests a novel contribution beyond a narrow technical analysis.
Figure 2.
Sustainable mineral resource management domains for electronics.
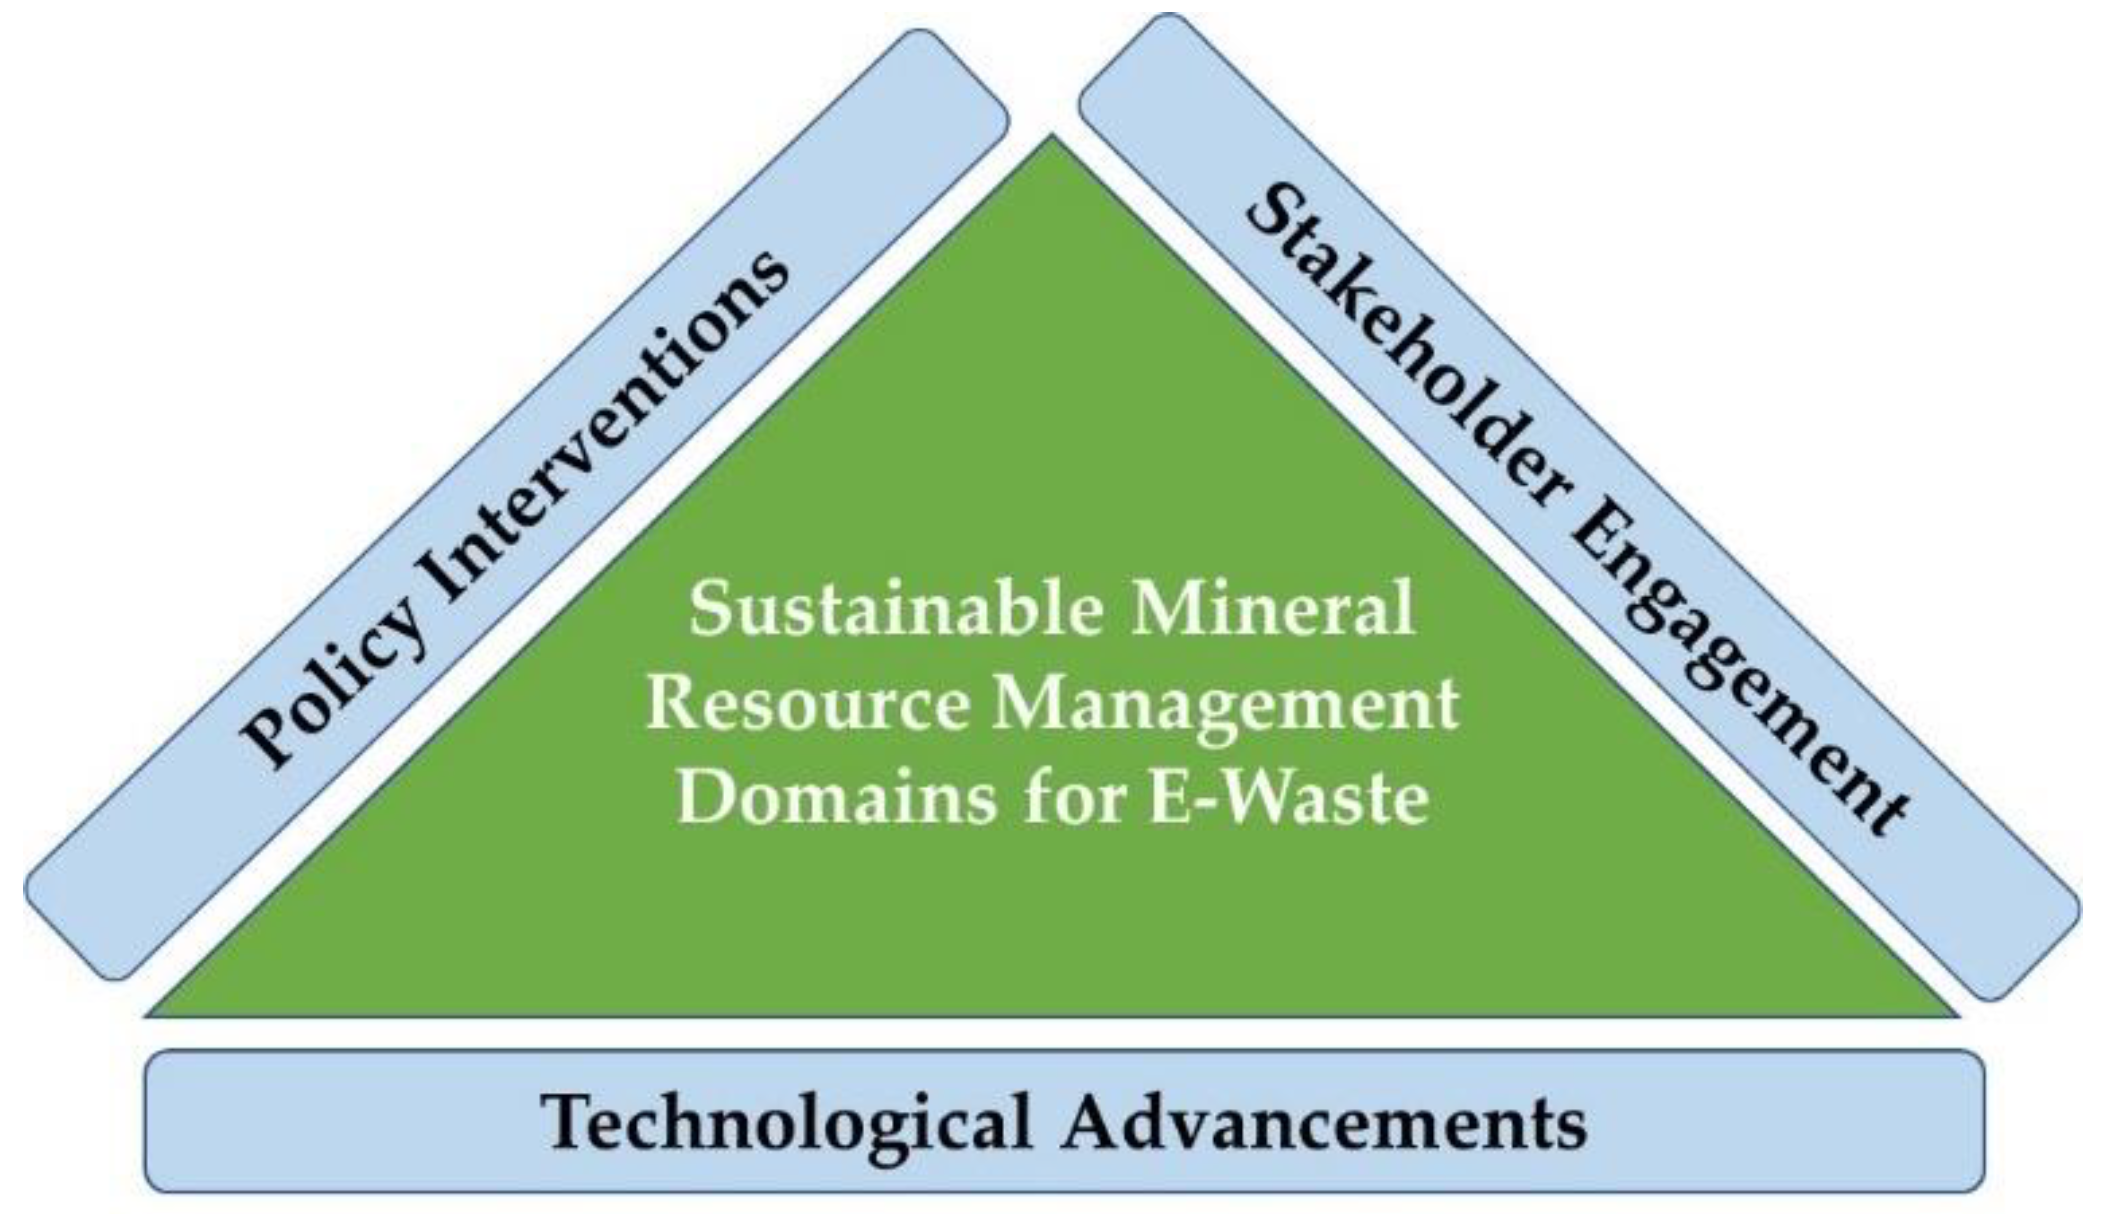
In summary, the novelty of this manuscript lies in its holistic approach to understanding how technological advancements, policy interventions, and stakeholder engagement can work together to significantly improve critical and precious mineral recovery from E-waste and establish a more resilient CE for the electronics sector. It moves beyond examining these aspects in isolation and focuses on their synergistic potential to address the pressing challenges in E-waste management and resource sustainability.
3. Methodology and Data Analysis
3.1. Identification of Sources
The scoping review followed the PRISMA-ScR (Preferred Reporting Items for Systematic Reviews and Meta-Analyses extension for Scoping Reviews) framework to ensure methodological transparency and consistency. An extensive literature search was conducted across multiple academic databases, including Scopus, Web of Science, and Google Scholar, focusing on scholarly publications related to E-waste management and critical mineral recovery. The search strategy combined key terms such as “E-waste,” “critical minerals,” “recycling technologies,” “circular economy,” “policy frameworks,” and “stakeholder engagements.” Additional sources were identified through backward citation tracking and expert consultations to ensure comprehensive coverage. The search was limited to publications in English and primarily focused on peer-reviewed articles, conference papers, and reviews.
3.2. Screening and Eligibility Analysis
All retrieved records were imported into a reference management system where duplicates were removed. Titles and abstracts were screened against predefined inclusion criteria: (a) relevance to E-waste management or critical/precious mineral recovery, (b) focus on technologies, environmental impacts, policy, consumer behavior and awareness or circular economy frameworks, and (c) clear methodological basis. Publications were excluded if they focused solely on general waste management, lacked empirical or technical content, or were non-English documents. The remaining articles underwent full-text review to confirm their eligibility. A total of 145 publications were included in the final analysis.
3.3. Data Analysis and Synthesis of Results
Each publication was classified into one of eight thematic categories derived from recurrent patterns in the literature: (1) mineral recovery technologies from e-waste, (2) critical and precious minerals, (3) sustainability and environmental impacts, (4) industrial applications of specific metals, (5) consumer behavior and awareness, (6) policy and legal frameworks, (7) emerging technologies and automation, and (8) general e-waste management and CE. The results of the review are visually summarized using a PRISMA-ScR-inspired flow chart, detailing the identification, screening, eligibility, and inclusion phases. The flow chart (Figure 3) illustrates the progressive refinement of sources from initial retrieval to final selection.
Distribution of publications across various thematic areas within the field of E-waste management and mineral recovery is presented in Figure 4. The data reveals that "Mineral Recovery Technologies from E-waste" is the most extensively researched area, with 44 publications. This indicates a significant academic and industrial focus on developing and optimizing methods to extract valuable minerals from electronic waste. Closely following is the category of "Critical and Precious Minerals," which has 36 publications. This reflects a strong interest in recovering high-value elements such as gold, palladium, and rare earth metals from discarded electronics. These two leading categories suggest that much of the current research effort is directed toward maximizing resource recovery from E-waste.
The environmental and sustainability aspects are also well represented. "Sustainability and Environmental Impacts of E-waste and Mineral Extraction" has 15 publications, pointing to an active interest in understanding and mitigating the ecological consequences of both E-waste processing and traditional mining activities. Similarly, the topic of "Industrial Applications and Production of Specific Metals" has 14 publications, focusing on how the recovered materials are utilized in various industrial processes. Both "Consumer Behavior, Awareness, and Participation in E-waste Recycling" and "Policy, Regulation, and Legal Frameworks for E-waste Management" have 13 publications each. This highlights a moderate level of research in the areas of public engagement and the institutional and legal structures governing e-waste practices, which are crucial for successful implementation of recycling initiatives. On the other hand, "Emerging Technologies and Automation in E-waste Management" and "General E-waste Management and Circular Economy" are the least explored categories, each with only 5 publications. These results suggest that there may be opportunities for future research in innovative technologies and in developing systemic CE models for E-waste.
In summary, the chart illustrates a research landscape heavily oriented toward technological and material recovery, with relatively less emphasis on automation, CE integration, and behavioral or regulatory aspects. This highlights potential gaps that could be addressed to create a more holistic approach to E-waste management.
4. Critical and Precious Minerals
4.1. Industrial Significance, Major Producers, and Potential Environmental Impact from Primary Resource Extraction Processes
Critical minerals, including lithium, cobalt, and rare earth elements (REEs), are vital for renewable energy, electronics, and defense sectors. Precious metals like gold, silver, and platinum are essential for electronic devices and high-performance applications such as batteries and semiconductors [16,17]. The term "critical metals" refers to those essential for clean energy technologies, including wind and geothermal turbines [18], solar panels, electric vehicles [19], and hydrogen production for energy storage [20]. Their criticality is determined by three factors: natural scarcity, supply chain risks, and economic and environmental feasibility of extraction (Table 1; revised after [17]. Global demand for critical metals has surged over the past decade due to population growth and their role in green energy technologies [21,22,23,24]. In year 2023, clean energy applications drove strong demand increases, with lithium consumption rising by 30% and other key minerals like nickel, cobalt, graphite, and REEs growing by 8%–15% [16].
The supply chains of critical minerals are highly concentrated in a few regions, leading to geopolitical vulnerabilities and market volatility (Table 1; revised after [17]). China, for instance, dominates the production and processing of REEs, while cobalt mining is largely controlled by operations in the Democratic Republic of Congo. This dependence on a limited number of suppliers poses a significant risk to technological and economic stability.
The extraction of critical and precious minerals from primary sources involves extensive land use, high energy consumption, and pollution [6,25]. Mining operations can lead to deforestation, soil degradation, and water contamination, often impacting vulnerable communities. The push for sustainable sourcing emphasizes the need to recover these materials from secondary sources such as E-waste to reduce environmental harm and promote ethical supply chains.
4.2. E-Waste as a Sustainable Resource for Critical and Precious Minerals
4.2.1. Secondary Resource Potentials
The accelerating demand for electronics, electric vehicles, and renewable energy technologies has increased the consumption of critical minerals. However, many of these resources are finite, and their depletion raises concerns about long-term availability [70]. E-waste recycling offers a means to supplement supply, ensuring the continued development of advanced technologies without exacerbating raw material scarcity [71,72]. E-waste contains a diverse array of valuable minerals, including copper, gold, silver, platinum, lithium, and REEs [73]. Figure 5 (data from [74]) provides a comprehensive overview of the distribution of metals in E-waste in year 2022, categorized into total metals, other metals, and precious metals. These data highlight the quantities of various metals present in discarded electronics and their respective recycling rates, revealing significant disparities in recovery efficiency across different categories. Figure 5a (data from [74]) illustrates the presence of total metals in E-waste, measured in billion kilograms (Kg). Iron (Fe) is the most abundant, accounting for 24 billion Kg, followed by aluminum (Al) at 4 billion Kg and copper (Cu) at 2 billion Kg. Smaller quantities of nickel (Ni) (0.52 billion Kg) and other metals (0.46 billion Kg) are also present. These metals constitute the largest fraction of E-waste materials, and their relatively high recycling rate of 60% suggests the existence of well-established recovery processes, particularly for iron and aluminum, which are widely used in infrastructure and electronics manufacturing.
The presence of other metals (0.46 billion Kg) in E-waste, measured in million kilograms (Kg) is shown in Figure 5b (data from [74]). Among them, zinc (Zn) is the most prevalent at 280 million Kg, followed by lead (Pb) (70 million Kg), tin (Sn) (44 million Kg), cobalt (Co) (34 million Kg), and antimony (Sb) (28 million Kg). These metals are critical for various industrial applications, including batteries, soldering, and electronic components. However, their recycling rate is alarmingly low at just 4%, indicating significant inefficiencies in current recovery technologies. This low rate can be attributed to the dispersed nature of these metals in complex electronic waste streams, making extraction challenging and often economically unviable.
The presence of precious metals (2 million Kg) in E-waste, measured in thousand kilograms (Kg) is shown in Figure 5c (data from [74]). Silver (Ag) leads at 1,200 thousand Kg, followed by gold (Au) at 270 thousand Kg and palladium (Pd) at 120 thousand Kg. Additionally, smaller quantities of osmium (Os) (12 thousand Kg) and platinum group metals such as praseodymium (Pr), iridium (Ir), rhodium (Rh), and ruthenium (Ru) (9 thousand Kg) are also present. Despite their relatively small quantities compared to bulk metals, these elements hold significant economic value. The recycling rate for precious metals stands at 20%, reflecting a moderate recovery level. Specialized hydrometallurgical and pyrometallurgical techniques enable the extraction of Au, Ag, and Pd, yet substantial losses still occur, emphasizing the need for enhanced E-waste recovery infrastructure.
In summary, Figure 5 (data from [74]) underscores the urgent need to improve E-waste recycling technologies and policies. While total metals enjoy a relatively high recovery rate, other metals remain vastly underutilized, and even precious metals—despite their value—are not being recycled at optimal levels. Developing advanced extraction methods, strengthening regulatory frameworks, and creating economic incentives for E-waste recycling are critical steps toward enhancing resource sustainability and minimizing environmental impacts.
4.2.2. Environmental Benefits
Recycling E-waste reduces reliance on traditional mining, which is linked to extensive environmental degradation, greenhouse gas emissions, and habitat destruction [6,75]. Improper E-waste management results in the annual release of approximately 58 thousand kg of mercury and 45 million kg of plastics containing brominated flame retardants into the environment [74]. Effective E-waste management mitigates landfill accumulation, prevents hazardous substances from contaminating soil and water, and conserves natural resources [76]. Furthermore, the recovery of secondary raw materials through E-waste recycling has prevented the extraction of 900 billion kg of ore and avoided 52 billion kg of CO₂-equivalent emissions [74]. Additionally, metal recovery from E-waste generally requires less energy than primary ore extraction, contributing to a reduced carbon footprint.
4.2.3. Economic Benefits
The estimated potential value of secondary raw materials in E-waste highlights the economic significance of metal recovery from discarded electronics. For example, in year 2022, the overall gross value of the metals contained in E-waste was estimated at USD 91 billion (Figure 6; data from [74]). Among these, copper (Cu) holds the highest value at $19 billion, reflecting its essential role in wiring and circuit boards. Following closely, iron (Fe) and gold (Au) are valued at $16 billion and $15 billion, respectively. While iron is widely used in structural components, gold's high value stems from its role in high-performance electronic circuits. Nickel (Ni) and aluminum (Al) also contribute significantly to the overall value, with estimated recoverable amounts worth $14 billion and $11 billion, respectively. Nickel is commonly found in batteries and specialized alloys, while aluminum is used in casings and heat dissipation components. Additionally, palladium (Pd), a crucial element in electronic connectors and catalytic applications, holds a potential value of $8 billion. Other metals, including cobalt (Co), tin (Sn), and silver (Ag), represent lower but still notable values at $2.3 billion, $1.4 billion, and $0.9 billion, respectively. Cobalt is primarily used in lithium-ion batteries, tin in soldering applications, and silver in high-conductivity components. Overall, this data (Figure 6; data from [74]) underscores the immense economic opportunity in E-waste recycling. Recovering these valuable metals not only supports material sustainability but also plays a crucial role in advancing the CE by reducing reliance on virgin resources and minimizing environmental impact.
Moreover, E-waste recycling creates economic opportunities by generating jobs in collection, processing, and advanced material recovery [77]. As demand for critical and precious minerals rises, urban mining from E-waste can provide a cost-effective alternative to raw material extraction, especially in regions lacking natural mineral deposits. With advances in refining techniques and economies of scale, the profitability of EE-waste recovery is expected to improve, fostering long-term sustainability in the electronics sector.
5. Technologies for Mineral Recovery from E-waste
Recovering valuable minerals from E-waste is crucial for resource efficiency, sustainability, and reducing environmental impact. Several technologies are used for mineral recovery, each with distinct mechanisms and advantages [9,11,12,78,79,80,81,82,83,84,85,86,87]. The primary methods include physical and mechanical separation, hydrometallurgical processes, pyrometallurgical processes, bio-metallurgy, and electrochemical processes.
5.1. Physical and Mechanical Separation
Physical and mechanical separation processes are the first step in E-waste recycling, aiming to extract valuable materials based on their physical properties without chemical modification [9,12]. These methods include shredding and crushing to break down E-waste into smaller pieces, followed by magnetic separation to remove ferromagnetic materials like iron, nickel, and cobalt. Eddy current separation is employed to recover non-ferrous metals such as copper and aluminum, while density separation (gravity and air classification) separates plastics, glass, and metals based on their weight differences. Additionally, electrostatic separation leverages variations in electrical conductivity to separate conductive metals from non-conductive materials.
While these techniques are cost-effective and environmentally friendly, they are not efficient for recovering fine or mixed metal particles and cannot extract metals from complex compounds. These processes are shown in Table 2 with specific example for Information Technology (IT) and telecommunication equipment. A typical physical–mechanical treatment plant for IT and telecommunication equipment follows a sequential process. Upon arrival, materials are sorted and cleaned by removing hazardous substances (e.g., ink cartridges, mercury-containing switches, and various batteries) and recovering valuable components like hard drives and printed circuit boards (PCBs). An initial mechanical treatment breaks casings to expose internal parts, followed by manual selection of valuable and hazardous components. The remaining material is shredded and undergoes a second manual sorting cycle before further shredding reduces it to a few centimeters. Finally, the shredded material is processed through eddy currents to extract non-ferrous metals, while magnetic separation isolates ferrous metals.
5.2. Pyrometallurgical Processes
Pyrometallurgy employs high-temperature treatments to extract and refine metals from E-waste [88,89,90,91]. The most common method is smelting, where E-waste is melted in furnaces to separate metals based on their densities. Roasting is another technique that converts metal compounds into oxides or sulfides for further refining. In more advanced applications, plasma arc furnaces use high-energy plasma to extract metals, while volatilization allows for the recovery of certain metals like mercury and zinc through controlled evaporation. Table 3 lists the various pyrometallurgical processes.
Pyrometallurgical methods, such as smelting and roasting, provide high recovery efficiency and fast processing by using high temperatures to extract metals from E-waste [90]. For example, copper smelting in a blast furnace effectively recovers copper, gold, and silver from PCBs. Similarly, lead smelting extracts lead from batteries, while plasma arc furnaces refine precious metals from E-waste. However, these methods demand substantial energy, as furnaces must maintain temperatures exceeding 1,200°C. Additionally, they release air pollutants like dioxins, furans, and heavy metal vapors, requiring advanced filtration systems such as baghouse filters, electrostatic precipitators, and wet scrubbers to minimize environmental impact.
Pre-treatment is crucial to remove plastics and hazardous substances that could release toxic emissions during processing. For instance, PCBs contain brominated flame retardants, which, when burned, generate harmful dioxins. Removing these plastics beforehand reduces the formation of hazardous compounds and improves metal recovery efficiency. Similarly, mercury switches and cadmium-containing components must be extracted to prevent toxic gas emissions during high-temperature processing. Thus, while pyrometallurgical techniques offer efficient metal recovery, they necessitate careful pre-processing and emission control measures to mitigate environmental and health risks.
5.3. Hydrometallurgical Processes
Hydrometallurgical methods involve using aqueous solutions to dissolve and extract metals from E-waste [9,92,93,94,95,96,97,98,99,100]. The process (Table 4) typically begins with leaching, where chemicals such as sulfuric acid (H₂SO₄), nitric acid (HNO₃), or cyanide dissolve specific metals. Ammonia leaching is sometimes used for selective recovery of copper and nickel. Once the metals are in solution, solvent extraction (SX) employs organic solvents to selectively recover valuable metals, while ion exchange uses resins to capture specific metal ions. Finally, metals are recovered through precipitation, where reagents like sodium hydroxide help extract metals by adjusting the pH. Hydrometallurgy is an energy-efficient and highly selective method for recovering metals like gold, silver, and copper. While it produces lower emissions than pyrometallurgy, it relies on hazardous chemicals and requires extensive wastewater treatment. Effective reagent selection and proper waste management are crucial to minimizing environmental impact and operational costs.
5.4. Bio-Metallurgy
Biological methods, collectively known as bio-metallurgy, use microbes or plants to extract metals from E-waste in an eco-friendly manner [101,102,103]. One of the most promising techniques is bioleaching, which utilizes bacteria such as Acidithiobacillus ferrooxidans and fungi to break down E-waste and dissolve valuable metals [104,105,106]. For example, Nithya et al. [107] used Pseudomonas balearica SAE1 to extract gold and silver and achieved a recovery rate of 68.5 %, and 33.8 %, respectively. Another approach, phyto-mining, involves using plants to absorb and accumulate metals from shredded E-waste [108,109]. These processes are environmentally sustainable and have low energy consumption compared to traditional metallurgical techniques. However, bio-metallurgy is slow and requires specific conditions for microbial activity, making it less viable for large-scale industrial applications. Despite these challenges, ongoing research aims to optimize microbial efficiency and improve scalability.
5.5. Electrochemical Processes
Electrochemical methods recover metals through redox reactions driven by electric currents. One widely used technique is electrowinning, which extracts metals such as gold, silver, and copper by reducing metal ions from solution onto an electrode [110,111]. For instance, Murali et al. [111] successfully recovered copper from E-waste through a bioleaching process followed by solvent extraction (SX) and electrowinning (EW). After copper recovery, precious metals (Au and Ag) were extracted using a thiosulfate process, followed by resin adsorption, stripping, and either electrowinning or cementation. Under optimized conditions, more than 94% of copper and less than 10% of iron were transferred from the E-waste leach solution during the loading phase, with a 92% stripping efficiency from the loaded organic phase. Electrowinning of the stripped solution produced electrodeposits with 99% purity and a current efficiency of 94.5%. Optimal conditions for achieving approximately 87% gold leaching recovery included 111 mM thiosulfate, 30.0 mM copper (II), and 0.32 M ammonia. The electrowinning tests further demonstrated that the gold fraction reached 81% when applying an electrode potential of -600 mV Ag/AgCl.
Electrorefining is another electrochemical process that purifies metals by dissolving impure metal at the anode and depositing pure metal at the cathode. For example, Mahyapour and Mohammadnejad [112] reported that using an anode composition of 75% gold, an electrolyte with an ionic concentration of 2 M, a process temperature of 25°C, and a specific cathode current of 0.02 A/cm², resulted in the production of cathode gold with a purity of 95.3% when the electrolyte gold concentration was below 1 g/L. Additionally, Italimpianti refining plants in Italy can produce gold with a purity of 999.9/1000 from an initial composition of 900/1000, with a maximum silver content of 3% and total platinum group metals (PGM) of 0.1% [113].
Another electrochemical approach, electrocoagulation, utilizes an electric current to aggregate fine metal particles, enhancing their recovery [114,115]. These electrochemical processes offer high-purity metal recovery while generating minimal chemical waste, making them attractive for sustainable E-waste recycling. However, they require significant electricity input and are generally slower than pyrometallurgical methods. Their effectiveness is maximized when integrated with hydrometallurgical techniques, improving overall recovery efficiency.
5.6. Advantages/Disadvantages and Efficiency of Mineral Recovery Processes from E-Waste
A summary of the advantages and disadvantages of each mineral recovery technology from E-waste, described above, is shown in Table 5.
Moreover, a detailed comparison of the five technologies for mineral recovery from E-waste, focusing on their effectiveness in recovering specific materials is shown in Table 6. Different metals require different recovery methods, each with varying levels of efficiency and effectiveness, as discussed below.
- Gold (Au) and Silver (Ag): They are among the most valuable metals found in E-waste. They are best recovered through hydrometallurgical and pyrometallurgical methods, both of which are highly effective in extracting these precious metals. Additionally, electrochemical processes can also be used to recover Au and Ag with high purity, ensuring that these valuable materials are efficiently separated and refined.
- Copper (Cu): It is commonly found in E-waste, particularly in circuit boards and wiring. It can be efficiently extracted using hydrometallurgy, pyrometallurgy, and electrochemical methods. These processes ensure high recovery rates of Cu, which is a key material in electronics due to its excellent conductivity and recyclability.
- Rare Earth Elements (REEs): The recovery of REEs, such as neodymium and dysprosium, is a more challenging task, as traditional recovery methods often struggle to extract these elements efficiently. While bio-metallurgy (using microorganisms to extract metals) shows promise for REE recovery, it requires further research and optimization to enhance its effectiveness and scalability.
- Platinum Group Metals (PGMs): PGMs, including platinum, palladium, and rhodium, are highly valuable but are typically found in smaller quantities in E-waste. The most effective recovery methods for PGMs are hydrometallurgy and pyrometallurgy, which allow for the extraction of these metals with high efficiency.
- Ferrous Metals (Fe, Ni, Co): They are best recovered using physical separation methods, such as magnetic separation, or through pyrometallurgical techniques. These methods effectively separate ferrous metals from other materials, ensuring that they can be recycled and reused.
- Aluminum (Al): It is widely used in electronics, particularly in housings and casings. The most efficient recovery methods for aluminum include physical separation techniques, such as eddy current separation, or through pyrometallurgy. These methods are effective in extracting aluminum with minimal loss and ensuring that it can be reused in new products.
In summary, different recovery methods are suited to different types of metals, with hydrometallurgical and pyrometallurgical processes being highly effective for many precious and valuable metals, while physical separation methods are particularly useful for ferrous metals and aluminum. The recovery of REEs still presents a challenge but offers significant potential for innovation with continued research into bio-metallurgy and other emerging techniques.
5.7. Challenges and Barriers of Mineral Recovery Processes from E-Waste
The challenges categorized into: (1) technical; (2) environmental; (3) occupational health and safety; (4) energy and climate impact; (5) waste management; and (6) efficiency and scalability are:
- Technical challenges related to complexity of material composition and the requirements of advanced recovery methods are: (a) The heterogeneous composition of E-waste and the miniaturization of components make the recovery of critical and precious minerals highly complex. Devices often contain multilayered structures, composite materials, and intricate alloys that are difficult to dismantle and separate efficiently; and (b) Techniques like hydrometallurgy, pyrometallurgy, and bioleaching are needed to extract valuable metals, each with their own technological limitations and process complexities.
- Environmental challenges concerning toxicity byproducts and chemical pollution, air pollution from high-temperature processes, and secondary waste stream management are (a) Hydrometallurgical processes use acids and cyanide-based solutions, generating hazardous liquid waste that risks soil and water contamination if mismanaged; (b) Pyrometallurgical techniques release toxic gases such as dioxins, sulfur dioxide, and heavy metal vapors, contributing to air pollution and long-term ecological damage, and (c) Processes generate residuals like slags, sludges, and spent acids that require careful disposal or treatment. Poor management can lead to heavy metal leaching into ecosystems.
- Occupational health and safety challenges involving exposure to hazardous substances, and health risks are: (a) Workers handling E-waste are at risk from toxic elements such as lead, mercury, arsenic, and brominated flame retardants, and (b) Improper handling can result in respiratory diseases, neurological disorders, and cancer. Ensuring adequate protection and proper handling protocols is critical for worker safety.
- Energy and climate impact in view of high energy consumption, and trade-offs of low-energy alternatives are: (a) Pyrometallurgical processes are energy-intensive, significantly contributing to GHG emissions and climate change, and (b) While bioleaching and electrochemical recovery are more energy-efficient, they are often slower and less effective in extracting metals, limiting industrial viability.
- Waste Management challenges relating to residual waste disposal, and lack of sustainable strategies are: (a) The byproducts of mineral recovery often require further treatment to prevent environmental contamination, and (b) Many current waste treatment methods are insufficiently sustainable, increasing the ecological burden of recycling operations.
- Efficiency and scalability challenges concerning low selectivity and purity, reliance on primary mining, scalability of emerging technologies, and balancing recovery and sustainability are: (a) Existing recovery methods often yield low-purity metals and suffer from inefficient selective separation, requiring additional refining, (b) Inefficiencies in recycling contribute to continued dependence on virgin resource extraction, (c) Biological techniques like bioleaching face hurdles such as slow reaction times, inconsistent yields, and limited scalability, posing challenges for industrial-scale adoption, and (d) Achieving high recovery rates while minimizing environmental harm and maintaining cost-effectiveness remains a persistent research and development hurdle.
Despite the potential of scaling technologies such as additive manufacturing (i.e., 3D printing) to minimize waste and enhance sustainability, significant challenges remain in their widespread adoption within a CE framework [116,117,118]. A key barrier to the full deployment of these technologies in waste management is the integration of Industry 4.0 solutions with CE principles [119,120]. To successfully transition to a CE in E-waste recycling, several key steps must be implemented:
- Advanced material separation technologies: Implementing innovative separation techniques such as hydrometallurgical and bioleaching processes can enhance the recovery of valuable metals and rare earth elements from E-waste. Additionally, the use of AI-powered robotic sorting systems can improve material classification and reduce contamination.
- Robust collection and reverse logistics networks: Establishing efficient take-back schemes and drop-off points for consumers, combined with digital tracking systems, can ensure higher recovery rates and minimize improper disposal.
- Economic incentives and policy measures: Governments and industry stakeholders should introduce financial incentives such as tax breaks, subsidies, and extended producer responsibility (EPR) programs to encourage manufacturers to design recyclable products and invest in CE initiatives.
- Industry collaboration and standardization: Strengthening partnerships among manufacturers, policymakers, and recyclers is crucial for developing unified standards for material recovery, ensuring consistency, and fostering innovation in recycling technologies.
By integrating these strategies, scalable and sustainable E-waste management systems can be developed. A closed-loop approach that continuously recovers and reuses materials will not only reduce dependence on virgin resources but also enhance both economic and environmental sustainability, driving the transition toward a CE.
6. Economics
The economic feasibility of E-waste recycling is shaped by multiple cost factors, including high capital investment, operational expenses, and uncertain market returns. Despite the potential value of recovered metals, E-waste recycling faces financial hurdles that hinder its large-scale adoption. Key factors influencing the economic viability of these processes include fluctuating metal prices, expensive recovery technologies, collection and transportation costs, labor expenses, and regulatory compliance requirements.
6.1. Investment Costs and Capital Expenditures
Setting up an E-waste recycling facility requires significant upfront investment in infrastructure, specialized equipment, and processing technologies. Automation and emerging technologies such as robotic disassembly, artificial intelligence (AI)-based sorting, and blockchain-enabled traceability offer long-term efficiency benefits but come with high initial investment costs. While these innovations improve material recovery rates and reduce manual labor dependency, the high cost of implementation makes them less accessible to smaller recycling enterprises, particularly in developing regions where investment capital is limited [121]. Advanced recovery methods, such as hydrometallurgy, pyrometallurgy, and bioleaching, necessitate sophisticated processing units, chemical treatment facilities, and emissions control systems, all of which contribute to high capital expenditures (CAPEX). Moreover, the cost of acquiring or retrofitting industrial spaces, ensuring proper waste handling measures, and obtaining necessary permits further increases the financial burden on recyclers. The estimated total initial investment ranges from $50,000 to $500,000, depending on scale and location [122].
6.2. Operational Costs and Ongoing Expenses
In addition to initial investments, E-waste recycling operations involve continuous expenses that affect profitability. Collection and transportation costs are major cost drivers, as E-waste must be gathered from various locations, often requiring specialized handling due to hazardous components such as batteries, heavy metals, and flame retardants. The logistics of collecting and safely transporting discarded electronics to processing centers can be costly, particularly in regions with poor waste collection infrastructure or fragmented supply chains.
Energy consumption is another significant operational cost, particularly for energy-intensive processes such as pyrometallurgical smelting and electrochemical metal recovery. High electricity and fuel costs can erode profit margins, making certain recycling methods financially unviable unless supplemented with renewable energy sources or government subsidies. Additionally, the cost of chemicals, reagents, and wastewater treatment in hydrometallurgical and bioleaching processes further adds to the total cost of operations (OPEX). The estimated OPEX ranges from $144,000 to $696,000 annually, depending on the scale of operations [122].
Labor expenses, particularly in countries with strict environmental and safety regulations, also contribute to high operating costs. Skilled workers are required for manual disassembly, sorting, and hazardous waste handling, making labor-intensive recycling methods more expensive. Typically, labor expenses account for 30% to 50% of total OPEX [122]. In contrast, informal sector recyclers, often operating in unregulated markets, may offer lower-cost alternatives but at the expense of worker safety, environmental protection, and material recovery efficiency. The utilities and facility management can represent 20% to 30% of OPEX, especially in energy-intensive operations [122]. These costs can be optimized by considering the following approaches [122]: (a) Energy efficiency: Invest in energy-efficient equipment and practices to reduce utility expenses; (b) Route optimization: Implement efficient logistics planning to minimize transportation costs; (c) Preventive maintenance: Regular equipment maintenance can prevent costly repairs and downtime; (d) Staff training: Well-trained staff can improve operational efficiency and reduce errors; and (e) Partnerships: Collaborate with local organizations for shared resources and community engagement.
A financial model tailored for setting up and operating an E-waste recycling facility in the United Arab Emirates (UAE),as an example, is given in Appendix A. This model includes CAPEX, OPEX, and revenue projections. It’s built for a small to medium-scale facility with capacity to process about 5,000–10,000 tons of E-waste annually. The CAPEX and OPEX are estimated at USD 1,327,000 and USD 613,000 per year, respectively. The total revenue is estimated at USD 1,525,000 per year. The net profit (year 1) is estimated at USD 912,000 and payback period is about 2 years. These costs can be reduced considering the following approaches: (a) Use of solar panels or renewable energy integration to reduce OPEX and carbon footprint; (b) Use of AI sorting systems to improve recovery efficiency and metal purity; (c) Partnership with manufacturers to guarantee inflow of waste and additional revenue from corporate social responsibility (CSR); and (d) Government incentives that may reduce initial capital requirements.
6.3. Market Volatility and Financial Returns
The profitability of E-waste recycling is highly dependent on fluctuating market prices for recovered metals such as gold, silver, copper, palladium, lithium, and REEs. Metal prices are influenced by global supply-demand dynamics, geopolitical factors, and macroeconomic conditions. When prices for primary raw materials are low, recycled metals become less competitive, making E-waste recycling financially unsustainable without government support or incentive programs. Additionally, the composition of E-waste is constantly evolving, with manufacturers using smaller amounts of valuable metals in newer devices while incorporating more composite materials and plastics that are harder to recycle. This trend reduces the economic yield per unit of processed E-waste, making it more difficult to achieve high recovery rates and profitability. Despite these challenges, financial incentives such as Extended Producer Responsibility (EPR) schemes, tax breaks, recycling subsidies, and material recovery credits can help bridge the cost gap and improve the economic outlook for E-waste recycling businesses. Governments and policymakers play a crucial role in leveling the playing field by introducing regulations that internalize the environmental costs of primary mining and promote the use of secondary raw materials from recycled E-waste.
6.4. Comparative Cost Advantage of Primary Mining vs. Recycling
The cost of primary mining for critical minerals varies significantly depending on several factors, including the type of mineral, geographic location, mine scale, ore grade, and infrastructure availability. Appendix B outlines a detailed summary of capital expenditures (CAPEX) and operating expenditures (OPEX) across various mining projects. According to the International Energy Agency (IEA) [123], meeting climate-aligned development scenarios will demand substantial mining investments. For instance: (a) Under the Announced Pledges Scenario (APS), approximately $590 billion in new capital investments is required between now and 2040, and (b) Under the more ambitious Net Zero Emissions by 2050 Scenario (NZE), capital requirements rise by around 30%, reaching nearly $800 billion by 2040. Among all critical minerals, copper represents the largest share of future investment, with required capital reaching $330 billion under APS and $490 billion under NZE. These growing figures reflect not only rising demand but also increasing costs per tonne of ore, largely due to declining ore quality and more complex extraction environments. To contextualize these facts, Table 7 provides a comparative analysis of critical mineral extraction via primary mining versus E-waste recycling, examining key dimensions such as cost, extraction efficiency, scalability, and environmental impact.
In summary, primary mining involves high upfront capital and operating costs, significant environmental degradation, and long lead times due to permitting and infrastructure development. The efficiency of metal extraction is often limited by low ore grades and declining resource quality. In contrast, e-waste recycling presents a cost-effective, energy-efficient, and environmentally sustainable alternative. With faster setup times, higher metal concentrations, and urban scalability, it offers compelling advantages—especially in resource-constrained or highly urbanized regions. While it may not fully replace traditional mining, e-waste recycling contributes meaningfully to resource security and supports the circular economy by reducing dependence on virgin raw materials.
A specific case in point is gold extraction, which clearly illustrates the economic advantage of e-waste recycling. Traditional gold ore contains only 5–10 grams per tonne, leading to extraction costs of approximately $30,000–$50,000 USD per kilogram. In comparison, printed circuit boards (PCBs) found in e-waste may contain 1,000–3,000 grams of gold per tonne, enabling more cost-effective recovery—estimated at just $10,000–$20,000 USD per kilogram when using advanced recycling technologies. This stark contrast underscores the growing viability and economic promise of urban mining for high-value metals.
6.5. Balancing Costs and Sustainable Growth
For E-waste recycling to become a viable and profitable industry, it is crucial to address cost inefficiencies and create financially sustainable business models. This requires a combination of technological advancements, policy interventions, and market-based incentives to reduce capital and operational costs while maximizing material recovery efficiency. Investments in automation, digitalization, and decentralized recycling hubs can help lower logistics costs, improve recovery rates, and enhance profitability.
Policymakers must also focus on leveling the economic playing field by integrating CE principles into regulatory frameworks, ensuring that recycled materials become a competitive alternative to newly mined resources. By implementing eco-design requirements, mandatory take-back schemes, and stricter enforcement of E-waste regulations, governments can help accelerate the transition toward a more financially sustainable and environmentally responsible E-waste management system.
7. Regulatory and Policy
The lack of uniform E-waste regulations across different regions significantly impedes global recycling efforts. Some countries have well-established EPR programs, which mandate a structured network for separate E-waste collection, efficient management systems, and monitoring tools. In contrast, other countries lack enforcement mechanisms, resulting in informal recycling practices and illegal E-waste exports [124]. Strengthening regulatory frameworks and fostering international collaboration are crucial for ensuring responsible E-waste management.
In Europe, all countries have legislation or policies governing E-waste [4]. Member states are required to extend the lifecycle of E-waste, implement separate collection systems, and meet specific recycling and treatment targets while combating illegal waste exports. The EU directive on E-waste [14] is founded on two key principles: EPR and the polluter pays principle (PPP). Under this directive, producers are accountable for the take-back and recycling of their products. However, inconsistencies in definitions have led to varied implementations across member states. Some enforce stringent controls on E-waste trafficking, while others adopt more flexible monitoring strategies. Despite the directive's goal of harmonizing E-waste management across Europe, these disparities create challenges for multinational manufacturers, who must navigate country-specific regulations rather than adhering to a unified framework [125].
In North America, neither the United States nor Canada has federal level E-waste regulations. Instead, E-waste management is governed at the state or provincial level. In the U.S., 25 states have enacted specific E-waste legislation, creating challenges for multi-state manufacturers like those faced by businesses operating across different EU member states [126]. In Canada, E-waste recycling is primarily managed by the private sector through provincial stewardship programs [127].
In Asia, of the 46 countries in the region, 29 lack national E-waste legislation [4]. China, the world's largest E-waste producer, also remains a major recipient of illegally imported E-waste, with an estimated 8 million tons entering the country annually [128,129]. India, on the other hand, has had E-waste-specific legislation since 2011, incorporating EPR principles [128]. The E-waste Management Rules [130,131] impose responsibilities on traders, producers, online retailers, and Producer Responsibility Organizations (PROs). In major Indian cities, E-waste recycling is an emerging and rapidly growing market [132]. The fragmented nature of global E-waste management and mineral recovery policies presents significant challenges in achieving harmonized regulations, efficient resource recovery, and sustainable environmental practices. Many nations have developed national policies tailored to their domestic industries, yet inconsistencies between local, regional, and international frameworks create regulatory loopholes that allow illegal exports, informal recycling, and environmentally harmful practices to persist. A more coherent global policy framework is essential to bridge these gaps and promote responsible E-waste recycling and mineral recovery.
Despite efforts from organizations like the Basel Convention on the Control of Transboundary Movements of Hazardous Wastes and Their Disposal, international cooperation on E-waste regulation remains uneven. One of the key challenges is disparities in enforcement—while the Basel Convention restricts hazardous waste exports, illegal E-waste shipments continue due to weak enforcement in some regions. Many developing countries still receive E-waste under the guise of "second-hand electronics" or "repairable goods," circumventing existing regulations. Another major gap is the lack of universal standards across nations. Countries have different definitions of E-waste, recycling targets, and disposal methods, leading to inconsistencies in compliance and enforcement. For example, some regions mandate EPR programs, requiring manufacturers to take back used electronics, while others lack infrastructure for collection and processing. This regulatory mismatch creates challenges for multinational corporations and recyclers operating across borders. Furthermore, technology transfer barriers prevent developing nations from adopting advanced recycling processes. Many of these countries lack access to state-of-the-art recycling technologies due to high costs, intellectual property restrictions, and limited financial incentives. Without the necessary infrastructure, low-income countries often rely on informal recycling, which poses significant environmental and health risks.
To improve policy alignment and promote sustainable E-waste recycling, strengthening international agreements is crucial. Updating the Basel Convention to enhance enforcement mechanisms would ensure that countries adopt uniform E-waste classifications, standardized reporting systems, and stricter penalties for non-compliance. In addition, expanding EPR programs globally would hold manufacturers accountable for end-of-life electronics, ensuring proper recycling and disposal regardless of where the products are sold. Another important step is the creation of global certification standards for E-waste recycling. Establishing a universally recognized "sustainable recycling certification" would help ensure that recyclers meet high environmental and safety standards while also promoting market incentives for compliance. Companies that adhere to these guidelines could gain access to global markets, while uncertified recyclers would face restrictions. Finally, enhancing technology transfer and capacity building in lower-income countries can help bridge the technological divide. Developed nations should support technology-sharing initiatives and investment partnerships to help emerging economies establish safe and efficient E-waste processing systems. Providing financial incentives, training programs, and infrastructure development assistance would ensure that all regions have access to sustainable recycling methods.
By aligning national policies with global frameworks, fostering cooperation through trade agreements, and incentivizing sustainable recycling practices, international policymakers can close regulatory gaps and promote a more responsible, equitable, and environmentally sound approach to E-waste management and mineral recovery.
8. Stakeholder Engagement
Low consumer awareness and limited access to proper recycling channels contribute to poor E-waste recovery rates. Many consumers are unaware of take-back programs or lack incentives to participate. Education campaigns, financial incentives, and convenient collection systems are essential to encourage responsible disposal and improve material recovery [133,134,135,136,137,138,139,140,141,142,143,144,145].
For example, in a study by Dhir et al. [137], adopting an extended Valence Theory (VT) framework, found several key factors influencing Japanese consumers' intentions to recycle E-waste. Firstly, perceived benefit demonstrated a positive association with recycling intentions, suggesting that consumers are more inclined to recycle when they recognize the advantages. Similarly, value compatibility and environmental concerns positively influenced the intention to recycle, indicating that alignment with personal values and awareness of environmental degradation are important motivators. Conversely, perceived risk and openness to change did not show significant associations with recycling intentions in this study. The extended VT model, incorporating these factors, explained 42% of the variance in recycling intentions. Furthermore, the study identified that contacting retailers/recycling centres and local government offices positively moderated the influence of value compatibility and environmental concerns/perceived benefit on recycling intentions. However, selling e-waste to the grey market negatively moderated the relationship between value compatibility and recycling intention. Notably, demographic variables did not significantly influence the intention to recycle e-waste. Despite these findings, the study presents several gaps. Firstly, it did not differentiate between various types of e-waste, which could have differing recycling behaviors associated with them. Secondly, the model only included specific values, and future research could incorporate other values such as altruistic and biospheric ones, potentially in combination with the Value-Belief-Norm (VBN) theory. The study also did not account for the impact of economic incentives like buy-back schemes. Methodologically, the cross-sectional online survey using self-reported data may introduce bias, and future longitudinal studies are suggested. The research focused solely on individual consumers, neglecting the e-waste generated by organizations. Finally, the generalizability of the findings is limited to developed countries with similar cultural values to Japan, suggesting a need for cross-country comparisons.
In a study by Almulhim [140], which was conducted in Dammam city, Saudi Arabia, it was revealed that while a significant portion of household respondents (65.0%) claimed awareness of E-waste, a larger percentage (69.8%) reported not having been adequately educated on its serious environmental implications. Consequently, common disposal practices involved storing E-waste at home (45%) or discarding it with regular household waste (32%). The study also identified the most common electronic devices in households as mobile phones (96%), TVs (79%), and laptops (71%). Despite the limited education, a notable majority (88.35%) expressed willingness to participate in E-waste management after gaining a proper understanding, and 91.2% supported the implementation of Extended Producer Responsibility (EPR) programs. However, statistical analysis indicated no remarkable changes in household awareness or willingness based on sociodemographic attributes such as gender, marital status, education level, or age. Despite these valuable insights, the study [140] acknowledges several gaps. Firstly, there was an absence of precise data on E-waste production, imports, sorting, reuse, and disposal in Saudi Arabia, which hinders the development of more accurate models and substantial conclusions. Secondly, the small sample size and its focus solely on Dammam city limit the generalizability of the findings to the entire nation. Furthermore, the research concentrated on households, neglecting the perspectives of other key stakeholders in the E-waste management chain. The study also notes a lack of longitudinal analysis to track changes in attitudes and behaviors over time. Finally, the authors highlight a discrepancy between behavioral research and the understanding of the technological and financial aspects of electronic product lifecycles and the circular economy within the Saudi Arabian context.
In another study by AbdulWaheed et al. [142], it was highlighted that attitudes, subjective norms, and perceived behavioral control significantly and positively influence E-waste recycling intentions among United Arab Emirates’ (UAE) residents. Furthermore, the study confirms that environmental consciousness strengthens the positive effect of attitudes on these recycling intentions. In terms of actual behavior, the research demonstrates that E-waste recycling intention positively impacts E-waste recycling behavior, and this relationship is further strengthened by the perceived infrastructure support available for recycling. Although the cost of recycling was found to negatively affect recycling behavior, its moderating effect on the intention-behavior link was not statistically significant. Overall, the study supports the applicability of the Theory of Planned Behavior in the context of E-waste recycling in the UAE and highlights the important roles of environmental consciousness and infrastructure support. Despite these insightful findings, the study acknowledges several limitations. Firstly, the research was conducted specifically within the UAE, where high levels of E-device consumption are prevalent, potentially influencing the general awareness of E-waste issues. Therefore, the generalizability of these findings to other contexts might require careful consideration. Secondly, the R-squared values for both recycling intention and behavior suggest that a considerable portion of the variance remains unexplained, indicating the influence of factors not included in the proposed model. Consequently, future research could explore other potential determinants of E-waste recycling intention and behavior, such as the psychological ownership of the environment and the practice of frugal consumption, to provide a more comprehensive understanding of this complex issue
Finally, the scoping review [145] reveals that current research on consumer behavior in handling Waste of Electrical and Electronic Equipment (WEEE) predominantly focuses on recycling and linear economy concepts like disposal and storage. Among the 9R framework (Refuse, Rethink, Reduce, Reuse, Repair, Refurbish, Remanufacture, Repurpose, Recycle), recycle is the most extensively studied strategy, while repair and reuse receive considerably less attention. The study also highlights a geographical bias, with a significant number of investigations conducted in China and India, while regions like Europe and North America are scarcely examined. Furthermore, the research identifies a "Circular Value Chain Blind Spot," indicating that recommendations for stakeholders in the electronics industry primarily target governments and businesses, despite consumers being recognized as crucial actors in the circular economy. The study [145] identifies several key research gaps. There is a notable underrepresentation of consumer-centric research across the broader spectrum of the 9R framework beyond recycling, including strategies related to smarter product use and extended product lifespan. Moreover, the lack of concrete consumer action strategies in the literature, with a primary emphasis on recommendations for governments and companies, represents a significant gap. The review also suggests a need for more differentiated research that considers the varying behaviors associated with different types of WEEE and the influence of cultural factors on consumer handling of electronic waste. Finally, the study points out the conceptual limitations of applying all 9R strategies directly to consumers in the WEEE sector
9. Synergistic Leverage for Sustainable E-waste Management
The below discussion addresses the central research question: "How can technological advancements, policy interventions, and stakeholder engagement be synergistically leveraged to bridge the existing gaps in E-waste management, thereby optimizing the recovery of critical and precious minerals and fostering a resilient CE for electronics?" The analysis of the proposed strategy for sustainable E-waste recycling reveals that a cohesive and interconnected approach across these three domains is crucial for effective and sustainable E-waste management.
9.1. Technological Advancements
Technological innovation forms a cornerstone of effective E-waste recycling. The results highlight significant potential in various processing methods and digital tools. Advanced recycling technologies, such as hydrometallurgical, bio-metallurgical, and pyrometallurgical processes, have demonstrated considerable potential in improving metal extraction efficiencies from E-waste. Hydrometallurgy, using chemicals to dissolve metals, can extract base metals and noble metals, and can be used in conjunction with solvent extraction and electrowinning for high purity recovery of metals like copper and REEs. Bio-metallurgical processes, such as bioleaching using microorganisms, offer an environmentally friendlier alternative for metal extraction, including from PCBs. Pyrometallurgy, involving high-temperature smelting, can be effective for certain metals, although it can be energy-intensive. The development and optimization of these technologies, including addressing reagent selection and waste management in hydrometallurgy, and improving microbial efficiency and scalability in bioleaching, are crucial.
On the other hand, utilizing industry 4.0 solutions (i.e., integration of digital technologies in recovery processes) offers significant opportunities for enhancing E-waste management. AI and machine learning (ML) can optimize leaching processes and improve the accuracy and robustness of automated disassembly and sorting using computer vision and deep learning. Robotics and automated disassembly can increase efficiency and reduce the hazards associated with manual dismantling. Internet of Things (IoT) and sensor-based monitoring can provide real-time data for process optimization. Digital twins can simulate and optimize recycling processes before physical implementation, enhancing efficiency and reducing risks. However, the full potential of these technological advancements can only be realized with supportive policy frameworks and active stakeholder engagement.
9.2. The Impact of Policy Interventions
Strategic policy interventions are essential to create an enabling environment for sustainable E-waste management. Examples are: (a) Implementing and effectively enforcing EPR programs holds producers accountable for the take-back and recycling of their products, incentivizing them to design for recyclability and invest in collection and treatment infrastructure. Inconsistencies in definitions and implementation across regions need to be addressed for greater effectiveness; (b) Clear and consistent regulatory frameworks at national and international levels are necessary to set recycling targets, ensure environmental compliance, and combat illegal waste exports. The Basel Convention plays a crucial role in regulating the transboundary movement of hazardous E-waste; (c) Deposit-refund schemes (DRS) have proven effective in increasing collection rates by assigning a monetary value to returned products. Other economic incentives, such as subsidies for sustainable recycling practices and taxes on unsustainable disposal methods, can further promote industry participation and consumer engagement.; and (d) The development of standardized recycling protocols can improve the efficiency and quality of material recovery processes. The effectiveness of these policies is contingent upon active participation from all stakeholders.
9.3. The Crucial Role of Stakeholder Engagement
Collaboration and participation across different stakeholder groups are vital for building a sustainable E-waste recycling ecosystem: (a) Beyond EPR schemes, manufacturers should be encouraged to incorporate recycled materials and modular designs and provide repair instructions and support services to extend product lifecycles and facilitate repair and reuse. Retailer take-back programs also provide convenient collection points for consumers; (b) Raising public awareness about the importance of proper E-waste disposal and providing convenient and accessible collection systems are crucial for increasing consumer participation in formal recycling programs. Understanding consumer behavior and motivations, as explored through models like the Theory of Planned Behavior (TPB) and the Norm Activation Model (NAM), is essential for designing effective engagement strategies; and (d) PPPs can leverage the resources and expertise of governments, businesses, and non-profit organizations to develop recycling infrastructure, improve waste collection systems, and formalize the informal E-waste sector. Integrating the informal sector is particularly important in developing economies.
The synergistic interaction of the three domains (i.e., technological advancements, policy interventions, and stakeholder engagement) is fundamental to achieving a resilient CE for electronics.
9.4. Proposed Implementation Roadmap
To effectively enhance the synergistic leverage for sustainable E-waste management, the proposed implementation roadmap (Table 8) can guide governments and industries. The first step is to invest in AI-powered recycling infrastructure to improve efficiency and material recovery. Next, EPR policies should be adopted to enforce manufacturer accountability. Consumer awareness campaigns should be strengthened through educational programs and incentives, encouraging responsible recycling behaviors. PPPs should be expanded to increase funding and infrastructure for E-waste management. Furthermore, eco-design regulations should be enforced to ensure that electronic products are built for longer life cycles and easier recycling. Lastly, businesses should be encouraged to incorporate recycled materials and modular designs, fostering a more sustainable electronics industry.
10. Conclusion and Future Outlook
The pressing global issue of escalating E-waste generation, evidenced by a rise from 35.8 Mt in year 2011 to a projected 74.7 Mt by year 2030, underscores the urgent need for effective management strategies, especially considering the alarmingly low global recycling rate of just 17.4% in year 2019. This stark disparity between E-waste generation and recovery efforts highlights significant gaps in current E-waste management systems. These gaps include regulatory and policy inconsistencies across regions, technological limitations in efficiently recovering all valuable materials, economic disincentives that render primary mining more competitive in certain contexts, and insufficient consumer awareness and participation in formal recycling programs. The prevalence of informal recycling practices and illegal E-waste exports further exacerbate these challenges, leading to environmental and health concerns.
Based on the analysis presented in the paper, several avenues for future research in the field of E-waste management and critical mineral recovery can be recommended. These areas aim to address existing gaps and enhance the transition towards a more sustainable and CE for electronics.
- (1)
- Addressing under-researched areas: The review of publications highlighted that topics such as public engagement and the institutional and legal structures governing E-waste practices, and digital technologies and automation in E-waste management. Future research could focus on gaining a deeper understanding of the complex global flow of E-waste, including the dynamics of illegal exports and the environmental and social impacts in receiving countries. Investigating the geochemical aspects of metals in E-waste and their potential long-term environmental consequences would also be valuable. Furthermore, exploring the specific role of E-waste recycling in supporting the clean energy transition and the material requirements of renewable energy technologies warrants further investigation.
- (2)
- Optimizing existing recovery technologies: While various technologies for mineral recovery exist, there is room for improvement and optimization. Future research should focus on: (a) Enhancing the selectivity and efficiency of hydrometallurgical processes while minimizing the use of hazardous chemicals and improving wastewater treatment methods. Research into greener leaching agents and more efficient solvent extraction techniques is needed; (b) Reducing the energy consumption and air pollutant emissions of pyrometallurgical processes through innovative furnace designs and advanced emission control technologies; (c) Improving the efficiency and scalability of bio-metallurgical approaches to make them more viable for industrial applications. This includes optimizing microbial activity and developing cost-effective bioreactor designs; and (d) Further developing and integrating electrochemical processes with other methods to achieve high-purity metal recovery with minimal environmental impact and lower energy requirements. Investigating novel electrode materials and cell designs could be beneficial.
- (3)
- Advancing automation and digitalization: The integration of Industry 4.0 solutions holds significant potential for E-waste management. Future research could focus on: (a) Developing more sophisticated AI and machine learning algorithms for improved automated disassembly and sorting of complex electronic devices; (b) Exploring the use of digital twins to simulate and optimize entire E-waste recycling processes before physical implementation, thereby enhancing efficiency and reducing risks; (c) Investigating the application of blockchain technology for enhancing the traceability and transparency of the E-waste supply chain; and (d) Addressing the significant gap between E-waste generation and recycling requires better collection systems. Future research could explore: (i) Developing and evaluating the effectiveness of different take-back schemes and deposit-refund systems in various socio-economic contexts; (ii) Investigating the role of digital technologies and IoT in optimizing reverse logistics networks and improving collection rates; and (iii) Identifying and addressing the barriers to consumer participation in formal recycling programs through behavioral studies and targeted interventions.
- (4)
- Policy and economic frameworks: Research into effective policy interventions and economic incentives is crucial for driving the CE for electronics. This includes: (a) Analyzing the impact and effectiveness of different EPR models and identifying best practices for implementation and enforcement. Research should address inconsistencies in definitions and implementation across regions; (b) Investigating the role of economic incentives, such as subsidies, tax breaks, and material recovery credits, in making E-waste recycling more financially competitive with primary mining; and (c) Developing harmonized international standards and regulations for E-waste management to combat illegal exports and promote responsible recycling practices globally.
By focusing on these research areas, the scientific community can contribute significantly to developing more sustainable, efficient, and economically viable solutions for managing the growing challenge of electronic waste and securing the supply of critical raw materials
Appendix A: E-Waste Recycling Financial Model for the United Arab Emirates (UAE)
1. Capital Expenditure (CAPEX)
| Item | Cost (USD) | Notes |
| Facility Setup (Lease + Modifications) | 218,000 | Includes electricals, ventilation, floor reinforcement, etc. |
| Processing Equipment | 817,000 | Shredders, eddy current separators, smelters, and crushers |
| Pollution Control & Waste Treatment | 109,000 | Fume scrubbers, liquid waste neutralization systems |
| Safety Equipment & PPE | 27,000 | For handling hazardous materials |
| Software & Digital Infrastructure | 41,000 | Inventory, traceability, compliance systems |
| Regulatory Licenses & Certifications | 20,000 | UAE environmental permits, EAD/ESMA approval |
| Vehicles (collection & transport) | 95,000 | 2 trucks and one support van |
| Total CAPEX | 1,327,000 |
2. Annual Operating Expenditure (OPEX)
| Item | Cost (USD/year) | Notes |
| Staff Salaries (12–15 staff) | 327,000 | Includes technical and admin staff |
| Facility Lease | 82,000 | Based on UAE industrial area average |
| Utilities (Power, Water) | 54,000 | Depends on energy use intensity |
| Maintenance & Repairs | 41,000 | Equipment upkeep |
| Waste Disposal Fees | 27,000 | Residuals from processing |
| Regulatory Compliance | 14,000 | Audits, reporting, testing |
| Transportation | 41,000 | Collection & logistics |
| Insurance | 11,000 | Property, liability, and worker safety |
| Marketing & Outreach | 16,000 | Community awareness, contracts |
| Total OPEX | 613,000 |
3. Revenue Projections (Annual)
| Revenue Stream | Amount (USD/year) | Assumptions |
| Precious Metal Recovery (Au, Ag, Pd, etc.) | 681,000 | From PCBs, connectors (based on market rates and yield) |
| Base Metal Sales (Cu, Al, Fe) | 490,000 | Shredded and sorted materials |
| Plastic & Secondary Sales | 82,000 | Sorted plastics and resins |
| Recycling Service Fees (corporate/govt) | 272,000 | Disposal and compliance services for institutions |
| Total Revenue | 1,525,000 |
4. Financial Summary (First Year)
| Metric | Amount (USD) |
| Total Capital Investment | 1,327,000 |
| Operating Cost (Year 1) | 613,000 |
| Total Revenue (Year 1) | 1,525,000 |
| Net Profit (Year 1) | 912,000 |
| Payback Period | ~2 years |
Appendix B: Estimated Costs for Primary Mining of Critical Minerals
The estimated costs for primary mining of critical minerals vary widely depending on factors such as the type of mineral, geographic location, mine size, ore grade, and infrastructure requirements. Below is a summary of CAPEX and OPEX expenditures for various mining projects:
1. Capital Expenditure (CAPEX)
| Project | Mineral | CAPEX (USD) | Notes |
| Cobre Panama | Copper | $10 billion | One of the largest foreign investments in Panama, processing 85–100 million tonnes of ore annually. |
| Reko Diq (Pakistan) | Copper & Gold | $5.6 billion | Revised from $4 billion; aims to process 45–90 million tonnes per year. |
| Oyu Tolgoi (Mongolia) | Copper & Gold | $10 billion | Costs escalated from an initial estimate of $4.6 billion; significant contributor to Mongolia's GDP. |
| Sentinel Mine (Zambia) | Copper | $2.3 billion | Produces approximately 300,000 tonnes of copper annually. |
| Falchani Project | Lithium | $2.57 billion | Total project capital cost over the life of mine. |
| Grasberg Mine (Indonesia) | Copper & Gold | $175 million | Initial construction cost in the 1970s; significant infrastructure development included. |
2. Operating Expenditure (OPEX)
| Project | Mineral | OPEX Estimate | Notes |
| Key Mining Corp. | Copper | $36.09 per tonne milled | Average operating cost over the life of mine, including mining, processing, and administrative expenses. |
| Australian Nickel Mining | Nickel | $20,000 per tonne | Higher production costs leading to competitiveness issues compared to Indonesian producers. |
| Indonesian Nickel Industry | Nickel | $5,000–$7,000 per tonne | Lower production costs due to technological advancements and significant investments. |
References
- Murthy, V.; Ramakrishna, S. A Review on Global E-Waste Management: Urban Mining towards a Sustainable Future and Circular Economy. Sustainability 2022, 14, 647. [Google Scholar] [CrossRef]
- UNEMG - Environment Management Group. A New Circular Vision for Electronics: Time for a Global Reboot. Geneva, Switzerland: World Economic Forum (WEF). 2019. https://www3.weforum.org/docs/WEF_A_New_Circular_Vision_for_Electronics.pdf (Accessed 17 April 2025).
- Elgarahy, A.M.; Eloffy, M.; Priya, A.; Hammad, A.; Zahran, M.; Maged, A.; Elwakeel, K.Z. Revitalizing the circular economy: An exploration of e-waste recycling approaches in a technological epoch. Sustain. Chem. Environ. 2024, 7. [Google Scholar] [CrossRef]
- Forti V, Baldé CP, Kuehr R, Bel G. The global E-waste monitor 2020. Bonn/Geneva/Rotterdam: United Nations University (UNU), International Telecommunication Union (ITU) & International Solid Waste Association (ISWA); 2020. p. 120. https://ewastemonitor.info/wp-content/uploads/2020/11/GEM_2020_def_july1_low.pdf (Accessed 17 April 2025).
- Paleologos, E.K.; O Mohamed, A.-M.; Singh, D.N.; O’kelly, B.C.; El Gamal, M.; Mohammad, A.; Singh, P.; Goli, V.S.N.S.; Roque, A.J.; A Oke, J.; et al. Sustainability challenges of clean-energy critical minerals: copper and rare earths. Environ. Geotech. 2024, 1–13. [Google Scholar] [CrossRef]
- Mohamed, A.M.O., Paleologos, E.K., Mohamed, D. , Fayad, A., Al Nahyan, M.T (2025). Critical Minerals Mining: A Path Toward Sustainable Resource Extraction and Aquatic Conservation; Preprints. [CrossRef]
- Kanwal, Q.; Li, J.; Zeng, X. Mapping Recyclability of Industrial Waste for Anthropogenic Circularity: A Circular Economy Approach. ACS Sustain. Chem. Eng. 2021, 9, 11927–11936. [Google Scholar] [CrossRef]
- Filho, W.L.; Kotter, R.; Özuyar, P.G.; Abubakar, I.R.; Eustachio, J.H.P.P.; Matandirotya, N.R. Understanding Rare Earth Elements as Critical Raw Materials. Sustainability 2023, 15, 1919. [Google Scholar] [CrossRef]
- Mohamed, A.M.O. Sustainable recovery of silver nanoparticles from electronic waste: applications and safety concerns. Acad. Eng. 2024, 1. [Google Scholar] [CrossRef]
- Kaya, M. Recovery of metals and nonmetals from electronic waste by physical and chemical recycling processes. Waste Manag. 2016, 57, 64–90. [Google Scholar] [CrossRef]
- Jadhao, P.R.; Ahmad, E.; Pant, K.; Nigam, K.D.P. Advancements in the field of electronic waste Recycling: Critical assessment of chemical route for generation of energy and valuable products coupled with metal recovery. Sep. Purif. Technol. 2022, 289. [Google Scholar] [CrossRef]
- Mohamed, A.M.O. Nexuses of critical minerals recovery from e-waste. Acad. Environ. Sci. Sustain. 2024, 1. [Google Scholar] [CrossRef]
- Serpe, A.; Purchase, D.; Bisschop, L.; Chatterjee, D.; De Gioannis, G.; Garelick, H.; Kumar, A.; Peijnenburg, W.J.G.M.; Piro, V.M.I.; Cera, M.; et al. 2002–2022: 20 years of e-waste regulation in the European Union and the worldwide trends in legislation and innovation technologies for a circular economy. RSC Sustain. 2024, 3, 1039–1083. [Google Scholar] [CrossRef]
- Directive 2012/19/EU of the European Parliament and of the Council of 4 July 2012 on waste electrical and electronic equipment (WEEE). Available from: https://eur-lex.europa.eu/legal-content/EN/TXT/PDF/?uri=CELEX:32012L0019.
- Althaf, S.; Babbitt, C.W.; Chen, R. The evolution of consumer electronic waste in the United States. J. Ind. Ecol. 2020, 25, 693–706. [Google Scholar] [CrossRef]
- IEA. The role of critical minerals in clean energy transitions. World Energy Outlook special report. Paris: International Energy Agency; 2022. 281p. https://www.iea.org/reports/the-role-of-critical-minerals-in-clean-energy-transitions.
- Müller, D.; Groves, D.I.; Santosh, M.; Yang, C.-X. Critical metals: Their applications with emphasis on the clean energy transition. Geosystems Geoenvironment 2024, 4. [Google Scholar] [CrossRef]
- Archer, R. 2020 - Geothermal Energy, Editor(s): Trevor M. Letcher, Future Energy (Third Edition), Elsevier, 2020, Pages 431-445, ISBN 9780081028865. [CrossRef]
- Zhang, D.; Kong, Q. Green energy transition and sustainable development of energy firms: An assessment of renewable energy policy. Energy Econ. 2022, 111. [Google Scholar] [CrossRef]
- Gielen, D., Lathwal, P., Lopez Rocha, S.C., 2023. Unleashing the Power of Hydrogen For the Clean Energy transition. Sustainable energy For All. World Bank Blogs. https://blogs.worldbank.org/en/energy/unleashing-power-hydrogen-clean-energy-transition (accessed 17 April 2025).
- European Commission, 2023. Study on the critical raw materials for the EU 2023: final report; https://single-market-economy.ec.europa.eu/publications/study-critical-raw-materials-eu-2023-final-report_en (accessed 17 April 2025).
- Fan, C.; Xu, C.; Shi, A.; Smith, M.P.; Kynicky, J.; Wei, C. Origin of heavy rare earth elements in highly fractionated peraluminous granites. Geochim. et Cosmochim. Acta 2022, 343, 371–383. [Google Scholar] [CrossRef]
- U.S. Geological Survey. Mineral Commodity Summaries. Indium (2023), pp. 88-89; https://www.usgs.gov/centers/national-minerals-information-center/mineral-commodity-summaries.
- Pandey, R.; Krmíček, L.; Müller, D.; Pandey, A.; Cucciniello, C. Alkaline rocks and their economic and geodynamic significance through geological time. Geol. Soc. London, Spéc. Publ. 2024, 551. [Google Scholar] [CrossRef]
- Pan, X.; Wong, C.W.; Li, C. Circular economy practices in the waste electrical and electronic equipment (WEEE) industry: A systematic review and future research agendas. J. Clean. Prod. 2022, 365. [Google Scholar] [CrossRef]
- Sun, Y. The use of aluminum alloys in structures: Review and outlook. Structures 2023, 57. [Google Scholar] [CrossRef]
- Anderson, C.G. Antimony production and commodities. In: mineral processing and extractive metallurgy handbook. Soc. Mining Metall. Expl. (SME) (2019), pp. 431-442; https://www.researchgate.net/publication/299133344_Antimony_Production_and_Commodites.
- Zhao, G.; Li, W.; Geng, Y.; Bleischwitz, R. Uncovering the features of global antimony resource trade network. Resour. Policy 2023, 85. [Google Scholar] [CrossRef]
- Sharma, H., Rawal, N., and Mathew, B. The characteristics, toxicity and effects of cadmium. Int. J. Nanotech. Nanosci., 3 (2015), pp. 1-9; https://www.researchgate.net/publication/305778858_The_characteristics_toxicity_and_effects_of_cadmium.
- Ahmad, N.I.; Kar, Y.B.; Doroody, C.; Kiong, T.S.; Rahman, K.S.; Harif, M.N.; Amin, N. A comprehensive review of flexible cadmium telluride solar cells with back surface field layer. Heliyon 2023, 9, e21622. [Google Scholar] [CrossRef]
- Bella, F.; Renzi, P.; Cavallo, C.; Gerbaldi, C. Caesium for Perovskite Solar Cells: An Overview. Chem. – A Eur. J. 2018, 24, 12183–12205. [Google Scholar] [CrossRef]
- Hines, B.R.; Turnbull, D.; Ashworth, L.; McKnight, S. Geochemical characteristics and structural setting of lithium–caesium–tantalum pegmatites of the Dorchap Dyke Swarm, northeast Victoria, Australia. Aust. J. Earth Sci. 2023, 70, 763–800. [Google Scholar] [CrossRef]
- Li, X.; Zhang, H.; Zhou, X.; Zhong, W. Research on the evolution of the global import and export competition network of chromium resources from the perspective of the whole industrial chain. Resour. Policy 2022, 79. [Google Scholar] [CrossRef]
- Brink, S.v.D.; Kleijn, R.; Sprecher, B.; Tukker, A. Identifying supply risks by mapping the cobalt supply chain. Resour. Conserv. Recycl. 2020, 156. [Google Scholar] [CrossRef]
- Savinova, E.; Evans, C.; Lèbre, É.; Stringer, M.; Azadi, M.; Valenta, R. Will global cobalt supply meet demand? The geological, mineral processing, production and geographic risk profile of cobalt. Resour. Conserv. Recycl. 2023, 190. [Google Scholar] [CrossRef]
- Zhang, W.; Zhao, L.; Wang, W.; Nechaev, V.P.; French, D.; Graham, I.; Lang, Y.; Li, Z.; Dai, S. Enrichment of critical metals (Li, Ga, and rare earth elements) in the early Permian coal seam from the Jincheng Coalfield, southeastern Qinshui Basin, northern China: With an emphasis on cookeite as the Li host. Ore Geol. Rev. 2024, 167. [Google Scholar] [CrossRef]
- Ahmad, S.; Steen, J.; Ali, S.; Valenta, R. Carbon-adjusted efficiency and technology gaps in gold mining. Resour. Policy 2023, 81. [Google Scholar] [CrossRef]
- Liu, S.; Geng, Y.; Gao, Z.; Li, J.; Xiao, S. Uncovering the key features of gold flows and stocks in China. Resour. Policy 2023, 82. [Google Scholar] [CrossRef]
- Yakubchuk, A. Russian gold mining: 1991 to 2021 and beyond. Ore Geol. Rev. 2023, 153. [Google Scholar] [CrossRef]
- Lin, S.; Mao, J.; Chen, W.; Shi, L. Indium in mainland China: Insights into use, trade, and efficiency from the substance flow analysis. Resour. Conserv. Recycl. 2019, 149, 312–321. [Google Scholar] [CrossRef]
- Kumar, A.A.; Sanislav, I.V.; Cathey, H.E.; Dirks, P.H.G.M. Geochemistry of indium in magmatic-hydrothermal tin and sulfide deposits of the Herberton Mineral Field, Australia. Miner. Deposita 2023, 58, 1297–1316. [Google Scholar] [CrossRef]
- He, X.; You, Y.; Li, W.; Cao, Y.; Bi, L.; Liu, Z.; Tan, S. The enrichment mechanism of indium in Fe-enriched sphalerite from the Bainiuchang Zn-Sn polymetallic deposit, SW China. Ore Geol. Rev. 2024, 167. [Google Scholar] [CrossRef]
- Cabello, J. Lithium brine production, reserves, resources and exploration in Chile: An updated review. Ore Geol. Rev. 2021, 128. [Google Scholar] [CrossRef]
- Meixner, A.; Alonso, R.N.; Lucassen, F.; Korte, L.; Kasemann, S.A. Lithium and Sr isotopic composition of salar deposits in the Central Andes across space and time: the Salar de Pozuelos, Argentina. Miner. Deposita 2021, 57, 255–278. [Google Scholar] [CrossRef]
- Hagelstein, K. Globally sustainable manganese metal production and use. J. Environ. Manag. 2009, 90, 3736–3740. [Google Scholar] [CrossRef]
- Sun, X.; Hao, H.; Liu, Z.; Zhao, F. Insights into the global flow pattern of manganese. Resour. Policy 2020, 65. [Google Scholar] [CrossRef]
- Henckens, M.; Driessen, P.; Worrell, E. Molybdenum resources: Their depletion and safeguarding for future generations. Resour. Conserv. Recycl. 2018, 134, 61–69. [Google Scholar] [CrossRef]
- Outteridge, T.; Kinsman, N.; Ronchi, G.; Mohrbacher, H. Editorial: Industrial relevance of molybdenum in China. Adv. Manuf. 2019, 8, 35–39. [Google Scholar] [CrossRef]
- Wang, X.; Wang, A.; Zhong, W.; Zhu, D.; Wang, C. Analysis of international nickel flow based on the industrial chain. Resour. Policy 2022, 77. [Google Scholar] [CrossRef]
- Dilshara, P.; Abeysinghe, B.; Premasiri, R.; Dushyantha, N.; Ratnayake, N.; Senarath, S.; Ratnayake, A.S.; Batapola, N. The role of nickel (Ni) as a critical metal in clean energy transition: applications, global distribution and occurrences, production-demand and phytomining. J. Asian Earth Sci. 2023, 259. [Google Scholar] [CrossRef]
- Cooper, J.; Beecham, J. A Study of Platinum Group Metals in Three-Way Autocatalysts. Platin. Met. Rev. 2013, 57, 281–288. [Google Scholar] [CrossRef]
- Nose, K., Okabe, T.H. (2024) Platinum group metals production. Treatise Process Metallurgy Vol. 3 Industrial Processes (2nd ed.): 751–770; 10.1016/B978-0-323-85373-6.00029-6.
- Dostal, J. Rare Earth Element Deposits of Alkaline Igneous Rocks. Resources 2017, 6, 34. [Google Scholar] [CrossRef]
- Wu, M., Qiu, K., Diao, X., Ma, J., Yu, H., An, M., Zhi, C., Krmicek, L., Deng, J. (2024) The giant Baerzhe REE-Nb-Zr-Be deposit, Inner Mongolia, China, an Early Cretaceous analogue of the Strange Lake rare-metal deposit, Quebec. In: Pandey, R., Pandey, A., Krmicek, L., Cucciniello, C., Müller, D. (Eds) Alkaline Rocks and Their Economic and Geodynamic Significance Through Geological Time. Geol. Soc. London Spec. Publ. 551 (in press).
- Funari, V.; Gomes, H.I.; Coppola, D.; Vitale, G.A.; Dinelli, E.; de Pascale, D.; Rovere, M. Opportunities and threats of selenium supply from unconventional and low-grade ores: A critical review. Resour. Conserv. Recycl. 2021, 170. [Google Scholar] [CrossRef]
- Liu, F.-W.; Cheng, T.-M.; Chen, Y.-J.; Yueh, K.-C.; Tang, S.-Y.; Wang, K.; Wu, C.-L.; Tsai, H.-S.; Yu, Y.-J.; Lai, C.-H.; et al. High-yield recycling and recovery of copper, indium, and gallium from waste copper indium gallium selenide thin-film solar panels. Sol. Energy Mater. Sol. Cells 2022, 241. [Google Scholar] [CrossRef]
- Kanellos, G.; Tremouli, A.; Tsakiridis, P.; Remoundaki, E.; Lyberatos, G. Silver Recovery from End-of-Life Photovoltaic Panels Based on Microbial Fuel Cell Technology. Waste Biomass- Valorization 2023, 15, 75–86. [Google Scholar] [CrossRef]
- Nassar, N.T.; Kim, H.; Frenzel, M.; Moats, M.S.; Hayes, S.M. Global tellurium supply potential from electrolytic copper refining. Resour. Conserv. Recycl. 2022, 184. [Google Scholar] [CrossRef]
- Katepalli, A.; Wang, Y.; Shi, D. Solar harvesting through multiple semi-transparent cadmium telluride solar panels for collective energy generation. Sol. Energy 2023, 264. [Google Scholar] [CrossRef]
- Lehmann, B. Formation of tin ore deposits: A reassessment. Lithos 2020, 402-403, 105756. [Google Scholar] [CrossRef]
- Li, H.; Qin, W.; Li, J.; Tian, Z.; Jiao, F.; Yang, C. Tracing the global tin flow network: highly concentrated production and consumption. Resour. Conserv. Recycl. 2021, 169. [Google Scholar] [CrossRef]
- Cui, C.; Hu, B.; Zhao, L.; Liu, S. Titanium alloy production technology, market prospects and industry development. Mater. Des. 2011, 32, 1684–1691. [Google Scholar] [CrossRef]
- Maldybayev, G.; Korabayev, A.; Sharipov, R.; Al Azzam, K.M.; Negim, E.-S.; Baigenzhenov, O.; Alimzhanova, A.; Panigrahi, M.; Shayakhmetova, R. Processing of titanium-containing ores for the production of titanium products: A comprehensive review. Heliyon 2024, 10, e24966. [Google Scholar] [CrossRef]
- Huang, J.; Ding, Q.; Wang, Y.; Hong, H.; Zhang, H. The evolution and influencing factors of international tungsten competition from the industrial chain perspective. Resour. Policy 2021, 73. [Google Scholar] [CrossRef]
- Peluzo, B.M.T.C.; Kraka, E. Uranium: The Nuclear Fuel Cycle and Beyond. Int. J. Mol. Sci. 2022, 23, 4655. [Google Scholar] [CrossRef]
- Polyak, D.E., 2019. Vanadium. https://minerals.usgs.gov/minerals/pubs/commodity/vanadium/mcs-2019-vanad.
- Petranikova, M.; Tkaczyk, A.; Bartl, A.; Amato, A.; Lapkovskis, V.; Tunsu, C. Vanadium sustainability in the context of innovative recycling and sourcing development. Waste Manag. 2020, 113, 521–544. [Google Scholar] [CrossRef] [PubMed]
- Ng, K.S.; Head, I.; Premier, G.C.; Scott, K.; Yu, E.; Lloyd, J.; Sadhukhan, J. A multilevel sustainability analysis of zinc recovery from wastes. Resour. Conserv. Recycl. 2016, 113, 88–105. [Google Scholar] [CrossRef]
- Rostek, L.; Pirard, E.; Loibl, A. The future availability of zinc: Potential contributions from recycling and necessary ones from mining. Resour. Conserv. Recycl. Adv. 2023, 19. [Google Scholar] [CrossRef]
- Müller, D., Groves, D. I., and Santosh, M. (2024). Metallic Mineral Resources: The Critical Components for a Sustainable Earth. University of Western Australia, 10.1016/C2023-0-51506-X.
- Nanjo, M., Urban mine, Bulletin of the Research Institute for Mineral Dressing and Metallurgy at Tohoku University, Tohoku University, 1987, pp 239–241. [CrossRef]
- Nakamura, T., and Halada, K. Urban Mining Systems, Springer Briefs in Applied Sciences and Technology, Springer, Japan, Tokyo, 2015. [CrossRef]
- Fornalczyk, A., Willner, J., Francuz, K., and Cebulski, J. (2013). E-waste as a source of valuable metals. October 2013. Archives of Materials Science and Engineering 63(2):87-92; http://www.amse.acmsse.h2.pl/vol63_2/6325.pdf.
- Baldé, C.P., Kuehr, R., Yamamoto, T., McDonald, R., D’Angelo, E., Althaf, S., Bel, G., Deubzer, O., Fernandez-Cubillo, E., Forti, V., Gray, V., Herat, S., Honda, S., Iattoni, G., Khetriwal, D.S., di Cortemiglia, V.L., Lobuntsova, Y., Nnorom, I., Pralat, N., and Wagner, M. (2024). International Telecommunication Union (ITU) and United Nations Institute for Training and Research (UNITAR). 2024. Global E-waste Monitor 2024. Geneva/Bonn. Pdf version: 978-92-61-38781-5; https://ewastemonitor.info/wp-content/uploads/2024/03/GEM_2024_18-03_web_page_per_page_web.pdf (accessed 17 April 2025).
- Rawat S, Verma L, Singh J. Environmental hazards and management of E-waste. Environmental concerns and sustainable development. Amsterdam: Springer; 2020. p.381–98.; 10.1007/978-981-13-6358-0_16.
- Ahirwar, R.; Tripathi, A.K. E-waste management: A review of recycling process, environmental and occupational health hazards, and potential solutions. Environ. Nanotechnology, Monit. Manag. 2021, 15. [Google Scholar] [CrossRef]
- Cucchiella, F.; D’adamo, I.; Koh, S.L.; Rosa, P. Recycling of WEEEs: An economic assessment of present and future e-waste streams. Renew. Sustain. Energy Rev. 2015, 51, 263–272. [Google Scholar] [CrossRef]
- Cui, J.; Zhang, L. Metallurgical recovery of metals from electronic waste: A review. J. Hazard. Mater. 2008, 158, 228–256. [Google Scholar] [CrossRef]
- Khaliq, A.; Rhamdhani, M.A.; Brooks, G.; Masood, S. Metal Extraction Processes for Electronic Waste and Existing Industrial Routes: A Review and Australian Perspective. Resources 2014, 3, 152–179. [Google Scholar] [CrossRef]
- Khaliq, A.; Rhamdhani, M.A.; Brooks, G.; Masood, S. Metal Extraction Processes for Electronic Waste and Existing Industrial Routes: A Review and Australian Perspective. Resources 2014, 3, 152–179. [Google Scholar] [CrossRef]
- Shokri, A.; Pahlevani, F.; Levick, K.; Cole, I.; Sahajwalla, V. Synthesis of copper-tin nanoparticles from old computer printed circuit boards. J. Clean. Prod. 2017, 142, 2586–2592. [Google Scholar] [CrossRef]
- Chauhan, G.; Jadhao, P.R.; Pant, K.; Nigam, K. Novel technologies and conventional processes for recovery of metals from waste electrical and electronic equipment: Challenges & opportunities – A review. J. Environ. Chem. Eng. 2018, 6, 1288–1304. [Google Scholar] [CrossRef]
- Rene, E.R.; Sethurajan, M.; Ponnusamy, V.K.; Kumar, G.; Dung, T.N.B.; Brindhadevi, K.; Pugazhendhi, A. Electronic waste generation, recycling and resource recovery: Technological perspectives and trends. J. Hazard. Mater. 2021, 416, 125664. [Google Scholar] [CrossRef]
- Palanisamy, M.M.; Myneni, V.R.; Gudeta, B.; Komarabathina, S. Toxic Metal Recovery from Waste Printed Circuit Boards: A Review of Advanced Approaches for Sustainable Treatment Methodology. Adv. Mater. Sci. Eng. 2022, 2022, 1–9. [Google Scholar] [CrossRef]
- Ramprasad, C.; Gwenzi, W.; Chaukura, N.; Azelee, N.I.W.; Rajapaksha, A.U.; Naushad, M.; Rangabhashiyam, S. Strategies and options for the sustainable recovery of rare earth elements from electrical and electronic waste. Chem. Eng. J. 2022, 442. [Google Scholar] [CrossRef]
- Battelle. United States Energy Association: critical material recovery from E-waste. Final report. Subagreement no. 633-2023-004-01; 2023. Available from: https://usea.org/sites/default/files/USEA633-2023-004-01_CMfromEwaste_FINAL_REPORT.
- Shahabuddin, M.; Uddin, M.N.; Chowdhury, J.I.; Ahmed, S.F.; Mofijur, M.; Uddin, M.A. A review of the recent development, challenges, and opportunities of electronic waste (e-waste). Int. J. Environ. Sci. Technol. 2022, 20, 4513–4520. [Google Scholar] [CrossRef]
- Zhang, L.; Xu, Z. A review of current progress of recycling technologies for metals from waste electrical and electronic equipment. J. Clean. Prod. 2016, 127, 19–36. [Google Scholar] [CrossRef]
- Zhan, L.; Xia, F.; Xia, Y.; Xie, B. Recycle Gallium and Arsenic from GaAs-Based E-Wastes via Pyrolysis–Vacuum Metallurgy Separation: Theory and Feasibility. ACS Sustain. Chem. Eng. 2017, 6, 1336–1342. [Google Scholar] [CrossRef]
- Faraji, F.; Golmohammadzadeh, R.; Pickles, C.A. Potential and current practices of recycling waste printed circuit boards: A review of the recent progress in pyrometallurgy. J. Environ. Manag. 2022, 316, 115242. [Google Scholar] [CrossRef]
- Huang, Y.-F.; Chou, S.-L.; Lo, S.-L. Gold recovery from waste printed circuit boards of mobile phones by using microwave pyrolysis and hydrometallurgical methods. Sustain. Environ. Res. 2022, 32, 1–11. [Google Scholar] [CrossRef]
- Tasker, P. A., McCleverty, J. A., Plieger, P. G., Meyer, T. J., and West, L. C. 9.17 Metal Complexes for Hydrometallurgy and Extraction, in Comprehensive Coordination Chemistry II, Elsevier, 2004, vol. 9, pp. 759–807.; https://www.academia.edu/79331550/Metal_Complexes_for_Hydrometallurgy_and_Extraction (accessed 17 April 2025).
- Akcil, A.; Erust, C.; Gahan, C.S.; Ozgun, M.; Sahin, M.; Tuncuk, A. Precious metal recovery from waste printed circuit boards using cyanide and non-cyanide lixiviants – A review. Waste Manag. 2015, 45, 258–271. [Google Scholar] [CrossRef]
- Tunsu, C.; Petranikova, M.; Gergorić, M.; Ekberg, C.; Retegan, T. Reclaiming rare earth elements from end-of-life products: A review of the perspectives for urban mining using hydrometallurgical unit operations. Hydrometallurgy 2015, 156, 239–258. [Google Scholar] [CrossRef]
- Xiu, F.-R.; Weng, H.; Qi, Y.; Yu, G.; Zhang, Z.; Zhang, F.-S.; Chen, M. A novel recovery method of copper from waste printed circuit boards by supercritical methanol process: Preparation of ultrafine copper materials. Waste Manag. 2017, 60, 643–651. [Google Scholar] [CrossRef]
- Tatariants, M.; Yousef, S.; Sakalauskaitė, S.; Daugelavičius, R.; Denafas, G.; Bendikiene, R. Antimicrobial copper nanoparticles synthesized from waste printed circuit boards using advanced chemical technology. Waste Manag. 2018, 78, 521–531. [Google Scholar] [CrossRef]
- Veglio, F., and Birloaga, I. (editors) Waste Electrical and Electronic Equipment Recycling: Aqueous Recovery Methods, Woodhead Publishing Series in Electronic and Optical Materials, Woodhead Publishing is an imprint of Elsevier, Duxford, United Kingdom; Cambridge, MA, United States, 2018a, I. (editors) Waste Electrical and Electronic Equipment Recycling: Aqueous Recovery Methods, Woodhead Publishing Series in Electronic and Optical Materials, Woodhead Publishing is an imprint of Elsevier, Duxford, United Kingdom; Cambridge, MA, United States, 2018; 10.1016/B978-0-08-102057-9.
- Yousef, S.; Tatariants, M.; Makarevičius, V.; Lukošiūtė, S.-I.; Bendikiene, R.; Denafas, G. A strategy for synthesis of copper nanoparticles from recovered metal of waste printed circuit boards. J. Clean. Prod. 2018, 185, 653–664. [Google Scholar] [CrossRef]
- Chen, Y.; Shang, H.; Ren, Y.; Yue, Y.; Li, H.; Bian, Z. Systematic Assessment of Precious Metal Recovery to Improve Environmental and Resource Protection. ACS ES&T Eng. 2022, 2, 1039–1052. [Google Scholar] [CrossRef]
- Nan, T.; Yang, J.; Aromaa-Stubb, R.; Zhu, Q.; Lundström, M. Process simulation and life cycle assessment of hydrometallurgical recycling routes of waste printed circuit boards. J. Clean. Prod. 2023, 435. [Google Scholar] [CrossRef]
- Pant, D.; Joshi, D.; Upreti, M.K.; Kotnala, R.K. Chemical and biological extraction of metals present in E waste: A hybrid technology. Waste Manag. 2012, 32, 979–990. [Google Scholar] [CrossRef]
- Villares, M.; Işıldar, A.; Beltran, A.M.; Guinee, J. Applying an ex-ante life cycle perspective to metal recovery from e-waste using bioleaching. J. Clean. Prod. 2016, 129, 315–328. [Google Scholar] [CrossRef]
- Brown, R.M.; Mirkouei, A.; Reed, D.; Thompson, V. Current nature-based biological practices for rare earth elements extraction and recovery: Bioleaching and biosorption. Renew. Sustain. Energy Rev. 2022, 173. [Google Scholar] [CrossRef]
- Ji, X.; Yang, M.; Wan, A.; Yu, S.; Yao, Z. Bioleaching of Typical Electronic Waste—Printed Circuit Boards (WPCBs): A Short Review. Int. J. Environ. Res. Public Heal. 2022, 19, 7508. [Google Scholar] [CrossRef]
- Mokarian, P.; Bakhshayeshi, I.; Taghikhah, F.; Boroumand, Y.; Erfani, E.; Razmjou, A. The advanced design of bioleaching process for metal recovery: A machine learning approach. Sep. Purif. Technol. 2022, 291. [Google Scholar] [CrossRef]
- Yaashikaa, P.; Priyanka, B.; Kumar, P.S.; Karishma, S.; Jeevanantham, S.; Indraganti, S. A review on recent advancements in recovery of valuable and toxic metals from e-waste using bioleaching approach. Chemosphere 2022, 287. [Google Scholar] [CrossRef]
- Nithya, R.; Sivasankari, C.; Thirunavukkarasu, A. Electronic waste generation, regulation and metal recovery: a review. Environ. Chem. Lett. 2020, 19, 1347–1368. [Google Scholar] [CrossRef]
- Chatterjee, A.; Das, R.; Abraham, J. Bioleaching of heavy metals from spent batteries using Aspergillus nomius JAMK1. Int. J. Environ. Sci. Technol. 2019, 17, 49–66. [Google Scholar] [CrossRef]
- Kafle, A.; Timilsina, A.; Gautam, A.; Adhikari, K.; Bhattarai, A.; Aryal, N. Phytoremediation: Mechanisms, plant selection and enhancement by natural and synthetic agents. Environ. Adv. 2022, 8. [Google Scholar] [CrossRef]
- Xiu, F.-R.; Zhang, F.-S. Preparation of nano-Cu2O/TiO2 photocatalyst from waste printed circuit boards by electrokinetic process. J. Hazard. Mater. 2009, 172, 1458–1463. [Google Scholar] [CrossRef]
- Murali, A.; Zhang, Z.; E Shine, A.; Free, M.L.; Sarswat, P.K. E-wastes derived sustainable Cu recovery using solvent extraction and electrowinning followed by thiosulfate-based gold and silver extraction. J. Hazard. Mater. Adv. 2022, 8. [Google Scholar] [CrossRef]
- Mahyapour, H.; Mohammadnejad, S. Optimization of the operating parameters in gold electro-refining. Miner. Eng. 2022, 186. [Google Scholar] [CrossRef]
- Italimpianti, n.d ; https://www.italimpianti.it/en/catalogue/refining/precious-metals-electrolysis/electrolytic-gold-refining-plant-type-iao-a (accessed 24 February 2025).
- Jo, S.; Kadam, R.; Jang, H.; Seo, D.; Park, J. Recent Advances in Wastewater Electrocoagulation Technologies: Beyond Chemical Coagulation. Energies 2024, 17, 5863. [Google Scholar] [CrossRef]
- Al-Ajmi, F.; Al-Marri, M.; Almomani, F. Electrocoagulation Process as an Efficient Method for the Treatment of Produced Water Treatment for Possible Recycling and Reuse. Water 2024, 17, 23. [Google Scholar] [CrossRef]
- Praveena, B.A., Lokesh, N., Buradi, A., Santhosh, N., Praveena, B.L., Vignesh, R., 2022. A comprehensive review of emerging additive manufacturing (3D printing technology): Methods, materials, applications, challenges, trends and future potential. Mater. Today.: Proc. 52, 1309–1313. [CrossRef]
- Al Rashid, A.; Koç, M. Additive manufacturing for sustainability and circular economy: needs, challenges, and opportunities for 3D printing of recycled polymeric waste. Mater. Today Sustain. 2023, 24. [Google Scholar] [CrossRef]
- Valera, E.H.; Cremades, R.; van Leeuwen, E.; van Timmeren, A. Additive manufacturing in cities: Closing circular resource loops. Circ. Econ. 2023, 2. [Google Scholar] [CrossRef]
- Kamble, S.S.; Gunasekaran, A. Analysing the role of Industry 4.0 technologies and circular economy practices in improving sustainable performance in Indian manufacturing organisations. Prod. Plan. Control. 2021, 34, 887–901. [Google Scholar] [CrossRef]
- Karmaker, C.L.; Al Aziz, R.; Ahmed, T.; Misbauddin, S.; Moktadir, A. Impact of industry 4.0 technologies on sustainable supply chain performance: The mediating role of green supply chain management practices and circular economy. J. Clean. Prod. 2023, 419. [Google Scholar] [CrossRef]
- Tabelin, C.B.; Park, I.; Phengsaart, T.; Jeon, S.; Villacorte-Tabelin, M.; Alonzo, D.; Yoo, K.; Ito, M.; Hiroyoshi, N. Copper and critical metals production from porphyry ores and E-wastes: A review of resource availability, processing/recycling challenges, socio-environmental aspects, and sustainability issues. Resour. Conserv. Recycl. 2021, 170. [Google Scholar] [CrossRef]
- https://businessplan-templates.com/blogs/running-costs/e-waste-recycling?utm.
- https://www.iea.org/reports/global-critical-minerals-outlook-2024/outlook-for-key-minerals?
- Escobar-Pemberthy, N.; Ivanova, M. Implementation of Multilateral Environmental Agreements: Rationale and Design of the Environmental Conventions Index. Sustainability 2020, 12, 7098. [Google Scholar] [CrossRef]
- Andersen, T. A comparative study of national variations of the European WEEE directive: manufacturer’s view. Environ. Sci. Pollut. Res. 2021, 29, 19920–19939. [Google Scholar] [CrossRef]
- Schumacher, K.A.; Agbemabiese, L. E-waste legislation in the US: An analysis of the disparate design and resulting influence on collection rates across States. J. Environ. Plan. Manag. 2020, 64, 1067–1088. [Google Scholar] [CrossRef]
- Shittu, O.S.; Williams, I.D.; Shaw, P.J. Global E-waste management: Can WEEE make a difference? A review of e-waste trends, legislation, contemporary issues and future challenges. Waste Manag. 2021, 120, 549–563. [Google Scholar] [CrossRef]
- Illes, A. , Geeraerts, K., and Schweizer, J.-P. Illegal Shipment of E-waste from the EU: A Case Study on Illegal E-waste Export from the EU to China, 2015. https://www.ecologic.eu/sites/default/files/publication/2015/efface_illegal_shipment_of_e_waste_from_the_eu_0. 17 April.
- Patil, R.A.; Ramakrishna, S. A comprehensive analysis of e-waste legislation worldwide. Environ. Sci. Pollut. Res. 2020, 27, 14412–14431. [Google Scholar] [CrossRef] [PubMed]
- E-waste Management Rules, 2016, https://jaipurmc.org/PDF/Auction_MM_RTI_Act_Etc_PDF/E-WASTE%20MANAGMENT%20RULES%202016. 17 April.
- E-waste Management Rules, 2022; https://cpcb.nic.in/rules-6/ (accessed ). 17 April.
- Bagwan, W.A. Electronic waste (E-waste) generation and management scenario of India, and ARIMA forecasting of E-waste processing capacity of Maharashtra state till 2030. Waste Manag. Bull. 2023, 1, 41–51. [Google Scholar] [CrossRef]
- Borthakur, A.; Govind, M. Emerging trends in consumers’ E-waste disposal behaviour and awareness: A worldwide overview with special focus on India. Resour. Conserv. Recycl. 2017, 117, 102–113. [Google Scholar] [CrossRef]
- Kianpour, K.; Jusoh, A.; Mardani, A.; Streimikiene, D.; Cavallaro, F.; Nor, K.M.; Zavadskas, E.K. Factors Influencing Consumers’ Intention to Return the End of Life Electronic Products through Reverse Supply Chain Management for Reuse, Repair and Recycling. Sustainability 2017, 9, 1657. [Google Scholar] [CrossRef]
- Pérez-Belis, V.; Braulio-Gonzalo, M.; Juan, P.; Bovea, M.D. Consumer attitude towards the repair and the second-hand purchase of small household electrical and electronic equipment. A Spanish case study. J. Clean. Prod. 2017, 158, 261–275. [Google Scholar] [CrossRef]
- Attia, Y.; Soori, P.K.; Ghaith, F. Analysis of Households’ E-Waste Awareness, Disposal Behavior, and Estimation of Potential Waste Mobile Phones towards an Effective E-Waste Management System in Dubai. Toxics 2021, 9, 236. [Google Scholar] [CrossRef]
- Dhir, A.; Malodia, S.; Awan, U.; Sakashita, M.; Kaur, P. Extended valence theory perspective on consumers' e-waste recycling intentions in Japan. J. Clean. Prod. 2021, 312. [Google Scholar] [CrossRef]
- Nanath, K.; Kumar, S.A. The role of communication medium in increasing e-waste recycling awareness among higher educational institutions. Int. J. Sustain. High. Educ. 2021, 22, 833–853. [Google Scholar] [CrossRef]
- Thukral, S.; Shree, D.; Singhal, S. Consumer behaviour towards storage, disposal and recycling of e-waste: systematic review and future research prospects. Benchmarking: Int. J. 2022, 30, 1021–1072. [Google Scholar] [CrossRef]
- Almulhim, A.I. Household's awareness and participation in sustainable electronic waste management practices in Saudi Arabia. Ain Shams Eng. J. 2022, 13. [Google Scholar] [CrossRef]
- Gilal, F.G.; Shah, S.M.M.; Adeel, S.; Gilal, R.G.; Gilal, N.G. Consumer e-waste disposal behaviour: A systematic review and research agenda. Int. J. Consum. Stud. 2021, 46, 1785–1803. [Google Scholar] [CrossRef]
- Waheed, K.A.; Singh, A.; Siddiqua, A.; El Gamal, M.; Laeequddin, M. E-Waste Recycling Behavior in the United Arab Emirates: Investigating the Roles of Environmental Consciousness, Cost, and Infrastructure Support. Sustainability 2023, 15, 14365. [Google Scholar] [CrossRef]
- Lyu T, Chen H, Guo YL. Investigating innovation diffusion, social influence, and personal inner forces to understand people’s participation in online E-waste recycling. J Retail Consum Serv. 2023;73:103366. [CrossRef]
- Nadarajan, P.; Vafaei-Zadeh, A.; Hanifah, H.; Thurasamay, R. Sustaining the environment through e-waste recycling: an extended valence theory perspective. Aslib J. Inf. Manag. 2023, 76, 1059–1087. [Google Scholar] [CrossRef]
- Hunger, T.; Arnold, M.; Ulber, M. Circular value chain blind spot – A scoping review of the 9R framework in consumption. J. Clean. Prod. 2024, 440. [Google Scholar] [CrossRef]
Figure 1.
Natural resources of some selected minerals: (A) Quantities and annual consumption rate; and (B) Depletion rate.
Figure 1.
Natural resources of some selected minerals: (A) Quantities and annual consumption rate; and (B) Depletion rate.
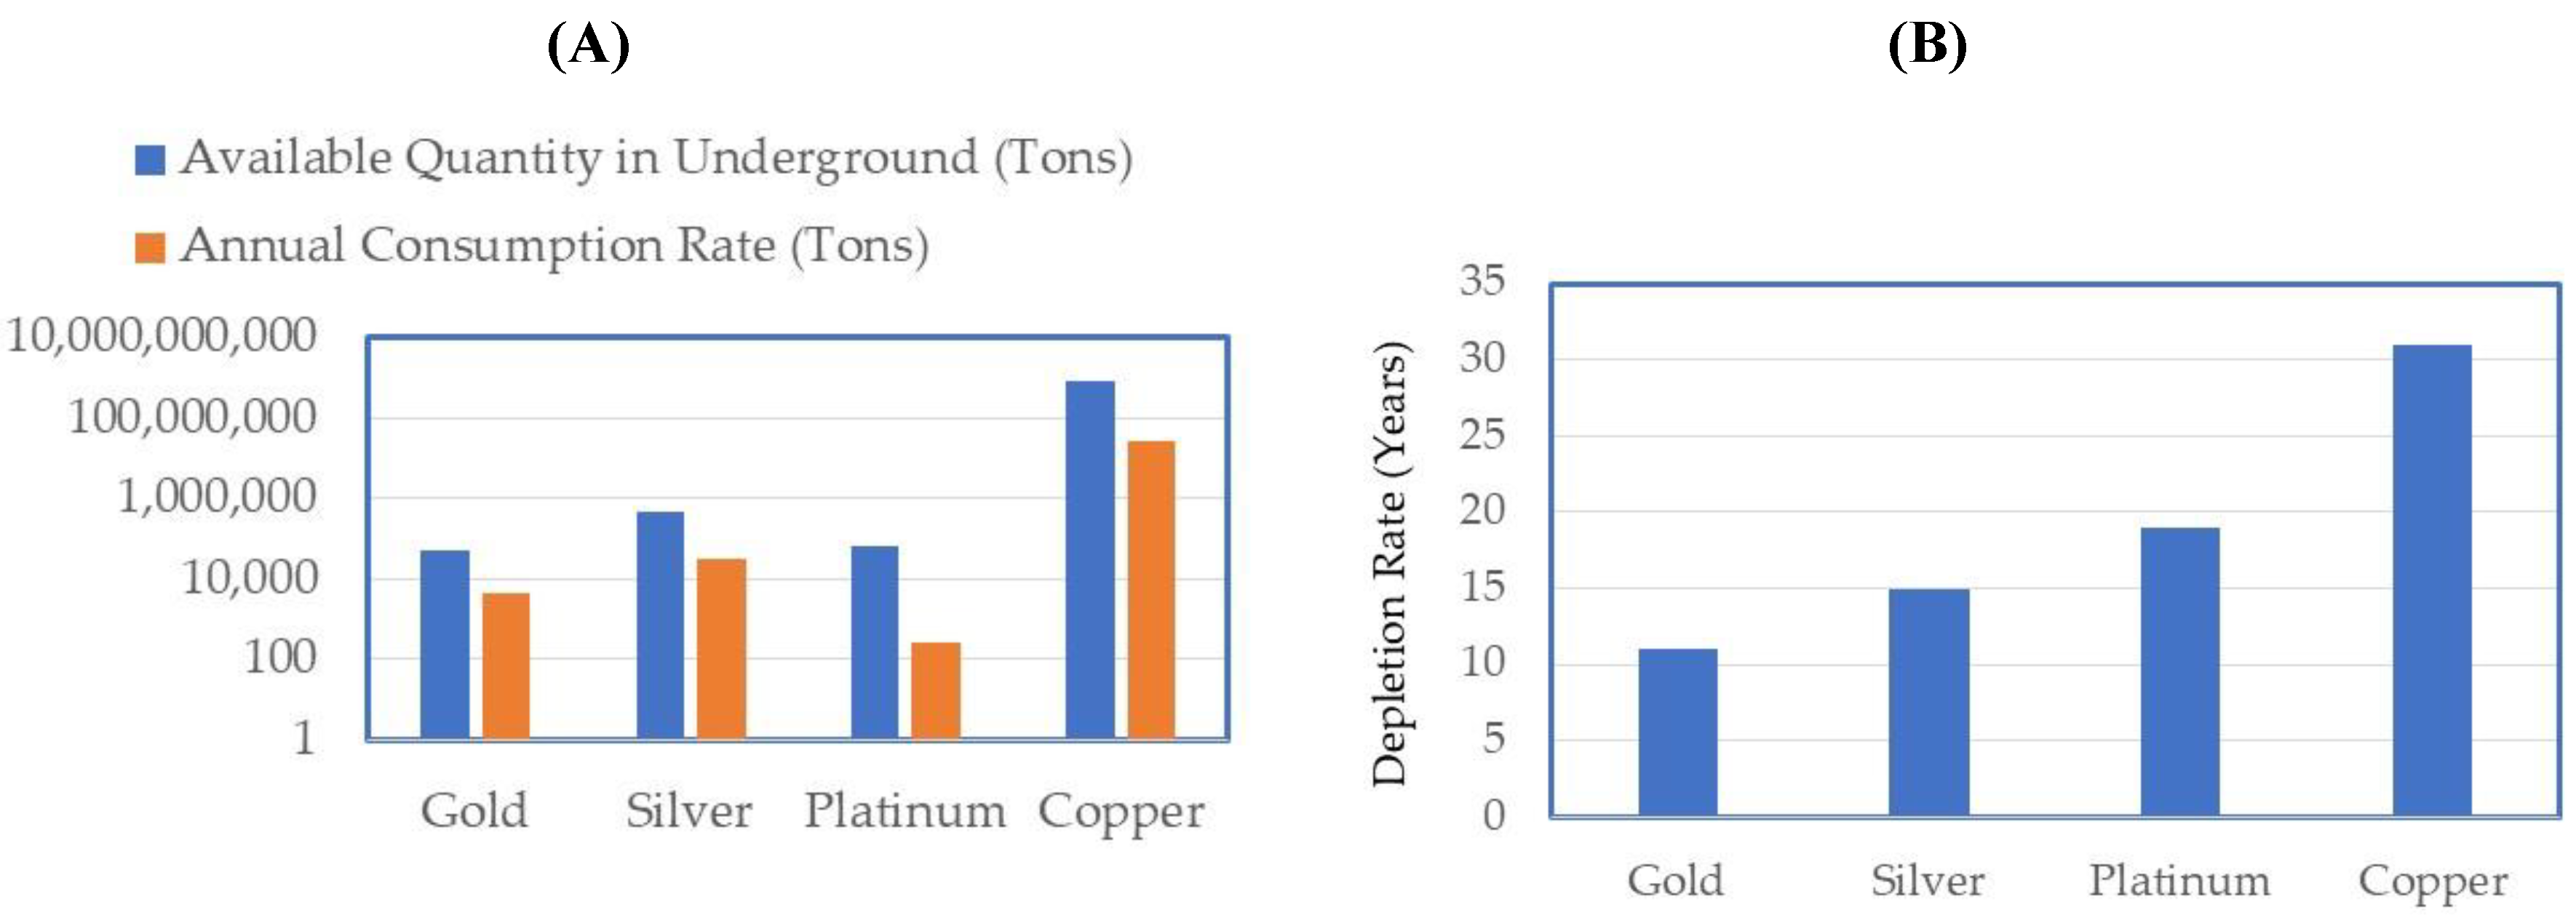
Figure 3.
PRISMA-ScR-inspired flow chart.
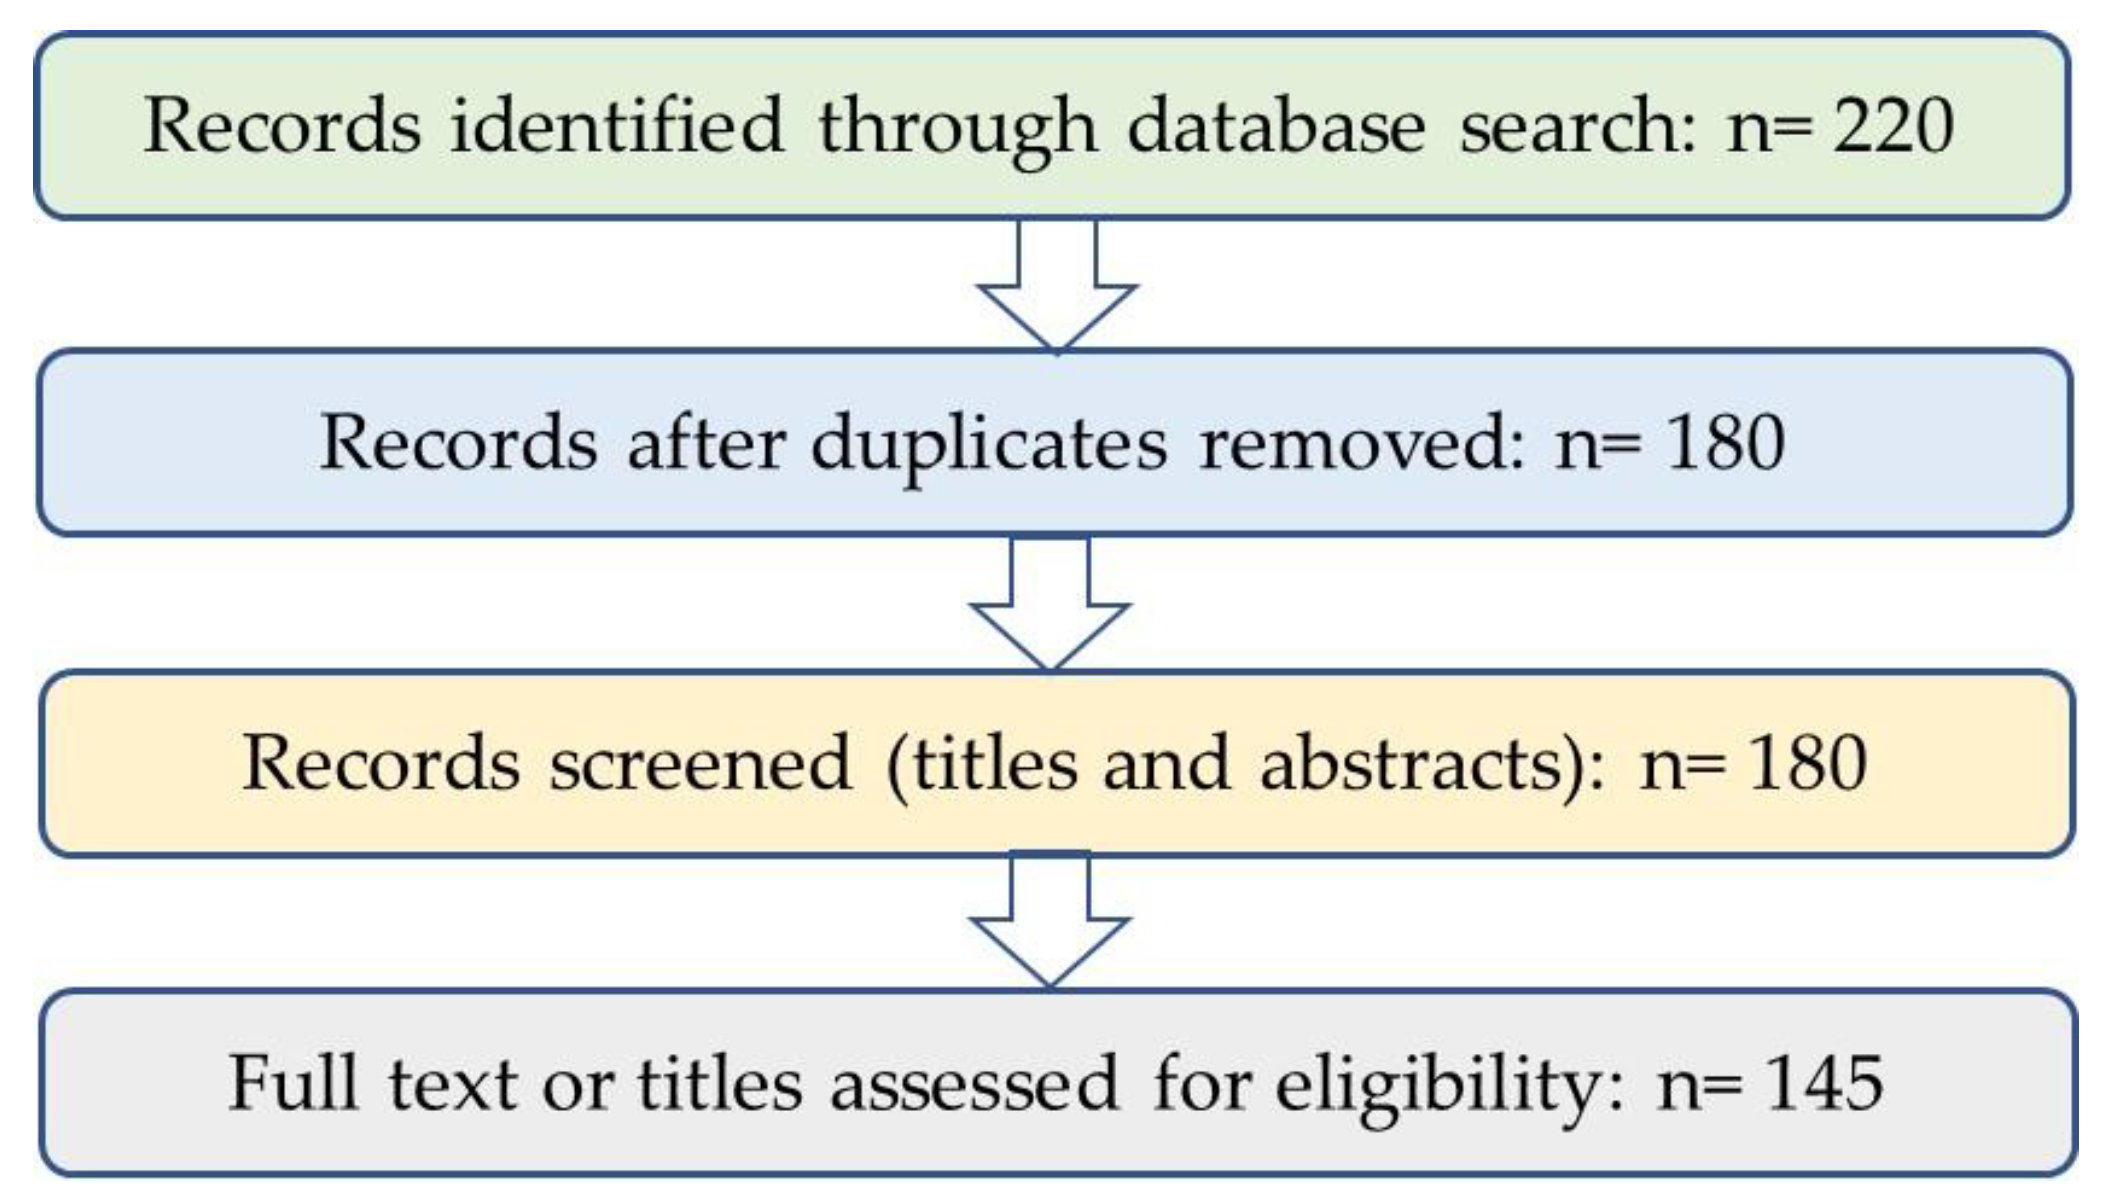
Figure 4.
Number of publications of key subjects covered in the review.
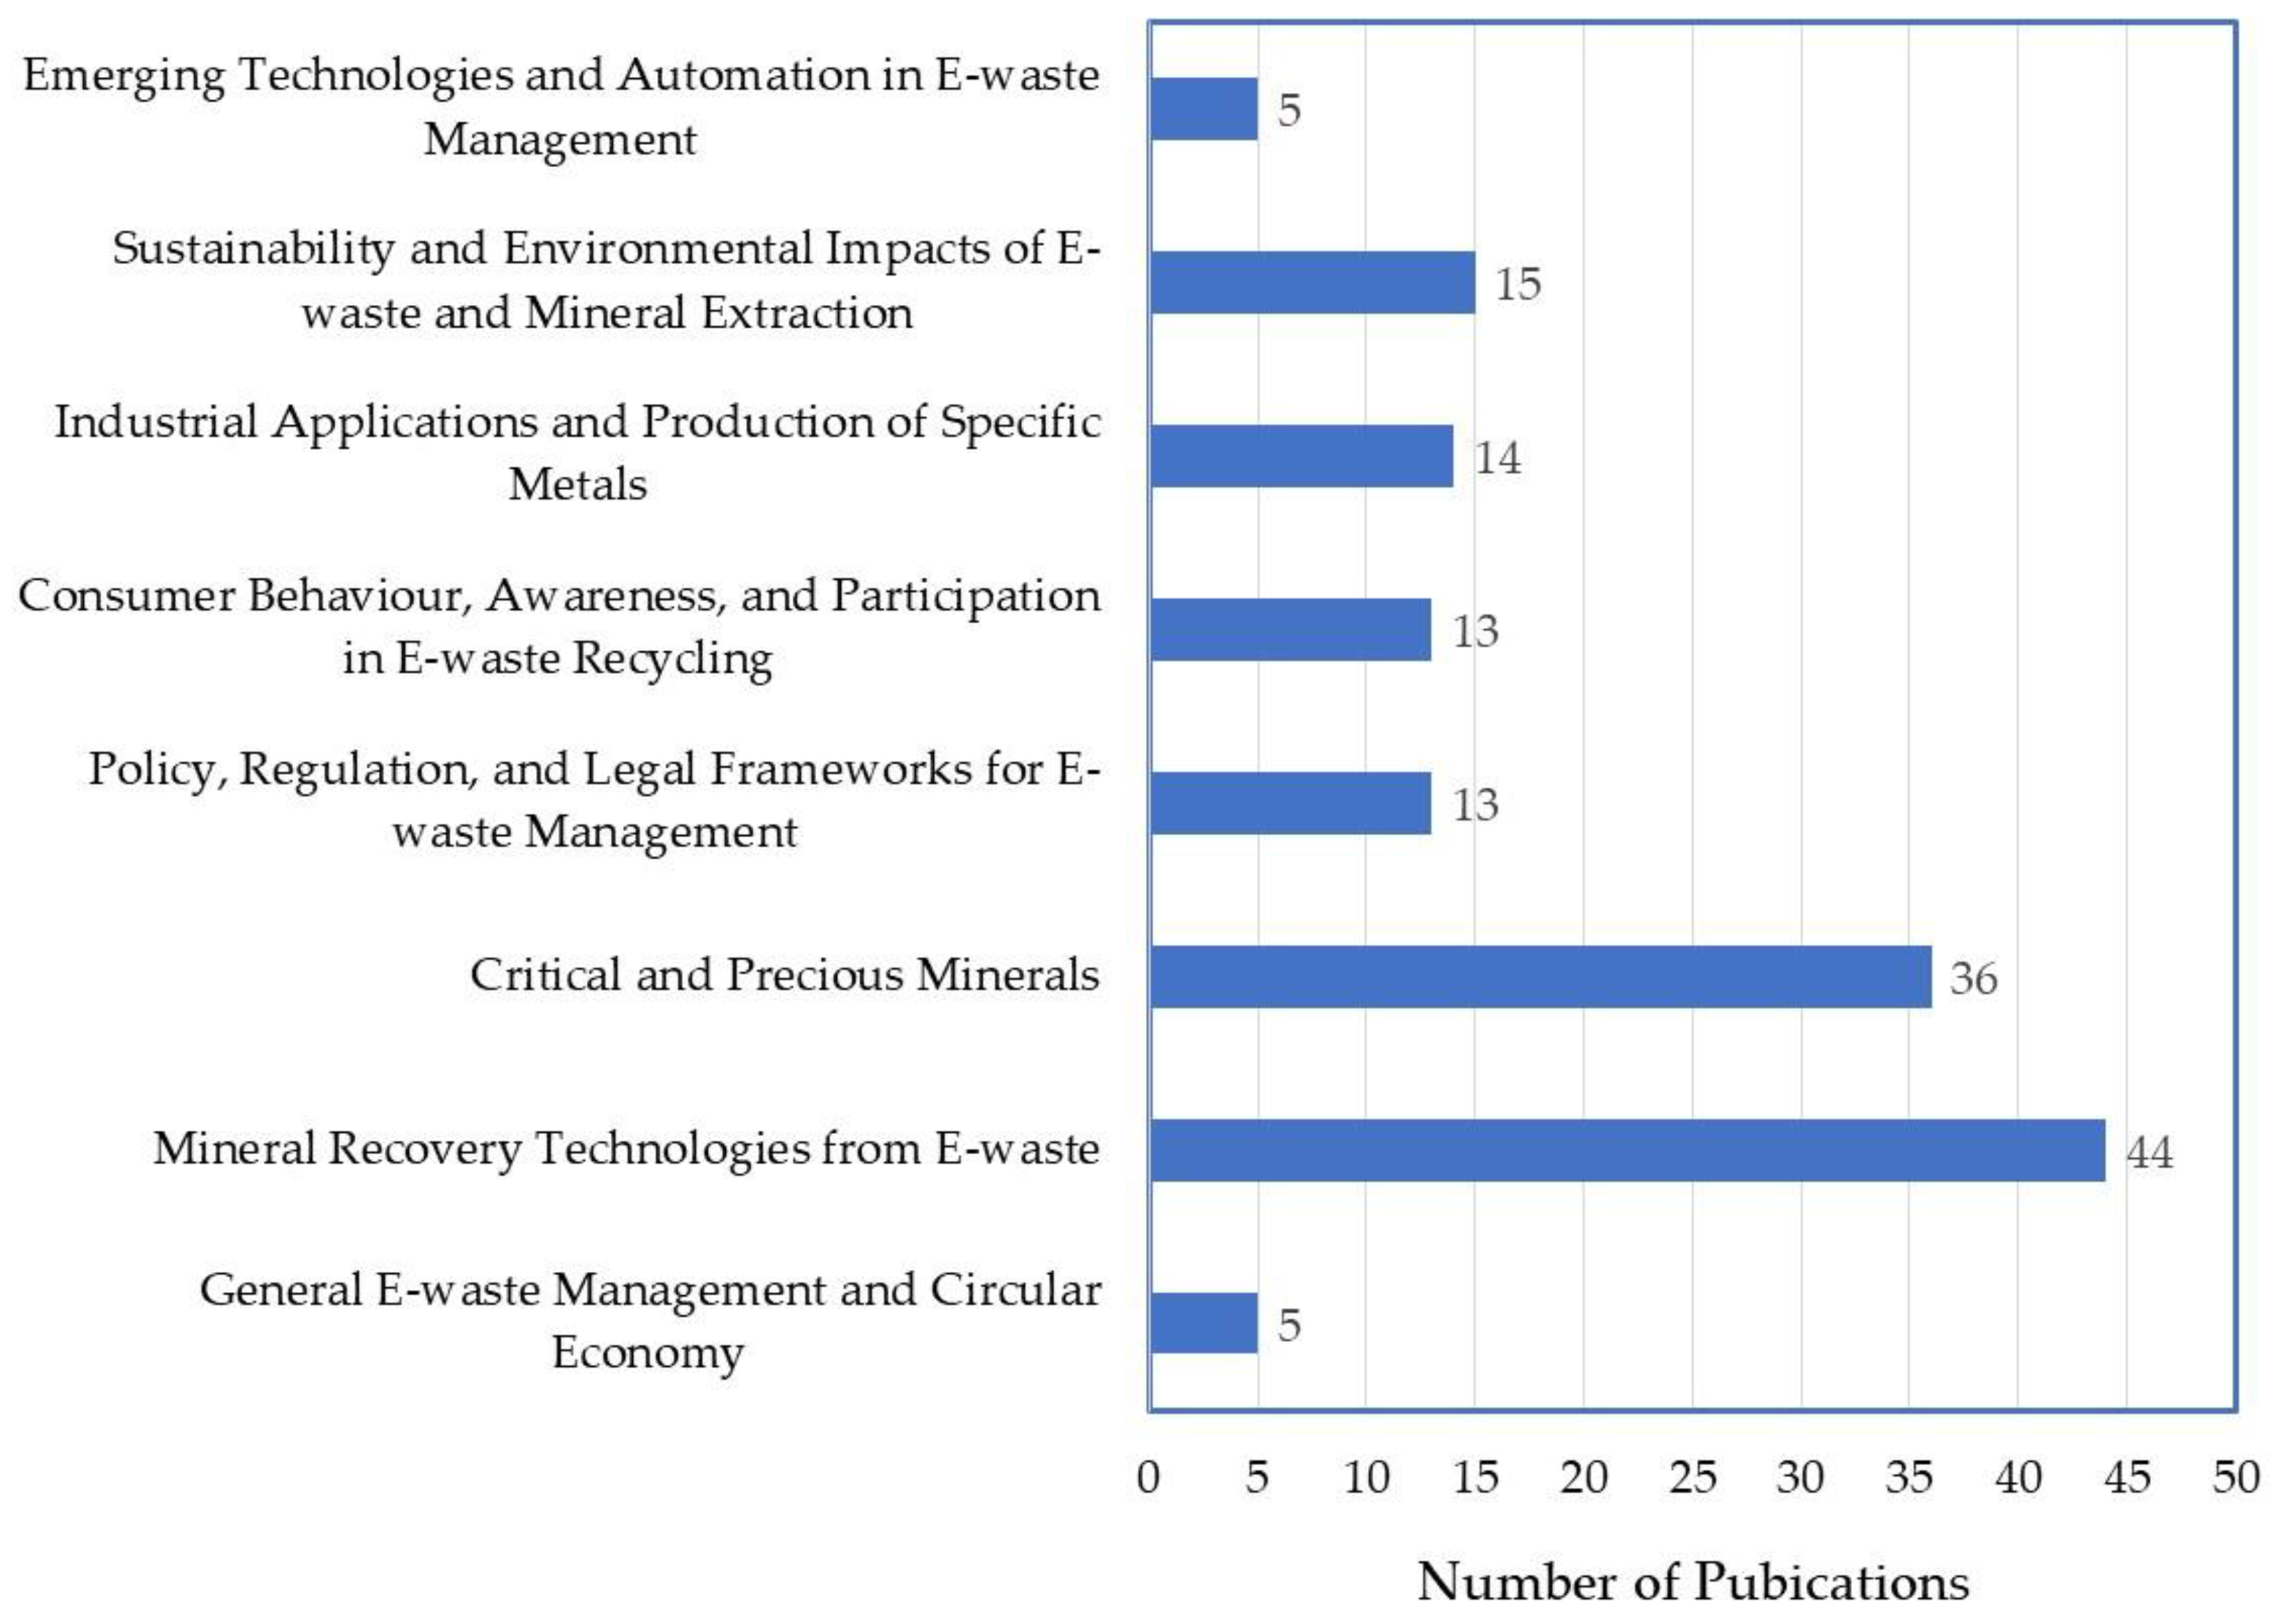
Figure 5.
Distribution of metals in E-waste in 2022, categorized into (A) total metals, (B) other metals, and (C) precious metals.
Figure 5.
Distribution of metals in E-waste in 2022, categorized into (A) total metals, (B) other metals, and (C) precious metals.
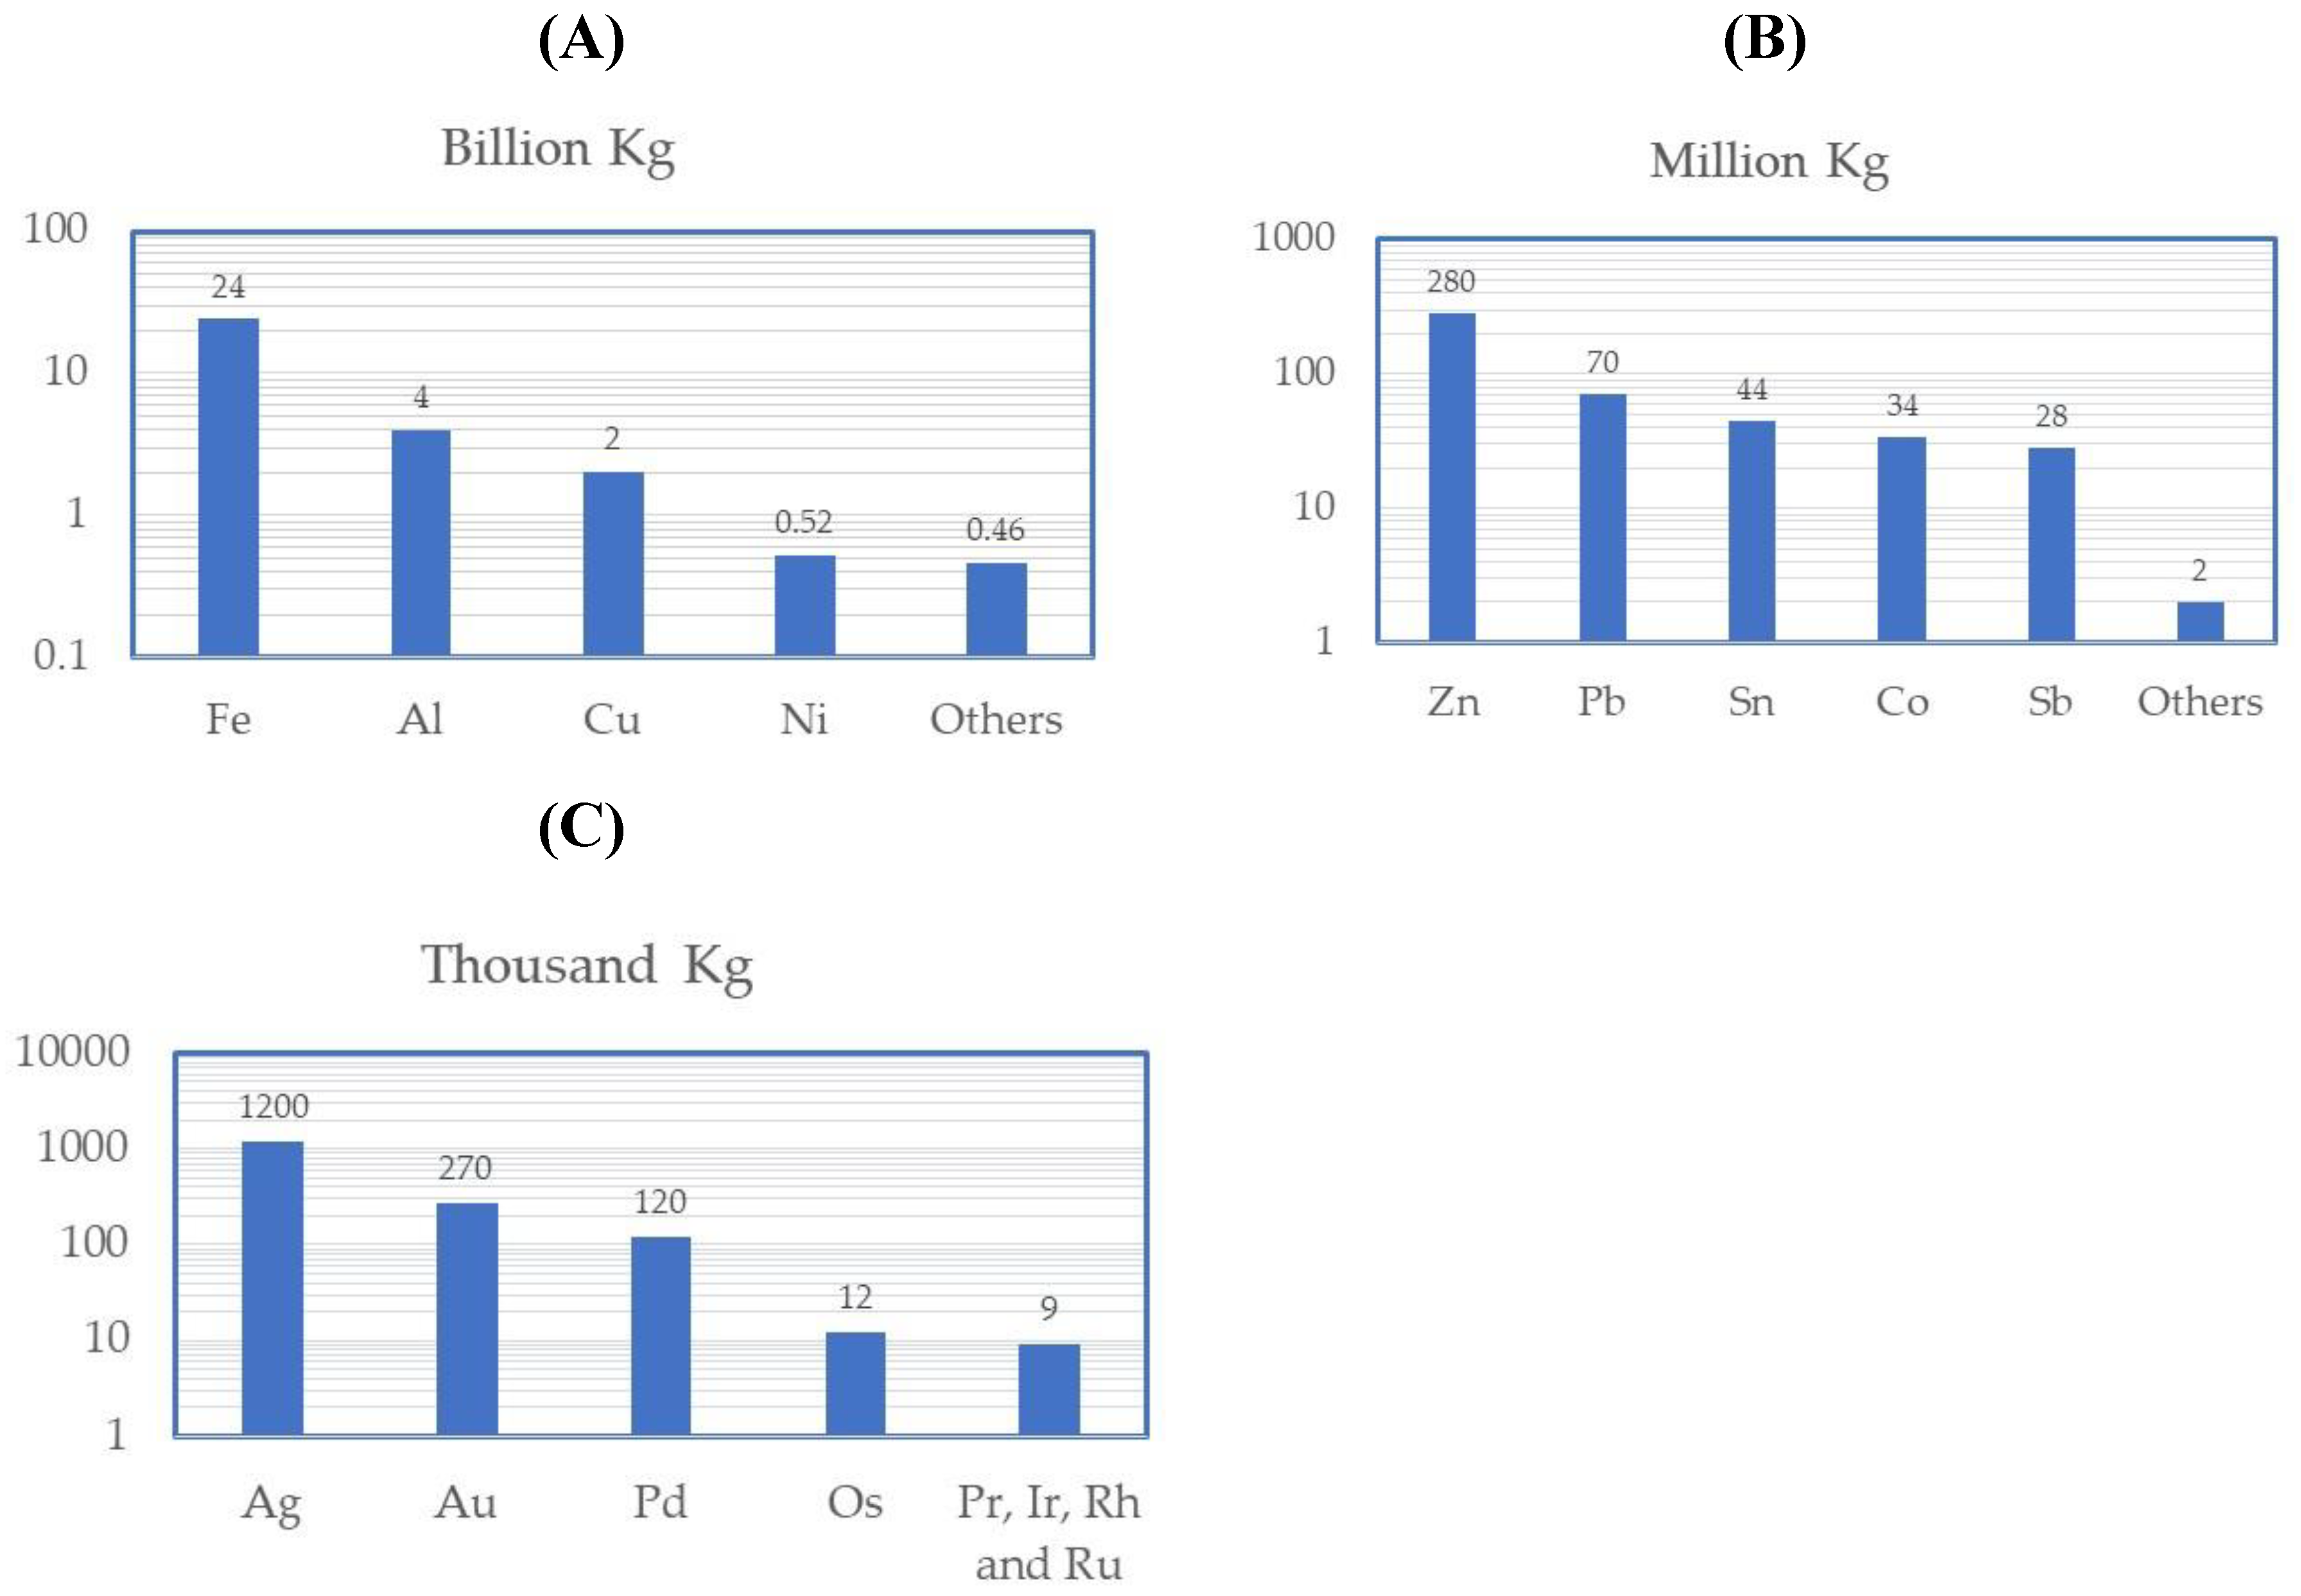
Figure 6.
Potential value in secondary raw materials in E-waste.
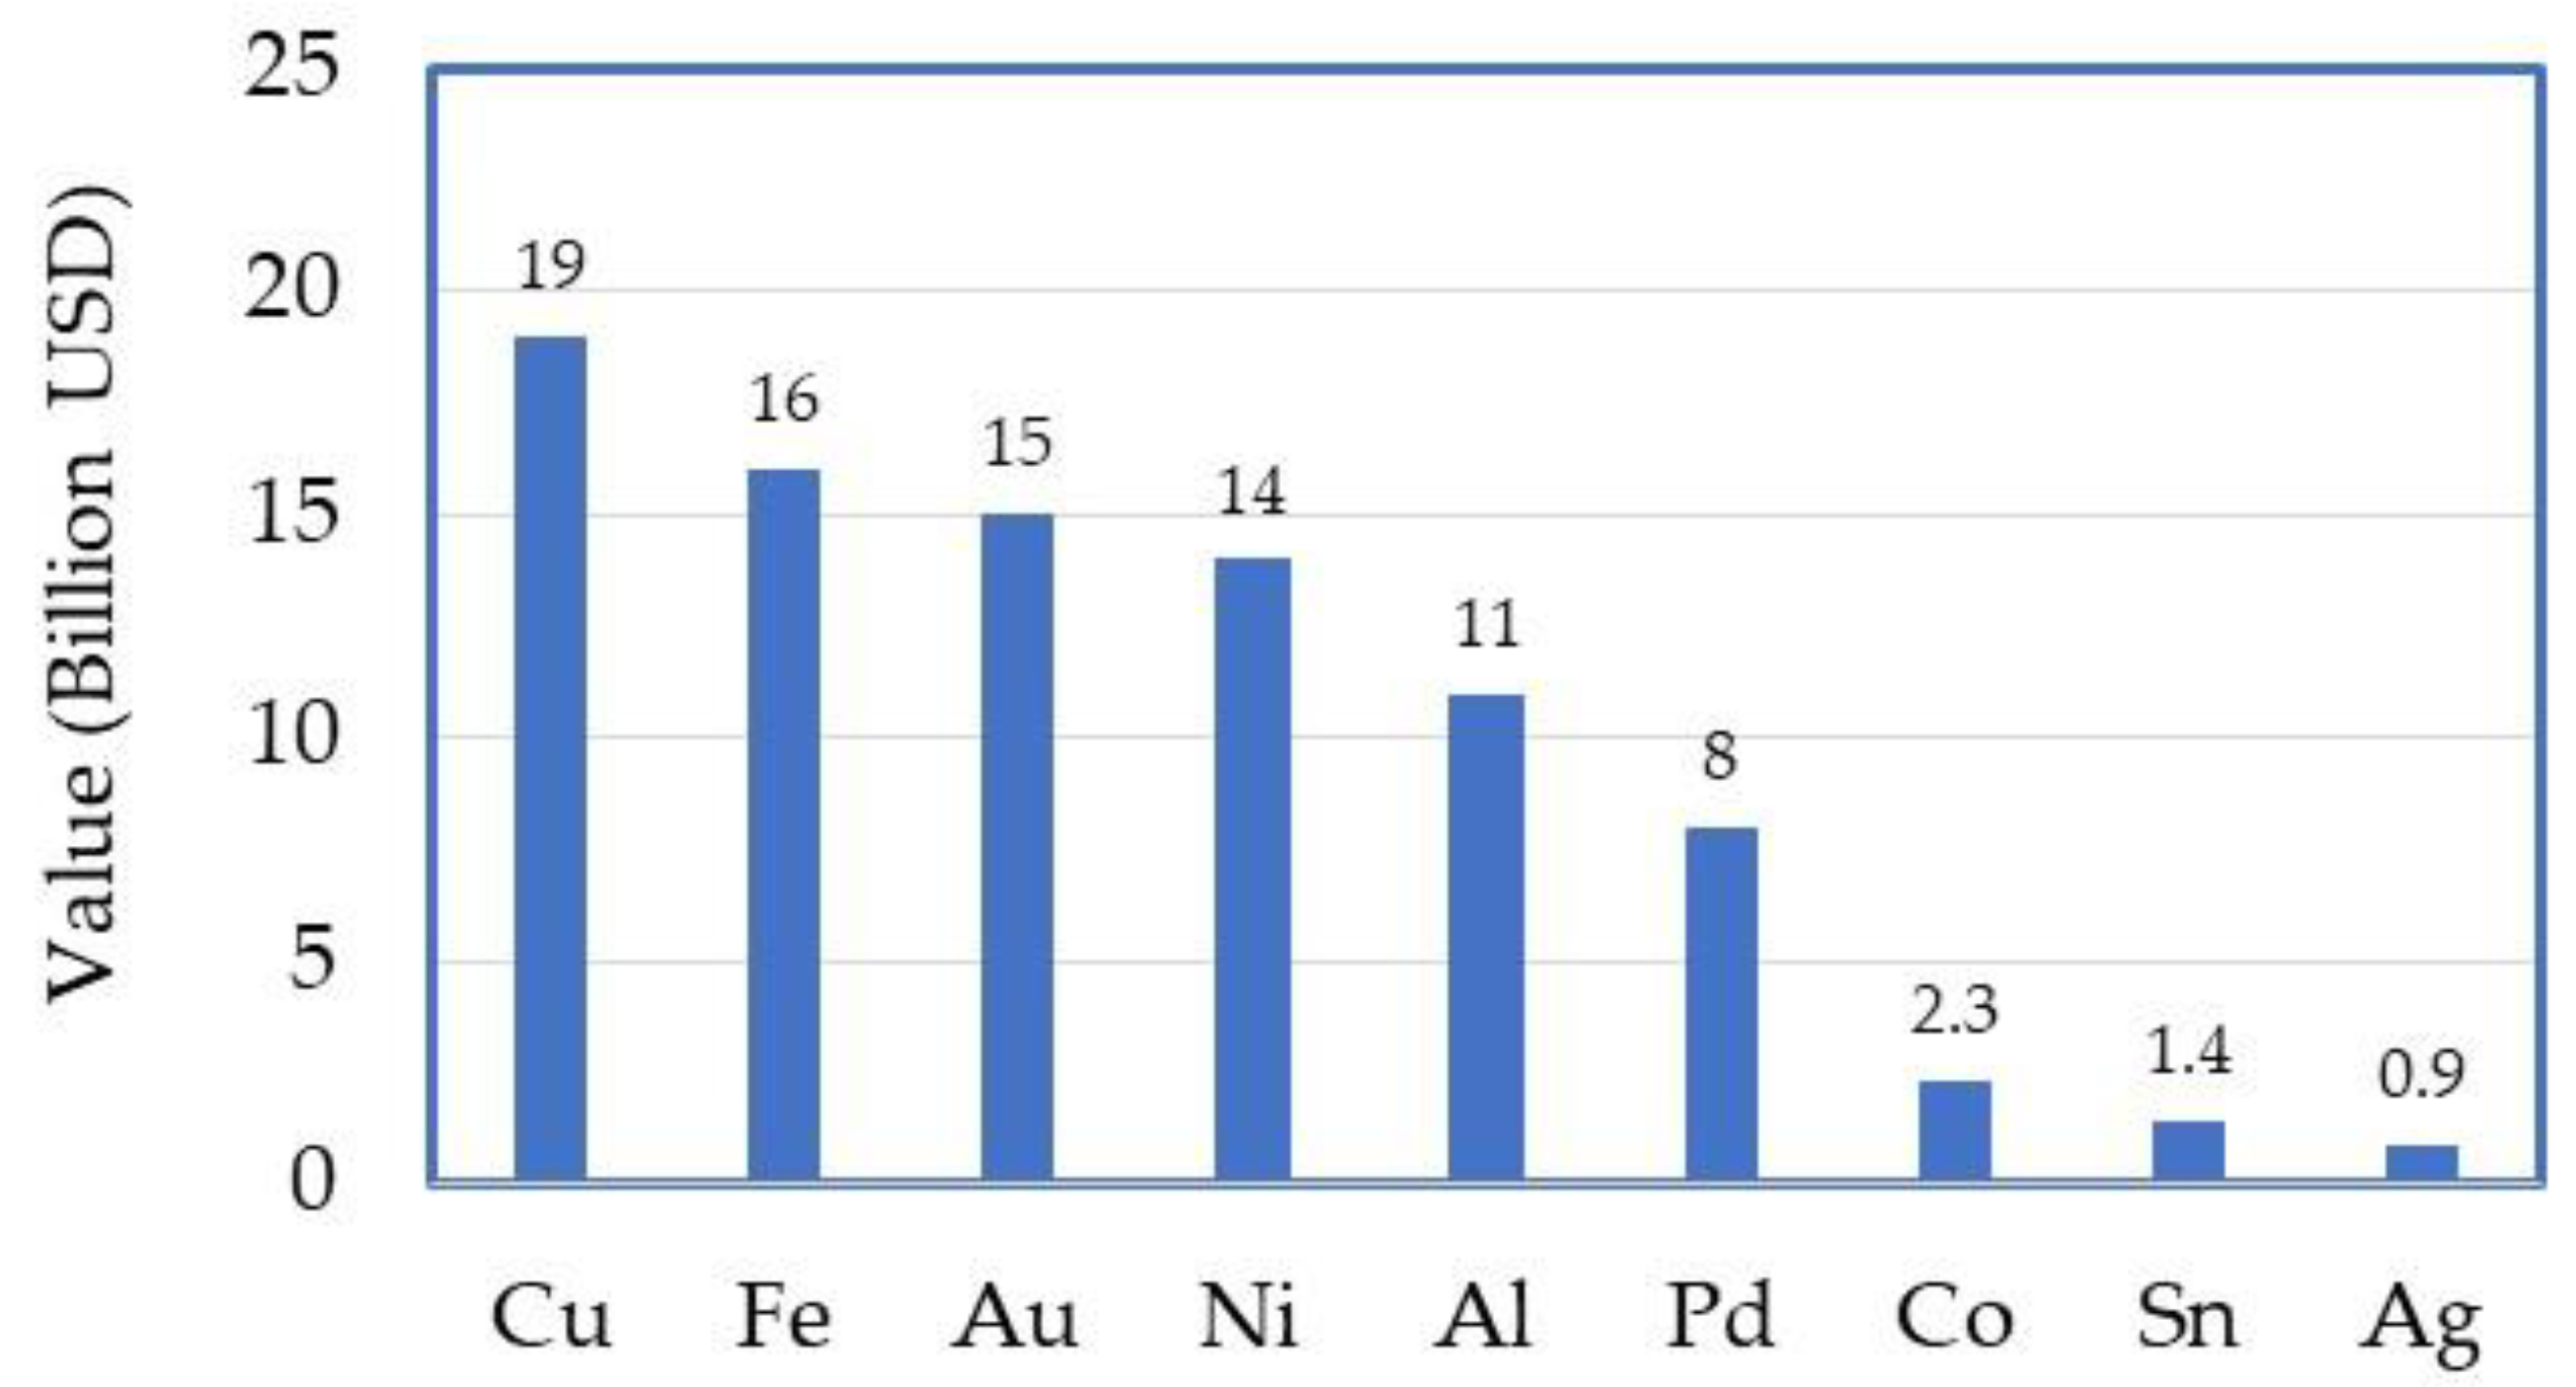

Table 1.
Critical and precious minerals: Properties, industrial applications, major producers and current supply risk (revised after [17]).
Table 1.
Critical and precious minerals: Properties, industrial applications, major producers and current supply risk (revised after [17]).
| Element | Important properties | Industrial utilization | Major producers | Supply risk | References |
| Aluminum | Conductive, flexible, durable, recycleable | Aerospace, defense, and infrastructure | China, India | Moderate | [26] |
| Antimony | Flame proofing compound | Flame retardants, batteries, and alloys | China, India | High | [27,28] |
| Cadmium | Fatigue and corrosion resistive | Solar panels and batteries | China, South Korea | High | [29,30] |
| Caesium | Higly reactive, pyrophoric | Atomic clocks, drilling fluids, and electronics | Canada, Australia | High | [31,32] |
| Chromite | Durability, hardness, wear resistance | Source of chromium, used in stainless steel and alloys | South Africa, Turkey | Very high | [33] |
| Cobalt | Wear resistance, high strength, magnetic | Batteries, superalloys, and magnets | Democratic Republic of Congo, Indonesia | High | [34,35] |
| Gallium | Conductive | Semiconductors and LEDs | China, Japan | High | [36] |
| Gold | Inert, high conductivity | Jewelry, electronics, and investment | China, Australia | Moderate | [37,38,39] |
| Indium | High conductivity, corrosion resistive, low melting point | Touchscreens, solar panels, and LCDs | China, South Korea | High | [40,41,42] |
| Lithium | Resistance to abrasion in synthetic rubber | Batteries and energy storage | Chile, Australia | High | [43,44] |
| Manganese | Corrosion resistive | Steel production and batteries | China, South Africa | Moderate | [45,46] |
| Molybdenum | Strength, corrosion resistive, conductivity | Steel alloys and catalysts | China, Chile | Moderate | [47,48] |
| Nickel | Corrosion resistive, toughness | Batteries, stainless steel, and alloys | Indonesia, Philippines | Moderate | [49,50] |
| Platinum Group Elements (PGEs) | Hardness, corrosion resitive, high melting points | Catalytic converters and hydrogen fuel cells | South Africa, Russia | Very high | [51,52] |
| Rare Earth Elements (REEs) | Magnetic, phosphorescent | Electronics, magnets, and defense applications | China, USA | Very high | [53,54] |
| Selenium | Photoconductive | Solar panels and electronics | China, Japan | High | [55,56] |
| Silver | High conductivity, antibacterial properties | Jewelry, electronics, and investment | Mexico, China | Moderate | [57] |
| Tellurium | Piezoelectric | Solar cells and thermoelectrics | China, Japan | High | [58,59] |
| Tin | Corrosion resistive, light weight | Soldering and electronics | China, Indonesia | Moderate | [60,61] |
| Titanium | Hardness, resistive, light weight, chemically inert | Aerospace, medical, and pigments | China, Mozambique | Moderate | [62,63] |
| Tungsten | High melting and boiling points, high density | Cutting tools, defense, and electronics | China, Russia | High | [64] |
| Uranium | High density, radioactive | Nuclear power and defense applications | Kasakhstan, Namibia | Moderate | [65] |
| Vanadium | Toughness, shock and vibration resistance | Steel alloys and redox flow batteries | China, Russia | Moderate | [66,67] |
| Zinc | Corrosion resistive | Galvanization and alloys | China, Peru | Low | [68,69] |
Table 2.
General physical and mechanical separation processes with an example from the Information Technology and Telecommunication sector.
Table 2.
General physical and mechanical separation processes with an example from the Information Technology and Telecommunication sector.
| General Processes | An example for IT and Telecommunication Equipment Separation Processes | |||
| Steps | Products | Manual Processing | Mechanical Processing | Products |
| A. Sorting and Dismantling | Separation of reusable parts | 1. Sorting | Capacitors, tuners, batteries | |
| B. Mechanical Processing (size reduction and sorting | Separation of metals, plastics, etc. | 2. Crushing | ||
| C. Eddy Current Separation | Separation of nonferrous metals | 3. Sorting | Valuable and hazardous components | |
| D. Magnetic Separation | Separation of ferrous metals | 4. Shredding | ||
| E. Density Separation | Separation of plastics | 5. Sorting | Valuable and hazardous components | |
| F. Electrostatic Separation | Separation of conductive metals from non-conductive materials | 6. Shredding | ||
| G. Disposal | Landfilling | 7. Eddy current separation | Nonferrous metals | |
| 8. Magnetic separation | Ferrous metals | |||
Table 3.
Pyrometallurgical processes.
| Pyrometallurgical Processes | Description |
| ❖ Incineration | • E-waste is incinerated at high temperatures in a controlled environment, breaking down organic materials and combustibles while leaving metal-rich ash. |
| ❖ Smelting | • Ashes or shredded E-waste are melted in high-temperature furnaces, allowing metals to separate from non-metallic materials due to their lower melting points. • Valuable metals like copper, lead, and precious metals are collected in molten form. |
| ❖ Roasting | • Metal compounds are converted into oxides or sulfides for further refining |
| ❖ Plasma arc furnaces | • Metals are extracted using high-energy plasma. |
| ❖ Volatilization | • Certain metals like mercury and zinc are recovered through controlled evaporation |
| ❖ Cupellation | • The metal-rich material is heated in a cupel (a porous container) with a blast of air, which oxidizes impurities and leaves behind the precious metals. • It is used to recover precious metals like gold and silver. |
Table 4.
Hydrometallurgical processes.
| Hydrometallurgical Processes | Description |
| ❖ Leaching | Chemicals such as sulfuric acid (H₂SO₄), nitric acid, or cyanide (CN-) are used to dissolve specific metals. • H₂SO₄ is used to extract base metals like Zn, Fe, Co, Pb, Al, and Cu. HNO₃ is used to extract base metals (including REE) and noble metals (i.e. Ag, Pd, Cu, Hg). • Cyanide solutions are used especially for gold recovery, under strictly alkaline conditions in the presence of oxygen |
| ❖ Ammonia leaching | It is sometimes used for selective recovery of copper and nickel. With higher reduction potential metals, i.e. Cu and Ag, its action can be empowered by adding oxidants such as H2O2, (NH4)2S2O8, or others. |
| ❖ Solvent extraction (SX) | Solvent extraction selectively recovers specific metals using organic solvents that bind to target metal ions. • In copper recovery, the leachate containing dissolved copper ions is mixed with an organic solvent, such as a hydroxyoxime-based extractant, which selectively binds to copper. The copper-laden solvent is then separated and stripped using sulfuric acid to regenerate copper sulfate, which can be further processed into pure copper via electrowinning. • This method is also used to extract REEs from E-waste, such as neodymium and dysprosium from magnets in hard drives. |
| ❖ Ion exchange | Ion exchange relies on resins to capture specific metal ions from the solution. • Gold recovery from E-waste uses strong-base anion exchange resins that selectively adsorb gold cyanide complexes from the leachate. The resin is then stripped with a suitable eluent, such as thiourea or sodium thiosulfate, releasing gold for further refining. • Platinum group metals (PGMs) like palladium and platinum from catalytic converters in E-waste can be extracted using chelating resins designed to bind specifically to these elements. |
| ❖ Precipitation | Precipitation recovers metals by adjusting the pH of the solution using reagents that cause metal hydroxides or sulfides to form. For examples: • Gold precipitation: Sodium metabisulfite or ferrous sulfate is added to a gold-bearing solution, reducing gold ions to solid elemental gold; • Nickel and cobalt recovery: By adding sodium hydroxide, nickel and cobalt precipitate as hydroxides, which can be further refined; and • Lead and zinc removal: Sulfide precipitation using hydrogen sulfide gas or sodium sulfide helps recover lead and zinc as insoluble sulfides from E-waste processing solutions. |
Table 5.
Summary of the advantages and disadvantages of each mineral recovery technology from E-waste.
Table 5.
Summary of the advantages and disadvantages of each mineral recovery technology from E-waste.
| Technology | Advantages | Disadvantages |
| ❖ Physical & Mechanical Separation | • Low cost and energy-efficient • No use of hazardous chemicals • Effective for pre-processing |
• Ineffective for fine or mixed metal recovery • Cannot separate metals from complex compounds |
| ❖ Hydrometallurgical Processes | • High selectivity and metal recovery efficiency • Lower energy consumption compared to pyrometallurgy • Can recover multiple metals (gold, silver, copper, etc.) |
• Requires hazardous chemicals (e.g., cyanide, acids) • Generates wastewater that requires treatment • Slow processing |
| ❖ Pyrometallurgical Processes | • High recovery efficiency for various metals • Fast processing time • Can handle mixed metal compositions |
• High energy consumption • Air pollution from gas emissions • Requires pre-treatment to remove plastics and hazardous materials |
| ❖ Bio-metallurgy | • Environmentally friendly • Low energy consumption • Can recover metals from low-grade E-waste |
• Slow processing rate • Requires specific conditions for microbial activity • Limited scalability for industrial applications |
| ❖ Electrochemical Processes | • High-purity metal recovery • Low chemical waste • Can be integrated with hydrometallurgical processes |
• Requires significant electricity input • Slower compared to pyrometallurgy • Ineffective for complex metal mixtures |
Table 6.
Technology Comparison for Specific Materials.
| Technology | Gold (Au) | Silver (Ag) | Copper (Cu) | Rare Earth Elements (REEs) | Platinum Group Metals (PGMs) | Ferrous Metals (Fe, Ni, Co) | Aluminum (Al) |
| ❖ Physical & Mechanical Separation | ❌ Not effective | ❌ Not effective | ✅ Good efficiency (electrostatic, density separation) | ❌ Not effective | ❌ Not effective | ✅ Good efficiency (magnetic separation) | ✅ Good efficiency (eddy current separation) |
| ❖ Hydrometallurgical Processes | ✅ Very effective (cyanide leaching) | ✅ Very effective (acid leaching) | ✅ High efficiency (acid leaching, solvent extraction) | ❌ Limited effectiveness | ✅ High efficiency (chloride leaching) | ❌ Limited effectiveness | ❌ Inefficient |
| ❖ Pyrometallurgical Processes | ✅ High efficiency (smelting, refining) | ✅ High efficiency (smelting) | ✅ High efficiency (smelting, roasting) | ❌ Not commonly used | ✅ Effective (high-temperature refining) | ✅ Effective for ferrous metals | ✅ Effective (high-temperature recovery) |
| ❖ Bio-metallurgy | ✅ Possible (bioleaching) | ✅ Possible (bioleaching) | ✅ Good efficiency (bioleaching with bacteria) | ✅ Promising research (microbial bioleaching) | ❌ Limited research | ❌ Not effective | ❌ Inefficient |
| ❖ Electrochemical Processes | ✅ High purity recovery (electrowinning) | ✅ High purity recovery (electrowinning) | ✅ Effective (electrowinning, electrorefining) | ❌ Not effective | ✅ Effective (electrorefining for platinum) | ❌ Inefficient | ❌ Inefficient |
Table 7.
A comparative analysis of critical mineral extraction via primary mining versus E-waste recycling.
Table 7.
A comparative analysis of critical mineral extraction via primary mining versus E-waste recycling.
| Aspect | Primary Mining | E-Waste Recycling |
| Capital Expenditure (CAPEX) | Very high: Typically, $500 million–$10+ billion USD | Moderate: Typically, $2 million–$10 million USD for medium-scale facilities |
| Operating Expenditure (OPEX) |
Moderate to high: $20,000–$50,000 USD/tonne of refined critical metal | Lower: $10,000–$25,000 USD/tonne, depending on technology and material type |
| Ore/Material Grade | Often low-grade ore (0.5–3%), requiring processing of huge volumes | E-waste has high metal content (up to 40% by weight), e.g., gold in PCBs can be 100× richer than gold ore |
| Energy Consumption | High: Large-scale excavation, crushing, smelting | Lower: Mostly mechanical, chemical, and electrochemical processes |
| GHG Emissions | High: Emissions from mining operations, heavy fuel usage, and smelting | Lower: Potential for near-zero emissions if powered by renewables |
| Environmental Impact | Significant: Land degradation, tailings, water contamination | Much lower: Fewer emissions and no landscape disruption, but still requires hazardous waste management |
| Extraction Efficiency | Moderate: Depends on ore quality and technology (often < 90%) | High: Precious metals like Au, Pd, and Cu can be recovered with >90% efficiency with advanced methods |
| Resource Scalability | Limited by geology, geography, and permitting | Scalable in urban areas; urban mining becomes more viable with growing e-waste volumes |
| Time to Set Up Operations | Long: Often 5–10 years due to exploration, feasibility studies, permits | Short: Typically, 1–2 years for plant construction and operation setup |
| Economic Viability | Highly dependent on metal prices and mine life | Economically attractive at small scale, especially where recycling fees and metal recovery both generate value |
| Strategic Benefit | Supports supply independence, but geopolitically sensitive | Enhances circular economy, reduces import dependency, and supports critical mineral security |
Table 8.
Implementation roadmap for E-waste sustainable management.
| Step | Action | Key Stakeholders | Expected Outcome |
| 1. Improve Recycling Infrastructure | ❖ Invest in AI-powered sorting and robotics for automation | ❖ Governments, Recycling Firms | ❖ Higher efficiency, reduced labor risks |
| 2. Implement Extended Producer Responsibility (EPR) | ❖ Mandate electronics manufacturers to finance E-waste collection and recycling | ❖ Government Regulators, Tech Industry | ❖ Higher collection and recycling rates |
| 3. Strengthen Consumer Awareness Campaigns | ❖ Launch educational programs and incentives for responsible recycling | ❖ NGOs, Tech Companies, Media | ❖ Increased participation in recycling programs |
| 4. Expand Public-Private Partnerships | ❖ Encourage collaboration between government and private sector in E-waste recycling | ❖ Municipal Authorities, Private Investors | ❖ Increased funding and infrastructure expansion |
| 5. Promote Eco-Design and Right-to-Repair Laws | ❖ Require manufacturers to produce repairable and recyclable devices | ❖ Policy Makers, Tech Industry | ❖ Reduced E-waste generation |
| 6. Introduce CE Initiatives | ❖ Encourage businesses to use recycled materials and modular design | ❖ Corporations, Researchers | ❖ Sustainable product life cycles |
Disclaimer/Publisher’s Note: The statements, opinions and data contained in all publications are solely those of the individual author(s) and contributor(s) and not of MDPI and/or the editor(s). MDPI and/or the editor(s) disclaim responsibility for any injury to people or property resulting from any ideas, methods, instructions or products referred to in the content. |
© 2025 by the authors. Licensee MDPI, Basel, Switzerland. This article is an open access article distributed under the terms and conditions of the Creative Commons Attribution (CC BY) license (http://creativecommons.org/licenses/by/4.0/).
Copyright: This open access article is published under a Creative Commons CC BY 4.0 license, which permit the free download, distribution, and reuse, provided that the author and preprint are cited in any reuse.


