
Submitted:
30 July 2024
Posted:
01 August 2024
You are already at the latest version
Abstract
The impulse of the Fourth Industrial Revolution is triggering the demand for few specific metals. These include copper, silver, gold, and platinum group metals (PGMs), with important applications in renewable energies, green hydrogen, and electronic products. However, the continuous extraction of these metals is leading to a rapid decline in their ore grades and, consequently, increasing the environmental impact of extraction. Hence, obtaining metals from secondary sources, such as waste electrical and electronic equipment (WEEE), becomes imperative for both environmental sustainability and ensuring availability. This recovery entails few problems such as allocation due to the simultaneous production of several metals, the use of non-renewable resources, and the exergy destruction during the life cycle of the metals. Therefore, this work analyses the waste printed circuit boards (PCBs) recycling process by proposing different exergy-based cost allocations for the mentioned metals, disaggregating the exergy cost into non-renewable and renewable, and considering the complete life cycle of metals with the Circular Thermoeconomics methodology. The results show a significant saving of non-renewable energy by using renewable energies in primary extraction (67-87%), recycling (97.6-98.5%), and renewable energies in recycling (98.7%, 99.0%), compared to conventional primary extraction. However, when considering the entire life cycle, between 47% and 53% of the non-renewable exergy is destroyed during recycling. Therefore, delaying recycling as much as possible would be the most desirable option for maximizing the use of non-renewable resources, which nature cannot replace in a short time.
Keywords:
Exergy Life Cycle
; Thermoeconomics
; Exergy Cost
; Exergy Replacement Cost
; Circular Economy
; WEEE recycling
1. Introduction
The climate crisis and the Fourth Industrial Revolution are accelerating the energy and digital transition [1,2]. This double transition is increasing the demand for many metals and materials [3]. Certain of these metals are copper, silver, gold and palladium. For instance, these metals are found almost all the printed circuit boards (PCBs), which is the core of any electrical and electronic equipment (EEE), computers, and data centers. [4], i.e., the foundation of digitalization. On the other hand, copper is essential for renewable energies and the conduction of electricity, silver is used in significant quantities in silicon solar panels [5], and palladium is an essential metal in green hydrogen technologies [6]. However, these metals are not particularly abundant in nature, as evidenced by the progressive decrease in their ore grade since the beginning of the 20th century [7]. For instance, copper ore grades were around 2.5 in the early 20th century, but by 2015, it had decreased to 0.6 [8]. Because of this situation, it is essential to promote a circular economy capable of obtaining metal resources from waste [9]. In the context of the digital transition, PCBs contained in waste electrical and electronic equipment (WEEE) are good candidates due to their significant concentration of metals and their exponential growth in recent years because of their short lifespan [10]. However, the recycling processes themselves consume non-renewable resources; therefore, it is not enough to recycle metals; it is better to do it through renewable energies to obtain cleaner metals that promote the double transition to achieve the sustainability objectives.
Life Cycle Assessment (LCA) is the most widely used methodology for analyzing the resources consumed and the environmental impacts of the production of metals such as copper [11,12,13,14]. However, this methodology presents several limitations. For instance, quality losses cannot be measured using mass-based recovery, mass and energy balances could not be conserved, or the Life Cycle Impact Assessment (LCIA) is a subjective and arbitrary step in current LCA methodologies [15,16]. These limitations could be overcome by using exergy and exergy cost. Exergy is the maximum theoretical useful work obtained if a system is brought into thermodynamic equilibrium with the environment [17], while the exergy cost represents the cumulative exergy consumption necessary to manufacture a product, considering its life cycle. [18]. Thus, through the exergy cost, it is possible to measure the relationship between the material dimension and the energy dimension through a single criterion, the exergy [19]. An additional advantage of using exergy and exergy costs is that many of these metals will be used to produce renewable energy in the context of the energy transition. This allows us to determine the efficiency of materials in energy production in terms of non-renewable exergy [20,21]. This type of exergy is more valuable from the point of view of the sustainability since cannot be replace by the nature in the short-time. Other studies focused in the use of non-renewable exergy during the life cycle of products, however this concepts were not applied to circular economy and recycling [22,23].
Several studies analyze recycling from the point of view of exergy [15,16,24,25,26,27]. However, these studies do not use a thermoeconomic approach that would allow us to identify the origin of the exergy used, i.e., renewable or non-renewable. This aspect is fundamental in the context of the energy transition since the use of renewable energies reduces the use of non-renewable resources in obtaining metals, and this can be quantified through a disaggregated exergy cost depending on the origin of the exergy. Another problem arises when several metals are produced simultaneously since it is necessary to allocate exergy costs. LCAs commonly use the economic allocation [28,29]. However, prices are not a physical magnitude and are highly variable over time, and therefore, its use is controversial [30]. In primary production, the use of the relative scarcity of metals in the earth’s crust is presented as a solution due to the impossibility of determining the exergy cost at this stage [31]. However, during recycling, it is possible to use exergy criteria to allocate the exergy cost [26,32,33]. Nevertheless, there are different options from the exergy perspective to realize the allocation. For instance, using the exergy of the flows or the Exergy Replacement Cost (ERC) [34].
This study explores the thermoeconomic analysis of a recycling process of copper, silver, gold, and palladium from waste PCBs. This type of analysis is frequently used in power plants but is rarely employed in other types of industries. We discuss the different options for exergy allocation. As a novelty, the present work considers the origin of the exergy (renewable and non-renewable), which allows us to consider two scenarios: 2020 (using conventional fuels) and 2050 (using renewable fuels), both for primary and secondary production. Finally, the complete consideration of the life cycle of metals allows us to determine and reflect on the efficiency of circularity through exergy.
2. Materials and Methods
Section 2.1 explains the calculation of the exergy life cycle cost (ELC) and the primary exergy cost in 2020 (, ) and in 2050 (, ), for the four studied metals (Cu, Ag, Au and Pd). Section 2.2 explains the thermoeconomic model for PCB recycling. In total, we compare 5 different scenarios for each metal:
- Primary 2020 ()
- Primary 2050 with conventional energies ()
- Primary 2050 with renewable energies ()
- Recycled 2020 (). There are three allocations (B, , and )
- Recycled 2050 (). There are three allocations (B, , and ).
2.1. Exergy Life Cycle Cost (ELC) and Primary Exergy Cost of metals
Circular thermoeconomics requires considering the entire life cycle of products, in this case, metals. For this reason, we start from the mining extraction to determine the exergy cost of metals. We distinguish between two types of exergy costs:
- Exergy Life Cycle Cost (): Electricity is considered as the final exergy. It is used for allocation during recycling due to the high variability of the primary energy cost of electricity, depending on whether it originates from renewable or non-renewable sources [21].
- Primary (): It considers the effect of ore grade and EROI decreasing and the electricity and hydrogen life cycle. Therefore, we calculate the 2020 scenario and two scenarios for 2050: one with renewable energies and the other with non-renewable energies. This scenario is used to compare with the recycling results.
First, we explain the calculation of the Exergy Life Cycle Cost (). Figure 1 shows the disaggregation of the exergy cost of metals into four steps (“Mining and concentration”, “Chemicals for mining and concentration”, “Smelting and Refining”, “Chemicals for Smelting and Refining”), and four fuels (“Natural gas”, “Oil”, “Coal”, “Electricity”) and the exergy of minerals.
The exergy cost of the four steps and the four fuels for each metal was obtained from several sources [21,31,34,35,36,37,38], the mineral exergy from [34], the energy cost with a physical allocation from [31], and the procedure for its transformation into exergy from [21]. These values are shown in Table A1. Furthermore, we considered the EROI degradation of fossil fuels from [35,36] and ore grade degradation from [7,37,38]. Considering these variables, the calculation of the exergy life cycle cost () for the year () (), i.e. for 2020 or 2050, was performed through Equation (1).
Equation (1) shows that all exergy cost variables depend on the year (yr). However, the exergy cost of “Mining and Concentration" step () and () shows an increase in the required exergy cost because of decreasing ore grade, as lower ore grade needs not to increase the exergy cost of the “Smelting and Refining” stages () and () since a fixed grade concentrate is produced in concentrating stage regardless of the initial ore grade [39]. Therefore, the variation in the "Smelting and Refining" exergy cost step is only due to the decreasing EROI. On the other hand, to calculate the increase in the exergy costs of “Mining and Concentration” step , Equation (2) is applied, in which we start from the current exergy cost , the current ore grade and the ore grade in any year and the exponent b, which is an experimental index that indicates how fast the exergy cost increases in the mine. The relationship between ore grade and years is based on several studies [7,38], and data is available in Table A2.
The trend of Equation (2) is shown qualitatively in Figure 2.
2.2. Thermoeconomic model of PCB recycling
The thermoeconomic analysis of the metallurgical simulation of PCB recycling is performed using the MATLAB package TaesLab [40]. This software allows the thermoeconomic analysis of industrial systems. TaesLab needs a data set for defining the model:
- Physical structure: The physical structure represents the energy system. It is based on the metallurgical simulation shown in Figure 3.
- Productive structure: The productive structure defines the function of each flow and process and the Fuel-Product definition.
- Thermodynamic model: The thermodynamic model shows the set of equations (mass, energy, entropy balances...) that allow to determine the exergy of the flows. They define the thermodynamic state of the plant
- Environmental model: the environmental model represents the external cost of the resources consumed by the plant.
2.2.1. Physical Structure
The physical structure was obtained from [41,42,43] which simulate the recovery of copper, silver, gold and palladium from PCBs using HSC chemistry and FactSage. Figure 3 represents the scheme from the HSC, and Figure 4 shows all the processes and flows of the thermoeconomic model. The differences between the Figure 3 and Figure 4 are the combination of the pumps and heat exchanger as only one process, the addition of dissipative equipment PYW, HGW, and SLW (represented in grey), and the elimination of other waste flows since they can be integrated as internal irreversibilities. There are 16 processes (numbered A to N) and 55 flows.
2.2.2. Productive Structure
There are four types of flows and two types of processes, differentiated by color in Figure 4:
- Resources (Green): these are the input flows, which also have an associated exergy cost defined in the Environmental Model. See Section 2.2.4
- Intermediate (Black): these flows connect two processes. In Figure 3, they are always identified with two letters. The first letter refers to its origin and the second letter to its destination.
- Output (Blue): these are the products, i.e., the recovered metals: copper (produced in electrorefining), plus silver, gold, and palladium, produced in precious metal recovery, besides the steam generated in the heat exchanger.
- Residues (Red): These are the residues: slag from reduction, gases from reduction and oxidation, gases from fire refining, residues from electrorefining, and residues from the precious metal recycling process.
On the other hand, there are two types of processes depending on the function:
- Productive: the products of these processes are internal flows (Internal) or final products (Output).
- Dissipative: these processes eliminate waste flows.
Table 2 shows the type of processes and the fuel-product definition of each flow. This table is called the Process Table.
Table 1 describes the flows of the plant, grouping by flow type.

Table 1.
Flow Definition tables
| (a) Resources | |
|---|---|
| key | Description |
| A1 | PCB Scrap |
| A2 | Electricity Scarp |
| B2 | Flux RED |
| C1 | Coke - H2 |
| C2 | Flux OXI |
| D1 | NG -H2 |
| D2 | Flux FR |
| D3 | Air |
| E1 | Cold Water |
| F1 | Electricity ER |
| F2 | Electrolite ER |
| G1 | Air |
| H1 | Electricity Pump |
| H2 | Water |
| J1 | Air |
| J2 | Electricity ASU |
| K1 | Electricity DeCu |
| K2 | Chemical DeCu |
| L1 | Electricity DeAg |
| L2 | Chemical DeAg |
| M1 | Electricity DeAu |
| M2 | Chemical DeAu |
| N1 | Electricity Pd |
| N2 | Chemical Pd |
| NW1 | Slimes treatment |
| (b) Internal Flows | |
| key | Description |
| AB1 | PCB Shredder Plastic |
| AB2 | PCB Shredder Metal |
| BC | Black Copper |
| BG | Heat Gases |
| B3 | Slag RED |
| CB | Slag OXI |
| CD | Rough Copper |
| CI | Gases OXI |
| DC | Slag FR |
| DE | Anode Copper HT |
| EF | Anode Copper LT |
| FD | Exhausted Anode |
| FK | Slimes |
| H4 | Hot Gases |
| GH | Heat Gases |
| JB | O2 Reduction |
| JC | O2 OXI |
| KF | Cu Sulphate (CuSO4) |
| KL | Slimes w/o Cu |
| LM | Slimes w/o Ag |
| MN | Slimes w/o Au |
| N4 | Slimes not recovered |
| (c) Outputs | |
| key | Description |
| STM | Steam |
| Cu | Copper Cathode |
| Ag | Silver |
| Au | Gold |
| Pd | Palladium |
| (d) Waste | |
| key | Description |
| PYW | Pyrometallurgical waste |
| HGW | Hot Gases waste |
| SLM | Slimes waste |
Table 2.
Processes definition table
| key | description | fuel | product | type |
|---|---|---|---|---|
| SRD | Shredding (A) | A1+A2 | AB1+AB2 | PRODUCTIVE |
| RED | Reduction (B) | (AB1+JB-BG)+(B2+AB2+CB-B3) | BC | PRODUCTIVE |
| OXI | Oxidation (C ) | C2+(C1+JC-CI)+(BC+DC-CB) | CD | PRODUCTIVE |
| FR | Fire Refining (D) | D1+D2+D3+FD+(CD-DC) | DE | PRODUCTIVE |
| AC | Anode casting (E ) | E1+DE | EF | PRODUCTIVE |
| ER | Electrorefining (F) | F1+F2+KF+(EF-FD) | Cu+FK | PRODUCTIVE |
| AB | Afterburner (G) | G1+BG | GH | PRODUCTIVE |
| HE | Heat exchanger (H) | H1+H2+(GH+CI-H4) | STM | PRODUCTIVE |
| ASU | Air separation unit (J) | J1+J2 | JB+JC | PRODUCTIVE |
| DeCu | Decoppering (K) | K1+K2+FK | KL+KF | PRODUCTIVE |
| AgRe | Silver recovery (L) | L1+L2+KL | Ag+LM | PRODUCTIVE |
| AuRe | Gold recovery (M) | M1+M2+LM | Au+MN | PRODUCTIVE |
| PdRe | Palladium recovery (N) | N1+N2+(MN-N4) | Pd | PRODUCTIVE |
| PYRW | Pyrometallurgical waste | B3 | SLW | DISSIPATIVE |
| HEW | Heat exchanger waste | H4 | HGW | DISSIPATIVE |
| SLMW | Slime waste | N4+NW1 | SLW | DISSIPATIVE |
2.2.3. Thermodynamic Model
The exergies (B) were calculated using HSC software from the mass flow rate, temperature and chemical composition of each stream. However, we extended the analysis using: (calculated in Section 2.1) and (obtained from [44]). Thus, the exergy cost of extraction is considered under different criteria. These criteria allow three different cost allocations for each product, as indicated at the beginning of the section. Table 3 shows the exergy of each flow depending on the thermodynamic criterion.
2.2.4. Environmental Model
The Environmental Model gives the exergy life cycle cost of the resources. Figure 4 shows the resource type flows in green and Table A4 and Table A5 show the complete values divided according to the exergy source. The main resources are:
- PCB (A1): It represents the exergy cost of producing the metals that constitute a PCB. We consider its exergy cost zero since it is a waste to be recycled.
- Electricity (A2, F1, H2, J2, K1, L1, M1, N1): There are two electricity scenarios: 2020 and 2050. We obtained the data from [21].
- Fuel/Reductant (C1, D1): These are coke, natural gas or hydrogen, depending on the scenario. The exergy cost of coke and natural gas are based on their EROI, and the exergy cost of hydrogen is calculated from [45].
- Flux (B2, C2, D2): Represents the exergy cost of producing fluxes composed of FeO, SiO2, or CaO in variable compositions, depending on whether they are used in reduction, oxidation, or refining. Its exergy cost was calculated following the methodology described on [31]
- Chemicals (F2, K2, L2, M2, N2): mainly sulfuric acid (H2SO4) for electrolysis, nitric acid (HNO3) used in Ag recovery, oxalic acid (C2H2O4) in Au recovery and ammonium chloride (NH4Cl) in PGM recovery. Their exergy cost was calculated following the methodology of [31].
Once the physical structure, the production structure, the thermodynamic model, and the environmental model have been defined, all the data are loaded into TaesLab, and the results are obtained. The results allow selecting the best allocation, B, , or to establish the exergy cost of the products: Cu, Ag, Au, and Pd. Furthermore, it is possible to distinguish the part of the exergy cost due to renewable or non-renewable origin, depending on the selected environmental model, for the three scenarios considered, as described at the beginning of the section: Recycled 2020 scenario uses current conventional fuels (coke, natural gas and 2020 electricity) and Recycled 2050 scenario alternative fuels, hydrogen and renewable electricity.
3. Results and Discussion
First, we show the total exergy cost of metals under different exergy allocation criteria, both for primary and secondary production. Secondly, we present the exergy cost of the previous section but disaggregated depending on the origin of the exergy. Finally, we show the complete cycle of metals assuming their use in PCBs, through Sankey diagrams to draw the main conclusions of circularity.
3.1. Exergy or Exergy cost allocations?
Table 4 shows the chemical exergy (, obtained from [34]), and (calculated in this article) and the ERC (from the reference [44]) of the four metals studied. The four allocation criteria during the recycling process are applied using the values in Table 4. The difference between and is the increase in exergy cost due to the decrease in ore grade expected between 2020 and 2050 (see Figure 4) and the delining .
The exergy allocation under the exergy cost theory uses the exergy of the flows to allocate exergy cost [19]. This criterion is meaningful in energy production plants since their exergy content determines the value of the flows since their function provides energy. However, using this criterion for products whose purpose is not energy production is not consistent. Table 4 shows that copper has 10 times more exergy than gold since it is more environmentally reactive than gold. However, gold is much scarcer (and more valuable) than copper. On the other hand, shows the exergy destroyed during the metal production processes, and the shows the exergy that will be destroyed as the ore grade of the metals decreases, being a measure of the mineral scarcity [32]. Conclusively, chemical exergy does not reflect the "usefulness" of metals, while and indicate the resources destroyed during the production process (either current or future ), so their use is more consistent.
Table 5 shows the total exergy costs of primary production with primary exergy (), and of the recycling process () analyzed in this study under the allocation criteria with exergy (B), exergy life cycle cost () and Exergy Replacement Cost (), for both 2020 and 2050. We observed that the primary exergy cost of primary production is lower in 2050 than in 2020 in the cases of Cu, Ag and Pd, despite a decrease in their ore grade. This is because in 2050 we have assumed a strong penetration of renewable energies, according to the NZE scenario of the IEA [2]. Renewable energies are much more efficient in the transformation of exergy [20,31], so despite an increase in due to the decrease in ore grade, there is a decrease in the use of primary resources.
Table 6 shows the percentage of savings of secondary production with respect to primary production under the different proposed exergy criteria, i.e., it represents the ratio of to in Table 5.
Table 6 shows the disadvantages of using the exergy criterion (B), since copper accounts for a very high percentage of the cost (represented by a saving between 31% and 54%), compared to a very high saving percentage for the case of gold (more than 99.99%). This is because the chemical exergy of copper is 10 times higher than gold (see Table 4). The method showing the most balanced savings is the exergy cost method, with an almost constant saving of 97% for all metals. This result is consistent since we are comparing the recycling exergy costs using the exergy life cycle cost allocation (), with the primary exergy costs themselves , which are calculated from . Regarding the criterion, we observe that Pd accounts for a higher percentage of the cost, with savings around 84%, while the rest of the metals present much higher savings. This result is caused because the ERC of Pd is very high (i.e. 8,983,377 MJ/kg, Table 4) compared to the rest of the metals (i.e. 553,250, 7,371, and 292 MJ/kg for Au, Ag and Cu, respectively, Table 4) due to the elevated scarcity of this element in nature.
The exergy cost allocation criteria ( and ) obtained the most satisfactory results. These criteria show the most balanced savings. Recycling aims to save the exergy of primary production; therefore, it is consistent to consider the life cycle of metals for allocation, through their exergy cost, both present () or future ().
3.2. Non-renewable and renewable exergy cost of metals
Figure 5 shows the primary exergy cost of Table 5 for the four studied metals, both primary production and recycling, disaggregated according to the origin of the exergy. We excluded the exergy allocation (B) since the most interesting ones were the exergy cost allocation ( and ), as explained in the previous section. We divided the exergy into the chemical exergy of minerals (), the exergy cost of natural gas, oil, and coal (, , , respectively), the non-renewable part of electricity and hydrogen (), and the renewable part of the above ().
All metals show very significant exergy savings when comparing primary and secondary production. The difference in exergy costs is high enough to zoom into the graphs to see the recycling composition. Disaggregation allows us to analyze the savings in non-renewable exergy. Thus, in the case of copper, 23.2-76.1 Non-Renewable MJ/kg are saved with respect to primary production. In the case of silver, the savings are between 3,310 and 25,011 Non-Renewable MJ/kg. Gold recycling saves between 96,249 and 854,313 Non-Renewable MJ/kg. Finally, recycled Pd saves between 9,649 and 239,068 Non-Renewable MJ/kg. Saving non-renewable exergy should be the priority of recycling since non-renewable exergy represents all resources that are not renewable, i.e., that cannot be replaced by nature in a short timescale.
The savings in non-renewable resources are also evident in primary production. Figure 5 shows two primary production scenarios for 2050: one that maintains the 2020 energy mix (NRE, since it is mostly non-renewable energy) and another that is based on the IEA-NZE scenario [2], with more renewables (RE). The comparison of these two scenarios allows us to appreciate the effect of the decrease in ore grade (lower in 2050 than in 2020) on the increase in the non-renewable energy costs of all metals when the energy mix is maintained (NRE scenarios). For example, it increases by 11.3% for Cu, 9.2% for Ag, 62.4% for Au, and 13.0% for Pd. However, considering the RE scenario, the non-renewable exergy cost decreases by 64% for Cu, 83% for Ag, 79% for Au, and 81% for Pd. The smaller decrease in the case of copper is due to the high chemical exergy of the mineral from which it is obtained: chalcopyrite.
The use of renewable energies in the recycling processes also reduces the non-renewable energy cost. Thus, in the case of copper, the exergy cost using allocation (1.9 MJ/kg) is reduced from 1.8 Non-Renewable MJ/kg to 0.9 Non-Renewable MJ/kg, representing a decrease of 52%. Using renewable energies to recycle silver also shows a notable decrease in the non-renewable energy cost of 32%. In the case of gold, the decrease in the exergy cost amounts to 32%, while for Pd, it is 54%.
Table 7 shows only the non-renewable exergy costs and their possible reduction from the case of primary extraction in 2050 with the current energy mix, representing the worst-case scenario. Table 7 considers the allocation scenarios with the exergy life cycle cost () and all metals studied. It shows that implementing renewable energies in primary extraction would reduce the non-renewable exergy cost between 67% and 87%. Copper would be the metal with the lowest reduction due to the high chemical exergy of chalcopyrite that is destroyed in the production process. However, primary extraction would still require the extraction of natural resources from the mines, which would be depleted in the mining process, and their ore grade would decrease. Recycling would, therefore, save these resources for future generations. In addition, recycling, even with fossil technologies ( 2020), would reduce the consumption of non-renewable resources even further, reaching reductions of 97.6% to 98.5%. However, the highest savings are obtained in the case of recycling using renewable energies. In this case, non-renewable exergy savings of 98.7% to 99.0% are achieved. Therefore, the most favorable cases are always those of recycling versus primary production, regardless of the energy sources used.
3.3. Circular thermoeconomics
Figure 6 and Figure 7 show two Sankey diagrams showing the complete life cycle of the metals and materials embedded in the PCBs, from their extraction in the mine to their recycling, through the exergy cost (measured in kWh). The exergy cost is divided into categories therefore we can differentiate between its non-renewable and renewable contributions. Figure 6 shows the 2020 case, which uses conventional resources, while Figure 7 shows the 2050 scenario, which uses renewable resources in all stages.
The primary production stages distinguish between the chemical exergy from ores and fuels, the exergy cost of mining and concentrating the ores, and the smelting and refining exergy cost of transforming the ores into metals. We can observe that mining and concentrating costs are higher than smelting and refining. This is due to the significant contribution of gold mining, which accounts for 89% of the non-renewable exergy cost of this step. In the remaining metals (Cu, Ag, and Pd), the non-renewable exergy cost of smelting and refining represents the largest part: between 88.3% and 92.3%. On the other hand, chemical exergy from mines and deposits comes mainly from plastics embedded in PCBs (73%).
Once the metals and materials were produced, we distinguished between the exergy cost necessary to produce the four recycling metals: Cu, Ag, Au, and Pd, and the rest of the metals and materials. The metals selected for recycling comprise 91% of the entire non-renewable exergy cost, corresponding to 4.9% for Cu, 7.2% for Ag, 65.8% for Au, and 13.4% for Pd. Therefore, the recycling process is correctly focused since it can recover most of the exergy cost embodied in metals.
PCB production involves more resource consumption than raw materials since it is necessary to assemble all the components, such as integrated circuits, capacitors, and resistors. In this study, we have estimated the electricity needed for assembly at 87.5 kWh/kg of PCBs, obtained from the study of Yu et al. [46]. This exergy consumption is almost of the same magnitude as that required for the primary production of the materials, representing 47% of the total non-renewable energy cost of production, the remaining 53% being due to the production of materials. This fact has important implications since all this exergy is destroyed during recycling because obtaining a new PCB will require consuming it again.
Once the PCB is produced, used and reaches the end of its lifetime (EoL PCB), we consider that it is collected and transported to the recycling plant we discussed in this study. However, not all EoL PCBs ends in plants suitable for recycling [47]. Moreover, this is one of the main challenge for the circular economy, as much of the WEEE is either not collected or ends up in unknown locations [9].
Recycling processes always consume resources. However, the non-renewable exergy cost of these resources is low compared to the exergy embedded in the materials recovered. In the case of 2020, 41,870 non-renewable kWh recovered 1,602,761 kWh embedded in copper, silver, gold, and palladium. Therefore, just taking the recycling view, we observe that they are very efficient processes since it is enough to invest 2.5% of non-renewable exergy to recover the remaining 97.5%. However, during the recycling process, there are more losses in addition to the resources used. On the one hand, all the exergy cost invested during assembly is lost since, in a new cycle, it will be necessary to consume this exergy cost. On the other hand, recycling processes are never 100% efficient due to mass (slag) and quality losses. Thus, if we take a complete view of the circular economy when recovering the 1,602,761 non-renewable kWh embedded in copper, silver, gold, and palladium, 1,795,200 non-renewable kWh are destroyed: mass and quality losses (9.8%), the exergy cost of recycling (2.3%) and the exergy cost of PCB production (87.9%). Therefore, considering only the recycling resources, it is enough to destroy 2.5% non-renewable exergy; however, when considering the complete life cycle, this exergy destruction amounts to 53%. In other words, in each circular economy cycle, more than half of the non-renewable resources are lost, despite considering 100% collections and having a process capable of recovering the most valuable metals (Cu, Ag, Au, and Pd), which make up 91% of the primary exergy cost of production.
One option to minimize the destruction of non-renewable exergy is to maximize the use of renewable energies in the primary production and recycling processes. However, renewable energies always have a non-renewable exergy cost due to their life cycle [20,21]. This scenario is depicted in Figure 7. In this scenario, we observe a strong decrease in non-renewable exergy destroyed. Thus, the non-renewable exergy destroyed goes from 1,795,200 kWh in the 2020 case (Figure 6 to 287,211 kWh in the 2050 case (Figure 7), i.e., by using renewable energies, the non-renewable exergy cost is reduced by 84%. The distribution of these losses (285,797 kWh) differs from the 2020 case, with 45.2% coming from mass and quality losses, 45.9% from production, and 8.9% from recycling. The significant increase in mass and quality losses for the 2020 case (from 9.8% to 45.2%) is mainly because the recycling process uses plastics as fuel, and all its chemical exergy is lost in the process. On the other hand, as in the 2020 case, the percentage of exergy destruction throughout the life cycle remains significant. In the case of 2050, 287,211 non-renewable kWh are destroyed to recover the 326,281 kWh embedded in the materials, representing an efficiency of 47%.
In addition to recovering metals, steam is obtained during this process from the hot gases in the reduction and oxidation stages. The non-renewable unit energy cost of the steam produced is 0.21 kJ/kJ and 0.16 kJ/kJ for the 2020 and 2050 scenarios, respectively, much lower than steam produced in a conventional steam boiler or a cogeneration plant driven by fossil fuels.
The important difference between considering a metal-centric approach [48] (with savings between 97.6-99.0%, depending on the metal considered, Table 7) and product-centric approach [48] (with only savings of 47-53%, Figure 6 and Figure 7), reinforces the importance of accounting for the entire life cycle of products (in this case a PCB) and of designing specific recycling processes that minimize the loss of non-renewable exergy. On the other hand, the high losses (47-53%) of non-renewable exergy during recycling indicate that these processes should be delayed as much as possible, encouraging other measures such as reuse. Moreover, these results serve to measure the efficiency of the circular economy as a whole since losses during these processes are unavoidable. Therefore, the question arises: to what extent is it possible to refer to a circular economy if it is necessary to destroy non-renewable energy in order to return materials to the economy, even while maximizing renewable energies? Thus, Valero et al. proposed the term Spiral Economy [49] with the aim of raising awareness of the inevitable losses of exergy during these processes, as established by the Second Principle of Thermodynamics.
4. Conclusions
This work applies thermoeconomics approach, using the TaesLab software, to analyze a PCB recycling process in which copper, silver, gold, and palladium are extracted. In addition, the methodology considers the complete PCB life cycle from the extraction of resources to the recycling through exergy. The exergy is disaggregated depending on its origin: non-renewable and renewable. Thus, we establish several scenarios for 2020 using conventional energy and 2050 using renewable energies to compare cleaner production scenarios.
The chemical exergy of metals is not a good criterion for resource cost allocation, as it does not characterize the utility of metals. As a solution, both life cycle exergy cost () and exergy replacement cost () are viable options.
The worst-case scenario is primary extraction in 2050 using conventional energy. Taking this scenario as a reference, it is possible to save between 67% and 87% of the non-renewable exergy cost just by applying renewable energies to primary production, despite the decrease in ore grade. The savings increase to 97.8-98.5% if metals comes from recycled PCBs using conventional energies and up to 98.6-99.0% using renewable energies during recycling. However, when considering the point of view of the PCB, the destruction of non-renewable resources is much higher, ranging between 47% and 53% of the exergy cost saved in the recovered metals. These significant inefficiencies are mainly due to the exergy cost of PCB assemblage and the exergy losses due to the plastics used as fuel during the recycling process. This result reinforces the importance of a product-centric compared to a metal-centric perspective, since each product has specific production processes which have to be considered as losses during its life-cycle, and recycling processes should be specifically design for each product.
Thermoeconomics and disaggregated exergy costs into non-renewable and renewable are very useful approaches for assessing the circularity and sustainability of materials. The objective of recycling should be to save non-renewable exergy, since it cannot be replaced by nature in the short-time. On the other hand, renewable exergy, although also destroyed in the processes of transforming matter, can be replaced by nature since it ultimately originates from the Sun. Thus, recycling not only serves to save minerals from the earth’s crust but also to save other non-renewable resources, such as natural gas, oil, or coal, and exergy can evaluate and compare all these resources with energy units only. The example of PCBs of this work shows that recycling should be delayed as much as possible in the life cycle of products since it always implies a significant destruction of non-renewable resources. Measures such as the reuse of PCBs in other devices, the reuse of their components, or the separation of plastics for recycling could delay recycling and minimize losses. The circular economy always presents exergy losses, as established by the Second Principle of Thermodynamics. Therefore, other denominations, such as Spiral Economy, could be more accurate since, in a spiral, the cycles are not completely closed.
Acknowledgments
This research was funded by the Spanish Ministry of Science, Innovation and Universities (grant number PID2023-148401OB-I00) and Horizon Europe project REDOL (Grant Agreement 101091668).
Conflicts of Interest
The authors declare no conflicts of interest.
Appendix A
This section shows all the data used in the methodology and few complementary results. Table A1 shows all the initial data used for the calculation of and of the metals.
Table A1.
Specific exergy values for primary extraction without considering ore grade and EROI declining (MJ/kg).
Table A1.
Specific exergy values for primary extraction without considering ore grade and EROI declining (MJ/kg).
| Cu | Ag | Au | Pd | |
|---|---|---|---|---|
| Exergy Minerals | 2.07E+01 | 1.51E+03 | 0.00E+00 | 1.93E+02 |
| NG_MC | 0.00E+00 | 3.66E+01 | 4.86E+04 | 0.00E+00 |
| OIL_MC | 3.34E-03 | 2.78E+02 | 7.72E+04 | 7.41E+03 |
| Coal_MC | 0.00E+00 | 1.13E+02 | 5.87E+03 | 0.00E+00 |
| Elec_MC | 3.94E+00 | 1.67E+03 | 1.02E+05 | 2.39E+04 |
| NG_MC_EFC | 1.04E-01 | 2.44E+01 | 8.05E+03 | 3.13E+02 |
| Oil_MC_EFC | 1.14E-02 | 5.37E+00 | 8.82E+02 | 1.30E+02 |
| Coal_MC_EFC | 2.27E-02 | 7.78E+00 | 2.69E+03 | 1.88E+01 |
| Elec_MC_EFC | 6.64E-03 | 2.55E+00 | 5.49E+03 | 4.52E+01 |
| NG_SR | 5.30E-01 | 1.73E+02 | 0.00E+00 | 5.95E+04 |
| Oil_SR | 1.69E+00 | 6.55E+02 | 0.00E+00 | 0.00E+00 |
| Coal_SR | 3.52E+00 | 2.95E+03 | 0.00E+00 | 0.00E+00 |
| Elec_SR | 9.71E+00 | 3.39E+03 | 0.00E+00 | 3.42E+04 |
| NG_SR_EFC | 1.93E-02 | 1.73E+02 | 0.00E+00 | 0.00E+00 |
| Oil_SR_EFC | 1.41E-01 | 4.37E+01 | 0.00E+00 | 0.00E+00 |
| Coal_SR_EFC | 4.86E-03 | 2.16E+01 | 0.00E+00 | 0.00E+00 |
| Elec_SR_EFC | 3.45E+00 | 1.95E+03 | 0.00E+00 | 0.00E+00 |
| Exergy Cost | 43.90 | 13,004 | 250,524 | 125,709 |
Table A2 shows the evolution of ore grade used for the years 2020 and 2050, used for the calculation of and of the metals.
Table A2.
Ore grade evolution of minerals (kg/kg)
| Cu | Ag | Au | Pd | |
|---|---|---|---|---|
| Ore grade () | 8.15E-03 | 1.79E-04 | 2.11E-06 | 7.94E-07 |
| Ore grade (2020) | 6.35E-03 | 1.56E-04 | 1.59E-06 | 6.93E-07 |
| Ore grade (2050) | 4.39E-03 | 1.28E-04 | 1.04E-06 | 5.66E-07 |
Table A3 shows the amount (in kg) of PCBs introduced into the recycling process, as well as the amount of products produced for the recycling scenarios.
Table A3.
PCB Recycling plant production values (kg)
| Type | Product | Scenario 2020 | Scenario 2050 |
|---|---|---|---|
| Input | PCB | 20,000 | 20,000 |
| Output | Steam | 19,127 | 21,260 |
| Output | Copper | 4,178 | 4,141 |
| Output | Silver | 19.80 | 19.80 |
| Output | Gold | 7.92 | 7.92 |
| Output | Palladium | 3.96 | 3.96 |
Table A4 and Table A5 show the resource cost in kW/kW used in the recycling process for the year 2020 and 2050, respectively. The difference between the two tables is due to the higher integration of renewable energy in the year 2050. The exergy cost is divided according to the origin of the exergy as stated in the methodology. Table A6 shows in kWh the non-renewable exergy cost of each flow depending on the selected exergy allocation criteria: B, or .
Table A4.
Cost of Resource streams for scenario 2020 (kW/kW)
| key | Mineral | NG | OIL | Coal | Elec-NR | H2-NR | Elec-RE | H2-RE | NR | RE | Total |
|---|---|---|---|---|---|---|---|---|---|---|---|
| A1 | 0.0000 | 0.0000 | 0.0000 | 0.0000 | 0.0000 | 0.0000 | 0.0000 | 0.0000 | 0.0000 | 0.0000 | 0.0000 |
| A2 | 0.0000 | 0.0000 | 0.0000 | 0.0000 | 1.7907 | 0.0000 | 0.2856 | 0.0000 | 1.7907 | 0.2856 | 2.0763 |
| B2 | 0.1316 | 0.5764 | 0.7117 | 2.7807 | 1.7348 | 0.0000 | 0.2767 | 0.0000 | 5.9353 | 0.2767 | 6.2120 |
| C1 | 0.0000 | 0.0000 | 0.0000 | 1.0600 | 0.0000 | 0.0000 | 0.0000 | 0.0000 | 1.0600 | 0.0000 | 1.0600 |
| C2 | 0.1459 | 0.6492 | 0.5768 | 3.5887 | 2.0496 | 0.0000 | 0.3269 | 0.0000 | 7.0102 | 0.3269 | 7.3371 |
| D1 | 0.0000 | 1.0400 | 0.0000 | 0.0000 | 0.0000 | 0.0000 | 0.0000 | 0.0000 | 1.0400 | 0.0000 | 1.0400 |
| D2 | 0.1459 | 0.6492 | 0.5768 | 3.5887 | 2.0496 | 0.0000 | 0.3269 | 0.0000 | 7.0102 | 0.3269 | 7.3371 |
| D3 | 0.0000 | 0.0000 | 0.0000 | 0.0000 | 0.0000 | 0.0000 | 0.0000 | 0.0000 | 0.0000 | 0.0000 | 0.0000 |
| E1 | 0.0000 | 0.0000 | 0.0000 | 0.0000 | 0.0000 | 0.0000 | 0.0000 | 0.0000 | 0.0000 | 0.0000 | 0.0000 |
| F1 | 0.0000 | 0.0000 | 0.0000 | 0.0000 | 1.7907 | 0.0000 | 0.2856 | 0.0000 | 1.7907 | 0.2856 | 2.0763 |
| F2 | 0.0000 | 0.0008 | 0.2457 | 0.0000 | 0.0598 | 0.0000 | 0.0095 | 0.0000 | 0.3063 | 0.0095 | 0.3158 |
| G1 | 0.0000 | 0.0000 | 0.0000 | 0.0000 | 0.0000 | 0.0000 | 0.0000 | 0.0000 | 0.0000 | 0.0000 | 0.0000 |
| H1 | 0.0000 | 0.0000 | 0.0000 | 0.0000 | 0.0000 | 0.0000 | 0.0000 | 0.0000 | 0.0000 | 0.0000 | 0.0000 |
| H2 | 0.0000 | 0.0000 | 0.0000 | 0.0000 | 1.7907 | 0.0000 | 0.2856 | 0.0000 | 1.7907 | 0.2856 | 2.0763 |
| J1 | 0.0000 | 0.0000 | 0.0000 | 0.0000 | 0.0000 | 0.0000 | 0.0000 | 0.0000 | 0.0000 | 0.0000 | 0.0000 |
| J2 | 0.0000 | 0.0000 | 0.0000 | 0.0000 | 1.7907 | 0.0000 | 0.2856 | 0.0000 | 1.7907 | 0.2856 | 2.0763 |
| K1 | 0.0000 | 0.0000 | 0.0000 | 0.0000 | 1.7907 | 0.0000 | 0.2856 | 0.0000 | 1.7907 | 0.2856 | 2.0763 |
| K2 | 0.0000 | 0.0005 | 0.1581 | 0.0000 | 0.1384 | 0.0000 | 0.0221 | 0.0000 | 0.2970 | 0.0221 | 0.3190 |
| L1 | 0.0000 | 0.0000 | 0.0000 | 0.0000 | 1.7907 | 0.0000 | 0.2856 | 0.0000 | 1.7907 | 0.2856 | 2.0763 |
| L2 | 0.0000 | 0.8176 | 0.1042 | 3.6408 | 5.2194 | 0.0000 | 0.8326 | 0.0000 | 9.7819 | 0.8326 | 10.6145 |
| M1 | 0.0000 | 0.0000 | 0.0000 | 0.0000 | 1.7907 | 0.0000 | 0.2856 | 0.0000 | 1.7907 | 0.2856 | 2.0763 |
| M2 | 0.0000 | 4.7442 | 0.1177 | 0.1241 | 25.6890 | 0.0000 | 4.0977 | 0.0000 | 30.6751 | 4.0977 | 34.7728 |
| N1 | 0.0000 | 0.0000 | 0.0000 | 0.0000 | 1.7907 | 0.0000 | 0.2856 | 0.0000 | 1.7907 | 0.2856 | 2.0763 |
| N2 | 0.0000 | 3.2800 | 0.0235 | 1.8735 | 16.1314 | 0.0000 | 2.5732 | 0.0000 | 21.3084 | 2.5732 | 23.8816 |
| NW1 | 0.0000 | 3.8847 | 0.0110 | 0.4451 | 8.9707 | 0.0000 | 1.4309 | 0.0000 | 13.3114 | 1.4309 | 14.7424 |
Table A5.
Costs of Resource streams for scenario 2050 (kW/kW)
| key | Mineral | NG | OIL | Coal | El-NR | H2-NR | El-RE | H2-RE | NR | RE | Total |
|---|---|---|---|---|---|---|---|---|---|---|---|
| A1 | 0.0000 | 0.0000 | 0.0000 | 0.0000 | 0.0000 | 0.0000 | 0.0000 | 0.0000 | 0.0000 | 0.0000 | 0.0000 |
| A2 | 0.0000 | 0.0000 | 0.0000 | 0.0000 | 0.1337 | 0.0000 | 0.9268 | 0.0000 | 0.1337 | 0.9268 | 1.0605 |
| B2 | 0.1316 | 0.5764 | 0.7117 | 2.7807 | 0.1296 | 0.0000 | 0.8978 | 0.0000 | 4.3300 | 0.8978 | 5.2278 |
| C11 | 0.0000 | 0.0000 | 0.0000 | 0.0000 | 0.0000 | 0.3232 | 0.0000 | 1.4638 | 0.3232 | 1.4638 | 1.7870 |
| C12 | 0.0000 | 0.0000 | 0.0000 | 0.0000 | 0.0000 | 0.3232 | 0.0000 | 1.4638 | 0.3232 | 1.4638 | 1.7870 |
| C2 | 0.1459 | 0.6492 | 0.5768 | 3.5887 | 0.1531 | 0.0000 | 1.0608 | 0.0000 | 5.1136 | 1.0608 | 6.1744 |
| D1 | 0.0000 | 0.0000 | 0.0000 | 0.0000 | 0.0000 | 0.3232 | 0.0000 | 1.4638 | 0.3232 | 1.4638 | 1.7870 |
| D2 | 0.1459 | 0.6492 | 0.5768 | 3.5887 | 0.1531 | 0.0000 | 1.0608 | 0.0000 | 5.1136 | 1.0608 | 6.1744 |
| D3 | 0.0000 | 0.0000 | 0.0000 | 0.0000 | 0.0000 | 0.0000 | 0.0000 | 0.0000 | 0.0000 | 0.0000 | 0.0000 |
| E1 | 0.0000 | 0.0000 | 0.0000 | 0.0000 | 0.0000 | 0.0000 | 0.0000 | 0.0000 | 0.0000 | 0.0000 | 0.0000 |
| F1 | 0.0000 | 0.0000 | 0.0000 | 0.0000 | 0.1337 | 0.0000 | 0.9268 | 0.0000 | 0.1337 | 0.9268 | 1.0605 |
| F2 | 0.0000 | 0.0008 | 0.2457 | 0.0000 | 0.0045 | 0.0000 | 0.0309 | 0.0000 | 0.2510 | 0.0309 | 0.2819 |
| G1 | 0.0000 | 0.0000 | 0.0000 | 0.0000 | 0.0000 | 0.0000 | 0.0000 | 0.0000 | 0.0000 | 0.0000 | 0.0000 |
| H1 | 0.0000 | 0.0000 | 0.0000 | 0.0000 | 0.0000 | 0.0000 | 0.0000 | 0.0000 | 0.0000 | 0.0000 | 0.0000 |
| H2 | 0.0000 | 0.0000 | 0.0000 | 0.0000 | 0.1337 | 0.0000 | 0.9268 | 0.0000 | 0.1337 | 0.9268 | 1.0605 |
| J1 | 0.0000 | 0.0000 | 0.0000 | 0.0000 | 0.0000 | 0.0000 | 0.0000 | 0.0000 | 0.0000 | 0.0000 | 0.0000 |
| J2 | 0.0000 | 0.0000 | 0.0000 | 0.0000 | 0.1337 | 0.0000 | 0.9268 | 0.0000 | 0.1337 | 0.9268 | 1.0605 |
| K1 | 0.0000 | 0.0000 | 0.0000 | 0.0000 | 0.1337 | 0.0000 | 0.9268 | 0.0000 | 0.1337 | 0.9268 | 1.0605 |
| K2 | 0.0000 | 0.0005 | 0.1581 | 0.0000 | 0.0103 | 0.0716 | 0.0000 | 0.0000 | 0.2405 | 0.0000 | 0.2405 |
| L1 | 0.0000 | 0.0000 | 0.0000 | 0.0000 | 0.1337 | 0.0000 | 0.9268 | 0.0000 | 0.1337 | 0.9268 | 1.0605 |
| L2 | 0.0000 | 0.8176 | 0.1042 | 3.6408 | 0.3898 | 0.0000 | 2.7012 | 0.0000 | 4.9523 | 2.7012 | 7.6535 |
| M1 | 0.0000 | 0.0000 | 0.0000 | 0.0000 | 0.1337 | 0.0000 | 0.9268 | 0.0000 | 0.1337 | 0.9268 | 1.0605 |
| M2 | 0.0000 | 4.7442 | 0.1177 | 0.1241 | 1.9184 | 0.0000 | 13.2951 | 0.0000 | 6.9045 | 13.2951 | 20.1995 |
| N1 | 0.0000 | 0.0000 | 0.0000 | 0.0000 | 0.1337 | 0.0000 | 0.9268 | 0.0000 | 0.1337 | 0.9268 | 1.0605 |
| N2 | 0.0000 | 3.2800 | 0.0235 | 1.8735 | 1.2047 | 0.0000 | 8.3486 | 0.0000 | 6.3817 | 8.3486 | 14.7303 |
| NW1 | 0.0000 | 3.8847 | 0.0110 | 0.4451 | 0.6699 | 0.0000 | 4.6427 | 0.0000 | 5.0107 | 4.6427 | 9.6533 |
Table A6.
Non Renewable exergy cost of flows in PCB Recovery plant (kWh)
| Scenario 2020 | Scenario 2050 | |||||
|---|---|---|---|---|---|---|
| Key | B | ELC | ERC | B | ELC | ERC |
| A1 | 0.00 | 0.00 | 0.00 | 0.00 | 0.00 | 0.00 |
| A2 | 1571.16 | 1571.16 | 1571.16 | 117.33 | 117.33 | 117.33 |
| B2 | 9209.18 | 9209.18 | 9209.18 | 13318.47 | 13318.47 | 13318.47 |
| C1 | 2095.38 | 2095.38 | 2095.38 | 1156.90 | 1156.90 | 1156.90 |
| C2 | 10639.59 | 10639.59 | 10639.59 | 6679.64 | 6679.64 | 6679.64 |
| D1 | 4633.36 | 4633.36 | 4633.36 | 1051.73 | 1051.73 | 1051.73 |
| D2 | 2853.94 | 2853.94 | 2853.94 | 2592.33 | 2592.33 | 2592.33 |
| D3 | 0.00 | 0.00 | 0.00 | 0.00 | 0.00 | 0.00 |
| E1 | 0.00 | 0.00 | 0.00 | 0.00 | 0.00 | 0.00 |
| F1 | 2553.73 | 2553.73 | 2553.73 | 189.00 | 189.00 | 189.00 |
| F2 | 49.01 | 49.01 | 49.01 | 39.97 | 39.97 | 39.97 |
| G1 | 0.00 | 0.00 | 0.00 | 0.00 | 0.00 | 0.00 |
| H1 | 0.00 | 0.00 | 0.00 | 0.00 | 0.00 | 0.00 |
| H2 | 185.00 | 185.00 | 185.00 | 15.36 | 15.36 | 15.36 |
| J1 | 0.00 | 0.00 | 0.00 | 0.00 | 0.00 | 0.00 |
| J2 | 6215.47 | 6215.47 | 6215.47 | 0.00 | 0.00 | 0.00 |
| K1 | 41.15 | 41.15 | 41.15 | 3.07 | 3.07 | 3.07 |
| K2 | 3.10 | 3.10 | 3.10 | 2.51 | 2.51 | 2.51 |
| L1 | 40.38 | 40.38 | 40.38 | 3.02 | 3.02 | 3.02 |
| L2 | 56.60 | 56.60 | 56.60 | 28.66 | 28.66 | 28.66 |
| M1 | 81.38 | 81.38 | 81.38 | 6.08 | 6.08 | 6.08 |
| M2 | 633.16 | 633.16 | 633.16 | 142.51 | 142.51 | 142.51 |
| N1 | 43.80 | 43.80 | 43.80 | 3.27 | 3.27 | 3.27 |
| N2 | 279.73 | 279.73 | 279.73 | 83.78 | 83.78 | 83.78 |
| NW1 | 684.52 | 684.52 | 684.52 | 257.67 | 257.67 | 257.67 |
| AB1 | 16297.48 | 210.67 | 18.34 | 15240.92 | 38.83 | 3.95 |
| AB2 | 3446.58 | 3296.54 | 3221.52 | 3223.14 | 865.65 | 694.41 |
| BC | 46226.91 | 17319.95 | 16943.31 | 33734.90 | 14357.88 | 14172.20 |
| BG | 5882.10 | 1601.05 | 1549.87 | 4332.54 | 11.04 | 1.12 |
| B3 | 21189.91 | 136.64 | 22.12 | 22543.71 | 138.71 | 31.72 |
| CB | 33411.57 | 531.60 | 260.37 | 23802.04 | 282.00 | 187.80 |
| CD | 32885.68 | 29298.35 | 29121.56 | 24254.47 | 21618.67 | 21507.40 |
| CH | 845.42 | 845.42 | 845.42 | 353.37 | 353.37 | 353.37 |
| DC | 7044.87 | 137.70 | 67.87 | 6093.21 | 49.64 | 30.13 |
| DE | 38327.23 | 42145.11 | 42022.11 | 25076.05 | 28997.24 | 28891.22 |
| EF | 38327.23 | 42145.11 | 42022.11 | 25076.05 | 28997.24 | 28891.22 |
| FD | 4999.12 | 5497.16 | 5481.12 | 3270.73 | 3784.15 | 3769.89 |
| FK | 208.73 | 37149.67 | 37994.81 | 134.99 | 24450.93 | 24612.73 |
| GH | 5882.10 | 1601.05 | 1549.87 | 4332.54 | 11.04 | 1.12 |
| H4 | 2002.07 | 728.05 | 712.82 | 1281.68 | 99.67 | 96.96 |
| JB | 5805.55 | 5805.55 | 5805.55 | 0.00 | 0.00 | 0.00 |
| JC | 409.92 | 409.92 | 409.92 | 0.00 | 0.00 | 0.00 |
| KF | 101.39 | 4.26 | 2.33 | 56.34 | 2.02 | 1.51 |
| KL | 151.60 | 37189.66 | 38036.73 | 84.24 | 24454.49 | 24616.81 |
| LM | 83.91 | 34577.53 | 38002.19 | 39.13 | 22654.82 | 24563.47 |
| MN | 615.50 | 6137.51 | 34509.91 | 144.71 | 2993.54 | 22026.94 |
| N4 | 150.96 | 463.76 | 320.85 | 35.49 | 303.76 | 204.79 |
| STM | 4910.45 | 1903.41 | 1867.46 | 3419.59 | 280.09 | 272.89 |
| Cu | 35823.50 | 2105.27 | 1151.24 | 21955.64 | 993.15 | 739.07 |
| Ag | 164.67 | 2709.11 | 131.52 | 76.78 | 1831.34 | 85.01 |
| Au | 182.94 | 29154.55 | 4206.82 | 43.01 | 19809.87 | 2685.12 |
| Pd | 788.07 | 5997.28 | 34512.58 | 196.26 | 2776.83 | 21909.19 |
| PYW | 21189.91 | 136.64 | 22.12 | 22543.71 | 138.71 | 31.72 |
| HGW | 2002.07 | 728.05 | 712.82 | 1281.68 | 99.67 | 96.96 |
| SLW | 835.49 | 1148.28 | 1005.38 | 293.16 | 561.42 | 462.46 |
References
- Xu, M.; David, J.M.; Kim, S.H. The fourth industrial revolution: Opportunities and challenges. International Journal of Financial Research 2018, 9, 90–95. [Google Scholar] [CrossRef]
- Agency, I.E. Net Zero by 2050 - A Roadmap for the Global Energy Sector, 2021.
- Lallana, M.; Torrubia, J.; Valero, A. Metals for energy and digital transition in Spain: Demand, recycling and sufficiency alternatives. Resources, Conservation and Recycling 2024, 205. [Google Scholar] [CrossRef]
- Torrubia, J.; Valero, A.; Valero, A. Thermodynamic Rarity Assessment of Mobile Phone PCBs: A Physical Criticality Indicator in Times of Shortage. Entropy 2022, 24. [Google Scholar] [CrossRef] [PubMed]
- Carrara, S.; Dias, P.A.; Plazzotta, B.; Pavel, C. Raw materials demand for wind and solar PV technologies in the transition towards a decarbonised energy system.; Publications Office of the European Union, 2020, 2020.
- Agency, I.E. Energy Technology Perspectives 2023, 2023.
- Mudd, G.M. The sustainability of mining in Australia : key production trends and their environmental implications for the future, 2009.
- Dong, D.; van Oers, L.; Tukker, A.; van der Voet, E. Assessing the future environmental impacts of copper production in China: Implications of the energy transition. Journal of Cleaner Production 2020, 274. [Google Scholar] [CrossRef]
- Torrubia, J.; Valero, A.; Valero, A.; Lejuez, A. Challenges and Opportunities for the Recovery of Critical Raw Materials from Electronic Waste: The Spanish Perspective. Sustainability 2023, 15, 1393. [Google Scholar] [CrossRef]
- Forti, V.; Balde, C.; Kuehr, R. E-Waste Statistics: Guidelines on Classification Reporting and Indicators, second edition, 2018.
- Chen, J.; Wang, Z.; Wu, Y.; Li, L.; Li, B.; Pan, D.; Zuo, T. Environmental benefits of secondary copper from primary copper based on life cycle assessment in China. Resources, Conservation and Recycling 2019, 146, 35–44. [Google Scholar] [CrossRef]
- Zhang, W.; Li, Z.; Dong, S.; Qian, P.; Ye, S.; Hu, S.; Xia, B.; Wang, C. Analyzing the environmental impact of copper-based mixed waste recycling-a LCA case study in China. Journal of Cleaner Production 2021, 284. [Google Scholar] [CrossRef]
- Zhang, J.; Tian, X.; Chen, W.; Geng, Y.; Wilson, J. Measuring environmental impacts from primary and secondary copper production under the upgraded technologies in key Chinese enterprises. Environmental Impact Assessment Review 2022, 96. [Google Scholar] [CrossRef]
- Dong, D.; Tukker, A.; Steubing, B.; van Oers, L.; Rechberger, H.; Aguilar-Hernandez, G.A.; Li, H.; der Voet, E.V. Assessing China’s potential for reducing primary copper demand and associated environmental impacts in the context of energy transition and “Zero waste” policies. Waste Management 2022, 144, 454–467. [Google Scholar] [CrossRef]
- Amini, S.H.; Remmerswaal, J.A.; Castro, M.B.; Reuter, M.A. Quantifying the quality loss and resource efficiency of recycling by means of exergy analysis. Journal of Cleaner Production 2007, 15, 907–913. [Google Scholar] [CrossRef]
- Castro, M.B.; Remmerswaal, J.A.; Brezet, J.C.; Reuter, M.A. Exergy losses during recycling and the resource efficiency of product systems. Resources, Conservation and Recycling 2007, 52, 219–233. [Google Scholar] [CrossRef]
- Szargut, J.; Morris, D.R.; Steward, F.R. Exergy Analysis of Thermal, Chemical, and Metallurgical Processes, first ed.; Taylor & Francis Inc, 1988.
- Valero, A.; Ángel Lozano, M.; Muñoz, M. A general theory of exergy saving. I. On the exergetic cost. Computer-aided engineering and energy systems: second law analysis and modelling 1986, 3, 1–8. [Google Scholar]
- Torres, C.; Valero, A. The exergy cost theory revisited. Energies 2021, 14. [Google Scholar] [CrossRef]
- Torrubia, J.; Valero, A.; Valero, A. Renewable exergy return on investment (RExROI) in energy systems. The case of silicon photovoltaic panels. Energy 2024, 304. [Google Scholar] [CrossRef]
- Torrubia, J.; Valero, A.; Valero, A. Non-renewable and renewable levelized exergy cost of electrity (LExCOE) with focus on its infrastructure: 1900-2050. Under Review (Energy) 2024. [Google Scholar]
- Meester, B.D.; Dewulf, J.; Janssens, A.; Langenhove, H.V. An improved calculation of the exergy of natural resources for Exergetic Life Cycle Assessment (ELCA). Environmental Science and Technology 2006, 40, 6844–6851. [Google Scholar] [CrossRef]
- Dewulf, J.; Bösch, M.E.; Meester, B.D.; Vorst, G.V.D.; Langenhove, H.V.; Hellweg, S.; Huijbregts, M.A. Cumulative exergy extraction from the natural environment (CEENE): A comprehensive life cycle impact assessment method for resource accounting. Environmental Science and Technology 2007, 41, 8477–8483. [Google Scholar] [CrossRef]
- Ignatenko, O.; van Schaik, A.; Reuter, M.A. Exergy as a tool for evaluation of the resource efficiency of recycling systems. Minerals Engineering 2007, 20, 862–874. [Google Scholar] [CrossRef]
- Ghodrat, M.; Samali, B.; Rhamdhani, M.A.; Brooks, G. Thermodynamic-based exergy analysis of precious metal recovery out of waste printed circuit board through black copper smelting process. Energies 2019, 12. [Google Scholar] [CrossRef]
- Reuter, M.A.; Degel, R.; Borowski, N.; Apushkin, D. Digital twin for KGHM-Legnica: Simulation-based footprinting and exergy allocation of impacts. 2023.
- Vierunketo, M.; Klemettinen, A.; Reuter, M.A.; Santasalo-Aarnio, A.; Serna-Guerrero, R. A multi-dimensional indicator for material and energy circularity: Proof-of-concept of exentropy in Li-ion battery recycling. iScience 2023, 26. [Google Scholar] [CrossRef]
- Lai, F.; Laurent, F.; Beylot, A.; Villeneuve, J. Solving multifunctionality in the carbon footprint assessment of primary metals production: Comparison of different approaches. Minerals Engineering 2021, 170. [Google Scholar] [CrossRef]
- Farjana, S.H.; Huda, N.; Mahmud, M.A.P.; Saidur, R. A review on the impact of mining and mineral processing industries through life cycle assessment, 2019. [CrossRef]
- Santero, N.; Hendry, J. Harmonization of LCA methodologies for the metal and mining industry. International Journal of Life Cycle Assessment 2016, 21, 1543–1553. [Google Scholar] [CrossRef]
- Torrubia, J.; Valero, A.; Valero, A. Energy and carbon footprint of metals through physical allocation. Implications for energy transition. Resources, Conservation and Recycling 2023, 199, 107281. [Google Scholar] [CrossRef]
- Valero, A.; Domínguez, A.; Valero, A. Exergy cost allocation of by-products in the mining and metallurgical industry. Resources, Conservation and Recycling 2015, 102, 128–142. [Google Scholar] [CrossRef]
- Llamas, A.A.; Delgado, A.V.; Capilla, A.V.; Cuadra, C.T.; Hultgren, M.; Peltomäki, M.; Roine, A.; Stelter, M.; Reuter, M.A. Simulation-based exergy, thermo-economic and environmental footprint analysis of primary copper production. Minerals Engineering 2019, 131, 51–65. [Google Scholar] [CrossRef]
- Valero, A.; Valero, A.; Stanek, W. Assessing the exergy degradation of the natural capital: From Szargut’s updated reference environment to the new thermoecological-cost methodology. Energy 2018, 163, 1140–1149. [Google Scholar] [CrossRef]
- Hall, C.A.; Lambert, J.G.; Balogh, S.B. EROI of different fuels and the implications for society. Energy Policy 2014, 64, 141–152. [Google Scholar] [CrossRef]
- Valero, A.; Valero, A. What are the clean reserves of fossil fuels? Resources, Conservation and Recycling 2012, 68, 126–131. [Google Scholar] [CrossRef]
- Calvo, G.; Mudd, G.; Valero, A.; Valero, A. Decreasing ore grades in global metallic mining: A theoretical issue or a global reality? Resources 2016, 5. [Google Scholar] [CrossRef]
- der Voet, E.V.; Oers, L.V.; Verboon, M.; Kuipers, K. Environmental Implications of Future Demand Scenarios for Metals: Methodology and Application to the Case of Seven Major Metals. Journal of Industrial Ecology 2019, 23, 141–155. [Google Scholar] [CrossRef]
- Norgate, T.; Haque, N. Energy and greenhouse gas impacts of mining and mineral processing operations. Journal of Cleaner Production 2010, 18, 266–274. [Google Scholar] [CrossRef]
- Torres, C.; Valero, A.; Valero-Delgado, A. TaesLab: An advanced software tool for circular thermoeconomics. 2023.
- Torrubia, J.; Parvez, A.M.; Sajjad, M.; Paz, F.G.; Charitos, A.; Valero, A.; van der Boogaart, K.G. Copper recovery from electronic waste: An energy transition approach to decarbonise the industry. Manuscript submitted for publication 2024. [Google Scholar]
- Bassorgun, A. Precious metal recovery from secondary copper anode slimes through hydrometallurgical route: A study with process simulation and life-cycle assessment approach. 2023.
- He, S. Precious metal recovery from secondary copper anode slimes: a sensitivity analysis study using life cycle assessment approach. 2024.
- Iglesias-Émbil, M.; Valero, A.; Ortego, A.; Villacampa, M.; Vilaró, J.; Villalba, G. Raw material use in a battery electric car – a thermodynamic rarity assessment. Resources, Conservation and Recycling 2020, 158. [Google Scholar] [CrossRef]
- Torrubia, J.; Lima, A.; Valero, A.; Valero, A. How renewable is green hydrogen? Analysis of the exergy cost of its production. 7 2024.
- Yu, J.; Williams, E.; Ju, M. Analysis of material and energy consumption of mobile phones in China. Energy Policy 2010, 38, 4135–4141. [Google Scholar] [CrossRef]
- Baldé, C.P.; D’Angelo, E.; Luda, V.; Deubzer, O.; Kuehr, R. Global Transboundary E-waste Flows Monitor - 2022, 2022.
- Reuter, M.; Schaik, A.V. Chapter 5 - Material and product-centric recycling: design for recycling rules and digital methods; Elservier, 2024; pp. 79–95. [CrossRef]
- Valero, A.; Valero, A. Thermodynamic Rarity and Recyclability of Raw Materials in the Energy Transition: The Need for an In-Spiral Economy. Entropy 2019, 21, 873. [Google Scholar] [CrossRef]
Figure 1.
Exergy life cycle cost () calculation of a metal
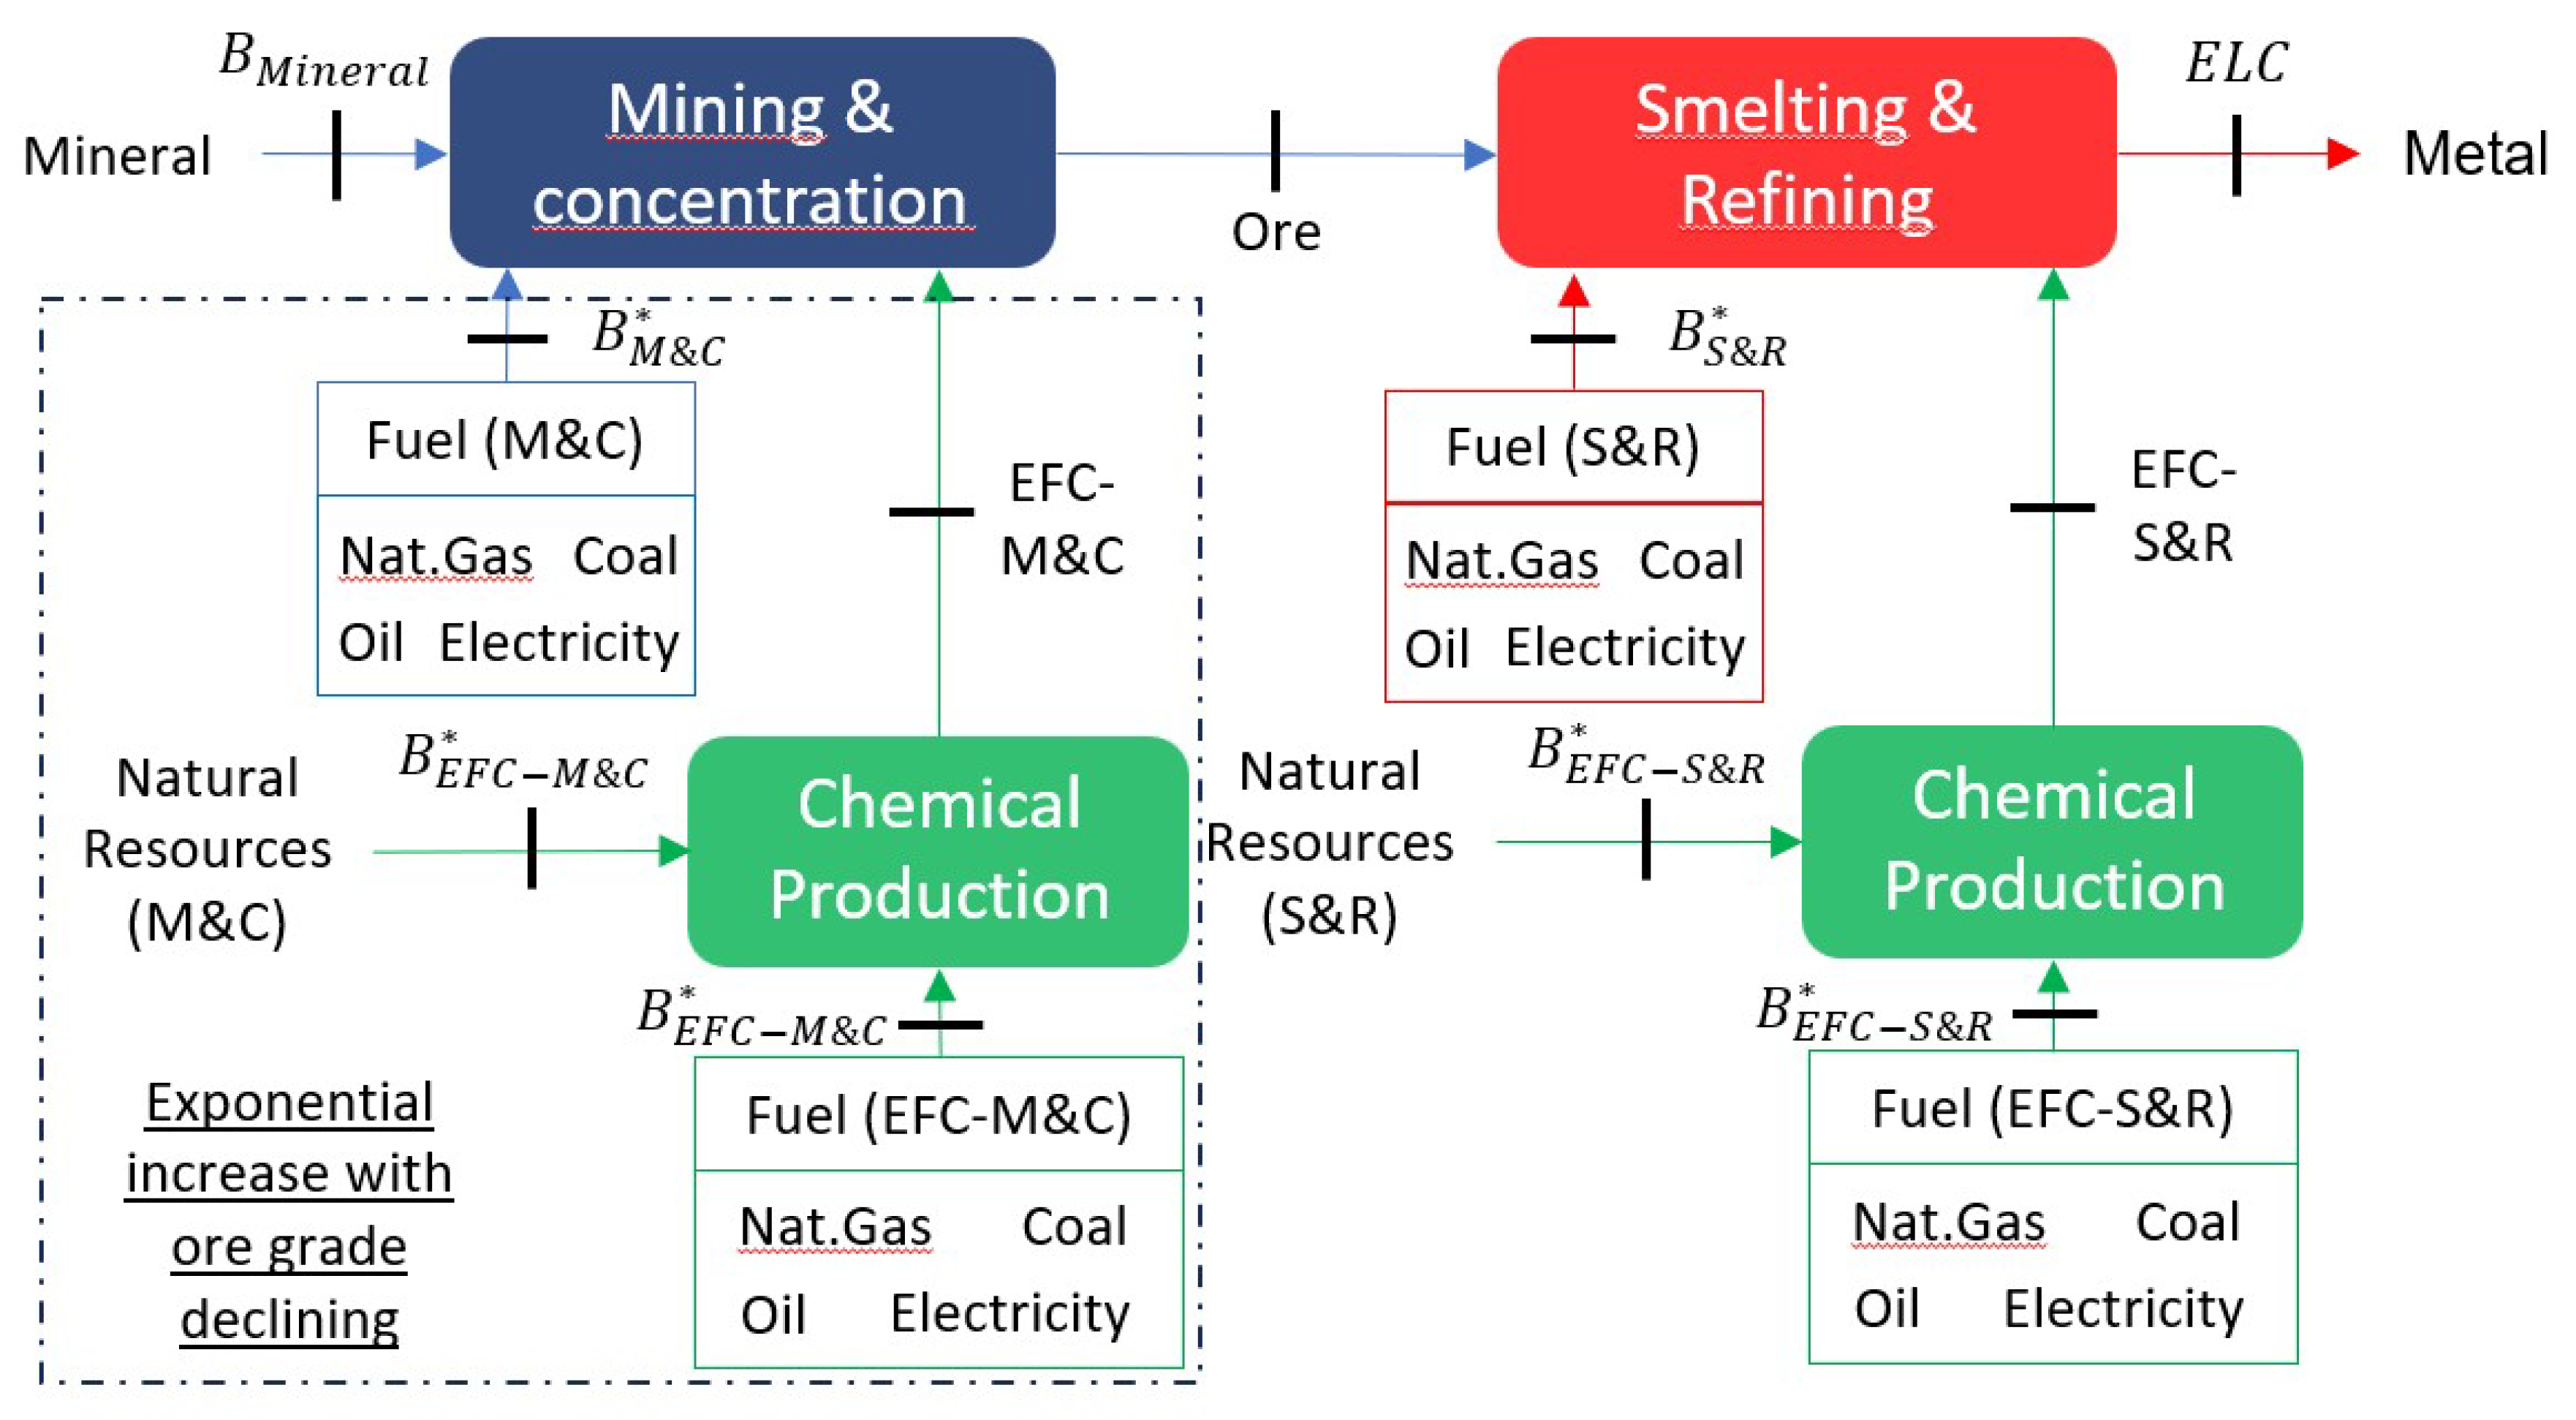
Figure 2.
Exergy cost evolution with ore grade decrease.
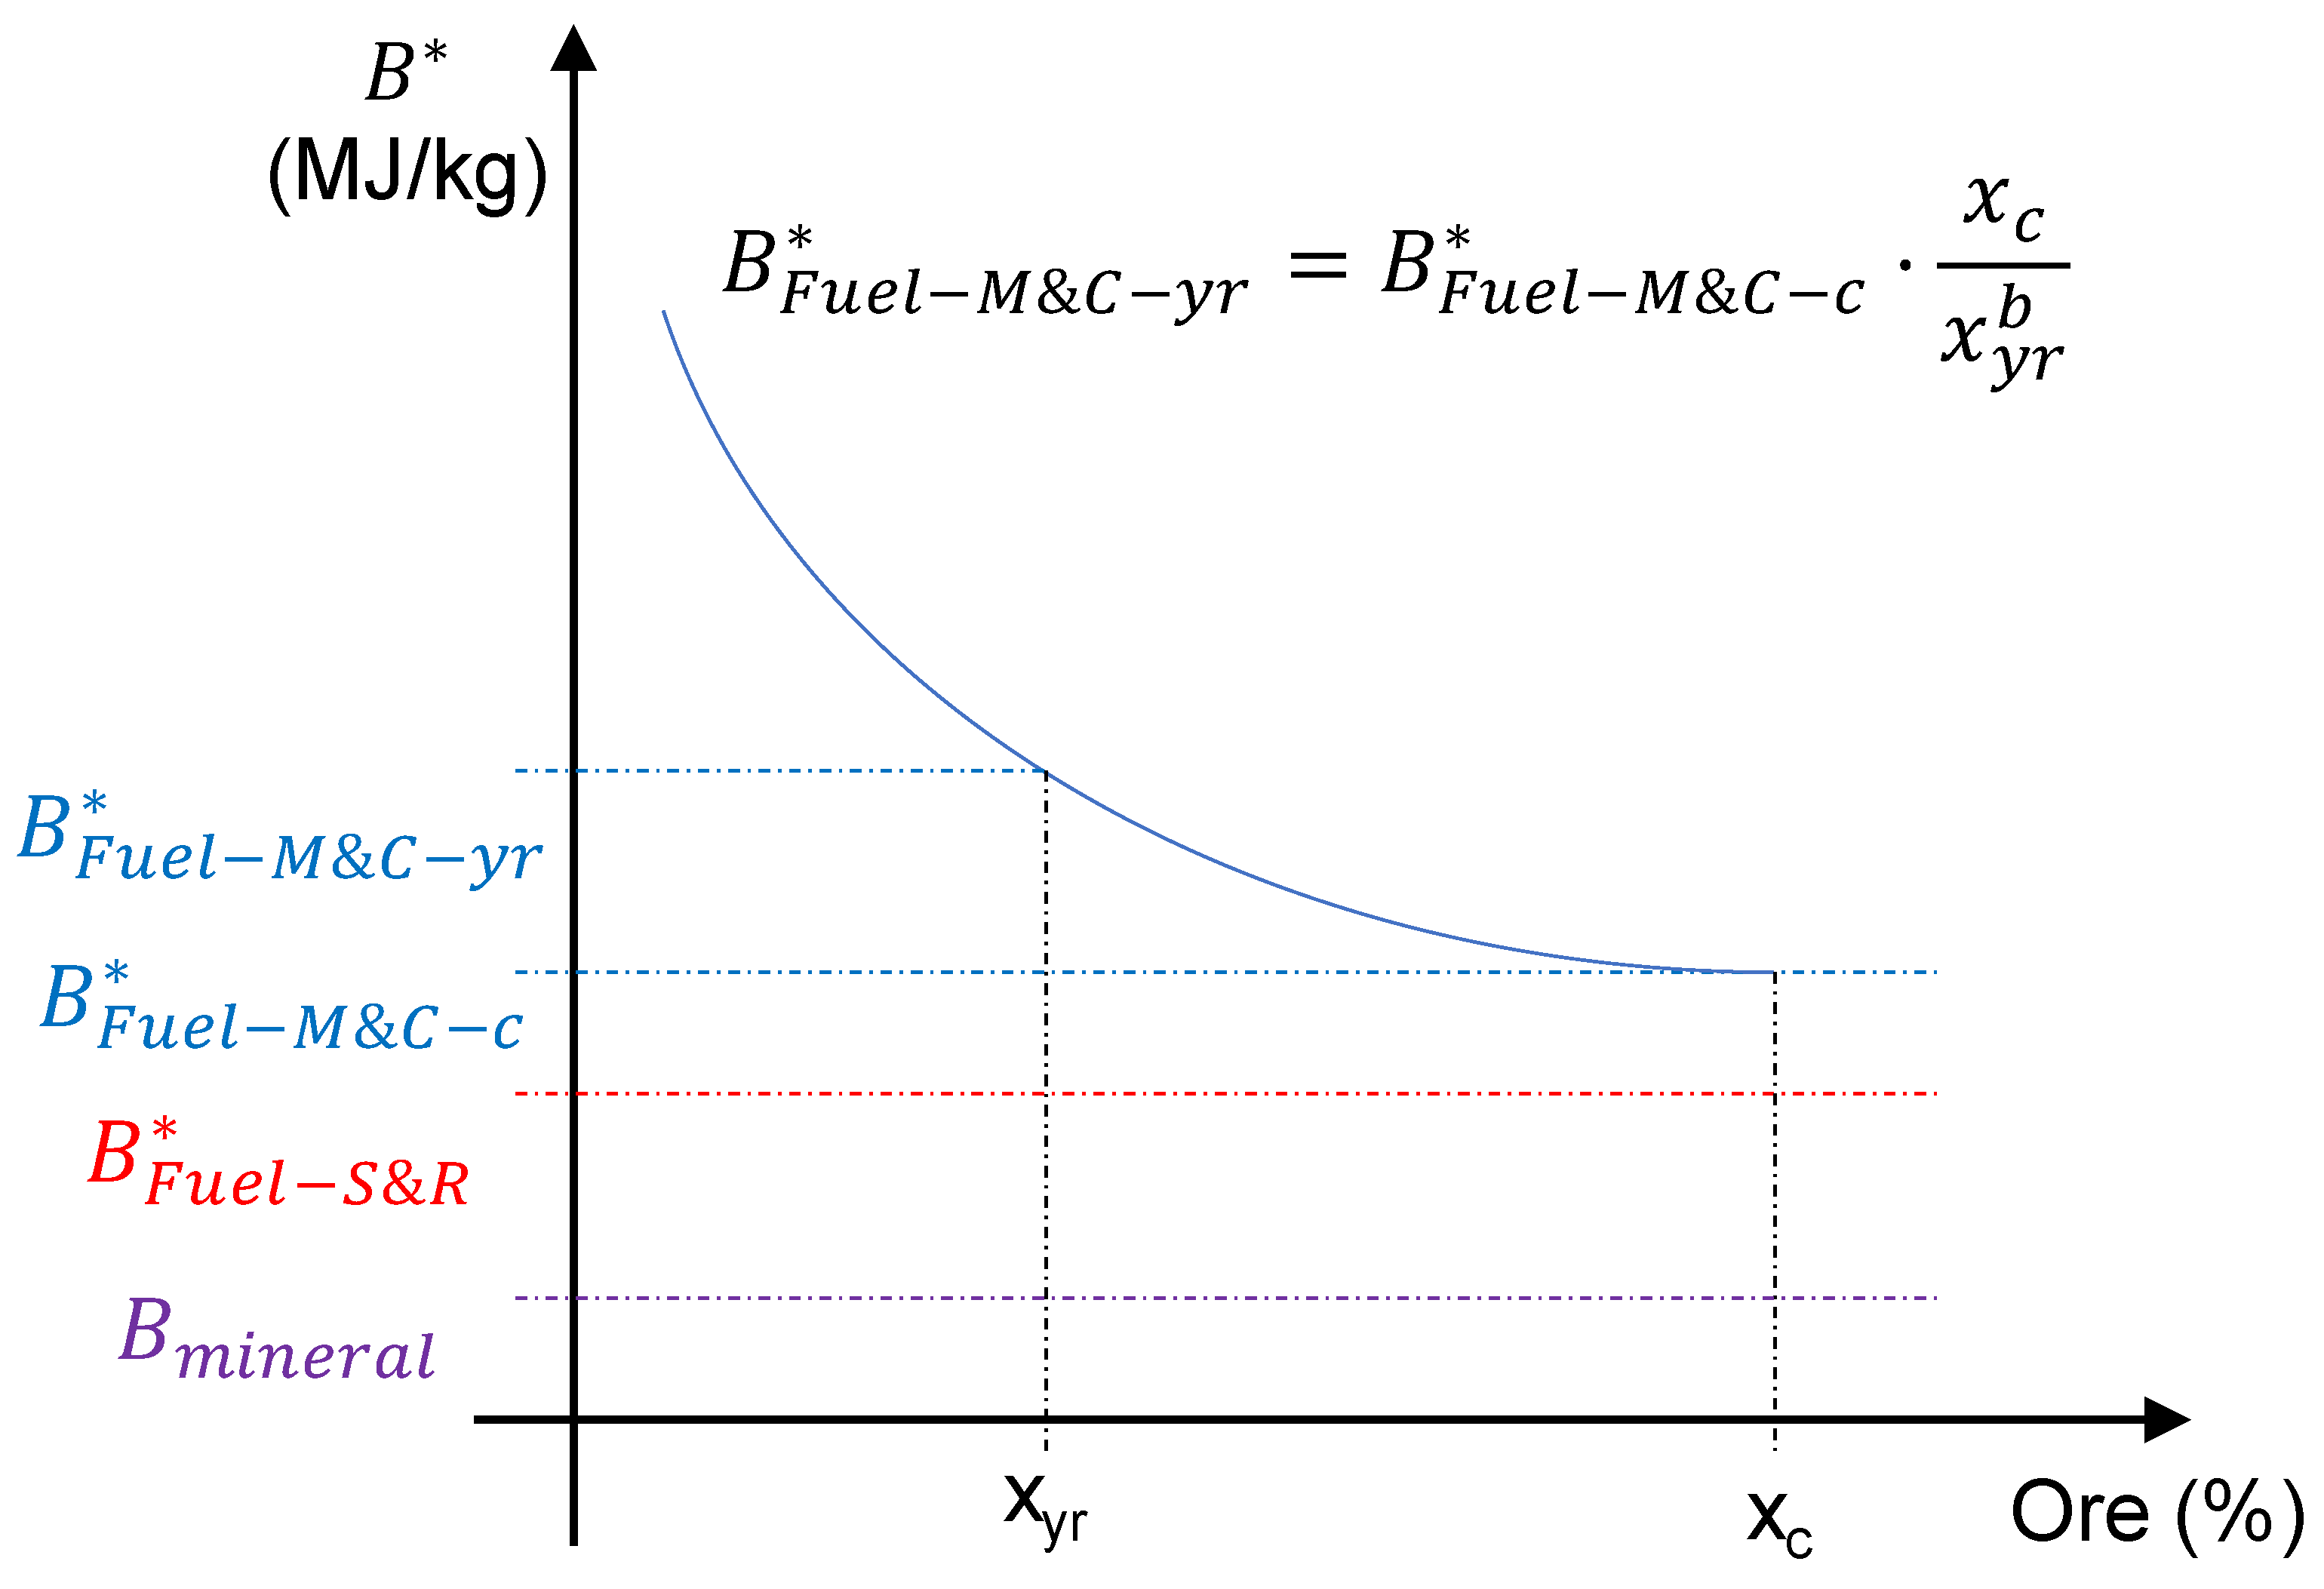
Figure 3.
Block Flows Diagram of the PCB recycling process.
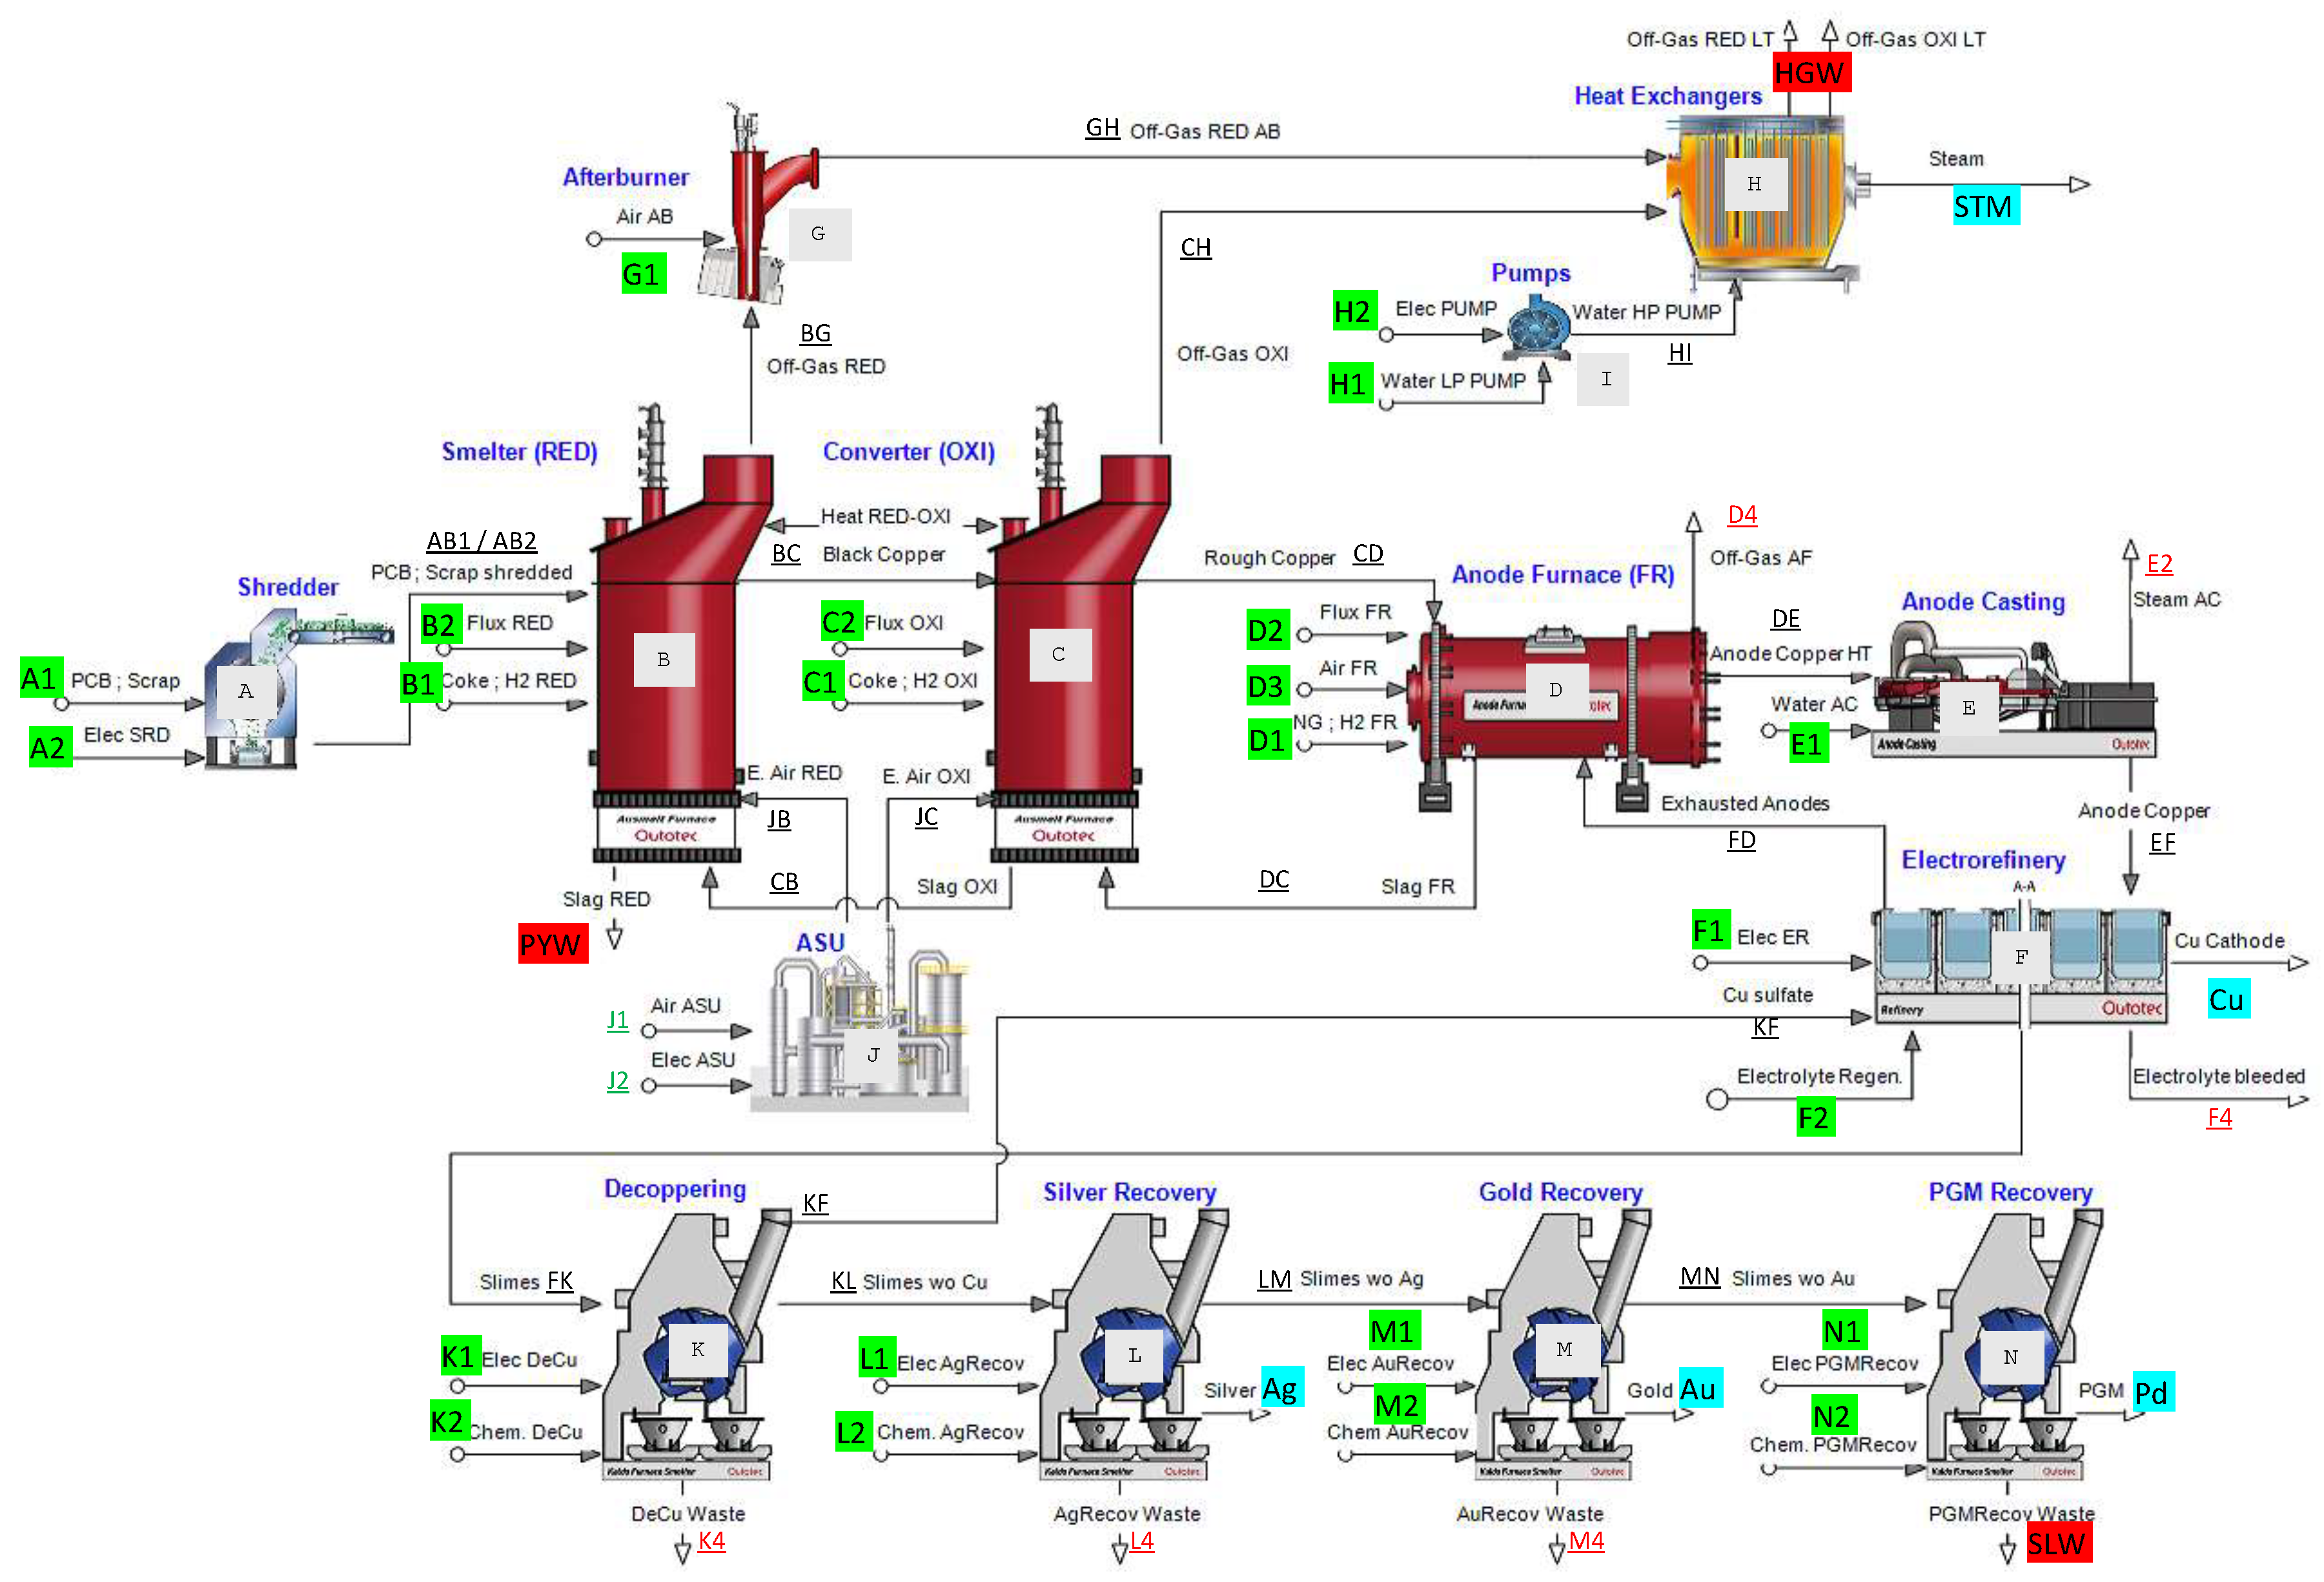
Figure 4.
Thermoeconomic Diagram of the PCB recycling process.
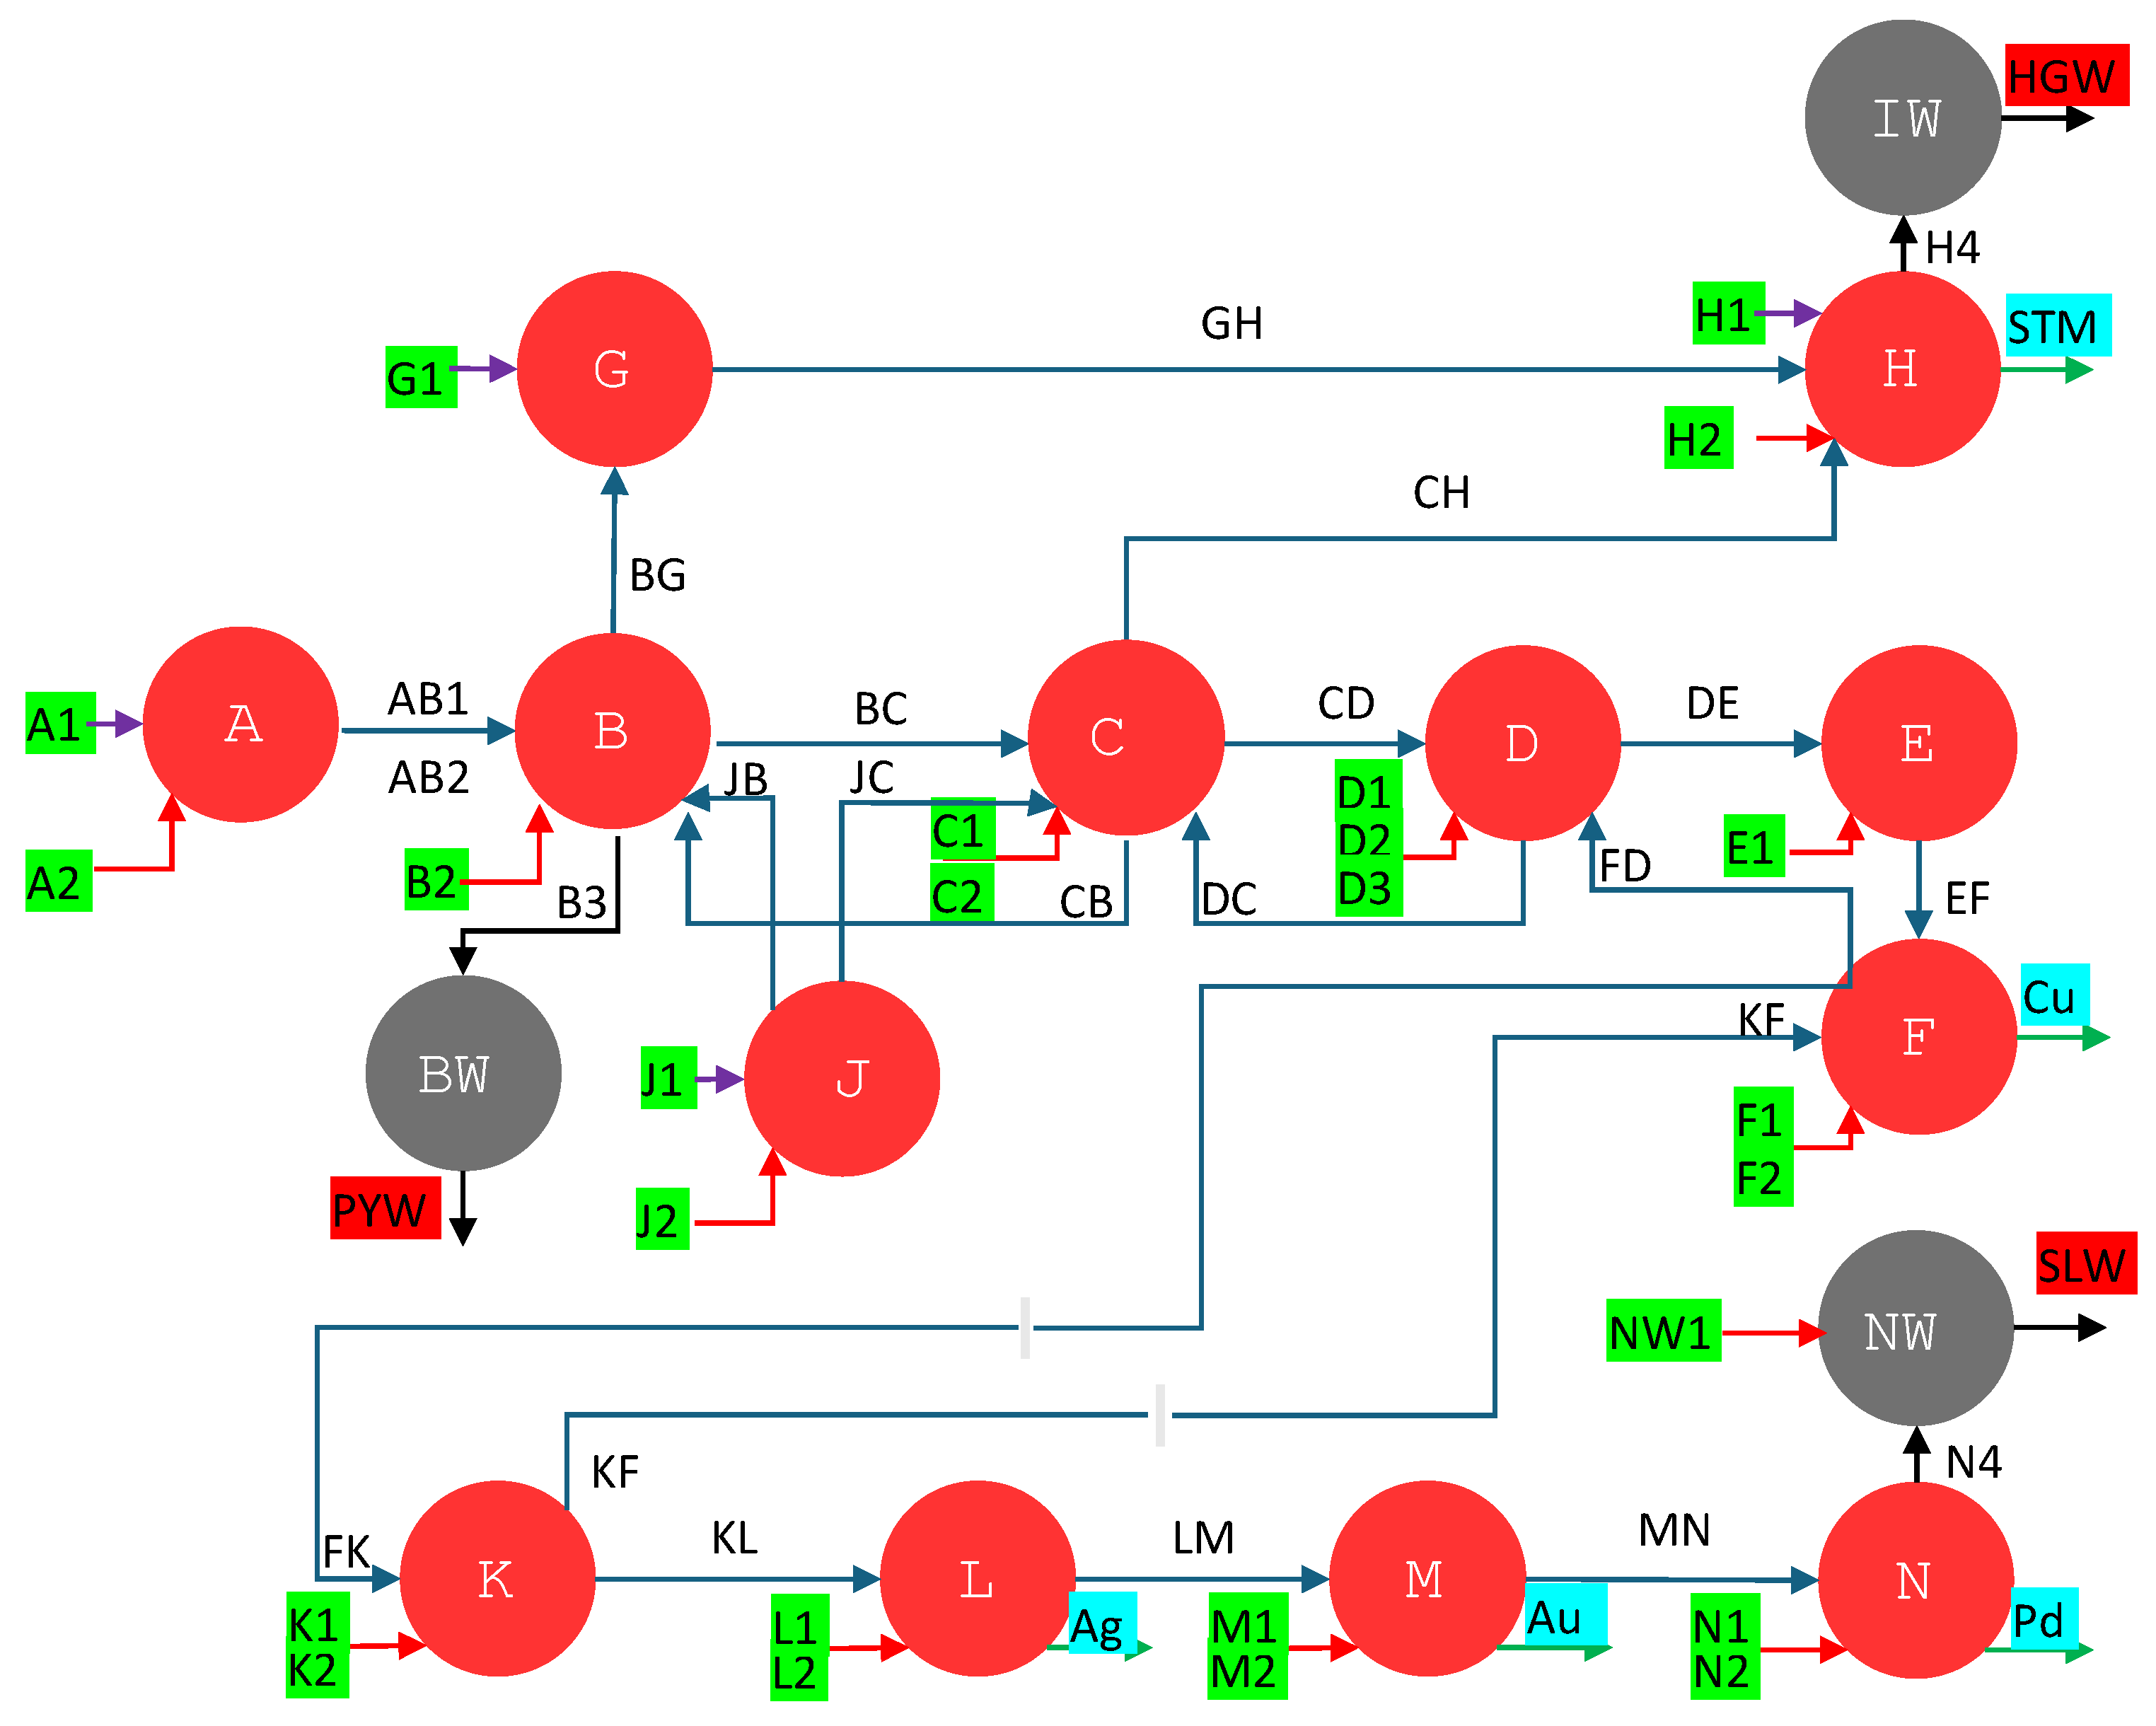
Figure 5.
Disaggregated exergy cost of primary metals vs. recycling.
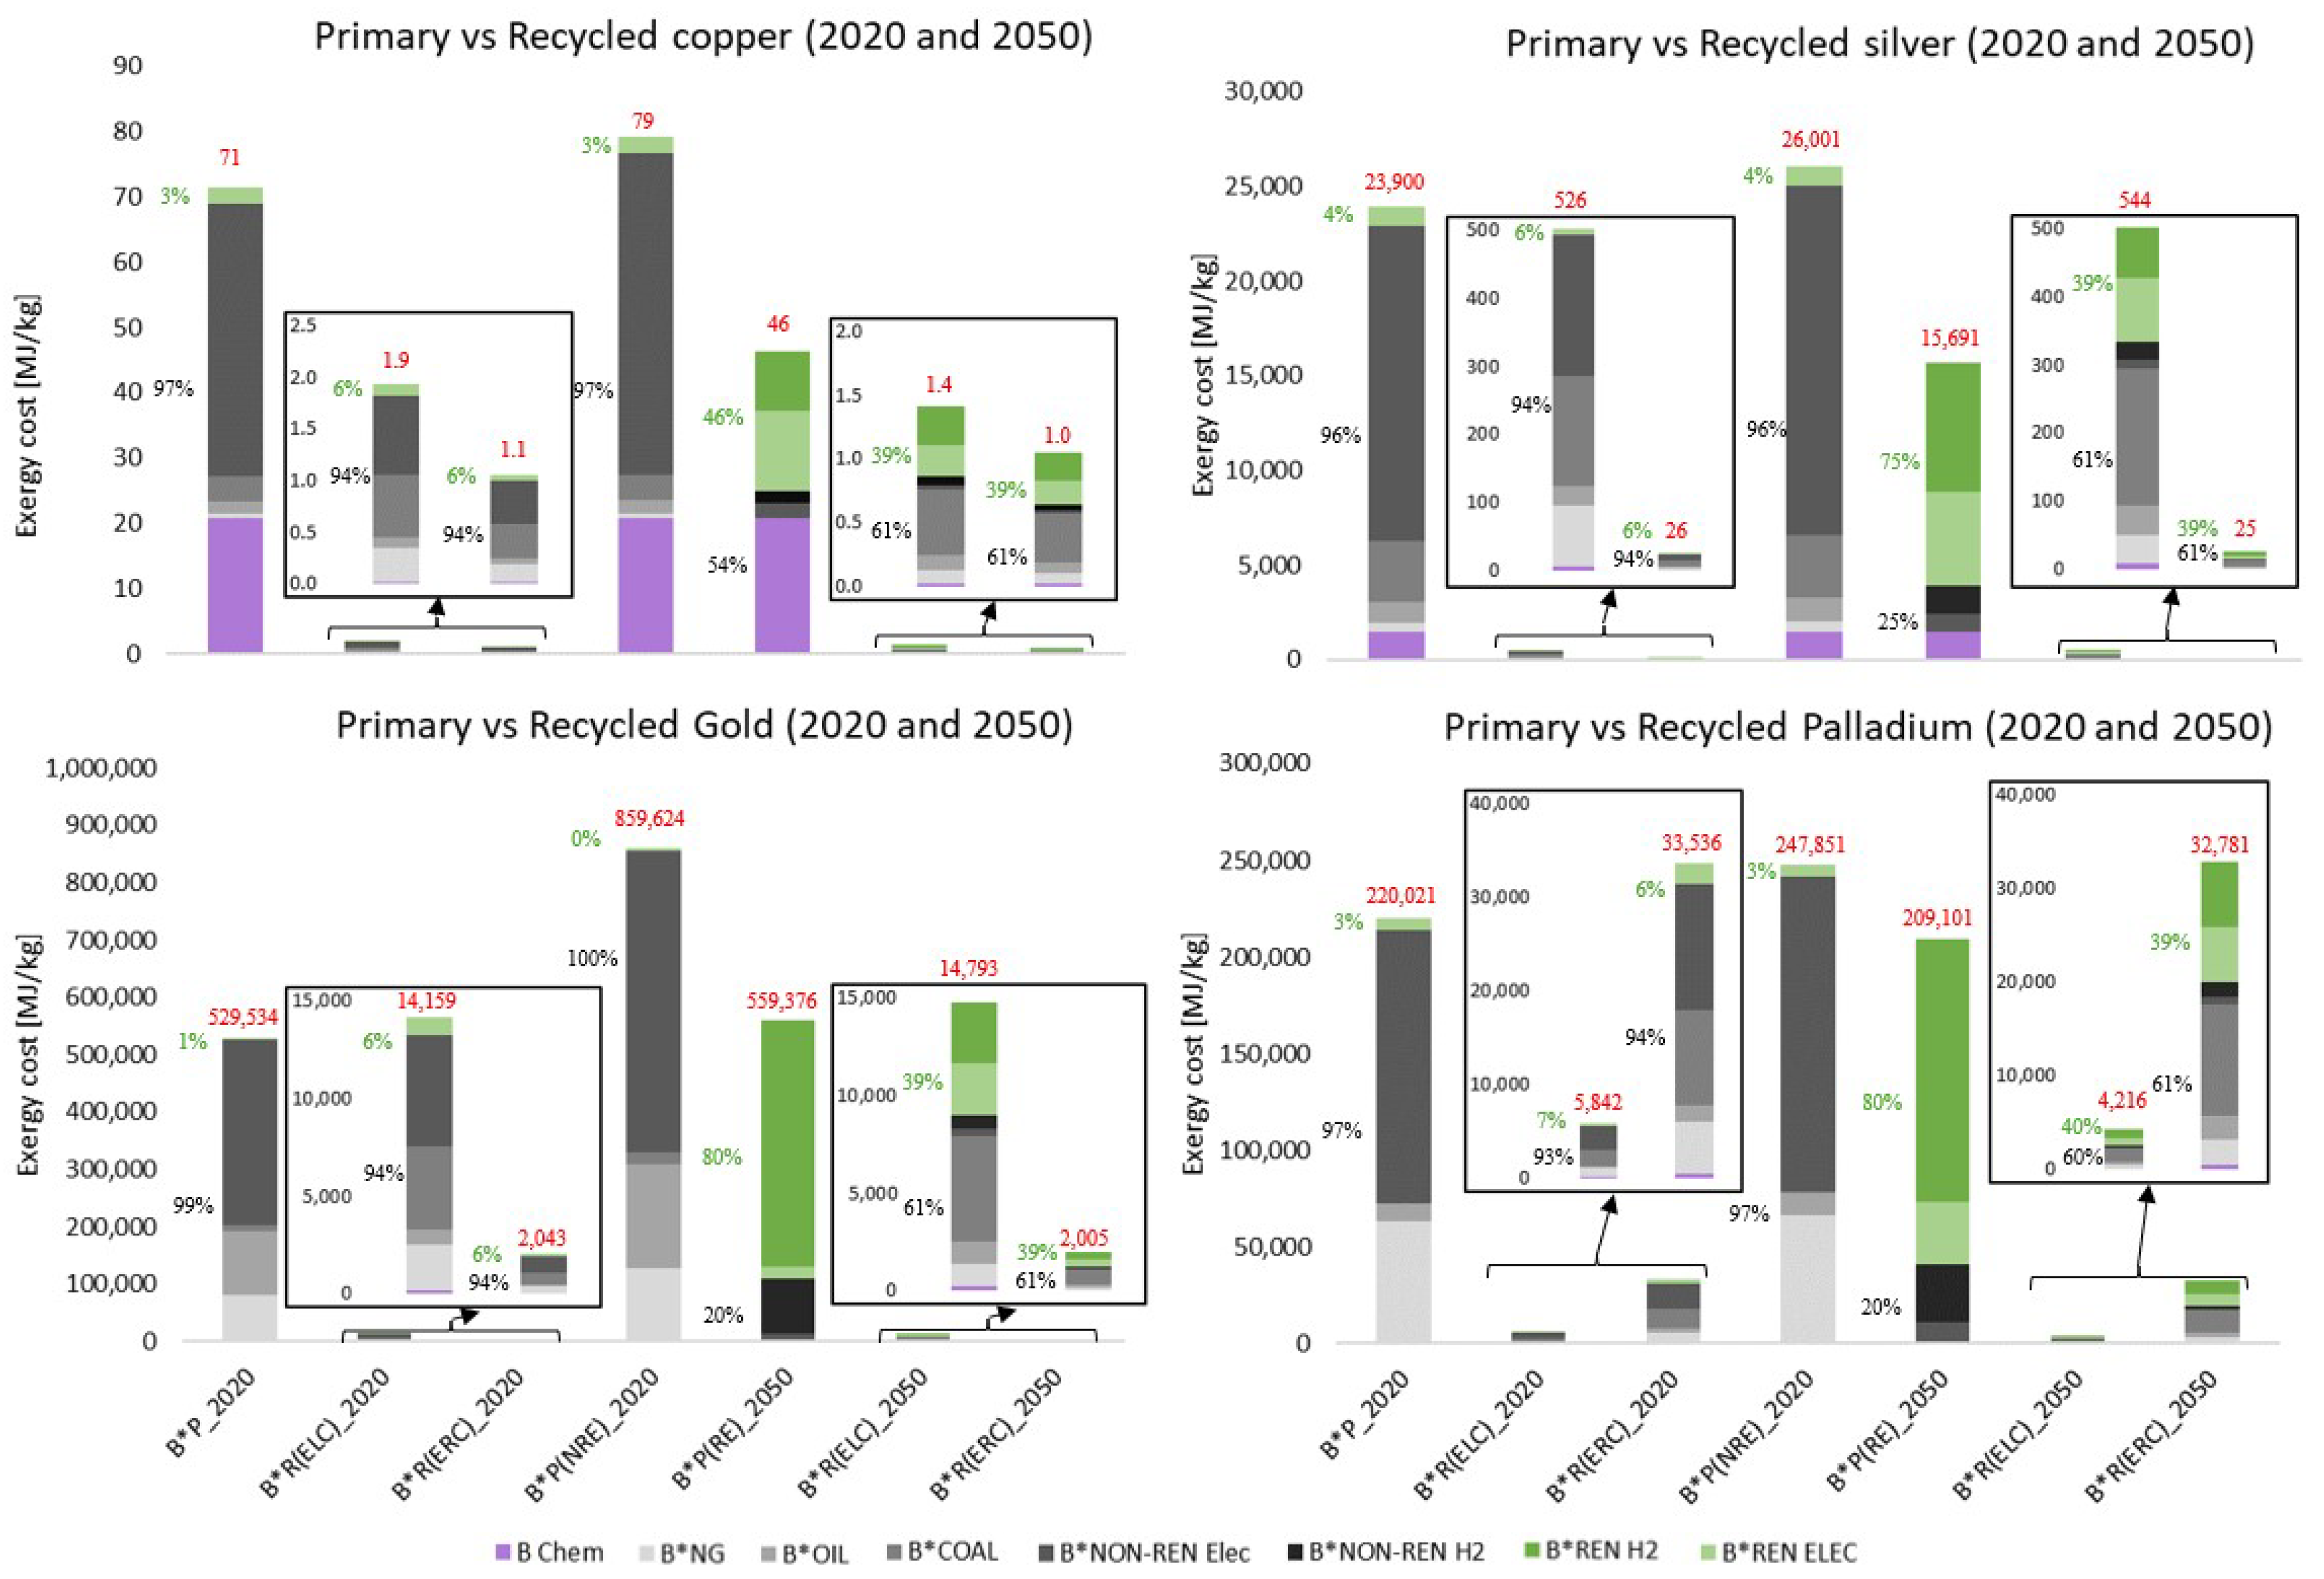
Figure 6.
Sankey diagram of the complete life cycle of metals embedded in a PCB. Scenario 2020
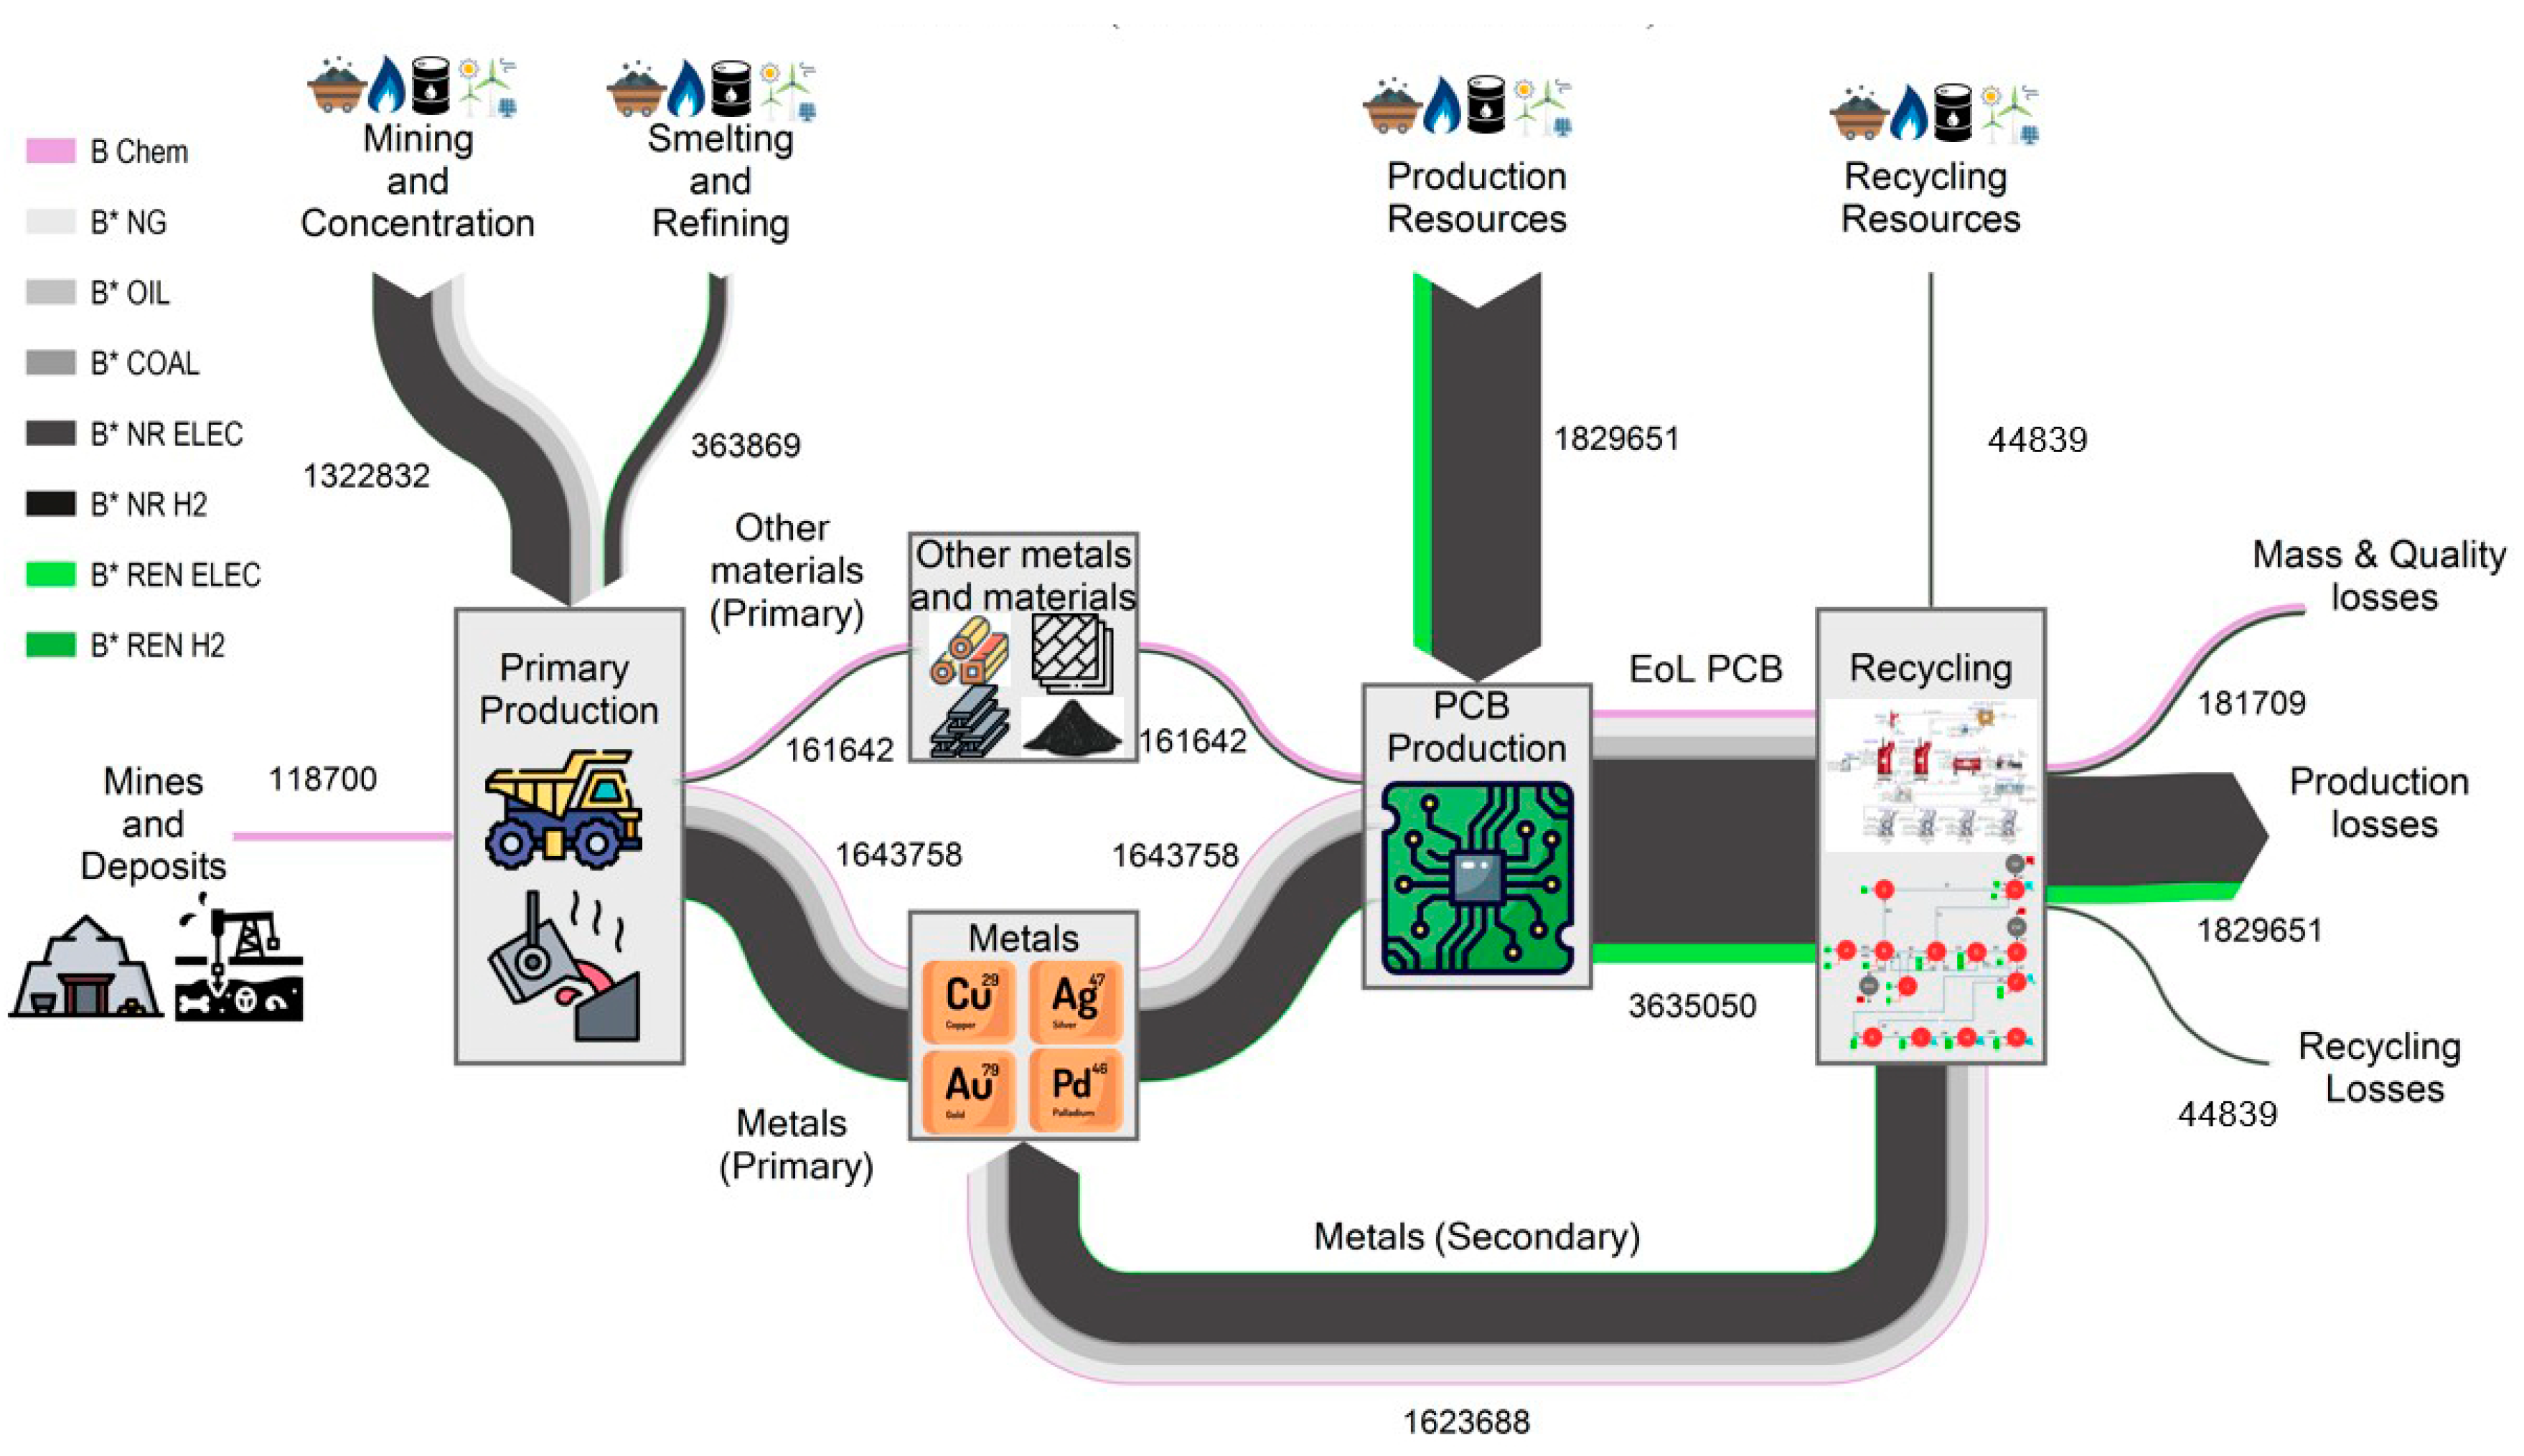
Figure 7.
Sankey diagram of the complete life cycle of metals embedded in a PCB. Scenario 2050
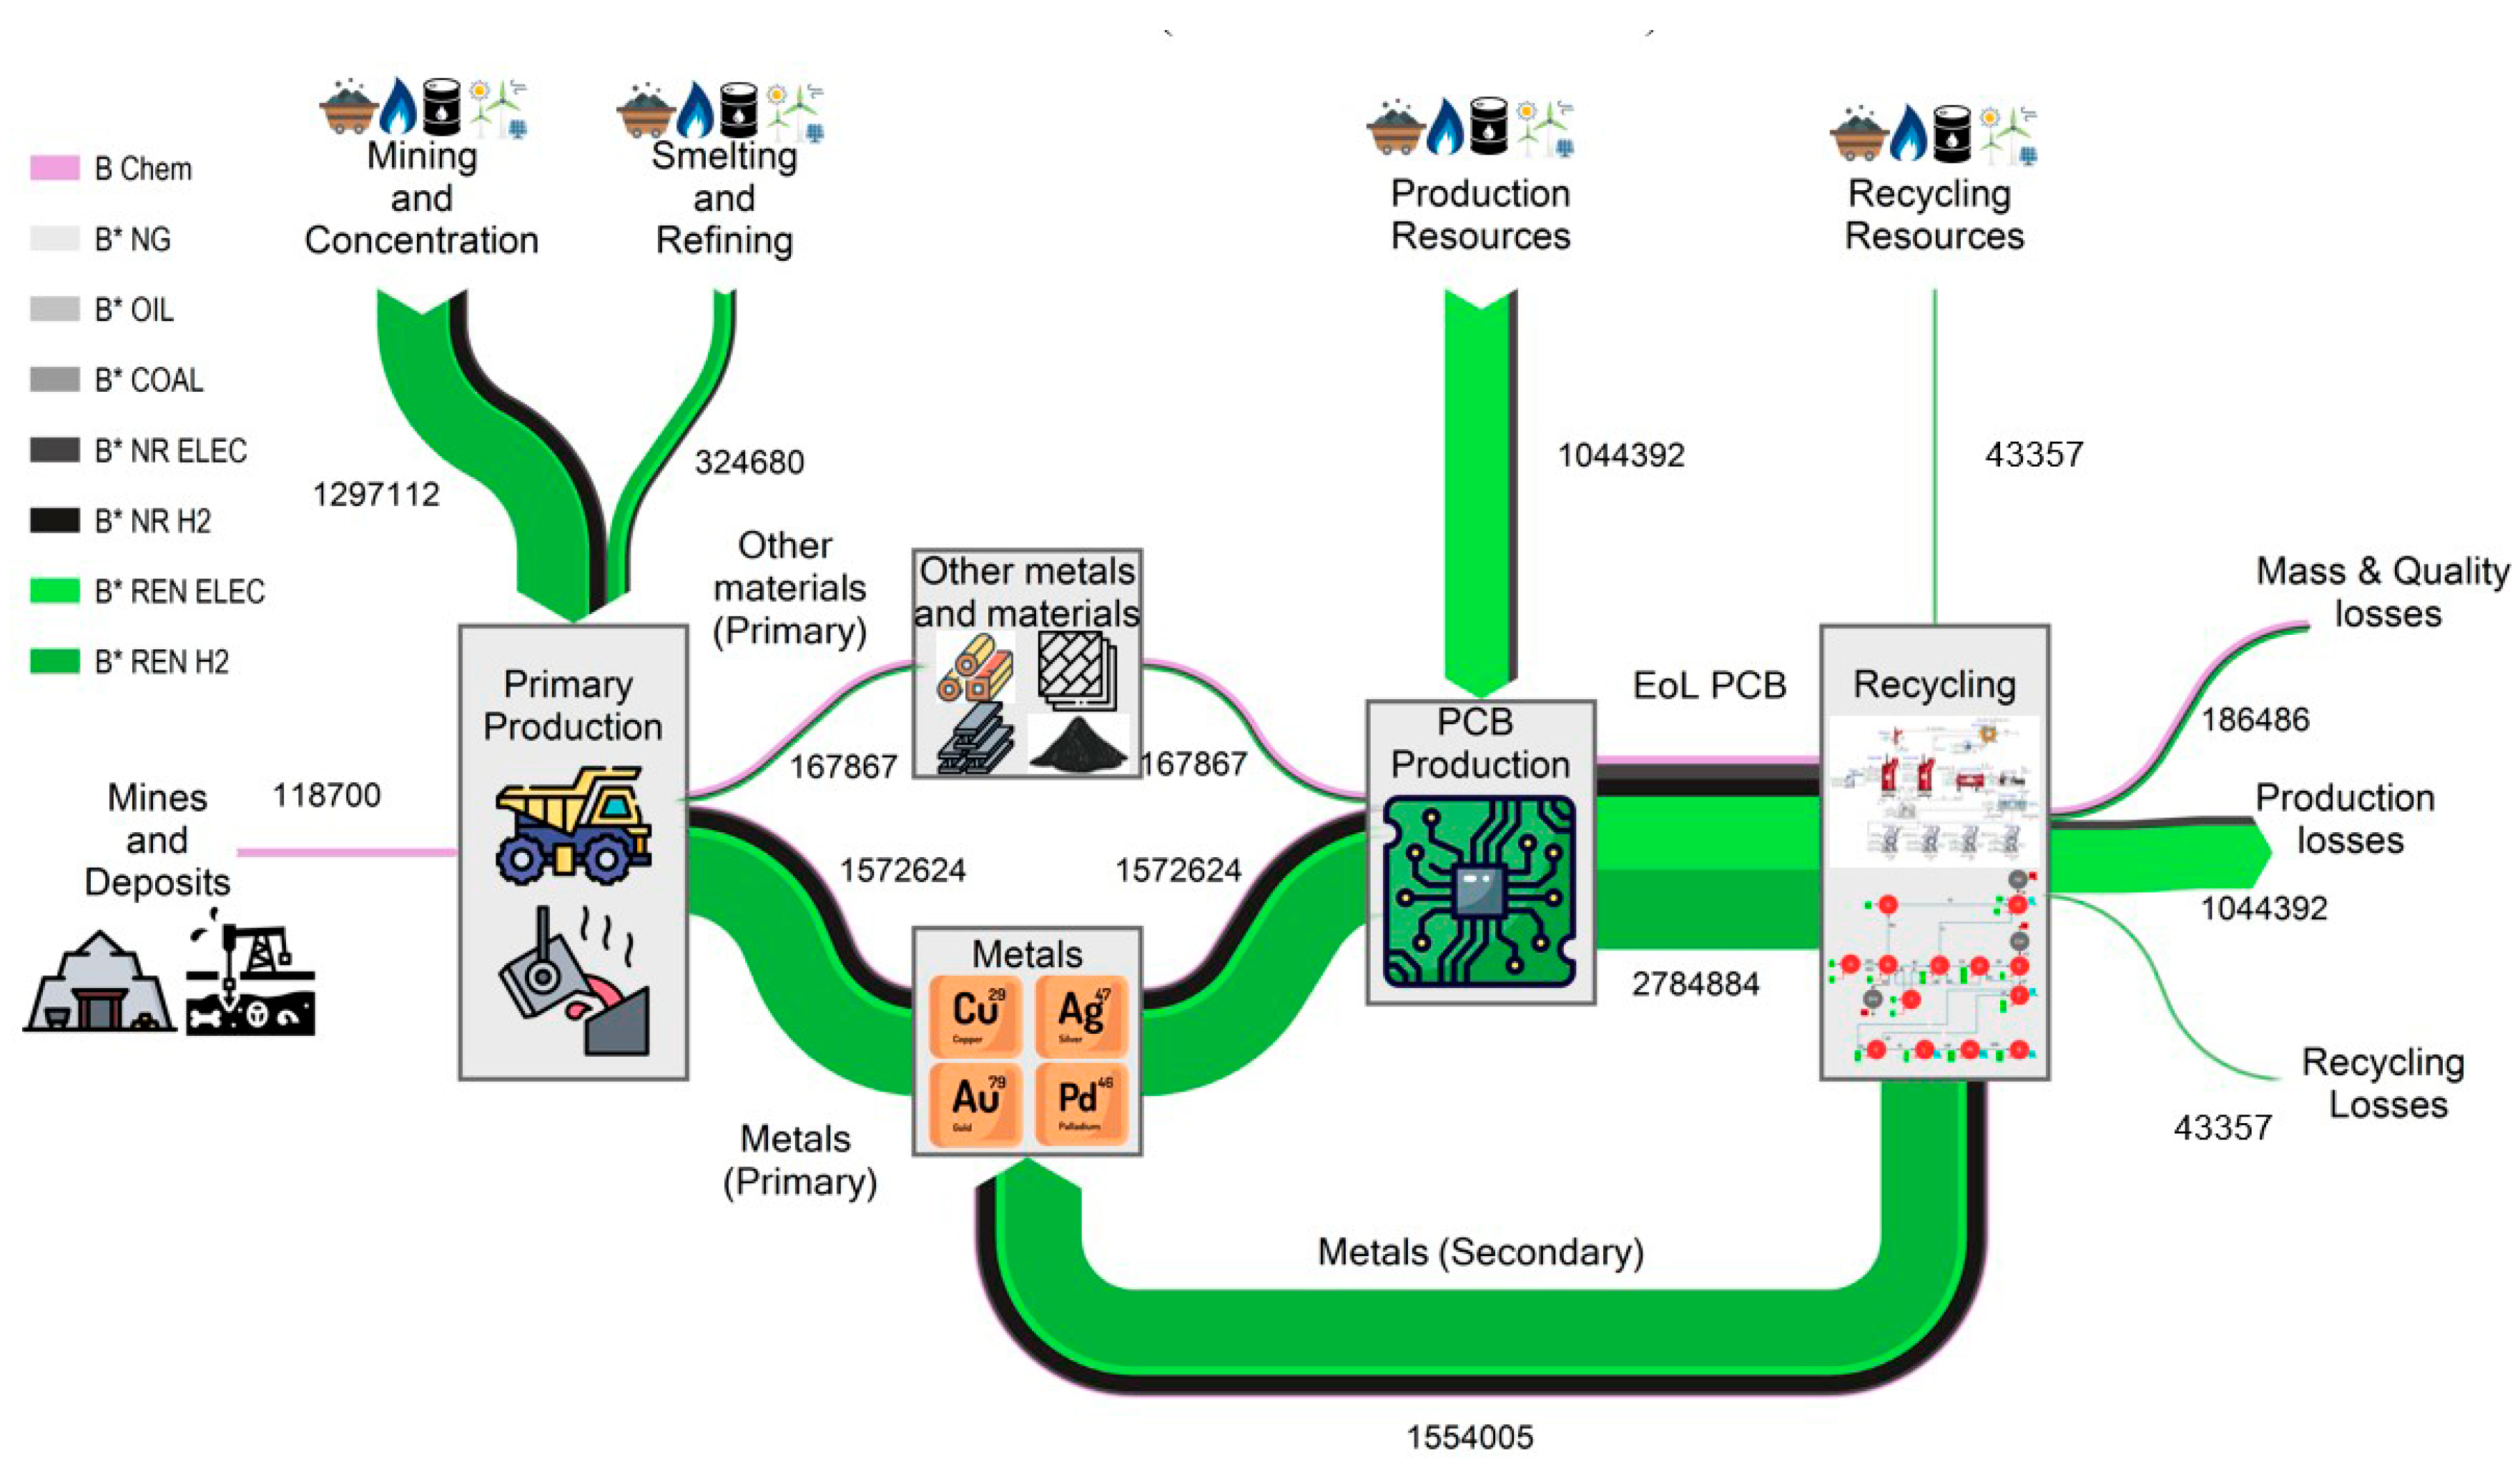
Table 3.
Exergy Values of the thermodynamic model (kWh).
| Scenario 2020 | Scenario 2050 | ||||||
|---|---|---|---|---|---|---|---|
| key | type | B | ELC | ERC | B | ELC | ERC |
| A1 | RESOURCE | 80,174 | 1,101,744 | 11,688,623 | 80,174 | 1,541,591 | 11,688,623 |
| A2 | RESOURCE | 877.4 | 877.4 | 877.4 | 877.4 | 877.4 | 877.4 |
| B2 | RESOURCE | 1,551.6 | 1,551.6 | 1,551.6 | 3,075.9 | 3,075.9 | 3,075.9 |
| C1 | RESOURCE | 1,976.8 | 1,976.8 | 1,976.8 | 3,579.0 | 3,579.0 | 3,579.0 |
| C2 | RESOURCE | 1,517.7 | 1,517.7 | 1,517.7 | 1,306.2 | 1,306.2 | 1,306.2 |
| D1 | RESOURCE | 4,455.2 | 4,455.2 | 4,455.2 | 3,253.6 | 3,253.6 | 3,253.6 |
| D2 | RESOURCE | 407.1 | 407.1 | 407.1 | 506.9 | 506.9 | 506.9 |
| D3 | RESOURCE | 78.0 | 78.0 | 78.0 | 50.8 | 50.8 | 50.8 |
| E1 | RESOURCE | 23.0 | 23.0 | 23.0 | 22.9 | 22.9 | 22.9 |
| F1 | RESOURCE | 1,426.1 | 1,426.1 | 1,426.1 | 1,413.3 | 1,413.3 | 1,413.3 |
| F2 | RESOURCE | 160.0 | 160.0 | 160.0 | 159.3 | 159.3 | 159.3 |
| G1 | RESOURCE | 18.9 | 18.9 | 18.9 | 43.5 | 43.5 | 43.5 |
| H1 | RESOURCE | 276.9 | 276.9 | 276.9 | 307.8 | 307.8 | 307.8 |
| H2 | RESOURCE | 103.3 | 103.3 | 103.3 | 114.8 | 114.8 | 114.8 |
| J1 | RESOURCE | 1,030.2 | 1,030.2 | 1,030.2 | 1,091.9 | 1,091.9 | 1,091.9 |
| J2 | RESOURCE | 3,471.0 | 3,471.0 | 3,471.0 | - | - | - |
| K1 | RESOURCE | 23.0 | 23.0 | 23.0 | 23.0 | 23.0 | 23.0 |
| K2 | RESOURCE | 10.4 | 10.4 | 10.4 | 10.4 | 10.4 | 10.4 |
| L1 | RESOURCE | 22.5 | 22.5 | 22.5 | 22.5 | 22.5 | 22.5 |
| L2 | RESOURCE | 5.8 | 5.8 | 5.8 | 5.8 | 5.8 | 5.8 |
| M1 | RESOURCE | 45.4 | 45.4 | 45.4 | 45.4 | 45.4 | 45.4 |
| M2 | RESOURCE | 20.6 | 20.6 | 20.6 | 20.6 | 20.6 | 20.6 |
| N1 | RESOURCE | 24.5 | 24.5 | 24.5 | 24.5 | 24.5 | 24.5 |
| N2 | RESOURCE | 13.1 | 13.1 | 13.1 | 13.1 | 13.1 | 13.1 |
| NW1 | RESOURCE | 51.4 | 51.4 | 51.4 | 51.4 | 51.4 | 51.4 |
| AB1 | INTERNAL | 66,178 | 66,178 | 66,178 | 66,178 | 66,178 | 66,178 |
| AB2 | INTERNAL | 13,995 | 1,035,566 | 11,622,444 | 13,995 | 1,475,413 | 11,622,444 |
| BC | INTERNAL | 7,366 | 1,054,384 | 11,780,363 | 6,965 | 1,490,645 | 11,752,187 |
| BG | INTERNAL | 17,800 | 17,800 | 17,800 | 19,009 | 19,009 | 19,009 |
| B3 | INTERNAL | 9,494 | 11,208 | 20,574 | 12,151 | 14,457 | 26,319 |
| CB | INTERNAL | 5,094 | 32,254 | 180,722 | 4,674 | 29,242 | 155,614 |
| CD | INTERNAL | 3,525 | 1,027,457 | 11,627,237 | 3,404 | 1,465,021 | 11,613,083 |
| CH | INTERNAL | 683.9 | 683.9 | 683.9 | 1,111.8 | 1,111.8 | 1,111.8 |
| DC | INTERNAL | 755.2 | 4,829.1 | 27,098.4 | 855.1 | 3,364.2 | 16,270.2 |
| DE | INTERNAL | 3,643 | 1,176,477 | 13,340,609 | 3,634 | 1,681,609 | 13,337,037 |
| EF | INTERNAL | 2,924 | 1,175,759 | 13,339,890 | 2,920 | 1,680,895 | 13,336,323 |
| FD | INTERNAL | 381.4 | 153,359 | 1,739,979 | 380.9 | 219,358 | 1,740,197 |
| FK | INTERNAL | 14.1 | 966,557 | 11,252,636 | 14.8 | 1,403,515 | 11,252,637 |
| GH | INTERNAL | 17,561.9 | 7,561.9 | 17,561.9 | 18,696.1 | 18,696.1 | 18,696.1 |
| H4 | INTERNAL | 5,429.9 | 5,429.9 | 5,429.9 | 5,417.8 | 5,417.8 | 5,417.8 |
| JB | INTERNAL | 708.5 | 708.5 | 708.5 | 691.4 | 691.4 | 691.4 |
| JC | INTERNAL | 50.0 | 50.0 | 50.0 | 61.0 | 61.0 | 61.0 |
| KF | INTERNAL | 4.9 | 110.7 | 688.8 | 4.9 | 116.2 | 688.8 |
| KL | INTERNAL | 7.3 | 966,445 | 11,251,946 | 7.3 | 1,403,396 | 11,251,946 |
| LM | INTERNAL | 2.5 | 896,226 | 11,213,139 | 2.5 | 1,298,435 | 11,213,139 |
| MN | INTERNAL | 1.9 | 155,859 | 9,994,760 | 1.9 | 170,453 | 9,994,760 |
| N4 | INTERNAL | 0.5 | 11,777 | 92,926 | 0.5 | 17,296 | 92,926 |
| STM | OUTPUT | 8,794.9 | 8,794.9 | 8,794.9 | 9,775.6 | 9,775.6 | 9,775.6 |
| Cu | OUTPUT | 2,421.8 | 54,775 | 340,955 | 2,400.1 | 57,008 | 37,896 |
| Ag | OUTPUT | 4.8 | 70,218 | 38,806 | 4.8 | 104,961 | 38,806 |
| Au | OUTPUT | 0.6 | 740,366 | 1,218,379 | 0.6 | 1,127,981 | 1,218,379 |
| Pd | OUTPUT | 1.4 | 144,082 | 9,901,829 | 1.4 | 153,157 | 9,901,829 |
| PYW | WASTE | 9,494.3 | 11,207.7 | 20,574.3 | 12,150.8 | 14,457.0 | 26,319.1 |
| HGW | WASTE | 5,429.9 | 5,429.9 | 5,429.9 | 5,417.8 | 5,417.8 | 5,417.8 |
| SLW | WASTE | 29.4 | 11,805.9 | 92,954.6 | 29.4 | 7,325.0 | 92,954.6 |
Table 4.
Chemical exergy, exergy life cycle cost for 2020 and 2050 scenarios, and ERC for the metals studied (MJ/kg)
Table 4.
Chemical exergy, exergy life cycle cost for 2020 and 2050 scenarios, and ERC for the metals studied (MJ/kg)
| [34] | ERC[44] | |||
|---|---|---|---|---|
| Cu | 2.09 | 45 | 47 | 292 |
| Ag | 0.92 | 13,339 | 19,939 | 7,371 |
| Au | 0.26 | 336,190 | 512,201 | 553,250 |
| Pd | 1.30 | 130,717 | 138,950 | 8,983,377 |
Table 5.
Exergy cost of metals depending on the allocation criterion (MJ/kg)
| Scenario 2020 | Scenario 2050 | |||||||
|---|---|---|---|---|---|---|---|---|
| Key | (B) | (ELC) | (ERC) | (B) | (ELC) | (ERC) | ||
| Cu | 71 | 32.9 | 1.9 | 1.1 | 46 | 31.6 | 1.4 | 1.0 |
| Ag | 23,900 | 32.8 | 525.6 | 25.5 | 15,691 | 26.4 | 543.8 | 25.2 |
| Au | 529,534 | 94.1 | 14,159 | 2,043 | 559,376 | 56.2 | 14,792.8 | 2,004.5 |
| Pd | 220,021 | 809.3 | 5,842 | 33,536. | 209,101 | 484.6 | 4,216 | 32,781 |
Table 6.
Exergy saving in recycling PCB depending on the allocation criterion. (%)
| Scenario 2020 | Scenario 2050 | |||||
|---|---|---|---|---|---|---|
| Key | B | ELC | ERC | B | ELC | ERC |
| Cu | 53.68 | 97.27 | 98.51 | 31.32 | 96.96 | 97.74 |
| Ag | 99.86 | 97.80 | 99.89 | 99.83 | 96.53 | 99.84 |
| Au | 99.98 | 97.33 | 99.61 | 99.99 | 97.36 | 99.64 |
| Pd | 99.63 | 97.34 | 84.76 | 99.77 | 97.98 | 84.32 |
Table 7.
Evolution of non-renewable energy costs and metal savings for different scenarios.
| Cu | Ag | Au | Pd | |||||
|---|---|---|---|---|---|---|---|---|
| Saving | Saving | Saving | Saving | |||||
| (MJ/kg) | (%) | (MJ/kg) | (%) | (MJ/kg) | (%) | (MJ/kg) | (%) | |
| 76.7 | - | 25,027 | - | 855,534 | - | 241,593 | 0.0 | |
| 25.0 | 67.4 | 3,903 | 84.4 | 109,501 | 87.2 | 41,024 | 83.0 | |
| 1.81 | 97.6 | 492 | 98.0 | 13,252 | 98.5 | 5,452 | 97.7 | |
| 0.86 | 98.9 | 333 | 98.7 | 9,004 | 99.0 | 2,524 | 98.9 | |
Disclaimer/Publisher’s Note: The statements, opinions and data contained in all publications are solely those of the individual author(s) and contributor(s) and not of MDPI and/or the editor(s). MDPI and/or the editor(s) disclaim responsibility for any injury to people or property resulting from any ideas, methods, instructions or products referred to in the content. |
© 2024 by the authors. Licensee MDPI, Basel, Switzerland. This article is an open access article distributed under the terms and conditions of the Creative Commons Attribution (CC BY) license (http://creativecommons.org/licenses/by/4.0/).
Copyright: This open access article is published under a Creative Commons CC BY 4.0 license, which permit the free download, distribution, and reuse, provided that the author and preprint are cited in any reuse.


