
Submitted:
25 July 2023
Posted:
26 July 2023
You are already at the latest version
Abstract
The objective of this study was to apply simulation and computational intelligence techniques using artificial intelligence and genetic algorithm for economic and environmental optimization of the reverse network (manufacturers, waste managers and recyclers in São Paulo, Brazil) of waste electrical and electronic equipment (WEEE) to promote circular economy. For the economic evaluation, the reduction of: fuel, drivers, insurance, depreciation, maintenance and charges was considered and for the environmental evaluation, the environmental impact was measured in the abiotic, biotic, water, land, air and greenhouse gases compartments. It is concluded that the optimized structure of the WEEE reverse chain for São Paulo, Brazil reduced the number of collections, making the most of the cubage. It also generated economic and environmental gains, contributing to the strategic actions of the circular economy. Thus, the proposed simulation allows replication in organizational practice, mainly to meet the 2030 agenda on reducing the carbon footprint generated in transport in large cities. Thus, this study can guide companies on structuring the reverse WEEE chain in São Paulo, Brazil for economic and environmental optimization, a relevant aspect considering the exponential generation of WEEE, requiring the implementation of the national solid waste policy, and subsequently the signature of the electronics sector agreement in São Paulo.
Keywords:
Reverse logistic
; Reverse Chain
; WEEE
; Industry 4.0 Technology
; Simulation
; Artificial intelligence
; Eco-efficiency
; Circular Economy
1. Introduction
Growing industrialization and increased competitiveness have contributed to the growth in the volume of electronic products manufactured across a variety of market segments. Nowadays, large volumes of electronic products are sold worldwide. As a result of this growth, electronic waste has become a major problem in the disposal process, presenting itself as a critical and aggressive situation for the environment [1]. This challenge, has triggered the in Brazil, in 2010, the Law 12.305/2010 that was enacted on the National Solid Waste Policy. This is acknowledged as the most specific concerning reverse logistics and recycling of WEEE. Its principle is to develop a reverse chain in order to promote shared responsibility for the life cycle of electrical and electronic equipment among the players in the chain. Article 33 of the aforementioned Law stipulates the obligation of manufacturers, distributors, traders, recyclers and importers to structure their reverse logistics systems for the return of post-consumer WEEE [2]. Reverse logistics aims to provide a final destination for the return to the business cycle in an environmentally correct way, supported by legal terms.
It should be noted that in October 2019 also a sectoral agreement was signed, aiming at sharing responsibilities for WEEE management between manufacturers, waste managers and recyclers in São Paulo, Brazil. Oliveira Neto et al. [3] mention that electronics manufacturers are responsible for implementing post-consumer WEEE reverse logistics, aiming at WEEE circularity through remanufacturing, repair, reuse, recycling and/or sale to the secondary market. But the manufacturers do not have the capacity to simultaneously carry out production and remanufacturing. As such, a common strategy has been to hire a WEEE manager responsible for allocating collection points, reverse logistics, receiving, disassembling, segregating and disposing of appropriate recyclers, as well as reseeeling for the secondary market.
Thus, it is considered relevant to incorporate the principles of Circular Economy in the reverse logistics operations associated with WEEE [4], namely to consider the players in the reverse chain [5], and seeking the circularity of WEEE through remanufacturing, repair, reuse, recycling and/or or sale to the secondary market. This is to be done [3] in compliance with the regulation of local policies aimed at eliminating the disposal of WEEE in landfills, allowing the reduction of CO², in addition to improving the recovery rate, capacity of the facilities in relation to the total profit expected [6]. By implementing cyclic material flows it is possible to limit the production flow to levels that nature tolerates, respecting its natural reproduction rates [7], generating system sustainability [8].
To promote the implementation of the principles of Circular Economy in the reverse WEEE chain – stimulated by the mandatory adoption of reverse logistics in São Paulo by the electronics sector - it is timely and relevant to conduct studies that can agument the knowledge about how to improve such systems [3]. As such it In this context, it is important to carry out the simulation for economic and environmental optimization of the WEEE reverse network (manufacturers, waste managers, collection points and recyclers in São Paulo). With this, the use of technology for simulation will allow the development of optimal routes in economic and environmental terms. Simulation is an industry 4.0 technology, being used for real-time data analysis, offering opportunities for adjustments in complex systems through knowledge, information and accurate estimates about the system [9], it is important to adopt information technology infrastructure [10]. The use of the computational simulation approach with the circular economy for the economic and environmental optimization of a WEEE reverse chain generates economic and environmental benefits in operations [11].
A systematic review of the literature was carried out, addressing 23 scientific studies selected for including the use of simulation approaches to identify the optimal way to optimize the WEEE reverse logistics network in economic and environmental terms, as shown in Table 1. The fisrt step in the analsyis invoved the characterization of the computational simulations applied in the selected work. Among these, 9 studies used mixed integer linear programming for the simulation exercise - as shown by Achillas et al., [12]; Qiang; Zhou [13]; Kilic et al. [14]; Bal; Satoglu [15]; Elia et al. [16]; Mar-Ortiz et al. [17]; Gomes et al. [18]; Alumur et al. [19] and Assavapokee and Wongthatsanekorn [20]. Also, other 3 studies used multicriteria objective linear programming, in line with Achilles et al., [21]; Achillas et al., [22] and Yu and Solvang, [23]; and 2 studies dealt with discrete event simulation - Gamberini et al. [24] and Shokohyar and Mansour, [25]. One piece of esearch adopted linear and non-linear optimization problems, in discrete or continuous variables Dat et al. 2012[26], and another used stochastic programming - Ayvaz et al. [27]. There were also some studies that combined more than one computational simulation, namely the nonlinear gray Bernoulli model with the convolution integral NBGMC improved by Particle Swarm Optimization Duman et al. [28], and multi-objective models are computed using the two-phase fuzzy compromise approach. Tosarkani et al. [6], based on the Kriging Lv and Du method, [29], multi-objective stochastic model and bi-objective mixed-integer programming model under uncertainties Moslehi et al. [30], system dynamics and a mixed integer nonlinear programming model Llerena-Riascos et al. [4], convolutional neural network-based quality prediction and closed-loop control Zhang et al. [31] and agent-based modeling, system dynamics and discrete event simulation Guo and Zhong, [5].
The first gap identified after the analysis of the published works was that no research applied simulation with computational intelligence techniques using artificial intelligence through genetic algorithm, for the economic and environmental optimization of the reverse WEEE network, considering manufacturers, waste managers and recyclers. It should be noted that the choice of techniques to compose the proposed simulation model to obtain better routes and destinations is based on the fact that both have shown good results (optimal or suboptimal solutions) for routing problems and other related problems of combinatorial optimization. In addition is also allows for handling a large number of constraints, including time windows and capabilities present in the problem Koç et al., [32]. Nevertheless, the use of heuristic algorithms, such as the one by Clarke & Wright [33], to populate the initial population of the Genetic Algorithm with feasible solutions has proven to be a good alternative for solving routing problems, as demonstrated in the works of Lima et al. [34] and Lima & Araújo [35].
A second step in the research analysis was understand the procedure used to present the environmental gains in the selected studies. In this regard, the studies that presented an environmental assessment – listed in Table 1 - only offered a quantification in percentage using data extracted from the computer simulation. These studies generally emphasized the reduction of WEEE disposal in landfills and the reduction of CO², such as in: Gamberini et al. [24]; Achilles et al., [21]; Achilles et al., [22]; Assavapokee and Wongthatsanekorn [20], ; Shokohyar and Mansour, [25]; Yu and Solvang, [23]; Bal and Satoglu, [15]; Elia, et al. [16]; Duman et al.[28]; Tosarkani et al. 2020[6]; Llerena-Riascos et al. 2021[4]; Lv and Du, [29]; Moslehi et al.[30]; Guo and Zhong, [5]. From this, the second gap identified was that no research evaluated the reduction of environmental impacts in the abiotic, biotic, and water dimensions, using the Material Intensity Factor, which is a relevant tool for global assessment of the minimization of environmental impacts, not just using percentage data.
Thirdly, the procedure used by the surveys to develop the economic evaluation was analyzed. Surveys use only percentage data to measure transportation and storage cost savings and profitability without a detailed explanation of the data. Thus, the third research gap addressed in this study consists in the fact that no research was identified that presented the calculation of cost and time reduction in detail, in addition to measuring the improvement in the volume of vehicles, being a primordial aspect in the optimization and orientation of transport managers. It should be noted that complex optimization scenarios without detailing make it impossible for managers to apply them in practice.
The fourth aspect analyzed in the research was the country of application of computer simulations for optimization of the WEEE reverse chain. Five surveys were carried out in China by Dat et al. [26], Qiang and Zhou [13], Yu and Solvang [23], Lv and Du [29] and Guo and Zhong [5]; three surveys conducted in Greece by Achillas et al., [12], Acillas et al., [21], Acillas et al., [22]; three in Türkiye by Ayvaz et al. [27], Kilic et al. [14], Bal and Satoglu [15]; two in Italy by Gamberini et al. [24] and Elia et al. [16]; two studies in the USA by Assavapokee and Wongthatsanekorn [20] and Duman et al. [28]; two in Iran by Shokohyar and Mansour [25] and Moslehi et al. [30] and one each in Spain by Mar-Ortiz et al. [17], Portugal by Gomes et al. [18], Germany by Alumur et al. [19], Canada by Tosarkani et al. [6], Colombia by Llerena-Riascos et al. [4] and Belgium by Zhang et al. [31]. Thus, the fourth gap for research was the lack of studies carried out in Brazil and mainly in São Paulo on the use of simulation for economic and environmental optimization of the reverse WEEE network, considering manufacturers, waste managers, collection points and recyclers.
The fifth content analysis carried out on the articles concerned the use of the circular economy approach in research. Tosarkani et al. [6] mentioned circular economy only in relation to the passage of Bill 151 and the development of circular economy strategies in Ontario, Canada, greater attention was directed towards recycling electronics (OES annual report, 2017). Llerena-Riascos et al. [4] incorporated the principles of circular economy to maximize economic benefits in relation to environmental ones and Guo and Zhong [5] mentioned circular economy superficially, in addition to not performing optimal optimization in the WEEE reverse chain. Therefore, no research on circular economy was identified that evaluated the environmental impact and economic gain with details of the adoption of computer simulation for optimization of the WEEE reverse chain, denoting the fifth gap to be explored in this study. Hidalgo et al. [11] concluded that the use of simulation for the management of WEEE in the reverse network does not guarantee eco-efficiency, because it is important to use the circular economy approach to obtain economic and environmental benefits in operations, because it is about promoting the circularity of WEEE.
Therefore, the application of computer simulation using artificial intelligence with the use of genetic algorithm for economic and environmental optimization of the reverse WEEE network, considering manufacturers, waste managers and recyclers to promote circular economy, was, at the date of the study relatively unnadressed in the scientific literature,. The exploratory analysis of the literature allowed for the identification of five important research gaps, critical for both theory and managerial practice. The following research question was formulated: How can the application of simulation and computational intelligence techniques, with the use of artificial intelligence and genetic algorithm, for economic and environmental optimization of the reverse WEEE network (manufacturers, waste managers and recyclers of São Paulo) promote circular economy?
The study contributes to this research gap, and highlights that the optimal configuration of the reverse WEEE network should promote economic gains and reduction of environmental impacts for the actors in the network (manufacturer, waste manager and recyclers in São Paulo). The economic gains are evaluated considering the opportunity to reduce transport costs. The reduction of environmental impacts is measured by evaluating the intensity of the material in the abiotic, biotic, water, land and air compartments in relation to the minimization of fuel consumption and CO² emission. This study is justified by the contribution to theory, organizational practice and society.
2. A simulation Approach for Optimizing the WEEE Reverse Logistics Network
A preliminary overview of the extant literature is organized in Table 1, displaying the research work that used computer simulation to identify the optimal path for optimizing the WEEE reverse logistics network in economic and environmental terms. Three surveys carried out in Greece, three in China, three in Turkey, two in Italy, and one in each, considering Spain, Portugal, Germany, USA and Iran, were identified. All surveys aim to reduce transport costs and half aim to reduce CO² emissions. Likewise, in China additional five studies were identified. Dat et al. [26] developed a model to minimize the total cost of the WEEE recycling network in China, which is the sum of the transport cost, operation cost, fixed cost, disposal cost minus the revenue generated from the sale of recyclable materials. and renewables and components. Also based on the proposed model, the ideal locations of the facilities and the material flows in the reverse logistics network were determined. Qiang and Zhou [13] developed a robust mixed integer linear programming simulation model for WEEE reverse logistics network to optimize the handling process, which was affected by recovery uncertainty based on risk preference coefficient and risk coefficient. penalty diverted from restrictions, that could allow decision makers to fine-tune operating system robustness and risk preferences. The result showed an opportunity to reduce transport costs.Yu and Solvang [23] developed a stochastic mixed integer-programming model to design and plan a multi-source, multi-echelon, capable and sustainable reverse logistics network for managing WEEE under uncertainty. The model takes into account economic efficiency and environmental impacts in decision-making, and environmental impacts are evaluated in terms of carbon emissions. Lv and Du [29] developed a simulation based on the Kriging method to predict the amount of WEEE returned in reverse logistics in China. The proposed model can accurately predict the amounts of WEEE returned from unknown locations, as well as those from the entire area through data from the known location, which is important for compliance with environmental legislation. Guo and Zhong [5] applied Agent based modeling, system dynamics and discrete event simulation is constructed in China for the simulation of a closed-loop supply chain based on the Internet of Things, allowing to generate more profit and can reduce more greenhouse gas emissions and contamination by heavy metals, in addition to offering protection of people from diseases caused by heavy metals present in WEEE. It should be noted that this study mentions adequate management of WEEE through the use of IoT, installation of sensors in the truck, barcode on the product and trash can on the sidewalk and the pre-selection center, in addition to the technology adopted by the manufacturer. However, this study does not perform optimal optimization and mentions circular economy superficially.
Three works in Greece were identified. Achillas et al., [12] used the mixed integer linear programming model to adapt the model in order to optimize and minimize total costs of transporting WEEE between collection points and recycling units, optimizing the use of containers and storage containers of WEEE, cost reduction on WEEE storage deposits in Macedonia and Greece. This suggests that some network nodes (i.e. collection and recycling points) can be strategically modified, in such a way as to promote considerable cost reductions in the WEEE reverse logistics network. Achilles et al. [21] adopted multicriteria objective linear programming to identify the optimal location for the installation of waste recycling plants for two cities in Greece: Messologhi and Kavala. The study aimed to address legal standards and goals for the collection of WEEE. Specificallly the goal was to minimize the environmental impact by reducing the possibility of WEEE being dumped in landfills, in addition to reducing pollutants from fossil fuels (CO²) in the atmosphere. Moreover it documented the generation of an economic advantage of 235,000 Euros due to the recycling and reuse of WEEE and the minimization of fuel consumption. Achillas et al., [22] used multicriteria objective linear programming for weighted optimization of WEEE collection and recycling processes in order to minimize total logistic costs and reduce fuel consumption in the region of Central Macedonia, Greece. The results showed a 5% reduction in CO² pollutants (from fossil fuels), in addition to an economic gain of 545 thousand Euros,
Two surveys were carried out in Italy. Gamberini et al., [24] developed discrete event simulation and lifecycle analysis for the optimization of the WEEE transport network in northern Italy. The authors used vehicle routing methods and heuristic procedures for creating different scenarios for the system, simulation modeling to obtain solutions that satisfy technical performance measures, life cycle analysis to assess the environmental impact of such solutions, multicriteria decision methods to select the best choice under the joint technical and environmental perspective. With this, opportunities to reduce transport costs were identified, in addition to minimizing CO² emissions in the environment. Elia et al. [16] do not mention aroute optimization considering the reverse chain in terms of recycling and reuse. They only mention ollection and direct option or determination of another path in Italy. With this, the simulation was adopted to compare different alternatives for a WEEE collection service. A dynamic collection scheme (i.e. with varying collection frequencies based on the actual level of waste stream) is simulated in two different logistical configurations, i.e. one based on direct connection and the other based on a network. The impact of the adoption of electric vehicles is also evaluated. Alternatives are compared using key economic and environmental performance indicators to assess the level of sustainability. The simulation was adopted to compare different alternatives for a WEEE collection service. A dynamic collection scheme (i.e. with varying collection frequencies based on the actual level of waste stream) is simulated in two different logistical configurations, i.e. one based on direct connection and the other based on a network. The impact of the adoption of electric vehicles is also evaluated. Alternatives are compared using key economic and environmental performance indicators to assess the level of sustainability. Simulation was emplyed to compare different alternatives for a WEEE collection service. A dynamic collection scheme (i.e. with varying collection frequencies based on the actual level of waste stream) is simulated in two different logistical configurations, i.e. one based on direct connection and the other based on a network. The impact of the adoption of electric vehicles is also evaluated. Alternatives are compared using key economic and environmental performance indicators to assess the level of sustainability. one based on direct connection and one based on a network. The impact of the adoption of electric vehicles is also evaluated. Alternatives are compared using key economic and environmental performance indicators to assess the level of sustainability. one based on direct connection and one based on a network. The impact of the adoption of electric vehicles is also evaluated. Alternatives are compared using key economic and environmental performance indicators to assess the level of sustainability.
Assavapokee and Wongthasanekorn [20] used the mathematical model of mixed integer linear programming for process optimization in terms of the most adequate choice for the implantation of recycling units in Texas – USA through discrete variables, representing the decisions such as locations and capacity allocation. Overal they also addressed decisions about the material flows of the reverse logistics network. The model considered the obsolescence estimates for the products (e.g. computers, monitors, televisions), the sales volume of the products and analyzed the logistics transport costs. This reduced the logistics costs of transporting waste in terms of fuel and reduced storage costs for waste deposits, in addition to the percentage indication of the reduction in the amount of CO².
Other authors [28] proposed nonlinear gray Bernoulli model with convolution integral NBGMC(1,n) improved by Particle Swarm Optimization (PSO) with the aim of presenting a new prediction technique for e-waste for the US with multiple inputs in the presence of limited historical data. It was concluded that it is possible to improve decision-making in reverse logistics planning, allowing the proper collection, recycling and disposal of electronic waste, generating elimination of WEEE disposal in landfills and CO² reduction.
Shokohyar and Mansour [25] designed a WEEE recovery network to determine the best locations for collection centers and also recycling plants for total WEEE management in Iran, so that the government can simultaneously trade-off between environmental issues and economic and social impacts. Moslehi et al. [30] applied the multi-objective stochastic model. bi-objective mixed-integer programming model under uncertainties with the aim of modeling the reverse logistics process of electrical and electronic equipment (EEE) to Iran. A case study of an electronic equipment manufacturer in Esfahan, Iran, was included, making it possible to minimize the disposal of WEEE in landfills and reduce CO², in addition to reducing transportation costs.
Mar-Ortiz et al. [17] developed a survey in Spain with the aim of optimizing the design of the WEEE logistics network. Thus, firstly, an installation location problem was formulated and solved using a mixed integer linear programming; in the second phase, a new integer programming formulation for the corresponding heterogeneous fleet vehicle routing problem is presented, and an economics-based heuristic algorithm is developed to efficiently solve the related collection routing problems; in the third phase, a simulation study of the collection routes is carried out to evaluate the overall performance of the recovery system. The results show a good performance of the proposed procedure, and an improved configuration of the recovery network in relation to the one currently in use,
Gomes et al. [18] developed a generic mixed integer linear programming model that was proposed to represent this network, which is applied to its design and planning in Portugal, where the best locations for the collection and sorting centers are chosen simultaneously with the definition of network tactical planning. Some analyzes were carried out to provide more information on the selection of these alternative sites. The results support the company's strategic expansion plans for the opening of a large number of centers and for their location close to the main sources of WEEE, with a main focus on reducing operating costs. Alumur et al.
Tosarkani et al. [6] applied efficient solutions of the multi-objective model are computed using the two-phase fuzzy compromise approach, aiming to optimize and configure a Canadian WEEE reverse logistics network, considering the uncertainty associated with fixed and variable costs, the amount of demand and return and the quality of returned products. The study mentions that with the passage of Bill 151 and the development of circular economy strategies in Ontario, greater attention has been directed towards recycling electronics (OES annual report, 2017). With this, it is necessary to implement a reverse chain for environmental compliance to reduce pollution and eliminate the disposal of WEEE in landfills, allowing the reduction of CO², in addition to improving the recovery rate,
Llerena-Riascos et al. [4] applied simulation using system dynamics and mixed integer nonlinear programming to design sustainable policies for WEEE management systems, incorporating circular economy principles to maximize economic benefits in relation to environmental ones. This led to a 33% increase in profit and a 65% increase in environmental benefits. It should be noted that despite mentioning the circular economy, it does not quantify the economic and environmental gains based on a real case, presenting percentage data.
Zhang et al. [31] applied computer simulation using Convolutional Neural Network-based quality prediction and Closed-Loop control, with the aim of presenting a closed-loop capture planning method for the random collection of WEEE products in Belgium, reducing costs in the collection and pre-processing process.
3. Methodology
The study builds on a preliminary systematic review of the literature with the purpose of framing the field and supporting the development of the conceptual model. After the literature revie and analysis, interviews were conducted with managers of companies involved in the reverse chain of WEEE. After data collection, the proposed AI approach was proposed for optimizing the routing of vehicles on the reverse WEEE network was applied. Next the environmental and economic assessments were carried out using the information derived from the routing. Based on the simulation, a new interview process was carried out with the companies to investigate thiers views about the simulation and the optimization models developed.
3.1. Systematic Literature Review
A systematic review of the literature was conductedto better understand the state of the art in terms of applying simulation and artificial intelligence techniques for optimizing routes with the aim of economic and environmental gains of the reverse WEEE network. This step also informed the development of the itens for the composition of the semi-structured interview questionnaire.
The keywords used for the development of this study, and which were adopted in the systematic review are:
- (i)
- “simulation” AND “reverse logistics” Or “reverse chain” Or “closed-loop”AND “waste electrical” Or “weee” Or “electronic”.
- (ii)
- “modeling” AND “reverse logistics” Or “reverse chain” Or “closed-loop”AND “waste electrical” Or “weee” Or “electronic”.
- (iii)
- “genetic algorithm” AND “reverse logistics” Or “reverse chain” Or “closed-loop”AND “waste electrical” Or “weee” Or “electronic”.
- (iv)
- “artificial intelligence” AND “reverse logistics” Or “reverse chain” Or “closed-loop” AND “waste electrical” Or “weee” Or “electronic”.
- (v)
- “optimizing” AND “reverse logistics” Or “reverse chain” Or “closed-loop” AND “waste electrical” Or “weee” Or “electronic”
As mentioned, these keywords were used to identify scientific research on the researched subject. 31 articles were identified, out of which 16 were selected after the systematic review. The selection criterion adopted was that research should use simulation to optimize WEEE reverse logistics routes.
Based on these articles, the variables used for simulation and routing optimization were identified.
The literature review also allowed for the development of a semi-structured questionnaire for supporting the conducting the interviews intended for data collection. The topics questions addressed in the semi-structured instruments were as follows:
- (a)
- General information about the companies;
- (b)
- Description of the reverse chain processes, which include the manufacturer, waste manager and recyclers, in addition to their locations and exclusive specialties by type of electronic waste;
- (c)
- Identification of manufacturers, waste managers, collection points and recyclers, as well as the amounts of electronic waste received per month/year, the amount of materials and substances processed per month/year and the total WEEE processing capacity per month/year.
3.2. Procedure for Data Collection - Expert Analysis via Semi-Structured Interview
In this research, semi-structured interviews were conducted with 4 manufacturers' managers, a WEEE manager and 3 recyclers located in São Paulo to survey the volume and types of WEEE, locations of recyclers and collection points. Thus, the research method involved collecting information from specialists from companies belonging to the reverse WEEE network. Bogner et al. [36] mentioned that the analysis of specialists allows verifying the researched subjects in the organizational practice, making it possible to gather important data to develop a research with relevant practical contribution. However, for the effectiveness of the data collection process with the specialists, semi-structured interviews were carried out.
With this, it was possible to study and understand the reverse chain processes of WEEE, in addition to raising quantitative data on volumes and types of WEEE, and locations of companies in São Paulo, allowing to determine the set of routes that optimize environmental and economic gains, promoting the circular economy.
3.3. Procedure for Data Analysis
The data collected about the recyclers and collection points were recorded in an Excel spreadsheet to facilitate its analysis using the AI approach. This, building on the optimization of the routes for the reverse WEEE chain, provides a comparative analysis of the economic/financial aspects and of the environmental impact by evaluating the intensity of material in the compartments: abiotic, biotic, water, air and land. With this, the optimal model of the WEEE reverse chain was determined in economic and environmental terms, which are important factors for business decision-making.
3.3.1. Proposed AI-Based Approach for Economic and Environmental Dimensions
The approach proposed in this study is focused on the optimization of routes in the reverse WEEE chain, which in turn directly impacts the reduction of economic and environmental costs. It is composed by a set of four computational pipelined procedures developed in python language, and its functioning is illustrated in Figure 1 and detailed below.
In first step (Geolocation procedure), geopy is employed to provide the geolocations of the recyclers (RECs) and the collection points (CPs) from their addresses stored in an excel spreadsheet received from the São Paulo State Waste Management Company, which also includes other information such as capacities of processing and collecting of the RECs and CPs, respectively. This spreadsheet containing raw data is the main input of the AI approach.
It is important to highlight that the problem addressed in this study that involves 3 recyclers (RECs) for collecting waste from 554 collection points (CPs), from the combinatorial optimization point of view, is classified as the Multi Depot Vehicle Routing Problem (MDVRP) which is much more complex than a simple VRP or CVRP (Capacitated Vehicle Routing Problem) that considers only one depot. However, this problem can be solved in two phases (clustering and routing) greatly reducing its complexity since it is broken down into simple VRPs or CVRPs. As this strategy was adopted in this study, the Data analysis and representation procedure that comprises the second step first groups the CPs according to their proximity to the RECs, then use the geocoordinates of RECs and CPs to compute the distance and time matrices (one for each REC) using the Open Source Routing Machine – OSRM library. From these matrices are computed the the distances and times spent on routes taken by vehicles in waste collection. The procedure of second step also creates the representation of a CVRP scenario for each REC using the computed matrices (DM and TM) and other information from georeferenced data spreadsheet. In the literature, a scenario of CVRP is known as “instance” of CVRP which can be mathematically represented by equations 1 to 8. In short, solving CVRP means to find a set of routes, where each route is traveled by a vehicle, with the objective of minimizing the total cost of routes (tc), respecting the following restrictions: (i) each route must start and finish at the depot (or distribution center); (ii) each customer must be visited only once; (iii) the sum of demands of customers belonging to a route cannot exceed the capacity of vehicle; and iv) all vehicles of the fleet must have equal capacities.
where: : demand of customer i; k: vehicle; K: set of vehicles; S: Set of customers; nc: number of customers; v(S): minimum number of vehicles to service S; cv: capacity of vehicles; : cost of the path from the customer i to customer j; tc: total cost of all routes; : path from the customer i to customer j with vehicle k. In our case, costumers are the CPs and their demand are represented by their capacities; each REC acts as a depot (or distribution center); the service refers to the collection of waste; v(S) is obtained by dividing the sum of the capacities of all CPs associated with a REC by the capacity of the vehicle used by the REC for collection waste; and tc is computed taking into account distance (in km) and travel time stored in DM and TM matrices.
Equation 7 ensures that K vehicles will be used starting from the distribution center, while Equation 8 guarantees that each route has its beginning and ending at the distribution center. Equation 9 defines that customers must be attended exactly one time and the equation 10 keeps the flow ensuring that the vehicle arrives at a customer and out of it, preventing the route ends prematurely. The Equation 11 prevents the formulation of routes which do not include the depot. The restriction 11 ensures that the number of vehicles used to service the customers of set S is not less than v(S) and, finally, the Equation 12 is used to formulate the vehicle capacity restriction. The equation 13 explains that the solution to the problem is a binary matrix.
In the third step (Vehicle routing procedure) is conducted the routing for the three RECs from the scenarios (instances) provided in the second step, and the generation of a report summarizing the routing information (a fragment is depicted in Figure 2).
For routing task, we employed the Genetic Algorithm – GA ([38,39]) combined with the Clarke & Wright – CW algorithm [33]. GA is a meta-heuristic technique based on the theory of species evolution, according to which individuals in a population that best adapt to the environment in which they live are more likely to survive and reproduce. The CW, one of the most known heuristics for VRP, consists of a saving algorithm that seeks to replace the most expensive paths within the routes by paths that represent lower costs. When two routes (0,…,i,0) and (0,j,…,0) can feasibly be merged into a unique route (0,…,i,j,…,0), then a distance saving s( i, j) = c(i, D) + c(D, j) - c(i, j) is generated. The GA and CW algorithms (Adapted from [40] are presented in the Figure 3.
In our implementation using orthools and hygese libraries the CW is applied to generate feasible solutions for composing the initial population of the GA which represents possible solutions to the problem. It should be noted that the choice of using GA and CW to compose the optimization model to obtain better routes was based on the fact that both algorithms have shown good results for routing problems and other related combinatorial optimization problems. Nevertheless, the use of heuristics to populate the initial GA population with feasible solutions has proven to be a good alternative for solving routing problems [41; 34; 42-43]. In addition, we tested other metaheuristics such as Simulated Annealing – SA [44; 45-46] and Tabu Search – TS [45-46], but the results obtained in preliminary experiments do not indicate improvements in using them.
Finally, in the fourth step called Data visualization procedure, all data produced by routing task is spatialized in a map that can be visualized as a web page in any browser, as shown in Figure 4. In our implementations we employed the Open Street Map – OSM , besides the OSRM and folium libraries. The Google Maps platform is more present in people's daily lives and is one of the most used options, however its use is conditioned to the contracting of its services through its API or to restrictions on its use, limiting the available public service. Thus, the combination of OSRM with folium and OSM represents a free and open alternative source to the Google Maps for distance calculations and spatial data visualization.
3.3.2. Procedure for Economic Evaluation
The economic assessment was based on the cost of transporting the set of WEEE reverse chain routes, as well as the economic gains from recycling and reusing WEEE.
Table 2 presents six categories of transport costs that arose in the data collection process with the WEEE reverse chain specialists. The sum of these costs represents the transportation cost, according to equation 9.
CT=CC+CMO+CS+CD+CET+CM
For environmental assessment, the Mass Intensity Factors (MIF) tool will be used, which allows to calculate the environmental impact [48; 49-50]. The data will be evaluated based on the volume of reused/recycled WEEE and the fuel spent on transport for the set of WEEE reverse chain routes studied. The MIF considers the mass (M) of the residue multiplied by the Intensity Factor (IF), according to equation 10:
The MIF tool allows measuring the environmental impact with regard to the consumption of abiotic, biotic, water, air materials, so that each of them is grouped in the form of a compartment [51; 52-53]. The biotic compartment is related to the set of all living organisms derived from plants and decomposers, while the abiotic compartment is related to a set of non-living factors of an ecosystem active in the biotic environment, are metrics such as pressure, temperature, rainfall relief, among others [54].
In this context, it should be noted that the calculation of the reduction of the environmental impact is obtained by multiplying the factor of each abiotic (w), biotic (x), water (y), air (z) compartment by the reused/recycled and minimized mass . Thus, it is possible to calculate the sum of each compartment, considering the Material Intensity per Compartment (MIC), according to equation 11:
MIC(w)=〖IF〗_A(w)+〖IF〗_B(w)+〖IF〗_C(w)+〖…+IF〗_N (w)
Onde:〖IF〗_A W),〖IF〗_B(w),〖IF〗_C(w) and〖IF〗_N (w) represent the intensity factors of residues A, B, C and N, respectively, in the compartment w.
With this, the sum is calculated for each compartment (abiotic, biotic, water, air), which represents the reduction of environmental impacts per compartment. Then, it is necessary to calculate the total amount of minimization of environmental impacts by adding all the MICs, arriving at the MASS Intensity Total (MIT), according to equation 12.

Table 3.
- Material Intensity Factors.
To calculate the reduction in the emission of the main greenhouse gases and material particles generated in the transport operation, equation 13 is used.
4. Results and Discussion
4.1. The Reverse Chain of WEEE in Brazil
After the interviews with 4 electronics manufacturers located in Brazil, it was found that they did not have information on the players in the reverse WEEE chain, which includes a survey of the volume collected, locations of recyclers and collection points in the region of São Paulo. The manufacturers mentioned that after the approval of the sectoral agreement in 2019, requiring the implementation of WEEE reverse logistics, a joint decision was taken between the manufacturers on hiring a WEEE manager, mentioning that she would have all the necessary information. The manager mentioned that she was unable to produce and handle WEEE simultaneously, due to lack of operational capacity. Thus, it was necessary to focus on manufacturing, its core competence.
In this interview, it was identified that the WEEE manager hired 3 recyclers for dismantling, recycling, preparation for the sale of WEEE to the secondary market. The WEEE manager also referred us to a manager from one of the recyclers, emphasizing that he knew the process as a whole, including the estimated values needed to carry out the simulation. Thus, consequently, an interview was conducted in São José dos Campos (R1).
In this interview, the locations of recyclers and collection points were verified, as well as the volume of WEEE collected, as shown in Table 4. R1 has a planned capacity of 20,000 ton/year and a realized capacity of 6,000 ton/year. Recycler 2 (R2) is located in Sorocaba, with a planned capacity of 2500 ton/year and realized capacity of 700 ton/year and Recycler 3 (R3) is installed in Nova Odessa (R3) with a planned capacity of 3200 ton/year and realized capacity of 1000 ton/year. The location of 554 collection points was also identified, as well as the volume of WEEE collected, ranging from 8 to 60 ton/year, which are distributed throughout Brazil. In this context, knowledge of the WEEE reverse chain used in São Paulo is new to the scientific literature. Also, the practical structuring of this WEEE reverse chain through simulation will contribute to the strategic actions of the circular economy, which aims to reduce, recycle, reuse and recover as much WEEE as possible. However, it will not be possible to promote close-loop, an aspect encouraged by circular economy actions, but it will be optimized as much as possible, and the computational technique can be applied over time, always looking for the most optimized scenario. This finding denotes a relevant theoretical and practical contribution because the research by Guo and Zhong [5] carried out in China, Tosarkani et al. [6] in Canada and Llerena-Riascos et al. [4] in Colombia, only used the term “circular economy”, but did not show the application with details showing the environmental and economic benefits, as this study elucidates.
Another aspect observed was that the WEEE manager does not have its own fleet of trucks for collection. She outsourced the transport to a carrier specializing in reverse logistics. The required vehicle was a VUC truck with a capacity of 3 ton because most collections are carried out in the metropolitan region and in cities at collection points (stores, malls, parks, large and small supermarkets, etc.), not allowing the circulation of trucks with capacities greater than 3 tons. This finding shows that the manufacturers outsourced the reverse logistics of WEEE to a waste manager, which considers 3 recyclers and 554 collection points located in São Paulo. Thus, the manufacturers considered WEEE reverse logistics as a support activity and therefore outsourced it, innovating the state of the art.
However, even when interviewing the WEEE manager and recyclers, it was not possible to identify the current scenario with the details of the routes carried out by the VUCs, denoting the lack of global knowledge of the process, which could lead to future problems. In addition, the lack of knowledge of the environmental and economic gains of this action, related to the circular economy strategy.
In this context, the interviewee mentioned that the carrier performs 286 collections per month with 13 VUCs, considering 22 working days including vehicle rotation, summing up 21005 km driven. R1 performs 132 collections of 500ton per month with 12974 km. The R2 performs 76 collections of 58tons per month, consuming 1930 km. The R3 transports 83tons through 53 collections over 6101 km. This information formed the current scenario, which considers the 3 recyclers and 554 collection points (Table 5). Thus, based on this information, a computational tool was applied to simulate the WEEE reverse chain, making it possible to present the optimization in economic and environmental terms.
4.2. WEEE Reverse Chain Simulation for Economic and Environmental Optimization
Initially, location information was entered for plotting the map, and the association of each collection point to one of the 3 recyclers was assigned considering the shortest distance between them, respecting the limit of the recyclability capacity of each recycler and the capacity of the vehicle for transport. Thus, if a collection point is closest to a recycler and it has reached maximum capacity, then that collection point is associated with the recycler with the second shortest distance.
The map of the State of São Paulo shows 3 recyclers in green, being related to R1 of São José dos Campos with 270 collection points (blue), R2 of Sorocaba with 164 collection points (black) and R3 of Nova Odessa with 120 points of collection (red), as shown in Figure 5. It should be noted that distance and real times computed using OSRM were considered. This finding is also innovative for research, for example, Achillas et al. [12], Achilles et al. [21], Achilles et al. [22], Ayvaz et al. [27], Kilic et al. [14], Duman et al. [28], Tosarkani et al. [6]. Research on the subject usually only presents complex optimization scenarios directly using artificial intelligence, but they do not explain in detail the construction of knowledge and mainly do not mention that the adoption of WEEE reverse logistics is a strategic action at the meso level of the circular economy. Thus, an operations manager could easily understand the process performed for optimization, enabling its replication in organizational practice, contributing to actions to reduce, recycle, reuse and recycle in the circular economy.
Table 5 displays the comparison between the current scenario and the optimized scenario. The current scenario was identified in the interview as mentioned earlier, while the optimized scenario was extracted from the simulation using AI. It was found that it was possible to optimize the number of collections from 286 to 220, considering 642 tons per month. This reduced 26.87% of the distance covered from 21005 km to 15360 km in the WEEE collection process at collection points for recyclers. It should be noted that the solution to the problem investigated in this study was through the meta-heuristic model, which considers the process of evolutionary computation of economies and minimization of environmental impacts. These savings represent how much distance or transportation costs can be relatively optimized, reduced, grouping themselves to the nodes of the networks and their respective destinations. The reduction of the environmental impact represents the route that consumes less fuel, as well as reuses more WEEE, reducing environmental impacts in the abiotic, biotic, water and air compartments. An important finding was that the carrier fulfilled individual orders without a schedule for WEEE removal. Thus, the trucks returned most of the time with space to store more WEEE. In the optimization process, it considered the opportunity to develop the collection schedule, where each collection process the VUC passes through several points until it loads the truck as much as possible. With this, this study presents the detail of the researched scenario, contributing to the literature and organizational practice,
Thus, the optimization of 13 VUCs to 10 VUCs for the operation, considering that to collect 642 tons of WEEE per month in 22 working days, it is necessary to collect 29 tons per day in 10 VUCs of 3 tons each. As a result, it generated a reduction of 67,738 kilometers driven per year, representing a gain of 26.87%. In addition to the reduction in operating time from 315h:5m:56s to 240h:23m:31s, considering the operation of the WEEE reverse chain as a whole, generating savings of 74h:42m:2s. It should be noted that the optimization sought to reach 220 hours of operation to avoid overtime for drivers, but in the metropolitan region of São Paulo this was not possible due to traffic. This result is important for the theory because in optimizing a realistic scenario in a large metropolis, such as São Paulo, it is not possible to optimize 100% of overtime in transport, that is, it is not possible to program the route without traffic. It is noteworthy that this finding was not evidenced in any study on the subject, denoting innovation in terms of managerial implications for the WEEE reverse logistics process.
Also, after optimizing the reverse WEEE chain in Brazil, the VUCs occupancy rate improved from 74.82% to 97.21%, even using 3 VUCs less. This finding can be explained considering that each collection process of each VUC passes through several collection points, making it possible to better use the vehicle's cubage. Research on the subject indicates percentage data of optimizations, without detailing the reasons, for example, detailing the reduction in the volume of VUCs. This aspect is strategic for the transport area, being a relevant result for organizational practice, which also contributes to the circular economy. The reverse chain optimization reduced 3 VUCs, in addition to reducing the need to work a lot of overtime, due to better scheduling of collections at different points simultaneously respecting the use of VUC cubage with better effectiveness. This study contributes to the theory because we are not aware of any research that applied simulation and computational intelligence techniques with the use of artificial intelligence and genetic algorithm for economic and environmental optimization of the reverse WEEE network in Brazil, specifically in São Paulo, considering the manufacturers, waste managers and recyclers.
4.2.1. Economic Gain with WEEE Reverse Chain Optimization
The WEEE manager is responsible for the operation of the reverse chain, which decided to outsource transport for the collection of WEEE at the 554 collection and unloading points at the 3 recyclers. An average value of USD 109.81 per freight was agreed with the carrier, and in the current scenario there are 260 VUCs leaving for monthly WEEE collection, summing up the monthly cost of USD 28550.60 and annual cost of USD 342607.20. It should be noted that a profit of approximately 25% was agreed with the carrier on operating costs, which in the current scenario is USD 274,126.80 and monthly is USD 22,843.90.
Table 6 shows the cost assessment of the current and optimized scenario. With the optimization of the WEEE reverse chain transport, the distance traveled per year was minimized from 252058 to 184320 km, saving USD 31623.35 in fuel consumption.
It also reduced employee costs by USD 5661.82 due to optimization of VUCs from 13 to 10 and minimization of overtime by USD 3261.82 per year. This finding contributes to social gain, because due to better route planning, drivers spend less time in traffic or waiting to collect WEEE at collection points. The social gain is related to a better quality of life for drivers, who will be able to work without overtime, making better use of time spent with their families. This result is a relevant aspect to promote the circular economy.
Also with the optimization of the fleet, the following reductions per year were: insurance costs of USD 7200.00, depreciation cost of USD 17997.75, costs with charges and fees of USD 1560.00 and maintenance costs of USD 5999.25 . This is the first study that presents the detail of the cost evaluation between the current and the optimized scenario, making it possible to clearly present the cost reduction with the optimization of the WEEE reverse chain. Research on the subject mostly presents total cost reductions without much detail, as is the case of research by Achillas et al.[22] held in Greece with the economic gain of 545 thousand Euros; Mar-Ortiz et al.[17] with a 29.2% reduction in transport costs in Spain; and Llerena-Riascos et al. [4] generating a 33% increase in profit in Colombia.
Based on this assessment, it was possible to require the carrier to reduce the operation costs to USD 255105.775 per year, and monthly to USD 21258.82. This result shows that it is important to provide contractual transparency in terms of operating costs between the contractor (WEEE manager) and the contractor (carrier). It also shows that it was important to add to the contract that the carrier's gain would be 25% on operating costs.
4.2.2. Environmental Gain with WEEE Reverse Chain Optimization
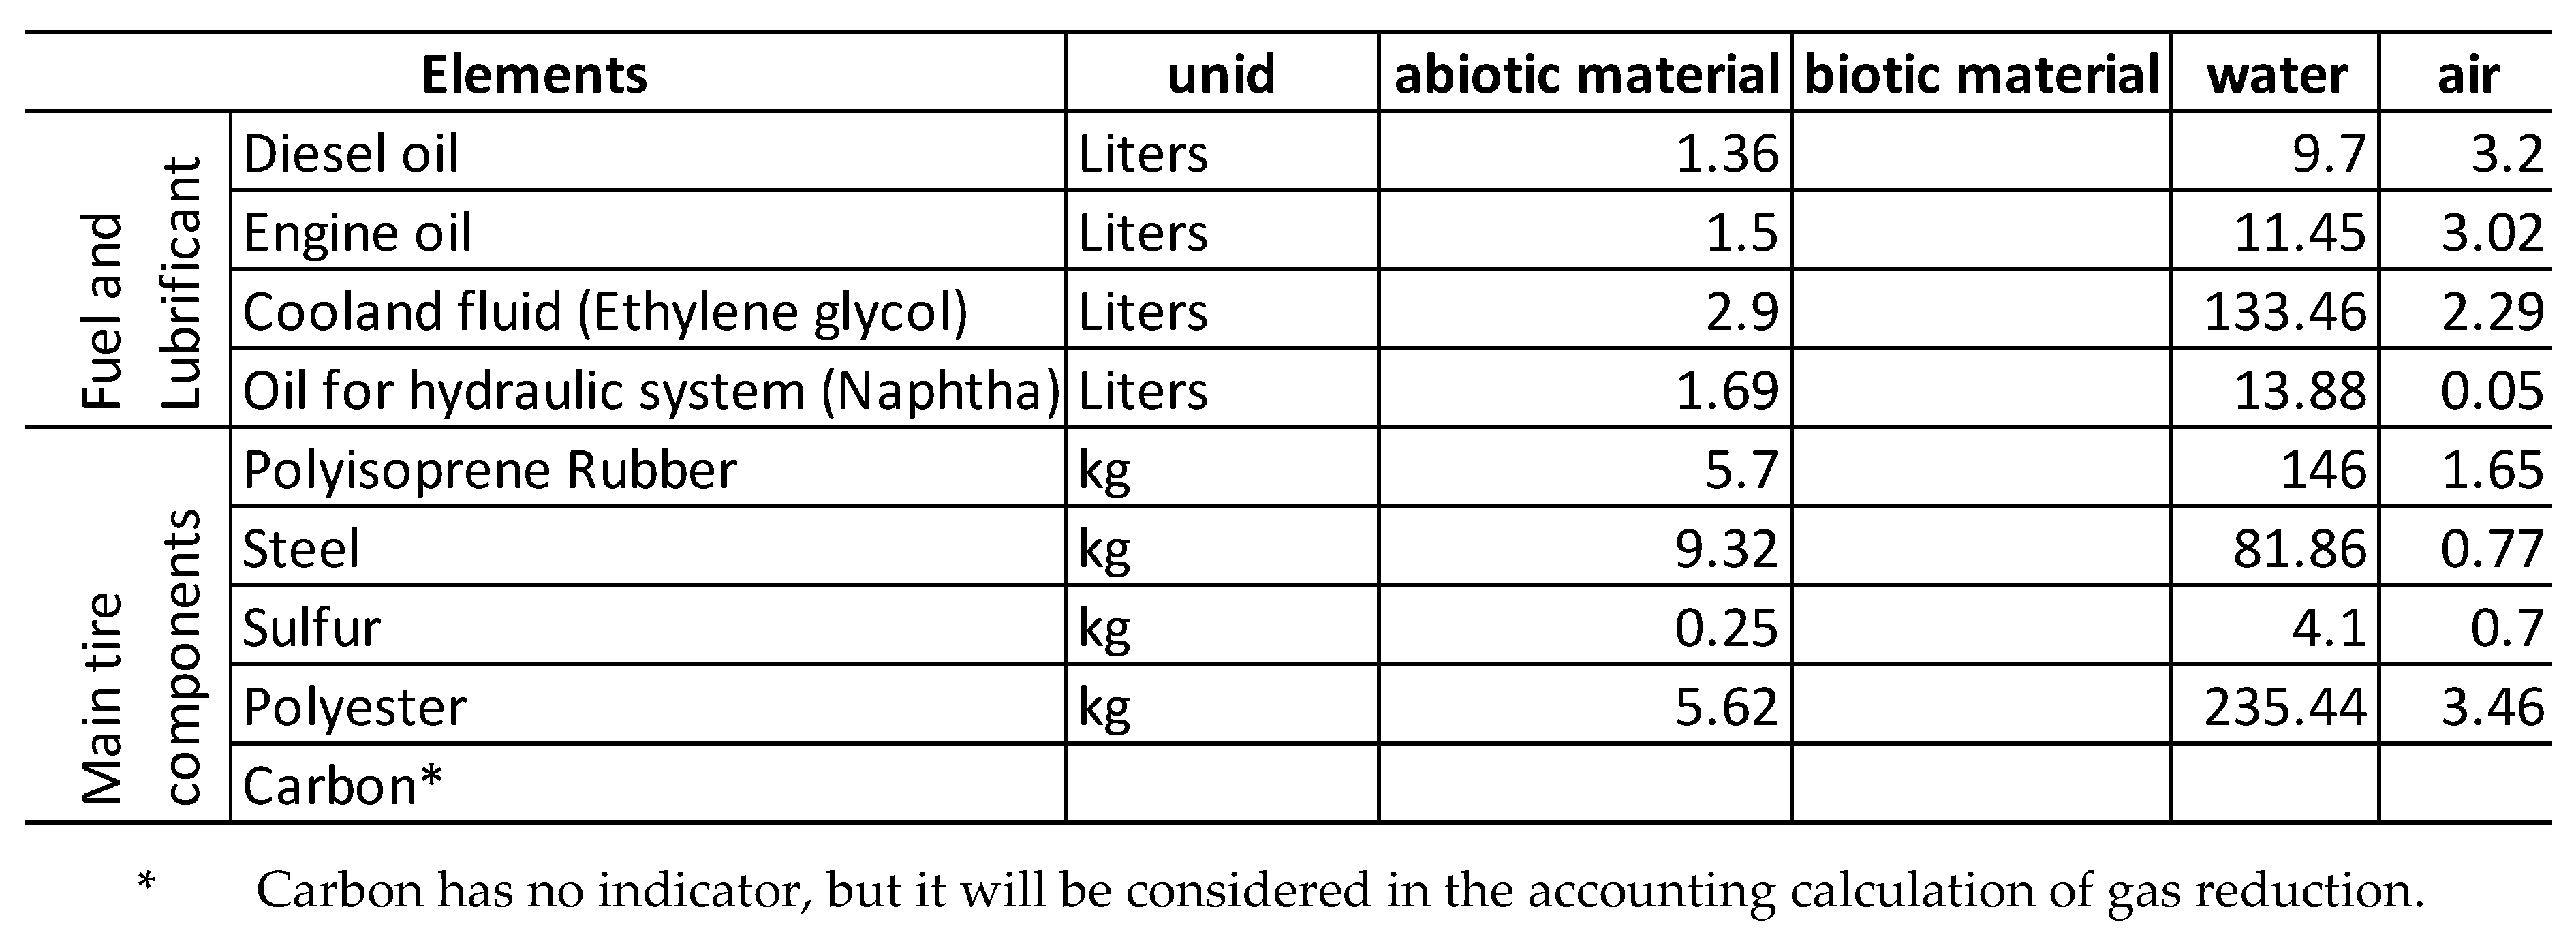
Table 7 shows the elements divided into fuel/lubricant and main components of the tire, which were optimized in the WEEE reverse logistics operation. Thus, there was a reduction of environmental impacts in the compartments: (i) abiotic in 33621.92 kg, which represents factors related to global warming, air quality and minimization of pollution in fauna and flora. It should be noted that these factors directly affect the health of society, increasing the social cost; (ii) water in 295268 kg, reducing pollution in the local water system; and (iii) reduction in air pollution by 74194 kg. With that, it generated global minimization of 403083.68 kg. In this context, this is the first study that calculates the reduction of environmental impacts in abiotic compartments, water and air due to the optimization of the WEEE reverse chain transport using artificial intelligence. For the environmental assessment, the Material Intensity Factor was used, which is a relevant tool for global assessment of the minimization of environmental impacts, not using only percentage data, for example, Achillas et al [22] mentioned a 5% reduction in CO² pollutants ( from fossil fuels) and Llerena-Riascos et al. [4] reported that it generated 65% in environmental benefits. Thus, the researches do not present the reduction of impacts in the abiotic compartments, water and air, subject not explored in the scientific literature in the published simulation models. This result contributes to the adoption of a circular economy, due to the reduction of environmental impacts in transport,
Another relevant finding is that the tire components (rubber, steel, sulfur and polyester) are the most relevant in the optimization, minimizing 41411 kg, followed by the reduction of environmental impact due to diesel optimization in 321998.80 kg. It should be noted that carbon black was not considered in this calculation, because tire wear generates carbon particles, which are more related to the dust that affects breathing, being classified as emissions, which will be calculated later. Thus, by optimizing the use of VUCs, tire and fuel consumption was further minimized, an innovative aspect in research that adopted optimization with the use of artificial intelligence, which in most cases is concerned with the tool used and not with reducing impacts realistic environmental issues that promote circular economy,
There was also a reduction in emissions of 45,493.25 kg of the main polluting gases resulting from the transport operation in São Paulo, as shown in Table 8. Carbon dioxide is the main pollutant of the Earth's atmosphere, which affects the health of society; however, 45367.81 kg were optimized with the reduction of collections from 286 to 220, denoting an important contribution, despite not solving the problem in its entirety. This finding innovates the state of the art by measuring the reduction of emissions of the main gases responsible for the greenhouse effect due to the optimization of the transport of the reverse chain of WEEE to promote circular economy, as well as, it indicates to managers an important way to reduce gas emissions , mainly CO2, to contribute to the 2030 agenda.
Another interesting result was the reduction of particulate matter from 5.32 to 3.93 in air. Pollution from particles generated from carbon black from worn-out tires and gas emissions drastically affects the lungs, causing serious illnesses. The reduction generated was 1.39 kg per year, showing that the adoption of artificial intelligence for route optimization is a promising tool for reducing emissions of greenhouse gases and particles that contributes to the circular economy, denoting a relevant theoretical and practical contribution .
6. Conclusion
It is concluded that the optimization of the WEEE reverse chain for São Paulo using artificial intelligence generated economic and environmental gains, promoting a circular economy. The optimized scenario proved to be effective in reducing the number of collections when considering that each collection process the VUC passes through several collection points, making the most of the truck's cubage.
Thus, this study contributes to the theory by presenting the current functioning of the WEEE reverse chain in São Paulo, as well as presenting the optimized scenario with details after the adoption of artificial intelligence. In the current operation, it concluded that the manufacturers outsourced WEEE management and reverse logistics operation, denoting that WEEE management using reverse logistics is a support activity. Also, with the application of artificial intelligence, it was possible to present an optimized scenario that considered the programming for the removal of WEEE, where each collection process, the VUC passes through several points until it loads the truck as much as possible. This optimized WEEE reverse logistics schedule reduced the number of collections, 3 VUCs and overtime – improving the quality of life for drivers, generating economic and environmental benefits, promoting the circular economy. It should be noted that this is the first study that applied computer simulation with the use of artificial intelligence through genetic algorithm for economic and environmental optimization of the reverse WEEE network, considering manufacturers, waste managers and recyclers.
Thus, the cost reduction was concluded comparing the current scenario and the optimized one, forcing the contractor to reduce the freight price, as well as this is the first study that calculates the reduction of environmental impacts in the abiotic compartments, water and air on the subject, mainly evaluating the minimization of emissions of the main polluting gases generated by trucks, contributing to circular economy actions. Thus, this is the first study that presents the calculation of cost and time reduction in detail, in addition to measuring the improvement in the volume of vehicles, being a primordial aspect in the optimization and guidance of operations managers.
It also contributes to the organizational practice because it organized the WEEE reverse chain operations, an aspect that it was not possible to identify in the current scenario with operational details. It should be noted that complex optimization scenarios without detailing make it impossible for managers to apply them in practice. Thus, an operations manager could easily understand the process performed for optimization, enabling its replication in practice. The main problems found in practice that can be solved with this optimization are: (i) not answering requests for individual collections, but carrying out programmed collections at several collection points, taking advantage of the vehicle's volume as much as possible; (ii) it was not possible to optimize 100% of the extra hours of the transport operation due to traffic, but it was possible to optimize as much as possible; (iii) the lack of vision of the whole WEEE reverse chain made it difficult to study the reduction of 3 VUCs in the operation, generating environmental and economic gains. Another important aspect was the development of the contract with transparency in terms of costs, considering that the cost reduction would lead to a reduction in the freight price. In addition to the reduction of environmental impacts, and minimization of greenhouse gas emissions in a realistic scenario.
Also, this topic is relevant and emerging in the business environment of the electronics sector because the sectoral agreement was signed in October 2019 based on law 12,305 enacted in 2010 on the mandatory management of WEEE through reverse logistics aimed at sharing responsibilities for WEEE management between manufacturers, waste managers and recyclers in São Paulo, who are structuring the reverse chain.
The implementation of the reverse WEEE network in São Paulo also contributes to society, because the environmental impact resulting from the inadequate disposal of WEEE in common sanitary landfills and the generation of greenhouse gas emissions is being minimized, as well as several informal recyclers with ability to be part of the reverse WEEE network will be formalized, generating employment and, in particular, informal collectors may have the opportunity for formalized employment.
The main limitation of this study was the realization of the regional research in São Paulo, Brazil, justified because it is the first Brazilian State that has the obligation to implement WEEE reverse logistics. For future studies, it suggests carrying out this research in other states and countries with the aim of generating comparison between them, making it possible to generate relevant results for theory, practice and government actions.
Acknowledgments
The authors are grateful to FAPESP–São Paulo Research Foundation (Proc. 2020/16364-5). This work was financially supported by the research unit on Governance, Competitiveness and Public Policy (UIDB/04058/2020)+(UIDP/04058/2020), funded by national funds through FCT - Fundação para a Ciência e a Tecnologia.
References
- BRAZILIAN ASSOCIATION OF INDUSTRIAL DEVELOPMENT (ABDI). Reverse Logistics of Electronic Equipment. Analysis of Technical and Economic Feasibility. 2012. Available at: <http://www.mdic.gov.br/arquivos/dwnl_1362058667.pdf>. Accessed on: 25 Jan 2016.
- Rogers, DS; Tibben-Lembre, RS Going backwards: reverse logistics trends and practices. Reno: Reverse Logistics Executive Council, 1998.
- Oliveira Neto, GC, Correia, ADJC, Tucci, HNP, Melatto, RAPB, Amorim, M. Reverse Chain for Electronic Waste to Promote Circular Economy in Brazil: A Survey on Electronics Manufacturers and Importers. Sustainability (Switzerland), 2023, 15(5), 4135. [CrossRef]
- Llerena-Riascos, C., Jaén, S., Montoya-Torres, JR, Villegas, JG An Optimization-Based System Dynamics Simulation for Sustainable Policy Design in WEEE Management Systems. Sustainability 2021, 13, 11377. [CrossRef]
- Guo, R., Zhong, Z. A customer-centric IoT-based novel closed-loop supply chain model for WEEE management. Advanced Engineering Informatics 55 (2023), 101899.
- Tosarkani, BM, Amin, SH, Zolfagharinia, H. A scenario-based robust possibilistic model for a multi-objective electronic reverse logistics network. International Journal of Production Economics. v.224, 107557, 2020. [CrossRef]
- Korhonen, J., Honkasalo, A., Seppala, J. Circular economy: the concept and its limitations. Ecological economics, v.143, pp.37-46, 2018. [CrossRef]
- Pinto, LFR, Venturini, GFP, Digiesi, S., Facchini, F., Neto, GCO Sustainability assessment in manufacturing under a strong sustainability perspective—an ecological neutrality initiative. Sustainability (Switzerland), 2020, 12(21), pp. 1–40, 9232.
- Rubmann, M.; Lorenz, M.; Gerbert, P.; Waldner, M.; JustusS, J.; Engel, P.; Harnisch, M. Industry 4.0: The Future of Productivity and Growth in Manufacturing Industries; Boston Consulting Group: Boston, MA, USA, 2015; pp. 1–14, Available at: https://imagesrc. bcg.com/Images/Industry_40_Future_of_Productivity_April_2015_tcm9-61694.pdf. Accessed on July 20, 2020. [Google Scholar]
- Cassia, AR, Costa, I., da Silva, VHC, de Oliveira Neto, GC Systematic literature review for the development of a conceptual model on the relationship between knowledge sharing, information technology infrastructure and innovative capability. Technology Analysis and Strategic Management, 2020, 32(7), pp. 801–821.
- Hidalgo, CG, Ramirez, FJ, Olivares, T., Sanchez, LR The adoption of internet of things in a circular supply chain framework for the recovery of WEEE: the case of lithium-ion electric vehicle battery packs. Water Management, v.130, p.32-44, 2020.
- Achilles, C.; Vlachokostas, C.; Aidonis, D.; Moussiopoulos, N.; Lakovou, E.; Banias, G. Optimizing reverse logistics network to support policy-making in the case of Electrical and Electronic Equipment. Waste Management, v.30, p. 2592-2600, 2010a.
- Qiang S., Zhou XZ. Robust reverse logistics network design for the waste of electrical and electronic equipment (WEEE) under recovery uncertainty. Journal of Environmental Biology, v.37, pp.1153–1165, 2016.
- KILIC, HS; CEBELI, U.; AYHAN, MB Reverse logistics system design for the waste of electrical and electronic equipment (WEEE) in Turkey. Resources, Conservation and Recycling, vol. 95. P. 120-132, 2014.
- Bal, A., Satoglu, SI A goal programming model for sustainable reverse logistics operations planning and an application. Journal of Cleaner Production, v.201, pp.1081-1091, 2018.
- Elia, V., Gnoni, MG, Tornese, F. Designing a sustainable dynamic collection service for WEEE: an economic and environmental analysis through simulation. Waste Management & Research. v.37, n.4, pp.1-10, 2019. [CrossRef]
- Mar-Ortiz., Adenso-Diaz., Gonzalez-Velarde, JL. Design of a recovery network for WEEE collection: the case of Galicia, Spain. Journal of the Operational Research Society. V.62, pp.1471–1484, 2011.
- Gomes MI, Barbosa-Povoa AP, Novais AQ Modeling a recovery network for WEEE: a case study in Portugal. Waste Management, v.31, pp.1645–1660, 2011.
- Alumur, SA, Nickel, S., Saldanha-da-Gama., Verter, V. Multi-period reverse logistics network design. European Journal of Operational Research. v.220, n.1, pp.67-78, 2012. [CrossRef]
- Assavapokee, T.; Wongthatsanekorn, W. Reverse production system infrastructure design for electronic products in the state of Texas. Computers & Industrial Engineering, v.62, p. 129-140, 2012. [CrossRef]
- Achilles, C.; Vlachokostas, C.; Moussiopoulos, N.; Banias, G. Decision support system for the optimal location of electrical and electronic waste treatment pants: A case study in Greece. Waste Management, v. 30, p. 870-879, 2010b.
- Achilles, C.; Aidonis, D.; Vlacokostas, C.; Moussiopoulos, N.; Triantafillou, D. A multi-objective decision-making model to select waste electrical and electronic equipment transportation media. Resources Conservation and Recycling. See 66, p. 76-84, 2012. [CrossRef]
- Yu, H.,, Solvang W. A stochastic programming approach with improved multi-criteria scenario-based solution method for sustainable reverse logistics design of waste electrical and electronic equipment (WEEE). Sustainability, v.8, pp.1331, 2016.
- Gamberini R, Gebennini E, Manzini R, et al. On the integration of planning and environmental impact assessment for a WEEE transportation network: a case study. Resources, Conservation and Recycling, v.54, pp. 937–951, 2010. [CrossRef]
- Shokohyar, S., Mansour S. Simulation-based optimization of a sustainable recovery network for waste from electrical and electronic equipment (WEEE). International Journal of Computer Integrated Manufacturing, v.26, pp.487–503, 2013.
- Slowik, A., & Kwasnicka, H. (2020). Evolutionary algorithms and their applications to engineering problems. Neural Computing and Applications, 32, 12363-12379. [CrossRef]
- Dat, LQ, Linh, DTT, Chou, Shuo-Yan., Yu, VF Optimizing reverse logistic costs for recycling end-of-life electrical and electronic products. Expert Systems with Applications. v.39, n.7, pp.6380-6387, 2012.
- Ayvaz, B., Bolat, B., Aydin, N. Stochastic reverse logistics network design for waste of electrical and electronic equipment. Resources, Conservation and Recycling. v.104, Part, pp.391-404, 2015. [CrossRef]
- Duman, GM, Kongar, E, Gupta, SM Estimation of electronic waste using optimized multivariate gray models. Waste Management. v.95, pp.241–249, 2019.
- Lv, J., Du, S. Kriging Method-Based Return Prediction of Waste Electrical and Electronic Equipment in Reverse Logistics. app. Sci. 2021, 11, 3536. [CrossRef]
- Moslehi, MS, Sahebi, H., Teymour, A. A multi-objective stochastic model for a reverse logistics supply chain design with environmental considerations. Journal of Ambient Intelligence and Humanized Computing (2021) 12:8017–8040. [CrossRef]
- Zhang, H., Peeters, P., Demeester, E., Duflou, JR, Kellens, K. A CNN-Based Fast Picking Method for WEEE Recycling. Proceded by CIRP 106, 2022, 264-269.
- Koç, Ç.; Bektas, T.; Jabali, O.; Laporte, G. A hybrid evolutionary algorithm for heterogeneous fleet vehicle routing problems with time windows. Computers & Operations Research, v. 64, p. 11-27, 2015. [CrossRef]
- Clarke, G.; Wright JW Scheduling of Vehicles from A Central Depot to A Number of Delivery Points. Operations Research, v. 12, p.568-581, 1964.
- Lima, SJA; Araujo, SA; Schmidt, PTH A hybrid approach based on genetic algorithm and nearest neighbor heuristic for solving the capacitated vehicle routing problem. Acta Scientiarum Technology, v. 40, e36708, 2018.
- Lima, SJA; Araújo, SA A New Binary Encoding Scheme in Genetic Algorithm for Solving the Capacitated Vehicle Routing Problem. In: International Conference on Bioinspired Methods and Their Applications. Springer, Cham, p. 174-184. 2018.
- Bogner, A., Littig, B., Menz, B. Interviewing Experts. Palgrave McMillan, 2009.
- Yin, RK Case Study: design and methods. 4. ed. Porto Alegre: Bookman, 2010.
- Goldberg, DE Genetic Algorithms in search, optimization and machine learning. USA, Addison-Wesley Publishing Company, 1989.
- Holland, JH Adaptation in natural and artificial systems. Cambridge: MIT Press, p. 228, 1992.
- Juan AA, Keenan P., Martí R., McGarraghy S., Panadero J., Carroll P., & Oliva D. (2023). A review of the role of heuristics in stochastic optimization: From metaheuristics to learnheuristics. Annals of Operations Research, 320(2), 831-861.
- Larson, RC & Odoni, AR Urban Operations Research. NJ-USA: Prentice-Hall, 1981. Available at: https://web.mit.edu/urban_or_book/www/book/.
- Librantz, AFH, Coppini, NL, Baptista, EA, Alves de Araújo, S., & Castello Rosa, ADF (2011). Genetic algorithm applied to investigate cutting process parameters influence on workpiece price formation. Materials and Manufacturing Processes, 26(3), 550-557. [CrossRef]
- Slowik, A., & Kwasnicka, H. (2020). Evolutionary algorithms and their applications to engineering problems. Neural Computing and Applications, 32, 12363-12379. [CrossRef]
- Pereira, J., Mendes, J., Junior, JS, Viegas, C., & Paulo, JR (2022). A review of genetic algorithm approaches for wildfire spread prediction calibration. Mathematics, 10(3), 300. [CrossRef]
- Benvenga, MA, Araújo, SAD, Librantz, AF, Santana, JC, & Tambourgi, EB (2011). Application of simulated annealing in simulation and optimization of drying process of Zea mays malt. Agricultural Engineering, 31(5), 940-953. [CrossRef]
- Lourenço, WS, Lima, SJ A, & SA Araújo. (2018). TASNOP: A tool for teaching algorithms to solve network optimization problems. Computer Applications in Engineering Education, 26(1), 101-110. [CrossRef]
- Juan, AA, Keenan, P., Martí, R., McGarraghy, S., Panadero, J., Carroll, P., & Oliva, D. (2023). A review of the role of heuristics in stochastic optimization: From metaheuristics to learnheuristics. Annals of Operations Research, 320(2), 831-861.
- Combes, PP, Lafourcade, M. Transport costs: measures, determinants, and regional policy implications for France. Journal of economic geography, v.5, n.3, pp. 319-349, 2005. [CrossRef]
- Paoli, FM, de Oliveira Neto, GC, Lucato, WC Economic and environmental gains resulting from the utilization of the design for the environment (DfE) | Economic and environmental advantages resulting from the application of design for the environment (DfE). Espacios, 2013, 34(12), 11.
- Oliveira Neto, GC, de Sousa, WC Economic and Environmental Advantage Evaluation of the Reverse Logistic Implementation in the Supermarket Retail. IFIP Advances in Information and Communication Technology, 2014, 439(PART 2), pp. 197–204.
- Oliveira Neto, GC, Ferreira Correia, JM, Silva, PC, de Oliveira Sanches, AG, Lucato, WC Cleaner Production in the textile industry and its relationship to sustainable development goals.
- Journal of Cleaner Production, 2019, 228, pp. 1514–1525.
- Ritthoff, M.; Rohn, H.; Liedtke C. Calculating MIPS: Productivity resources of products and services. Wuppertal Spezial 27e. P. 8-25, 2003.
- Oliveira Neto, GC, Shibao, FY, Filho, MG, Chaves, LEC Cleaner production: A study of the environmental and economic advantage in polymer recycling | Cleaner production: study of the environmental and economic advantage of recycling polymers. Interciencia, 2015, 40(6), pp. 364–373.
- Oliveira Neto, GC, Lucato, WC Production planning and control as a tool for eco-efficiency improvement and environmental impact reduction Production Planning and Control, 2016, 27(3), pp. 148–156.
- Odum, EP Ecology. Rio de Janeiro: Guanabara Koogan, 1998.to in the content.
Figure 1.
Schematic diagram of the working of the proposed AI approach.
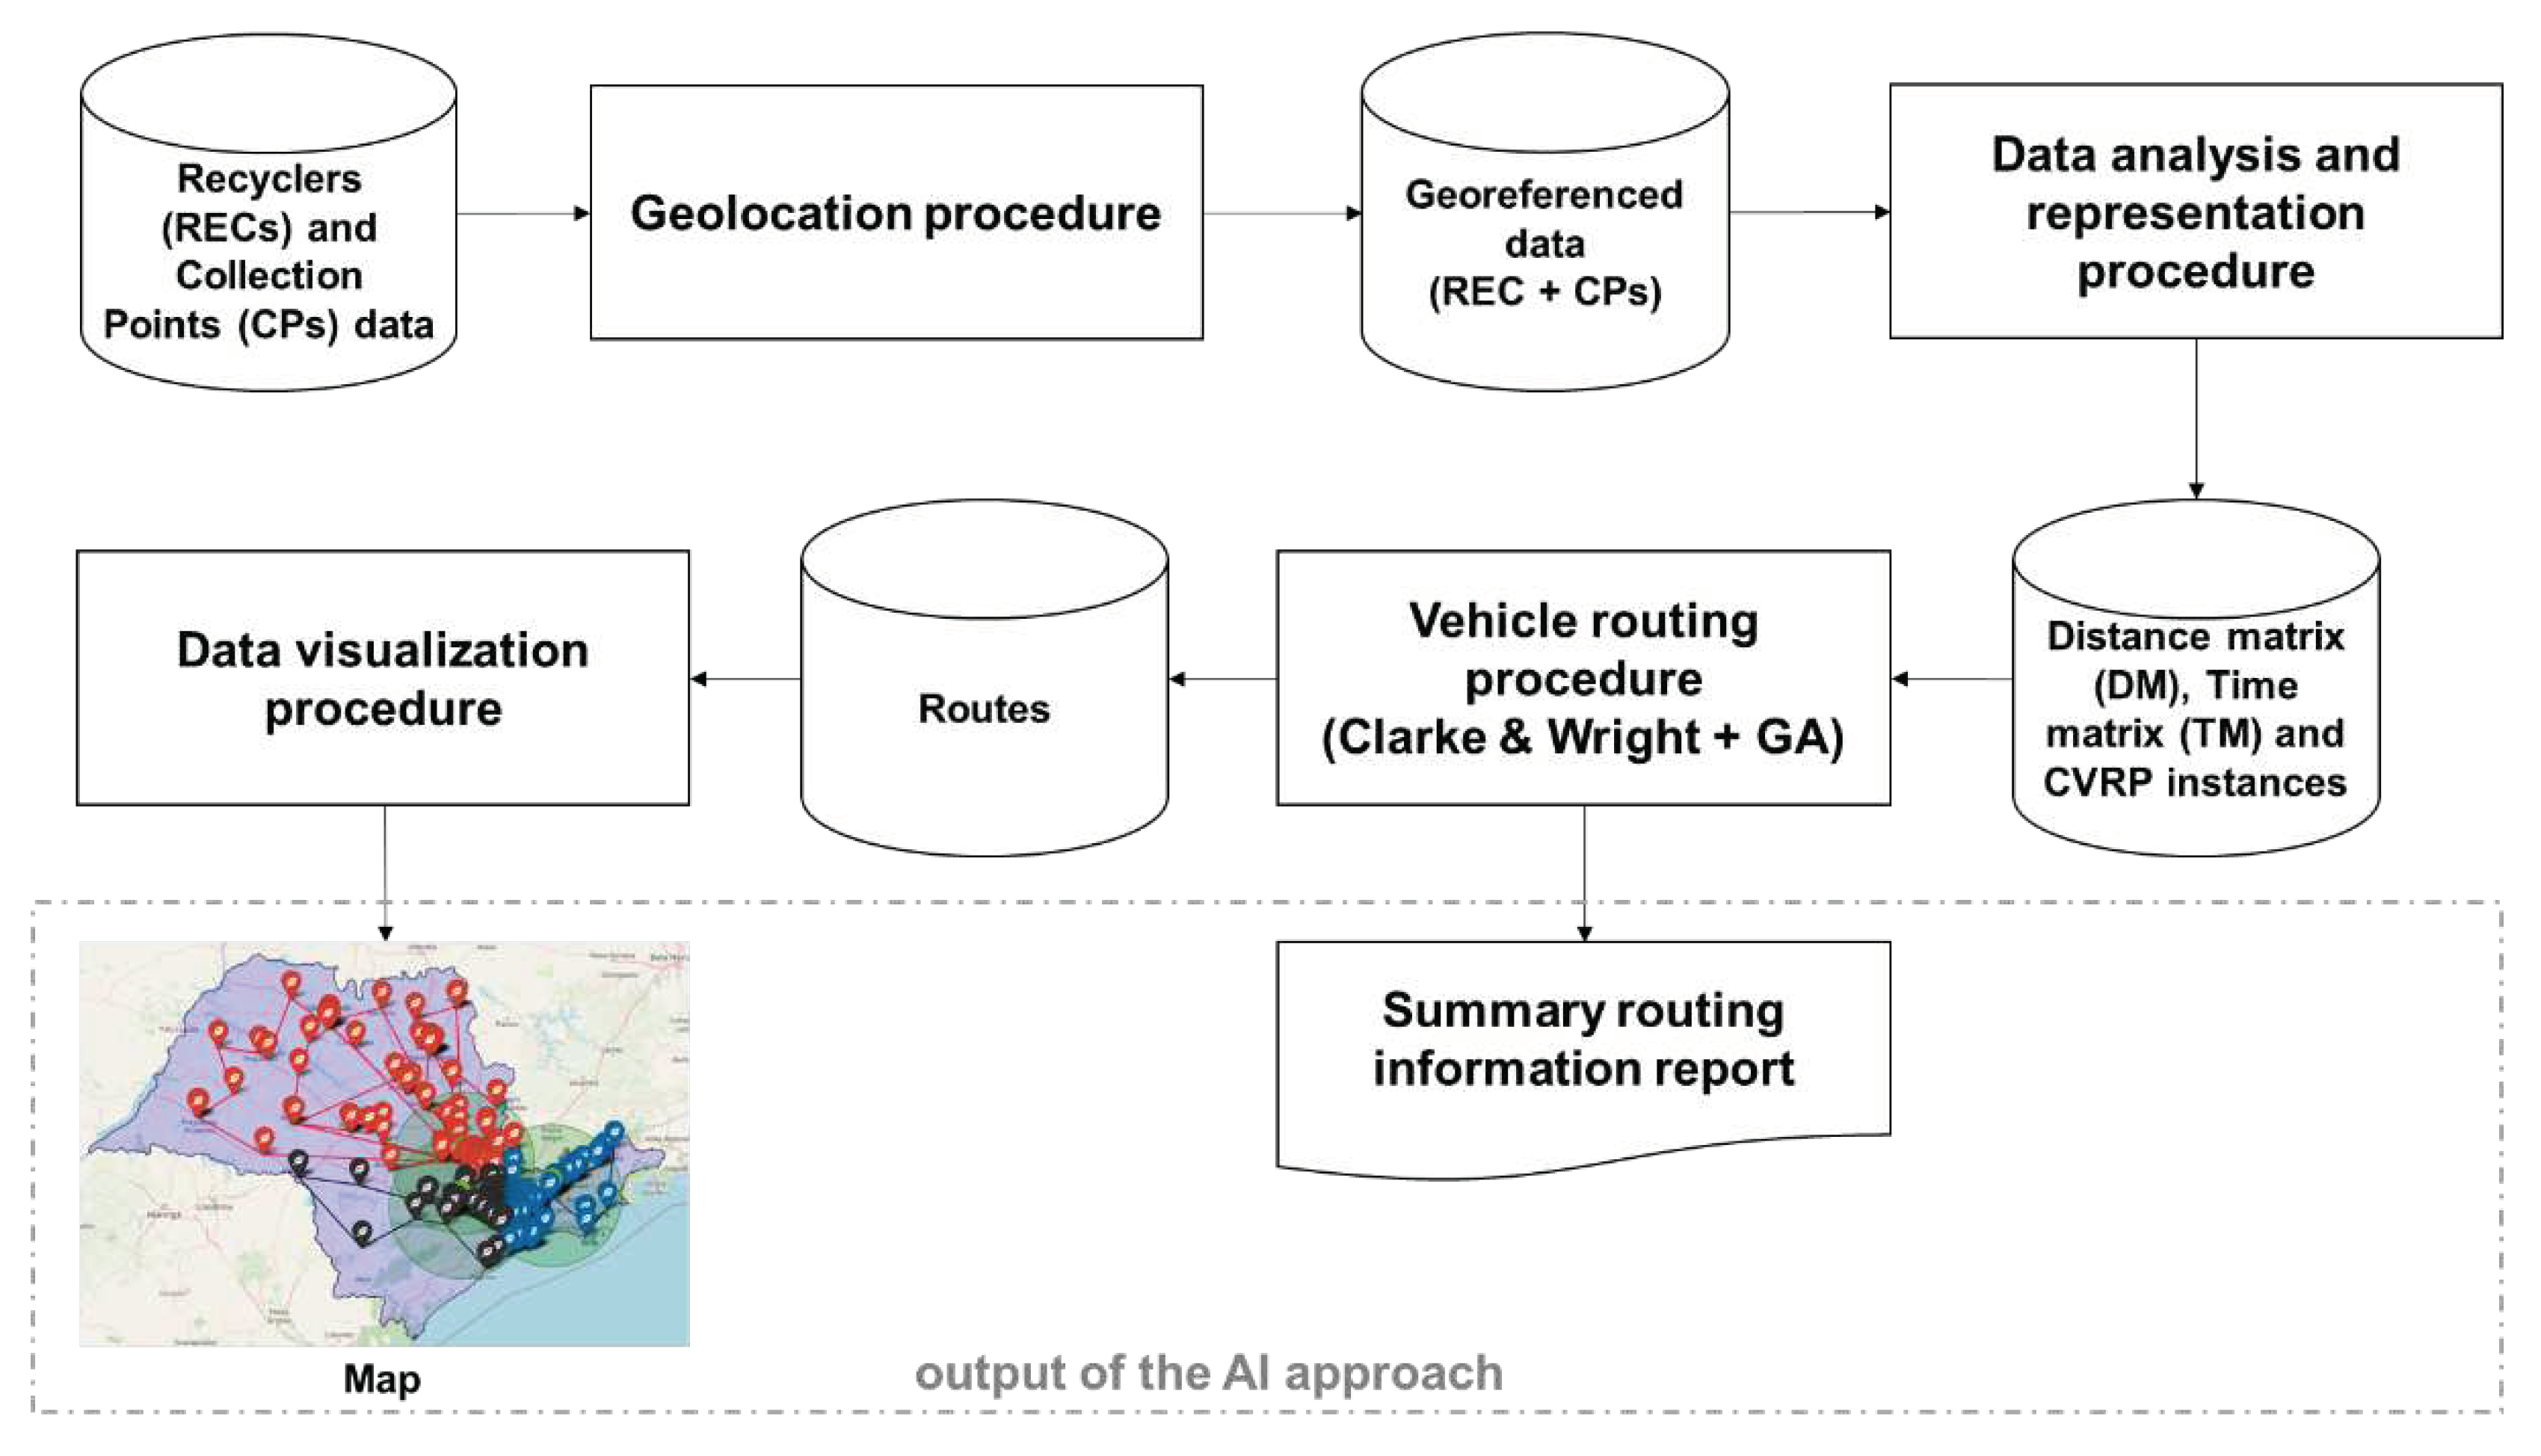
Figure 2.
Fragment of summary routing report.
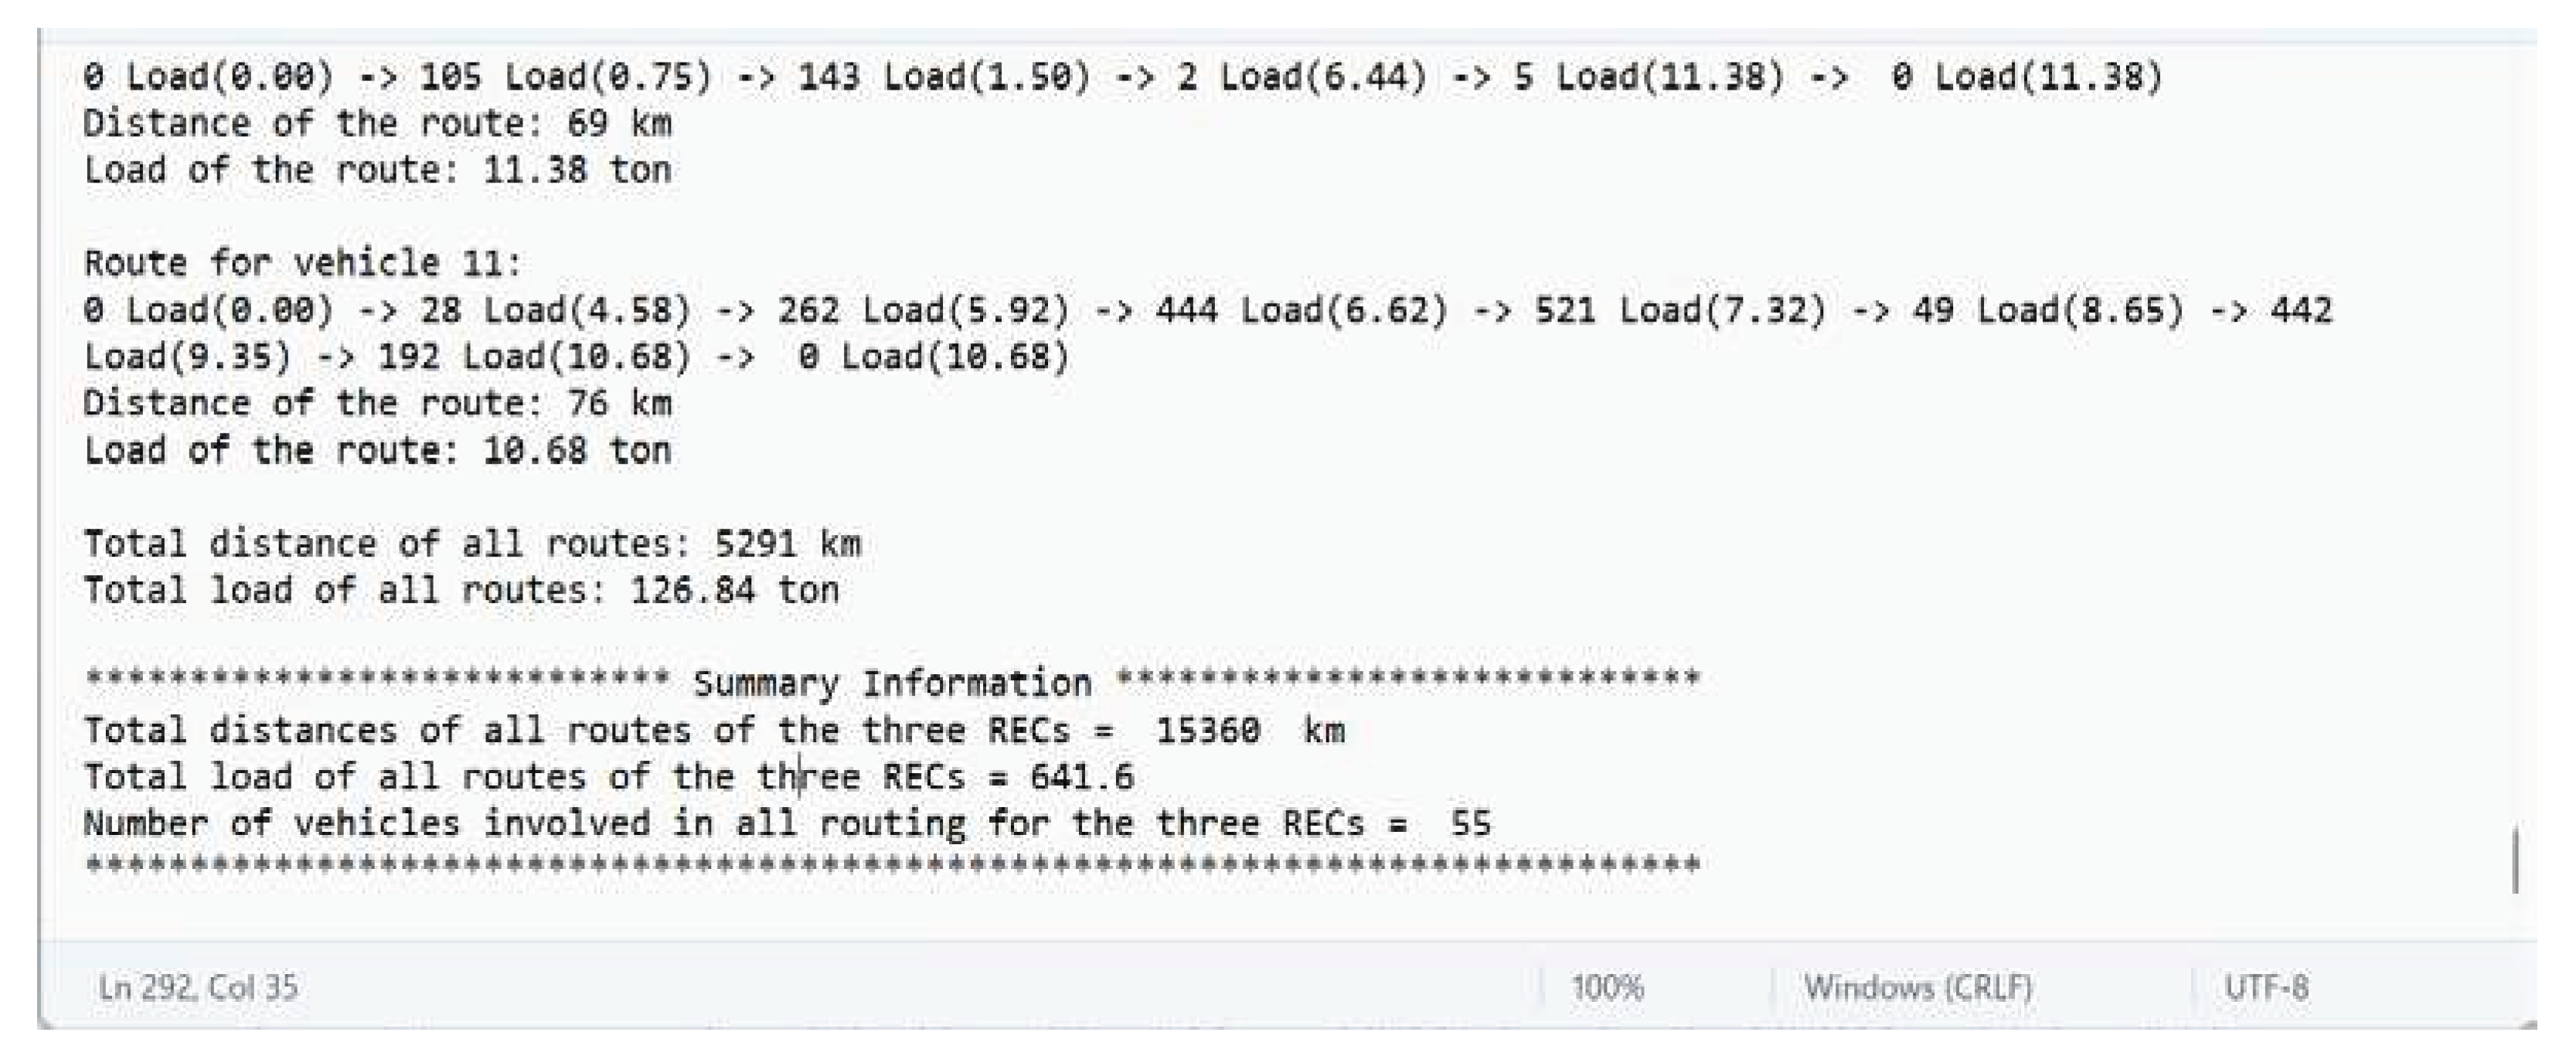
Figure 3.
GA and CW algorithms.
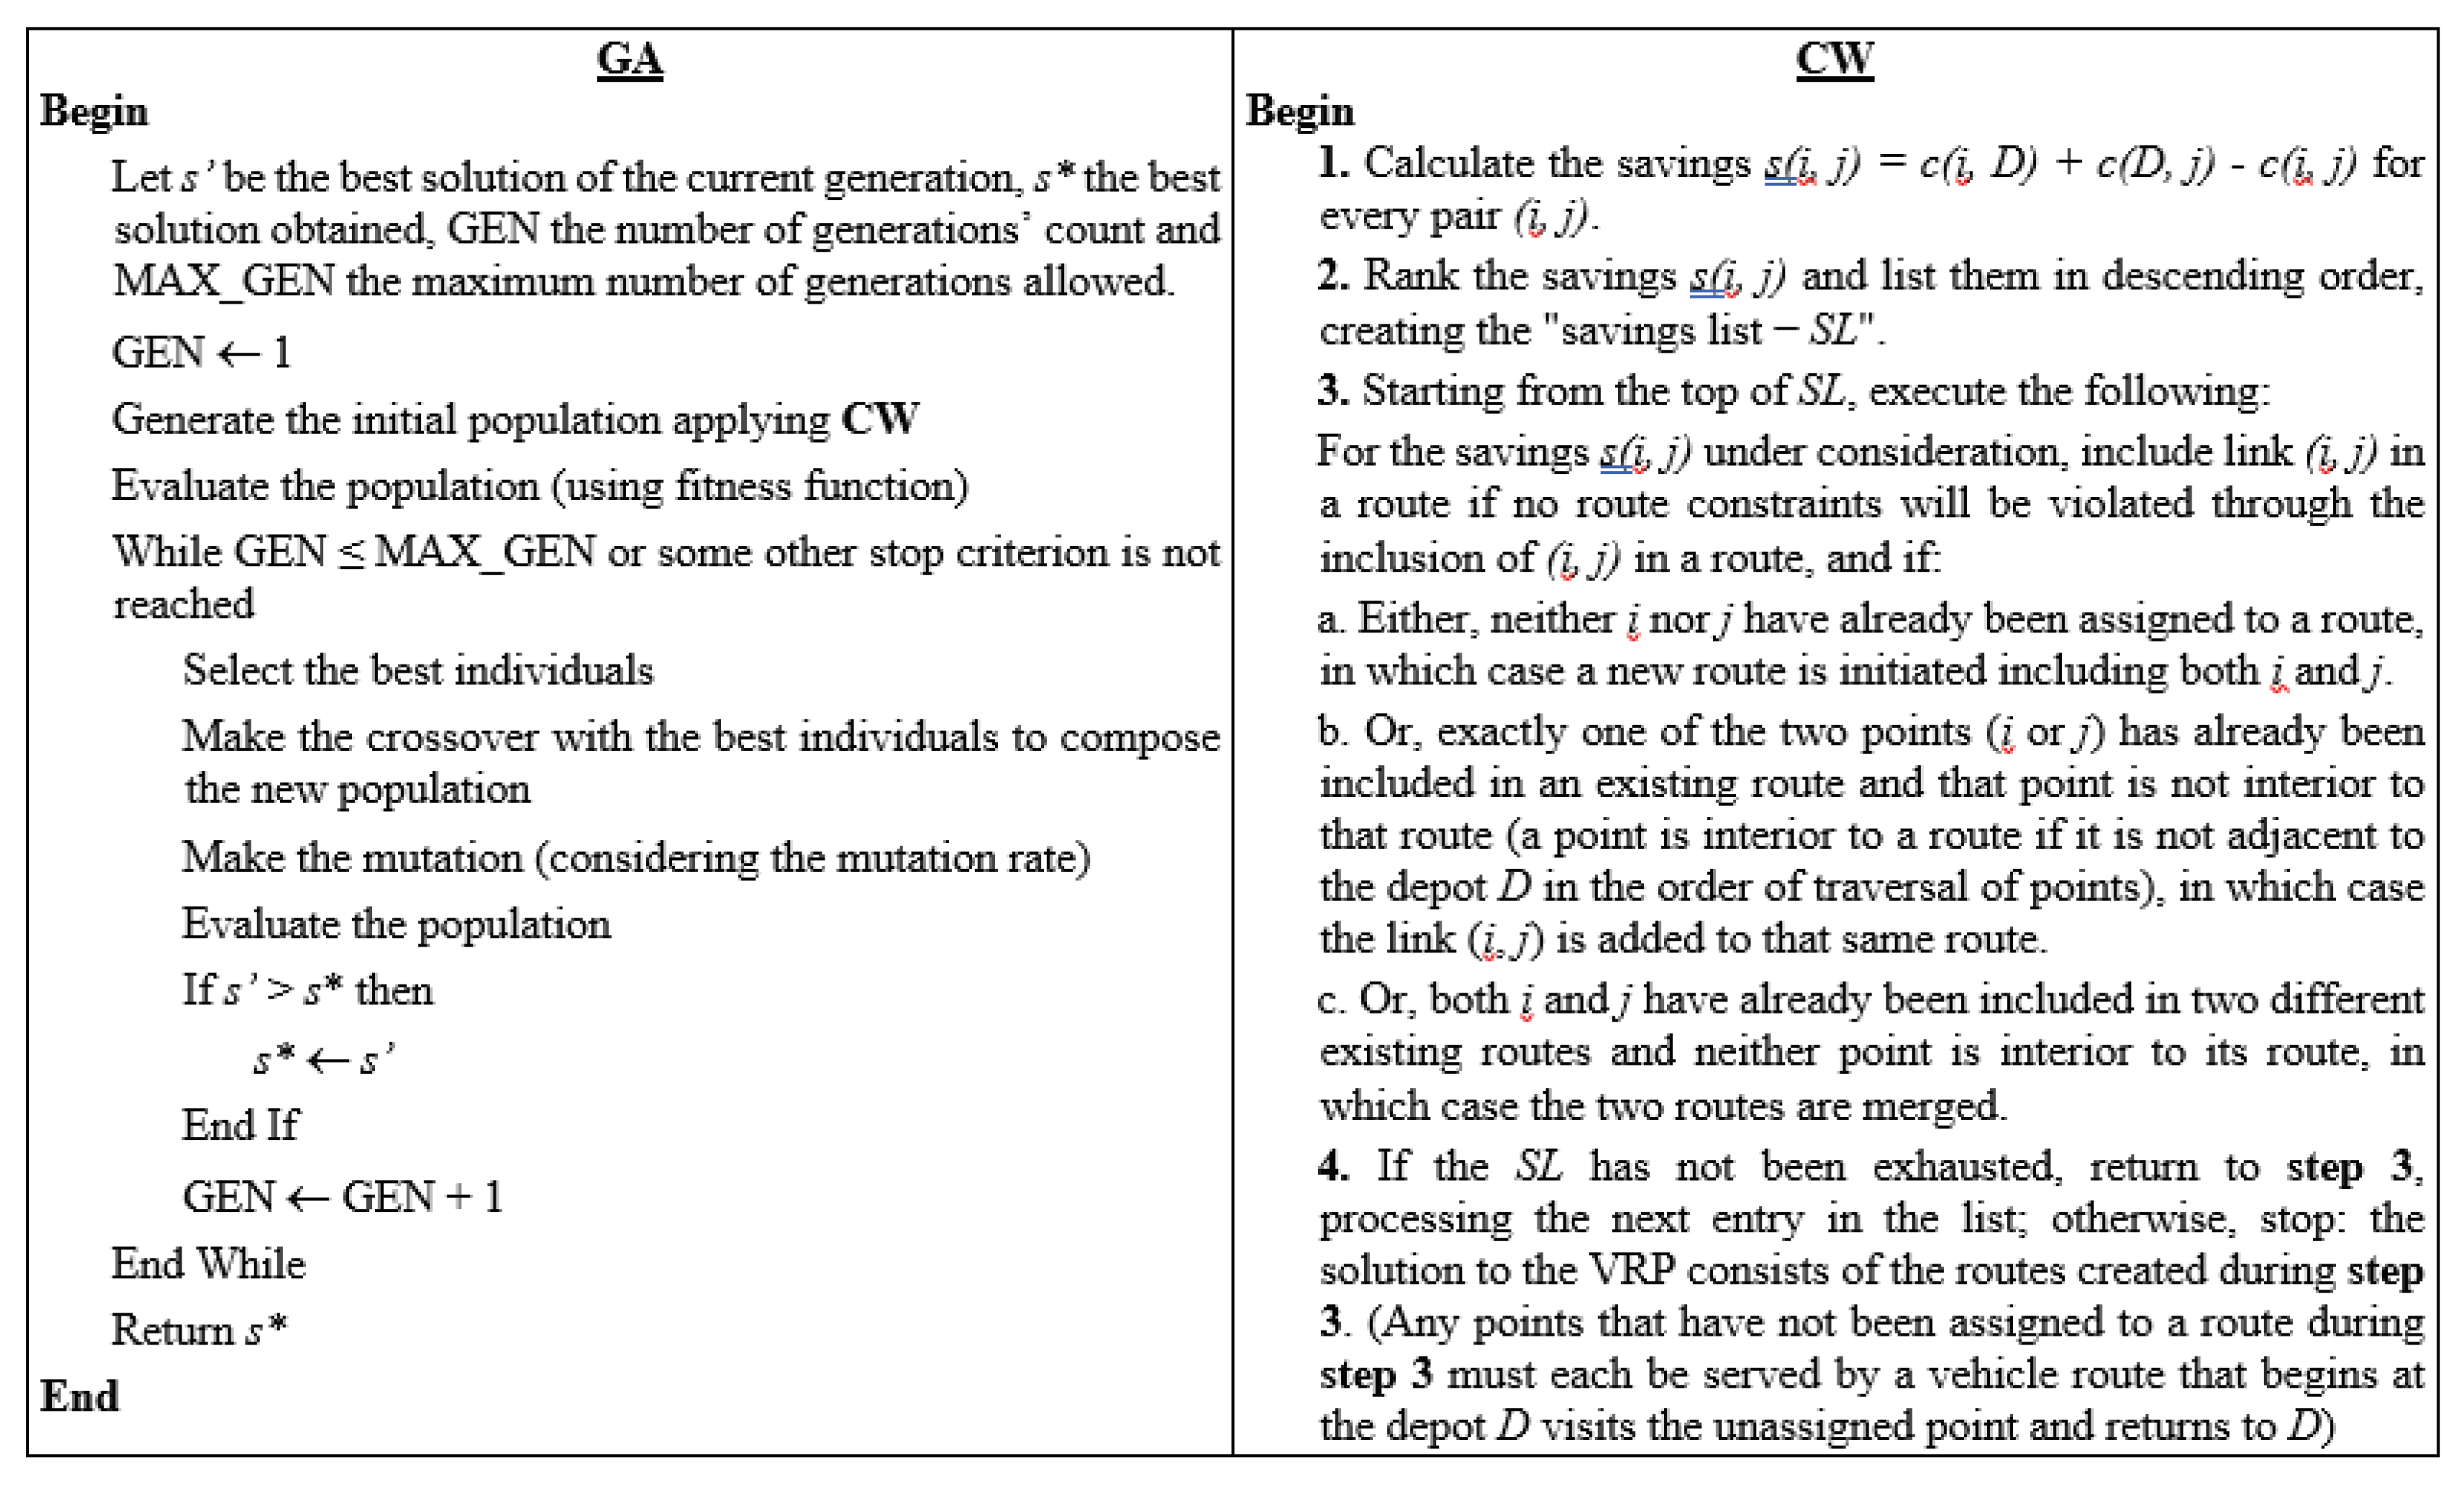
Figure 4.
Data visualization maps. (a) only RECs, (b) RECs+CPs and (c) RECs+CPs+routing.
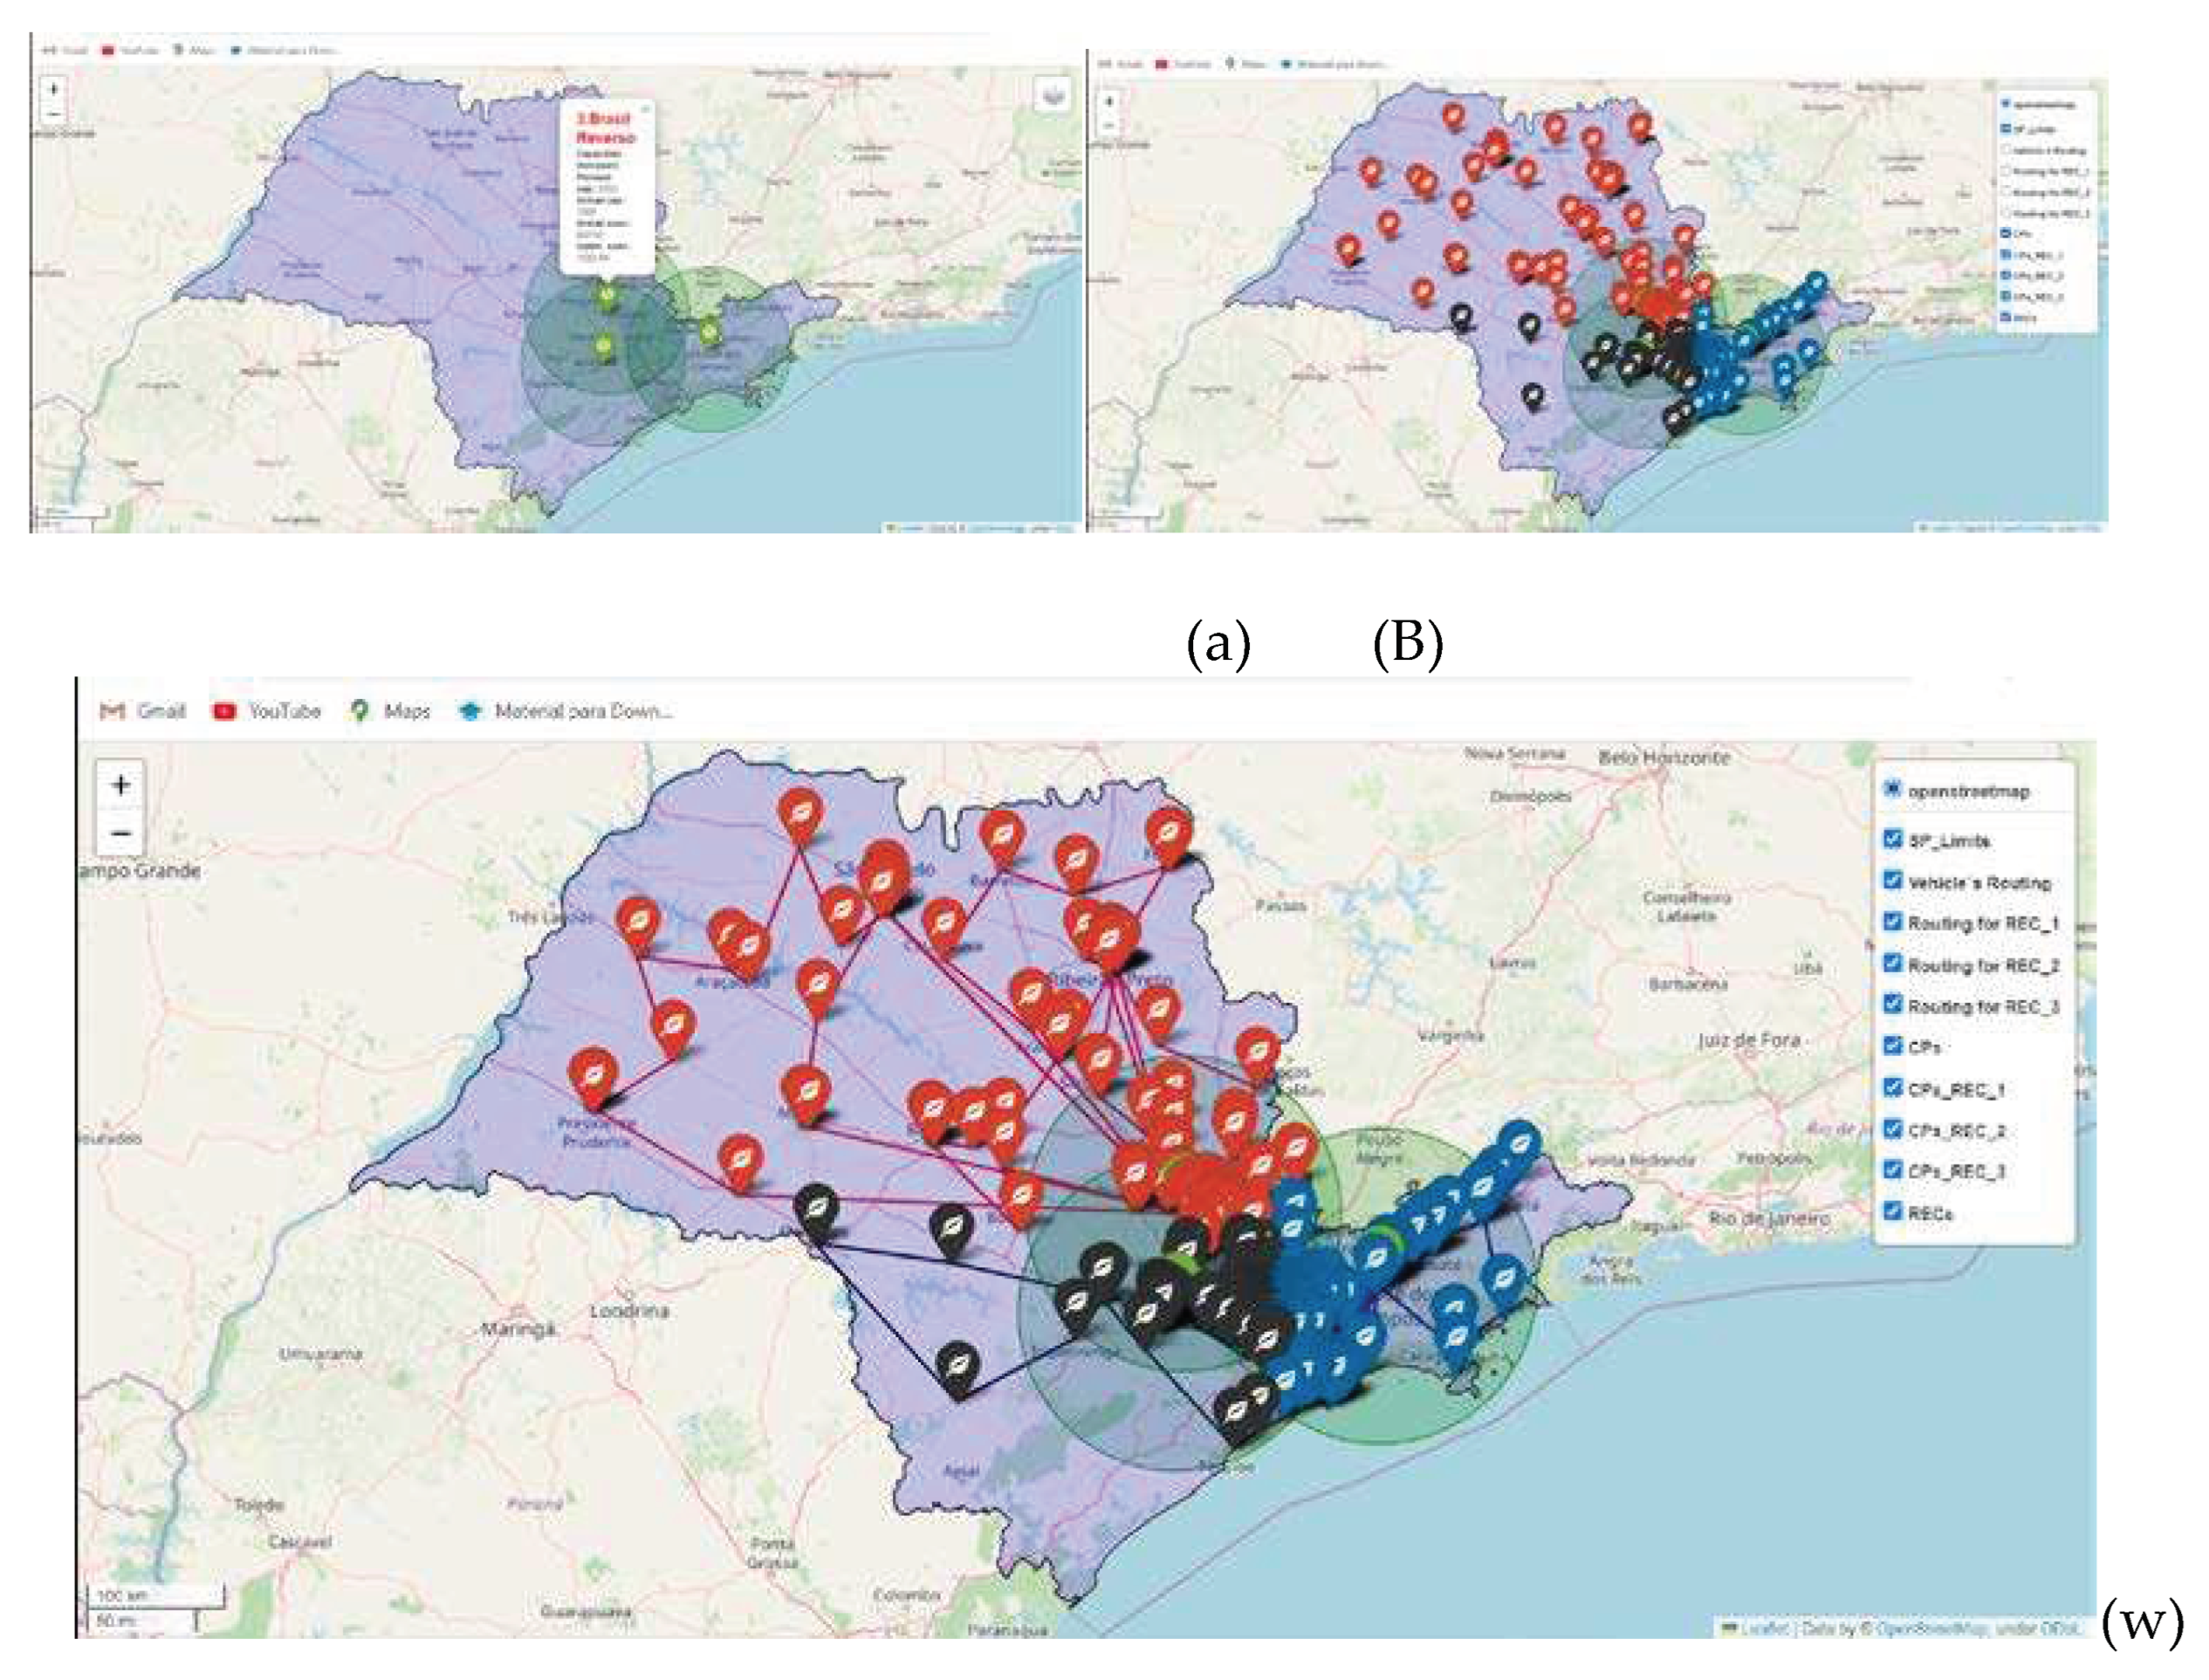
Figure 5.
Map of São Paulo with the location and closest route between the 3 recyclers and 554 collection points.
Figure 5.
Map of São Paulo with the location and closest route between the 3 recyclers and 554 collection points.
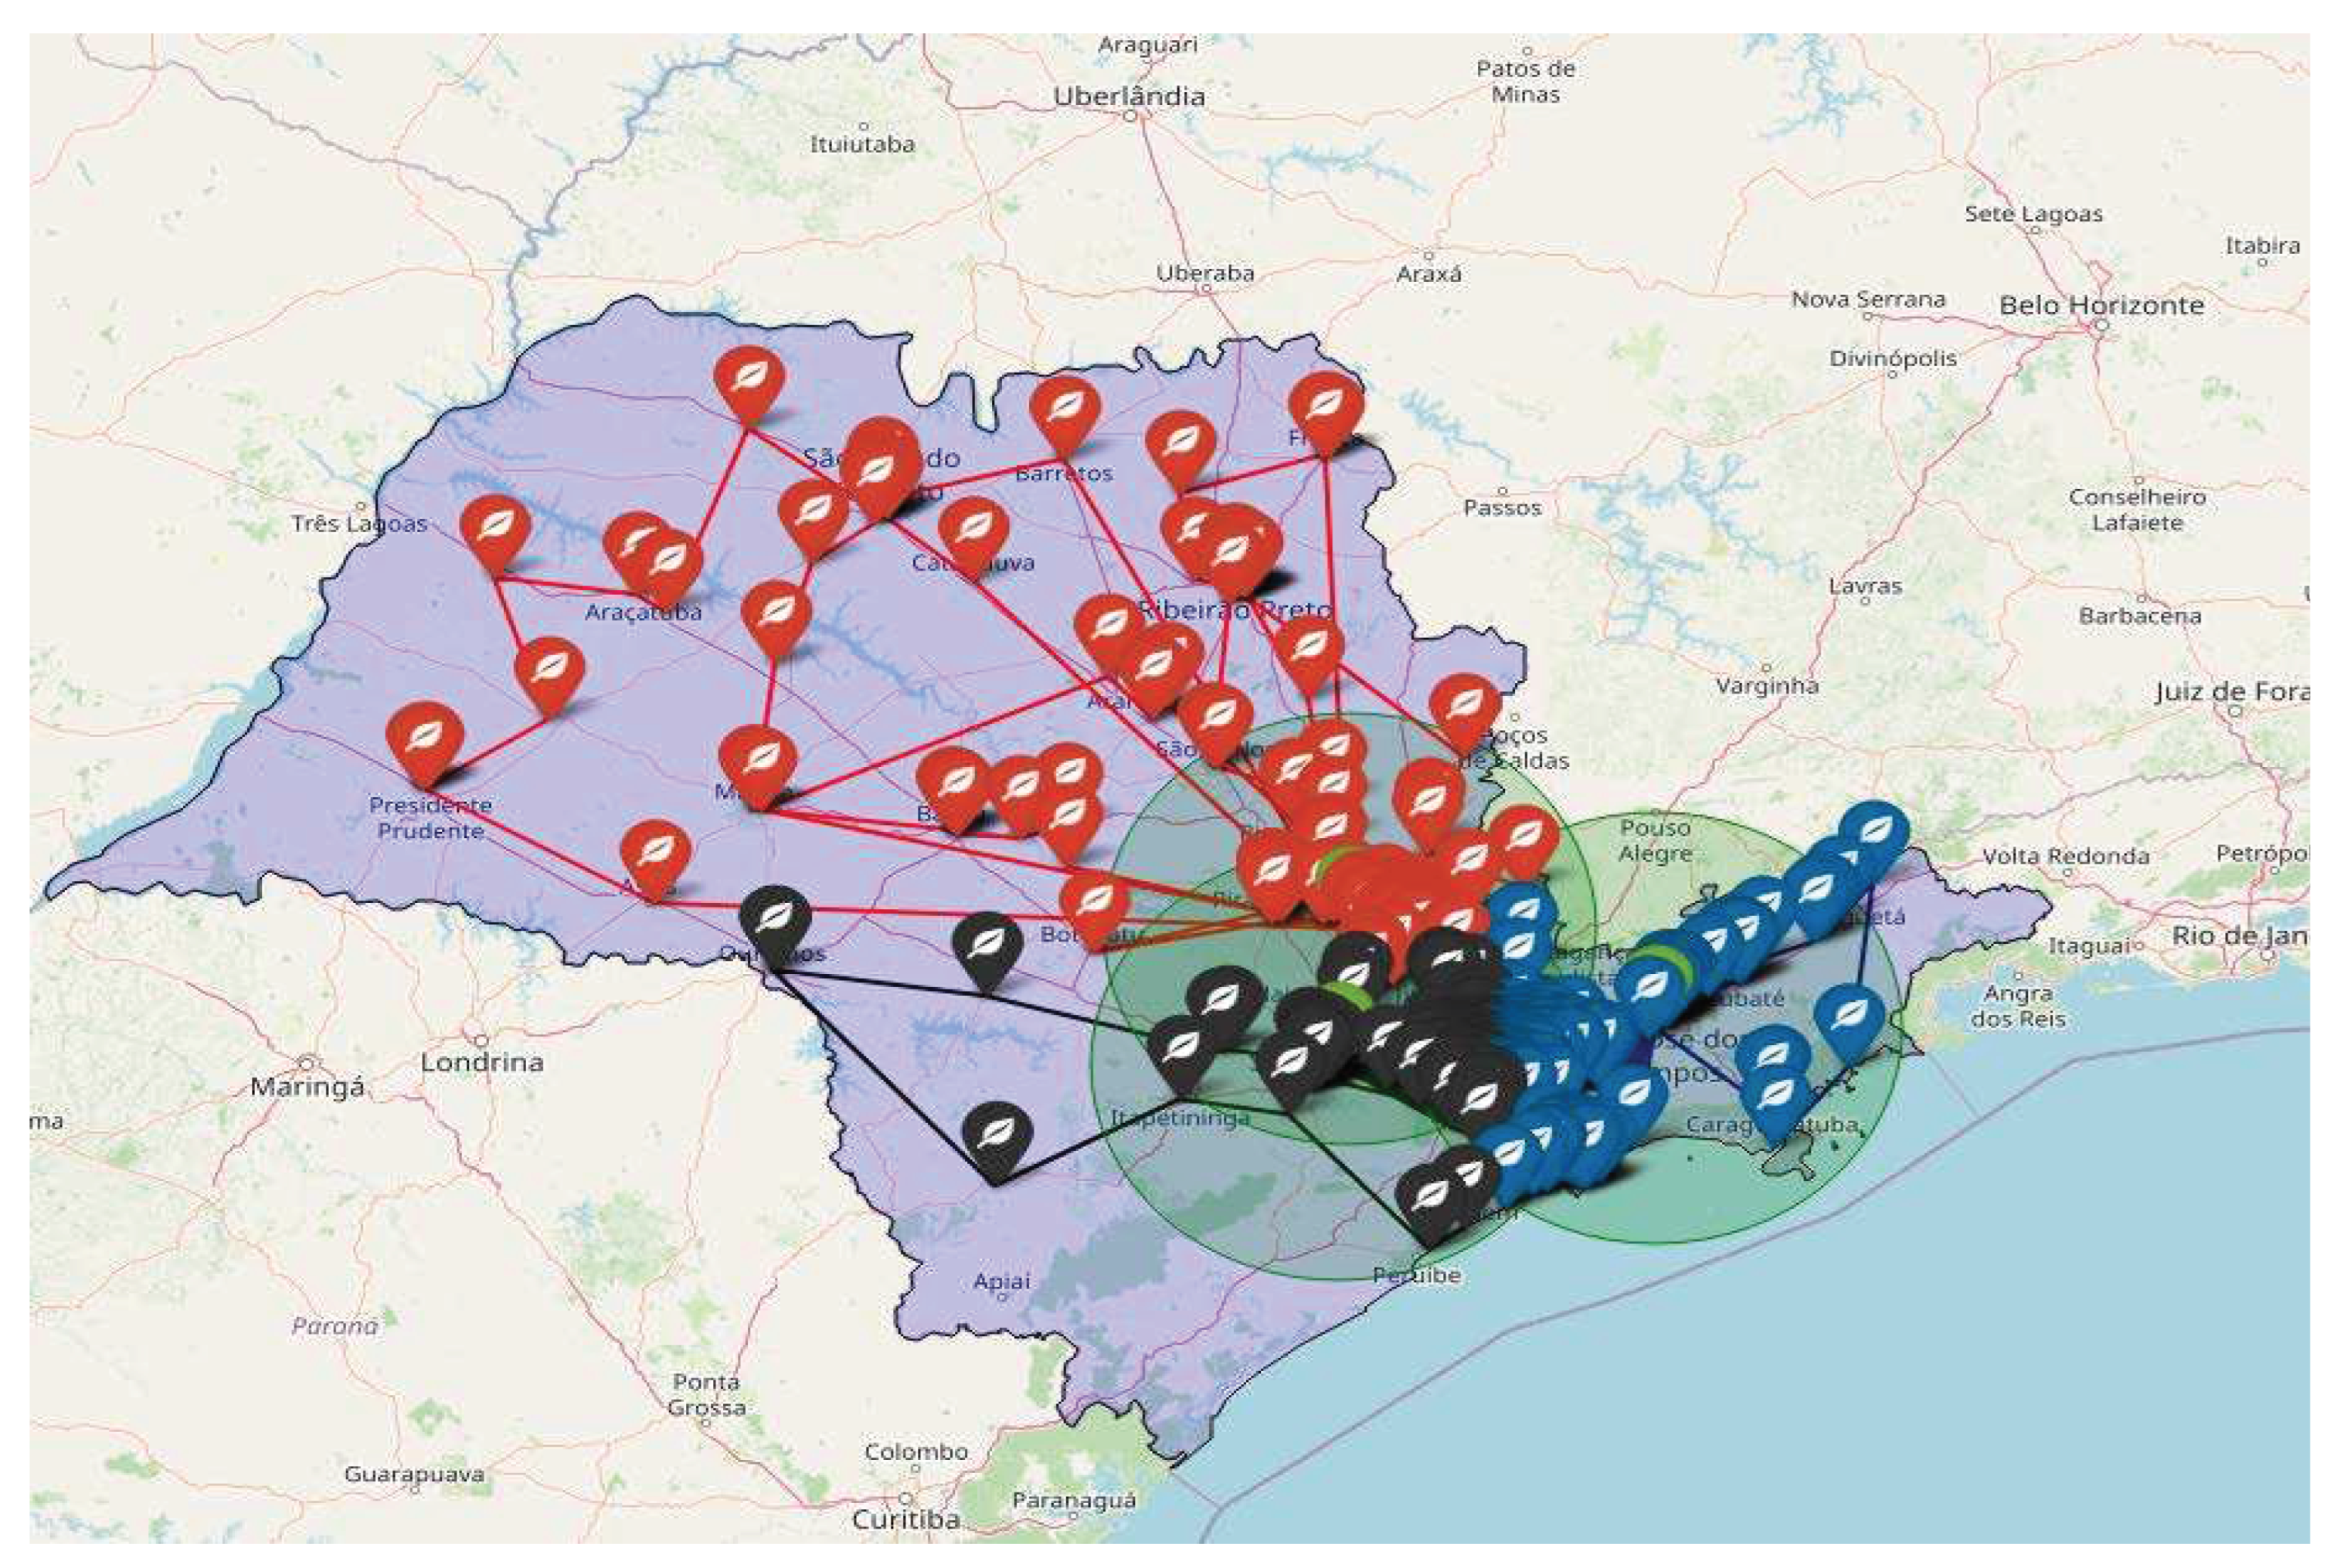
Table 1.
- Research on simulation for optimization of the WEEE reverse logistics network.
| Authors | Country | Computational Intelligence used for Simulation | Mentions about EC | aim of the paper | environmental gain | economic gain | social gain |
|---|---|---|---|---|---|---|---|
| [26] | China | Linear and non-linear optimization problems, in discrete or continuous variables. | null | Minimize the total cost of the WEEE recycling network | Reduction in the cost of transport and disposal, revenue generated from the sale of recyclable materials | ||
| [13] | China | Mixed integer linear programming | null | Optimize the WEEE reverse logistics network | Reduced transport costs | ||
| [23] | China | Multicriteria for Stochastic Mixed Integer Programming | null | Plan a reverse logistics network for managing WEEE under uncertainty. | CO² reduction. | Reduced transport costs | |
| [29] | China | model based on Kriging method | null | Apply a spatial mathematical model based on the Kriging method to predict the amount of WEEE returns in reverse logistics | environmental compliance | ||
| [5] | China | Agent based modeling, system dynamics and discrete event simulation | yes | Establish a sustainable closed-loop supply chain system based on the Internet of Things, considering the economic, environmental and social dimensions. | CO² reduction. | Revenue generated from the sale of recyclable materials | Safety at work |
| [12] | Greece | Mixed integer linear programming | null | Minimize total costs of transporting and storing WEEE between collection points and recycling units | Reduced transport costs | ||
| [21] | Greece | Multicriteria objective linear programming | null | Identify the optimal location for installing waste recycling plants | Elimination of WEEE disposal in landfills and reduction of CO². | Recycling and Reuse; Reduction in fuel costs | |
| [22] | Greece | Multicriteria objective linear programming | null | Optimize WEEE collection and recycling processes in order to minimize total logistical costs and reduce fuel consumption | CO² reduction. | Reduced transport costs | |
| [27] | Türkiye | stochastic programming | null | Minimize demand uncertainties for WEEE recycling by third-party recyclers to maximize profit. | Reduced transport costs | ||
| [14] | Türkiye | Mixed integer linear programming | null | Design a WEEE reverse logistics system network structure | Reduced transport costs | ||
| [15] | Türkiye | Mixed Integer Linear Programming and Multi-Facility, Multi-Product, and Multi-Period Goal Programming. | null | WEEE collection process at service points, transport to recycling and waste recovery facilities. | CO² reduction. | Reduced transport costs | job creation |
| [24] | Italy | Discrete event simulation and lifecycle analysis | null | Optimize the WEEE transport network | CO² reduction. | Reduced transport costs | |
| [16] | Italy | Mixed integer linear programming | null | Compare different alternatives to a WEEE collection service | CO² reduction. | Reduced transport costs | |
| [20] | USA | Mixed integer linear programming | null | Optimize processes in terms of the most appropriate choice for the implementation of recycling units in the network project | CO² reduction. | Reduced transport and storage costs | |
| [28] | USA | Proposed nonlinear gray model with convolution integral, improved by Particle Swarm Optimization | null | To present a new prediction technique for multi-input junk e-mail predictions in the presence of limited historical data. | Eliminate WEEE disposal in landfills and reduce CO² | ||
| [25] | Will | Discrete Event Simulation | null | Design a WEEE recovery network | CO² reduction. | Reduced transport costs | Employment generation, job security, local development. |
| [30] | Will | Multiobjective stochastic model. Bi-objective mixed-integer programming model | null | Model the electrical and electronic equipment (EEE) reverse logistics process as a bi-objective mixed integer programming model under uncertainties. | Eliminate WEEE disposal in landfills and reduce CO² | Reduced transport costs | |
| [17] | Spain | mixed integer linear programming and heuristic algorithm | null | Optimize the design of the WEEE logistics network. | Reduced transport costs | ||
| [18] | Portugal | Mixed integer linear programming | null | Optimize best locations for collection and sorting centers for reverse WEEE network planning | Reduced transport costs | ||
| [19] | Germany | Mixed integer linear programming | null | Maximize profit for WEEE reverse logistics network design problems | Reduced transport costs | ||
| [6] | Canada | multi-objective model are computed using the two-phase fuzzy compromise approach. | yes | Optimize and configure an electronic reverse logistics network, considering the uncertainty associated with fixed and variable costs, the quantity of demand and returns, and the quality of returned products | Environmental compliance to reduce pollution. Eliminate WEEE disposal in landfills and reduce CO² | Revenue generated from the sale of recyclable materials | |
| [4] | Colombia | system dynamics and a mixed integer nonlinear programming model | yes | To present an optimization-based simulation (OBS) approach that allows the design of sustainable policies for WEEE management systems. | Environmental benefits. | Revenue generated from the sale of recyclable materials | |
| [31] | Belgium | Convolutional Neural Network-based quality prediction and Closed-Loop control, named CNNB-CL | null | Closed-loop capture planning method is proposed for the random collection of WEEE products | Reduced transport costs |
Table 2.
- Transport costs.
| Transport costs (CT) | Concept |
| Fuel costs (CC) | It is the total amount spent on fuel and lubricants to carry out the necessary displacement to meet the targets. |
| Labor costs (CMO) | are mainly represented by the sum of the drivers' gross wages, in addition to applicable surcharges, such as accommodation or bonuses. |
| Insurance costs (CS) | The total cost of insurance policies for both equipment and cargo, where applicable. In addition, premium payments and other charges should be included, if necessary. |
| Depreciation costs (DC) | It is the total depreciation amount of equipment and accessories, including charges incurred to renew the vehicle. |
| Costs with charges and fees (CET) | It is the amount spent for the payment of taxes to enjoy the property, in this case, the equipment. However, costs with penalties and fines are also added to this item, in addition to toll costs. |
| Maintenance costs (CM) | are mainly represented by carrying out the preventive maintenance plan for equipment such as revisions carried out by dealers or specialized technicians, however, the cost of unscheduled maintenance, for example in the case of sudden breakdowns, as well as the cost of repairs due to small and medium accidents |
Source: Combes and Lafourcade [47].
Table 4.
– Collection points and volume collected.
| Types of Collection Points | Number of collection points | Total collected volume (ton/year) | Total collected volume (ton/month) |
| P - Batteries/pendrive/small computer eq | 276 | 2484 | 207 |
| PP - Batteries/Pendrive | 91 | 764 | 64 |
| G - Refrigerators/Stove/TVs/ Washers/Air conditioning | 30 | 1650 | 138 |
| GG -Refrigerators/Stove/TVs/ Washers/Air conditioning | 13 | 770 | 64 |
| M - Microwave/appliances | 107 | 1712 | 143 |
| Greenk - Computer EQ | 15 | 135 | 11 |
| Motostore - cell phone/computer eq | 22 | 185 | 15 |
| Total | 554 | 7700 | 642 |
Table 5.
- Current and optimized scenarios.
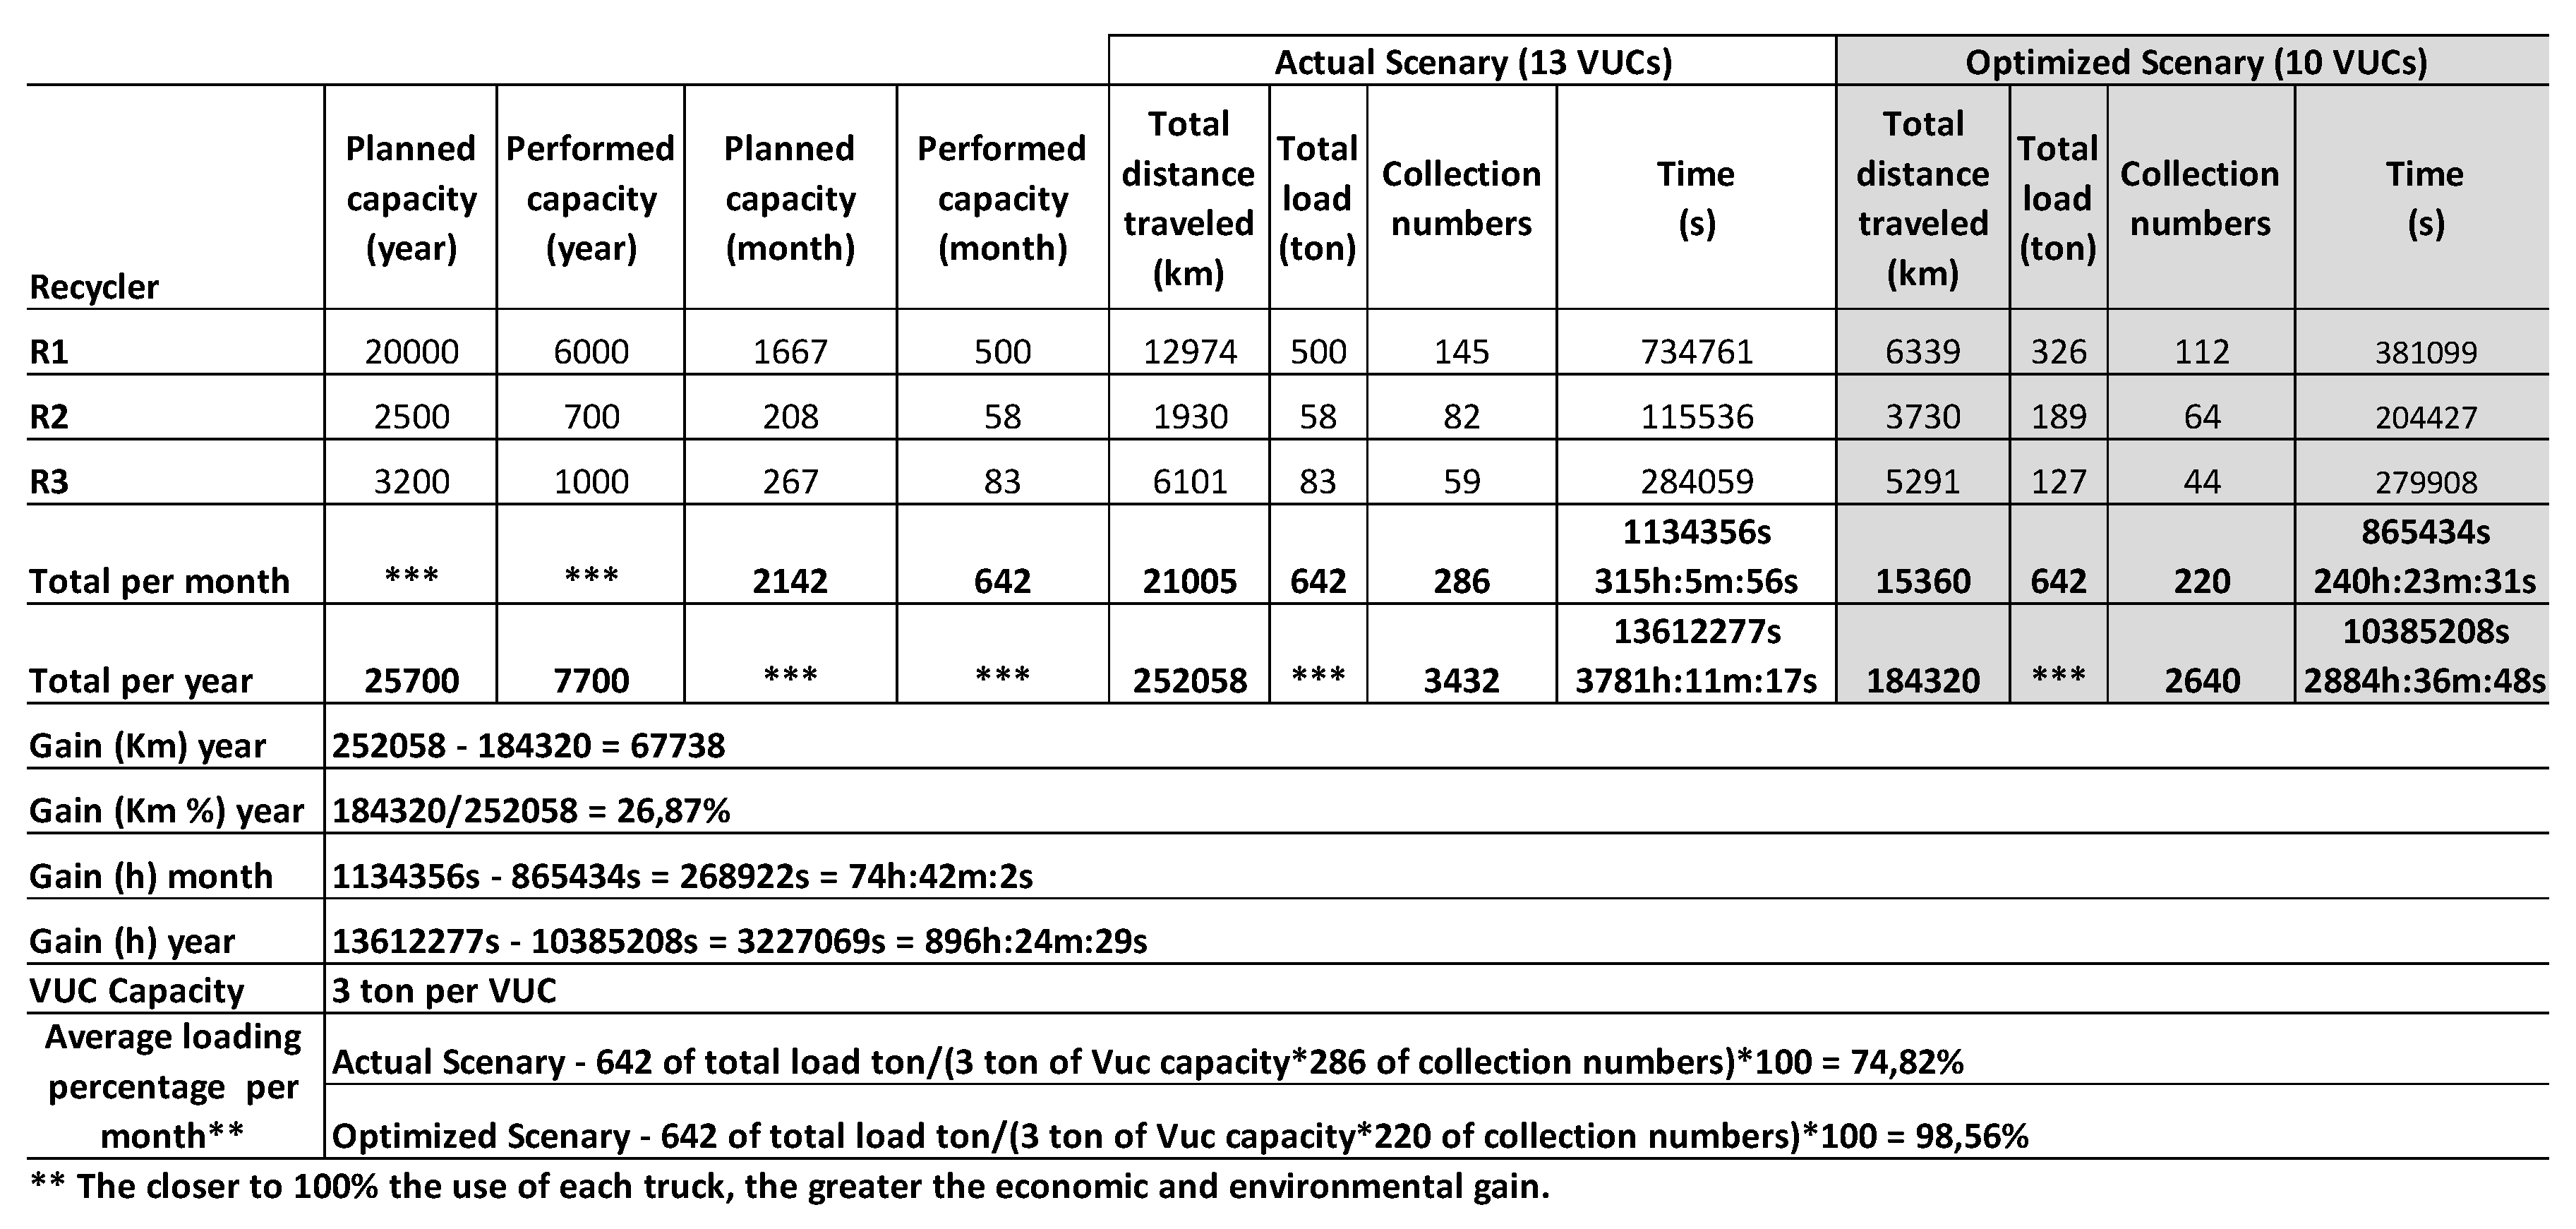
Table 6.
Cost evaluation of the current and optimized scenario.
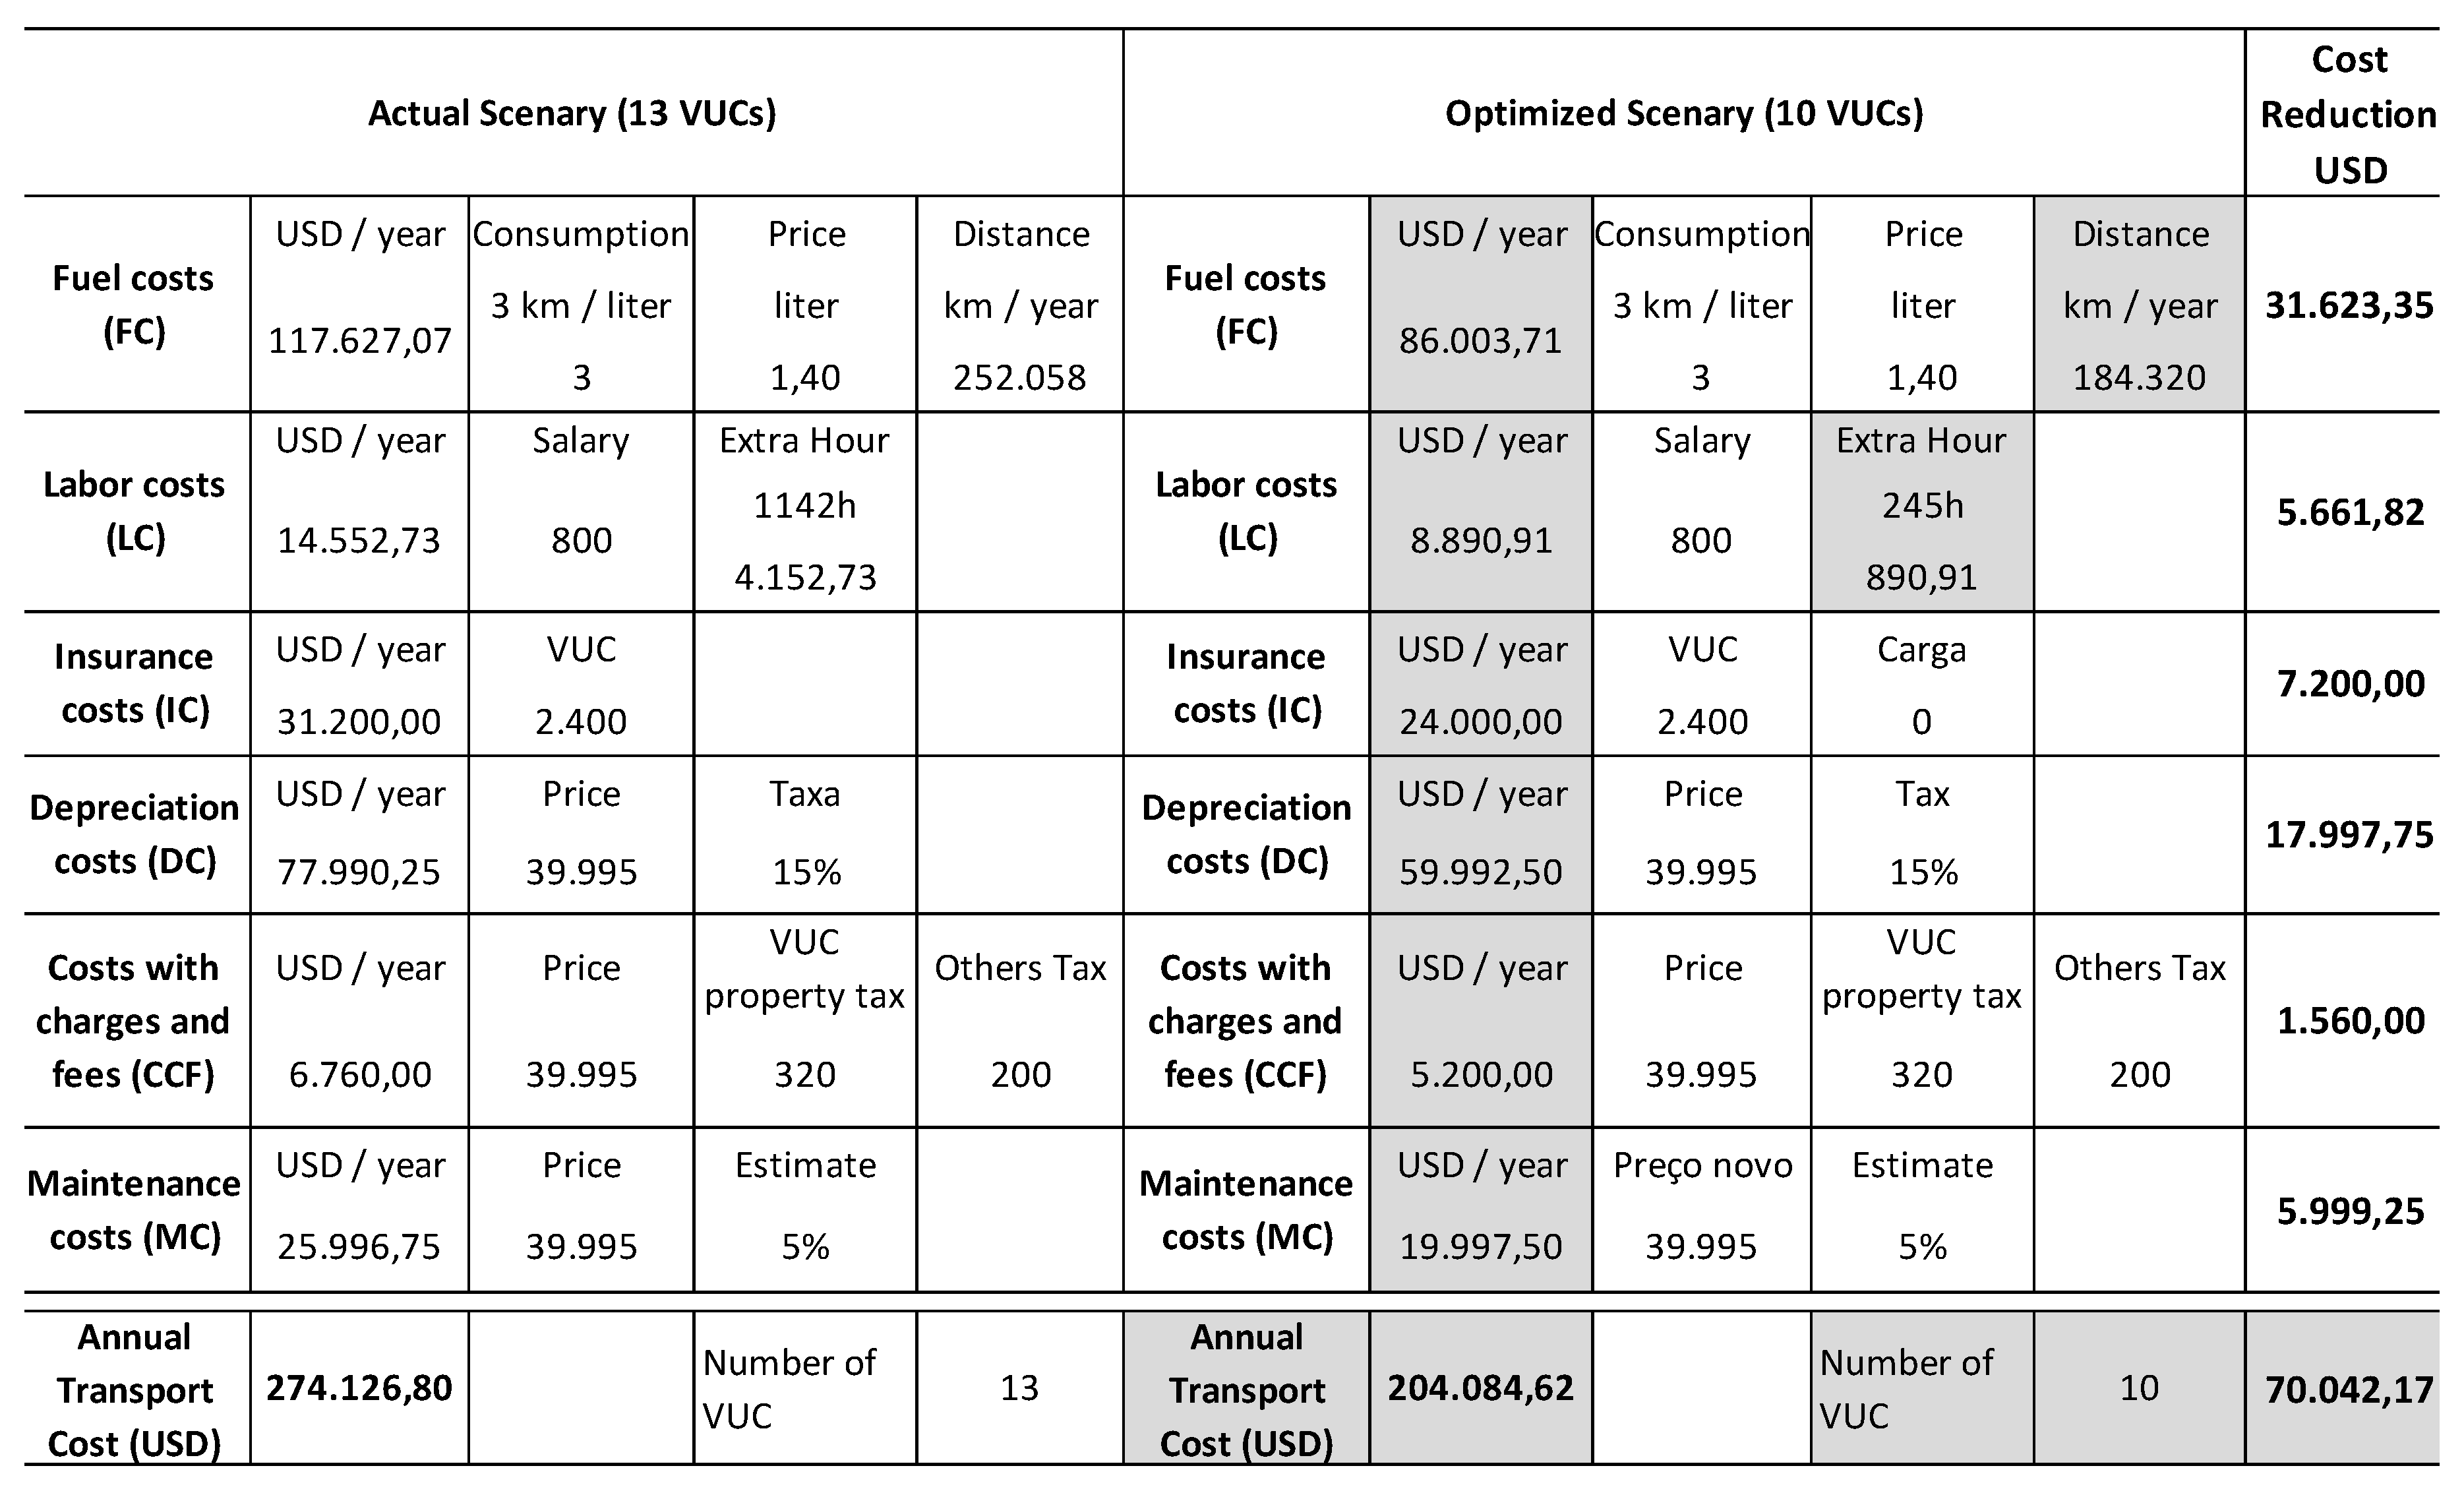
Table 7.
- Material Intensity Assessment.
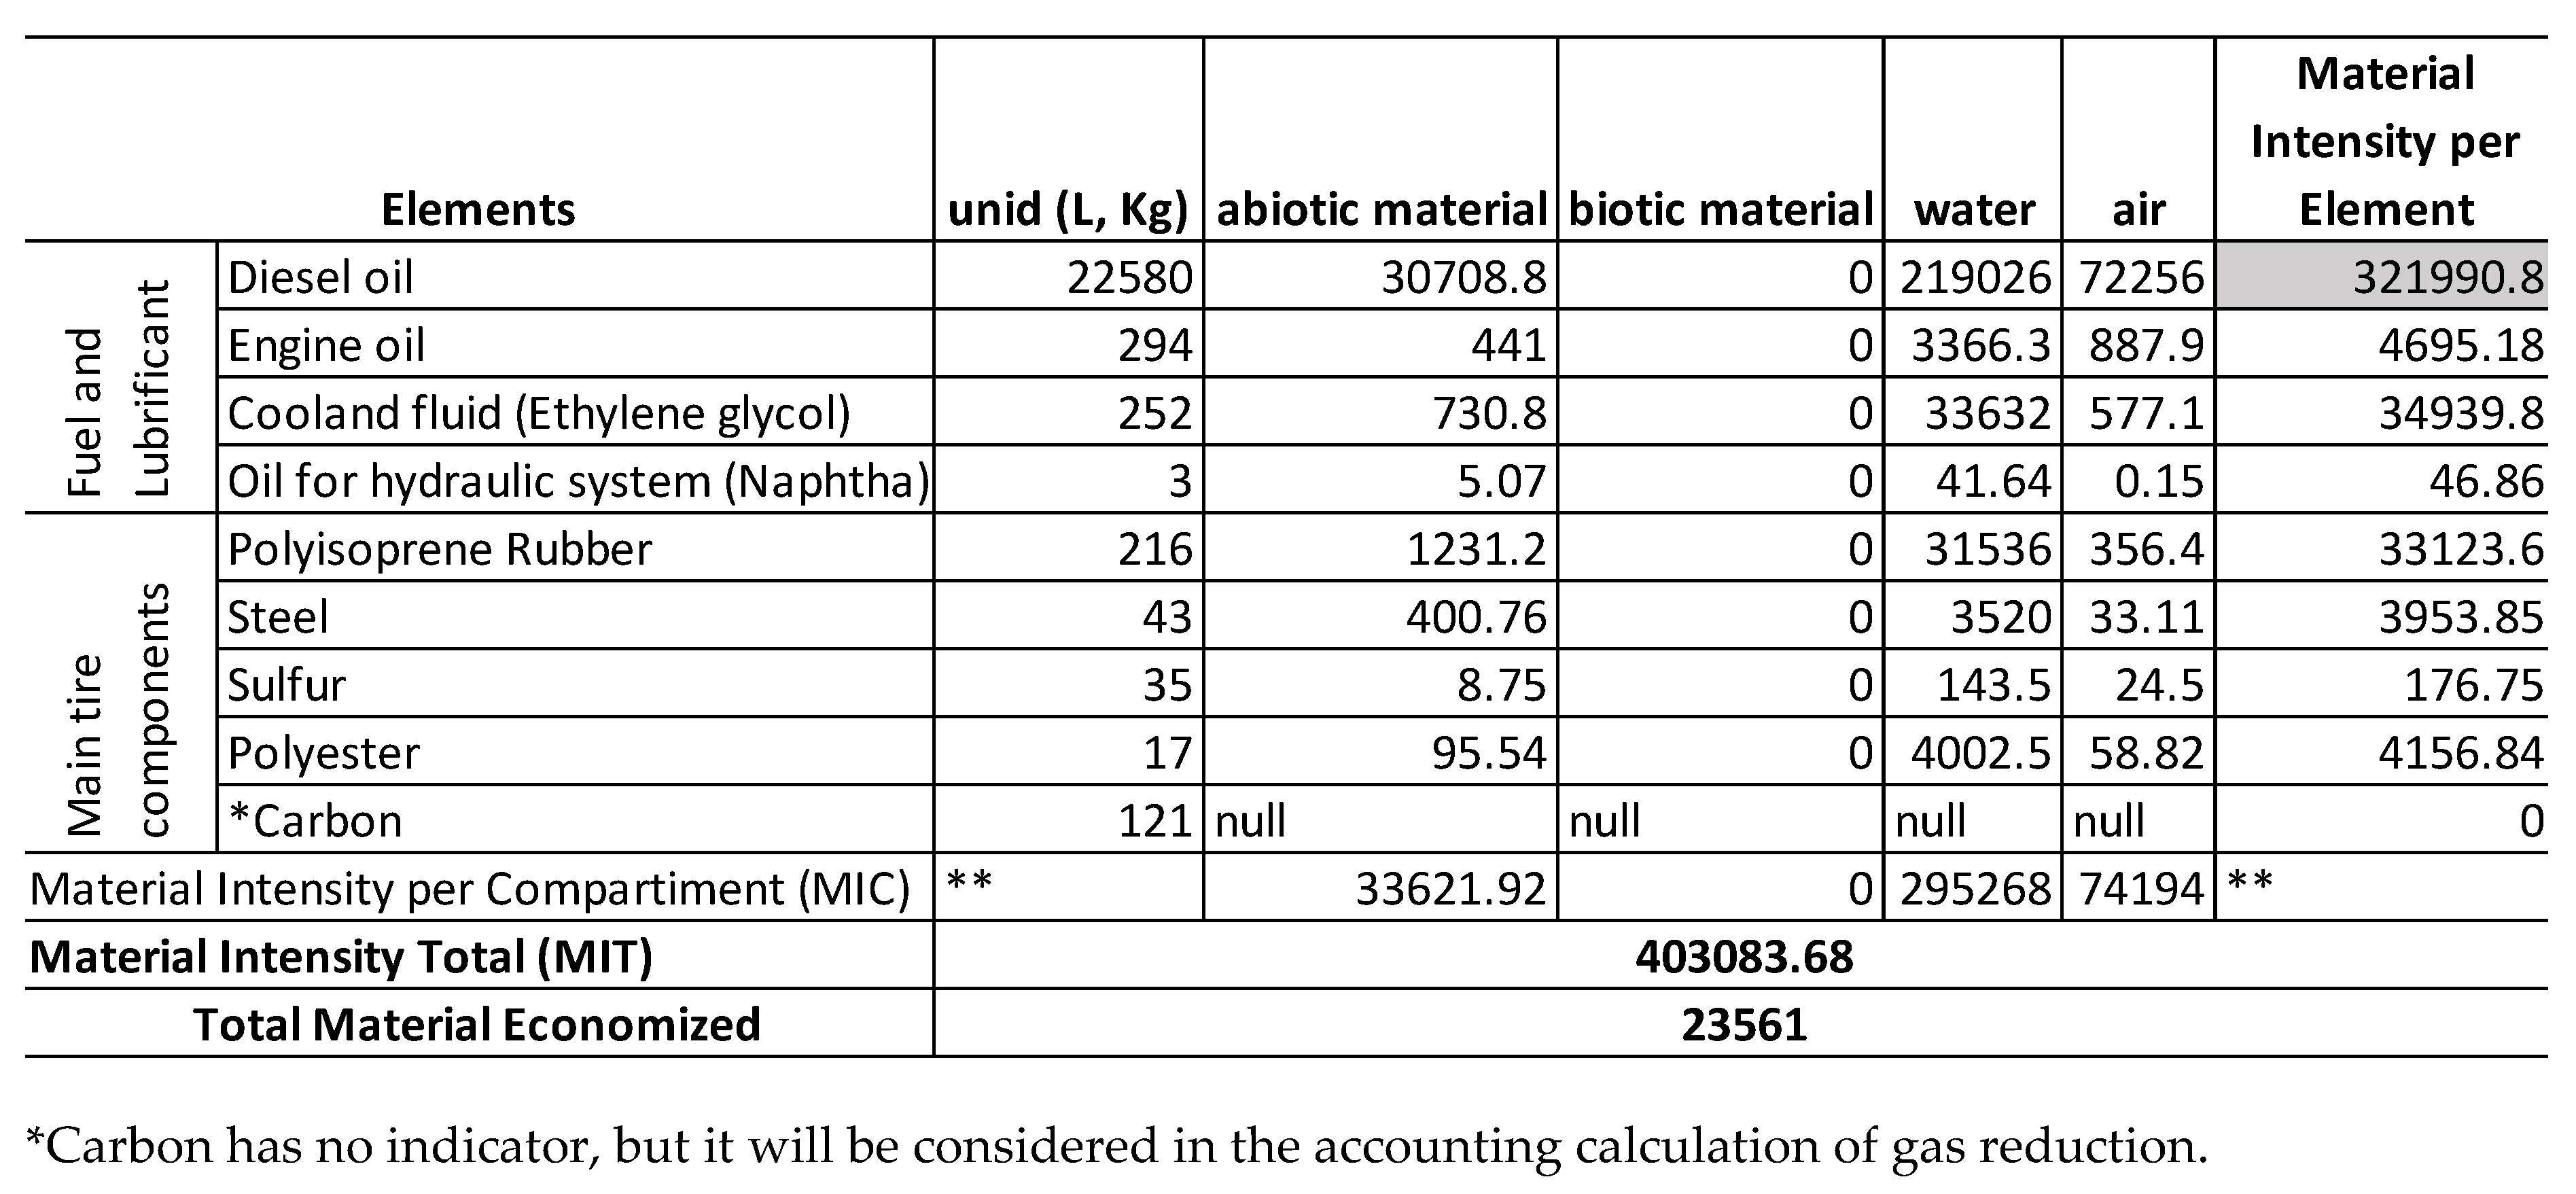
Table 8.
- Reduction in gas emissions.
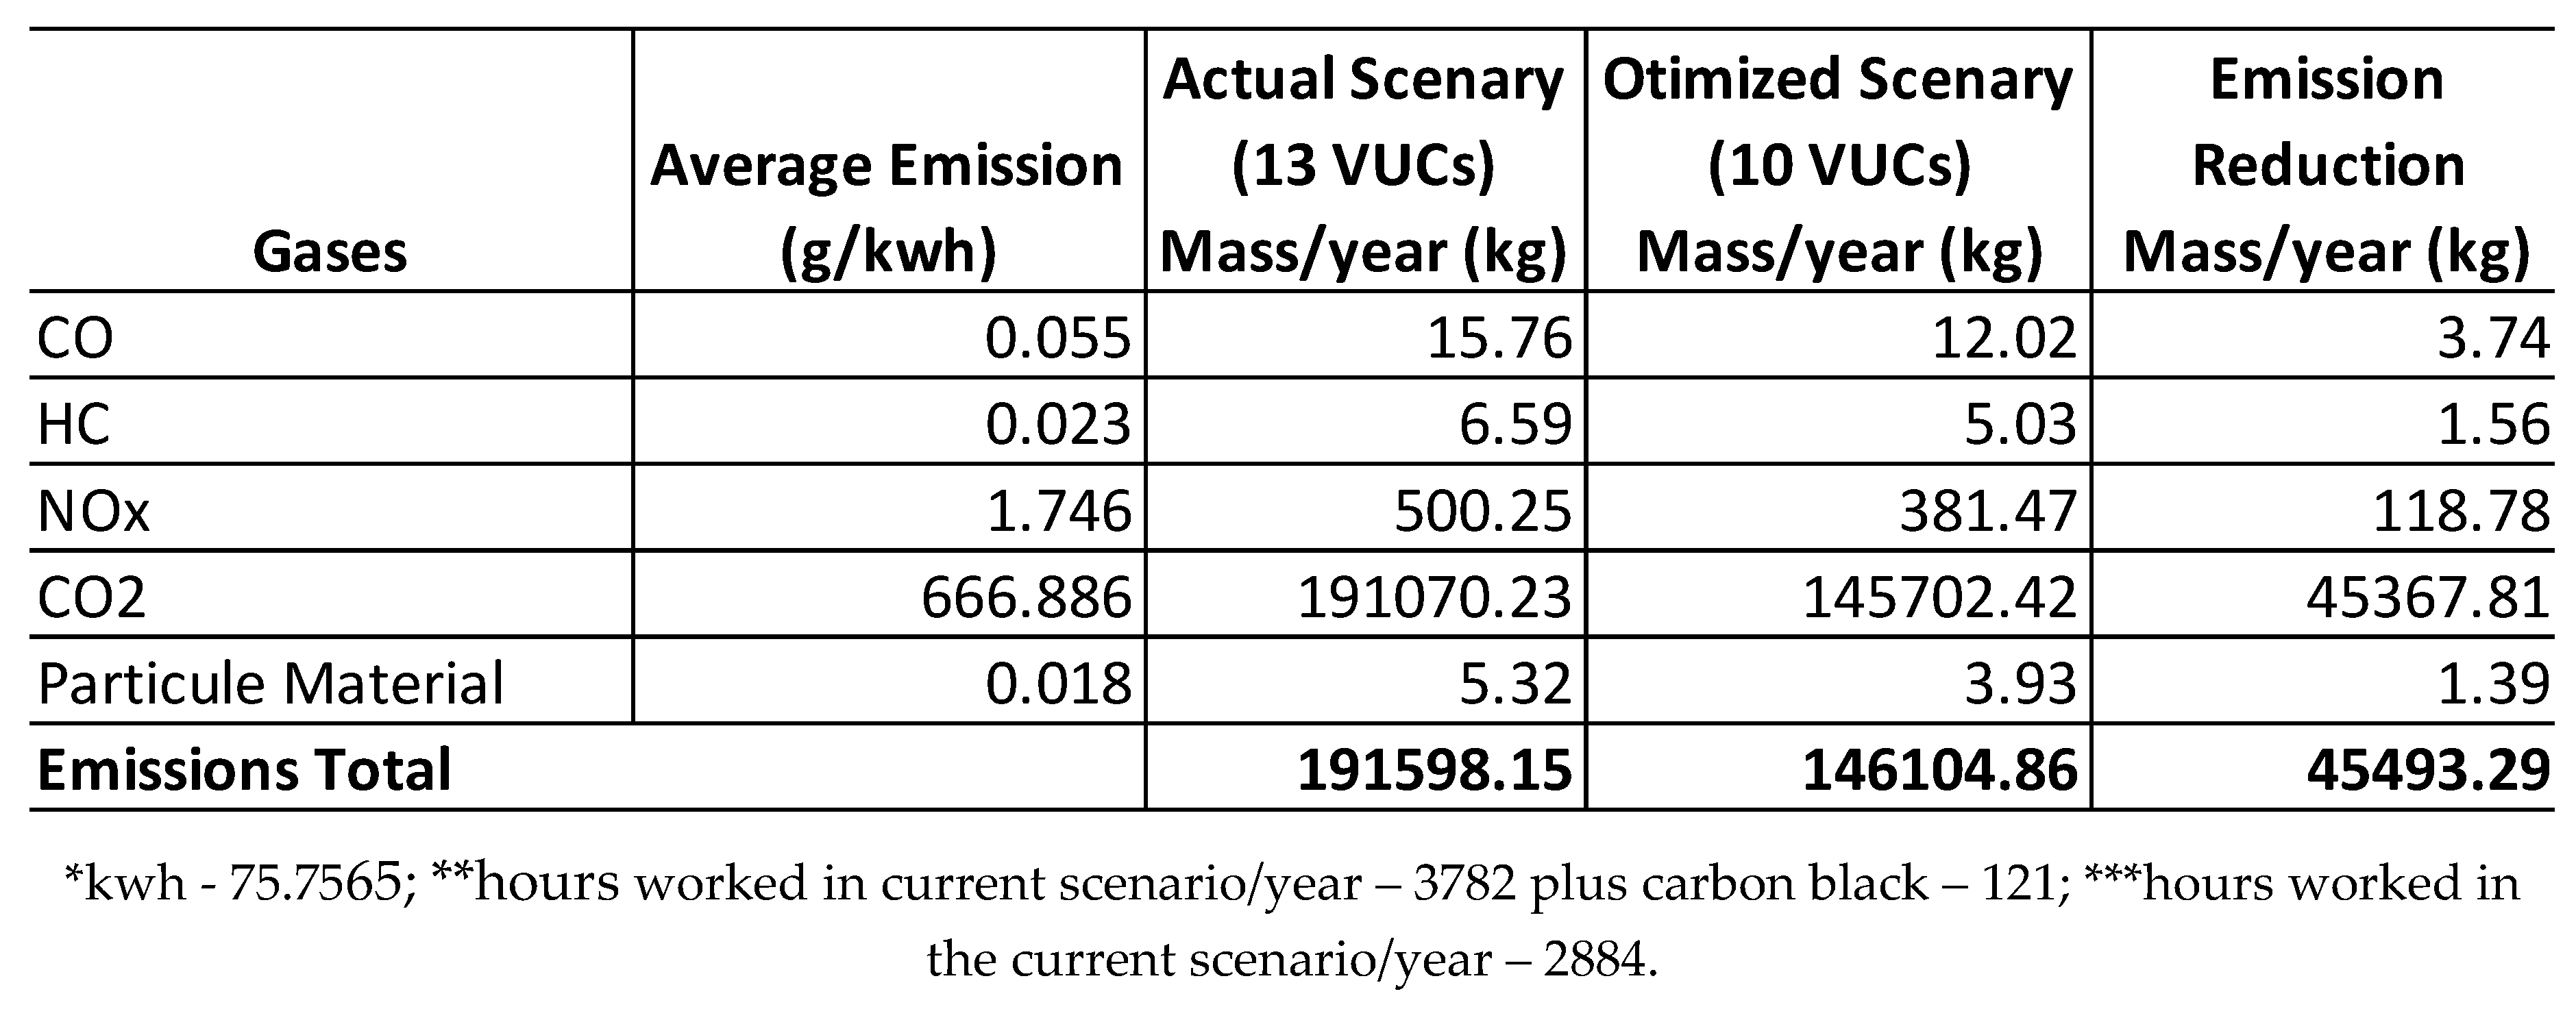
Disclaimer/Publisher’s Note: The statements, opinions and data contained in all publications are solely those of the individual author(s) and contributor(s) and not of MDPI and/or the editor(s). MDPI and/or the editor(s) disclaim responsibility for any injury to people or property resulting from any ideas, methods, instructions or products referred to in the content. |
© 2023 by the authors. Licensee MDPI, Basel, Switzerland. This article is an open access article distributed under the terms and conditions of the Creative Commons Attribution (CC BY) license (http://creativecommons.org/licenses/by/4.0/).
Copyright: This open access article is published under a Creative Commons CC BY 4.0 license, which permit the free download, distribution, and reuse, provided that the author and preprint are cited in any reuse.


