
Submitted:
20 February 2025
Posted:
20 February 2025
You are already at the latest version
Abstract
Moving toward sustainability is a social challenge that entails urban planning and the environmental impact of the transport and waste management system of the territory. This article studies the chain’s service area size of biomethane recovery of the municipal organic waste, a model is created to study the energy generated to determine the allocation and the location of the digester. This paper critically reviews the transportation energy losses that are related to the distance and to the technology used to transportation, but also to the location of the digester and the availability of organic waste of the region. The collection and the transportation of the organic waste to the transfer station are studied considering the use of a 10-ton payload truck and the transportation to the digester is studied considering the use of a truck with different payloads: 9, 18 and 27 tons. The results show that depending on the availability of organic waste and the distances to travel, having many digesters in the territory has a positive impact, over the most common use of a unique digester in the region. Results also demonstrate that in the less populated regions, the energy differences due to the location of the digester became less important. To demonstrate the applicability of the proposed framework, this paper focuses on a real-life case study of the administrative region of the Montérégie in the province of Québec, Canada was studied. This approach can be used in other territories and provides insights for city planners or policy markers regarding the sustainability of the waste management on the territory.
Keywords:
Sustainable development
; energy balance
; biomethane recovery
; transportation
; collection
1. Introduction
Sustainability is defined as the interaction of the pillars of environment, economy and society. Moving towards sustainability implies a social challenge of searching for the change of the status quo. Waste generation in cities is a growing problem and city planners need to develop waste management systems for cities that are constantly evolving. Urban waste management is becoming one of the most relevant issues in modern society associated with the growing concern for environmental preservation, urban planning (transport) and pollution control. In the last decades, the focus of waste management shifted from final disposal to the development of a circular economy approach based on resource and energy recovery (Zhou et al. 2018).
In recent years, the competing needs for land, food and bioenergy production have been at the forefront of the policy debates (Benites-Lazaro et al. 2020) including the chain’s service area size and the availability of organic materials. The potential energy recovered from many materials is studied (Dey and Thomson 2023) considering the availability and the territory (Awedem Wobiwo et al. 2018). Recovering bioenergy from municipal organic waste has gained increasing importance worldwide (Ahrens, Drescher-Hartung, and Anne 2017) and many biological treatments are available to produce biogas from an organic waste fraction of municipal solid waste (Tabatabaei et al. 2020). Despite all the available technologies, anaerobic digestion has the best environmental and economic performance (Tock and Schummer 2017).
There’s a growing interest in sustainability and anaerobic digestion (Baldé et al. 2022) and biogas offers important environmental benefits like the reduction of the greenhouse gas (GHG) emissions. Biogas production in Europe is estimated to be 963 PJ (9.63 X 10¹⁷J), resulting in 60% of GHG reduction (Ullah Khan et al. 2017). In addition, the world share of biomethane used for fuels is supposed to rise up from 2% today to 27% in 2050 (Ullah Khan et al. 2017). In 2020, in Canada, the emissions reductions were estimated at 8.2 Mt CO2, and these can increase to 23.6 Mt CO2 by 2050, accounting for both avoided methane emissions and displaced fossil fuels use (“Canadian Biogas & RNG Market Summary Report – October 2023” 2023). In 2021, Canada had nearly 300 biogas and renewable natural gas projects processing 2 million tons of manure, crop residues and off-farm organic annually, generating over 20 PJ of energy from agricultural and industrial digesters, municipal and industrial treatments and landfills. The industry renewable natural gas production is projected to quadruple in the coming years (“Canadian Biogas & RNG Market Summary Report – October 2023” 2023).
This renewable energy can be used for transport fuels or electricity generation (Ayodele et al. 2019), it can displace conventional fossil energy sources and GHG emissions. In the case of waste transport, the principle of economies of scale shows that grouping flows from different producers to a transfer station could reduce the transportation costs (Dongqing, Xingmei, and Zhong 2022) According to this principle, many municipalities attempted to mutualize their waste to benefit from the economies of scale (Kůdela et al. 2019). When considering the economic impact of the waste collection, the environmental impact of the transport structure and lack of adaptability to the territory are the main drawbacks (Ghosh, Ng, and Karimi 2023) of the application of this principle in waste management of materials. The represents Figure 1 the biomethane recovery process from the collection of the organic waste to the transfer station ant then the transport to the recovery facility.
As seen in Figure 1, the territorial aspect plays a double role in the recovery process: on one hand transport level 1 that represents the collection and transportation of the organic waste in the territory going to the transfer station and, on the other hand, the transportation level 2 that represents the transportation of the organic waste from the territory to the recovery facility. The waste management system could benefit from the use of different transportation methods accounting for the territory morphology and population density (Anderluh, Hemmelmayr, and Nolz 2017). It has been established that the waste collection and transportation are related to the parameters of waste generation in the territory, so the transport structures need to be adjusted to the city’s structures and population distribution’s (Tanguy et al. 2016).
Usually, the current situation in most cities is the curbside waste collection using the same transportation method and this situation is creating much noise and traffic inconvenience. This article creates a model based on the energy balance of the biomethane recovery process to study the impact of the territorial aspect of the gains and losses of energy on the different steps of the entire process. Some authors tackled the location and allocation of the waste management using the spatial interaction of the model in a constrained environment, showing the impact of the transport in the production chain of biomethane (Zbib and Wøhlk 2019) but the energy recovered from the biomethane recovery process was neglected.
The allocation of organic waste and the distribution of resources in the supply chain for anaerobic digesters was studied to diminish the total cost of supplying materials and studying the biomethane production system (Sailer et al. 2021). Computational tools have been used to determine the digester location (Sarker, Wu, and Paudel 2019) and in some cases, geographic information system (GIS) were used to study the spatial distribution of waste management facilities like the transfer station (Ghosh, Ng, and Karimi 2023). The GIS tools are used to analyze the temporal and spatial evolution of the system, including the suitable locations, optimal sizes and number of biogas plants needed in the region to process the biomass that can be collected (Sanchuan et al. 2019).
Homogenous urban form across different areas of the city fails to provide details to study the effects of urbanization on the environment (Liu et al. 2017). The paper focuses on developing a systemic method for locating biomethane recovery facilities based on the energy balance of the biomethane recovery chain. The economic aspect of the waste management process is not studied, this approach is based on an energetic evaluation of the process. This model is based on the energy balance of the waste management process integrating the technological challenges of the biomethane recovery and the different levels of transportation. The goal of the model is to compare the energy availability of different regions at a large scale, for more accurate results other computational tools are available, increasing the cost of the assessment.
The novelty of this paper is that the energy spent in collection and transportation from the household to the digester is included in the study to shed light on the energy efficiency of the global chain of biomethane recovery. Many aspects of waste management process are considered for a single territory to study the energy impact of the location of the recovery facility. The chain’s area service size, the allocation of municipal waste and the number and location of the digesters are analyzed to study the losses of the biomethane recovery process. This model represents an opportunity for the waste management sector to improve the supply chain of biomethane recovery considering the location of the digester and the characteristics of the territory.
2. Materials and Methods
The model developed is based on a systemic approach that considers the gains and losses of energy of the biomethane recovery system. The global energy of the biomethane recovery system includes the energy spent for collection and transport level 1 of municipal organic waste, the energy spent for transport level 2 of the municipal organic waste and the energy spent for the biological treatment and the energy embedded in the biogas. The data of different anaerobic digesters operated in real conditions in the province of Québec is used to calculate the volume of biomethane produced (Ministère de l’environnement et la lutte contre les changements climatiques 2022). The simplicity of this approach allows comparing different scenarios considering the location of the digester without the need for costly computational tools.
To study the impact of the location of the recovery facility on the energy recovery, different scenarios are studied. First the losses of collection and transport level 1 and level 2 are calculated when there’s only one recovery facility per region, this is considered the centralized scenario. In the scenario A, the municipal organic material is sent to the digester in the MAS municipality. Then the impact of the location of the digester is analyzed when there’s one recovery facility per municipality, this is considered the scenario B or decentralized. This situation represents the maximum energy that can be recovered when there’s no transport level 2 in the territory. The scenario C is the centralized scenario, but the municipal organic waste is sent to a digester situated in the ROS municipality. To study the energy losses of the centralized scenario and the impact of the location of the digester in the territory, a new scenario D is created. In the scenario D, there are multiple digesters in the region and the municipal organic waste is sent to the closest one. These scenarios are presented in Table 1.
This systemic model is based on the relation between the territory dimension and the availability of municipal organic waste generated and collected. The Figure 2 represents the different levels of transport involved in the global process of organic waste collection for different municipalities, different municipalities are represented by different colours.
The gain of energy obtained by the production of biomethane is presented in Equation (2) at it represents the energy embedded in the biomethane.
where:
: embedded energy in the biomethane (MJ/period)
: 36 MJ/Nm3 (International energy agency 2020)
: volume of biomethane produced (Nm3/period)
represents the lower heating value of biomethane. This considers the energy value of the biomethane after the upgrade from the biogas, the product can be used without the need for any changes or transformations, and it can be used in natural gas vehicles.
2.1. Energy Losses of Collection and Transport Level 1
To calculate the distances and therefore the energy spent during collection and transport, this article presents a model where the area is divided in smaller squares where each small square represents the area of the collection of one truck. The breakdown of the area is represented by a symmetrical grid, and the anaerobic digester is located at the centre of the territory. This approach allows for calculating the total collected organic waste using the variable of the dimension of the territory.
To calculate the distance travelled by the truck in the collection and transport level 1 two different configuration types are presented in Figure 3.
where:
is the dimension of each cell unit
The model is based on a cycle of collection or a defined period, so the energy balance and all the parameters are based on that period that can be adapted to the territorial situation. The equations that define the territorial breakdown are presented in Equation (3) and Equation (4).
where:
: number of travels or collection cycles needed for the collection of the organic waste of the area (unit/period)
: total collected waste of the area (t/period)
: payload of the truck used for the collection and transportation (t/truck)
where:
is the number of unit cells to cover the entire area and the cell unit has an area of d2.
The area of each unit cell is calculated considering the quantity of municipal organic waste available and the density of the population in the territory, and it is presented in Equation (5).
where:
: area of each unit cell (km2)
: quantity of municipal organic waste generated (kg/people/period)
: density (people/km2)
The dimension of each cell unit of the grid is represented in Equation 5.
The distance for the collection of organic waste considers, on one hand, the capacity of the truck and, on the other hand, the availability of organic waste and the density of population and roads in the area. The dimension of the cell is presented in Equation (6) and the distance of collection per cell unit is presented in Equation (7).
where:
: distance of collection per cell unit (km/period)
: density of routes (km/km2)
Then, the total distance of collection for each scenario is calculated by multiplying the distance of each cell unit by the number of cells considered (. This total distance of collection for each scenario is presented in Equation (8).
where :
: total distance of collection (km/period)
This approach allows relating the dimension of the territory to the energy spent not only on the municipal organic waste management but also on the biomethane recovery system. Considering the dimension of the cell as a variable, this model calculates the distance of collection and transport level 1 and the availability of municipal organic waste to be transformed in biomethane.
The total distance travelled one way on the transport level 1 represents the total distance connecting the centre of all the unit cells and the centre of the area, this distance is represented in Equation (9) and Equation (10). In this model, the recovery facility is located in the middle of the area.
where:
is the total distance travelled one way from the centre of each unit cell to the recovery facility (km/period).
The total distance travelled to go pick up the waste and then come back is represented in Equation (11) and Equation (12).
where:
: total distance travelled from the centre of each unit cell to the centre of the grid or the recovery facility for the reference situation(km/period).
In the simplified systemic approach developed in this paper, the digester is situated in the centre of a grid-type structure, and this allows for calculating the total energy consumed for transport level 1 using presented in Equation.(10) and Equation.(11) and presented in Equation.(7). The total energy consumed for collection and transport level 1 includes the embedded energy of the fuel used for the truck, in this case, is the fossil fuel consumption to produce 1 litre of diesel. These energies are presented in Equation (13) and Equation (14).
where:
: fuel consumption of trucks on the collection mode (L/km)
: fuel consumption of trucks on transportation modes (L/km)
: embedded energy in 1 litre of diesel (42.6 MJ/L; (Tanguy et al. 2017))
Some authors like (Pantaleo, Gennaro, and Shah 2013) and (Wright and Brown 2007) include the tortuosity of the territory (τ) that represents the ratio of road length and the length of the arc connecting two adjacent nodes of the grid to account for the lack of linearity of some roads. But this factor is not included in this paper, because the actual values of density of population and roads are used, these values are based on the data of the province of Québec (Ministère des transports du Québec 2022).
The values used in Equation (12) and Equation (13) are fuel consumption of collection () of 0.84 L/km and fuel consumption in transportation mode () for the transport level 1 of 0.61 L/km (Di Maria and Micale 2013).
2.2. Energy Losses of Transport Level 2
The situation that represents the maximum energy that can be recovered is represented when there’s no transport level 2 in the territory and the recovery facility is located in the municipality
The second level of transportation of the organic waste, from the transfer centre to the recovery facility is studied considering the transportation using a truck different payload. The payloads studied are 9, 18 and 27 tons and fuel consumption for transport level 2 are 0.25 L/km, 0.28 L/km and 0.30 L/km (Franzese and Davidson 2011).
In the simplified systemic approach developed, the digester is situated in the capital of the municipality, and this allows for calculating the total energy consumed using this value as the distance presented in (10). The energy consumed for the transportation level 2 is presented in Equation (15).
where:
is the energy spent on transportation level 2 (MJ/period).
represents the distance to the digester back and forth (km)
In this paper, the tortuosity factor (τ) is not included because the actual values of density of population and roads are used, these values are based on the data of the province of Québec (Ministère des transports du Québec 2022).
2.3. Location of the Recovery Facility
To study the impact of the distance from the territory to the digester, the digester is situated in the centre of each of the municipalities of the region to eliminate the losses dues to the transport level 2.
To analyze the impact of the location of the recovery facility two scenarios are studied. The scenario A includes only one recovery facility in the region, which represents the centralized scenario. Then, scenario B considers one recovery facility at the centre of each municipality, which represents the decentralized scenario, in this scenario the energy losses of transport level 2 are avoided.
2.4. Description of the Study Case: Montérégie, Québec, Canada
The province of Québec in Canada is divided in different administrative regions, one of them is the Montérégie. It covers a territory of 8’764 km2 with a population of 1’433’085 people, and it is divided in 13 municipalities. It is one of the southern provinces, and it presents a large array of density of population. The Figure 4 represents the geographical situation of the Montérégie region in Québec.
The linear density of the population which is the number of people per unit of length, as defined in Equation (16), this represents the availability of municipal organic waste per unit of length in the territory.
The data of the province of Québec, Canada (Ministère de l’environnement et la lutte contre les changements climatiques 2022) is used to study the biomethane recovery process. There are 12 projects of biomethane recovery and composting approved in the province of Québec as taking part of the government program to process the organic material. Only the data from those projects is available on the government database (Ministère de l’environnement et la lutte contre les changements climatiques 2022) and only 5 of these projects produce biomethane from the municipal solid organic waste without considering the composting projects or the ones processing municipal slurry. The data of different anaerobic digesters for biomethane recovery operated in real conditions in the province of Québec is used to calculate the volume of biomethane produced, this is shown in Figure 5.
In the case of collection and transportation level 1, the payload of the truck is 10 tons. In all cases, the collection cycle considered is one week. In the case of the transportation level 2, the payload of the truck is considered 9, 18 or 27 tons.
3. Results
The goal of this paper is to study the energy of the chain’s service area size of biomethane recovery and the impact of the changes of the location of the digester on the energetic evolution. A systemic approach based on the energy balance of the process is used: first, the efficiency of the digester is calculated for the scenario A where only one digester is available in the region, in scenario A the energy losses of collection, transport level 1 and level 2 are calculated. Then, the efficiency of the digester is calculated for the scenario B where the digester is situated in each municipality and there the energy losses of collection and transport level 1 are the only losses to be considered. Finally, this approach is used to study the impact of the location of the digester and the use of two different digesters on the same region.
The distance of collection and transportation in the area is calculated when the collection truck has a payload of 10 tons, these distances depend on the population and road density of the territory. The territorial data is extracted from (Gouvernement du Québec 2022) and (Gouvernement du Québec 2021) , it’s presented in Table 2.
The results in Table 2 show that the dimension of the cell and the population density of the municipality are related with the linear density, which represents that when an area has a bigger dimension it also has a bigger linear density.
3.1. Losses of Energy Depending on the Different Levels of Transport
The energy losses of collection and transport levels 1 and 2 are calculated for the different municipalities and different payloads. Figure 6 shows the energy lost in collection and transportation level 1 and level 2 for the scenario A, with only one digester in the region, that is situated in the municipality of MAS.
Results in Figure 6 show that the energy losses of transport level 2 diminish when transporting the municipal organic waste with a truck with a bigger payload. Therefore, the percentage of energy losses for the transport level 2 is calculated when using a tuck with a 27-ton payload.
3.2. Comparison of Different Scenarios and Digester Location
The results in Table 3 show the energy of the recovery process and the percentage of energy losses for each municipality when considering scenarios A and B. Scenario A represents the centralized scenario which includes the energy losses of collection and transport level 1 and also transport level 2, and scenario B represents the decentralized scenario which includes a digester in each municipality and by doing so, only the energy losses of collection and transport level 1 are considered.
The results of Table 3 show that the municipalities with a bigger availability of municipal organic waste and a big territory have a bigger percentage of losses of collection and transport level 1 and in these cases to diminish the energy losses, having multiple digester in the municipality can be considered.
In the cases of the bigger municipalities with a higher availability of organic material where the percentage of energy losses of collection and transport level 2 are important, the use of a digester in a nearby municipality should be considered.
There are two different situations to consider when allocating the organic municipal waste facilities to diminish the energy losses of transport level 1 or level 2. So, there’s a comprise to be considered between the proximity of the municipality to the transfer station and to the digester.
4.3. Allocation of Municipal Organic Waste
To diminish the energy losses of transport level 2, a new scenario is created. Scenario C represents the case where a second digester is located in the municipality of ROS and this represents the centralized scenario when the organic waste is sent to the ROS digester. Then the scenario D is created where the organic waste is sent to the digester that is closer to each municipality’s transfer center, this represents the mix between scenarios A and C. The Figure 7 shows the energy losses for the transportation level 2 when the digester is located in different municipalities.
The difference of energy losses between scenarios is also shown in Figure 7, when this difference is small, there’s not a big impact on changing the digester to which the organic waste is transported. In those cases, there’s not a big impact on which of the digester is used and that the municipal organic waste can be rerouted with a little energy impact. Additionally, the results in Figure 7 show that there’s a relation between the availability of organic waste and the difference of energy losses of transportation level 2 between scenarios. The impact of the difference of location of digester on a municipality increases with the availability of organic municipal waste in the municipality.
The total energy losses of transport level 2 for all these scenarios are presented in Table 4.
The results in Table 4 show that the location of the recovery facility influences the energy losses of the global process of energy recovery. The change of the digester from MAS to ROS for the centralised scenario to one unique digester represents 0.67% of the potential energy benefit but when considering the energy losses of scenario D, the percentage of energy losses of scenario D represent 49% of the scenario B and 72% of the scenario C. The fuel consumption of transport level 2 is calculated for each of these scenarios considering the embedded energy in 1 litre of (42.6 MJ/L; (Tanguy et al. 2017)) and and the GHG emissions are considered 2.7 kgCO2 per litre of diesel consumed (Ressources naturelles Canada 2014). Considering the fuel consumption and the GHG emissions per year, the economic and environmental costs of the change of the digester location can be calculated.
When considering the multiple digester situation in the region, there’s a compromise to be made between the energy losses and the investments of having more than one digester per municipality, the cost of the industrial infrastructure in the area and the investments or disturbance of the transport.
5. Discussion
The analysis of the energy of the chain’s service area size of biomethane recovery considering the population and road density shows that the creation of clusters within a city with a high population density is beneficial for the energy cost of material transportation but the energy losses of the chosen transportation method had to be evaluated. The energy spent on collection and transport level 1 depends on the distance travelled, the population density, route density and size of the municipality but also on the number of trucks needed to transport the municipal organic waste available. There are two different situations to consider when allocating the organic municipal waste facilities to diminish the energy losses of transport level 1 or level 2. So, there’s a compromise to be considered between the proximity of the municipality to the transfer station and to the digester.
In the case of municipalities with higher energy losses spent on collection and transport level 1, it can be considered to add another digester in the municipality to diminish the energy losses of collection and transport level 1. In the cases of the bigger municipalities with a higher availability of organic material where the percentage of energy losses of collection and transport level 2 are important, the use of a digester in a nearby municipality should be considered. In the less dense municipalities, with less availability of organic waste, the location changes of the digester have a small impact on the energy of the chain’s service area size of biomethane recovery. Having the digester closer to the municipality benefits the denser municipalities having a bigger availability of municipal organic waste.
A major barrier towards the development of biomethane recovery is the scarcity of reliable information for decision-makers about the biomass energy potential considering the territorial characteristics and geographical situation. In fact, except for very general data and statistics values, there is poor information about the biomethane recovery and the quantity of organic waste that could be converted into energy in a sustainable way. It is also important to mention that the speed of transportation, the conditions, and the steepness of the roads impact the energy calculations of the transportation methods.
This research considers the technological aspects of the waste management process, future research on the economical aspects of the changes of the location of the biomethane recovery facilities and the transport structure should be conducted. The energetic analysis without including the economical aspect allows identifying the economic cost of an environmental improvement and make an enlightened decision. The potential of this approach was demonstrated using the data of the Montérégie region in Québec and using plausible transportation methods. However, payloads, transportation methods and recovery technologies can be changed to be suitable to other materials, cities or environments. Many countries had developed new technologies for smaller digesters that can be installed (Chitaka and Schenck 2023) without compromising the efficiency of the biomethane recovery. Even if the technology is available to the biomethane recovery to install smaller digesters, the social acceptability of the anaerobic digester is a difficult step for many territories (Calisto Friant, Vermeulen, and Salomone 2020).
The configuration of transport structure and digester should be chosen considering the characteristics of the territory, thus finding the compromise between many aspects of it like sustainability, environmental criteria, urgency of transportation, economic performance and energy efficiency are necessary for the specific territory. The challenge for city planners is to generate a collection and transport structure considering the location of the digester where the different steps of the chain’s service area size of material recovery benefit the entire system.
5. Conclusions
This article examines the impact of the location of the digester in different municipalities in the Montérégie region, Canada considering the characteristics of the territory. This highlights the fact that the size of the territory impacts the energy losses of collection and transport to the transfer station and the distance between the transfer station and the digester play a key role in the energy losses of the energy global chain of recovery.
So municipal officers should consider the location of the transfer station and the allocation of organic materials to study the energetic benefits of the global chain of biomethane recovery for the territory’s characteristics. By the same token, the impact of noise, traffic and economic investment in the area should also be evaluated for the location of the digester.
The approach used for the calculations of energy spent in the transport represents a conceptual approach that can be generalized to the rest of the territory. Other methodologies using computational tools can be more precise, but the methodology used in this article allows comparing different scenarios.
It has been demonstrated that a compromise between the size of the territory, the distance from the territory to the recovery facility and the allocated quantity of organic waste is crucial to improve the energy recovery of the process.
References
- Zhou, Z.; Tang, Y.; Chi, Y.; Ni, M.; Buekens, A. Waste-to-Energy: A Review of Life Cycle Assessment and Its Extension Methods. Waste Manag Res 2018, 36, 3–16. [Google Scholar] [CrossRef] [PubMed]
- Benites-Lazaro, L. L.; Giatti, L. L.; Sousa Junior, W. C.; Giarolla, A. Land-Water-Food Nexus of Biofuels: Discourse and Policy Debates in Brazil. Environmental Development 2020, 33, 100491. [Google Scholar] [CrossRef]
- Dey, A.; Thomson, R. C. The Biomethane Generation Potential of Wastes and Wastewaters from the Sericulture, Fisheries, and Agro-Industrial Sectors in India. Energy for Sustainable Development 2023, 75, 40–59. [Google Scholar] [CrossRef]
- Awedem Wobiwo, F.; Ercoli Balbuena, J.-L.; Nicolay, T.; Larondelle, Y.; Gerin, P. A. Valorization of Spent Coffee Ground with Wheat or Miscanthus Straw: Yield Improvement by the Combined Conversion to Mushrooms and Biomethane. Energy for Sustainable Development 2018, 45, 171–179. [Google Scholar] [CrossRef]
- Ahrens, T.; Drescher-Hartung, S.; Anne, O. Sustainability of Future Bioenergy Production. Waste Management 2017, 67, 1–2. [Google Scholar] [CrossRef]
- Tabatabaei, M.; Aghbashlo, M.; Valijanian, E.; Kazemi Shariat Panahi, H.; Nizami, A.-S.; Ghanavati, H.; Sulaiman, A.; Mirmohamadsadeghi, S.; Karimi, K. A Comprehensive Review on Recent Biological Innovations to Improve Biogas Production, Part 1: Upstream Strategies. Renewable Energy 2020, 146, 1204–1220. [Google Scholar] [CrossRef]
- Tock, L.; Schummer, J. Sustainable Waste-to-Value Biogas Plants for Developing Countries. Waste Management 2017, 64, 1–2. [Google Scholar] [CrossRef]
- Baldé, H.; Wagner-Riddle, C.; MacDonald, D.; VanderZaag, A. Fugitive Methane Emissions from Two Agricultural Biogas Plants. Waste Management 2022, 151, 123–130. [Google Scholar] [CrossRef]
- Ullah Khan, I.; Hafiz Dzarfan Othman, M.; Hashim, H.; Matsuura, T.; Ismail, A. F.; Rezaei-DashtArzhandi, M.; Wan Azelee, I. Biogas as a Renewable Energy Fuel – A Review of Biogas Upgrading, Utilisation and Storage. Energy Conversion and Management 2017, 150, 277–294. [Google Scholar] [CrossRef]
- Canadian Biogas & RNG Market Summary Report – October 2023; Canadian Biogas Association, 2023. https://www.biogasassociation.ca/images/uploads/documents/2023/resources/CBA_Market_Summary_2023.pdf.
- Ayodele, T. R.; Alao, M. A.; Ogunjuyigbe, A. S. O.; Munda, J. L. Electricity Generation Prospective of Hydrogen Derived from Biogas Using Food Waste in South-Western Nigeria. Biomass and Bioenergy 2019, 127, 105291. [Google Scholar] [CrossRef]
- Dongqing, J.; Xingmei, L.; Zhong, S. Robust Optimization Model of Waste Transfer Station Location Considering Existing Facility Adjustment. Journal of Cleaner Production 2022. [Google Scholar]
- Kůdela, J.; Šomplák, R.; Nevrlý, V.; Lipovský, T.; Smejkalová, V.; Dobrovský, L. Multi-Objective Strategic Waste Transfer Station Planning. Journal of Cleaner Production 2019, 230, 1294–1304. [Google Scholar] [CrossRef]
- Ghosh, A.; Ng, K. T. W.; Karimi, N. An Evaluation of the Temporal and Spatial Evolution of Waste Facilities Using a Simplified Spatial Distance Analytical Framework. Environmental Development 2023, 45, 100820. [Google Scholar] [CrossRef]
- Anderluh, A.; Hemmelmayr, V. C.; Nolz, P. C. Synchronizing Vans and Cargo Bikes in a City Distribution Network. Cent Eur J Oper Res 2017, 25, 345–376. [Google Scholar] [CrossRef]
- Tanguy, A.; Glaus, M.; Laforest, V.; Villot, J.; Hausler, R. A Spatial Analysis of Hierarchical Waste Transport Structures under Growing Demand. Waste Manag Res 2016, 34, 1064–1073. [Google Scholar] [CrossRef]
- Zbib, H.; Wøhlk, S. A Comparison of the Transport Requirements of Different Curbside Waste Collection Systems in Denmark. Waste Management 2019, 87, 21–32. [Google Scholar] [CrossRef] [PubMed]
- Sailer, G.; Eichermüller, J.; Poetsch, J.; Paczkowski, S.; Pelz, S.; Oechsner, H.; Müller, J. Characterization of the Separately Collected Organic Fraction of Municipal Solid Waste (OFMSW) from Rural and Urban Districts for a One-Year Period in Germany. Waste Management 2021, 131, 471–482. [Google Scholar] [CrossRef]
- Sarker, B. R.; Wu, B.; Paudel, K. P. Modeling and Optimization of a Supply Chain of Renewable Biomass and Biogas: Processing Plant Location. Applied Energy 2019, 239, 343–355. [Google Scholar] [CrossRef]
- Sanchuan, O.; Hongguang, Z.; Junjie, C.; Minqi, Z. Optimization and GIS-Based Combined Approach for the Determination of Sites and Size of Biogas Plants for a Whole Region. E3S Web of Conferences 2019, 118, 03020. [Google Scholar] [CrossRef]
- Liu, Y.; Huang, L.; Kaloudis, A.; Støre-Valen, M. Does Urbanization Lead to Less Energy Use on Road Transport? Evidence from Municipalities in Norway. Transportation Research Part D: Transport and Environment 2017, 57, 363–377. [Google Scholar] [CrossRef]
- Ministère de l’environnement et la lutte contre les changements climatiques. Programme de traitement des matières organiques par biométhanisation et compostage - Liste des projets, 2022.
- International energy agency. Outlook for Biogas and Biomethane Prospects for Organic Growth; International energy agency, 2020; p. 93. Available online: (accessed on 16 August 2022).
- Tanguy, A.; Villot, J.; Glaus, M.; Laforest, V.; Hausler, R. Service Area Size Assessment for Evaluating the Spatial Scale of Solid Waste Recovery Chains: A Territorial Perspective. Waste Management 2017, 64, 386–396. [Google Scholar] [CrossRef] [PubMed]
- Pantaleo, A.; Gennaro, B. D.; Shah, N. Assessment of Optimal Size of Anaerobic Co-Digestion Plants: An Application to Cattle Farms in the Province of Bari (Italy). Renewable and Sustainable Energy Reviews 2013, 20, 57–70. [Google Scholar] [CrossRef]
- Wright, M.; Brown, R. C. Establishing the Optimal Sizes of Different Kinds of Biorefineries. Biofuels, Bioproducts and Biorefining 2007, 1, 191–200. [Google Scholar] [CrossRef]
- Ministère des transports du Québec. Réseau routier - RTSS - Données Québec, 2022.
- Di Maria, F.; Micale, C. Impact of Source Segregation Intensity of Solid Waste on Fuel Consumption and Collection Costs. Waste Management 2013, 33, 2170–2176. [Google Scholar] [CrossRef]
- Franzese, O.; Davidson, D. Effect of Weight and Roadway Grade on the Fuel Economy of Class-8 Freight Trucks; ORNL/TM-2011/471; Oak Ridge National Laboratory, 2011; p 79.
- Gouvernement du Québec. Navigateur géographique. MERN. Available online: https://mern.gouv.qc.ca/ministere/cartesinformation-geographique/navigateur-geographique/ (accessed on 8 April 2024).
- Gouvernement du Québec. Adresses Québec, 2022.
- Gouvernement du Québec. Région Administrative 16: Montérégie, 2021. www.bibliotheque.assnat.qc.ca.
- Québec, I. de la S. du. Recensement de la population 2011, municipalités, MRC et TE de Montréal (06) et Laval (13) et ensemble du Québec, 2011. [Google Scholar]
- Ressources naturelles Canada. Learn the Facts: Emissions from Your Vehicle, 2014. Available online: https://natural-resources.canada.ca/sites/www.nrcan.gc.ca/files/oee/pdf/transportation/fuel-efficient-technologies/autosmart_factsheet_9_e.pdf.
- Chitaka, T. Y.; Schenck, C. Developing Country Imperatives in the Circular Bioeconomy: A Review of the South African Case. Environmental Development 2023, 45, 100812. [Google Scholar] [CrossRef]
- Calisto Friant, M.; Vermeulen, W. J. V.; Salomone, R. A Typology of Circular Economy Discourses: Navigating the Diverse Visions of a Contested Paradigm. Resources, Conservation and Recycling 2020, 161, 104917. [Google Scholar] [CrossRef]
Figure 1.
Biomethane recovery process.
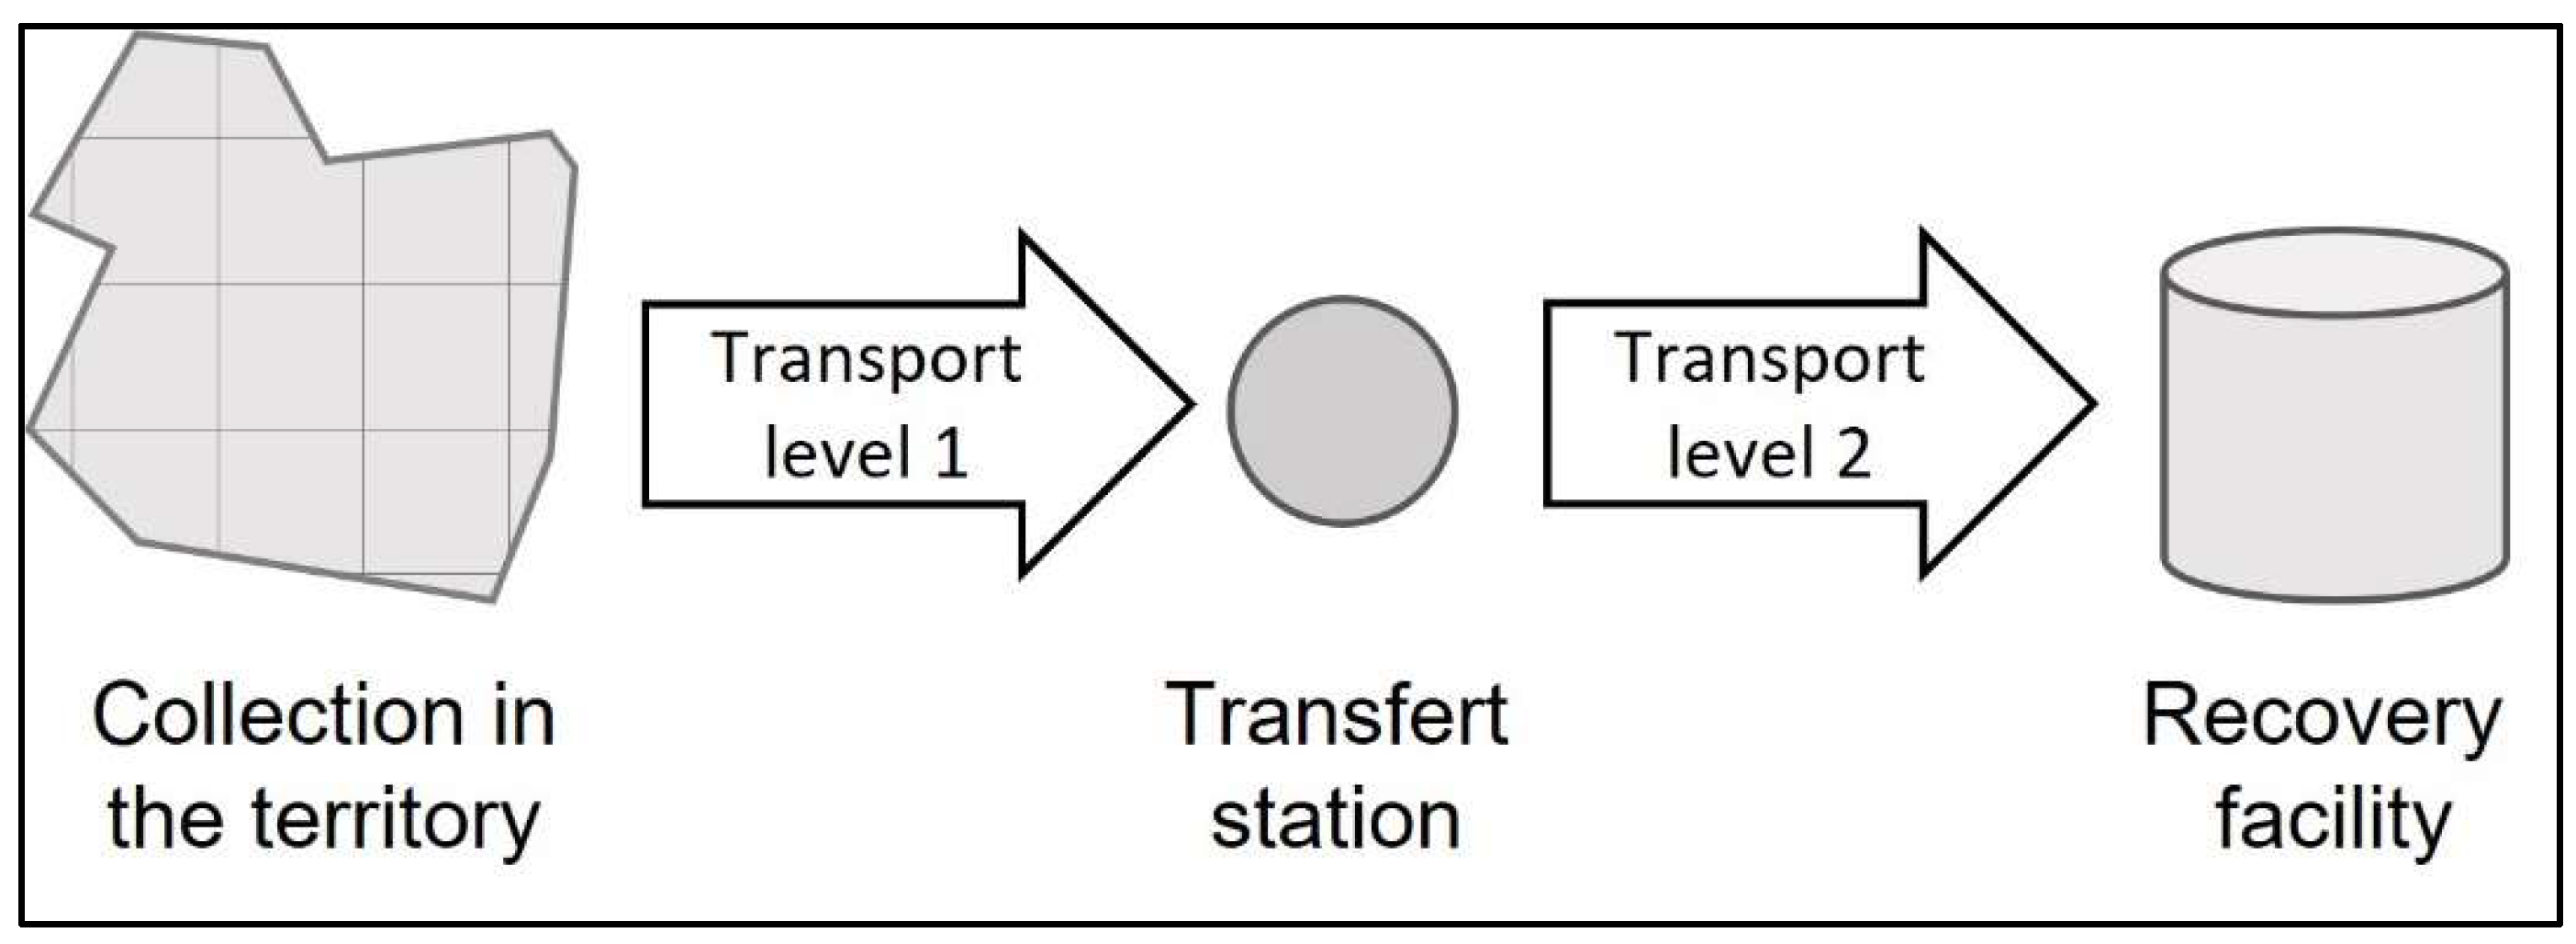
Figure 2.
Different levels of collection and transport.
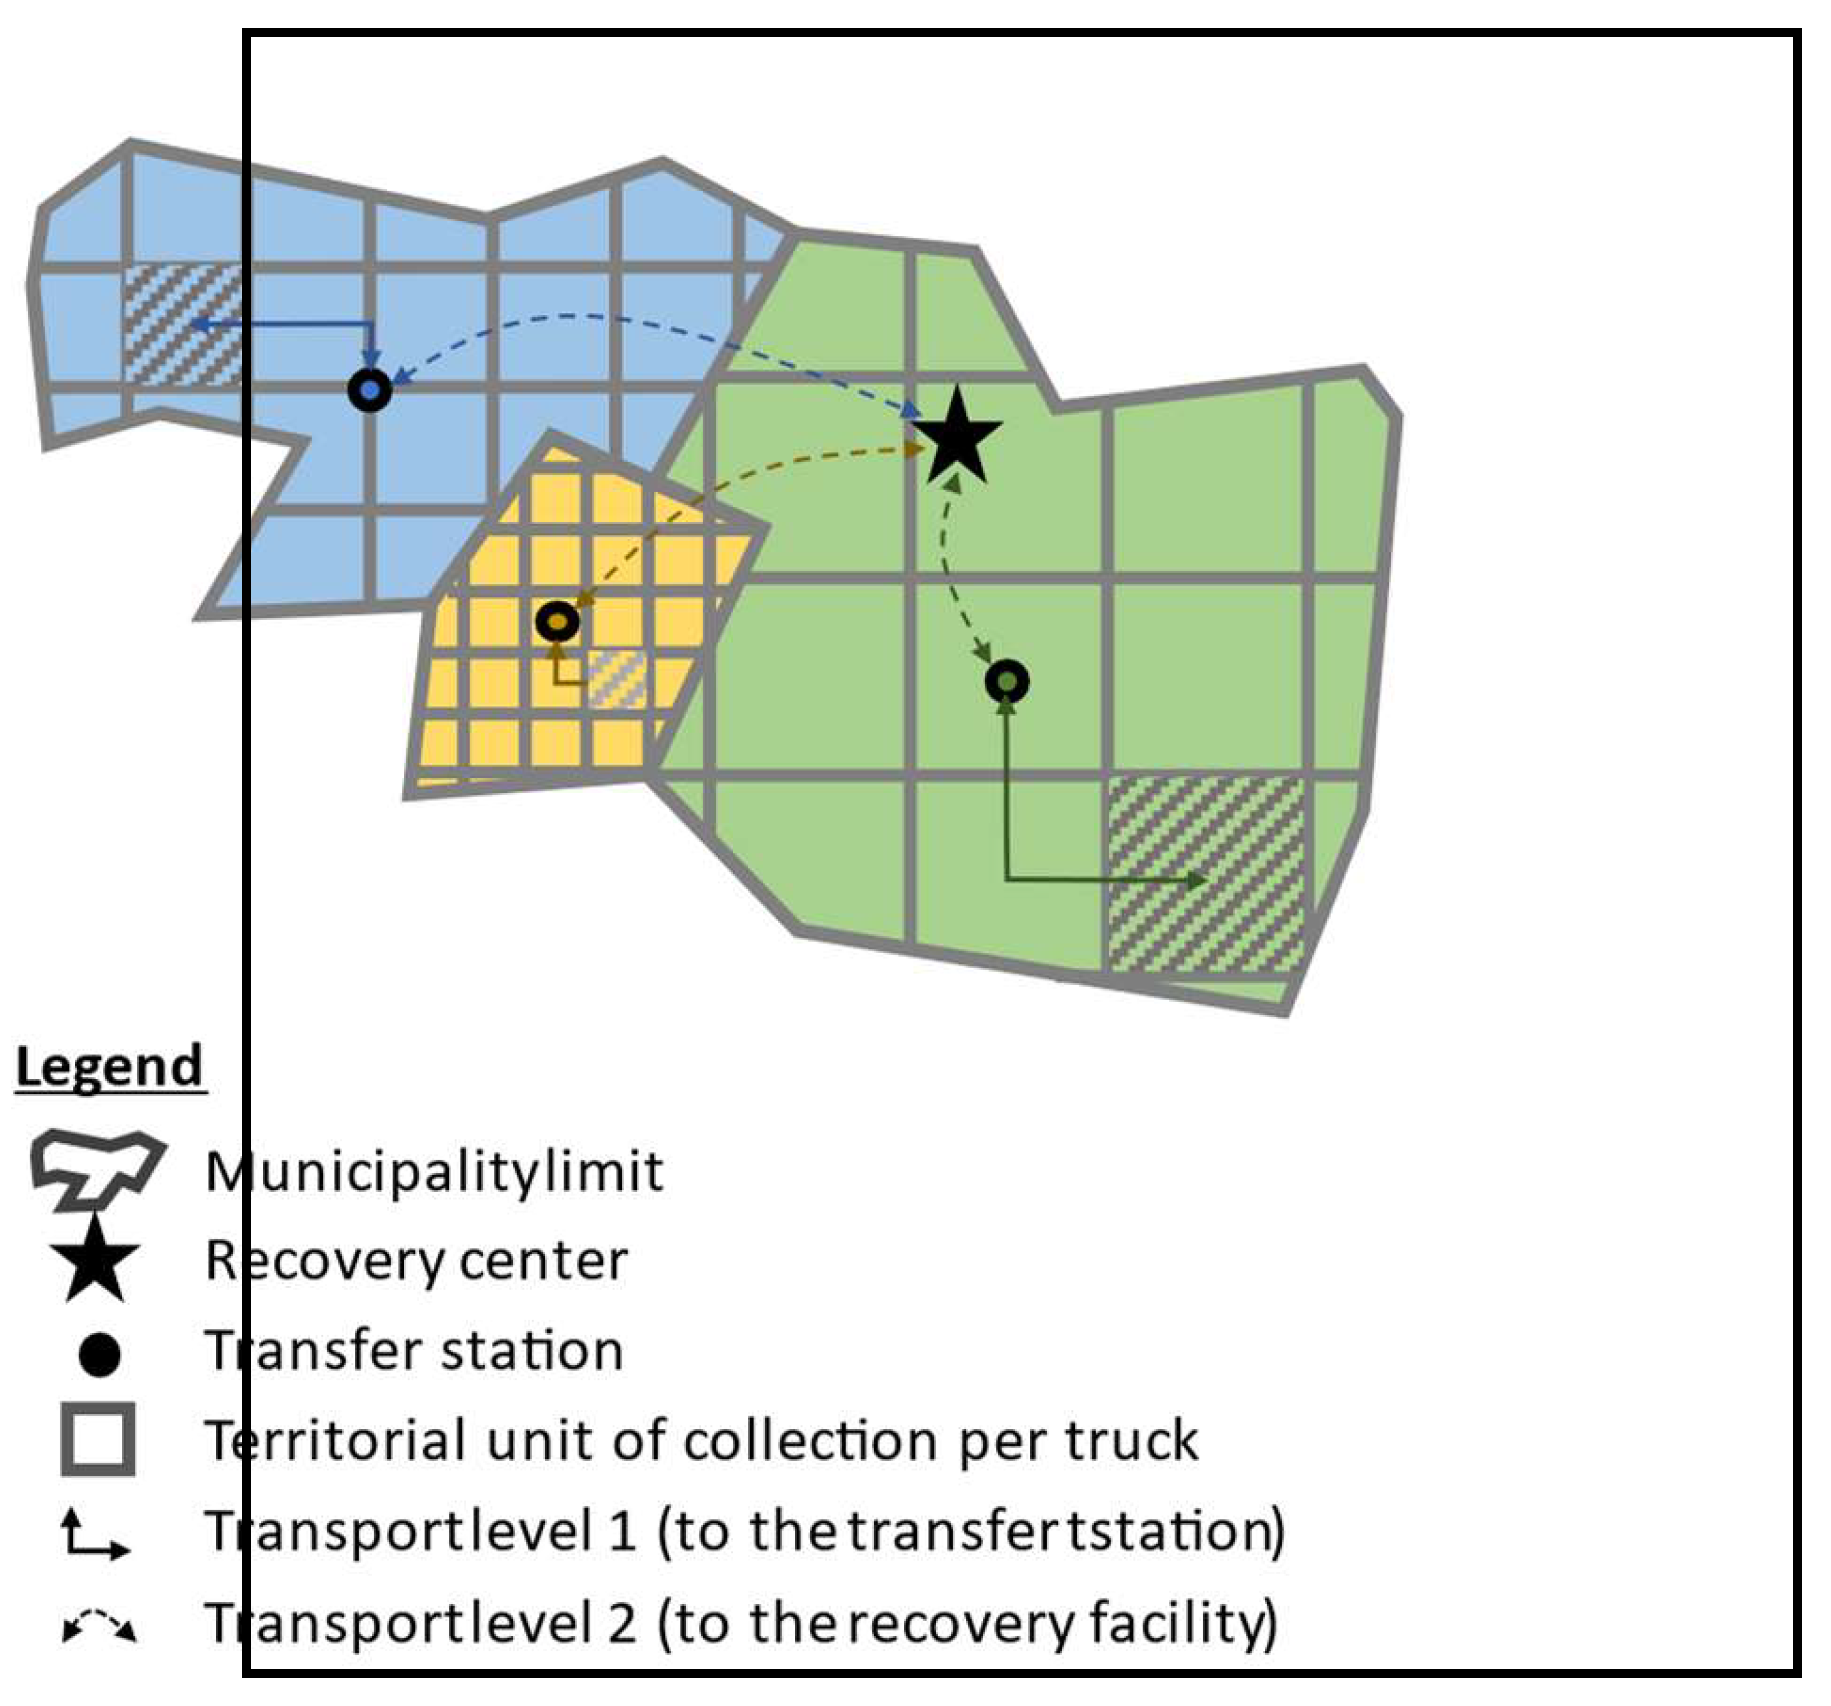
Figure 3.
Configuration breakdown grid type (n x n) centred on the recovery facility with the cell unit of collection represented by d2 dimensions for both configuration types: (1) even number of cell units in the grid to travel from the unit cell to the digester or (2) uneven number of units in the grid to travel from the unit cell to the digester.
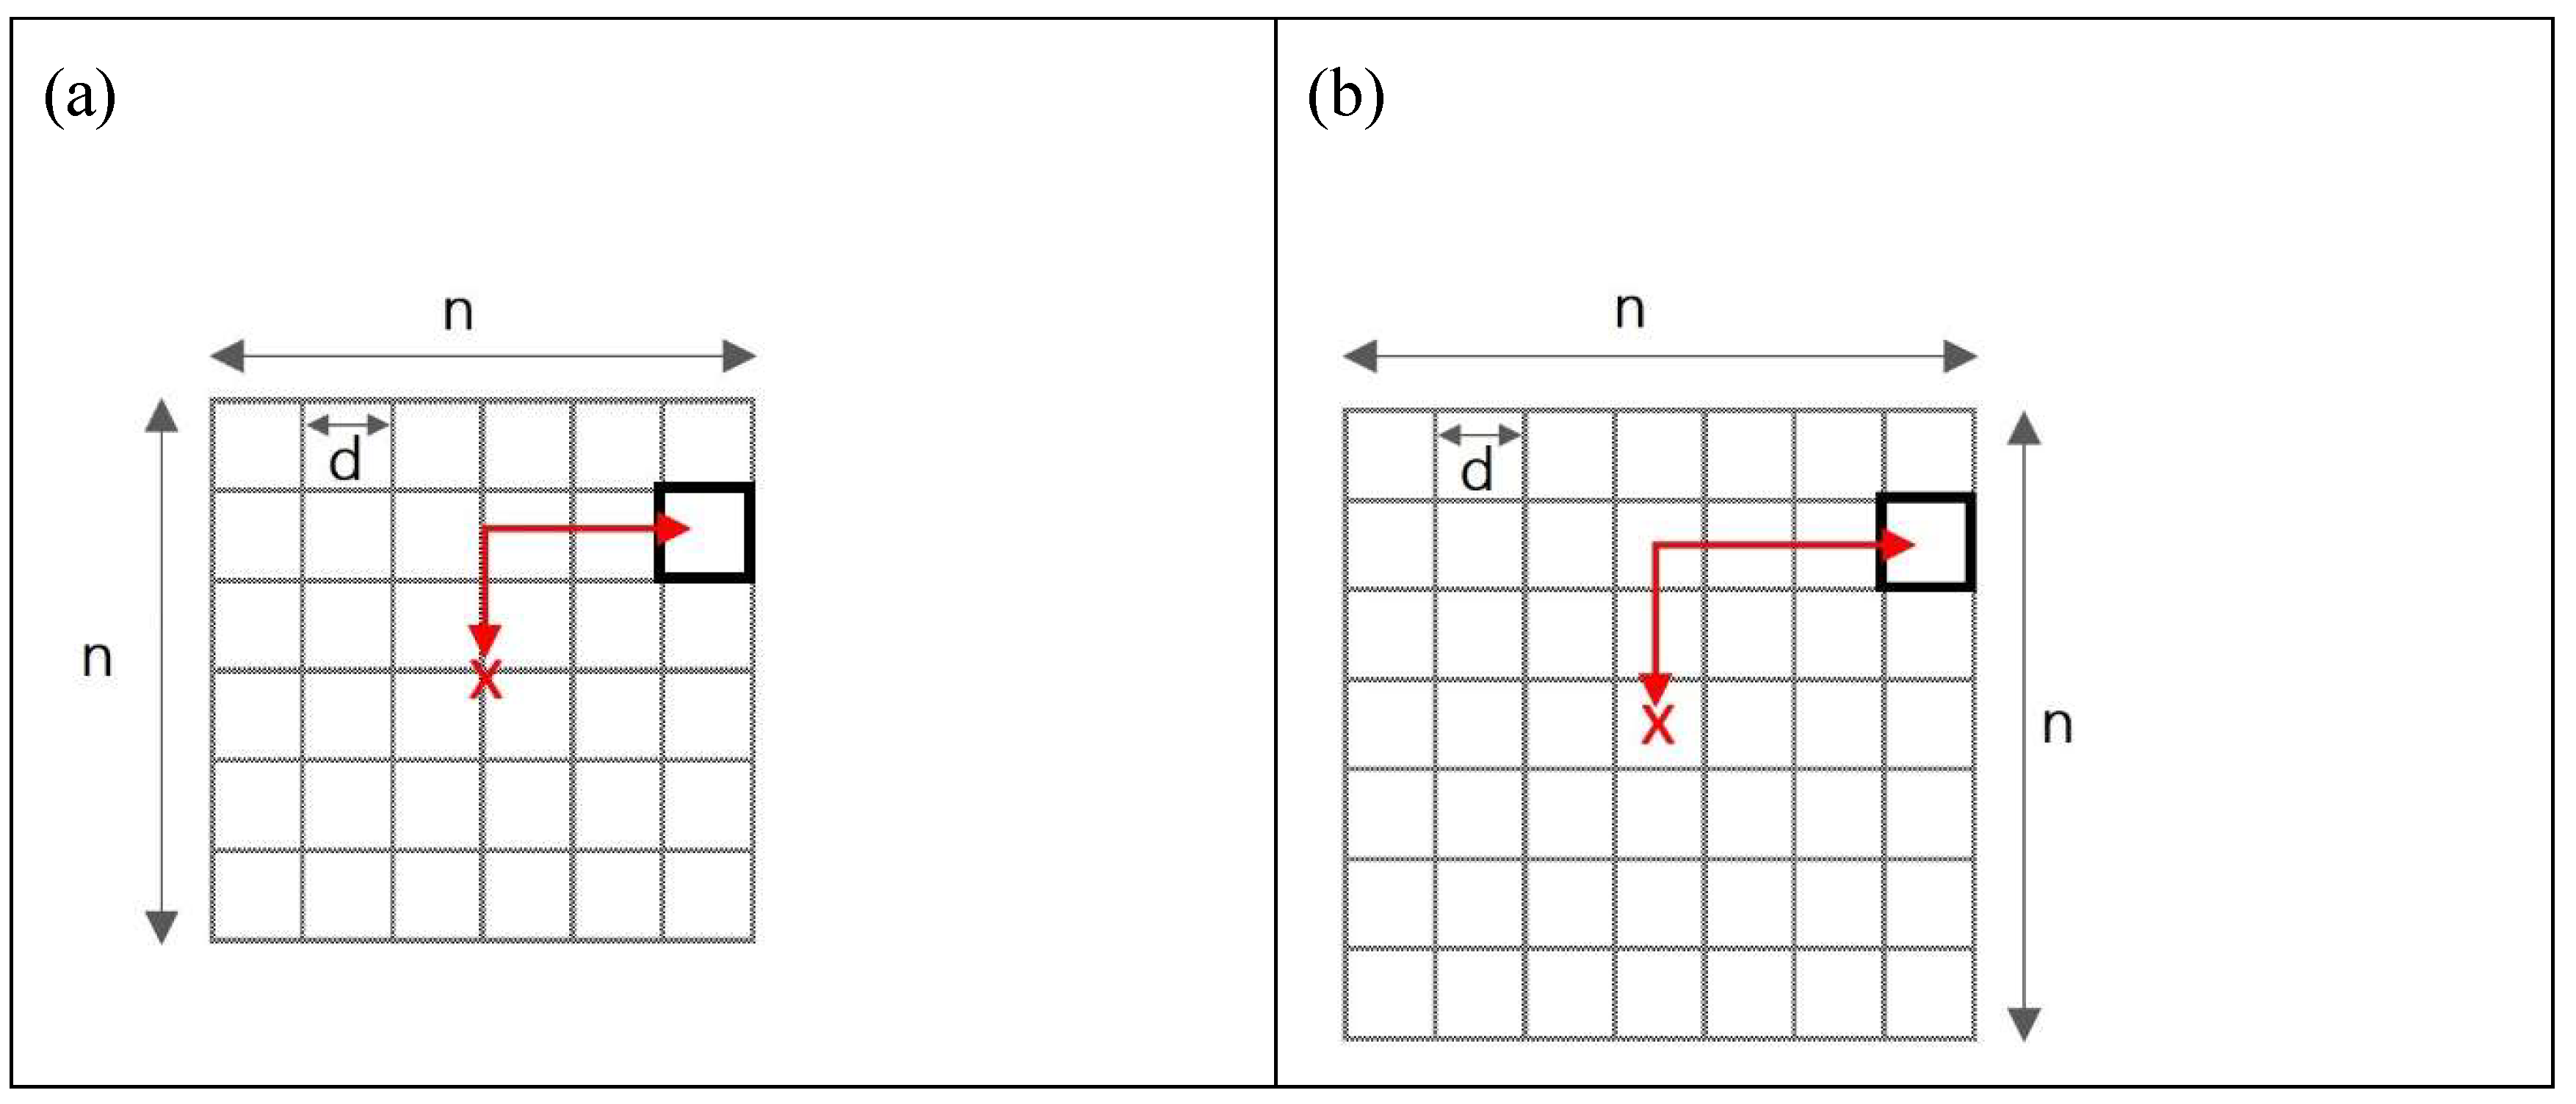
Figure 4.
Location of the Montérégie region (in red) in the province of Québec, Canada data from (Gouvernement du Québec 2024).
Figure 4.
Location of the Montérégie region (in red) in the province of Québec, Canada data from (Gouvernement du Québec 2024).
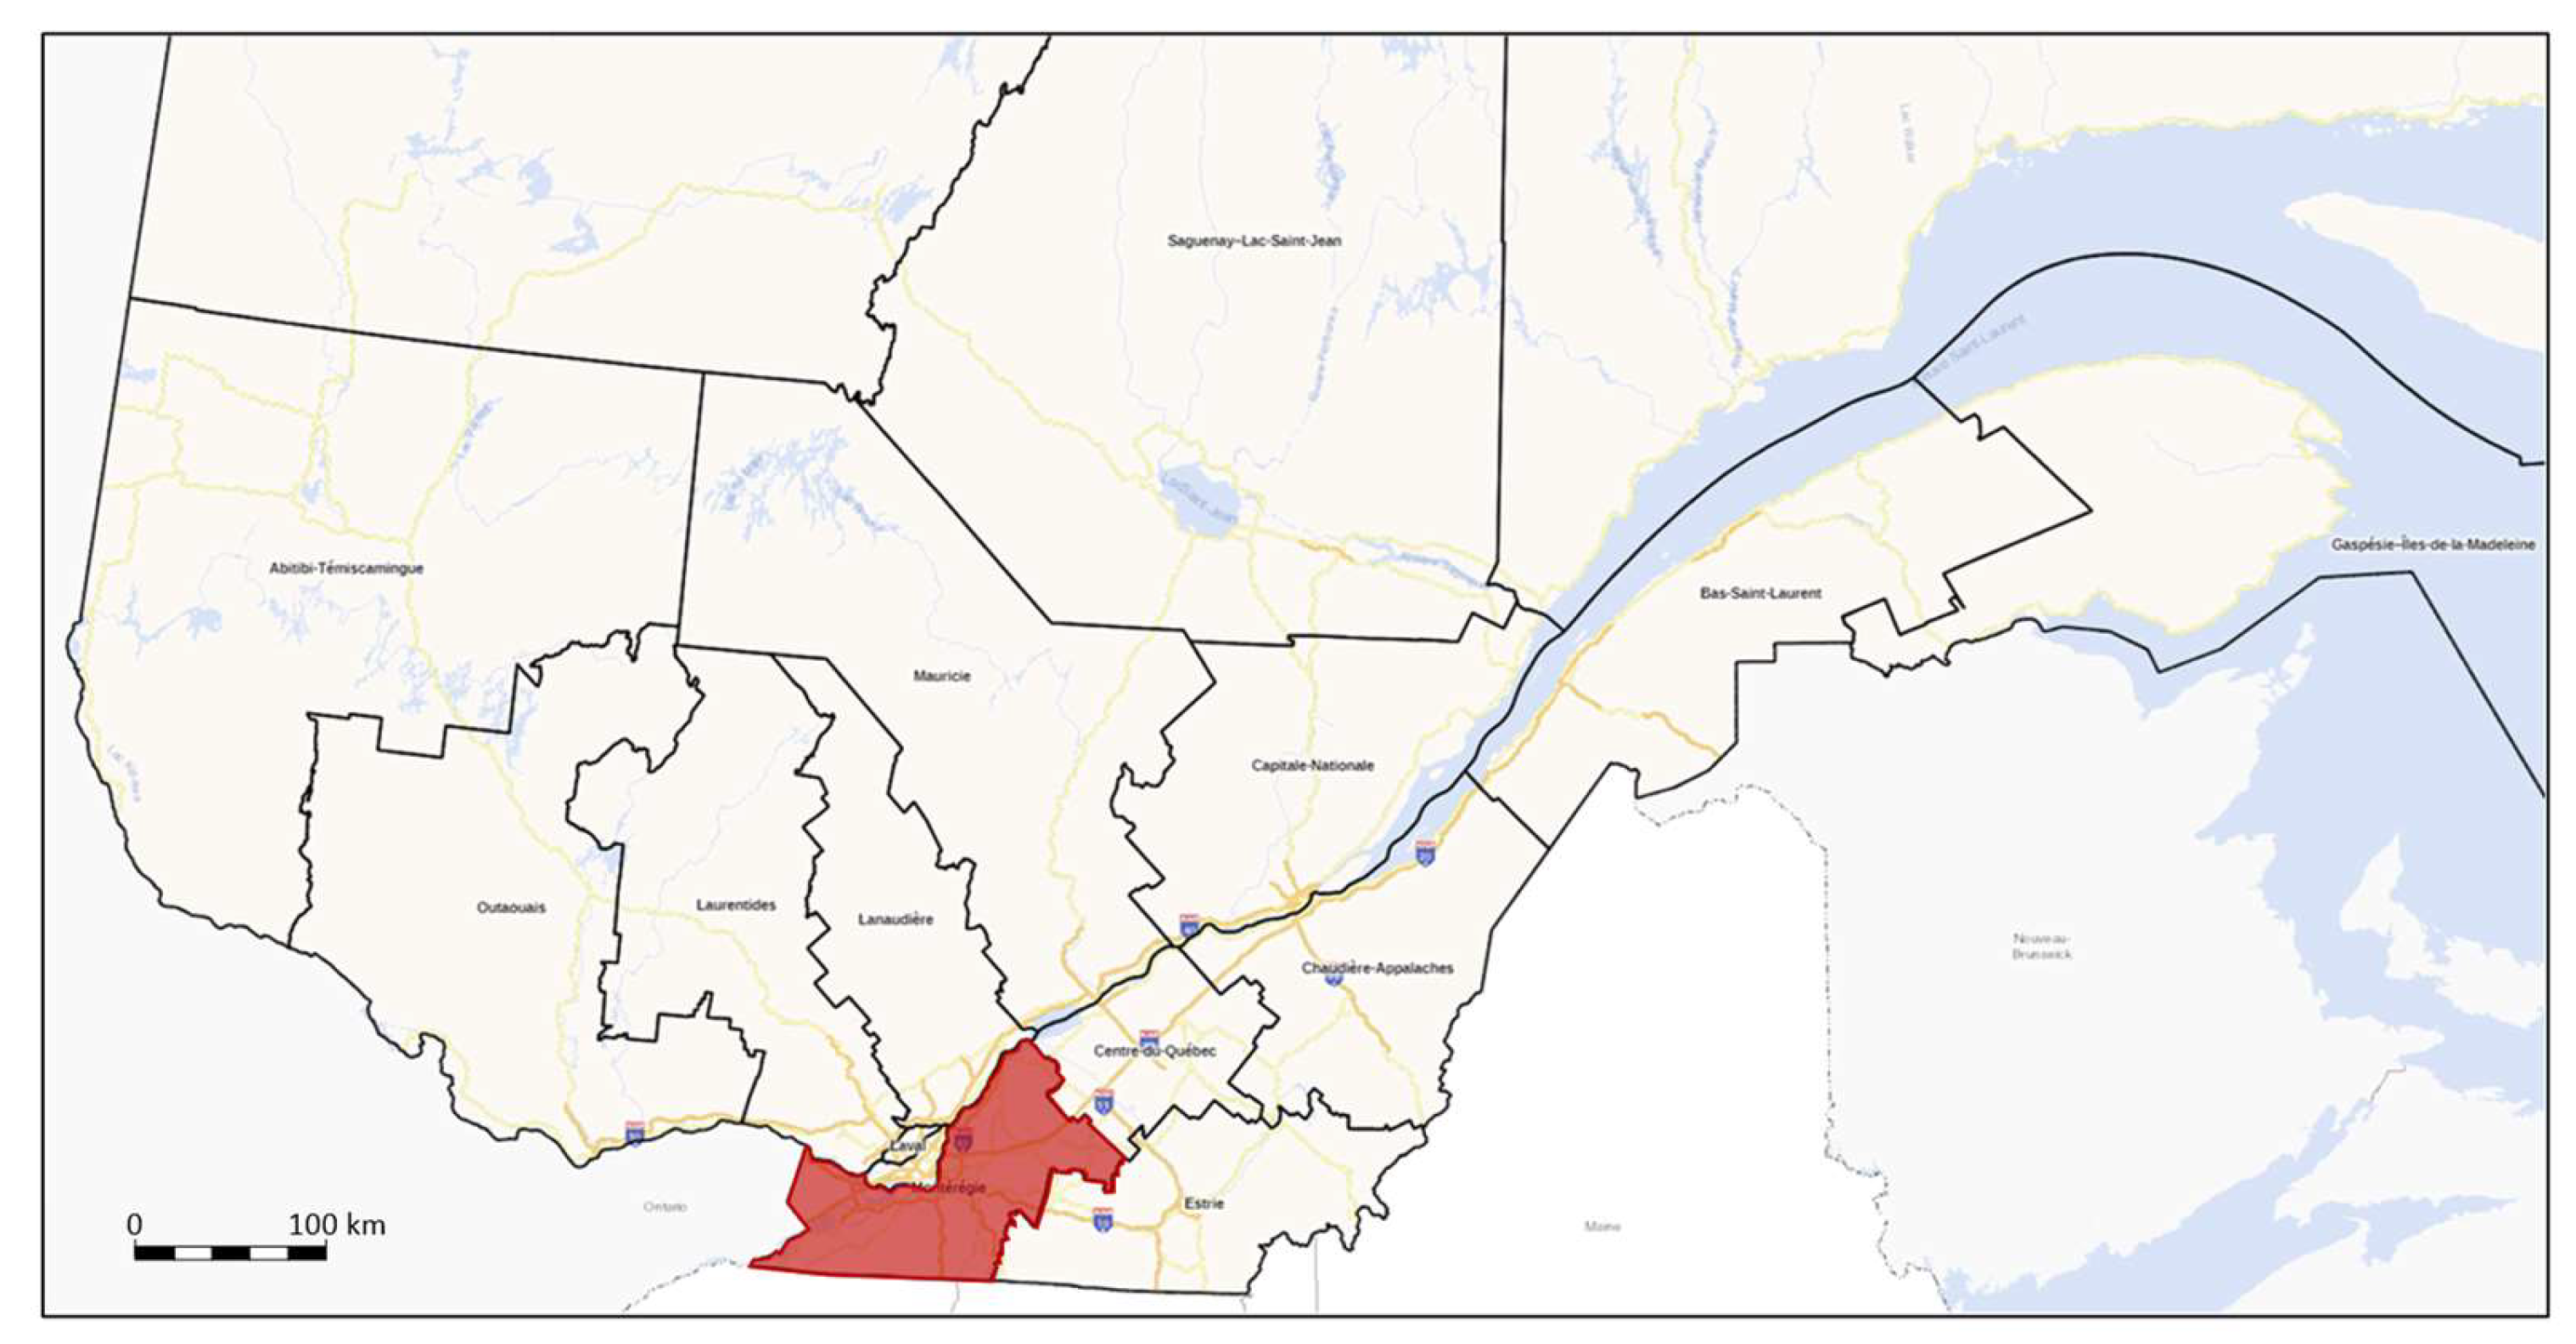
Figure 5.
Production capacity of biomethanization facilities in Quebec, Canada. Data collected from (22).
Figure 5.
Production capacity of biomethanization facilities in Quebec, Canada. Data collected from (22).
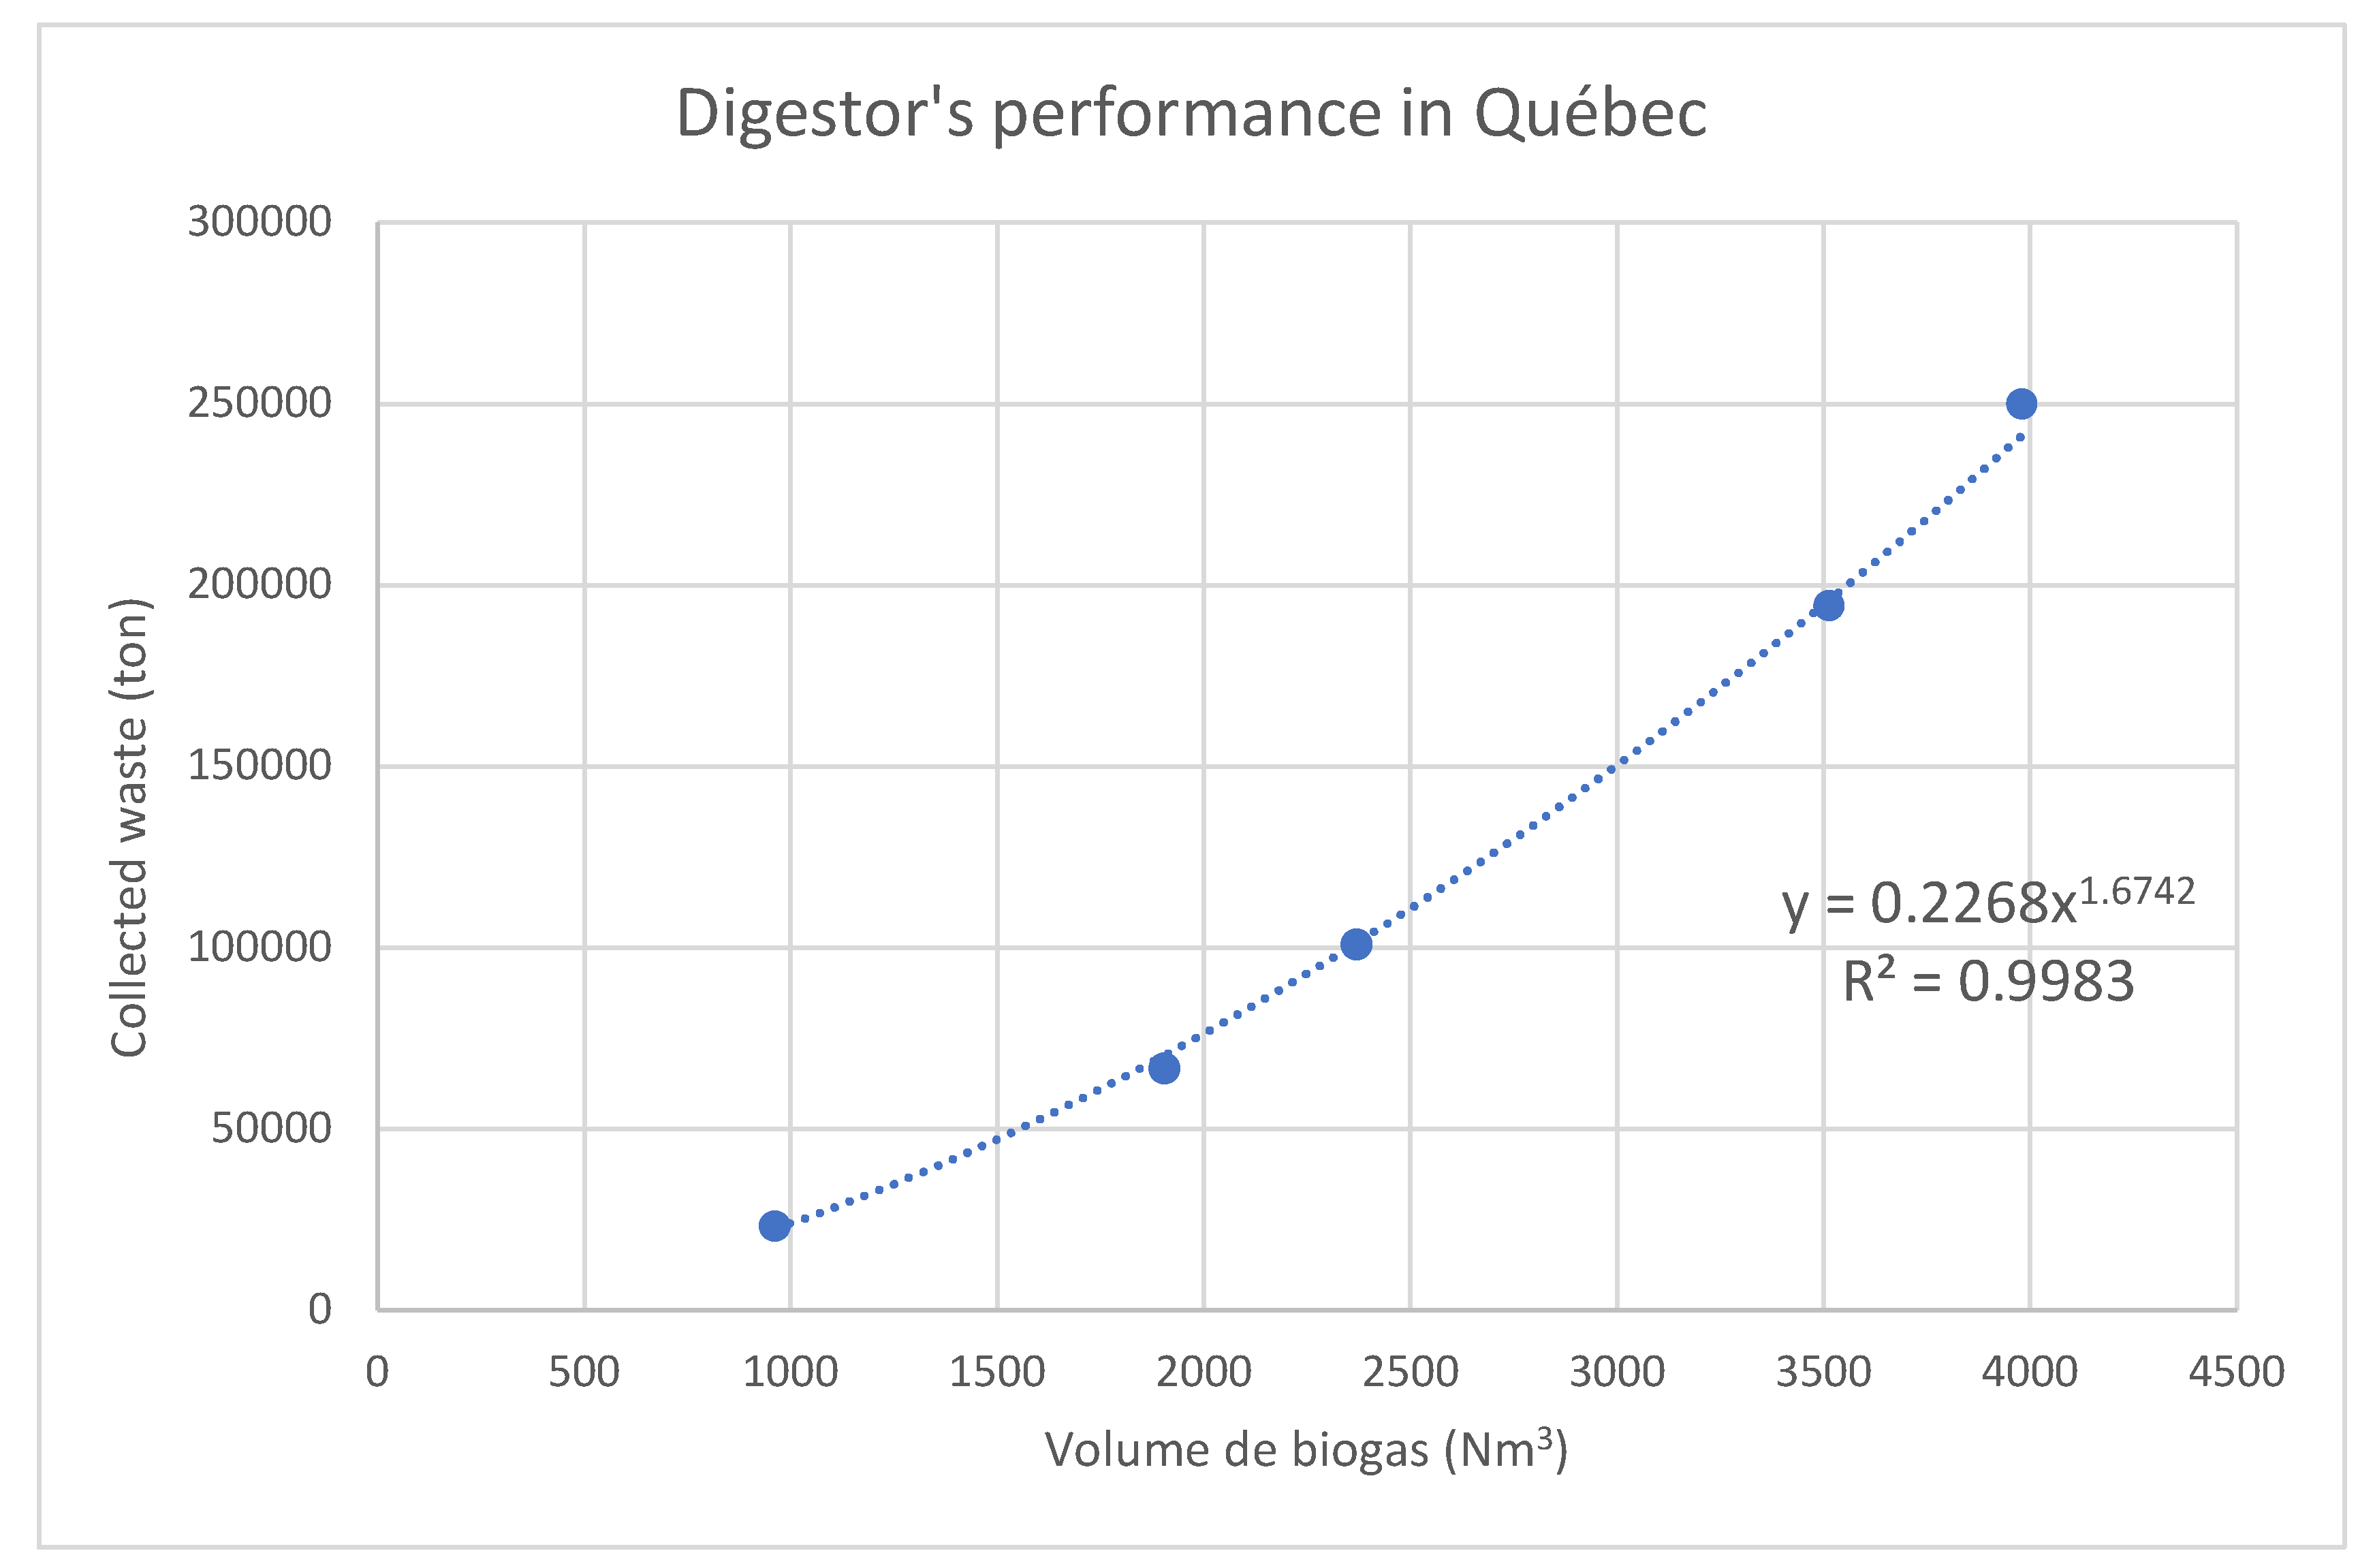
Figure 6.
Energies of collection and transportation level 1 and level 2 for the scenario A.
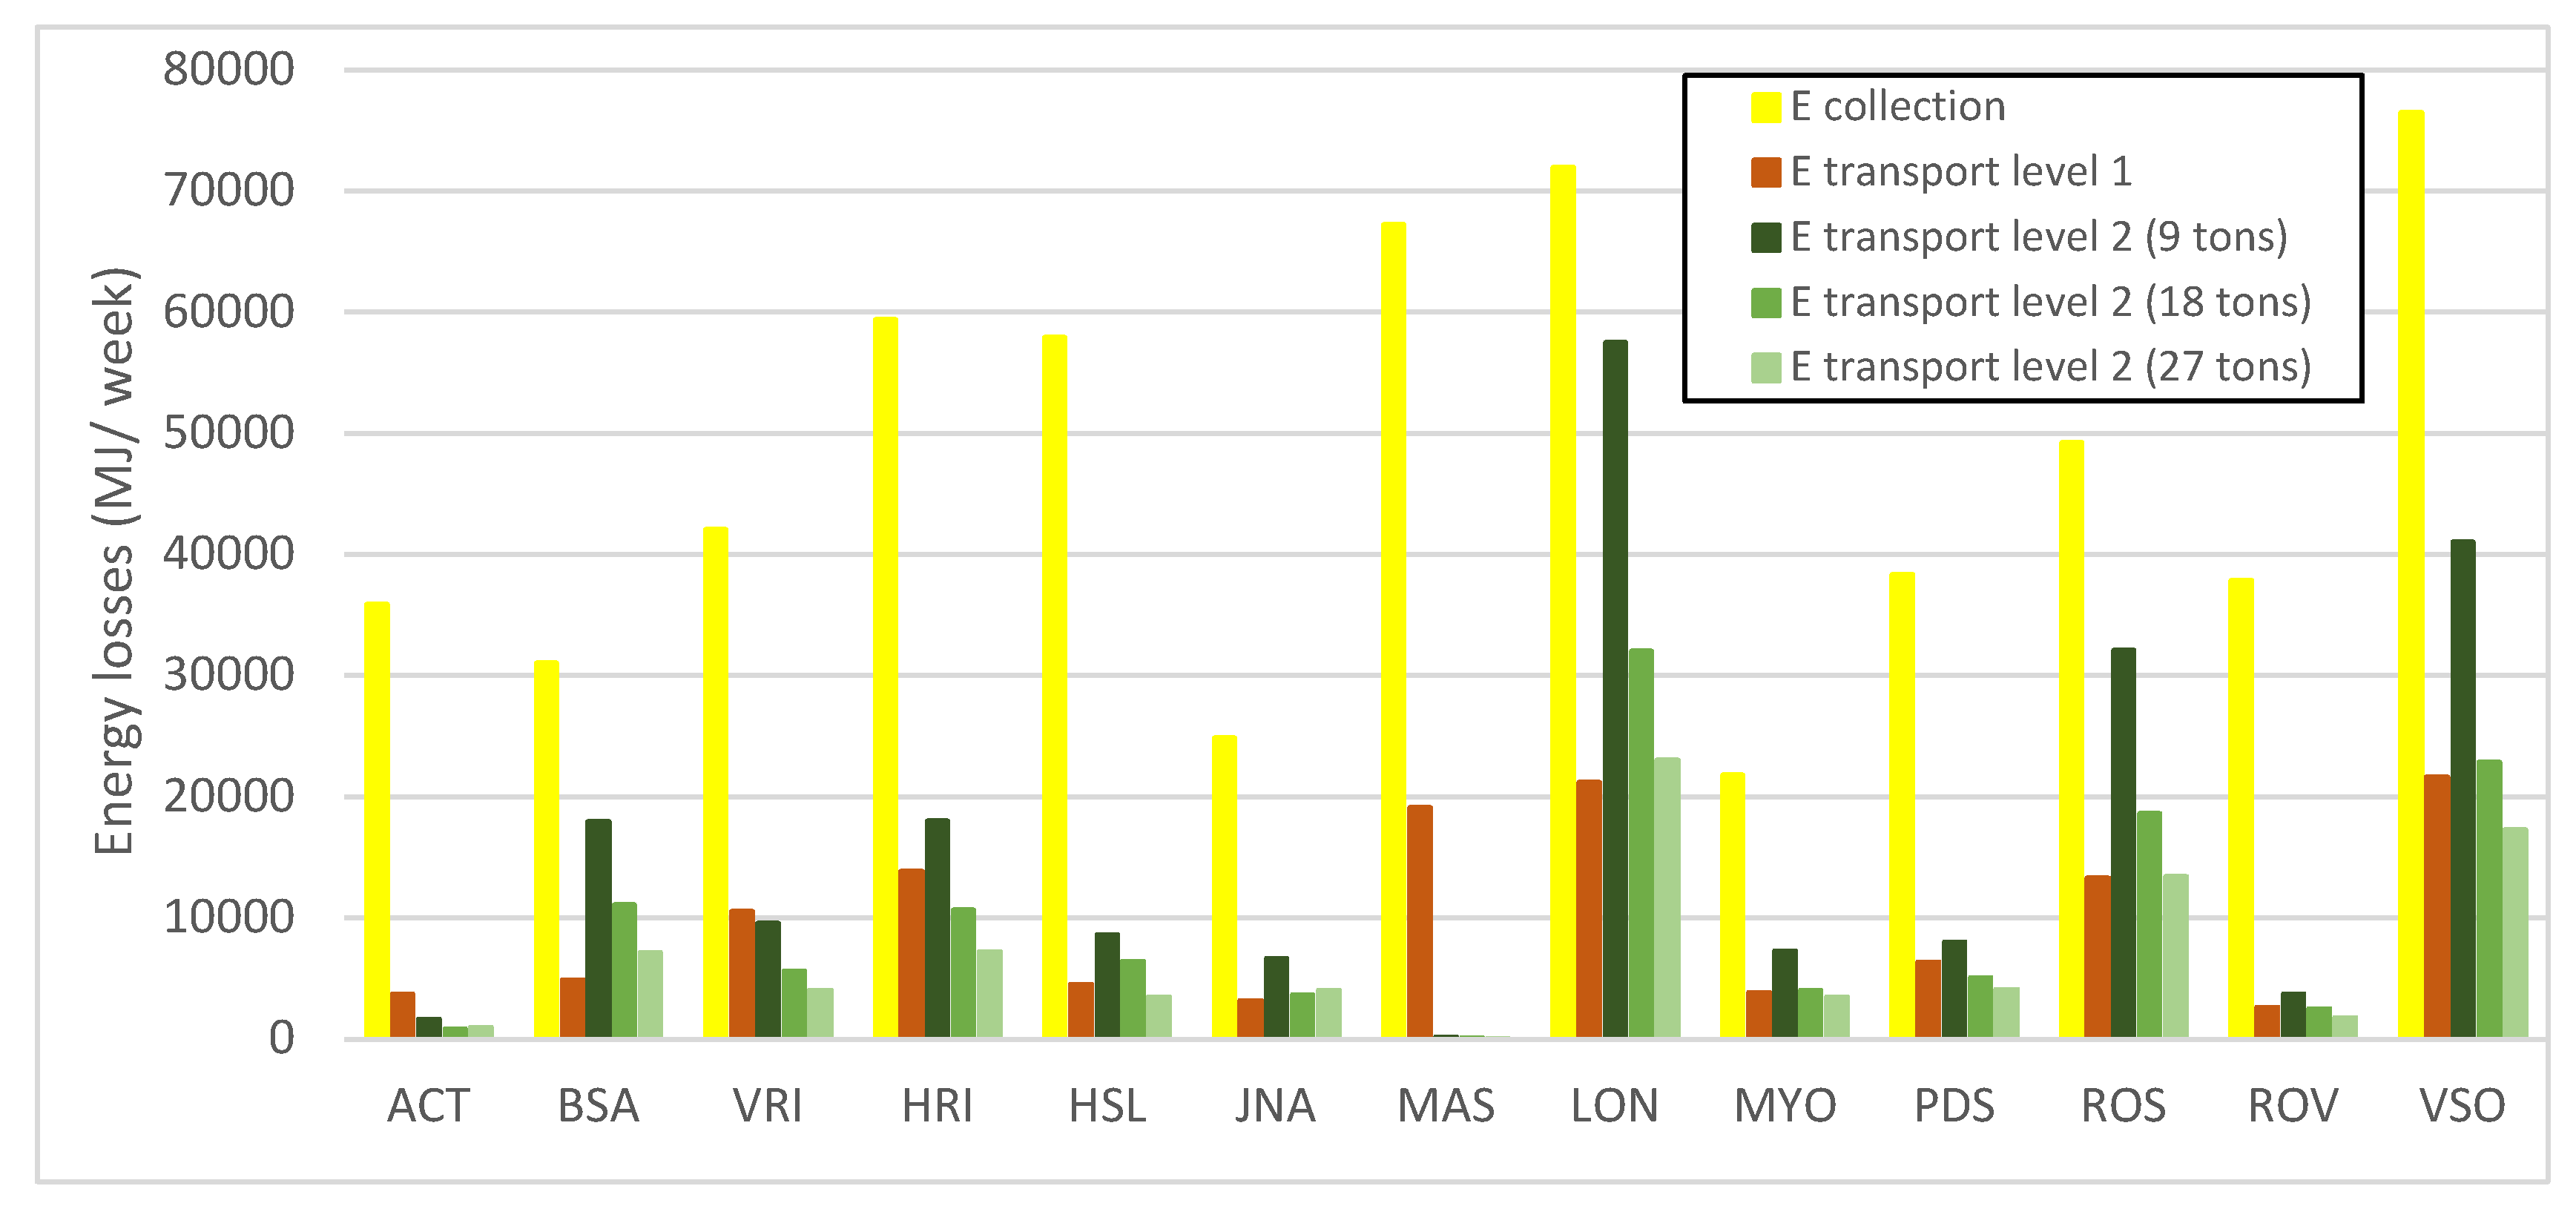
Figure 7.
Study of allocation of organic waste and location of the digester in the Montérégie region.
Figure 7.
Study of allocation of organic waste and location of the digester in the Montérégie region.
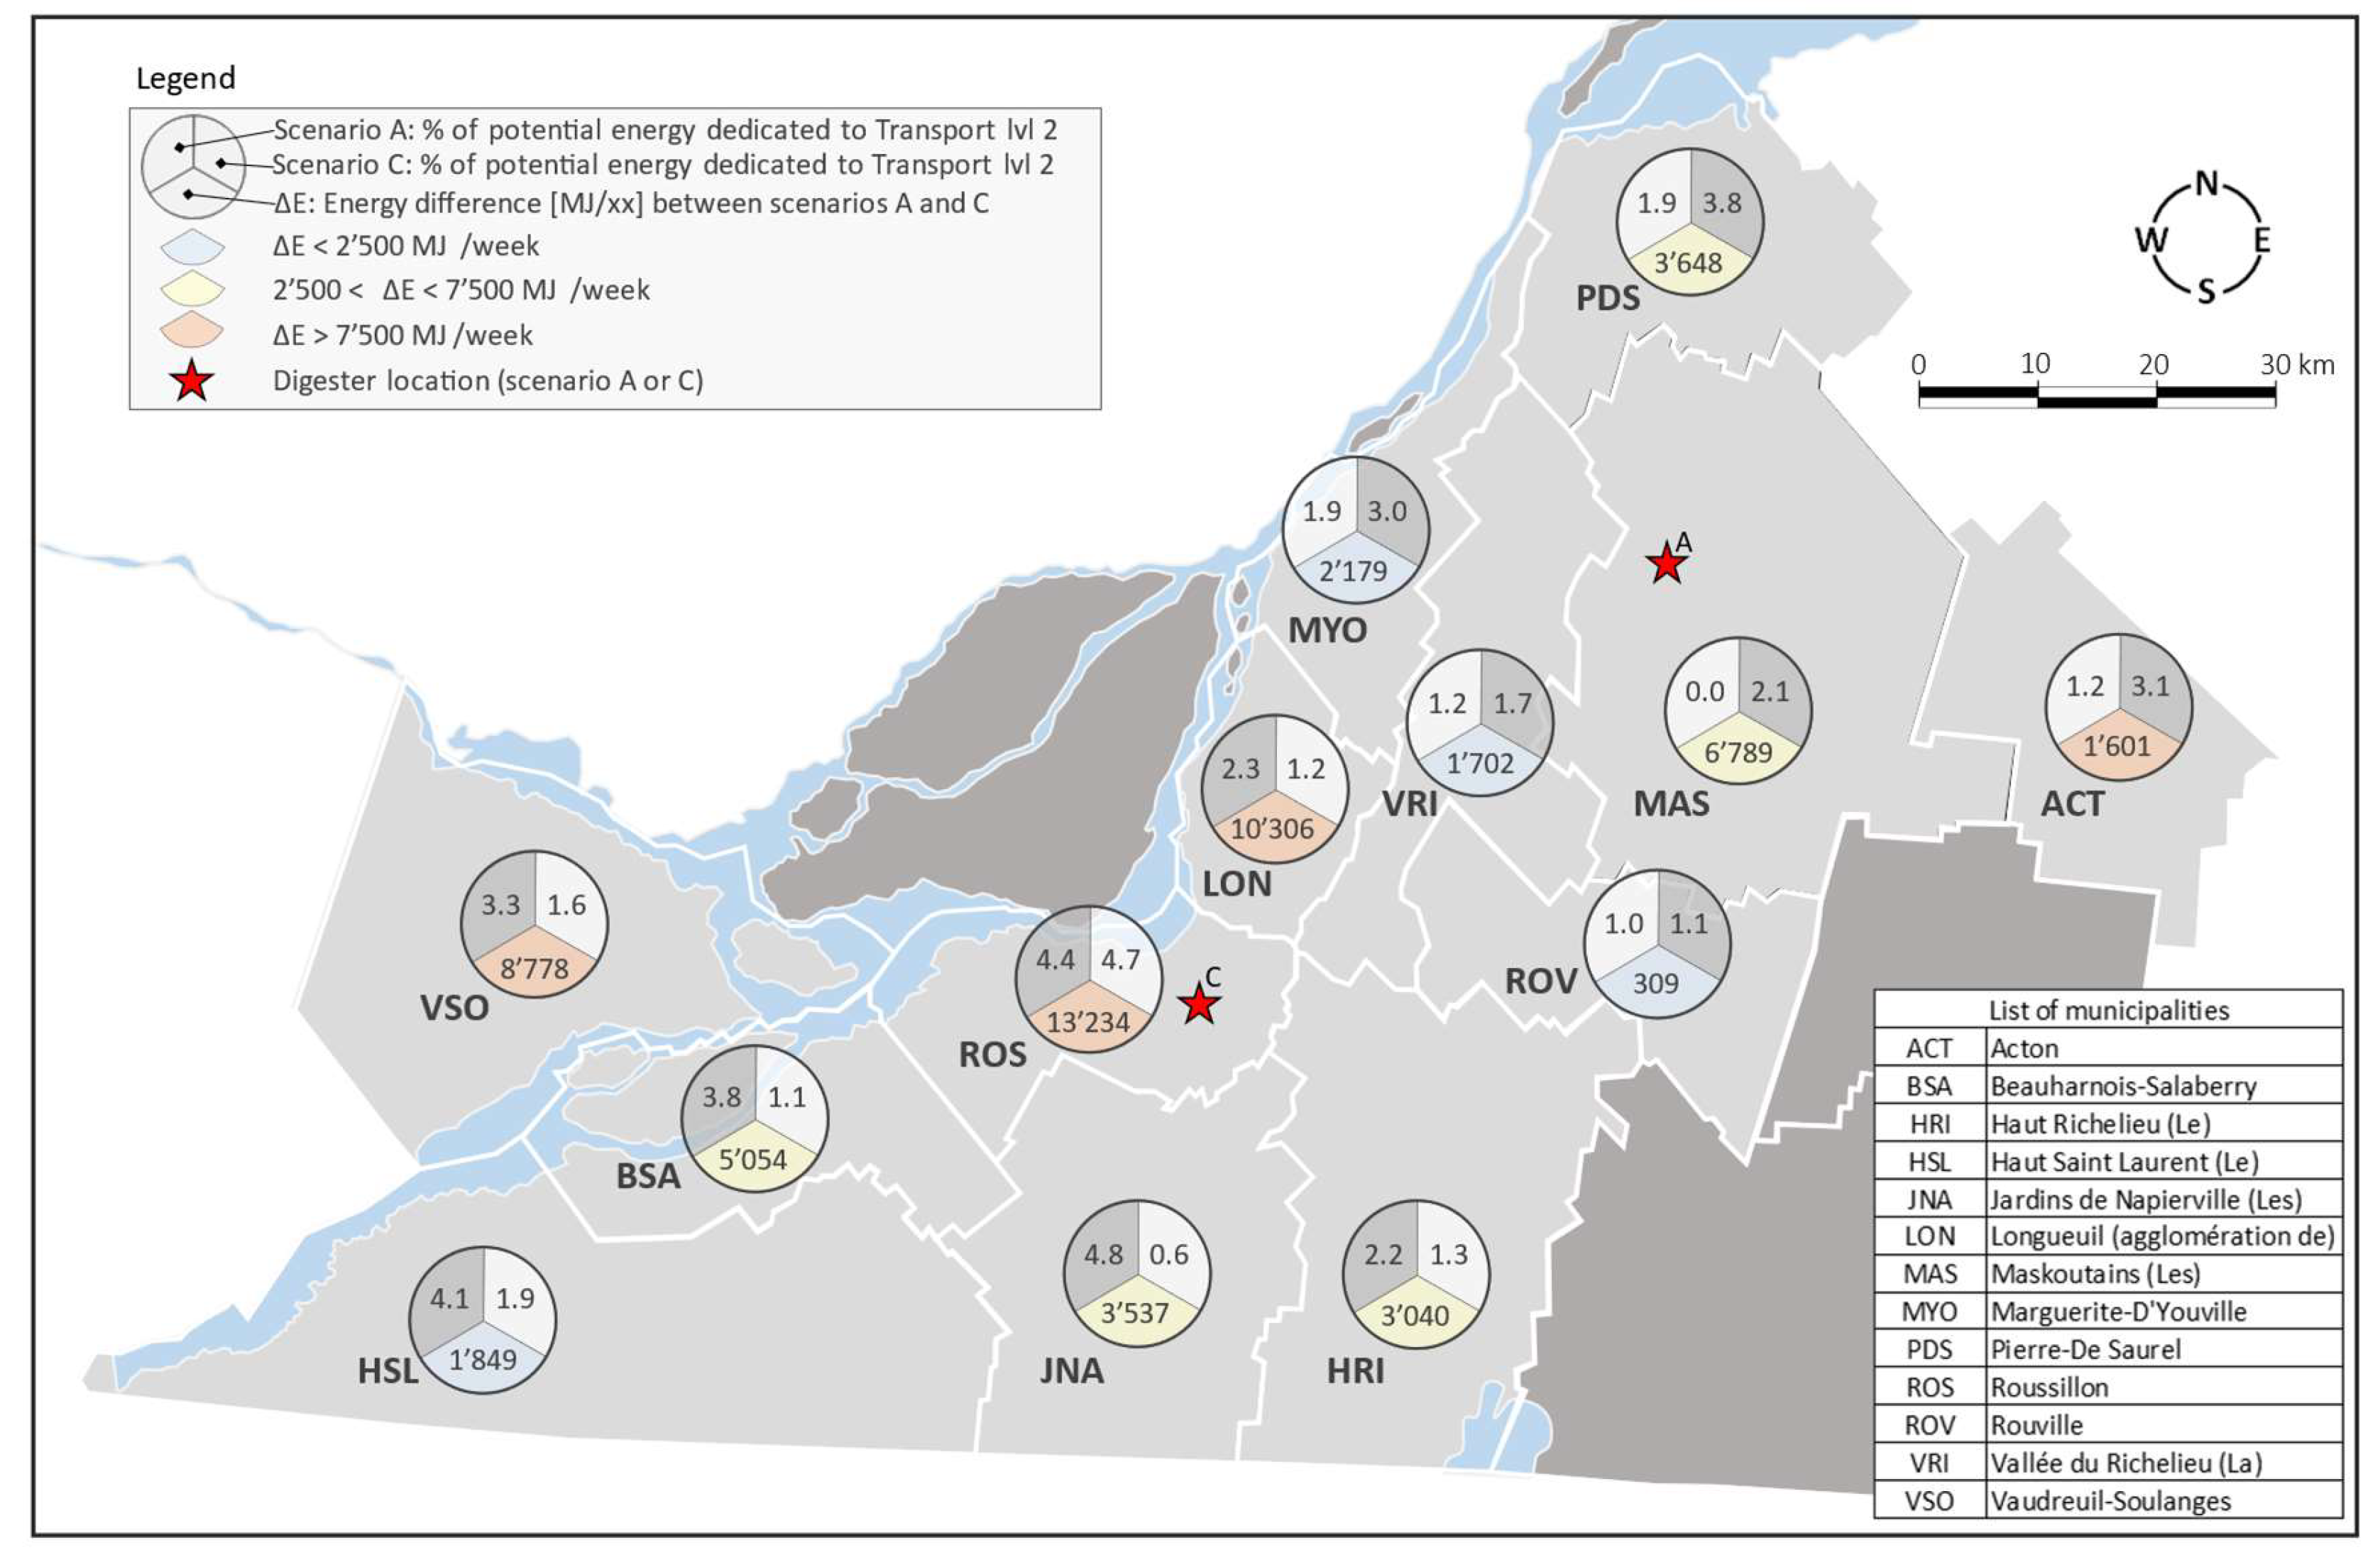

Table 1.
Description of different scenarios.
| Scenario | Description |
|---|---|
| A | Centralized: the organic waste is sent to the digester in the MAS municipality |
| B | Decentralized: the organic waste is sent to the digester in the centre of each municipality |
| C | Centralized: the organic waste is sent to the digester in the ROS municipality |
| D | Centralized to multiple digesters: the organic waste is sent to the digester in the MAS or ROS municipalities |
Table 2.
Municipalities and density in the administrative region of Montérégie in Québec, Canada data extracted from (Ministère des transports du Québec 2022).
Table 2.
Municipalities and density in the administrative region of Montérégie in Québec, Canada data extracted from (Ministère des transports du Québec 2022).
| Municipality | Population (people) | Area (km2) | Road Network (km) | Density (people/km2) | Road Density (km/km2) | Linear Density of Population (people/km) |
|---|---|---|---|---|---|---|
| Acton (ACT) | 15’965 | 579 | 440 | 28 | 0.76 | 36.3 |
| Beauharnois-Salaberry (BSA) | 67’899 | 468 | 720 | 145 | 1.54 | 94.2 |
| Haut Richelieu (Le) (HRI) | 122’526 | 936 | 1’399 | 131 | 1.49 | 87.6 |
| Haut Saint Laurent (Le) (HSL) | 22’200 | 1’157 | 988 | 19 | 0.85 | 22.5 |
| Jardins de Napierville (Les) (JNA) | 31’295 | 802 | 599 | 39 | 0.75 | 52.3 |
| Longueuil (agglomération de) (LON) | 434’711 | 282 | 1’963 | 1’542 | 6.96 | 221 |
| Maskoutains (Les) (MAS) | 89’575 | 1’303 | 1’158 | 69 | 0.89 | 77.4 |
| Margueritte-D’Youveille (MYO) | 80’742 | 348 | 600 | 232 | 1.72 | 135 |
| Pierre-De Saurel (PDS) | 51’800 | 594 | 679 | 87 | 1.14 | 76.3 |
| Roussillon (ROS) | 184’980 | 372 | 1’120 | 497 | 3.01 | 165 |
| Rouville (ROV) | 37’680 | 482 | 487 | 78 | 1.01 | 77.3 |
| Vallée du Richelieu (La) (VRI) | 132’315 | 587 | 1’070 | 225 | 1.82 | 124 |
| Vaudreuil-Soulanges (VSO) | 161’397 | 854 | 1’518 | 189 | 1.78 | 106 |
Table 3.
Energy losses of scenarios A and B.
| Municipality | Waste | Energy | |||
|---|---|---|---|---|---|
| (code) | (t/week) | Potential (MJ/week) | Collect (MJ/week) | Transport 1 (MJ/week) | Transport 2 (MJ/week) |
| (% of potential) | (% of potential) | (% of potential) | |||
| Recovery Sc.B (MJ/week) | Recovery Sc.A (MJ/week) | ||||
| (% of potential) | (% of potential) | ||||
| scénarios | A (centralised) |  |
|||
| B (decentralised) |  |
||||
| Acton (ACT) | 17.6 | 4’244 | 35’878 | 3’775 | 983 |
| >100% | 89.0% | 23.2% | |||
| -35’409 | -36’392 | ||||
| <0% | <0% | ||||
| Beauharnois-Sallaberry (BSA) | 74.7 | 16’496 | 31’067 | 4‘937 | 7’182 |
| >100% | 29.92% | 43.5% | |||
| -19’507 | -26’689 | ||||
| <0% | <0% | ||||
| Haut Richelieu (Le) (HRI) | 135 | 43’225 | 59’422 | 13’857 | 7’220 |
| >100% | 32.1% | 16.7% | |||
| -30’055 | -37’275 | ||||
| <0% | <0% | ||||
| Haut Saint-Laurent (Le) (HSL) | 24.4 | 4’244 | 57’937 | 4’525 | 3’471 |
| >100% | >100% | 81.8% | |||
| -58’219 | -61’690 | ||||
| <0% | <0% | ||||
| Jardins de Napierville (Les)(JNA) | 34.4 | 4’244 | 24’898 | 3’174 | 4’043 |
| >100% | 74.8% | 95.3% | |||
| -23’828 | -27,871 | ||||
| <0% | <0% | ||||
| Longueil(Agglom. de)(LON) | 478 | 281’526 | 71’984 | 21’200 | 23’074 |
| 25.6% | 7.53% | 8.20% | |||
| 188’342 | 165’268 | ||||
| 66.9% | 58.7% | ||||
| Maskoutains (Les)(MAS) | 98.5 | 43’225 | 67’265 | 19’122 | 101 |
| >100% | 44.2% | 0.02% | |||
| -43’162 | -43’264 | ||||
| <0% | <0% | ||||
| Marguerite-D’Youville (MYO) | 88.8 | 16’496 | 21’761 | 3’907 | 3’496 |
| >100% | 23.7% | 21.2% | |||
| -9’172 | -12’668 | ||||
| <0% | <0% | ||||
| Pierre-De Saurel (PDS) | 57.0 | 16’496 | 38’359 | 6’366 | 4’127 |
| >100% | 38.6% | 25.0% | |||
| -28’22as9 | -32’356 | ||||
| <0% | <0% | ||||
| Roussillon (ROS) | 203 | 91’248 | 49’219 | 13’333 | 13’437 |
| 53.9% | 14.6% | 14.7% | |||
| 28’696 | 15’259 | ||||
| 31.4% | 16.7% | ||||
| Rouville (ROV) | 41.4 | 16’496 | 37’860 | 6’727 | 1’819 |
| >100% | 40.8% | 11.0% | |||
| -28’091 | -29’910 | ||||
| <0% | <0% | ||||
| Vallée du Richelieu (La) (VRI) | 146 | 43’225 | 42’088 | 10’562 | 4’074 |
| 97.4% | 24.4% | 9.42% | |||
| -9’426 | -13’499 | ||||
| <0% | <0% | ||||
| Vaudreuil-Soulange (VSO) | 178 | 91’248 | 76’488 | 21’623 | 17’290 |
| 83.8% | 23.7% | 19.0% | |||
| -6’862 | -24’153 | ||||
| <0% | <0% | ||||
Table 4.
Results of energy losses of transport level 2 for scenarios A, C and D.
| Parameters | ENERGY | ||
| Transport 2 (MJ) | |||
| (% of potential) | |||
| scenario A | scenario C | scenario D | |
| centralised to MAS | centralised to ROS | mixed MAS and ROS | |
| Total losses transp level 2 (MJ/week) | 90’317 | 60’117 | 44’519 |
| % of potential | 13.4% | 8.94% | 6.62% |
| Fuel consumption (l/week) | 2’120 | 1’411 | 1’045 |
| GHG emissions (t CO2/year) | 298 | 198 | 147 |
Disclaimer/Publisher’s Note: The statements, opinions and data contained in all publications are solely those of the individual author(s) and contributor(s) and not of MDPI and/or the editor(s). MDPI and/or the editor(s) disclaim responsibility for any injury to people or property resulting from any ideas, methods, instructions or products referred to in the content. |
© 2025 by the authors. Licensee MDPI, Basel, Switzerland. This article is an open access article distributed under the terms and conditions of the Creative Commons Attribution (CC BY) license (https://creativecommons.org/licenses/by/4.0/).
Copyright: This open access article is published under a Creative Commons CC BY 4.0 license, which permit the free download, distribution, and reuse, provided that the author and preprint are cited in any reuse.


