
Submitted:
16 October 2025
Posted:
17 October 2025
You are already at the latest version
Abstract
The spatial configuration of Waste-to-Energy (WtE) infrastructure plays a decisive role in determining the environmental and economic performance of municipal solid waste (MSW) management systems. This study applies a Life Cycle Assessment (LCA) methodology to evaluate the environmental implications of centralized and decentralized siting strategies for Refuse-Derived Fuel (RDF) utilization in Greece. Two alternative scenarios were modeled: (i) a centralized approach based on six large WtE plants as proposed by the Greek Ministry of Environment and Energy (gr. YPEN), and (ii) a decentralized approach involving smaller, regionally distributed units located closer to Recycling and Recovery Facilities (RRFs). Using the SimaPro software and the CML/ReCiPe 2016 methodologies, environmental impacts were quantified across categories including global warming potential, acidification, eutrophication, and particulate matter formation. The results indicate that the decentralized scenario yields substantial environmental advantages, with reductions ranging from 33% to 45% across all impact categories and a 35% decrease in CO₂-equivalent (CO2e) emissions compared to the centralized scenario. Economic analysis confirms these findings, showing a 31% reduction in total transport and emissions-related costs due primarily to minimized long-distance and maritime transport. The study concludes that decentralized RDF-to-energy systems offer a more balanced and sustainable pathway, enhancing operational flexibility, lowering environmental burdens, and improving social acceptance. These results underscore the importance of integrating spatial and logistical parameters in national WtE planning to align with EU waste hierarchy principles and circular economy objectives.
Keywords:
waste management
; RDF
; Greece
; carbon footprint
; energy plants
1. Introduction
Municipal solid waste (MSW) management remains among the most pressing environmental, economic and social challenges in Europe, reflecting the combined pressures of increasing urbanization, changing consumption patterns, and the need to align with climate-neutrality objectives [1]. The European Union (EU) has established an ambitious policy framework aimed at transforming waste from a liability into a valuable source of raw materials and energy [2,3]. Central to this framework is the implementation of the waste hierarchy, which prioritizes prevention and minimization at source, followed by reuse, recycling, composting or anaerobic digestion, recovery (including energy recovery through waste-to-energy or RDF systems), and finally disposal (landfilling or incineration without energy recovery) [4,5]. Recent analyses demonstrate that the integration of energy recovery technologies, when applied within a circular economy approach, can significantly contribute to decarbonization efforts, resource efficiency, and reduced environmental impacts [4,6]. However, disparities persist among Member States in achieving recycling and recovery targets, indicating the need for further innovation, decentralized waste treatment systems, and harmonized policy implementation [7].
The EU’s legal framework for MSW is built primarily around the Waste Framework Directive (2008/98/EC, revised), the Landfill Directive (1999/31/EC, amended 2018/850), and specific directives on packaging waste, biodegradable waste, extended producer responsibility (EPR), and separate collection. Under these, legally binding targets compel Member States to increase recycling / preparing for reuse rates of municipal waste progressively: 55% by 2025, 60% by 2030, and 65% by 2035. Simultaneously, the share of MSW sent to landfill is to be reduced to no more than 10% by 2035. Member States, like Greece, with historically high landfill rates in 2013 may have temporary derogations, but the trend is clear.
Under the revised Landfill Directive, limitations are also set on the landfilling of biodegradable waste (eg. maximum percentages relative to baseline years) to mitigate methane emissions and leachate concerns. Legislative push is also strong for separate collection of organics, textiles, packaging materials, and e-waste. The Packaging & Packaging Waste Regulation has introduced measures to improve the recyclability of packaging, set reuse and refill targets, require recycled content, and reduce overpackaging [8].
Figure 1 shows that the EU has made respectable progress, although not uniformly across Member States. As of 2022, the average MSW recycling rate in EU-27 is approximately 48.6%, just under the 50% mark. For packaging waste, the EU average recycling rate is around 64%, although differing by material: paper/cardboard and glass are generally high, whereas plastics lag behind [10]. Many Member States are “at risk” of missing the 2025 targets: combinations of the municipal waste recycling/preparing for reuse target (55 %) and the packaging waste target (65 %) are not yet assured in several states. Countries at particular risk include those with low infrastructure, high reliance on landfill, or challenges in separate collection systems [11]. Trends in waste generation also pose challenges: projections indicate that total municipal waste generation may increase unless changes in consumption, waste prevention and circular product design are implemented. Even achieving the 2025-2030 recycling targets might not be sufficient to reduce residual waste (which remains after recycling & reuse) to the levels desired, unless waste generation is also curbed.
Across the European Union, MSW management follows a harmonized framework structured around the waste hierarchy. Thus, waste streams that cannot be feasibly recycled or reused are directed towards recovery pathways, where they are treated, sorted, and processed into, amongst other streams, alternative fuels. This process represents the final stage of material valorization before final disposal. In practice, mixed residual waste undergoes mechanical and biological treatment (MBT) or similar pre-treatment processes in Resource Recovery Facilities (RRFs) that separate recyclable fractions, remove inert and non-combustible materials, and refine the remaining combustible fraction into Refuse Derived Fuel (RDF). RDF is therefore the product of a systematic European waste management scheme that aims to maximize material recovery while minimizing landfill dependency and greenhouse gas emissions. The common pathway can be summarized as: separate collection → recycling and composting of recoverable materials → mechanical–biological or mechanical–thermal treatment of residual waste → RDF production → energy recovery through Waste-to-Energy (WtE) plants or co-incineration in industrial facilities (Figure 1).
RDF and WtE technologies constitute a cornerstone of the European Union’s strategy for managing residual waste that cannot be feasibly reintroduced into material recycling loops [1,4]. RDF enables the recovery of embedded energy from non-recyclable fractions of MSW, provided that the fuel produced meets specific standards for calorific value, moisture, and contaminant levels [12,13]. Once refined, RDF can be valorized through dedicated WtE plants or co-incinerated in energy-intensive industrial processes such as cement kilns, where it substitutes fossil fuels and supports industrial decarbonization efforts [14,15]. These applications are generally recognized as environmentally preferable to landfilling, due to their potential for partial greenhouse gas mitigation, controlled emissions, and reduced leachate generation, particularly when high-efficiency energy recovery systems and advanced flue-gas cleaning technologies are deployed [4,16]. The energy recovered from WtE operations can be converted into electricity and thermal energy for district heating/cooling networks, thereby enhancing local energy security and supporting the EU’s transition toward a low-carbon, circular economy [6].
However, the overall environmental and economic performance of the RDF and WtE chain depends critically on upstream processes, notably the efficiency of waste collection systems, the degree of source separation, and the effectiveness of sorting and preprocessing technologies [17,18]. Among these factors, transportation logistics exert a decisive influence: extended hauling distances for either unsorted MSW or pre-processed RDF can substantially increase greenhouse gas (GHG) emissions, thereby offsetting part of the environmental benefits achieved through energy recovery [18,19]. While large-scale, centralized WtE facilities generally achieve higher thermal efficiencies [20,21], their operation often entails long-distance waste transport and higher associated fuel, GHG emissions (Scope 2 emissions) and infrastructure costs. Conversely, decentralized or regionally distributed treatment facilities, strategically sited near the RRFs can minimize transport-related GHG emissions and improve integration with local recycling networks. Moreover, recent technological developments lead to reduction of investment costs per unit of capacity, and full compliance with emission performance of smaller decentralized WtE plants. This has been achieved through continuous technological progress in modular gasification, small-scale incineration, and advanced emission control systems, advancements that have mitigated older limitations traditionally associated with smaller WtE plants [19].
Although large centralized WtE facilities are often assumed to yield superior thermal efficiency, evidence suggests that small-scale or modular systems, when properly engineered, can approach comparable performance while achieving lower local environmental impact and full compliance with emissions standards. In real-world application, the case study in Northern Italy finds that a well-operated WtE plant’s contribution to local air pollution is orders of magnitude lower than major urban sources like road traffic, indicating that even “smaller scale” plants with proper controls can have negligible environmental burden [19]. Moreover, life-cycle assessments show that with optimal design (including heat recovery, emissions control, and possible carbon capture), even moderately scaled WtE systems can yield favorable climate outcomes [22].
Evidence from the literature indicates that transport distance is a decisive factor in determining the net environmental benefit of RDF utilization [23,24,25]. When distances become excessive, the incremental gains from improved plant efficiency may no longer compensate for the emissions associated with transportation and preprocessing [26,27]. Conversely, decentralized systems, when optimized for logistics and waste composition, may yield lower per-ton environmental burdens despite operating at smaller scales [28,29]. The optimal configuration for RDF and WtE therefore lies in balancing efficiency, logistics, and spatial distribution of energy recovery plants within each national or regional context [29]. This underscores that plant siting and transport optimization are key parameters in designing sustainable WtE systems aligned with the principle of proximity, the objectives and target of the circular economy and the European Green Deal [30].
Within this context, Member States face a strategic choice: pursue centralized large WtE/RDF hubs—concentrated capacity with longer transport routes—or adopt decentralized networks of smaller plants co-located with RDF preparation facilities (i.e. RRFs), characterized by shorter transport distances but more dispersed infrastructure [31]. Each choice carries inherent trade-offs. Centralized, larger WtE plants typically achieve higher thermal efficiencies and can justify the use of sophisticated emission control technologies [32]. However, they also concentrate waste transport flows, potentially increasing truck-kilometers and associated emissions [26]. Decentralized, smaller WtE variants, on the other hand, can reduce haulage distances and integrate more effectively with local recycling RRFs, often improving social acceptance and system resilience [29]. Nonetheless, they may face challenges such as reduced economies of scale and higher unit capital or operational expenditures although this is largely improved nowadays due to important technological advances and know-how during development of smaller WtE units. Therefore, assessing these trade-offs requires a life-cycle perspective that considers not only GHG emissions generated by the WtE plant but also Scope 2 emissions related to upstream collection, preprocessing, transport, and RDF production [27,30].
Given the above context, plant siting and transportation distances are not peripheral considerations but central determinants of environmental sustainability in RDF and WtE systems [33]. Their importance is underscored by the transport-related GHG emissions associated with heavy-duty vehicle (HDV) fleets—strongly influenced by fuel type, load factor, distance, and road conditions [26]—and by the energy demands of preprocessing operations such as sorting, drying, and shredding, which vary with waste composition, moisture content, and residual waste quality. The trade-off between economies of scale achieved in centralized WtE plants and the penalties of long transport distances and higher vehicle GHG emissions remains a key design challenge [31]. Moreover, the spatial distribution of infrastructure can influence social acceptance, local environmental impacts (noise, traffic, and emissions), and regional disparities in environmental burdens or costs. (Consequently, sustainability assessments that omit or oversimplify these spatial and logistical factors risk overestimating the environmental benefits of centralized WtE systems or failing to identify optimal configurations that minimize total life-cycle impacts.
The present study seeks to fill gaps in the current literature by performing a comparative LCA of centralized vs decentralized RDF/ WtE systems in the Greek national context, with full consideration of transport distances, preprocessing energy, vehicle types, plant efficiencies and scale. This paper, with its LCA scenarios, offers to quantify these trade-offs and to provide evidence to guide policy issues and related investments. It aims to help align national scale infrastructure development with EU circular economy and climate targets, while optimizing both environmental and social outcomes.
2. Materials and Methods
A systematic and structured methodology was applied in the present study to perform a comprehensive Life Cycle Assessment (LCA) of alternative Waste to Energy (WtE) plant siting strategies. The approach followed a sequential framework to ensure transparency, comparability, and reproducibility of results.
- In the first stage, the proposed management scenarios were defined, each incorporating WtE systems as key components for the valorization of residual municipal waste that could not be economically or technically recycled. The scenarios reflected different sizes of treatment infrastructure, plant location, and RDF transport distances, thus capturing a range of spatial and operational conditions.
- In the second stage, a detailed life cycle model was developed to represent the examined strategies by integrating all relevant processes, system boundaries, material and energy flows, and project phases.
The environmental performance of the proposed systems was quantified through multiple impact categories, focusing primarily on global warming potential (GWP), primary energy demand, air pollutant emissions, and resource depletion. To illustrate the applicability and adaptability of the proposed framework, the methodology was implemented in the Greek context, where integrated and sustainable waste management solutions are increasingly required to meet ambitious environmental and circular economy targets.
2.1. Case Study Greece
Greece presents a compelling case for evaluating integrated solid waste management (ISWM) systems incorporating WtE technologies due to its persistent reliance on landfilling, regional disparities in waste infrastructure, and the national drive to meet EU environmental targets [34]. Historically, the country has faced significant challenges in diverting MSW from landfills, with over 75% of waste still disposed of through landfilling as of 2022 [35]. Despite gradual improvements in recycling and composting, Greece remains among the lowest performers in waste recovery rates within the European Union and still suffers from the enforcement of large penalties from the European Commission for non-performance.
The national waste generation rate averages 1.45 kg/capita/day, corresponding to approximately 5.4 million tons of MSW annually [36]. Waste generation is highest in the Attica region—which includes the metropolitan area of Athens—and in Central Macedonia, which together account for nearly half of the total waste produced nationwide [37]. The composition of MSW in Greece is dominated by biodegradable organic waste (≈ 44%), followed by paper and cardboard (20%), plastics (17%), glass (5%), metals (3%), and other residues (11%) [38]. The high organic and plastic fractions indicate strong potential for both biological and thermal recovery pathways, especially in the non-recycled residues of the RRFs.
In alignment with the National Waste Management Plan (NWMP 2020–2030) and the Circular Economy Action Plan, Greece aims to reduce landfilling to below 10% of total waste by 2030 and to achieve 55% recycling of municipal waste by 2025, in compliance with EU Directive 2018/851. To achieve these objectives, the Greek government has introduced new waste valorization infrastructure through public–private partnerships (PPPs) and EU Cohesion Fund-supported projects, including the construction of MBT plants, anaerobic digestion (AD) units, and thermal valorization facilities (WtE plants) [39].
However, current energy and waste management frameworks remain constrained by high dependence on imported fossil fuels and uneven regional infrastructure. Approximately 65% of the country’s electricity is still generated from natural gas and petroleum derivatives, while renewable sources—mainly wind and solar—account for the remaining 35% [40]. Although Greece has made substantial progress in renewables deployment, seasonal demand fluctuations and grid limitations create opportunities for WtE plants to provide stable, dispatchable energy while simultaneously diverting waste from landfills.
Recent environmental and political developments have accelerated national discussions on WtE deployment. The Integrated Waste Management Plan for Attica (2023) foresees the establishment of a large-scale WtE plant with a processing capacity of approximately 350,000 tons/year, intended to serve as the final treatment option for residual waste following separation and recycling. Parallel projects have been proposed for Central Macedonia and Western Greece, focusing on RDF and SRF (Solid Recovered Fuel) utilization in co-processing facilities or dedicated incineration units. Such initiatives aim to reduce the significant volume of RDF currently transported to cement kilns or exported abroad, which contributes to high transport-related emissions and logistical costs.
The waste composition and quantities for Greece are summarized in Table 1, illustrating the predominance of organics and recyclable materials within the total waste stream.
The existing waste management model in Greece (business-as-usual, BAU scenario) largely consists of mixed-waste collection followed by landfill disposal, with limited pre-treatment or energy recovery. There are several MBT or waste treatment units in Greece, some operational, some under construction, that produce limited RDF/SRF streams. However, none of them includes integrated energy recovery, and the majority of the RDF/SRF generated is co-incinerated in cement kilns or exported. Current MBT capacity (≈ 0.8 million t/year) covers only about 30% of the target set in the National Waste Management Plan [41]. This results in increased greenhouse gas (GHG) emissions from transportation and underutilization of local energy potential.
According to the European Environment Agency (EEA, 2023), the waste sector in Greece contributes approximately 2.8 MtCO₂ -eq annually, representing about 3.5% of total national emissions. Most of these GHG emissions originate from methane released by unmanaged or semi-controlled landfills. Implementation of advanced WtE systems—particularly when integrated with pre-sorting, material recovery, and AD units—can potentially reduce GHG emissions by 40–60% relative to baseline scenarios, while generating renewable energy from the biogenic fraction of RDF.
Given its geographical configuration, Greece also faces unique logistical challenges in waste transportation. Many of its islands and remote mainland areas experience high per-unit transport costs for RDF and SRF, often exceeding the environmental benefits of centralized processing. The spatial distribution of WTE plants, therefore, is a key factor influencing both environmental and economic performance.
The case of Greece exemplifies a Southern European context where regulatory reforms, circular economy objectives, and decarbonization commitments intersect with persistent operational inefficiencies and infrastructural gaps. Applying the proposed ISWM–LCA framework allows for a comprehensive evaluation of how the deployment and spatial optimization of WtE facilities can enhance national resource efficiency, reduce landfill dependency, and align Greece with the EU’s Green Deal objectives for 2050.
2.2. Waste Management Scenarios
In the context of this study, an attempt is made, using the Life Cycle Analysis methodology, to compare a scenario, which concerns the management of RDF in large WtE plants, with an alternative, decentralized management scenario in smaller, locally implemented WtE plants.
The comparative evaluation of these two scenarios is based on specific parameters and methodological assumptions that define the framework of the analysis. The central parameter of comparison is the minimization of transport costs and related GHG emissions, thus considering impacts at both an economic and environmental level. For this purpose, the approach of creating smaller geographical coverage areas was adopted. With this approach, the residual RDF / SRF and MSW streams are guided to smaller, evenly distributed WtE plants located close to the residual wastes Recovery-Recycling Facilities (RRFs), drastically limiting e road and sea transport. This choice is in line with international good practices, according to which decentralized location follows the principle of proximity (proximity principle) and leads to lower GHG (CO₂eq) emissions and a smaller overall environmental and spatial footprint.
A second critical comparison parameter is the possibility of modular development of WtE plants. Decentralized units are designed based on a specific capacity that covers local needs, with the possibility of future expansion in case of an increase in waste quantities or diversification of energy requirements. In this way, greater flexibility is achieved in the selection and integration of technologies, as well as better adaptation to changes in the institutional framework or the energy market. In contrast to large WtE plants, which require a much higher initial capital expenditure (CAPEX) and a long-term amortization horizon, smaller units have a smaller spatial footprint and offer the possibility of gradual investments with reduced financial and economic risk. Moreover, centralized, large WtE plants require long-term contracts of RDF to reduce their financial risks, a practice that seriously undermines recovery of materials (especially the plastic fraction) and, hence, contradicts with the targets of the EU circular economy.
Finally, a critical assumption is the stability of the RDF and residue flows resulting from the existing (WtE) and future WtEs. The analysis considers that these quantities are sufficient to supply both the central and decentralized units, with different locations and combinations. At the same time, the hierarchical priority given to recycling is considered, so that WtE units operate exclusively as a complementary solution for managing the constantly decreasing quantities, due to increase in recycled materials, of non-recyclable residues. Overall, the above parameters and assumptions define the methodological framework of the analysis, enabling a comparative assessment between centralized and decentralized models of WtE plants development in terms of cost, environmental footprint, and operational flexibility.
Centralized scenario
The centralized scenario that is also proposed by the Greek Ministry of Environment and Energy (gr. YPEN) includes six WtE plants. Table 2 presents the spatial characteristics of the centralized scenario in terms of regional unit, service area and capacity.
Decentralized scenario
In the context of the comparative assessment, the possibility of decentralized development of WtE plants is examined, in comparison with the centralized scenario which foresees fewer but larger centralized facilities. The analysis that follows presents variations in management units 1.2, 3.2 and 4, with the aim to reduce transportation requirements, achieve better geographical distribution of capacities and limit the overall environmental consequences (carbon footprint).
In the case of MU1.2, the centralized scenario foresees the development of a single large unit in the Regional Unit of Kozani, with a total capacity of 309,000 tons of RDF per year. The alternative scenario proposes the development of three smaller units: one in the Western Sector of Western Macedonia with a capacity of 225,711 tons per year, one in Larissa with a capacity of 44,839 tons and one in Epirus with a capacity of 38,599 tons. In this way, better geographical coverage is met and a significant reduction in the need for RDF transport over long distances is achieved.
Accordingly, in MU3.2, the centralized scenario includes the construction of a central unit in Attica, with a capacity of 215,000 tons per year. The alternative scenario proposes the development of two units: one in Attica with a capacity of 189,086 tons per year, which also serves the Cyclades (Andros, Tinos, Syros, Mykonos, Paros, Naxos and Milos), and one in Lesvos with a capacity of 13,657 tons, which covers the needs of Lesvos and Chios. This option significantly reduces the cost and environmental burden of maritime transport.
In MU4, the centralized scenario foresees a central unit in Heraklion with a capacity of 105,000 tons per year. The alternative scenario is differentiated by the creation of two smaller facilities: one in Heraklion with a capacity of 82,590 tons per year, serving Santorini, Chania, Amari, Heraklion, Sitia and Hersonissos, and one in Rhodes with a capacity of 34,477 tons, covering the islands of Rhodes, Patmos, Leros, Kalymnos, Kos and Karpathos. This proposal allows for better coverage of the island regions and limits the extensive and costly maritime transport.
Overall, the capacity of the alternative scenario remains essentially the same as that of the centralized scenario (approximately 1,052,000 tons per year) as reflected in the following Table (Table 3). The main differentiation is found in the decentralized location of the units, which leads to a reduction in long-distance transport and consequently to a reduction in the overall transport cost and environmental footprint.
2.3. Life Cycle Assessment
2.3.1. Goal and Scope Definition
The goal of this study is to evaluate the environmental footprint of an alternative element of the MSW management strategies, namely the energy exploitation of the produced RDF stream, through an LCA approach. The analysis compares a centralized scenario with an alternative scenario involving a higher number of smaller, decentralized WtE plants.
The assessment was carried out using the SimaPro software package, which enables quantification and comparison of environmental impacts across complex waste management systems. The LCA methodology follows the international standards ISO 14040 and ISO 14044, ensuring methodological consistency, transparency, and comparability with similar studies.
The functional unit (FU) is defined as the total annual transport of residual waste at the national level (t/year), representing the overall quantity of material transferred from Recovery and Recycling Facilities (RRFs) to WtE plants. The system boundaries extend from the exit point of residual streams at RRFs to their delivery at WtE plants, covering both road and maritime transport.
The scope includes all processes related to the transport of RDF, including fuel consumption, transport work (tkm), and associated emissions of GHG emissions and air pollutants.
2.3.2. Life Cycle Inventory (LCI)
The LCI phase involved the collection and organization of detailed quantitative data regarding RDF transport flows under each scenario. For each management region, data were compiled on:
- RDF quantities (t/year),
- Transport distances (km),
- Mode of transport (road or maritime), and
- The resulting transport work (tkm) for each route.
Transport distances were classified as road or sea, reflecting the differences in energy consumption, emission factors, and operational costs associated with each mode.
Road transport was modeled using a 16–32-ton Euro 4 truck, while maritime transport was modeled using ferries, based on actual shipping routes used by national operators (coastline ferries).
The Ecoinvent database (version xx) was employed to model background processes, providing internationally recognized energy, fuel, and emission factors.
All collected data were organized into two comprehensive LCI datasets representing the centralized and decentralized scenarios (Table 4).
2.3.3. Life Cycle Impact Assessment
This phase was conducted in SimaPro, following a problem-oriented (midpoint) approach based on the ReCiPe 2016 Midpoint (H) methodology to quantify the environmental impacts associated with each scenario. The assessment covered all relevant midpoint impact categories to ensure a comprehensive evaluation of environmental performance, namely:
- Global Warming Potential (GWP, 100-year, kg CO₂-eq)
- Stratospheric Ozone Depletion (ODP, kg CFC-11-eq)
- Ionizing Radiation (IR, kBq Co-60-eq)
- Ozone Formation, Human Health (kg NOₓ-eq)
- Ozone Formation, Terrestrial Ecosystems (kg NOₓ-eq)
- Fine Particulate Matter Formation (kg PM₂.₅-eq)
- Terrestrial Acidification (kg SO₂-eq)
- Freshwater Eutrophication (kg P-eq)
- Marine Eutrophication (kg N-eq)
- Terrestrial Ecotoxicity (kg 1,4-DCB-eq)
- Freshwater Ecotoxicity (kg 1,4-DCB-eq)
- Marine Ecotoxicity (kg 1,4-DCB-eq)
- Human Carcinogenic Toxicity (kg 1,4-DCB-eq)
- Human Non-Carcinogenic Toxicity (kg 1,4-DCB-eq)
- Land Use (m²·year crop-eq)
- Mineral Resource Scarcity (kg Cu-eq)
- Fossil Resource Scarcity (kg oil-eq)
- Water Consumption (m³)
Characterization factors and equivalence units were applied according to ReCiPe 2016 Midpoint (H) to ensure methodological consistency and comparability with established waste management LCAs. The results highlight the relative environmental performance of each management scenario, demonstrating the influence of transport distances, transport mode, and decentralization level on greenhouse gas emissions, energy efficiency, and broader environmental impacts within the national waste management system.
3. Results and Discussion
3.1. Environmental Assessment
The application of the LCA methodology to the two approaches allowed for the comparative assessment of their environmental impacts across a wide range of categories, as defined by the ReCiPe Midpoint method. The results are presented in relative indices, where the centralized scenario is set as the base (100), and the values of the alternative scenario with decentralized siting are expressed proportionally (Figure 2). In this way, the relative improvement or burden resulting from the adoption of the alternative approach is clearly recorded.
Figure 3.
Comparative assessment of environmental impacts by category (ReCiPe Midpoint) for the compared scenarios.
Figure 3.
Comparative assessment of environmental impacts by category (ReCiPe Midpoint) for the compared scenarios.
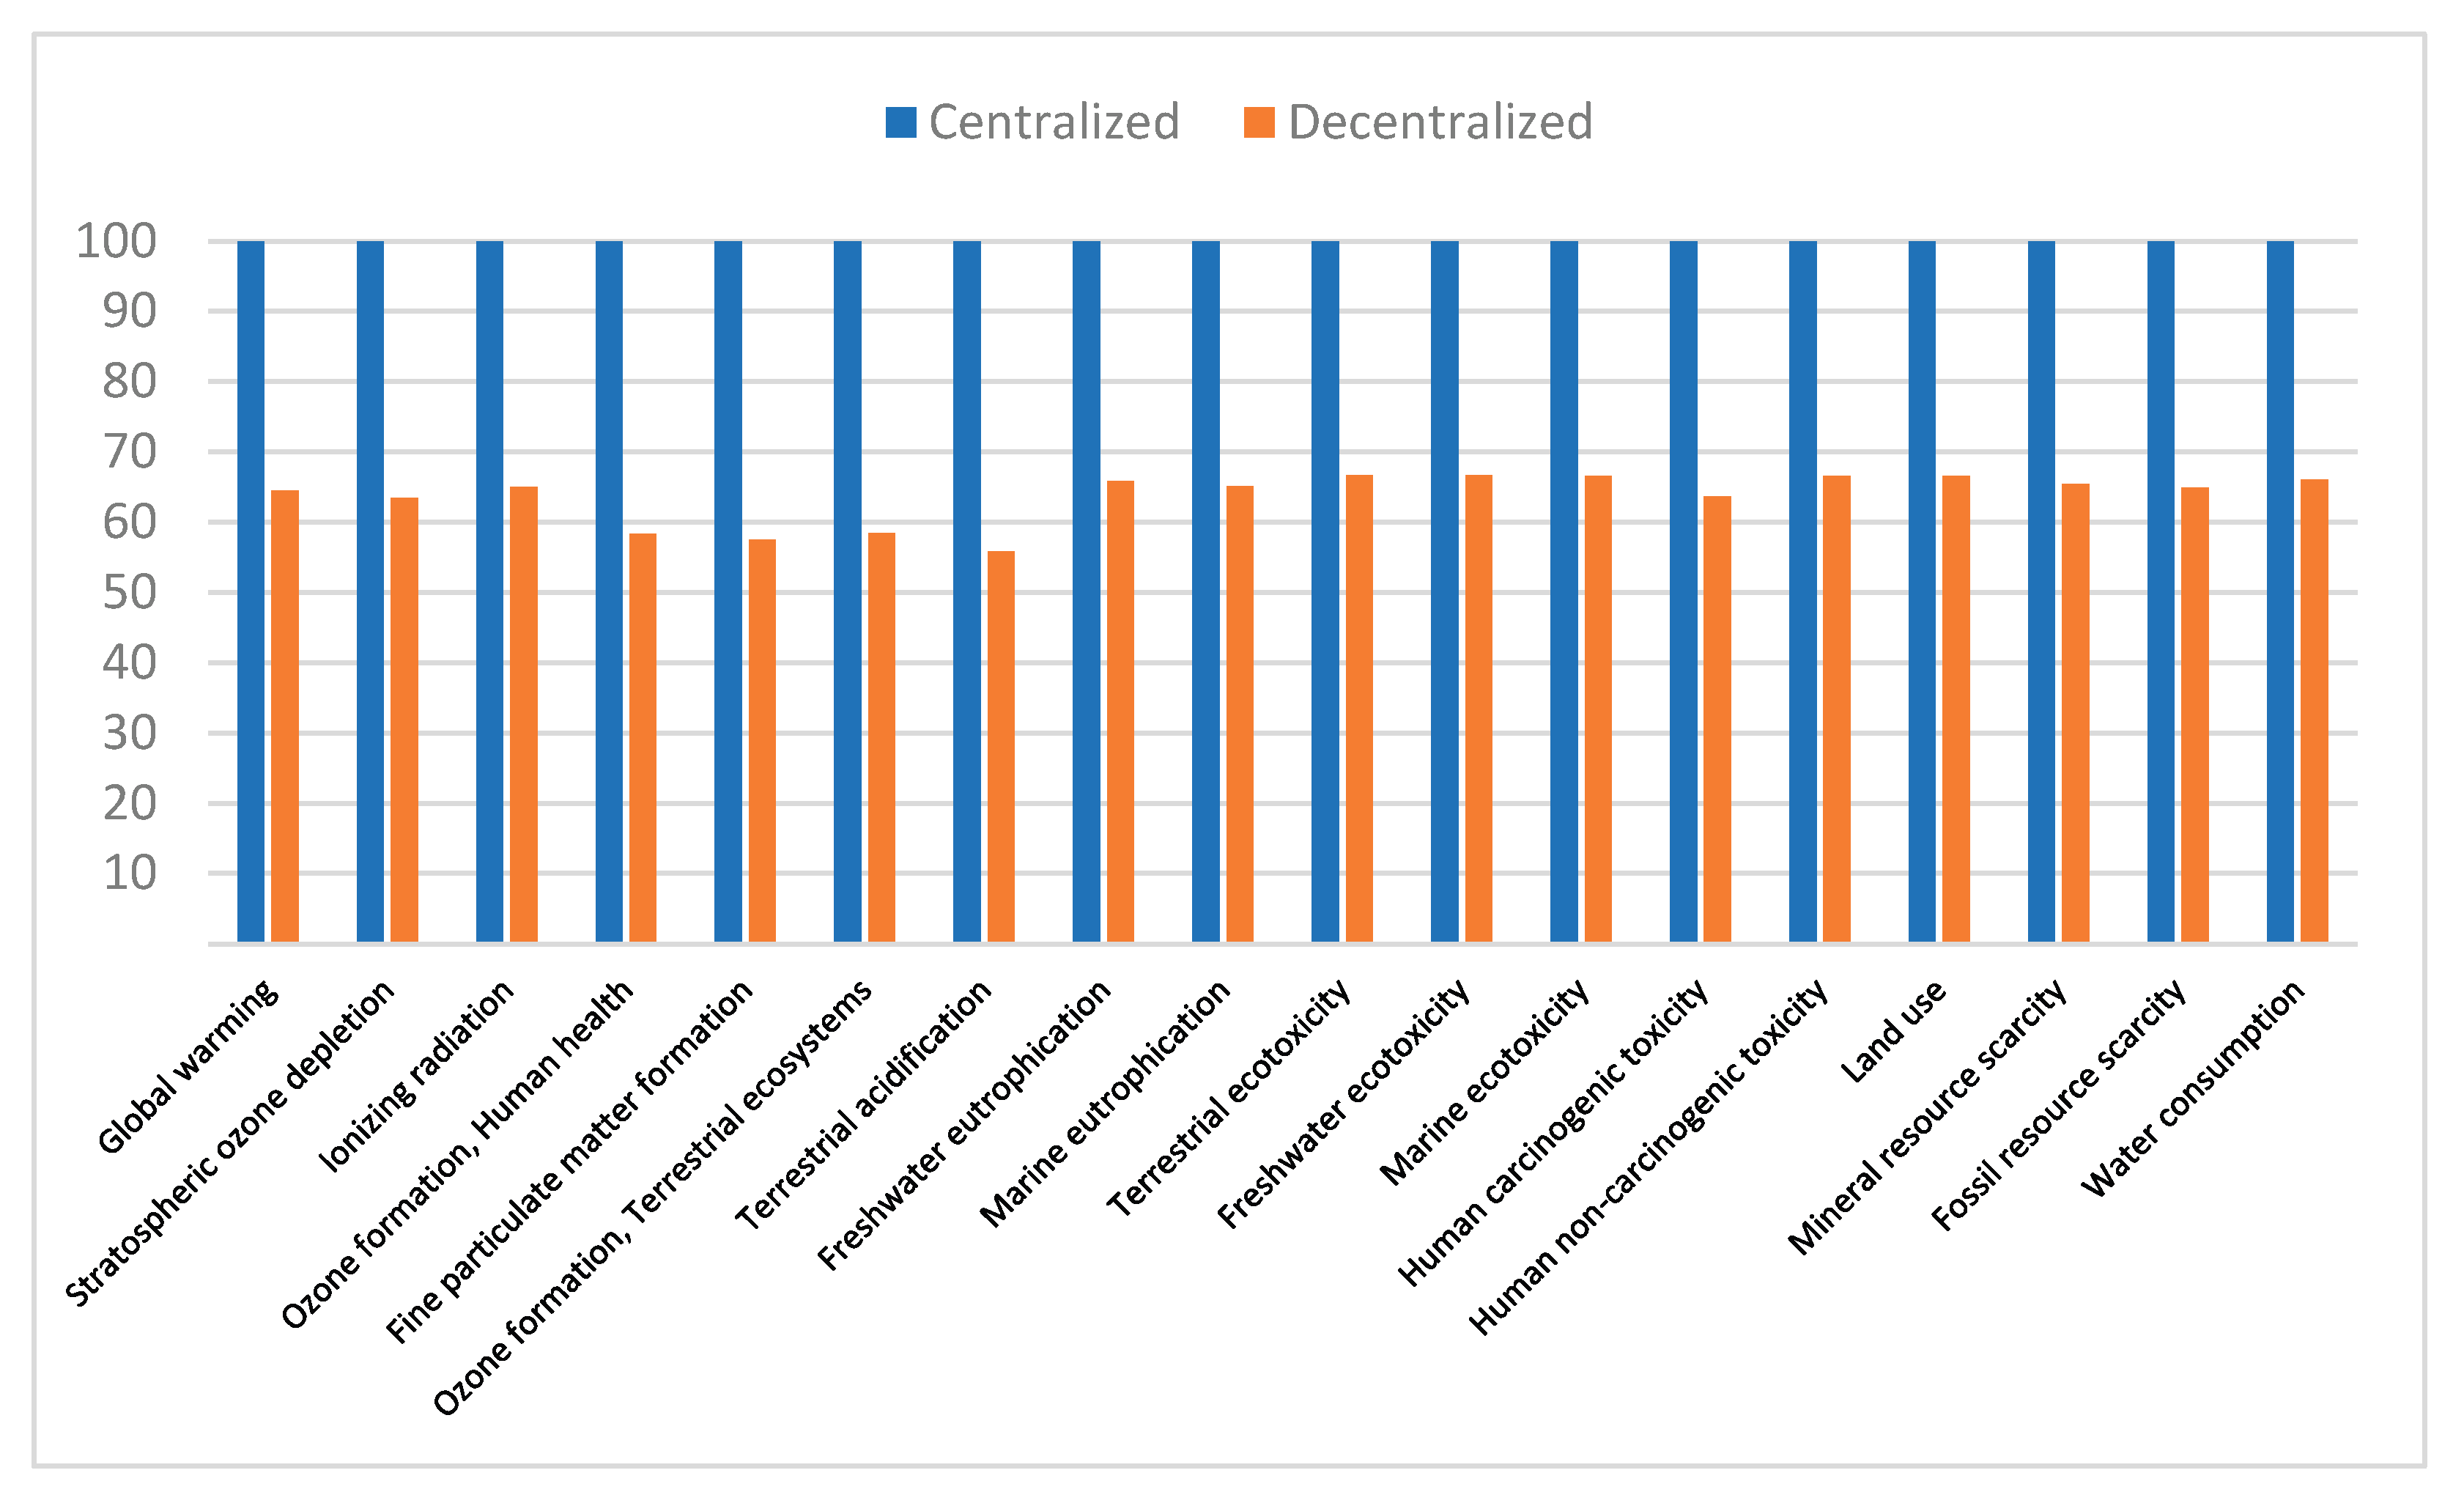
The analysis of the results shows that the alternative scenario with decentralized WtE plants presents environmental superiority over the centralized one. In all impact categories of the ReCiPe Midpoint method, the alternative scenario displays lower values, with improvements ranging from 33% to 45%. The most significant improvement is recorded in the planet’s Global Warming Potential - Global Warming up Potential (CO₂eq emissions), where approximately 35% reduction is achieved for the decentralized scenario. Similarly, in the categories directly linked to transport, such as acidification (Terrestrial acidification) and the formation of suspended particles (Fine particulate matter formation), the reduction exceeds 40%, which demonstrates the role of decentralized siting of WtE plants and the reduction of long-distance maritime transport and road haulage. In secondary categories, such as resource consumption (minerals and fuels) and toxicities (anthropogenic and ecotoxicities), the reduction ranges between 33–37%, an element that reinforces the overall environmental superiority of the decentralized scenario.
The most pronounced reduction occurs in Global Warming Potential (GWP), where the decentralized configuration achieves a 35 % decrease in CO₂-eq emissions relative to the centralized scenario. More specifically, the emissions results for each scenario are presented in the following tables (Table 5 and Table 6).
The total emissions for the centralized scenario amount to 2.22×10⁷ kg CO ₂ eq. The picture is highly concentrated, as only two management plants, MU1.2 (36.8%) and MU3.1 (30.4%), cover almost 67% of total emissions. The remaining plants exhibit a clearly smaller contribution: MU2 participates with 11.1%, MU3.2 with 9.6%, MU4 with 8.6%, while MU1.1 is limited to only 3.4%. This shows that large centralized WtE plants indirectly create a high environmental footprint due to extensive transport (Scope 2 emissions).
In the alternative scenario with decentralized location, emissions are reduced to 1.43×10⁷ kg CO₂ eq, i.e. approximately 35% lower. The picture is more decentralized, as MU1.2 has been split into three sub-units (1.2a, 1.2b, 1.2c), with a corresponding redistribution of emissions: 9.0%, 2.7% and 0.5% respectively. The largest contribution remains in MU3.1 (47.2%), however the remaining units now have smaller values and a more balanced participation. Also, the new units in Heraklion and Rhodes contribute to the reduction of long-distance maritime transport, with small but significant percentage contributions (0.7–6.6%).
Thus, the decline in Global Warming Potential for the decentralized scenario results primarily from the substantial reduction in average transport distances—as long-haul road and maritime routes to six large facilities are replaced by shorter, intra-regional transfers to multiple smaller WtE units. Because fuel combustion in heavy-duty vehicles dominates the GHG profile of RDF logistics, lower diesel consumption directly translates into lower CO₂, CH₄, and N₂O emissions. Comparable patterns were observed by Lombardi et al. [32] in their spatial LCA of RDF transport in Italy, where optimizing plant siting reduced total GWP by 30–40 %. Similarly, Ding et al., demonstrated that integrating GIS-based distance optimization into WtE systems in China led to a 32 % reduction in total GHG emissions. The results of this study therefore confirm that spatial optimization and transport minimization can rival technological upgrades in terms of emission savings. Furthermore, decentralization slightly enhances the net energy balance by displacing more diesel consumption with recovered energy, a mechanism also discussed by Eriksson & Finnveden [42] in Scandinavian WtE systems.
In the Acidification Potential (AP) category, the decentralized model achieves the largest relative reduction, exceeding 40 %. This improvement is mainly attributed to the decline in NOₓ and SO₂ emissions from diesel combustion in both trucks and ships. Maritime freight, which features higher sulfur content and emission factors per tonne-kilometre (tkm), exerts a disproportionate effect in the centralized configuration. By reducing the share of long maritime routes, the decentralized option yields a significant decrease in acidifying emissions. Similar findings were reported by Liao N et al. (2024), [43] who showed that optimizing waste collection and transport routes could lower acidification impacts by up to 30 %. Likewise, Dong et al. (2018) [44] found that transport distance was a key determinant of SO₂- and NOₓ-related acidification potential in comparative LCAs of gasification and incineration systems in Finland, France, and China. These consistencies strengthen the conclusion that logistical distance rather than process technology often governs acidification burdens in national-scale waste management systems.
The Particulate Matter Formation (PMF) category exhibits a similar downward trend, with reductions of approximately 40–42 % under the decentralized configuration. Diesel combustion during road and ferry transport contributes significantly to PM₁₀ and PM₂.₅ precursor emissions, particularly from heavy-duty vehicles and auxiliary engines at ports. By shortening travel distances and dispersing waste flows across several routes, decentralization not only reduces total emissions but also mitigates localized exposure hotspots around main transport corridors. Comparable evidence can be found in El-Fadel et al. [45], who reported that optimizing waste transfer routes in Lebanon reduced PM emissions by up to 45 %, and in Ding et al. [46] whose GIS-integrated LCA of waste collection in urban China demonstrated that PM formation was the impact category most sensitive to route length and vehicle efficiency. The present results therefore corroborate the broader consensus that transport optimization provides major co-benefits for air-quality and health-related indicators [47].
The reduction in Eutrophication Potential (EP) (≈ 33–36 %) is smaller yet still substantial. The main drivers are lower NOₓ emissions from vehicle exhaust, which contribute to nutrient enrichment through atmospheric deposition. Although the WtE processes themselves release nitrogen compounds, their relative contribution is minor compared with that of transport. These results are consistent with Dong et al. (2018) and Kalverkamp et al. (2023), who observed that reducing transport distances in RDF systems by 25–50 % produced comparable decreases in eutrophication potential. Thus, the findings reaffirm the sensitivity of EP to airborne emission sources linked to logistics, rather than to plant-level performance.
The consistent improvement across all midpoint categories demonstrates that transport work (tkm) is a first-order determinant of environmental performance in national RDF management schemes. Although smaller WtE plants may experience marginal efficiency losses or higher capital costs, these are more than offset by logistics-related GHG emissions savings, echoing conclusions from Lombardi et al. (2020) and Maalouf et al. (2022). In absolute terms, total GHG emissions in the decentralized configuration (≈ 1.43 × 10⁷ kg CO₂-eq) are about 35 % lower than in the centralized system (≈ 2.22 × 10⁷ kg CO₂-eq), highlighting the significance of spatial distribution for national mitigation strategies. From a policy standpoint, these results substantiate the EU Waste Framework Directive’s proximity principle, advocating for waste treatment “as close as possible” to its point of generation. They also align with the objectives of the EU Circular Economy Action Plan (2020) and Greece’s National Waste Management Plan 2020–2030, which emphasize regional equity, transport minimization, and integrated infrastructure planning. As highlighted by L. Pattouillard et al. (2018) [48], incorporating spatial LCA into decision-making enables policymakers to quantify the trade-offs between logistical efficiency and process scale, thereby supporting more resilient and sustainable waste-to-energy networks.
3.2. Cost Assessment
To calculate the total cost (transportation and pollutant costs), an analytical assessment of all parameters associated with RDF transport from RRFs to WtE plants was carried out. The methodology was based on the formulation of detailed fleet operation scenarios, which considered distances, transport time, loading and unloading times, as well as the number of required routes per year. The required number of vehicles and drivers was then calculated, based on the average efficiency, the daily frequency of routes and the permitted loading per vehicle.
In the next stage, the cost was divided into categories such as depreciation and fixed capital costs, fuel, staff salaries, insurance premiums, vehicle maintenance and other operating expenses. In this way, the total cost per route was determined and then expressed in €/ton RDF and €/kilometer, to enable comparative evaluation. The same methodology was applied for maritime transport, by incorporating the corresponding cost and GHG emissions parameters.
Furthermore, to fully assess the environmental burden, the economic model also introduces the cost of CO₂ pollutants, with a reference value of €65/ton of CO₂ emitted [49]. In this way, the final cost reflects not only the operating costs of transport but also the externalities associated with GHG emissions.
Finally, the transport load (cost per tonne-kilometre, tkm), which is considered the most reliable parameter as it is directly linked to both environmental and operational costs was estimated. Specifically, for road transport the cost was estimated at 0.20 €/ tkm, while for maritime transport at 800 €/route. These values were used for the comparison between the two scenarios.
The table below (Table 7) presents the total tonne-kilometers of the waste transport system for each scenario.
Based on the data above, the cost estimate for one year of operation is estimated (Table 8).
Table 7 shows that the alternative scenario with decentralized units presents significantly lower transport and GHG emissions costs compared to the centralized scenario. In road transport, a reduction of approximately 33% in tonne-kilometres is observed, which is reflected in lower costs for fuel, vehicles and personnel. The difference is even more pronounced in maritime transport, where the reduction in tonne-kilometres exceeds 50%, leading to a significant reduction in the corresponding cost. The lower transport activity is also reflected in the environmental cost, which is reduced by almost 33% in the alternative scenario. Combined, these differences lead to a total cost expressed at € 23,971,608 /year for the decentralized scenario, compared to € 34,462,521/year for the centralized scenario, i.e. approximately 31% lower. The results show that the rational geographical distribution of WtE plants decisively affects the economic and environmental balance of the transport system.

Table 9.
Carbon Price Sensitivity Analysis (€/tCO₂: 60–120).
| Scenario | Total Annual Cost (M€/y) | Specific Cost (€/t waste) |
|---|---|---|
| Centralized (60 €/tCO₂) | 34.35 | 32.65 |
| Centralized (120 €/tCO₂) | 35.68 | 33.92 |
| Decentralized (60 €/tCO₂) | 23.90 | 22.72 |
| Decentralized (120 €/tCO₂) | 24.76 | 23.53 |
A simple sensitivity analysis was performed to evaluate the effect of the carbon price on the total and specific management costs under the centralized and decentralized configurations. Varying the carbon price between €60 and €120 per ton of CO₂ resulted in only a marginal change in total system costs. For the centralized scenario, total annual costs increased from approximately €34.4 million to €35.7 million, while for the decentralized system they rose from €23.9 million to €24.8 million. On a specific cost basis, this corresponds to an increase of roughly €1.3 /t for the centralized option and €0.8 /t for the decentralized one. These results indicate that the comparative economic advantage of the decentralized configuration remains robust within plausible carbon price ranges, reflecting its lower emission intensity and more balanced cost structure.
3.3. Further Considerations
Centralized WtE plants present a range of challenges that must be carefully considered within the framework of strategic waste management planning. As also mentioned above, a fundamental issue concerns the long-term security of feedstock supply, particularly the availability of RDF and SRF over operational lifetimes of 20–25 years. Ensuring a consistent flow of secondary fuels requires the collection of waste from dispersed regions, often involving complex contractual arrangements among multiple municipal and private actors. This creates uncertainties regarding both the stability of supply quantities and the consistency of fuel quality (AEPY, 2022) [50]. As a result, the uninterrupted long-term availability of suitable feedstock constitutes a critical factor for the technical and economic viability of large WtE plants.
A second challenge lies in the interaction between large-scale WtE capacity and national recycling objectives. Large plants require a continuous input of combustible waste to operate efficiently, which can create an indirect disincentive for enhancing source separation, recycling, and material recovery. This approach is in direct conflict with the waste hierarchy, Figure 1,established by the EU Waste Framework Directive (Directive 2008/98/EC, as amended), which prioritizes waste prevention, reuse, and recycling above energy recovery. Experience from international examples such as Italy, the United Kingdom, and certain regions of Germany, indicates that over-reliance on large WtE infrastructure can, in some cases, hinder the progress of recycling and prevention initiatives by locking waste streams into long-term incineration contracts [51].
Financial considerations further complicate the feasibility of large WtE projects. These facilities are characterized by high capital expenditure (CAPEX) and significant upfront financial commitments, which increase exposure to market and regulatory risks. Concentrating investment in a small number of large installations reduces system flexibility and may impede future adaptation to evolving conditions. This is particularly relevant given the forthcoming inclusion of WtE facilities in the EU Emissions Trading System (ETS), expected from 2028 onwards. The incorporation of WtE plants into the ETS will necessitate additional significant investments for emissions monitoring, carbon accounting, and offset purchases, thereby increasing the overall operational costs and financial burden, especially for high-capacity plants with large combustion volumes.
Moreover, the operational costs of centralized WtE plants tend to escalate due to the extensive transportation of RDF and SRF required from wide geographical catchment areas. It is important to mention that extensive recycling rates in northern EU countries has led the Scandinavian and Netherlands large Wte Plants to import large quantities of RDF (notably from UK and Italy) to continue their operations.
The transport of high-volume, low-density materials such as waste fuels adds both economic and environmental pressure, contributing to increased fuel consumption and greenhouse gas (GHG) emissions along the entire supply chain.
Environmental concerns also represent a major area of scrutiny. Large WtE facilities function as point sources of emissions, necessitating stringent control and continuous monitoring of pollutants such as NOₓ, SO₂, particulate matter, and traces of heavy metals. Although modern flue gas cleaning systems and advanced emission control technologies have considerably improved environmental performance, the concentration of large combustion activities in a single site increases the localized environmental load, including cumulative air pollution and thermal effects. Additionally, the large-scale transportation of secondary fuels contributes to indirect emissions and extends the system’s overall environmental footprint.
The social dimension is equally significant. The siting of large WtE plants frequently encounters strong opposition from local communities, often related to concerns about pollution, odour, visual impact, and traffic load associated with the importation of waste from other regions. Public resistance has been documented in several proposed Greek projects, such as the case of Western Macedonia, where municipalities and civil society organizations expressed strong objections to regional waste incineration facilities. Recent unanimous opposition for the centralized scenario has been recorded amongst local authorities. Concentrating large-scale infrastructure in limited areas can thus lead to severe social conflicts that may delay or even prevent implementation [52]. These realities underscore the importance of exploring decentralized or modular alternatives, which can be better aligned with regional waste generation patterns and local acceptance.
In contrast to large, centralized facilities, smaller WtE plants offer several advantages. They can be developed in modular phases, enabling gradual implementation, reduced initial and future (inclusion of carbon capture systems) investment requirements, and shorter permitting and construction periods. This phased approach enhances flexibility, allowing plant design and capacity to adapt to changing waste generation trends, recycling progress, and evolving regulatory frameworks. Smaller-scale systems also lower financial risk by reducing techno-economic risks, distributing investment over time and allowing incremental adjustments in technology and capacity. In several EU countries, including France, Denmark and the Netherlands, this approach has facilitated the progressive integration of new technologies, such as advanced gasification and high-efficiency cogeneration, without locking systems into rigid long-term feedstock commitments.
In summary, although large-scale, centralized WtE facilities are often associated with favorable economies of scale and process optimization potential, their applicability in regions characterized by heterogeneous waste generation profiles and evolving recycling frameworks—such as Greece—should be critically assessed. Emerging evidence indicates that appropriately scaled, modular WtE configurations can exhibit comparable energy recovery performance, particularly when optimized for local waste characteristics and heat utilization opportunities. Furthermore, their distributed nature facilitates regulatory compliance and environmental licensing, as such systems can more readily align with regional air quality standards and public acceptance criteria. From a systems perspective, decentralized implementation enhances the adaptability of the national waste management network, supporting progressive integration with circular economy objectives while mitigating the environmental and financial risks typically associated with large-scale infrastructural lock-in.
4. Conclusions
The comparative analysis between the centralized and decentralized scenarios revealed substantial differences in both the environmental and economic footprint of the waste management system. The LCA methodology, in compliance with the international standards ISO 14040 and 14044, demonstrated that the decentralized approach leads to a significant reduction in GHG emissions (in CO₂eq), with percentages reaching approximately 35% compared to the scenario of central WtE plants as proposed by YPEN. At the same time, the categories of environmental impacts associated with transport, such as acidification and the production of suspended particles, record reductions of more than 40%, which are not reflected economically and socially in the present work.
GHG emissions showed that the alternative scenario has a total cost of € 23,971,608 /year for the alternative scenario, compared to € 34,462,521 /year in the scenario of the Ministry of Transport, i.e. a reduction of 31%. This difference is mainly due to the reduction in maritime transport, but also to the significant reduction in transport work on road routes.
Based on the above analysis, several key conclusions can be drawn. The implementation of Refuse-Derived Fuel (RDF) energy recovery units contributes significantly to reducing both the cost and the environmental footprint associated with waste transportation. The division of the overall system into smaller, regionally distributed management units enhances operational flexibility and reduces dependence on long-distance land and maritime transport. As a result, the environmental performance of the integrated system improves across all assessed impact categories, rendering the decentralized approach more balanced, resilient, and sustainable compared to centralized configurations.
Overall, the analysis demonstrates that the option of decentralized siting can be a technically, environmentally and economically efficient solution for the management of RDF residual flows, with lower transportation costs, reduced environmental footprint, better social acceptance and compliance with the EU waste management hierarchy.
Author Contributions
Conceptualization, S.M. E.M.B. ; methodology, G.P.,S.M. E.M.B.; software, G.P., D.M..; validation, S.M., E.M.B..; investigation, G.P.; resources, D.M.; data curation, G.P.; writing—original draft preparation, S.M., E.M.B.; writing—review and editing, G.P., S.M. E.M.B.; visualization, S.M. E.M.B. All authors have read and agreed to the published version of the manuscript.
Funding
This research received no external funding.
Data Availability Statement
The original contributions presented in this study are included in the article. Further inquiries can be directed to the corresponding authors.
Acknowledgments
During the preparation of this manuscript, the authors used Chatgpt in order to improve language and readability. The authors have reviewed and edited the output and take full responsibility for the content of this publication.
Conflicts of Interest
The authors declare no conflicts of interest.
Abbreviations
The following abbreviations are used in this manuscript:
| AD AP BAU CAPEX CCS CO₂e ETS EP FE FRS FU GHG GWP HDV IR LCA LCI LCIA LU MBT ME MET FET TET MRS MU NMVOC ODP OF-HH OF-TE OPEX PMF POFP RDF ReCiPe RRF SRF tkm WC WtE YPEN |
Anaerobic Digestion Acidification Potential Business as Usual Capital Expenditure Carbon Capture and Storage Carbon Dioxide Equivalent Emissions Trading System Eutrophication Potential Freshwater Eutrophication Fossil Resource Scarcity Functional Unit Greenhouse Gas Global Warming Potential Heavy-Duty Vehicle Ionizing Radiation Life Cycle Assessment Life Cycle Inventory Life Cycle Impact Assessment Land Use Mechanical–Biological Treatment Marine Eutrophication Marine Ecotoxicity Freshwater Ecotoxicity Terrestrial Ecotoxicity Mineral Resource Scarcity Management Unit Non-Methane Volatile Organic Compounds Ozone Depletion Potential Ozone Formation, Human Health Ozone Formation, Terrestrial Ecosystems Operating Expenditure Fine Particulate Matter Formation Photochemical Ozone Formation Potential Refuse-Derived Fuel Life Cycle Impact Assessment Method (ReCiPe 2016) Recovery and Recycling Facility Solid Recovered Fuel tonne-kilometre Water Consumption Waste-to-Energy Hellenic Ministry of Environment and Energy |
References
- European Environment Agency., Preventing waste in Europe: progress and challenges, with a focus on food waste. LU: Publications Office, 2025. Accessed: Oct. 15, 2025. Online.. Available: https://data.europa.eu/doi/10.2800/9052533.
- European Commission. Joint Research Centre., Circular economy perspectives in the EU textile sector: final report. LU: Publications Office, 2021. Accessed: Oct. 15, 2025. Online.. Available: https://data.europa.eu/doi/10.2760/858144.
- J. N. Hahladakis, E. Iacovidou, and S. Gerassimidou, “Plastic waste in a circular economy,” in Plastic Waste and Recycling, Elsevier, 2020, pp. 481–512. [CrossRef]
- L. Lombardi and M. J. Castaldi, “Energy Recovery from Residual Municipal Solid Waste: State of the Art and Perspectives within the Challenge to Climate Change,” Energies, vol. 17, no. 2, p. 395, Jan. 2024. [CrossRef]
- Y. Xie, J. Xue, C. T. Gnanendran, and K. Xie, “Physical, geotechnical and biochemical behaviours of municipal solid waste in field and laboratory bioreactors,” Waste Management, vol. 159, pp. 39–51, Mar. 2023. [CrossRef]
- G. D’Inverno, L. Carosi, and G. Romano, “Meeting the challenges of the waste hierarchy: A performance evaluation of EU countries,” Ecological Indicators, vol. 160, p. 111641, Mar. 2024. [CrossRef]
- Eurostat, “Municipal waste by waste management operations.” Eurostat, 2022. [CrossRef]
- European Parliament, “Report on the implementation of National Recovery and Resilience Plans,” European Parliament, Brussels, A9-0319/2023, Aug. 2023. Accessed: Sept. 11, 2025. Online.. Available: https://www.europarl.europa.eu/doceo/document/A-9-2023-0319_EN.html.
- “Recycling rates in Europe by waste stream.” Accessed: Sept. 29, 2025. Online.. Available: https://www.eea.europa.eu/en/analysis/indicators/waste-recycling-in-europe/recycling-rates-in-europe.
- “Less than one-fifth of EU plastic was recycled in 2019, but 2025 targets can be still reached - The Joint Research Centre: EU Science Hub.” Accessed: Oct. 16, 2025. Online.. Available: https://joint-research-centre.ec.europa.eu/jrc-news-and-updates/less-one-fifth-eu-plastic-was-recycled-2019-2025-targets-can-be-still-reached-2024-01-25_en.
- “Many EU Member States not on track to meet recycling targets for municipal waste and packaging waste.” Accessed: Oct. 16, 2025. Online.. Available: https://www.eea.europa.eu/en/analysis/publications/many-eu-member-states.
- S. M. Santos, C. Nobre, P. Brito, and M. Gonçalves, “Brief Overview of Refuse-Derived Fuel Production and Energetic Valorization: Applied Technology and Main Challenges,” Sustainability, vol. 15, no. 13, p. 10342, June 2023. [CrossRef]
- T. Tomić and D. R. Schneider, “The role of energy from waste in circular economy and closing the loop concept – Energy analysis approach,” Renewable and Sustainable Energy Reviews, vol. 98, pp. 268–287, Dec. 2018. [CrossRef]
- Directive (EU) 2025/1892 of the European Parliament and of the Council of 10 September 2025 amending Directive 2008/98/EC on waste (Text with EEA relevance). 2025. Accessed: Oct. 16, 2025. Online.. Available: http://data.europa.eu/eli/dir/2025/1892/oj/eng.
- H. Salaripoor, H. Yousefi, and M. Abdoos, “Life cycle environmental assessment of Refuse-Derived Fuel (RDF) as an alternative to fossil fuels in cement production: A sustainable approach for mitigating carbon emissions,” Fuel Communications, vol. 22, p. 100135, Mar. 2025. [CrossRef]
- M. M et al., “Environmental performance of alternatives to treat fly ash from a waste to energy plant,” Journal of Cleaner Production, vol. 231, pp. 1016–1026, Sept. 2019. [CrossRef]
- W. Wang et al., “Investigation and Evaluation of Flue Gas Pollutants Emission in Waste-to-Energy Plant with Flue Gas Recirculation,” Atmosphere, vol. 13, no. 7, p. 1016, June 2022. [CrossRef]
- E. C. Rada, L.-I. Cioca, and G. Ionescu, “Energy recovery from Municipal Solid Waste in EU: proposals to assess the management performance under a circular economy perspective,” MATEC Web Conf., vol. 121, p. 05006, 2017. [CrossRef]
- S. Longo, M. Cellura, and P. Girardi, “Life Cycle Assessment of electricity production from refuse derived fuel: A case study in Italy,” Science of The Total Environment, vol. 738, p. 139719, Oct. 2020. [CrossRef]
- J. Pluskal, R. Šomplák, D. Hrabec, V. Nevrlý, and L. M. Hvattum, “Optimal location and operation of waste-to-energy plants when future waste composition is uncertain,” Operational Research, vol. 22, no. 5, pp. 5765–5790, 2022. [CrossRef]
- M. A. Alao, O. M. Popoola, and T. R. Ayodele, “Waste-to-energy nexus: An overview of technologies and implementation for sustainable development,” Cleaner Energy Systems, vol. 3, p. 100034, Dec. 2022. [CrossRef]
- Paulillo, A. Sebastiani, P. Lettieri, and M. Materazzi, “Decarbonising waste-to-energy: A life cycle assessment study,” Resources, Conservation and Recycling, vol. 209, p. 107812, Oct. 2024. [CrossRef]
- M. Giugliano, S. Cernuschi, M. Grosso, and L. Rigamonti, “Material and energy recovery in integrated waste management systems. An evaluation based on life cycle assessment,” Waste Management, vol. 31, no. 9–10, pp. 2092–2101, Sept. 2011. [CrossRef]
- U. Arena, “Process and technological aspects of municipal solid waste gasification. A review,” Waste Management, vol. 32, no. 4, pp. 625–639, Apr. 2012. [CrossRef]
- F. Cherubini, S. Bargigli, and S. Ulgiati, “Life cycle assessment (LCA) of waste management strategies: Landfilling, sorting plant and incineration,” Energy, vol. 34, no. 12, pp. 2116–2123, Dec. 2009. [CrossRef]
- H. K. Jeswani, R. W. Smith, and A. Azapagic, “Energy from waste: carbon footprint of incineration and landfill biogas in the UK,” Int J Life Cycle Assess, vol. 18, no. 1, pp. 218–229, Jan. 2013. [CrossRef]
- Laurent et al., “Review of LCA studies of solid waste management systems – Part II: Methodological guidance for a better practice,” Waste Management, vol. 34, no. 3, pp. 589–606, Mar. 2014. [CrossRef]
- E. Risch, C. Boutin, and P. Roux, “Applying life cycle assessment to assess the environmental performance of decentralised versus centralised wastewater systems,” Water Research, vol. 196, p. 116991, May 2021. [CrossRef]
- P. Phogat, “Waste- and Refuse-Derived Fuels: Circular Energy Solutions from Waste Streams,” J. Mater. Sci. Technol. Res., vol. 12, pp. 22–44, Oct. 2025. [CrossRef]
- European Commission, “Communication from the Commission to the European Parliament, the Council, the European Economic and Social Committee and the Committee of the Regions: A New Circular Economy Action Plan for a Cleaner and More Competitive Europe,” European Commission, Brussels, Belgium, COM(2020) 98 final, Mar. 2020. Online.. Available: https://eur-lex.europa.eu/legal-content/EN/TXT/?uri=celex:52020DC0098.
- U. Arena and F. Di Gregorio, “A waste management planning based on substance flow analysis,” Resources, Conservation and Recycling, vol. 85, pp. 54–66, Apr. 2014. [CrossRef]
- L. Lombardi, E. Carnevale, and A. Corti, “A review of technologies and performances of thermal treatment systems for energy recovery from waste,” Waste Management, vol. 37, pp. 26–44, Mar. 2015. [CrossRef]
- C. Pharino, “Integrated Waste Management System Overview,” in Challenges for Sustainable Solid Waste Management, in SpringerBriefs on Case Studies of Sustainable Development., Singapore: Springer Singapore, 2017, pp. 1–13. [CrossRef]
- “Multicriteria analysis of municipal solid wastes energy recovery technologies in Greece,” Global NEST Journal, vol. 14, no. 2, pp. 225–234, Apr. 2013. [CrossRef]
- Hellenic Statistical Authority (ELSTAT), “Waste Statistics 2022,” Hellenic Statistical Authority (ELSTAT), Athens, Greece, 2022. Online.. Available: https://www.statistics.gr/documents/20181/18492981/DT_APOBLHTA_2022_en.pdf.
- Hellenic Statistical Authority (ELSTAT), “Annual Statistical Work Programme 2024.” Online.. Available: https://www.statistics.gr/documents/20181/301385/Annual_Statistical_Work_Programme_2024_en.pdf/0899329b-1b47-4ab5-39ed-e1893e553639.
- National Center for Environment & Sustainable Development (NCESD) / Ministry of Environment & Energy, Greece, “Waste Management 2019: Update of 2018 State of the Environment Report,” NCESD / Ministry of Environment & Energy (Greece), 2019. Online.. Available: https://necca.gov.gr/wp-content/uploads/2022/09/Waste-Management-2019.pdf.
- “Diversion of waste from landfill in Europe.” Accessed: Oct. 16, 2025. Online.. Available: https://www.eea.europa.eu/en/analysis/indicators/diversion-of-waste-from-landfill.
- “Terna Energy and TITAN participate in tender for waste treat... | Infrastructure Finance & Investment.” Accessed: Oct. 16, 2025. Online.. Available: https://www.infrapppworld.com/update/terna-energy-and-titan-participate-in-tender-for-waste-treatment-projects-in-greece.
- International Energy Agency, Greece 2023 Energy Policy Review. in IEA Energy Policy Reviews. OECD, 2023. [CrossRef]
- Eunomia Research & Consulting for SEPAN, “Circular Economy Annual Report — Final Report for SEPAN,” SEPAN (Federation of Recycling and Energy Recovery Industries & Enterprises), Eunomia Research & Consulting, Athens, Greece, Feb. 2021. Online.. Available: https://sepan.gr/wp-content/uploads/2023/12/Circular_Economy_FINAL_REPORT.pdf.
- Eriksson and, G. Finnveden, “Energy Recovery from Waste Incineration—The Importance of Technology Data and System Boundaries on CO2 Emissions,” Energies, vol. 10, no. 4, p. 539, Apr. 2017. [Google Scholar] [CrossRef]
- N. Liao, F. Lü, H. Zhang, and P. He, “Optimizing the greenhouse gas emissions of waste transfer and transport: An integration of life cycle assessment and vehicle routing problem,” Waste Management, vol. 189, pp. 314–324, Dec. 2024. [CrossRef]
- J. Dong et al., “Comparison of waste-to-energy technologies of gasification and incineration using life cycle assessment: Case studies in Finland, France and China,” Journal of Cleaner Production, vol. 203, pp. 287–300, Dec. 2018. [CrossRef]
- M. El-Fadel and A. Maalouf, “Challenges of Waste Management in a Developing Context: Lessons From Lebanon,” in Advances in Environmental Engineering and Green Technologies, A. Pariatamby, F. Shahul Hamid, and M. S. Bhatti, Eds., IGI Global, 2020, pp. 166–185. [CrossRef]
- Z. Ding, X. Wen, X. Cao, and H. Yuan, “A GIS and hybrid simulation aided environmental impact assessment of city-scale demolition waste management,” Sustainable Cities and Society, vol. 86, p. 104108, Nov. 2022. [CrossRef]
- D. Atstaja, N. Cudecka-Purina, V. Koval, J. Kuzmina, J. Butkevics, and H. Hrinchenko, “Waste-to-Energy in the Circular Economy Transition and Development of Resource-Efficient Business Models,” Energies, vol. 17, no. 16, p. 4188, Aug. 2024. [CrossRef]
- L. Patouillard, C. Bulle, C. Querleu, D. Maxime, P. Osset, and M. Margni, “Critical review and practical recommendations to integrate the spatial dimension into life cycle assessment,” Journal of Cleaner Production, vol. 177, pp. 398–412, Mar. 2018. [CrossRef]
- “European electricity prices and costs,” Ember. Accessed: Oct. 16, 2025. Online.. Available: https://ember-energy.
- “SMPE_Energeiaki_Axiopoiisi.pdf.” Accessed: Oct. 16, 2025. Online.. Available: https://ypen.gov.gr/wp-content/uploads/2025/08/SMPE_Energeiaki_Axiopoiisi.
- L. Levaggi, R. Levaggi, C. Marchiori, and C. Trecroci, “Waste-to-Energy in the EU: The Effects of Plant Ownership, Waste Mobility, and Decentralization on Environmental Outcomes and Welfare,” Sustainability, vol. 12, no. 14, p. 5743, July 2020. [CrossRef]
- Γ. Λιάλιος, “Καύση απορριμμάτων: Aπερρίφθη η στρατηγική μελέτη για την Aττική,” H ΚAΘHΜΕΡΙΝH. Accessed: Oct. 16, 2025. Available: https://www.kathimerini.gr/society/563856673/kaysi-aporrimmaton-aperrifthi-i-stratigiki-meleti-gia-tin-attiki/.
Figure 1.
Recycling rates in Europe by waste stream[9].
Figure 1.
Recycling rates in Europe by waste stream[9].
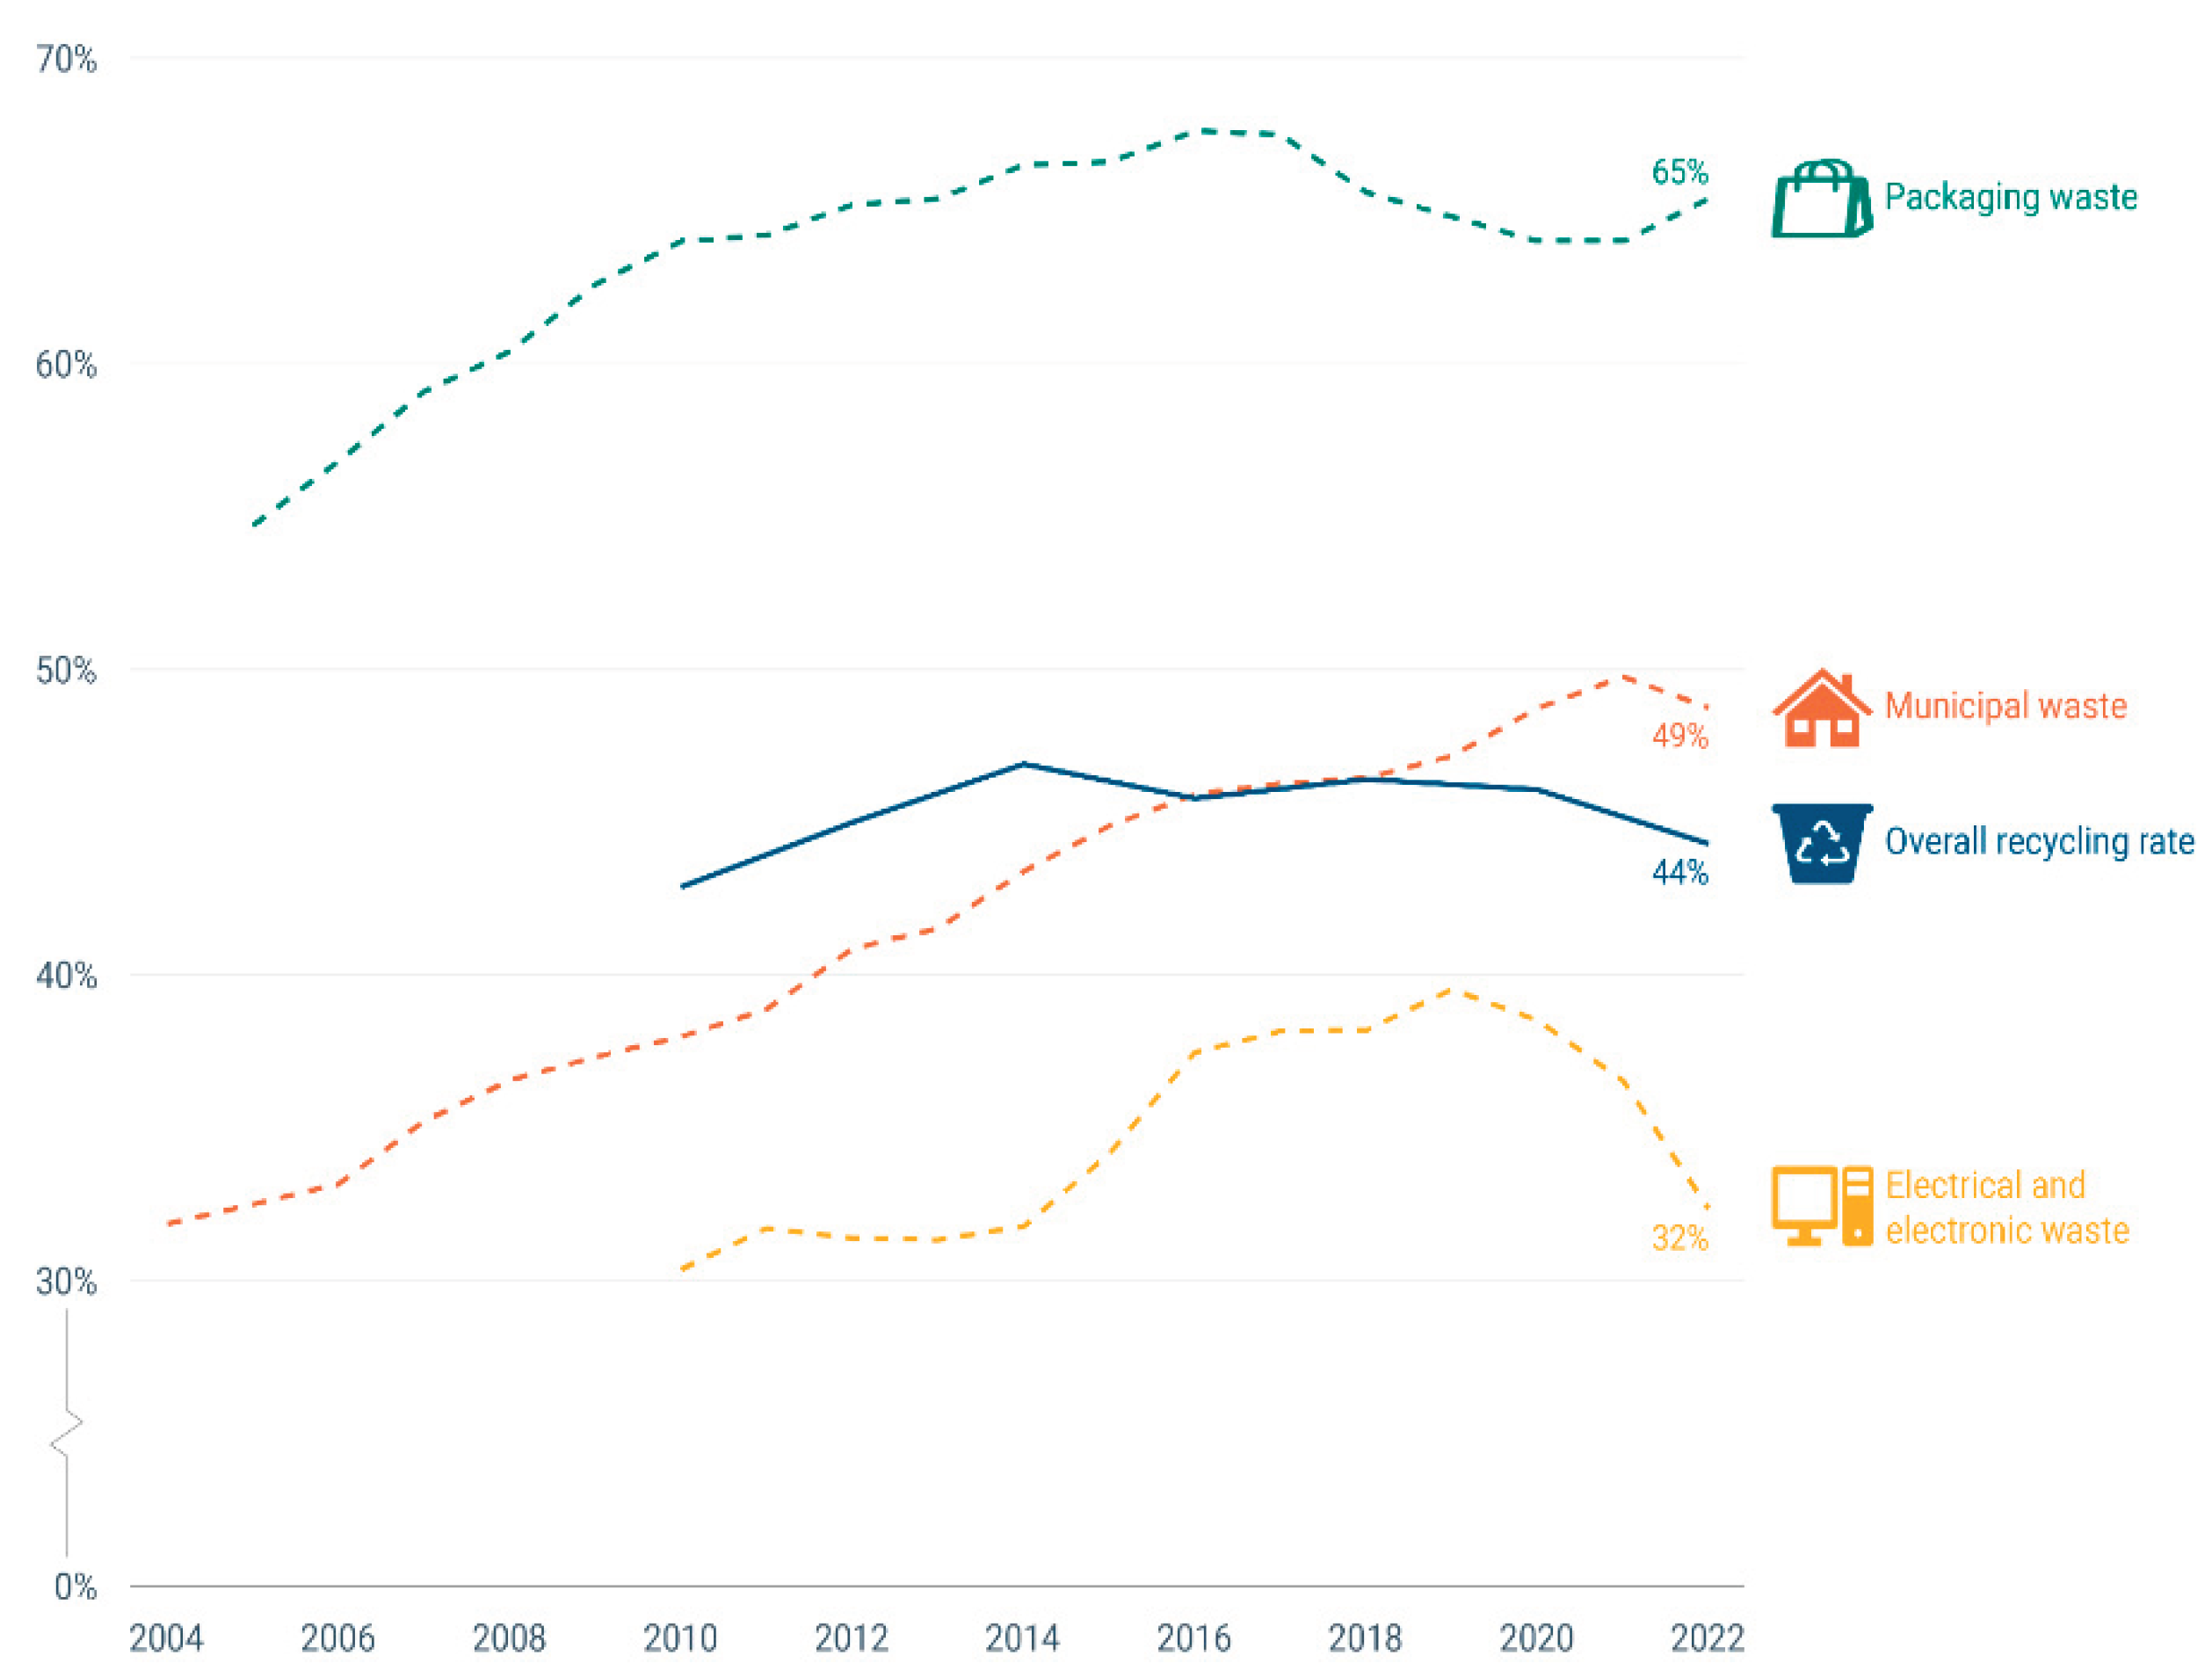
Figure 2.
Waste management hierarchy.
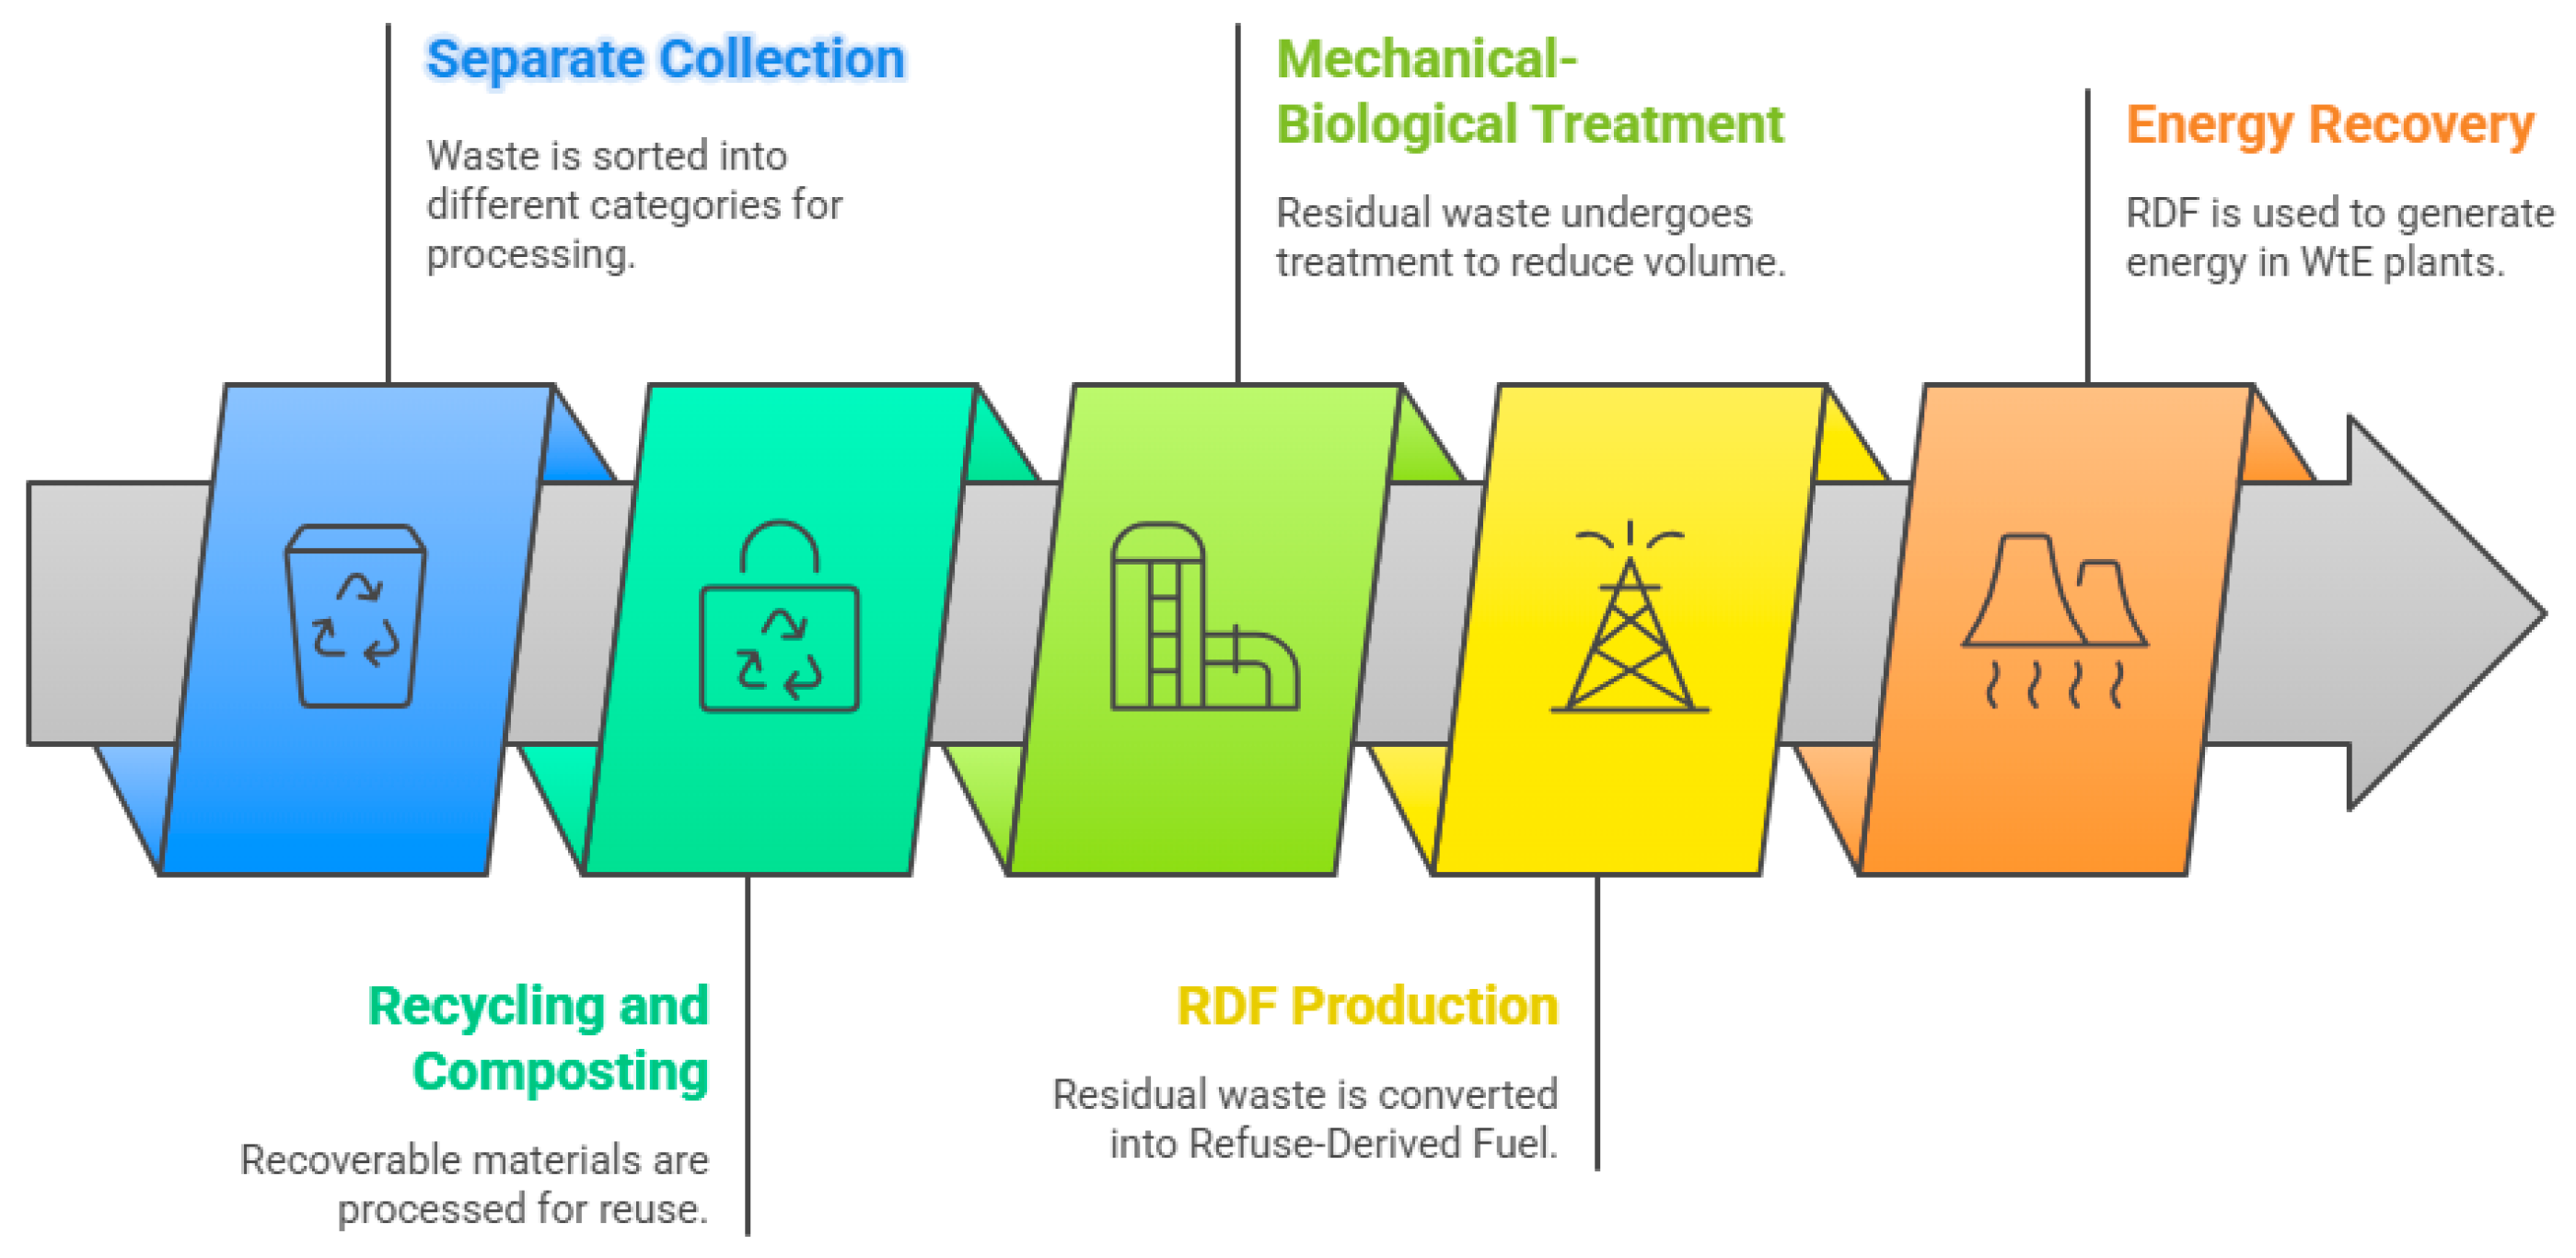
Table 1.
Waste composition and quantities in Greece.
| Waste Type | Paper | Plastic | Glass | Metals | Textile | Organic | Others | Total |
|---|---|---|---|---|---|---|---|---|
| Fraction (%) | 20 | 17 | 5 | 3 | 3 | 44 | 8 | 100 |
| Quantity (tons) | 1,080,000 | 918,000 | 270,000 | 162,000 | 162,000 | 2,376,000 | 432,000 | 5,400,000 |
Table 2.
Characteristics of centralized scenario in terms of management unit, regional unit, service area and capacity
Table 2.
Characteristics of centralized scenario in terms of management unit, regional unit, service area and capacity
| Management Unit (MU) | Regional Unit | Serviced Area | Capacity (t/y) |
|---|---|---|---|
| MU1.1 | Regional Unit of Rhodopes | Eastern Macedonia – Thrace | 54,000 |
| MU1.2 | Regional Unit of Kozani | Central Macedonia, West Macedonia, Epirus, Thessaly and part of the Ionian Islands (Corfu) | 309,000 |
| MU2 | Regional Unit of Arcadia or Elis or Achaea | Western Greece, Peloponnese and part of the Ionian Islands (except Corfu) | 125,000 |
| MU3.1 | Regional Unit of Boeotia | Central Greece and part of Attica | 244,000 |
| MU3.2 | Administrative region of Attica | Attica Region (part), North Aegean, part of South Aegean | 215,000 |
| MU4 | Regional Unit of Heraklion | Region of Crete and part of the South Aegean | 105,000 |
| Total | 1,052,000 |
Table 3.
Characteristics of decentralized scenario in terms of management unit, regional unit, service area and capacity
Table 3.
Characteristics of decentralized scenario in terms of management unit, regional unit, service area and capacity
| Management Unit (MU) | Regional Unit | Serviced Area | Capacity (t/y) |
|---|---|---|---|
| MU1.1 | Regional Unit of Rhodopes | Eastern Region Macedonia – Thrace | 54,000 |
| MU1.2a | Western Sector of the P.D.M. | Western Macedonia, Serres, East/ West Sector of the PKM | 225,711 |
| MU1.2b | Regional Unit of Larissa | Larissa, West Thessaly, Magnesia | 44,839 |
| MU1.2c | Administrative region of Epirus | Epirus, Corfu | 38,599 |
| MU2 | Regional Unit of Arcadia or Elis or Achaea | Regions of Western Greece, Peloponnese and part of the Ionian Islands (except Corfu) | 125,000 |
| MU3.1 | Regional Unit of Boeotia | Region of Central Greece and part of Attica | 244,000 |
| MU3.2a | Administrative region of Attica | Attica (part), Cyclades (Andros, Tinos, Syros, Mykonos, Paros, Naxos, Milos), Lesvos, Chios | 202,743 |
| MU4a | Regional Unit of Heraklion | Santorini, Chania, Amari, Heraklion, Sitia, Hersonissos | 82,590 |
| MU4b | Regional Unit of Rhodes | Rhodes, Patmos, Leros, Kalymnos, Kos, Karpathos | 34,477 |
| Total | 1,052,000 |
Table 4.
Input data for the compared scenarios.
| Scenario | Management Unit (MU) | Road transport | Sea freight |
|---|---|---|---|
| Centralized | MU1.1 | 4,516,745 | 19,787 |
| MU1.2 | 49,028,152 | 424,303 | |
| MU2 | 14,622,441 | 480,131 | |
| MU3.1 | 40,778,875 | N/A | |
| MU3.2 | 4,845,348 | 12,001,809 | |
| MU4 | 6,741,542 | 7,180,788 | |
| Total | 120,533,103 | 20,106,818 | |
| Decentralized | MU1.1 | 4,516,745 | 19,787 |
| MU1.2a | 7,816,003 | N/A | |
| MU1.2b | 2,323,001 | N/A | |
| MU1.2c | 993,848 | 424,303 | |
| MU2 | 14,622,441 | 480,131 | |
| MU3.1 | 40,778,875 | N/A | |
| MU3.2a | 4,089,456 | 5,289,410 | |
| MU4a | 5,215,267 | 658,935 | |
| MU4b | 1,077,906 | 1,866,046 | |
| Total | 81,433,542 | 8,738,613 |
Table 5.
CO₂eq emissions results per management unit for the centralized scenario.
| Management Unit | CO₂eq emissions (kg) |
|---|---|
| MU1.1 | 7.50E+05 |
| MU1.2 | 8.17E+06 |
| MU2 | 2.47E+06 |
| MU3.1 | 6.75E+06 |
| MU3.2 | 2.12E+06 |
| MU4 | 1.91E+06 |
| Total | 2.22E+07 |
Table 6.
CO₂eq emissions results per management unit for the decentralized scenario.
| Management Unit | CO₂eq emissions (kg) |
|---|---|
| MU1.1 | 7.50E+05 |
| MU1.2a | 1.29E+06 |
| MU1.2b | 3.85E+05 |
| MU1.2c | 7.04E+04 |
| MU2 | 2.47E+06 |
| MU3.1 | 6.75E+06 |
| MU3.2a | 1, 2 6E+06 |
| MU4a | 9.36E+05 |
| MU4b | 3.84E+05 |
| Total | 1.43E+07 |
Table 7.
Total tonne-kilometres for each scenario.
| Scenario | Road transport (tkm) | Sea transport (tkm) |
|---|---|---|
| Centralized | 120,533,103 | 20,106,818 |
| Decentralized | 81,433,542 | 8,738,613 |
| Reduction (%) | 32.4% | 56.5% |
Table 8.
Cost estimation results per year.
| Type | Centralized | Decentralized |
|---|---|---|
| Road transport costs (€/y) | 24,106,621 | 16,286,708 |
| Sea transport costs (€/y) | 8,912,900 | 6,755,400 |
| Environmental cost (€/y) | 1,443,000 | 929,500 |
| Total cost transportation (€/y) | 34,462,521 | 23,971,608 |
| Specific cost (€/tons) | 32.76 | 22.79 |
Disclaimer/Publisher’s Note: The statements, opinions and data contained in all publications are solely those of the individual author(s) and contributor(s) and not of MDPI and/or the editor(s). MDPI and/or the editor(s) disclaim responsibility for any injury to people or property resulting from any ideas, methods, instructions or products referred to in the content. |
© 2025 by the authors. Licensee MDPI, Basel, Switzerland. This article is an open access article distributed under the terms and conditions of the Creative Commons Attribution (CC BY) license (http://creativecommons.org/licenses/by/4.0/).
Copyright: This open access article is published under a Creative Commons CC BY 4.0 license, which permit the free download, distribution, and reuse, provided that the author and preprint are cited in any reuse.


