Submitted:
16 July 2025
Posted:
17 July 2025
You are already at the latest version
Abstract
Background: Circulating miRNAs have been identified as potential biomarkers for the early diagnosis and monitoring of cancers. However, limitations of polymerase chain reaction (PCR)-based methods are currently delaying the transition of miRNA research into clinical practice. These include labour-intensive workflows, exposure to errors and difficulties in detecting and quantifying low-abundance miRNAs. Objectives: This review emphasises the need to develop amplification-free ('PCR-free') technologies to improve the reliability, scalability and practicality of miRNA diagnostics in clinical settings. Methods: This review explores recent advances in PCR-free technologies developed over the past five years. It focuses on innovative methods, such as bead-based assays and sensor detection platforms, which serve as valuable alternatives to conventional PCR-based approaches. These emerging technologies have the potential to overcome the key limitations of PCR by offering streamlined workflows, reduced error rates and enhanced compatibility with a variety of clinical sample types. Crucially, they enable absolute quantification without the need for pre-nucleic acid extraction, reverse transcription or amplification, as well as the simultaneous detection of multiple miRNAs within a single assay. These provide cost-effective and scalable solutions for comprehensive biomarker profiling. The transition from PCR-based to PCR-free technologies is a significant step forward in miRNA diagnostics, overcoming long-standing technical barriers and paving the way for broader adoption of miRNA analysis in routine clinical settings. This shift supports the advancement of precision medicine and holds promises for improving early cancer detection.
Keywords:
microRNAs (miRNAs)
; PCR-free technologies
; labeling-free detection
; amplification-free platforms
; cancer diagnostics
; early detection
; liquid biopsy
; biomarker analysis
; nucleic acid testing
; sensor-based detection
; multiplexed assays
1. Introduction
Cancer remains a significant global health challenge, causing almost 10 million deaths each year [1]. According to the American Cancer Society’s Cancer Statistics Update, over 2 million people were diagnosed with cancer in 2024 [2]. This results in around 5,500 cases a day, or one diagnosis every 15 seconds. For the first time, the number of newly diagnosed cases in the United States has exceeded two million, with a growing proportion being identified at an earlier stage, when treatment success rates are at their highest. Consequently, cancer-related deaths have steadily declined, with an estimated 4.1 million lives saved since 1991 [3]. This progress reflects substantial investments in research and screening initiatives by organisations such as the National Institutes of Health, the Centers for Disease Control and Prevention, and the American Cancer Society [2,4].
Significant efforts continue to be focused on improving diagnostic and therapeutic methods in the ongoing fight against cancer. Early detection and precise diagnosis are crucial for improving patient outcomes and survival rates. Although tissue biopsy has long been considered the gold standard for cancer diagnosis, its invasiveness, incomplete tumour representation and risk of complications can limit its effectiveness [5].
Recent advancements in liquid biopsy, involving the detection of cancer biomarkers in bodily fluids such as blood, urine and saliva, have emerged as a transformative approach to non-invasive cancer detection [6,7]. Biomarkers such as circulating tumour cells (CTCs), circulating tumour DNA (ctDNA), microRNAs (miRNAs) and exosomes can provide real-time, comprehensive insights into tumour biology. Compared to traditional tissue biopsies, liquid biopsies offer clear advantages, including non-invasive and repeatable sampling, reduced risk, real-time monitoring and lower costs [7,8].
Furthermore, recent advances in molecular biotechnology have made it possible to identify cancer biomarkers with great precision through genomics, transcriptomics and proteomics [9]. These cutting-edge technologies have made a significant contribution to uncovering the underlying mechanisms of cancer and identifying actionable therapeutic targets, thereby accelerating the development of personalised and precision medicine approaches [10,11].
1.1. Circulating miRNAs as Potential Cancer Biomarkers
miRNAs are small non-coding RNA molecules, typically 18–24 nucleotides in length, which are present in all eukaryotic cells [12]. They play a crucial role in regulating key biological processes, including cell division, differentiation, apoptosis and numerous physiological and pathological pathways [13,14]. Alterations in miRNA expression, either up- or downregulation, have been widely associated with various human diseases, particularly cancer [15,16]. The importance of miRNAs in biology and medicine was further emphasised by the award of the 2024 Nobel Prize in Physiology or Medicine, which recognised their fundamental role in cellular regulation and disease [17].
Over the past two decades, extensive research has demonstrated the potential of circulating miRNAs as powerful biomarkers for cancer diagnosis, prognosis and therapy [18,19]. They have several clinical applications: they can signal the onset of cancer as early detection biomarkers; they can provide insight into disease progression and staging as prognostic indicators; and they can help evaluate therapeutic response and guide treatment decisions as predictive biomarkers. Therefore, monitoring miRNA expression profiles can offer clinicians a valuable tool for assessing how a patient responds to anticancer drugs and other interventions [20,21]. One of the major advantages of miRNAs is that they can be detected in various biofluids, including blood, urine and saliva [22]. This enables minimal or non-invasive sampling, making circulating miRNAs highly attractive for routine clinical testing and liquid biopsy applications [23]. They are notable for their remarkable stability in body fluids, remaining intact and detectable despite challenging biological conditions — an essential feature for reliable diagnostics [23,24,25].
1.2. The Problem with Conventional Analytical Methods
Despite their enormous clinical potential, miRNAs present significant analytical challenges that limit their use in diagnostics. Although their presence in accessible biofluids, such as blood, urine and saliva, enables non-invasive sampling and supports the development of liquid biopsy tests, miRNAs are inherently difficult to detect and quantify precisely. Their short sequence length, low abundance and high sequence similarity among family members make specific and reliable measurement difficult [26]. As mentioned above, although circulating miRNAs demonstrate exceptional stability in body fluids — an important trait for diagnostic use — this alone does not resolve the technical complexities involved in their isolation, enrichment and analysis [16]. Addressing these issues is essential if we are to realise the full diagnostic and therapeutic potential of miRNAs [27].
Over the past two decades, several analytical platforms have been used to evaluate miRNA expression in biofluids, converting conventional methods. These include the reverse transcription quantitative polymerase chain reaction (RT-qPCR) [28], droplet digital PCR (ddPCR) [29], microarrays [30] and next-generation sequencing (NGS)-based methods [31]. Using them for miRNA detection typically requires additional workflow steps, most notably reverse transcription to convert RNA into complementary DNA (cDNA), which can then be processed using standard DNA-based methodologies.
While these methods have demonstrated utility, they suffer from several limitations related to workflow complexity, cost, and analytical accuracy [32]. Crucially, none of these technologies were originally designed for the analysis of miRNAs. Rather, they are adaptations of platforms developed for broader nucleic acid targets, such as messenger RNA (mRNA) and genomic DNA (gDNA) [33]. As a result, they are not ideally suited to the unique characteristics of miRNAs, including their small size (~22 nucleotides), absence of poly-A tails, and high sequence similarity among family members. Moreover, circulating miRNAs are present in very low concentrations and are surrounded by complex backgrounds composed of other nucleic acids and abundant macromolecules. According to the literature, miRNAs constitute only about 0.01% of the total RNA mass in plasma [33,34]. Their expression levels can vary widely—from just a few copies to hundreds of thousands per microliter (μL) of blood plasma [35], corresponding to concentrations in the femtomolar (fM) to picomolar (pM) range.
These molecular features complicate probe design, increase the risk of off-target hybridization, and reduce analytical specificity and accuracy. This highlights the need for advanced analytical technologies with a dynamic range of at least four orders of magnitude. Furthermore, reliance on reverse transcription and amplification introduces technical variability and potential bias, which undermines reproducibility and limits the clinical translation of miRNA-based diagnostics.
These persistent limitations have prompted the scientific community to pursue the development of new, dedicated technologies optimised specifically for miRNA detection. Emerging approaches aim to enable direct interrogation of miRNAs in their native form, without requiring preprocessing steps such as RNA extraction, reverse transcription, or amplification. One key goal is to achieve absolute quantification through robust, multiplexed, extraction-free assays—comparable to the immunoassays used in protein biomarker analysis. These innovations are essential not only for improving analytical performance but also for accelerating the clinical translation of miRNA biomarkers for early disease detection, patient stratification, and personalised therapeutic monitoring.
1.3. Conventional Analytical Methods
1.3.1. Quantitative and Digital PCR-Based Technologies
Among PCR-based methods, RT-qPCR is the most widely used and is considered the gold standard for detecting low levels of miRNA [36]. Originally developed for mRNA analysis, RT-qPCR offers high sensitivity for gene expression studies [37]. However, as stated above, applying it to miRNA analysis presents several challenges due to the unique molecular features of miRNAs: (1) Small size: The short length of miRNAs (typically 18–24 nucleotides) makes optimal primer and probe design difficult; (2) Structural overlap: Precursor miRNAs (pre-miRNAs) form stable hairpin structures, and mature miRNAs are derived from internal segments of these precursors, which complicates differentiation between the precursor and mature forms; (3) Lack of a poly-A tail: Unlike mRNAs, miRNAs lack poly-A tails, rendering them incompatible with the poly-T priming method employed in numerous traditional RT reactions; (4) Sequence similarity: Many miRNA family members (including isomiRs) differ by only one or a few nucleotides, which increases the risk of cross-reactivity and reduces specificity; (5) Low abundance: miRNAs are generally found in low concentrations in biofluids, which makes them highly susceptible to technical noise and contamination, particularly from gDNA. Therefore, efficient removal of gDNA prior to reverse transcription is critical for accurate results [32,38].
To enhance miRNA detection, RNA extraction kits that are specifically designed to enrich small RNAs (less than 200 nucleotides) are often used [39]. These help to exclude longer RNAs and improve specificity. However, such enrichment steps can also lead to the partial loss of target miRNAs, which could affect sensitivity if not carefully controlled.
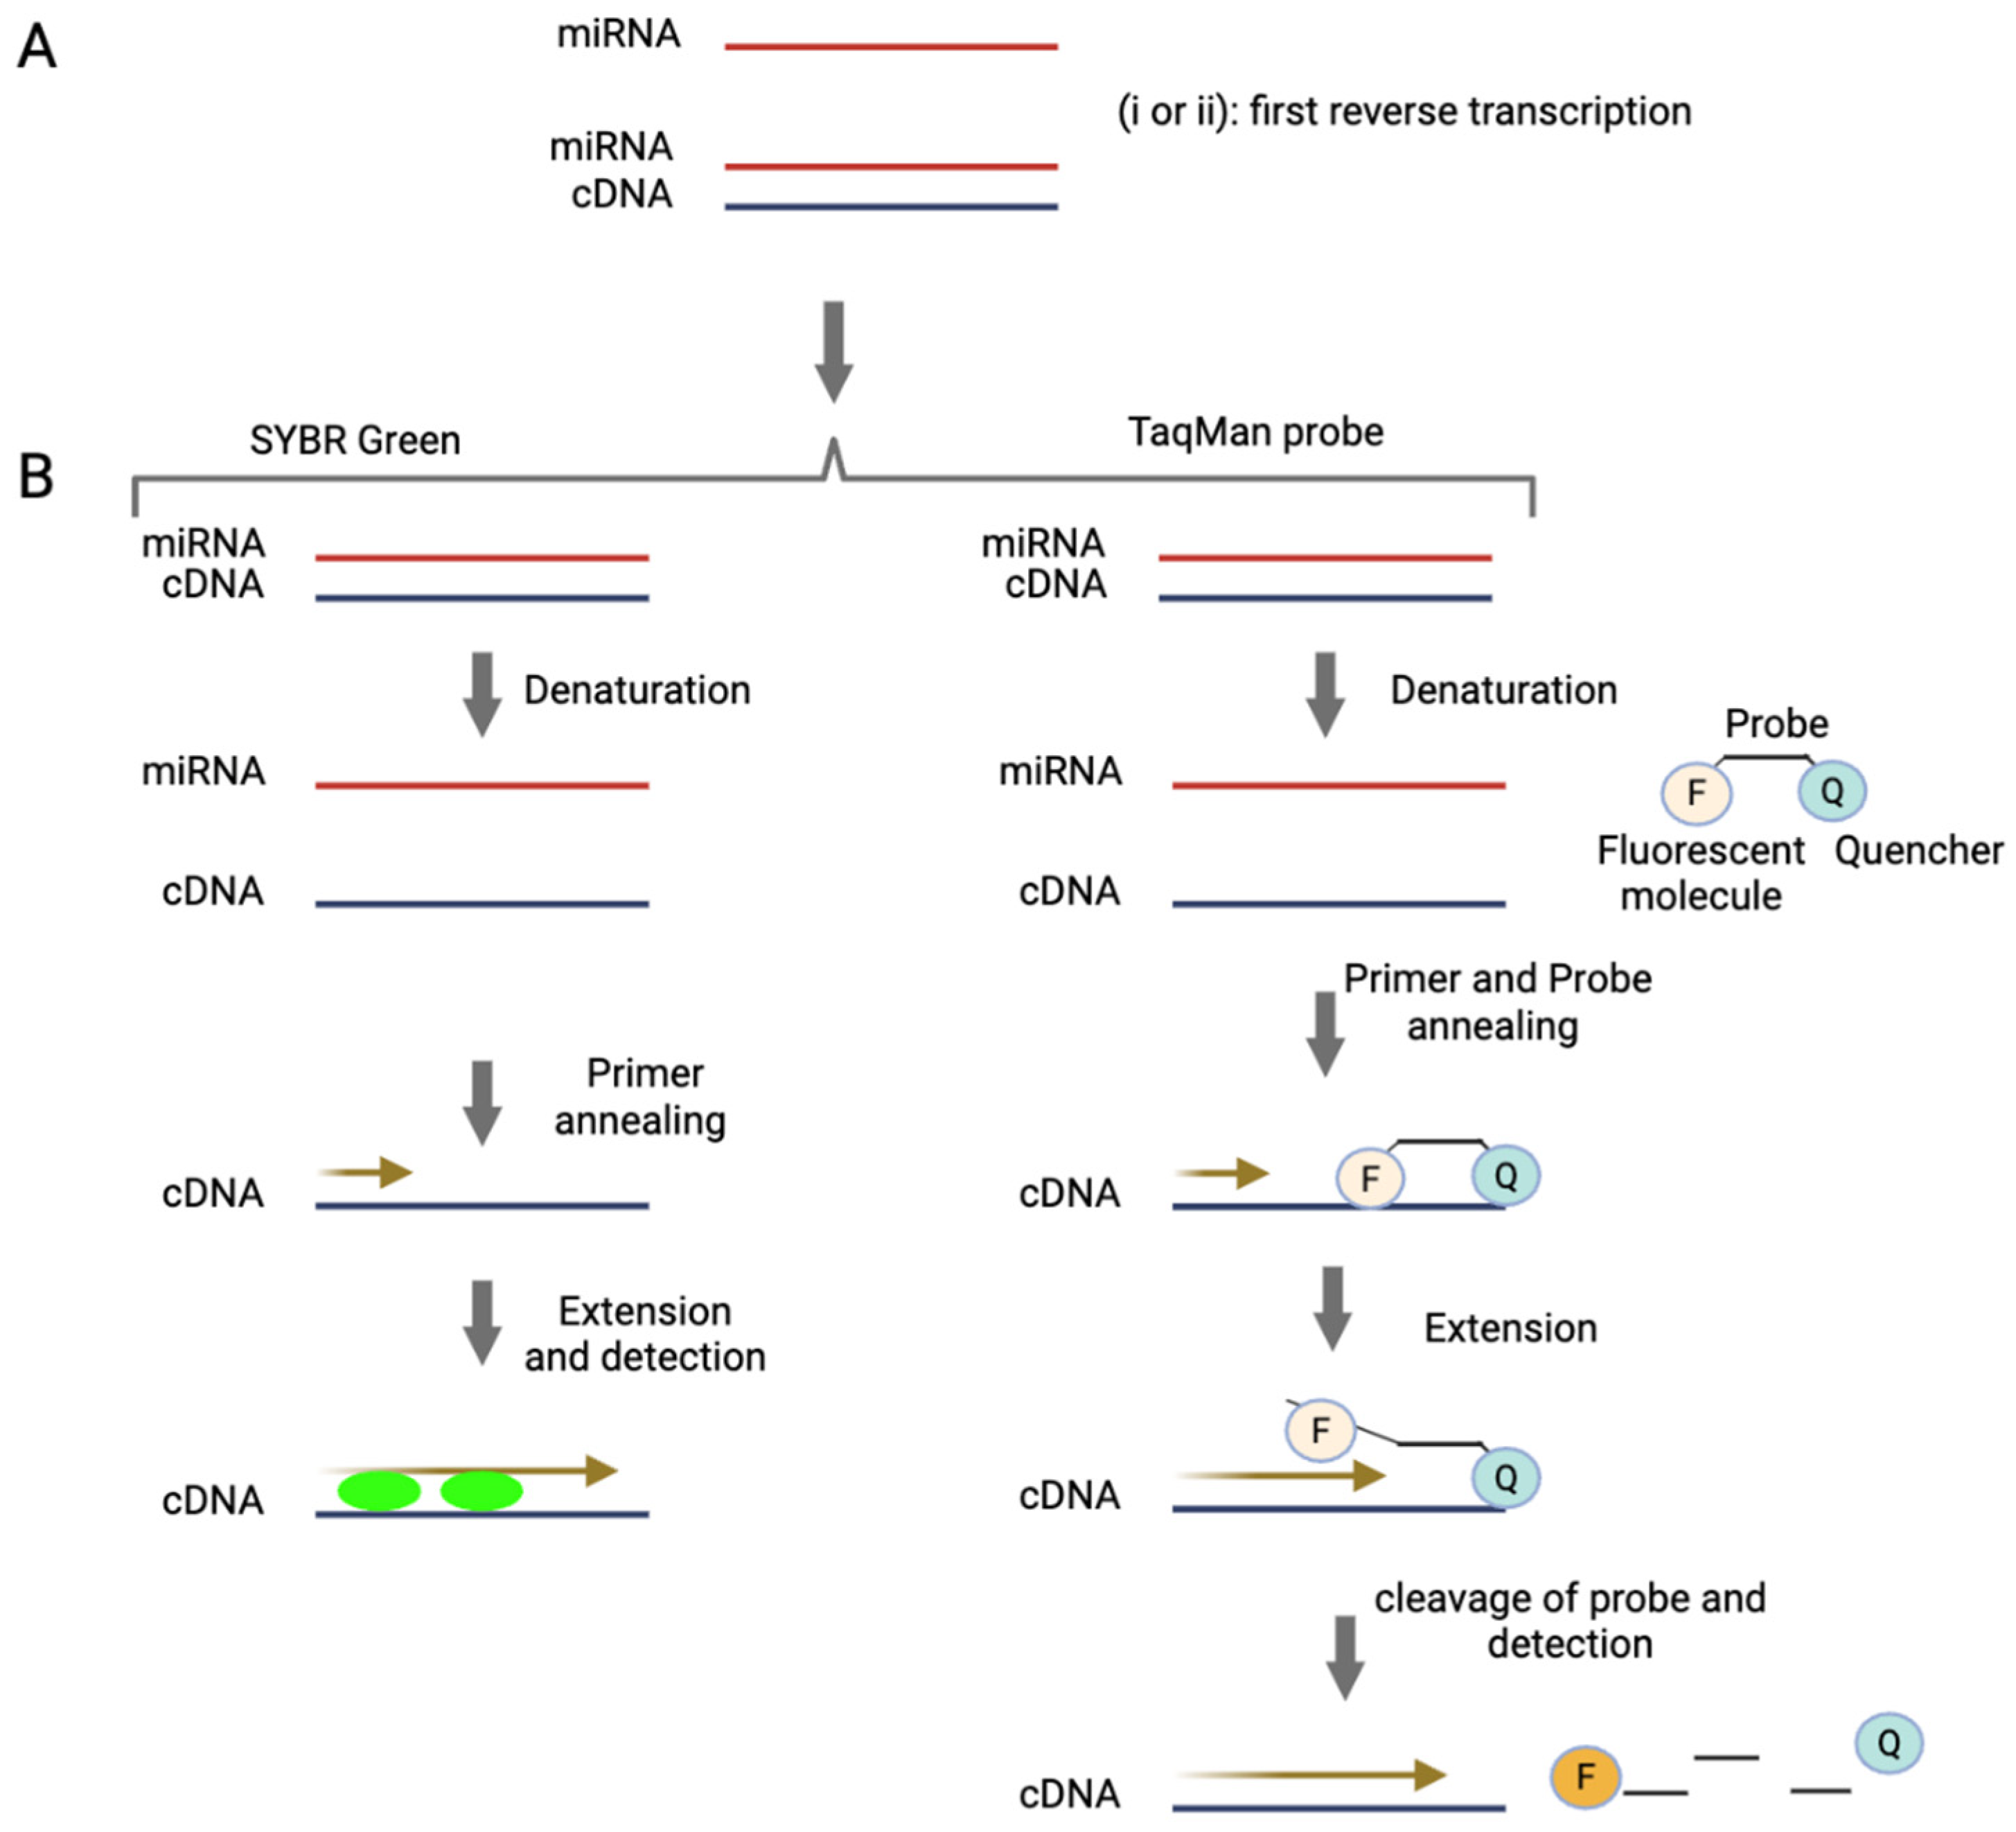
RT-qPCR interrogates miRNAs by amplifying specific RNA sequences extracted from the biological matrix. The process begins with the extraction of total RNA, including miRNAs, from biological samples. The quality and purity of the extracted RNA significantly impact the accuracy and reliability of the subsequent analysis, so this step is critical. Following extraction, as shown in Figure 1, the RNA is reverse transcribed into cDNA [40]. This cDNA is then amplified in a solution containing DNA polymerase, nucleotides and primers that are complementary to the target DNA sequence. The amplification process involves three key steps: 1) Denaturation: The double-stranded DNA (dsDNA) is heated to separate it into single strands. 2) Annealing: As the solution cools, the primers bind to the target sequences on the separate DNA strands. 3) Extension: DNA polymerase adds nucleotides to the primers, creating complementary copies of the target DNA sequence. This cycle of denaturation, annealing and extension is repeated multiple times, exponentially increasing the quantity of the target DNA sequence [41]. Ideally, amplification will not occur in the absence of the target cDNA sequence, ensuring high specificity. Two commonly used detection chemistries in RT-qPCR are SYBR Green and TaqMan (Figure 1), each employing a distinct approach to detect amplified products [42]. SYBR Green is a fluorescent dye that binds to double-stranded DNA, emitting a signal proportional to the amount of dsDNA generated during amplification. In contrast, TaqMan uses a sequence-specific fluorescent probe, providing greater specificity and reducing the likelihood of non-specific amplification [42].
The combination of sensitivity and versatility has established RT-qPCR as a cornerstone technique for studying miRNA expression. Despite the challenges outlined above, it remains one of the most widely used and trusted methods for miRNA quantification and analysis.
Furthermore, digital PCR (dPCR) has emerged as a powerful PCR-based technique capable of absolute quantification, thereby addressing some of the limitations associated with traditional quantitative polymerase chain reaction (qPCR). In particular, ddPCR enables precise quantification by partitioning the sample into thousands of nanoliter-sized droplets, with each droplet functioning as an individual micro-reaction of defined volume [43]. Subsequent to the process of PCR amplification, the fluorescence of each individual droplet is measured, and the droplets are classified as either positive (fluorescent) or negative (non-fluorescent) based on the presence or absence of the target nucleic acid. The number of positive droplets is then used to calculate the absolute concentration of the target using a Poisson distribution model [44]. These yields copy numbers per microliter of reaction along with associated confidence intervals [43].
A significant benefit of ddPCR is that it does not necessitate the use of reference genes or standard curves for quantification, thereby enhancing precision and eradicating variability introduced by amplification efficiency [45]. This is of particular benefit in the context of analysis of miRNAs, where the selection of a suitable reference gene can present significant challenges. In comparison to qPCR, ddPCR has been shown to possess several advantageous properties. These include an augmented level of sensitivity and accuracy in the detection of low-abundance targets, as well as an increased tolerance to polymerase chain reaction inhibitors. Consequently, ddPCR is regarded as a robust method for the analysis of complex or degraded samples [46].
Figure 1.
Methods of miRNA detection and quantification by RT-qPCR. A) miRNA is first reverse transcribed to generate cDNA. This can be achieved using the following strategies: (i) Stem-loop priming: A stem-loop primer binds specifically to the target miRNA, initiating reverse transcription and providing high specificity [47]. (ii) The polyadenylation approach: In this method, a poly(A) tail is added to the miRNA by an enzyme, enabling reverse transcription to proceed using an oligo(dT) primer [48,49]. B) The resulting cDNA is then amplified by PCR and detected using one of two common methods: SYBR Green (or similar dyes): These intercalating dyes bind to double-stranded DNA during amplification, generating a fluorescent signal proportional to the amount of DNA. TaqMan probes: These sequence-specific probes consist of a fluorophore (F) and a quencher (Q). When the probe hybridises to the target during PCR, the polymerase cleaves the probe, separating the fluorophore from the quencher and producing a fluorescence signal directly correlated to target amplification.
1.3.2. miRNA Microarrays
Microarray technology was originally implemented to study differences in transcription by analysing mRNA, providing a robust method for examining gene expression profiles [50]. However, advancements in the field have enabled its use for detecting and quantifying short RNA molecules, such as miRNAs [51].
Microarrays are a high-throughput method that can be used to detect and measure changes in the levels of a wide range of miRNAs in a single experiment [52,53]. This technique is based on nucleic acid hybridisation, whereby target molecules bind to their complementary probes that are anchored to a solid surface (e.g. glass slides) via covalent crosslinking [54]. Fluorescent dyes such as Alexa Fluor 546/647 or Cy3 are commonly used to label miRNAs. These fluorescently labelled miRNAs then hybridise with the complementary probes on the microarray, resulting in specific binding. Detecting fluorescence emission at defined positions on the glass slide enables the evaluation of relative quantities of miRNAs in the sample by analysing the intensity of the fluorescence signal (Figure 2). Microarray platforms enable the simultaneous comparison of expression levels in two different samples using distinct fluorophores. Numerous variants of microarray technology have been developed over the years for miRNA detection, incorporating innovations in immobilisation chemistry, probe design, sample labelling and chip signal-detection methods [55]. Various commercial microarray platforms are now available for miRNA detection and quantification. However, studies have shown significant differences in their performance, including biases in miRNA quantification and their ability to determine expression profiles [56,57]. Despite their invaluable role in preliminary screening, microarrays are lacking in terms of the sensitivity and specificity necessary for absolute quantification [58].
1.3.3. Next-Generation Sequencing for miRNA Profiling
NGS has profoundly advanced the field of miRNA analysis, providing a powerful tool for high-throughput, comprehensive profiling of small RNA populations. This technology not only enables accurate quantification of known miRNAs but also supports the discovery of novel miRNA species.
The typical workflow for small RNA sequencing (sRNA-Seq) begins with the extraction of total RNA from biological samples (Figure 3). This RNA pool contains a variety of molecules, including miRNAs and other small non-coding RNAs. Following RNA extraction, a size selection step is performed to enrich the sample for small RNAs, generally in the range of 18 to 30 nucleotides. This selection is essential to exclude longer RNA molecules and to focus the sequencing effort on the small RNA fraction.
Once the small RNAs are enriched, synthetic adapters are ligated to their 3′ and 5′ ends. This adapter ligation is a critical step because it prepares the RNA molecules for reverse transcription and subsequent amplification. After adapter ligation, the small RNAs are reverse transcribed to generate cDNA, which is then amplified by PCR to produce a sequencing-ready library (Figure 3). The amplified libraries are sequenced, and the resulting reads are mapped to reference genomes or curated miRNA databases, such as miRBase, to identify and quantify known miRNAs and to explore the presence of potentially novel [59].
Library preparation can be performed using commercially available kits, which vary based on the sequencing platform and the specific needs of the experiment. Some protocols use adapters with fixed sequences, as commonly found in kits like Illumina TruSeq, NEBNext, and CleanTag. Other protocols, such as those provided by the NEXTflex system, use adapters that contain four randomized nucleotides at their ligation ends [60]. These randomized or “4N” adapters are specifically designed to minimize ligation bias by reducing sequence dependency during adapter binding, thereby improving the uniformity and efficiency of miRNA capture.
One of the key technical challenges in sRNA-Seq is the introduction of ligation bias. The sequence and secondary structure of miRNAs can significantly affect how efficiently adapters are ligated to the RNA molecules. This can lead to preferential ligation of some miRNAs and under-representation of others, distorting the actual abundance of miRNAs in the sample. Ligation bias is particularly problematic in small RNA sequencing and is generally more pronounced than in standard mRNA sequencing protocols [61].
Once sequencing is complete, the data analysis presents its own challenges. In sRNA-Seq experiments, particularly when analyzing biofluids, miRNA expression levels are often highly skewed. A small number of highly abundant miRNAs typically account for the majority of sequencing reads, while most other miRNAs are present at low levels. This uneven distribution complicates data processing, especially in the normalization phase.
Different normalization methods have been proposed to address this challenge [62]. Some approaches adjust the data based on the total number of reads per sample, while others focus on aligning the distribution of expression levels across samples to improve comparability. Methods such as Reads Per Kilobase of transcript per Million mapped reads (RPKM) are widely used in mRNA sequencing, but they are less appropriate for miRNA sequencing because miRNAs are uniformly short and the RPKM adjustment is not meaningful for such molecules [63].
There is currently no universal consensus on the best normalization strategy for sRNA-Seq data. The choice of method can significantly influence the results of downstream analyses, including differential expression studies. Therefore, researchers must carefully select and justify their normalization approach based on the specific type of sample, experimental design, and biological question being addressed.
Over the years, significant improvements in library preparation, adapter design, and data normalization have helped to enhance the accuracy and reliability of miRNA profiling by NGS [64]. Nevertheless, careful attention to protocol selection, optimization steps, and data interpretation remains essential to obtain high-quality and biologically meaningful results.
2. Aim and Methodology
Current approaches for analysing circulating miRNAs typically involve RNA extraction and small RNA enrichment, steps that often result in partial miRNA loss and hinder the detection of low-abundance targets. Moreover, widely used methods such as RT-qPCR, ddPCR, microarrays, and NGS rely on reverse transcription and amplification, which can introduce variability and compromise the accuracy of quantification [65]. These limitations highlight the need for direct detection strategies that bypass RNA extraction, reverse transcription, and amplification to enable more robust and reproducible analysis of circulating miRNAs.
To address this need, a comprehensive literature review was conducted to identify technologies capable of detecting cancer-associated circulating miRNAs without requiring nucleic acid extraction or amplification. The search targeted original and review articles published up to and including 2024 in the PubMed and Scopus databases, using the terms:
((microRNA [Title/Abstract] OR miRNA [Title/Abstract]) AND amplification-free [Title/Abstract] OR PCR-free [Title/Abstract] AND detection [Title/Abstract]).
A total of 459 manuscripts were retrieved (195 from Scopus and 264 from PubMed). After removing 346 manuscripts—including 77 duplicates and 269 published before 2020—113 manuscripts remained for screening.
Of these, 85 were excluded for the following reasons: 33 did not use clinical samples, 37 were not focused on circulating miRNAs, and 15 were review articles. This left 28 manuscripts for full-text assessment. Among them, 21 were excluded: 8 did not implement extraction-free methods, and 13 lacked essential technical or clinical parameters.
Finally, 7 manuscripts were identified as eligible based on the inclusion criteria, and the 5 most recent were selected for detailed review (Table 1). These included diverse amplification-free technologies demonstrating high sensitivity, clinical relevance, and the capacity to work directly with biological fluids. One of the selected technologies was the Dynamic Chemical Labelling (DCL) approach developed by the authors’ research group. DCL employs synthetic abasic PNA probes and chemically reactive nucleobases for direct, extraction- and amplification-free detection of circulating miRNAs.
Table 1 summarises the key characteristics of the selected technologies, including detection principles, miRNA targets, limits of detection (LoD), sample types, and cancer associations. Each study is described in detail to illustrate its methodological strengths and diagnostic potential.
Among these technologies, the DCL method stands out for its simplicity, robustness, and clinical adaptability. A section of this review presents the development and recent refinements of the DCL platform, including its specific application in the direct detection of miRNA biomarkers in liquid biopsy samples for cancer diagnostics. This application demonstrates the potential of DCL as a highly promising alternative to conventional PCR-based approaches for reliable and multiplex quantification of circulating miRNAs in clinical settings. .

Table 1.
Comparison of novel advanced amplification-free methods for miRNA detection in liquid biopsies.
Table 1.
Comparison of novel advanced amplification-free methods for miRNA detection in liquid biopsies.
| Technology | Type of Detection |
Target miRNA | Limit of Detection (LoD) | Type of Clinical Sample | Types of Cancer |
Reference |
|---|---|---|---|---|---|---|
| Solid-state nanoplasmonic sensor | UV-Vis | miR-10b-5p miR-let7a-5p |
637.7 aM | Plasma | Pancreatic ductal adenocarcinoma | [66] |
| Electro-optical nanopore sensing | Fluorescence | miR-141-3p miR-375-3p |
5–8 fM |
Serum | Prostate cancer |
[67] |
| Singlet oxygen-based photoelectrochemical | Photoelectrochemical | miR-145-5p miR-141-3p |
3.5-8.3 pM |
Plasma | Prostate cancer |
[68] |
| Tandem bead-based hybridization assay | Fluorescence | miR-128-2-3p | 2.2 pM | Plasma | Colorectal cancer |
[69] |
| Dynamic chemical labelling (DCL) | Fluorescence | miR-21-5p miR-122–5p miR-371a-3p miR-451a–5p |
pM range | Sereum | Various cancers |
[70] |
3. Emerging Amplification-Free Methods for Circulating miRNA Detection in Cancer
3.1. Solid-State Nanoplasmonic Sensor
Masterson et al. [66] used a solid-state nanoplasmonic sensor to detect circulating miRNAs, specifically miR-10b-5p and miR-let7a-5p, in plasma samples. This approach is both amplification-free and label-free. These miRNAs show great promise in the early detection of pancreatic ductal adenocarcinoma (PDAC) [71,72].
This sensor utilizes the unique localized surface plasmon resonance (LSPR) properties of gold triangular nanoprisms (Au TNPs) attached to the glass bottom of a 384-well plate [73,74]. Fabrication involves two key steps: (i) Nanoparticle immobilization: Chemically synthesized Au TNPs (42–55 nm edge length) are covalently attached to a mercaptomethoxysilane-modified glass substrate to ensure stable anchoring. (ii) Covalent functionalization: The Au TNPs are functionalized with thiolated single-stranded DNA (ssDNA) capture probes specific to the target miRNAs. Polyethylene glycol thiolate (PEG4) spacers are co-immobilized to minimize nonspecific binding and fouling (Figure 4).
The Au TNPs act as plasmonic nanoantennas, concentrating the local electromagnetic field at their surface and creating near-field “hot spots” upon LSPR excitation. The sensitivity of this system is highly dependent on the size, shape, and local dielectric environment of the Au TNPs [75]. These near-field effects significantly enhance the sensor’s ability to detect minute refractive index changes upon miRNA hybridization.
The detection mechanism relies on the LSPR shift (Δλ_(LSPR)), which occurs when target miRNAs hybridise with the ssDNA probes, as also reported in [76]. Formation of a ssDNA/RNA duplex increases the local refractive index, resulting in a measurable red shift in the LSPR spectrum. This shift is quantified via UV–vis extinction spectroscopy [77]. This spectral shift is directly proportional to the concentration of the miRNAs, enabling accurate, label-free quantification.
In an earlier development involving the 96-well format [78], this solid-state nanoplasmonic sensor could detect miRNAs from as little as 10 µL of plasma with a LoD of 10⁻¹⁸ M (attomolar). To improve scalability, this work optimised the platform for a 384-well format, significantly enhancing sensitivity and throughput. In this configuration, the sensor achieved a LoD of 637.7 aM and a quantification limit of 45 fM.
The sensor exhibited exceptional diagnostic performance, effectively distinguishing PDAC from chronic pancreatitis (CP) and healthy controls, surpassing the accuracy of CA19-9, the current clinical biomarker standard [79,80]. combined biomarker strategy using miR-10b-5p and miR-let7a-5p achieved approximately 91% sensitivity and 87% specificity in distinguishing early-stage (I/II) from late-stage (III/IV) PDAC [81], demonstrating strong potential for the early detection of cancer.
Despite these promising results, there are still challenges to overcome, including the need for overnight assay incubation, ensuring sensor stability, and conducting large-scale clinical validation. Future improvements should focus on achieving greater multiplexing capabilities to enable the simultaneous detection of multiple miRNAs, optimising surface chemistry to reduce non-specific binding and integrating the technology into point-of-care diagnostic devices. Validation in larger and more diverse patient cohorts will be essential to establish its clinical applicability. Nevertheless, this solid-state nanoplasmonic sensor is a significant advancement in non-invasive cancer diagnostics, offering a highly sensitive, specific and scalable solution for early detection, disease monitoring and personalised medicine.
3.2. Electro-Optical Nanopore Sensing
In this study, Cai et al. [67] used an electro-optical nanopore sensing platform for the direct detection of miRNAs from serum samples in a label-free, amplification-free, multiplexed approach. This single-molecule technique combines size-encoded molecular probes, nanopore electrical sensing, and fluorescence microscopy. This enables highly sensitive and specific quantification of miRNAs with minimal sample input.
The detection mechanism is based on dual-mode signal readout, combining electrical nanopore sensing to discriminate between molecular probes based on size, with fluorescence-based optical detection to recognise target miRNAs based on sequence. This approach enables multiple miRNAs to be detected simultaneously in a single sample, making it a powerful tool for high-throughput liquid biopsy applications.
As shown in Figure 5, the system uses custom-designed molecular probes, each of which consists of a DNA carrier encoded molecular probe and a molecular beacon (MB). The MB is a stem-loop DNA structure labelled with a fluorophore and a quencher. It is designed to remain closed in the absence of the target miRNA, which prevents fluorescence emission. Upon hybridisation with its complementary miRNA, the MB unfolds, separating the fluorophore from the quencher and restoring fluorescence for optical detection.
At the same time, the DNA carrier acts as a molecular barcode, enabling size differentiation using nanopores. Each probe–miRNA complex is driven through a solid-state nanopore by electrophoresis, generating distinct current blockade signals that depend on the length of the DNA carrier. Since each miRNA-specific probe is attached to a carrier of a unique length, nanopore analysis can distinguish between multiple miRNAs based on their electrical signatures. Integrating electrical and optical readouts enhances specificity, enabling the effective discrimination of single-base mismatches and improving the accuracy of miRNA profiling. Figure 5 shows the electro-optical nanopore sensing workflow.
This technology was validated using prostate cancer (PCa)-associated miRNAs, including miR-141-3p and miR-375-3p, which are significantly upregulated in PCa patients [82,83]. The assay achieved an ultra-low LoD of 5–8 femtomolar (fM), surpassing the sensitivity of RT-qPCR and fluorescence-based bulk assays. Moreover, a three-miRNA panel (miR-141-3p, miR-375-3p, and let-7b) enabled classification of localized versus metastatic PCa, demonstrating its potential for disease staging and treatment monitoring [84,85]. The system exhibited an accuracy of 98.8% in differentiating PCa patients from controls, underscoring its clinical relevance.
A key advantage of this nanopore sensing platform is its minimal sample requirement—requiring only 0.1 µL of unprocessed serum, making it a minimally invasive and efficient tool for clinical diagnostics (Figure 5). Unlike PCR-based methods, which are prone to variability due to amplification bias, this amplification-free and extraction-free approach ensures more reliable quantification of miRNAs in biofluids. Additionally, the ability to perform multiplexed detection using size-encoded DNA carriers significantly enhances the system’s throughput and scalability, making it suitable for high-throughput screening applications [67].
Despite its advantages, several challenges remain. Further clinical validation across larger and more diverse patient cohorts is essential to confirm the platform’s diagnostic utility. Additionally, expanding multiplexing capacity to detect a broader range of cancer-associated miRNAs and optimizing the platform for point-of-care applications would enhance its clinical feasibility. Future developments should focus on automating sample processing, increasing detection speed, and integrating the system into hospital workflows to facilitate real-world implementation.
3.3. Singlet Oxygen-Based Photoelectrochemical
The singlet oxygen (¹O₂)-based photoelectrochemical (PEC) sensor used by Shanmugam et al. [68] represents a promising advancement in the detection of circulating miRNAs, providing a label-free, amplification-free, and highly sensitive strategy for early cancer diagnosis [86]. Unlike conventional methods that require complex reagents, enzymatic reactions, or nucleic acid amplification, this PEC system uniquely uses air as the oxygen source, significantly reducing costs and simplifying sensor fabrication and operation [87].
As shown in Figure 6A, the detection relies on a sandwich hybridization assay in which the target miRNA is specifically captured between two complementary DNA probes: a biotinylated capture probe immobilized on streptavidin-coated magnetic beads and a detection probe labeled with Chlorin e6 (ChlE6), a photosensitizer [88]. After hybridization, the magnetic beads are drawn to the sensor surface using an external magnetic field, ensuring the proximity of the probe-miRNA complex to the electrode for efficient signal generation [88,89].
When the sensor is exposed to light, the photosensitizer produces singlet oxygen (¹O₂), which rapidly reacts with the redox mediator hydroquinone (HQ), oxidizing it to benzoquinone (BQ). The BQ is then electrochemically reduced at the electrode back to HQ, establishing a redox cycling loop that greatly amplifies the PEC signal (Figure 6B).
Optimisation of the system involved fine-tuning the electrode potential to −0.2 V vs. an Ag quasi-reference electrode, adjusting the amount of magnetic beads to 100 µg per assay and the HQ concentration to 1 mM. This resulted in a LoD of 0.62 pM for miR-141-3p in buffer. The method demonstrated high specificity, low background signal and robust performance in untreated plasma samples, highlighting its potential for clinical use. Its simplicity, cost-effectiveness and rapid response time make it ideal for point-of-care diagnostics. The clinical applicability of this PEC platform was further validated by analysing circulating miRNAs in plasma samples from prostate cancer patients [90]. Following assaying of buffer samples, detection limits of 3.5 pM for miR-145-5p and 8.3 pM for miR-141-3p were established in pooled plasma spiked with target miRNAs at varying concentrations. Finally, when the platform was used with plasma samples from eight prostate cancer patients, significantly higher photocurrent responses (8–18 nA) were detected compared to healthy controls (4.5–5.5 nA). This is consistent with the elevated levels of miR-145-5p and miR-141-3p observed in prostate cancer [91,92]. Notably, miR-145-5p showed more consistent elevation across samples than miR-141-3p. This method enables sensitive and specific miRNA detection directly in untreated plasma, eliminating the need for pre-amplification and simplifying data interpretation. This makes it particularly attractive for point-of-care applications in clinical biomarker analysis [93].
3.4. Tandem Bead-Based Hybridization Assay
The tandem bead-based hybridization assay used by Slott et al. [69] offers a novel, amplification-free strategy for both detecting miRNAs and performing single-nucleotide polymorphism (SNP) analysis directly in miRNA sequences. This dual capability enables sensitive and specific quantification of circulating miRNAs while simultaneously distinguishing single-base mutations, which are increasingly recognized as important biomarkers in diseases such as colitis and colorectal cancer [94,95].
The detection system is based on a two-step hybridization assay that uses locked nucleic acid (LNA)-enriched probes to maximize binding affinity and SNP discrimination [96]. The assay workflow is summarized in Figure 7. Briefly, in the first step, biotinylated, mutation-specific capture probes (C1-C14) are immobilized on streptavidin-coated magnetic beads, selectively binding either wild-type or mutant miRNA sequences. In the second step, a linker probe—designed using the Peyrard–Bishop mesoscopic model—binds to the 5′ end of the miRNA and incorporates a calf thymus DNA (CTD) booster sequence to enhance the fluorescence signal.
The detection is achieved using QuantiFluor dye, which was selected after systematic evaluation of five fluorophores (EvaGreen, AccuClear, QuantiFluor, Acridine Orange, and Thiazole Orange) for photostability and emission performance [97]. QuantiFluor provided the most stable signal with minimal photobleaching (2.5% over seven cycles) and enabled the assay to achieve a LoD of 2.2 pM.
The assay was validated using plasma samples from 20 colorectal cancer patients, 24 patients with colitis, and 20 healthy controls. It successfully identified distinct SNP profiles in miR-128-2-3p that correlated with disease status [94,95]. Notably, mutations at the 3’-2 position (U>G and U>C) were found to be significantly elevated in diseased samples, suggesting their potential as biomarkers for colorectal cancer and colitis.
This technology offers several key advantages: a) It enables simultaneous miRNA detection and SNP analysis in a single assay. b) It is completely enzyme-free and amplification-free, reducing assay complexity, cost, and technical variability. c) It provides high specificity and discrimination for SNPs, with melting temperature differences (ΔTm) ranging from 6.6°C to 25.5°C between perfectly matched and mismatched sequences. d) The bead-based format supports multiplexing and high-throughput screening, making it suitable for large-scale clinical applications. e) Compared to traditional enzymatic assays, it significantly simplifies the workflow while delivering robust sensitivity and reproducibility.
Overall, this tandem hybridisation assay is a powerful and cost-effective platform for directly detecting miRNAs and their SNP variants from plasma. It has strong potential for clinical translation in the areas of early cancer diagnosis and personalised medicine. However, further refinements are required to improve its multiplexing capabilities, automate sample processing and validate its performance across different patient groups. Nevertheless, the assay remains a promising, amplification-free approach for non-invasive cancer diagnostics, providing a rapid, sensitive and scalable tool for miRNA mutation profiling in clinical settings.
3.5. Dynamic Chemical Labelling
Dynamic Chemical Labelling (DCL) is a chemical-based nucleic acid testing (NAT) strategy developed to directly detect and quantify circulating miRNAs without the need for extraction, reverse transcription, or enzymatic amplification [98]. Unlike conventional techniques, DCL relies on a sequence-selective chemical labelling process that provides exceptional specificity, single-nucleotide discrimination, and direct detection in complex biological fluids [99].
As shown in Figure 8, the DCL detection process involves two highly controlled molecular steps. First, an abasic PNA probe selectively hybridises to the complementary miRNA sequence, forming a chemical pocket at the abasic site. Once hybridisation is complete, a SMART base with a specific labelling tag, such as biotin, is covalently incorporated into the abasic site. This creates a chemical lock that tags the abasic PNA probe-miRNA duplex for detection. The labelled duplex is then recognised by a reporter molecule — typically a streptavidin-conjugated detection system — enabling signal generation across a variety of platforms [99,100,101,102,103,104]. A key feature of DCL is its dual molecular requirement for signal generation: a) Perfect hybridization between the miRNA and the abasic PNA probe; b) Selective molecular recognition and covalent incorporation of the SMART base following Watson–Crick base-pairing rules. If either event fails, the SMART base is not incorporated, resulting in 100% specificity [103,105].
This dual specificity drastically reduces false positives and allows single-nucleotide specificity, a rare feature in amplification-free miRNA detection systems [100,106,107]. The labelled abasic PNA probe–miRNA duplexes can be detected using various optical and bead-based platforms, making DCL highly versatile [108,109,110].
Importantly, the sensitivity of DCL is not intrinsic to the chemistry itself, but rather is determined by the detection platform with which it is integrated. DCL is a versatile technology that can be successfully integrated with various platforms, including fluorescence-based and chemiluminescence detection systems, as well as silicon photomultiplier (SiPM)-based readers and time-gated luminescence imaging systems [99,101,104,111,112]. This flexibility allows the sensitivity, throughput, and multiplexing capability of the system to be adjusted according to the specific platform, application, and target RNA or DNA [110,113,114,115,116]. It also enables the simultaneous detection of miRNAs and proteins associated with liquid biopsy [111,117].
The group has successfully applied DCL technology to analyse circulating hsa-miR-21-5p (miR-21) in patients with non-small cell lung cancer (NSCLC) [118]. To achieve this, DCL was combined with a novel SiPM-based optical reader, resulting in the development of the innovative ODG platform [119]. This method utilized biotinylated SMART bases and abasic PNA probes specifically designed to capture miR-21 sequences, enabling highly selective, sequence-specific miRNA detection. The captured and labelled miRNAs were detected through a chemiluminescent reaction, in which streptavidin-conjugated horseradish peroxidase (HRP) catalyzed the luminol oxidation, generating a light signal. This signal was subsequently measured and analyzed using the SiPM-based reader. The platform achieved a LoD of 4.7 pmol/L and successfully identified miR-21 in plasma samples from NSCLC patients. Although this approach provided accurate, amplification-free quantification of miRNAs, it faced challenges related to signal stability and background noise, which are inherent limitations of chemiluminescence-based detection systems. miR-21 was also interrogated using DCL technology merged with flow cytometry in a PCR-free manner as reported in [120].
In 2024, it was developed a multiplexed miRNA detection platform that integrated DCL with time-gated photoluminescence imaging (TG-PLIM) to enhance signal and significantly reduce background interference. Similar to the previously developed ODG platform, this system employed abasic PNA probes and SMART bases. However, instead of using chemiluminescence detection, the platform was adapted to a fluorescence-based detection system that utilized fluorophores with long luminescence lifetimes, specifically lanthanide-based luminescent probes such as Eu(III) cryptates conjugated to the SMART base [70].
In this novel application of DCL, the system was designed to simultaneously detect three clinically relevant miRNAs involved in cancer diagnostics: a) miR-122-5p (miR-122), increasingly recognized as a potential biomarker for cancer diagnosis and prognosis due to its dysregulation in various cancers [121] b) miR-371a-3p (miR-371), a well-validated biomarker for germ cell tumors, commonly used in both clinical and research settings [122] c) miR-451a-5p (miR-451), an erythroid cell-specific miRNA with emerging relevance as a biomarker in cancer diagnostics and therapeutic response monitoring [123].
In this study, magnetic beads functionalized with specific abasic PNA capture probes (capturing beads) were combined with SMART bases labelled with DTBTA-Eu cryptates and conventional fluorophores such as FAM and Cy5, enabling the simultaneous detection of three miRNA targets within the same assay (Figure 9A). A key advantage of using DTBTA-Eu cryptates is their long luminescence lifetime of 1.09 ms, which allows error-free multiplexing by separating signal detection into distinct time windows, effectively preventing photon crosstalk [124]. Following bead incubation, the DCL reaction, and time-resolved imaging, spectral and lifetime filtering were applied to differentiate each miRNA based on its distinct emission properties (Figure 9B-C) TG-PL intensity images of individual beads demonstrated a concentration-dependent detection of miRNAs, with a linear correlation between TG-PL emission intensity and miRNAs concentrations.
The system achieved a LoD of 1.4 nM for miR-122, validating its sensitivity for detecting clinically relevant miRNA levels in human serum. The combination of spectral and temporal separation enabled the simultaneous detection of multiple miRNAs in a single assay, each assigned a unique fluorescent label. The labelled beads were further analyzed using machine learning algorithms, which classified and quantified the detected miRNAs with high accuracy and minimal misclassification.
This study successfully demonstrated the proof of concept for a multiplexed miRNA detection platform using DCL and TG-PLIM. The platform exhibited high specificity and the ability to simultaneously detect three cancer-related miRNAs. While the achieved LoD of 1.4 nM confirms the platform’s clinical potential, further improvements are essential to reach the femtomolar to picomolar range typical of circulating miRNAs. The group is currently working to enhance sensitivity in order to unlock the full diagnostic potential of the platform.
4. Conclusion and Future Direction
Each of the amplification-free miRNA detection methods discussed in this review has its own advantages and limitations. Conventional approaches, such as qRT-PCR, microarrays and NGS, remain widely used for miRNA analysis. However, they are not ideally suited to the detection of circulating miRNAs in clinical samples. These techniques often involve complex, labour-intensive workflows that include RNA extraction, enzymatic amplification and labelling steps. These steps introduce potential biases, increase the risk of contamination and lengthen assay times.
Recent advancements in amplification-free technologies are beginning to overcome these barriers. These novel strategies have the potential to streamline workflows, reduce costs and enable rapid point-of-care diagnostics. Many of these novel strategies are compatible with bead-based and multiplexed detection platforms, and represent a significant step forward by enabling the direct analysis of mature miRNAs in body fluids without the need for nucleic acid extraction and amplification. This capability is essential for improving the robustness, reproducibility and diagnostic accuracy of circulating miRNA assays.
Of the reviewed technologies, DCL is one of the most notable, as it is a highly versatile and scalable platform. Its unique dual molecular recognition mechanism ensures single-nucleotide specificity, and its platform-agnostic nature enables integration with various detection systems, such as fluorescence-, chemiluminescence- and time-gated photoluminescence-based imaging. DCL’s ability to multiplex and simultaneously detect multiple circulating miRNAs — and potentially even proteins — directly in biological fluids makes it a particularly promising tool for liquid biopsy applications.
Furthermore, the direct, amplification-free detection of circulating miRNAs is crucial to realising their full potential and clinical value in cancer diagnostics. This was recently recognised by the 2024 Nobel Prize in Medicine, which highlighted the transformative role of circulating nucleic acids — particularly miRNAs — as groundbreaking biomarkers for non-invasive disease detection. miRNAs are now well-established as critical regulators of cancer-related pathways, and their differential expression patterns across cancer types, disease stages and therapeutic responses make them ideal candidates for non-invasive, real-time biomarker discovery. Reliably detecting these miRNAs without complex pre-processing not only simplifies clinical workflows, but also enhances the potential to utilise miRNAs as powerful diagnostic, prognostic and predictive tools.
Additionally, technologies that do not require amplification have potential applications beyond the direct detection and quantification of miRNAs for other RNA species, such as circular RNAs (circRNAs) and long non-coding RNAs (lncRNAs), without the need for nucleic acid extraction, reverse transcription or amplification [125,126]. Some of these expanded applications are currently under development within our group.
Looking ahead, the continued development of more refined, multiplexed and user-friendly methods of detecting miRNAs is essential to accelerating the clinical adoption of liquid biopsy diagnostics. Technologies that can realise the full clinical potential of circulating miRNAs by offering high specificity, rapid analysis, minimal sample preparation, and the ability to detect low-abundance targets in complex biological matrices are likely to lead the next wave of innovation in molecular diagnostics. Ultimately, amplification-free direct detection platforms could realise the full potential of miRNAs in cancer diagnostics, revolutionising clinical practice by enabling earlier disease detection and more precise monitoring.
Reference
- Siegel RL, Giaquinto AN, Jemal A. Cancer statistics, 2024. CA Cancer J Clin. 2024;74(1):12–49.
- Dizon DS, Kamal AH. Cancer statistics 2024: All hands on deck. CA Cancer J Clin. 2024;74(1):8–9. [CrossRef]
- Dela J Public Health. American Cancer Society. American Cancer Society Annual Cancer Statistics 2024 Shows Drop in Cancer Mortality but Increasing Incidence for Six of the Top Ten Cancers. 2024;10(3):6–7.
- Miller KD, Nogueira L, Devasia T, Mariotto AB, Yabroff KR, Jemal A, et al. Cancer treatment and survivorship statistics, 2022. CA Cancer J Clin. 2022;72(5):409–36. [CrossRef]
- Armakolas A, Kotsari M, Koskinas J. Liquid Biopsies, Novel Approaches and Future Directions. Cancers (Basel). 2023;15(5). [CrossRef]
- Ma L, Guo H, Zhao Y, Liu Z, Wang C, Bu J, et al. Liquid biopsy in cancer current: status, challenges and future prospects. Signal Transduct Target Ther. 2024;9(1):336.
- Takizawa S, Matsuzaki J, Ochiya T. Circulating microRNAs: Challenges with their use as liquid biopsy biomarkers. Cancer Biomarkers. 2022;35(1):1–9. [CrossRef]
- Tivey A, Church M, Rothwell D, Dive C, Cook N. Circulating tumour DNA — looking beyond the blood. Nat Rev Clin Oncol. 2022;19(9):600–12. [CrossRef]
- Sallam RM. Proteomics in cancer biomarkers discovery: Challenges and applications. Dis Markers. 2015; 2015:321370. [CrossRef] [PubMed]
- Shi J, Zhang Y, Fan Y, Liu Y, Yang M. Recent advances in droplet-based microfluidics in liquid biopsy for cancer diagnosis. Droplet. 2024;3(1):e92. [CrossRef]
- Primorac D, Ciechanover A. Personalized medicine: the future is here. Croat Med J. 2024;65(3):169–73.
- Bartel DP. Review MicroRNAs: Genomics, Biogenesis, Mechanism, and Function. Cell. 2004; 116:281–97. [CrossRef] [PubMed]
- Li Z, Xu R, Li N. MicroRNAs from plants to animals, do they define a new messenger for communication? Nutr Metab (Lond). 2018;15(1):68.
- Ratti M, Lampis A, Ghidini M, Salati M, Mirchev MB, Valeri N, et al. MicroRNAs (miRNAs) and Long Non-Coding RNAs (lncRNAs) as New Tools for Cancer Therapy: First Steps from Bench to Bedside. Target Oncol. 2020;15(3):261–78. [CrossRef]
- Ha TY. MicroRNAs in Human Diseases: From Cancer to Cardiovascular Disease. Immune Netw. 2011;11(3):135. [CrossRef] [PubMed]
- Metcalf GAD. MicroRNAs: circulating biomarkers for the early detection of imperceptible cancers via biosensor and machine-learning advances. Oncogene. 2024;43(28):2135–42. [CrossRef]
- Burki T. 2024 Nobel Prize awarded for work on microRNAs. The Lancet. 2024;404(10462):1507–8. [CrossRef] [PubMed]
- Felekkis K, Papaneophytou C. The Circulating Biomarkers League: Combining miRNAs with Cell-Free DNAs and Proteins. Int J Mol Sci. 2024;25(6):3403. [CrossRef]
- Chakrabortty A, Patton DJ, Smith BF, Agarwal P. miRNAs: Potential as Biomarkers and Therapeutic Targets for Cancer. Genes (Basel). 2023;14(7):1375. [CrossRef]
- Cicatiello AG, Musone M, Imperatore S, Giulioni C, La Rocca R, Cafarelli A, et al. Circulating miRNAs in genitourinary cancer: pioneering advances in early detection and diagnosis. The Journal of Liquid Biopsy. 2025; 8:100296. [CrossRef]
- Berger F, Reiser MF. Micro-RNAs as potential new molecular biomarkers in oncology: Have they reached relevance for the clinical imaging sciences? Theranostics. 2013;3(12):943–52. [CrossRef]
- Condrat CE, Thompson DC, Barbu MG, Bugnar OL, Boboc A, Cretoiu D, et al. MiRNAs as biomarkers in disease: Latest findings regarding their role in diagnosis and prognosis. Cells. 2020;9(2):276. [CrossRef]
- Lan H, Lu H, Wang X, Jin H. MicroRNAs as potential biomarkers in cancer: Opportunities and challenges. Biomed Res Int. 2015; 2015:125094. [CrossRef]
- Das S, Dey MK, Devireddy R, Gartia MR. Biomarkers in Cancer Detection, Diagnosis, and Prognosis. Sensors. 2024;24(1):37.
- Cui C, Cui Q. The relationship of human tissue microRNAs with those from body fluids. Sci Rep. 2020;10(1):5644. [CrossRef]
- Norouzi S, Soltani S, Alipour E. Recent advancements in biosensor designs toward the detection of intestine cancer miRNA biomarkers. Int J Biol Macromol. 2023; 245:125509. [CrossRef]
- Quang MT, Nguyen MN. The potential of microRNAs in cancer diagnostic and therapeutic strategies: a narrative review. The Journal of Basic and Applied Zoology. 2024;85(1):7. [CrossRef]
- Mou G, Wang K, Xu D, Zhou G. Evaluation of three RT-qPCR-based miRNA detection methods using seven rice miRNAs. Biosci Biotechnol Biochem. 2013;77(6):1349–53. [CrossRef]
- Falak S, O’sullivan DM, Cleveland MH, Cowen S, Busby EJ, Devonshire AS, et al. The Application of Digital PCR as a Reference Measurement Procedure to Support the Accuracy of Quality Assurance for Infectious Disease Molecular Diagnostic Testing. Clin Chem. 2025; 71:378–86. [CrossRef]
- Strutt R, Xiong B, Abegg VF, Dittrich PS. Open microfluidics: droplet microarrays as next generation multiwell plates for high throughput screening. Lab Chip. 2024;24(5):1064–75. [CrossRef]
- Satam H, Joshi K, Mangrolia U, Waghoo S, Zaidi G, Rawool S, et al. Next-Generation Sequencing Technology: Current Trends and Advancements. Biology (Basel). 2023;12(7):977. [CrossRef]
- Precazzini F, Detassis S, Imperatori AS, Denti MA, Campomenosi P. Measurements Methods for the Development of MicroRNA-Based Tests for Cancer Diagnosis. Int J Mol Sci. 2021;22(3):1176. [CrossRef]
- Hong M, Tao S, Zhang L, Diao LT, Huang X, Huang S, et al. RNA sequencing: new technologies and applications in cancer research. J Hematol Oncol. 2020;13(1):166. [CrossRef]
- Zhang L, Hou D, Chen X, Li D, Zhu L, Zhang Y, et al. Exogenous plant MIR168a specifically targets mammalian LDLRAP1: Evidence of cross-kingdom regulation by microRNA. Cell Res. 2012;22(1):107–26.
- Gines G, Menezes R, Xiao W, Rondelez Y, Taly V. Emerging isothermal amplification technologies for microRNA biosensing: Applications to liquid biopsies. Molecular Aspects of Medicine. Elsevier Ltd. 2020;72. [CrossRef]
- Redshaw N, Wilkes T, Whale A, Cowen S, Huggett J, Foy CA. A comparison of miRNA isolation and RT-qPCR technologies and their effects on quantification accuracy and repeatability. Biotechniques. 2013;54(3):155–64. [CrossRef]
- Kuang J, Yan X, Genders AJ, Granata C, Bishop DJ. An overview of technical considerations when using quantitative real-time PCR analysis of gene expression in human exercise research. PLoS One. 2018;13(5): e0196438. [CrossRef]
- Sanders R, Mason DJ, Foy CA, Huggett JF. Considerations for accurate gene expression measurement by reverse transcription quantitative PCR when analysing clinical samples. Anal Bioanal Chem. 2014;406(26):6471–83. [CrossRef]
- Choi C, Yoon S, Moon H, Bae YU, Kim C Bin, Diskul-Na-Ayudthaya P, et al. mirRICH, a simple method to enrich the small RNA fraction from over-dried RNA pellets. RNA Biol. 2018;15(6):763–72. [CrossRef]
- Ginzinger DG. Gene quantification using real-time quantitative PCR: An emerging technology hits the mainstream. Exp Hematol. 2002; 30:503–12. [CrossRef] [PubMed]
- Chen C, TR, WL, FR, HJ. Quantitation of MicroRNAs by Real-Time RT-qPCR. In: PCR Protocols. Humana Press; 2011. 43–55.
- Tajadini M, Panjehpour M, Javanmard S. Comparison of SYBR Green and TaqMan methods in quantitative real-time polymerase chain reaction analysis of four adenosine receptor subtypes. Adv Biomed Res. 2014;3(1):85. [CrossRef]
- Pinheiro LB, Coleman VA, Hindson CM, Herrmann J, Hindson BJ, Bhat S, et al. Evaluation of a droplet digital polymerase chain reaction format for DNA copy number quantification. Anal Chem. 2012;84(2):1003–11. [CrossRef]
- Quan PL, Sauzade M, Brouzes E. DPCR: A technology review. Sensors (Switzerland). 2018;18(4):1271. [CrossRef]
- Binderup HG, Madsen JS, Helweg Heegaard NH, Houlind K, Andersen RF, Brasen CL. Quantification of microRNA levels in plasma – Impact of preanalytical and analytical conditions. PLoS One. 2018;13(7):1–13. [CrossRef]
- Rački N, Dreo T, Gutierrez-Aguirre I, Blejec A, Ravnikar M. Reverse transcriptase droplet digital PCR shows high resilience to PCR inhibitors from plant, soil and water samples. Plant Methods. 2014;10(1):1–10. [CrossRef]
- Chen C, Ridzon DA, Broomer AJ, Zhou Z, Lee DH, Nguyen JT, et al. Real-time quantification of microRNAs by stem-loop RT-PCR. Nucleic Acids Res. 2005;33(20):1–9. [CrossRef]
- Beaulieu YB, Kleinman CL, Landry-Voyer AM, Majewski J, Bachand F. Polyadenylation-Dependent Control of Long Noncoding RNA Expression by the Poly(A)-Binding Protein Nuclear 1. PLoS Genet. 2012;8(11): e1003078. [CrossRef]
- Nejad C, Pépin G, Behlke MA, Gantier MP. Modified polyadenylation-based RT-qPCR increases selectivity of amplification of 3’-MicroRNA isoforms. Front Genet. 2018; 9:11. [CrossRef]
- Rao MS, Van Vleet TR, Ciurlionis R, Buck WR, Mittelstadt SW, Blomme EAG, et al. Comparison of RNA-Seq and microarray gene expression platforms for the toxicogenomic evaluation of liver from short-term rat toxicity studies. Front Genet. 2019; 9:636. [CrossRef]
- Love C, DS. MicroRNA Expression Profiling Using Microarrays. In: Hematological Malignancies Methods and Protocols. Humana Press, Totowa, NJ; 2013.
- Dave VP, Ngo TA, Pernestig AK, Tilevik D, Kant K, Nguyen T, et al. MicroRNA amplification and detection technologies: opportunities and challenges for point of care diagnostics. Laboratory Investigation. 2019;99(4):452–69. [CrossRef]
- Jet T, Gines G, Rondelez Y, Taly V. Advances in multiplexed techniques for the detection and quantification of microRNAs. Chem Soc Rev. 2021;50(6):4141–61. [CrossRef]
- Li W, Ruan K. MicroRNA detection by microarray. Anal Bioanal Chem. 2009;394(4):1117–24.
- Git A, Dvinge H, Salmon-Divon M, Osborne M, Kutter C, Hadfield J, et al. Systematic comparison of microarray profiling, real-time PCR, and next-generation sequencing technologies for measuring differential microRNA expression. RNA. 2010;16(5):991–1006. [CrossRef]
- Del Vescovo V, Meier T, Inga A, Denti MA, Borlak J. A cross-platform comparison of Affymetrix and Agilent microarrays reveals discordant miRNA expression in lung tumors of c-Raf transgenic mice. PLoS One. 2013;8(11): e78870. [CrossRef]
- Mestdagh P, Hartmann N, Baeriswyl L, Andreasen D, Bernard N, Chen C, et al. Evaluation of quantitative mirnA expression platforms in the micrornA quality control (mirQC) study. Nat Methods. 2014;11(8):809–15.
- Willenbrock H, Salomon J, Søkilde R, Barken KB, Hansen TN, Nielsen FC, et al. Quantitative miRNA expression analysis: Comparing microarrays with next-generation sequencing. RNA. 2009;15(11):2028–34. [CrossRef]
- Meng Y, Ma X, Li J, Shao C. Creating and maintaining a high-confidence microRNA repository for crop research: A brief review and re-examination of the current crop microRNA registries. J Plant Physiol. 2022; 270:153636. [CrossRef]
- Li YPMBIFAGSLA et al. NGS library preparation using NEXTFLEX Rapid Directional RNAseq kit (NOVA-5138-08) for animal tissue samples. PLOS ONE Journal contribution. 2025.
- Fuchs RT, Sun Z, Zhuang F, Robb GB. Bias in ligation-based small RNA sequencing library construction is determined by adaptor and RNA structure. PLoS One. 2015;10(5): e0126049. [CrossRef]
- Wang B, Sun F, Luan Y. Comparison of the effectiveness of different normalization methods for metagenomic cross-study phenotype prediction under heterogeneity. Sci Rep. 2024;14(1):7024. [CrossRef]
- Zhao S, Ye Z, Stanton R. Misuse of RPKM or TPM normalization when comparing across samples and sequencing protocols. RNA. 2020;26(8):903-909. [CrossRef]
- Cheng C, Fei Z, Xiao P. Methods to improve the accuracy of next-generation sequencing. Front Bioeng Biotechnol. 2023; 11:982111. [CrossRef]
- Bustin S, Dhillon HS, Kirvell S, Greenwood C, Parker M, Shipley GL, et al. Variability of the reverse transcription step: Practical implications. Clin Chem. 2015;61(1):202–12. [CrossRef]
- Masterson AN, Chowdhury NN, Fang Y, Yip-Schneider MT, Hati S, Gupta P, et al. Amplification-Free, High-Throughput Nanoplasmonic Quantification of Circulating MicroRNAs in Unprocessed Plasma Microsamples for Earlier Pancreatic Cancer Detection. ACS Sens. 2023;8(3):1085–100. [CrossRef]
- Cai S, Pataillot-Meakin T, Shibakawa A, Ren R, Bevan CL, Ladame S, et al. Single-molecule amplification-free multiplexed detection of circulating microRNA cancer biomarkers from serum. Nat Commun. 2021;12(1):3515. [CrossRef]
- Shanmugam ST, Campos R, Trashin S, Daems E, Carneiro D, Fraga A, et al. Singlet oxygen-based photoelectrochemical detection of miRNAs in prostate cancer patients’ plasma: A novel diagnostic tool for liquid biopsy. Bioelectrochemistry. 2024; 158:108698. [CrossRef]
- Ferreira I, Slott S, Schi C. Mutations in microRNA-128-2-3p identified with amplification-free hybridization assay. PLoS One. 2023;22;18(8): e0289556.
- Padial-Jaudenes M, Tabraue-Chávez M, Detassis S, Ruedas-Rama MJ, Gonzalez-Garcia MC, Fara MA, et al. Multiplexed MicroRNA biomarker detection by bridging lifetime filtering imaging and dynamic chemical labeling. Sens Actuators B Chem. 2024; 417:136136. [CrossRef]
- Sarantis P, Koustas E, Papadimitropoulou A, Papavassiliou AG, Karamouzis M V. Pancreatic ductal adenocarcinoma: Treatment hurdles, tumor microenvironment and immunotherapy. World J Gastrointest Oncol. 2020;12(2):173–81. [CrossRef]
- Beatty GL, Werba G, Lyssiotis CA, Simeone DM. The biological underpinnings of therapeutic resistance in pancreatic cancer. Genes Dev. 2021;35(13):940–62. [CrossRef]
- Willets KA, Van Duyne RP. Localized surface plasmon resonance spectroscopy and sensing. Annu Rev Phys Chem. 2007; 58:267–97.
- Mayer KM, Hafner JH. Localized surface plasmon resonance sensors. Chem Rev. 2011;111(6):3828–57.
- Kelly KL, Coronado E, Zhao LL, Schatz GC. The optical properties of metal nanoparticles: The influence of size, shape, and dielectric environment. Journal of Physical Chemistry B. 2003;107(3):668–77. [CrossRef]
- Joshi GK, Deitz-McElyea S, Liyanage T, Lawrence K, Mali S, Sardar R, et al. Label-Free Nanoplasmonic-Based Short Noncoding RNA Sensing at Attomolar Concentrations Allows for Quantitative and Highly Specific Assay of MicroRNA-10b in Biological Fluids and Circulating Exosomes. ACS Nano. 2015;9(11):11075–89. [CrossRef]
- Joshi GK, Deitz-Mcelyea S, Johnson M, Mali S, Korc M, Sardar R. Highly specific plasmonic biosensors for ultrasensitive MicroRNA detection in plasma from pancreatic cancer patients. Nano Lett. 2014;14(12):6955–63. [CrossRef]
- Couture M, Ray KK, Poirier-Richard HP, Crofton A, Masson JF. 96-Well Plasmonic Sensing with Nanohole Arrays. ACS Sens. 2016;1(3):287–94. [CrossRef]
- Salleh S, Thyagarajan A, Sahu RP. Exploiting the relevance of CA 19-9 in pancreatic cancer. J Cancer Metastasis Treat. 2020; 6:31. [CrossRef]
- Cheng JJ, Matsumoto Y, Dombek GE, Stackhouse KA, Ore AS, Glickman JN, et al. Differential expression of CD175 and CA19-9 in pancreatic adenocarcinoma. Sci Rep. 2025;15(1):4177. [CrossRef]
- Quirico L, Orso F. The power of microRNAs as diagnostic and prognostic biomarkers in liquid biopsies. Cancer Drug Resistance. 2020;3(2):117–39. [CrossRef]
- Rawla P. Epidemiology of Prostate Cancer. World J Oncol. 2019;10(2):63-89. [CrossRef] [PubMed]
- Zedan AH, Osther PJS, Assenholt J, Madsen JS, Hansen TF. Circulating miR-141 and miR-375 are associated with treatment outcome in metastatic castration resistant prostate cancer. Sci Rep. 2020;10(1):227. [CrossRef]
- Liu C, Liu R, Zhang D, Deng Q, Liu B, Chao HP, et al. MicroRNA-141 suppresses prostate cancer stem cells and metastasis by targeting a cohort of pro-metastasis genes. Nat Commun. 2017;8(1):14270. [CrossRef]
- Brase JC, Johannes M, Schlomm T, Haese A, Steuber T, Beissbarth T, et al. Circulating miRNAs are correlated with tumor progression in prostate cancer. Int J Cancer. 2011;128(3):608–16. [CrossRef]
- Trashin S, Rahemi V, Ramji K, Neven L, Gorun SM, De Wael K. Singlet oxygen-based electrosensing by molecular photosensitizers. Nat Commun. 2017;8(1):16108. [CrossRef]
- Daems E, Bassini S, Mariën L, Op de Beeck H, Stratulat A, Zwaenepoel K, et al. Singlet oxygen-based photoelectrochemical detection of single-point mutations in the KRAS oncogene. Biosens Bioelectron. 2024; 249:1–7. [CrossRef]
- Shanmugam ST, Trashin S, De Wael K. Singlet oxygen-based photoelectrochemical detection of DNA. Biosens Bioelectron. 2022; 195:113652. [CrossRef]
- Verrucchi M, Giacomazzo GE, Sfragano PS, Laschi S, Conti L, Pagliai M, et al. Characterization of a Ruthenium(II) Complex in Singlet Oxygen-Mediated Photoelectrochemical Sensing. Langmuir. 2023;39(1):679–89. [CrossRef]
- Sita-Lumsden A, Fletcher CE, Dart DA, Brooke GN, Waxman J, Bevan CL. Circulating nucleic acids as biomarkers of prostate cancer. Biomark Med. 2013;7(6):867–77. [CrossRef]
- Shen J, Hruby GW, McKiernan JM, Gurvich I, Lipsky MJ, Benson MC, et al. Dysregulation of circulating microRNAs and prediction of aggressive prostate cancer. Prostate. 2012;72(13):1469–77. [CrossRef]
- Xu Y, Qin S, An T, Tang Y, Huang Y, Zheng L. MiR-145 detection in urinary extracellular vesicles increase diagnostic efficiency of prostate cancer based on hydrostatic filtration dialysis method. Prostate. 2017;77(10):1167–75. [CrossRef] [PubMed]
- Garg S, Sachdeva A, Peeters M, McClements J. Point-of-Care Prostate Specific Antigen Testing: Examining Translational Progress toward Clinical Implementation. ACS Sens. 2023;8(10):3643–58. [CrossRef]
- Fajardo P, Taskova M, Martín-Serrano MA, Hansen J, Slott S, Jakobsen AK, et al. p38γ and p38δ as biomarkers in the interplay of colon cancer and inflammatory bowel diseases. Cancer Commun. 2022;42(9):897–901. [CrossRef]
- Fonseca A RSMAP das NRMACBPRV. Identification of colorectal cancer associated biomarkers: an integrated analysis of miRNA expression. Aging (Albany NY). 2021;13(18):21991–2029.
- Domljanovic I, Taskova M, Miranda P, Weber G, Astakhova K. Optical and theoretical study of strand recognition by nucleic acid probes. Commun Chem. 2020;3(1):111. [CrossRef]
- Kalies S, Kuetemeyer K, Heisterkamp A, Denk W, Strickler JH, Webb WW. Mechanisms of high-order photobleaching and its relationship to intracellular ablation. Biomed Opt Express. 2011;2(4):805–16.
- Bowler FR, Diaz-Mochon JJ, Swift MD, Bradley M. DNA analysis by dynamic chemistry. Angewandte Chemie - International Edition. 2010;49(10):1809–12.
- Venkateswaran S, Luque-González MA, Tabraue-Chávez M, Fara MA, López-Longarela B, Cano-Cortes V, et al. Novel bead-based platform for direct detection of unlabelled nucleic acids through Single Nucleobase Labelling. Talanta. 2016; 161:489–96. [CrossRef]
- Rissin DM, López-Longarela B, Pernagallo S, Ilyine H, Vliegenthart ADB, Dear JW, et al. Polymerase-free measurement of microRNA-122 with single base specificity using single molecule arrays: Detection of drug-induced liver injury. PLoS One. 2017;12(7): e0179669.
- Garcia-Fernandez E, Gonzalez-Garcia MC, Pernagallo S, Ruedas-Rama MJ, Fara MA, López-Delgado FJ, et al. MiR-122 direct detection in human serum by time-gated fluorescence imaging. Chemical Communications. 2019;55(99):14958–61. [CrossRef]
- Marín-Romero A, Robles-Remacho A, Tabraue-ChAvez M, López-Longarela Ba, SAnchez-Martín RM, Guardia-Monteagudo JJ, et al. A PCR-free technology to detect and quantify microRNAs directly from human plasma. Analyst. 2018 Dec 7;143(23):5676–82. [CrossRef]
- Morrison EE, Tranter JD, Chahman-vos L, Gautier J charles, Lartigau A, Boitier E, et al. Direct Detection of miR-122 in Hepatotoxicity Using Dynamic Chemical Labeling Overcomes Stability and isomiR Challenges. Anal Chem. 2020; 92:3388–95. [CrossRef]
- Marín-romero A, Tabraue-chávez M, Dear JW, Sánchez-martín RM, Ilyine H, Guardia-monteagudo JJ, et al. Talanta Amplification-free profiling of microRNA-122 biomarker in DILI patient serums, using the luminex MAGPIX system. Talanta. 2020; 219:121265.
- Marín-Romero A, Di Zeo-Sánchez DE, Tabraue-Chávez M, Villanueva-Paz M, Pinazo-Bandera JM, Sanabria-Cabrera J, et al. Short communication: miRNA122 interrogation via PCR-Free method to track liver recovery. PLoS One. 2025;20(5): e0324858. [CrossRef]
- Robles-Remacho A, Martos-Jamai I, Tabraue-Chávez M, Aguilar-González A, Laz-Ruiz JA, Cano-Cortés MV, et al. Click chemistry-based dual nanosystem for microRNA-122 detection with single-base specificity from tumour cells. Journal of Nanobiotechnology. 2024;22(1):791. [CrossRef]
- Robles-Remacho A, Luque-Gonzalez MA, López-Delgado FJ, Guardia-Monteagudo JJ, Fara MA, Pernagallo S, et al. Direct detection of alpha satellite DNA with single-base resolution by using abasic Peptide Nucleic Acids and Fluorescent in situ Hybridization. Biosens Bioelectron. 2023; 219:114770. [CrossRef]
- Pernagallo S, Ventimiglia G, Cavalluzzo C, Alessi E, Ilyine H, Bradley M, et al. Novel biochip platform for nucleic acid analysis. Sensors. 2012;12(6):8100–11. [CrossRef]
- Marín-Romero A, Pernagallo S. A comprehensive review of Dynamic Chemical Labelling on Luminex xMAP technology: a journey towards Drug-Induced Liver Injury testing. Analytical Methods. 2023;15(45):6139–49. [CrossRef]
- Marín-Romero A, Tabraue-Chávez M, Dear JW, Díaz-Mochón JJ, Pernagallo S. Open a new window in the world of circulating microRNAs by merging ChemiRNA Tech with a Luminex platform. Sensors and Diagnostics. 2022;1(6):1243–51. [CrossRef]
- Detassis S, Precazzini F, Brentari I, Ruffilli R, Ress C, Maglione A, et al. SA-ODG platform: a semi-automated and PCR-free method to analyse microRNAs in solid tissues. Analyst. 2024;149(15):3891–9. [CrossRef]
- Marín-Romero A, Regele V, Kolanovic D, Hofner M, Díaz-Mochón JJ, Nöhammer C, et al. MAGPIX and FLEXMAP 3D Luminex platforms for direct detection of miR-122-5p through dynamic chemical labelling. Analyst. 2023;148(22):5658–66. [CrossRef]
- Tabraue-Chávez M, Luque-González MA, Marín-Romero A, Sánchez-Martín RM, Escobedo-Araque P, Pernagallo S, et al. A colorimetric strategy based on dynamic chemistry for direct detection of Trypanosomatid species. Sci Rep. 2019;9(1):3696. [CrossRef]
- Angélica Luque-González M, Tabraue-Chávez M, López-Longarela B, María Sánchez-Martín R, Ortiz-González M, Soriano-Rodríguez M, et al. Identification of Trypanosomatids by detecting Single Nucleotide Fingerprints using DNA analysis by dynamic chemistry with MALDI-ToF. Talanta. 2018; 176:299–307. [CrossRef]
- Martín-sierra C, Tabraue M, Escobedo P, Guardia-monteagudo JJ, García-cabrera V, L FJ, et al. SARS-CoV-2 viral RNA detection using the novel CoVradar device associated with the CoVreader smartphone app Biosensors and Bioelectronics SARS-CoV-2 viral RNA detection using the novel CoVradar device associated with the CoVreader smartphone app Luis Ferm. Biosens Bioelectron. 2023; 230:115268.
- Robles-Remacho A, Martos-Jamai I, Tabraue-Chávez M, Aguilar-González A, Laz-Ruiz JA, Cano-Cortés V, et al. Click Chemistry-Driven Dual Nanosystem for miR-122 Detection with Single-Base Specificity from Tumour Cells. ChemRxiv. 2024. [CrossRef]
- Mar A, Tabraue-ch M, L B, Fara MA, Rosario MS, Dear JW, et al. Simultaneous Detection of Drug-Induced Liver Injury Protein and microRNA Biomarkers Using Dynamic Chemical Labelling on a Luminex MAGPIX System. Analytica. 2021; 2:130–9.
- Bica-Pop C, Cojocneanu-Petric R, Magdo L, Raduly L, Gulei D, Berindan-Neagoe I. Overview upon miR-21 in lung cancer: focus on NSCLC. Cellular and Molecular Life Sciences. 2018;75(19):3539–51. [CrossRef]
- Detassis S, Grasso M, Tabraue-Chávez M, Marín-Romero A, López-Longarela B, Ilyine H, et al. New Platform for the Direct Profiling of microRNAs in Biofluids. Anal Chem. 2019;91(9):5874–80. [CrossRef]
- Delgado-Gonzalez A, Robles-Remacho A, Marin-Romero A, Detassis S, Lopez-Longarela B, Lopez-Delgado FJ, et al. PCR-free and chemistry-based technology for miR-21 rapid detection directly from tumour cells. Talanta. 2019; 200:51–6. [CrossRef]
- Zhang J, Wu L, Ding R, Deng X, Chen Z. Role of miRNA-122 in cancer (Review). Int J Oncol. 2024;65(3).
- He D, Miao H, Xu Y, Xiong L, Wang Y, Xiang H, et al. MiR-371-5p facilitates pancreatic cancer cell proliferation and decreases patient survival. PLoS One. 2014;9(11): e112930. [CrossRef]
- Li Z, Li Y, Fu J, Li N, Shen L. Clinical utility of microRNA-451 as diagnostic biomarker for human cancers. Biosci Rep. 2019;39(1). [CrossRef]
- Lu Y, Lu J, Zhao J, Cusido J, Raymo FM, Yuan J, et al. On-the-fly decoding luminescence lifetimes in the microsecond region for lanthanide-encoded suspension arrays. Nat Commun. 2014; 5:3741. [CrossRef]
- Wen G, Zhou T, Gu W. The potential of using blood circular RNA as liquid biopsy biomarker for human diseases. Protein Cell. 2021;12(12):911–46. [CrossRef]
- Beylerli O, Gareev I, Sufianov A, Ilyasova T, Guang Y. Long noncoding RNAs as promising biomarkers in cancer: long non-coding RNAs and cancer. Noncoding RNA Res. 2022;7(2):66–70.
Figure 2.
Diagram of the miRNA microarray workflow. Size selection is used to enrich the total RNA for short RNA, including miRNA. Labeling is typically performed by incorporating a fluorophore during the reverse transcription and cDNA generation steps. For simplicity, the figure shows only one probe for a type of miRNA; however, multiple identical probes are present in clusters on the microarray surface and are designed to bind to identical target miRNAs. A complete microarray contains thousands of clusters, with up to 20 repetitions of the same cluster distributed across different locations on the slide. Wash steps have been omitted for clarity.
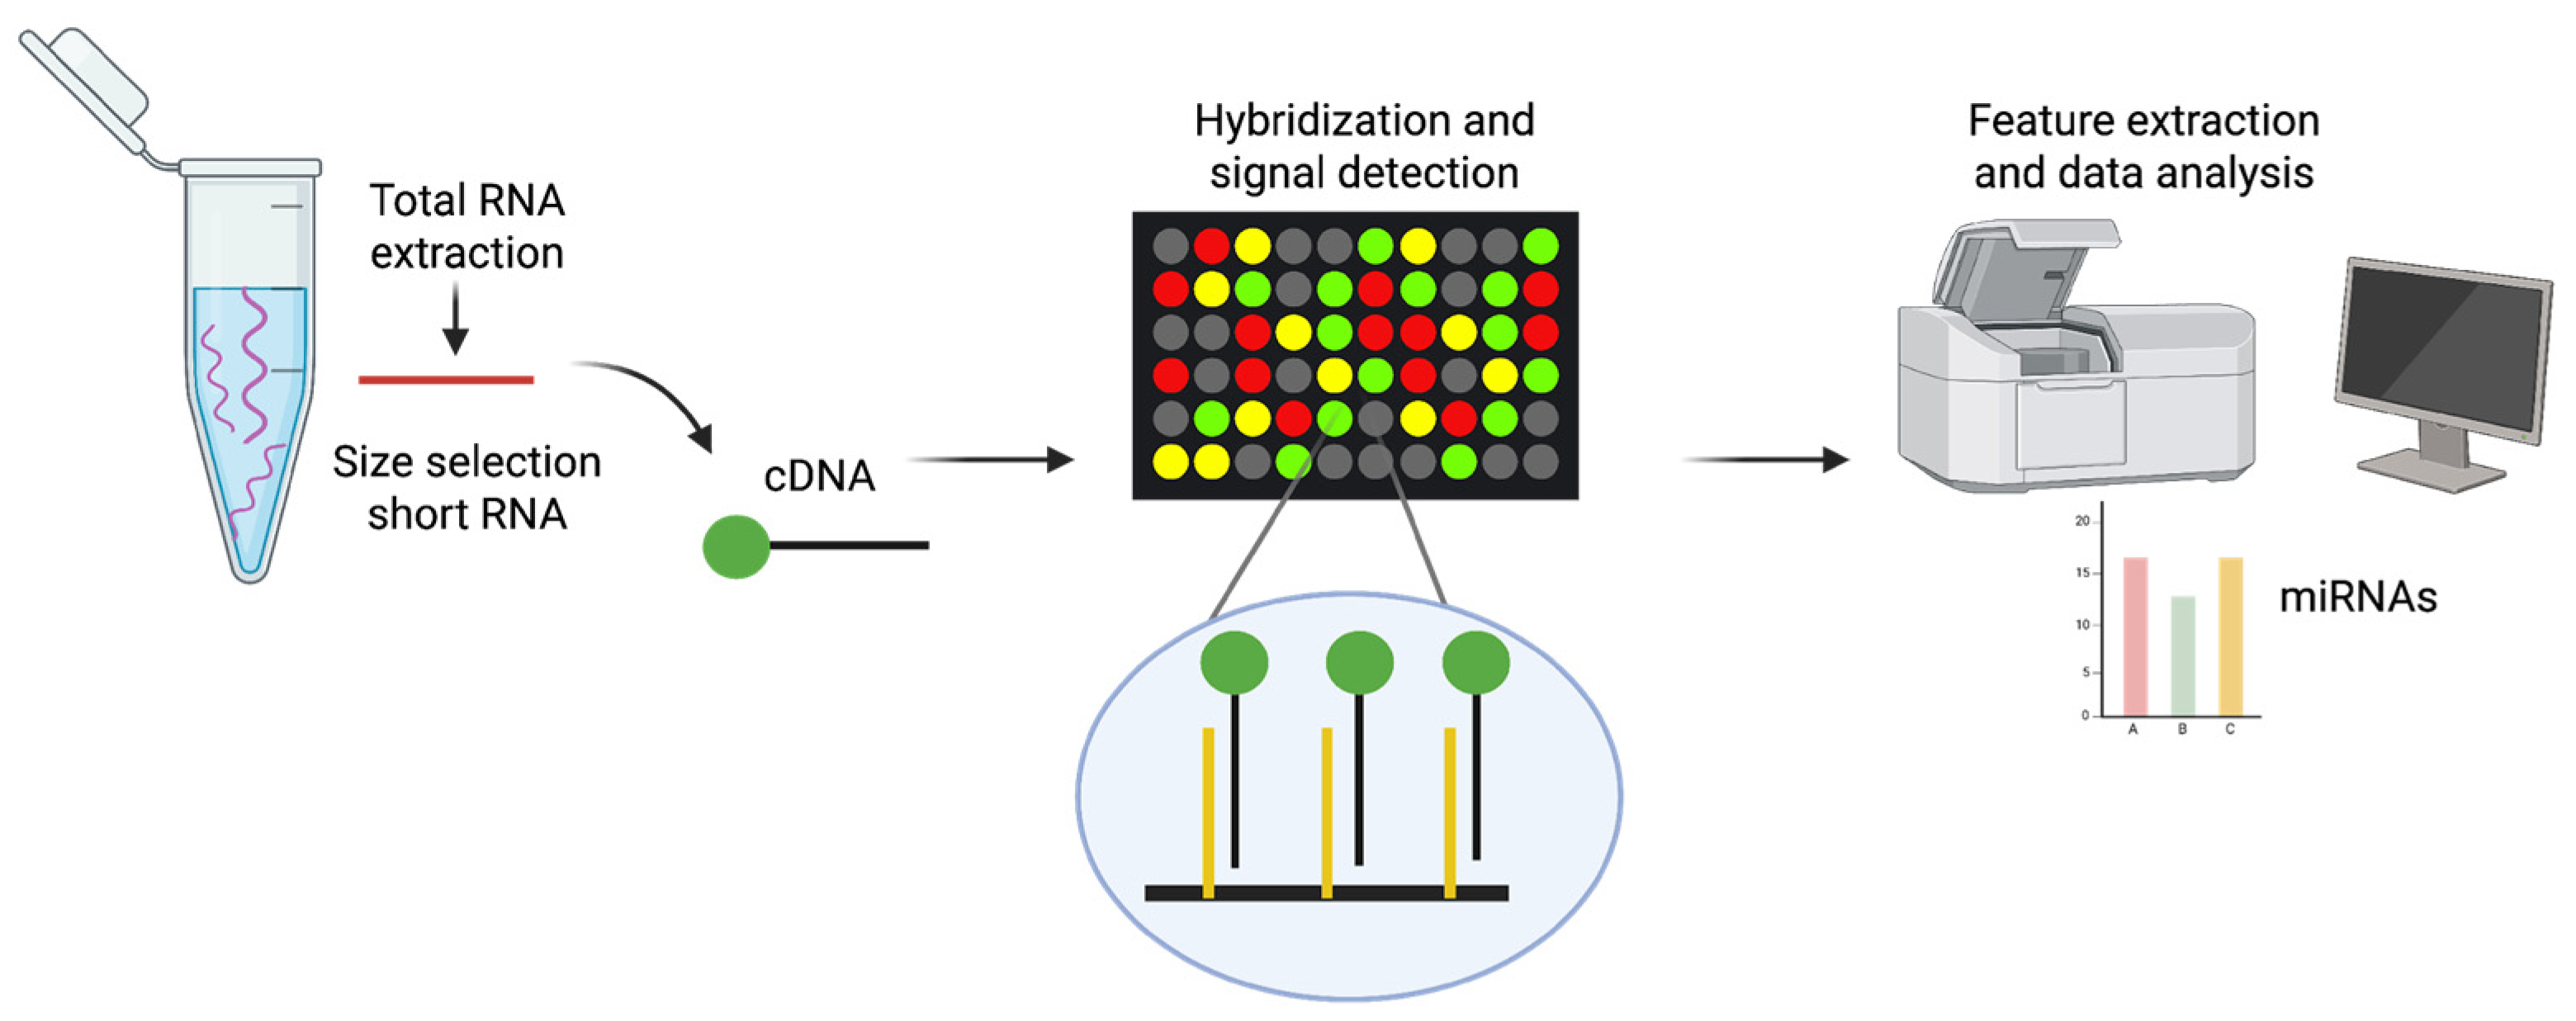
Figure 3.
Diagram of small RNA Sequencing workflow. The process begins with the isolation of small RNAs, followed by the ligation of synthetic adapters to their 3′ and 5′ ends — a crucial step in enabling reverse transcription. The adapter-ligated RNAs are then converted into complementary DNA (cDNA) and amplified by polymerase chain reaction (PCR) to generate a sequencing-ready library. This method enables the detection of thousands of small RNA molecules, including both known and novel species. The workflow details may vary depending on the library preparation protocol and sequencing platform used. For simplicity, only three small RNA types are indicated (coloured miRNAs).
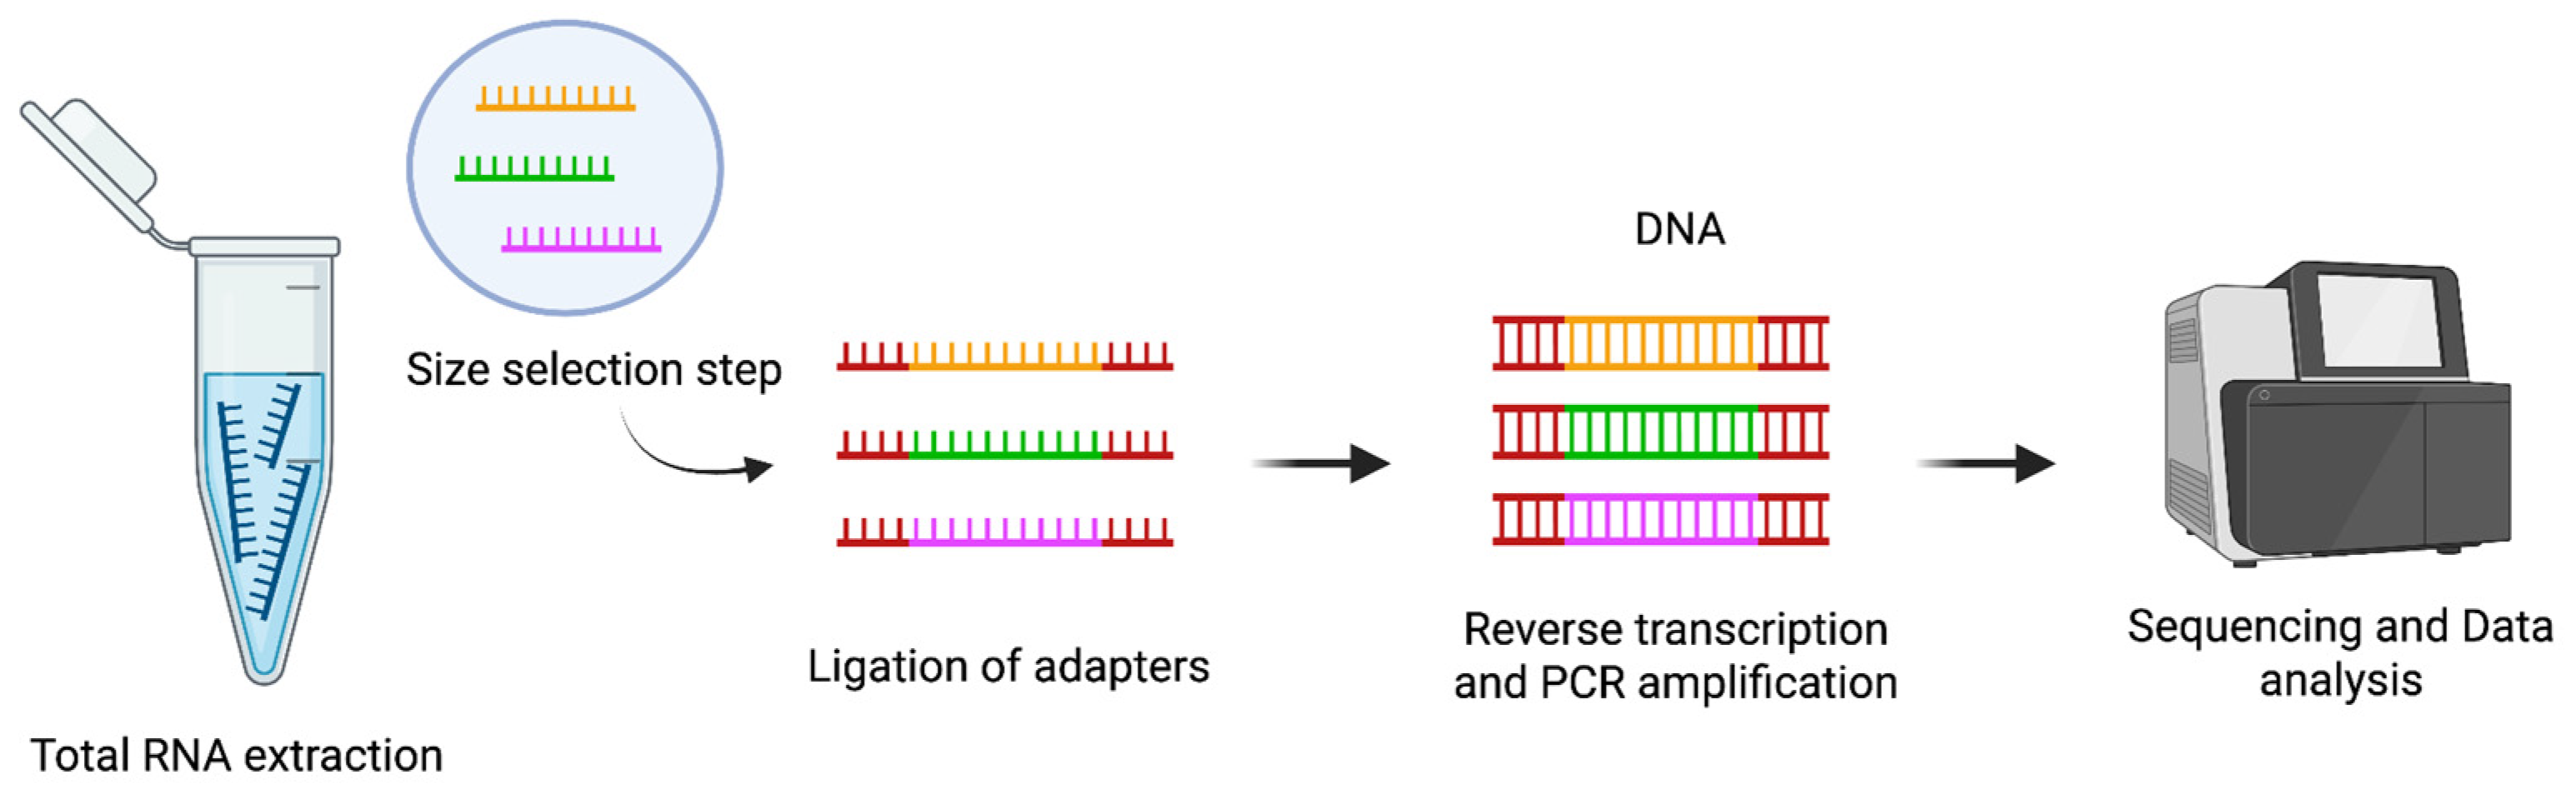
Figure 4.
Solid-state nanoplasmonic sensor for detection and quantification of miRNAs. The platform is based on Au TNPs immobilized on the glass surface of a 384-well plate. These Au TNPs are functionalized with thiolated ssDNA capture probes, which specifically hybridize with target miRNAs in the plasma sample. The binding event forms an ssDNA/miRNA duplex at the sensor surface, inducing a LSPR spectral shift due to changes in the local dielectric environment. The PEG4 spacers are included to minimize nonspecific binding and fouling effects. Figure created with BioRender, adapted from [66].
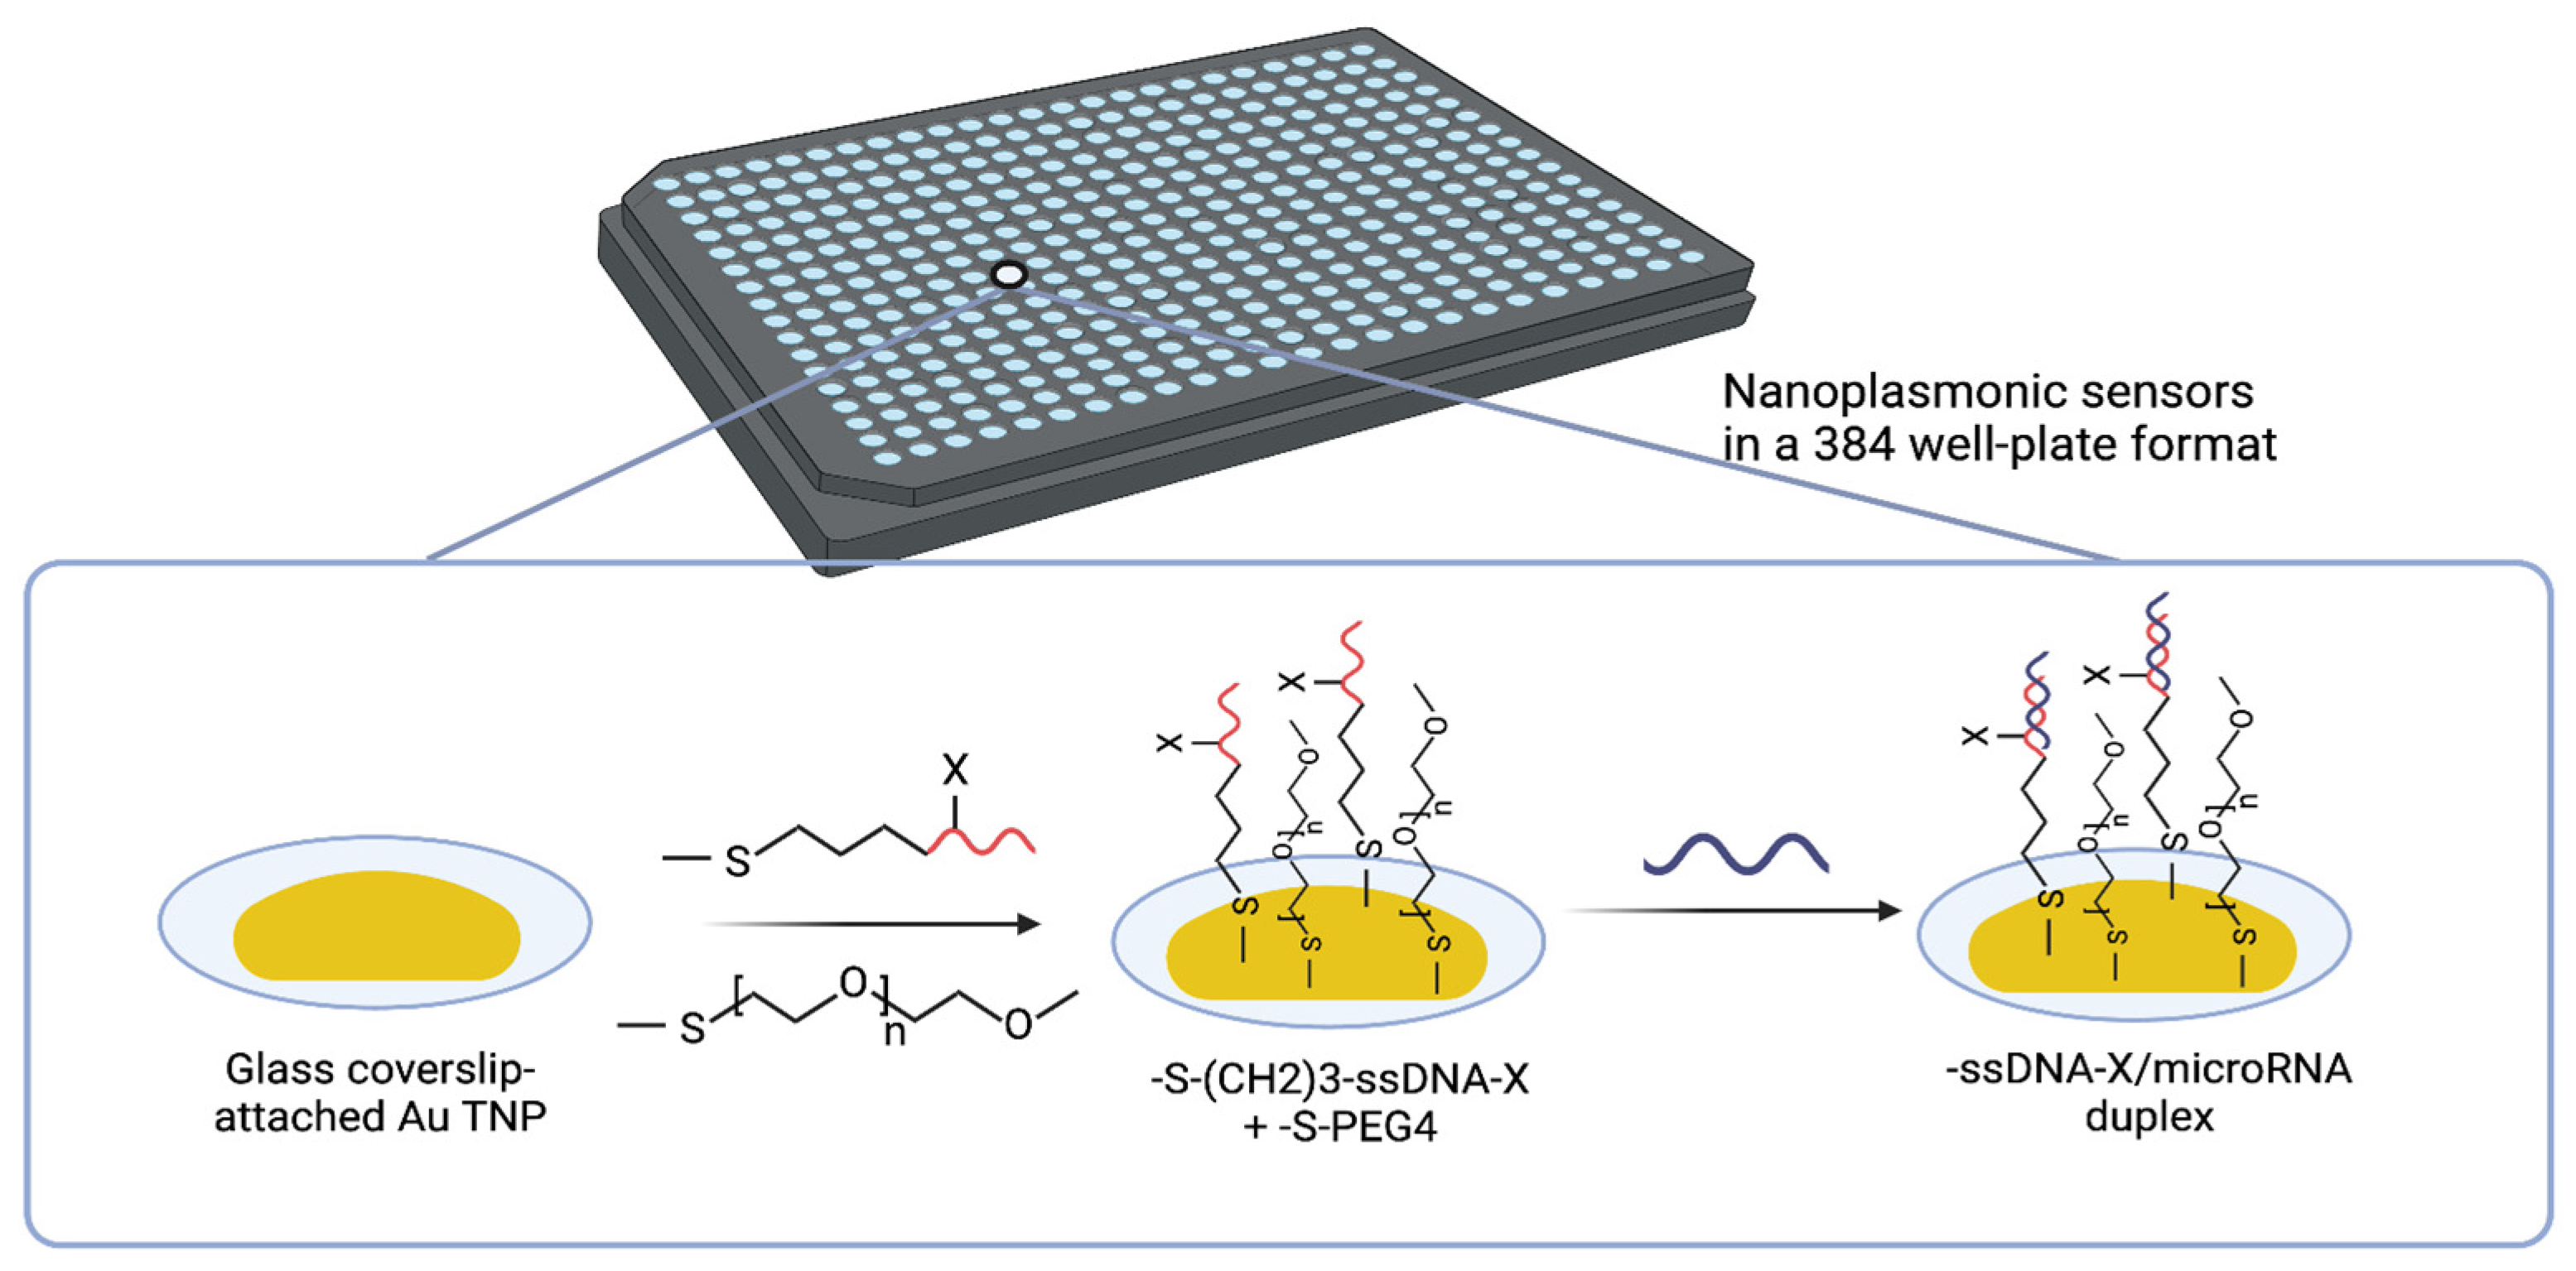
Figure 5.
Single-molecule multiplexed sensing using an electro-optical nanopore platform: (i) Patient serum is incubated with a length-encoded molecular probe consisting of a DNA carrier and a molecular beacon (MB). (ii) Electro-optical sensing is performed. (iii) MiRNA expression levels are determined. Figure created with BioRender, adapted from [67]. Figure 1B of [67] shows a schematic representation of the preparation of size-coded DNA probes and their binding to respective miRNA targets.
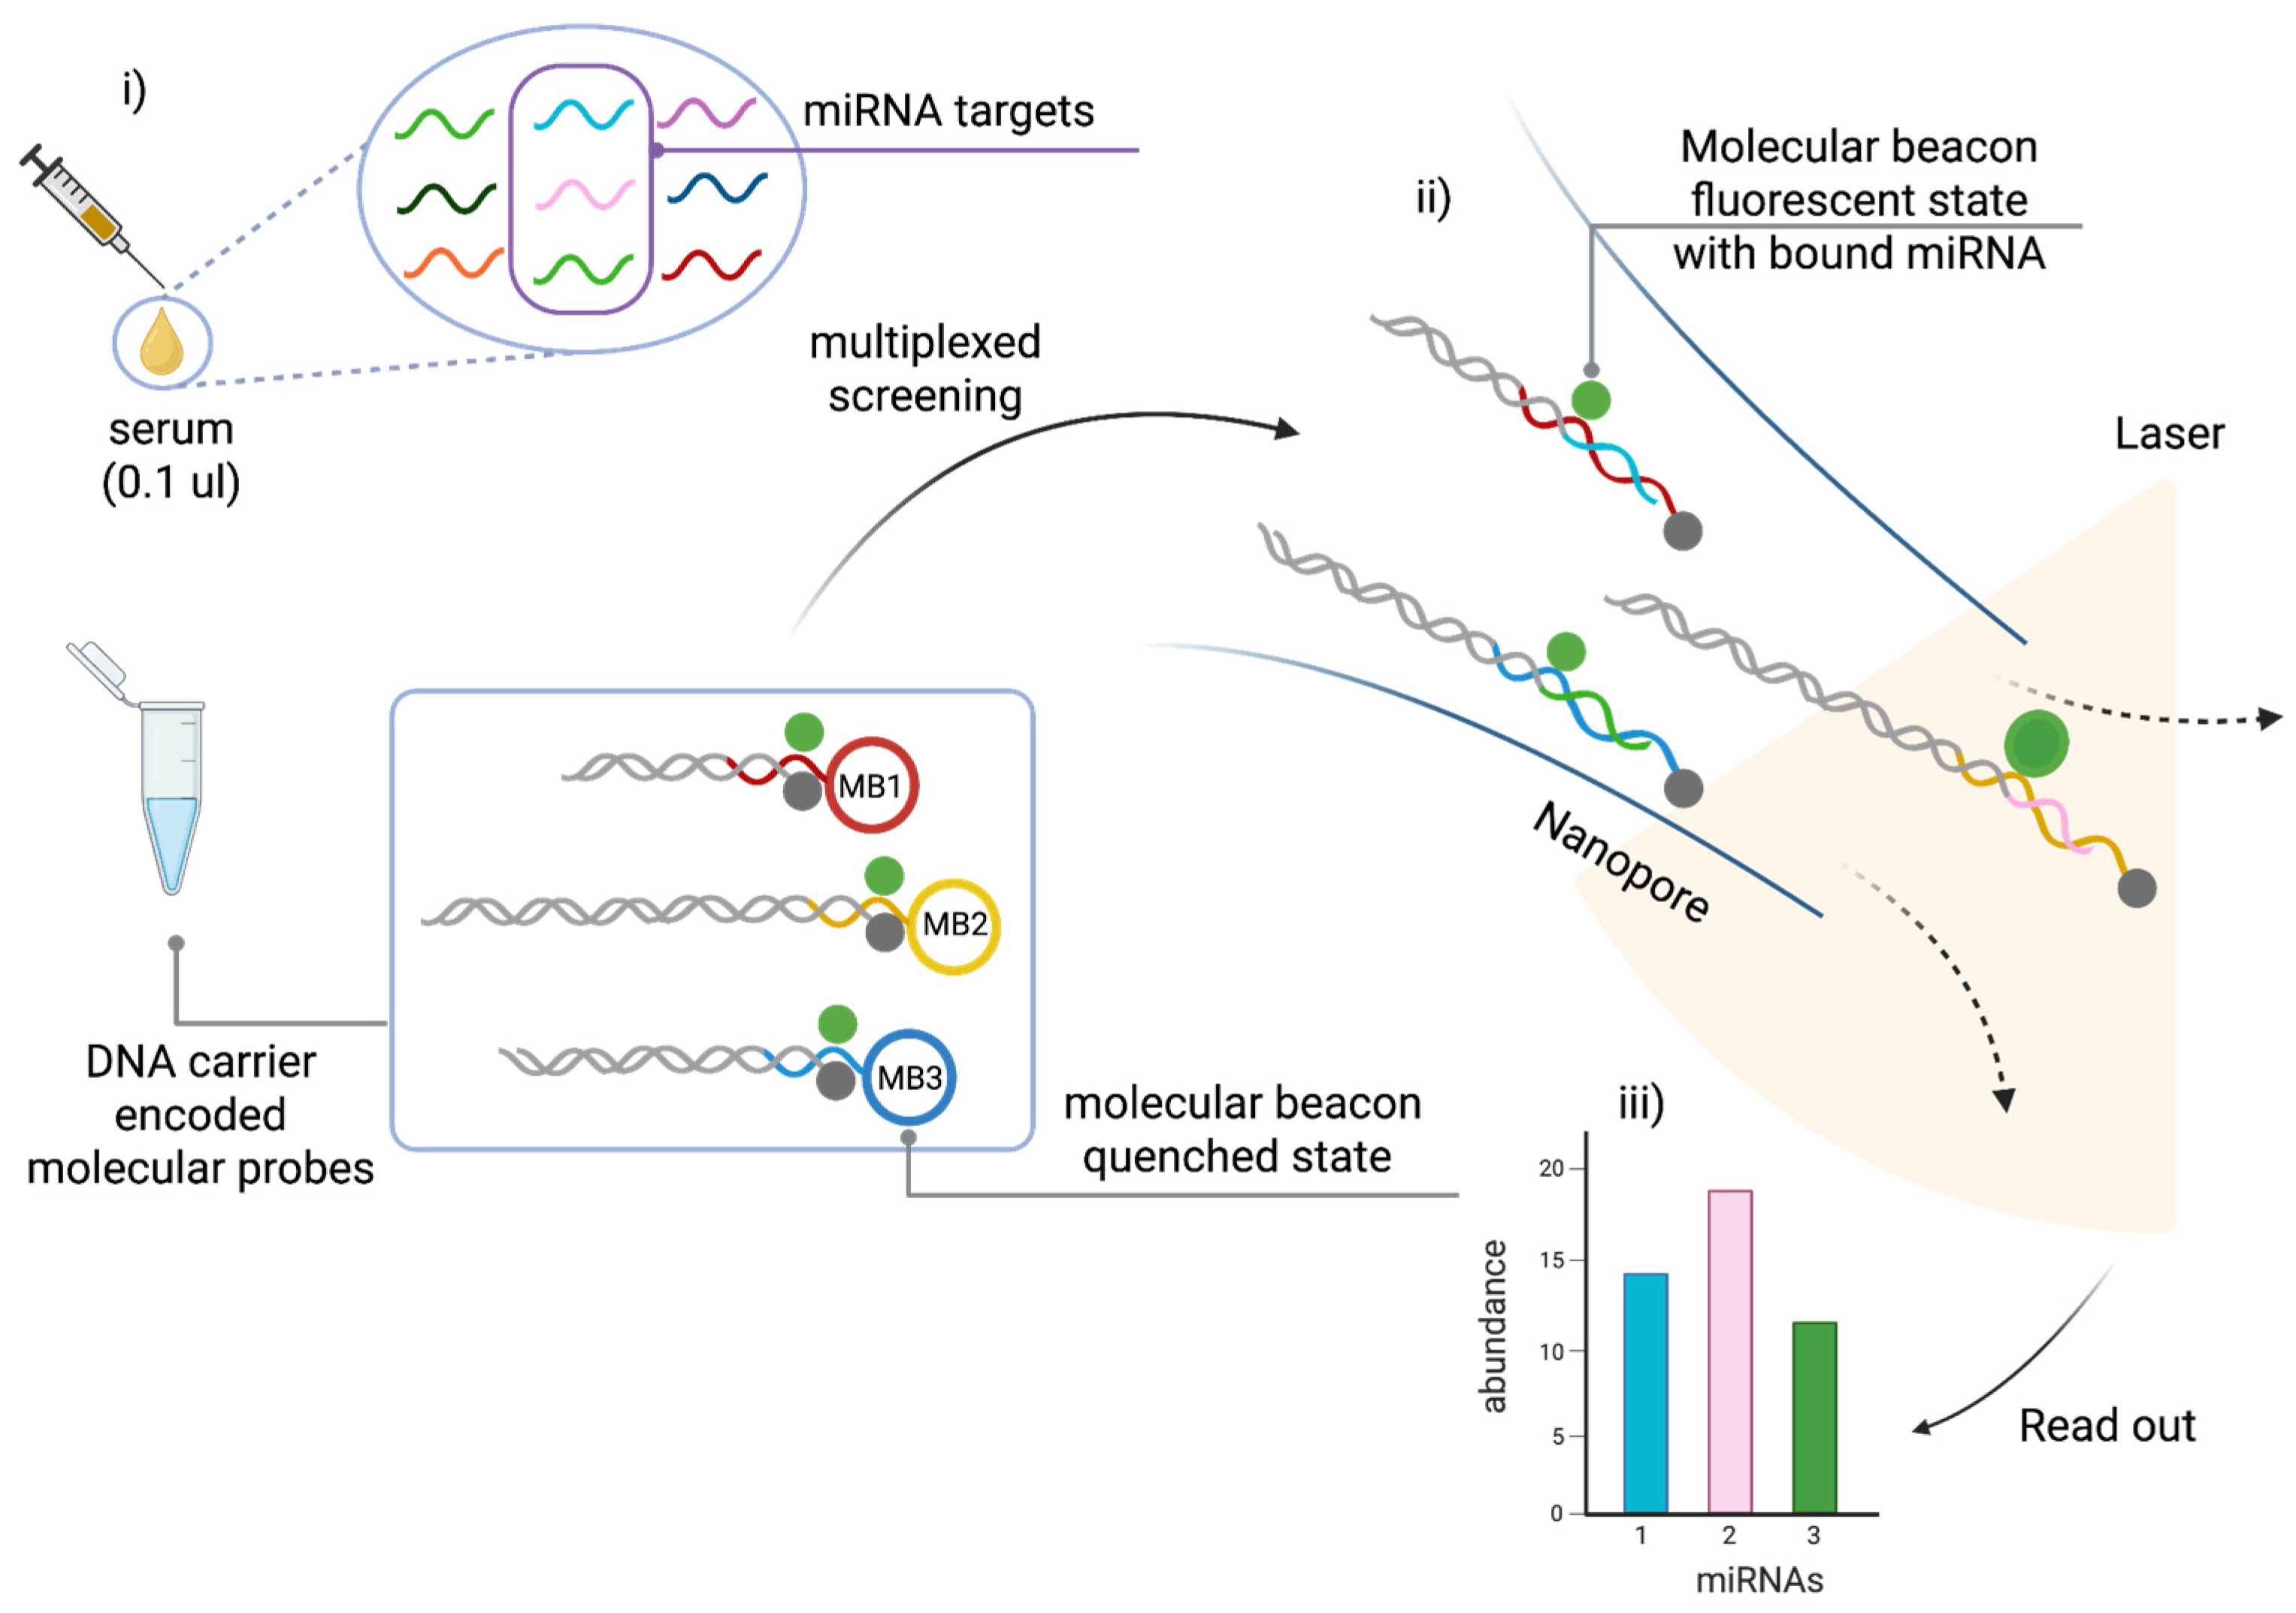
Figure 6.
(A) Schematic of the sandwich hybridization assay for miRNA detection. The target miRNA is captured between a biotinylated capture probe immobilized on streptavidin-coated magnetic beads and a detection probe labeled with the photosensitizer Chlorin e6 (ChlE6). (B) Principle of the ^1O₂-based photoelectrochemical (PEC) detection. Upon light exposure, the photosensitizer generates singlet oxygen (^1O₂), which oxidizes hydroquinone (HQ) to benzoquinone (BQ). Figure created with BioRender.com, adapted from [68].
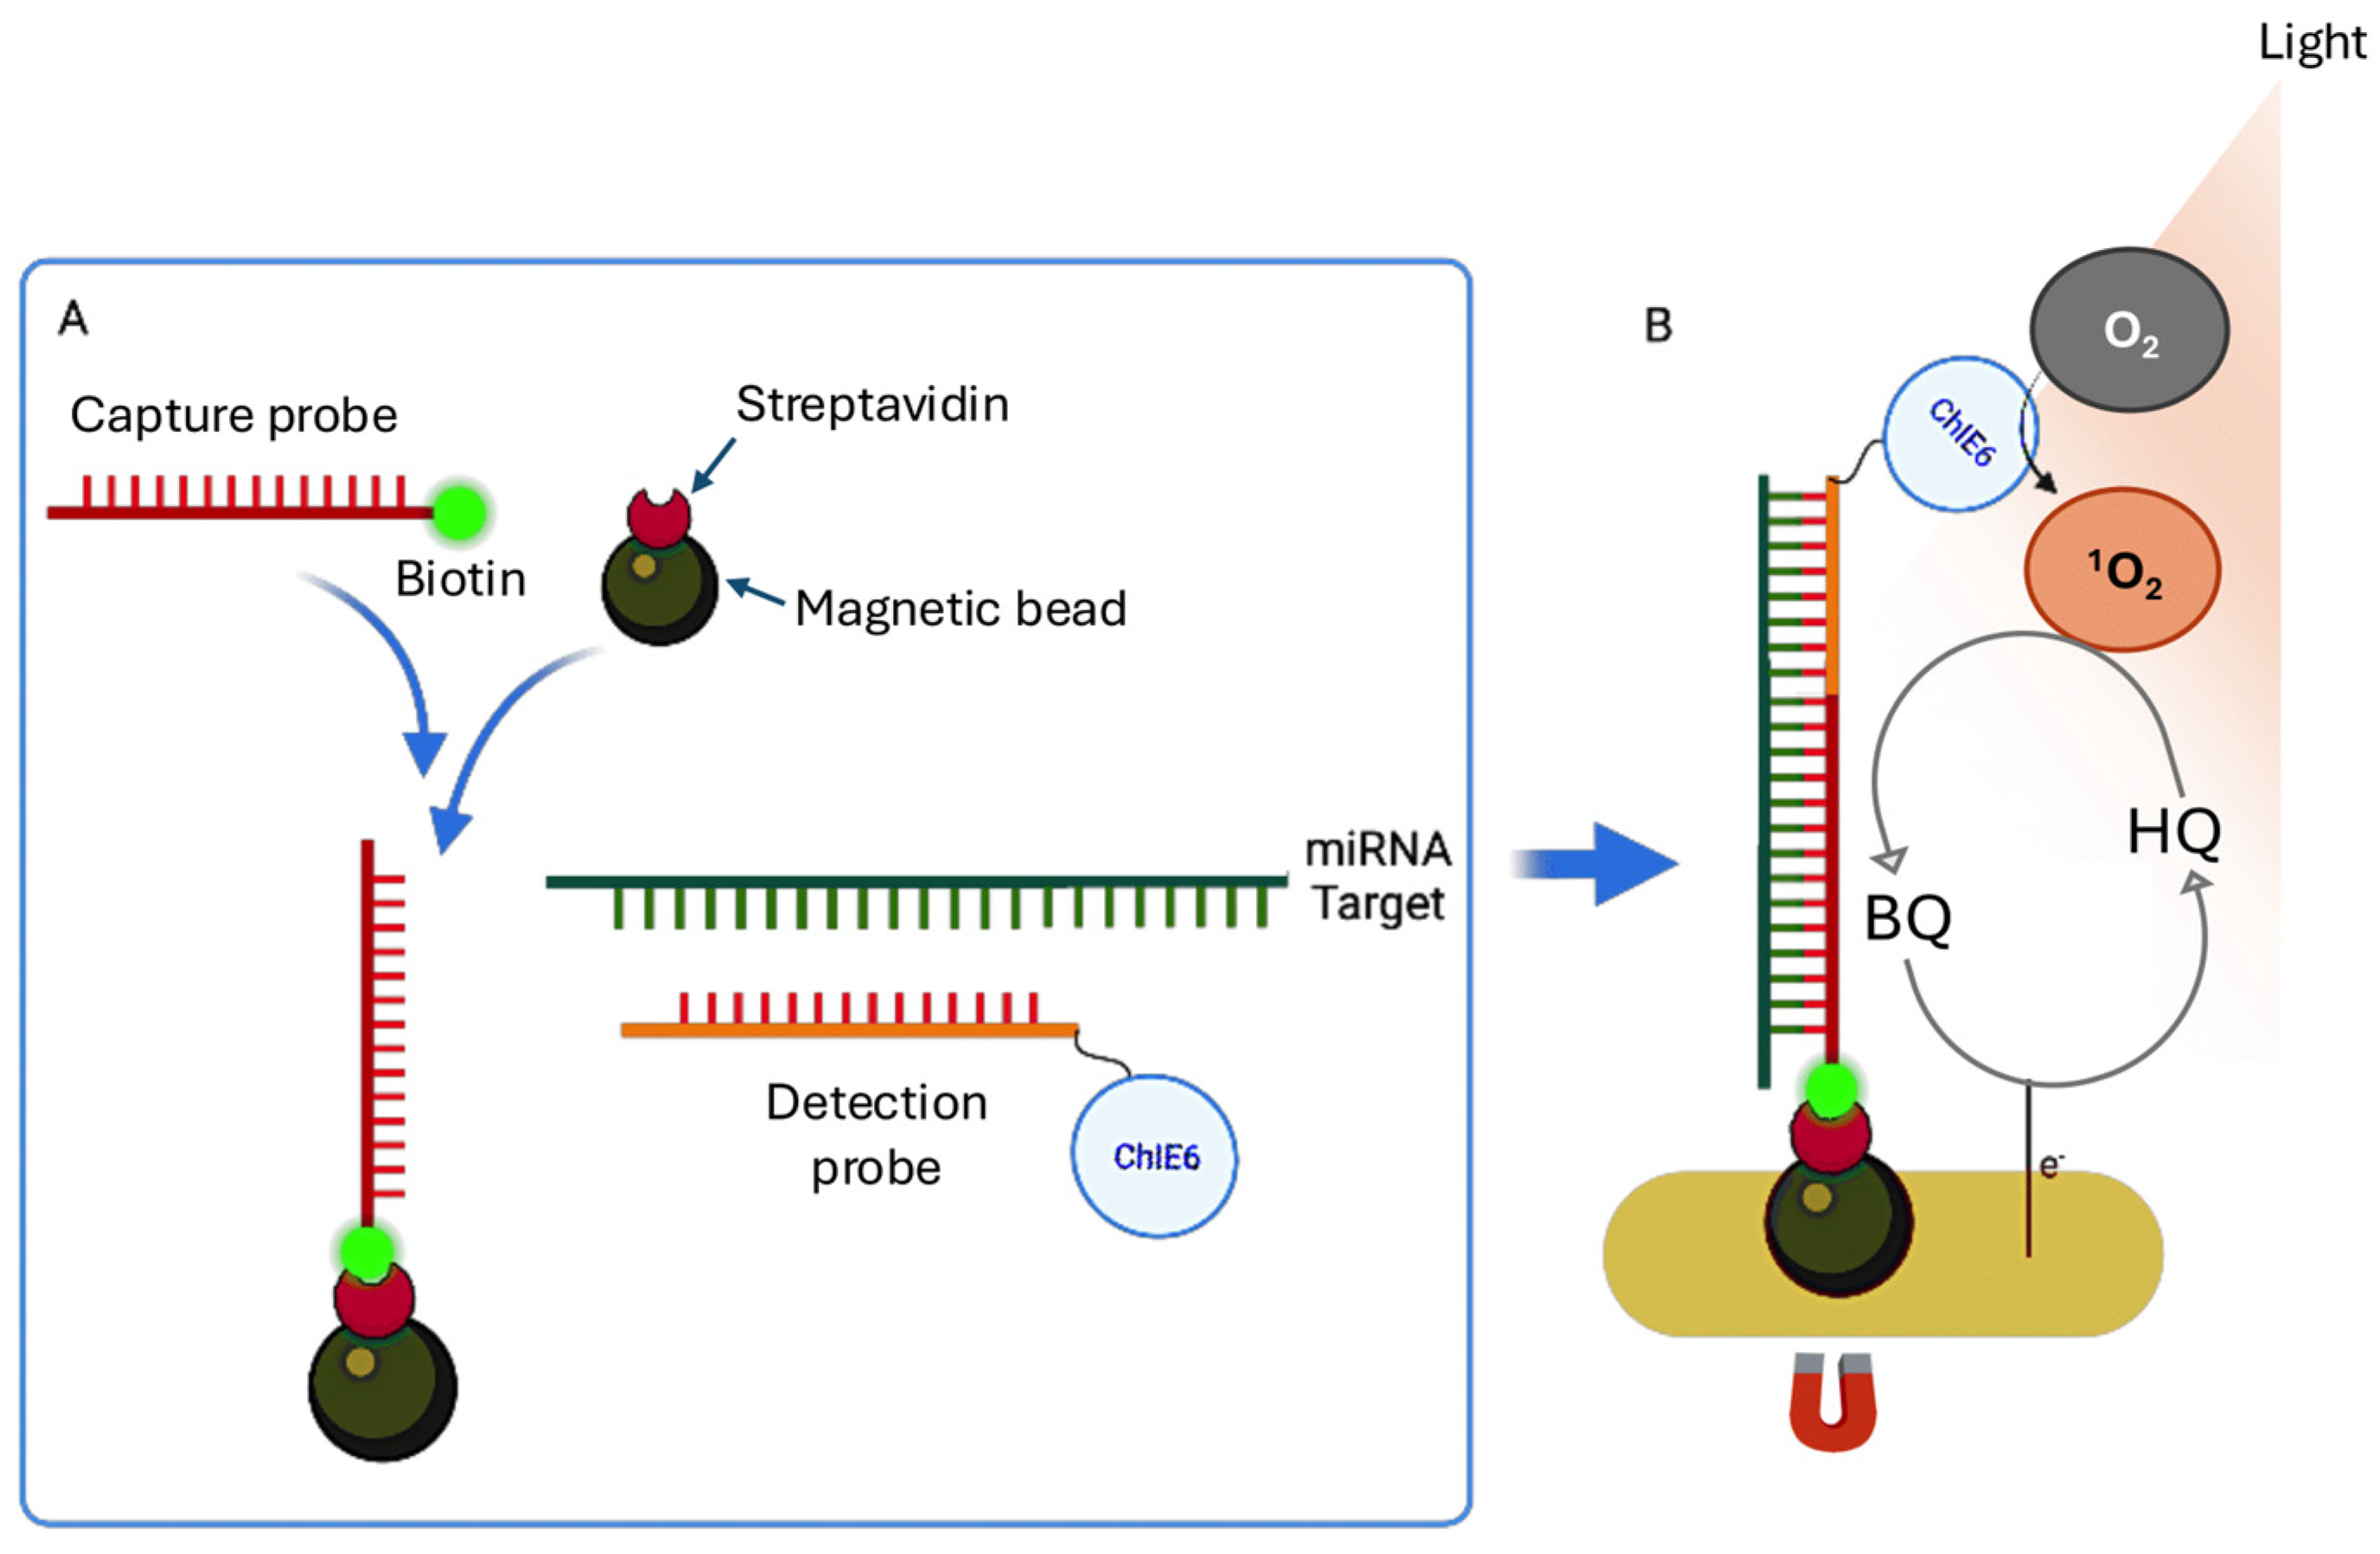
Figure 7.
Procedure for the bead-based miRNA detection assay: i) Streptavidin magnetic beads were incubated with biotinylated, mutation-specific capture probes (C1–C14), based on data from Table 1 [69]. This was followed by ii) washing, iii) incubation with samples containing miRNA128-2-3p and variants, and iv) washing again. The beads were then incubated with CTD, linker and buffer (v-vi), followed by washing and denaturation by heating to 92 °C for 10 minutes (vii-viii). The supernatant was then transferred to QuantiFluor (QF) solution and incubated at 92 °C for 5 minutes, then cooled to 23 °C over 60 minutes (ix-x). Finally, the concentration of miR-128-2-3p and its variants was quantified by fluorescence detection. Figure created with BioRender, adapted from [69].
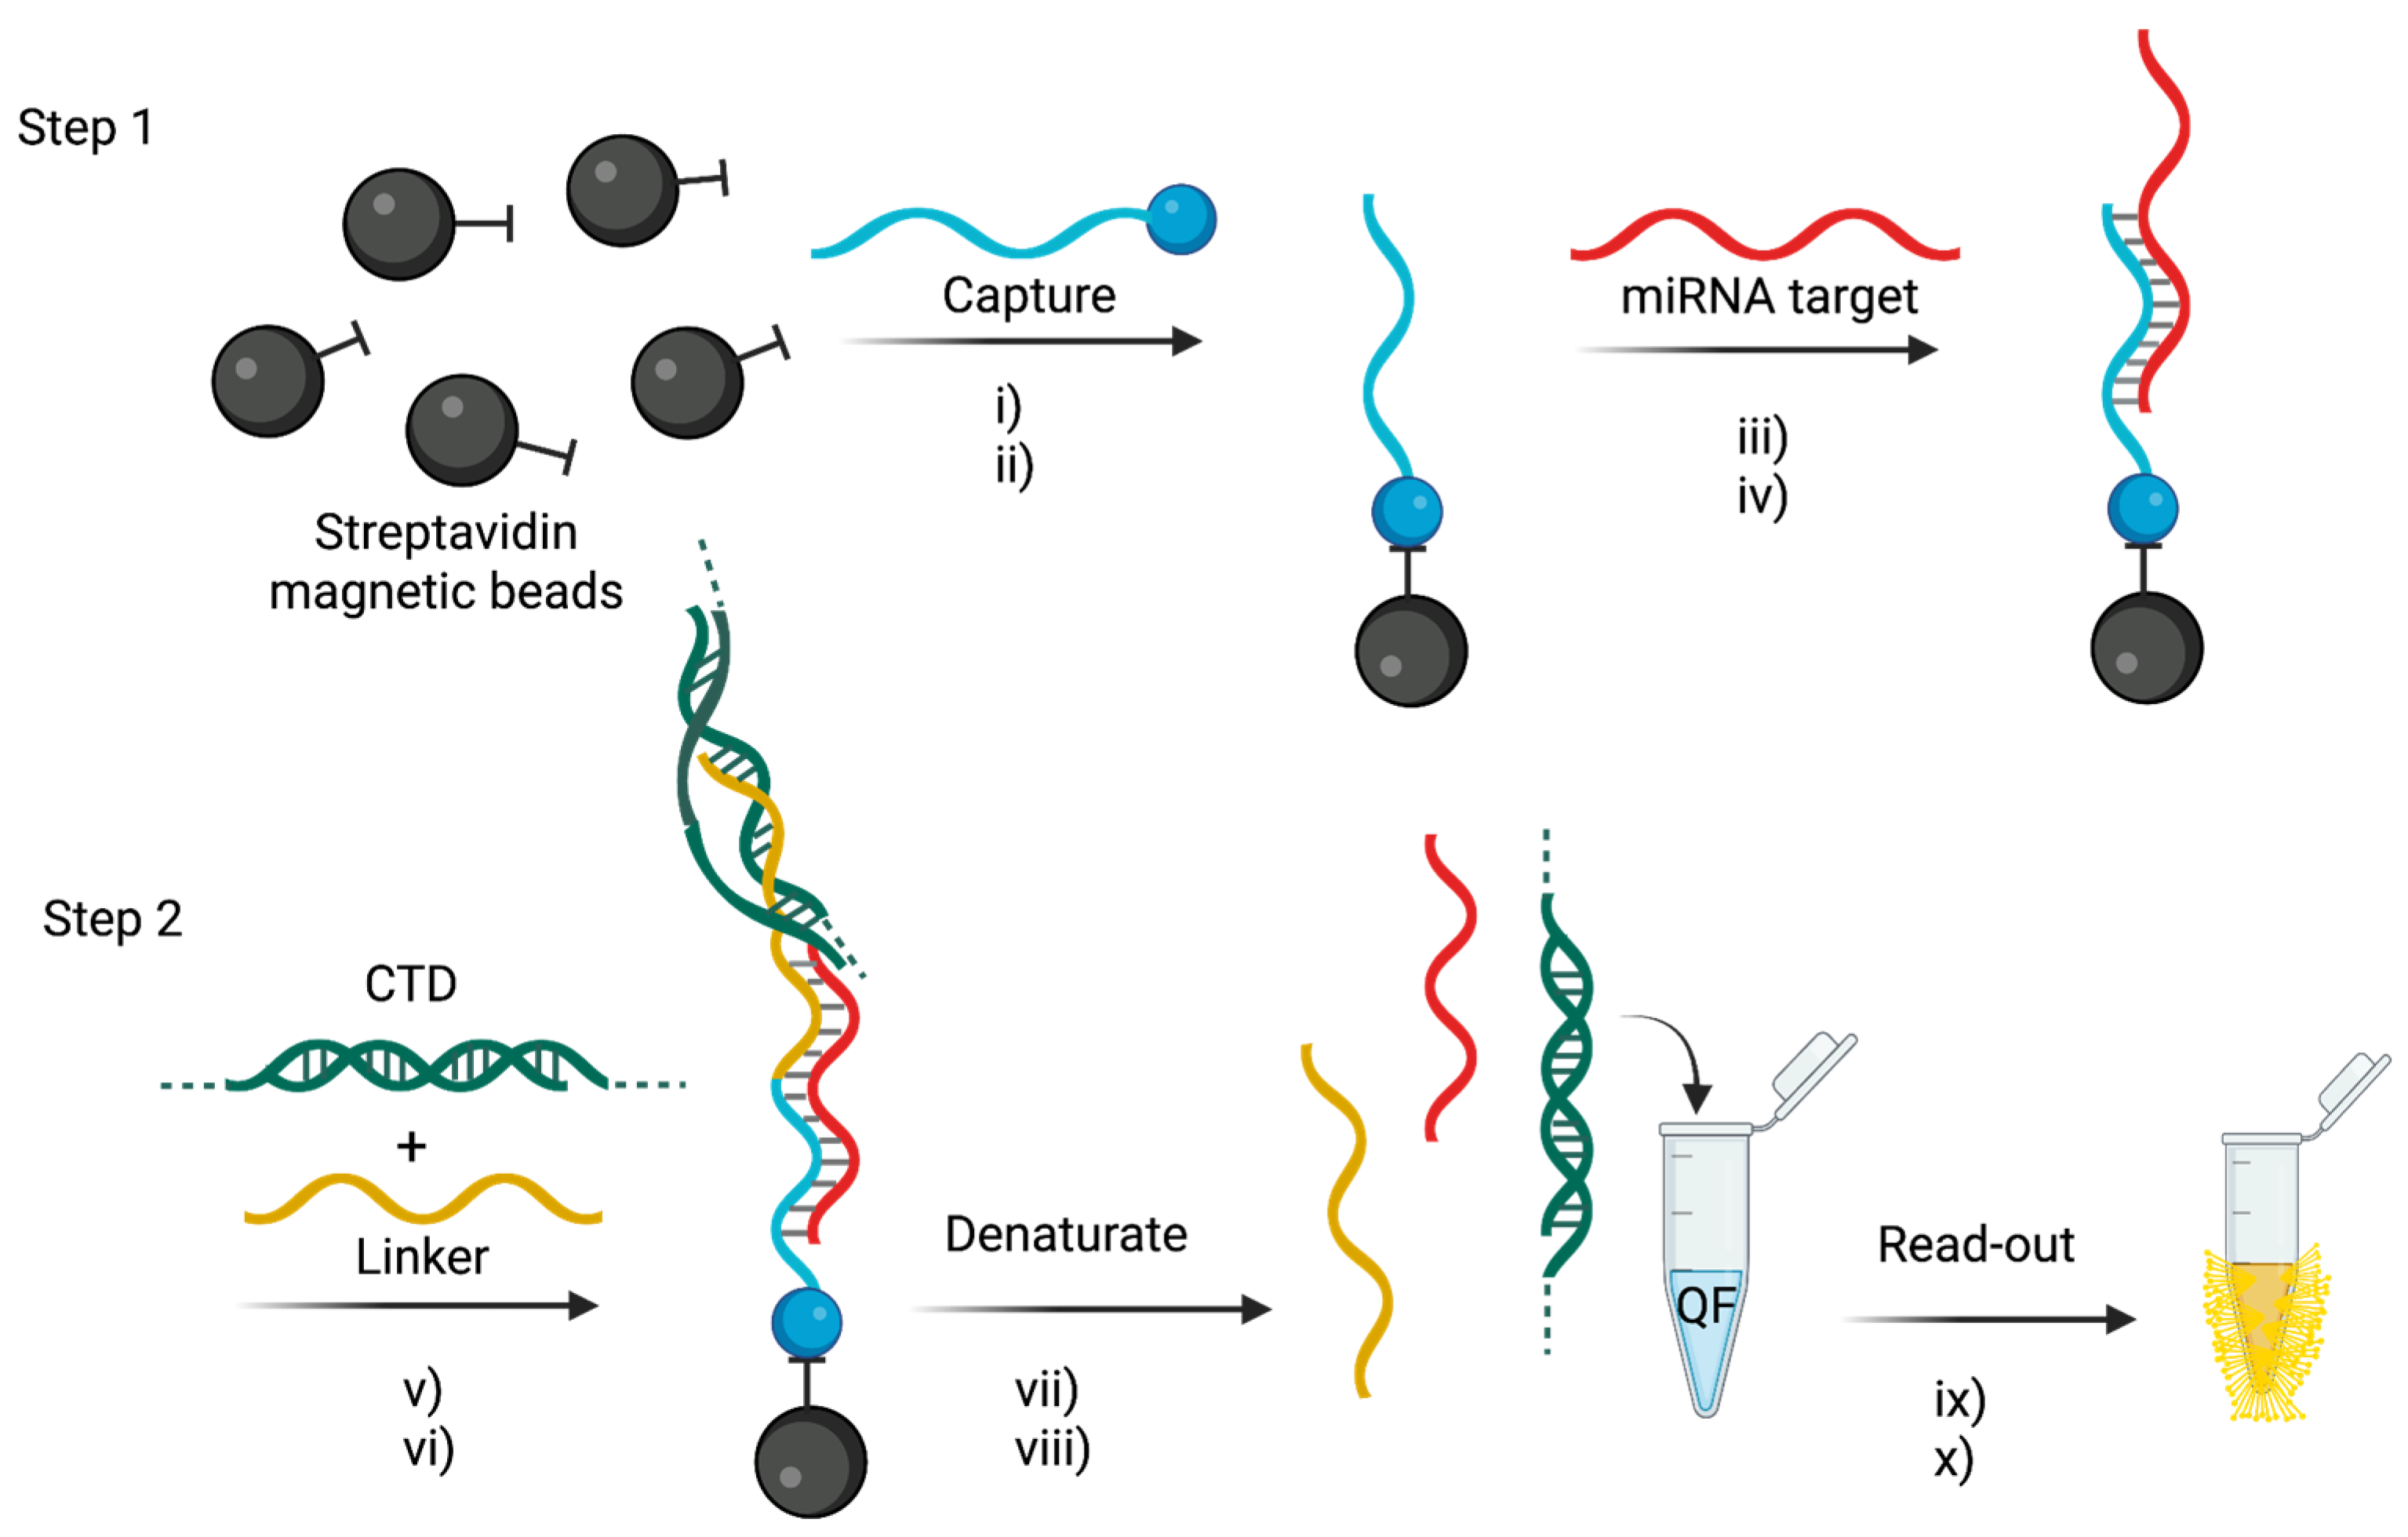
Figure 8.
Schematic representation of the DCL process. The abasic PNA probe hybridises with the target miRNA to form a specific chemical pocket. Through a selective covalent reaction, a SMART base carrying a detectable tag is incorporated into this pocket, forming a stable chemical lock. This tag is subsequently recognised by a reporter molecule, enabling signal generation. In most implementations, abasic PNA probes are immobilised on a solid surface, depending on the platform used in conjunction with DCL technology. Common immobilisation formats include magnetic beads, sensor chips, or membranes integrated into detection devices. This solid-phase setup enhances hybridisation stability, facilitates washing steps, and supports high-throughput or multiplexed detection.
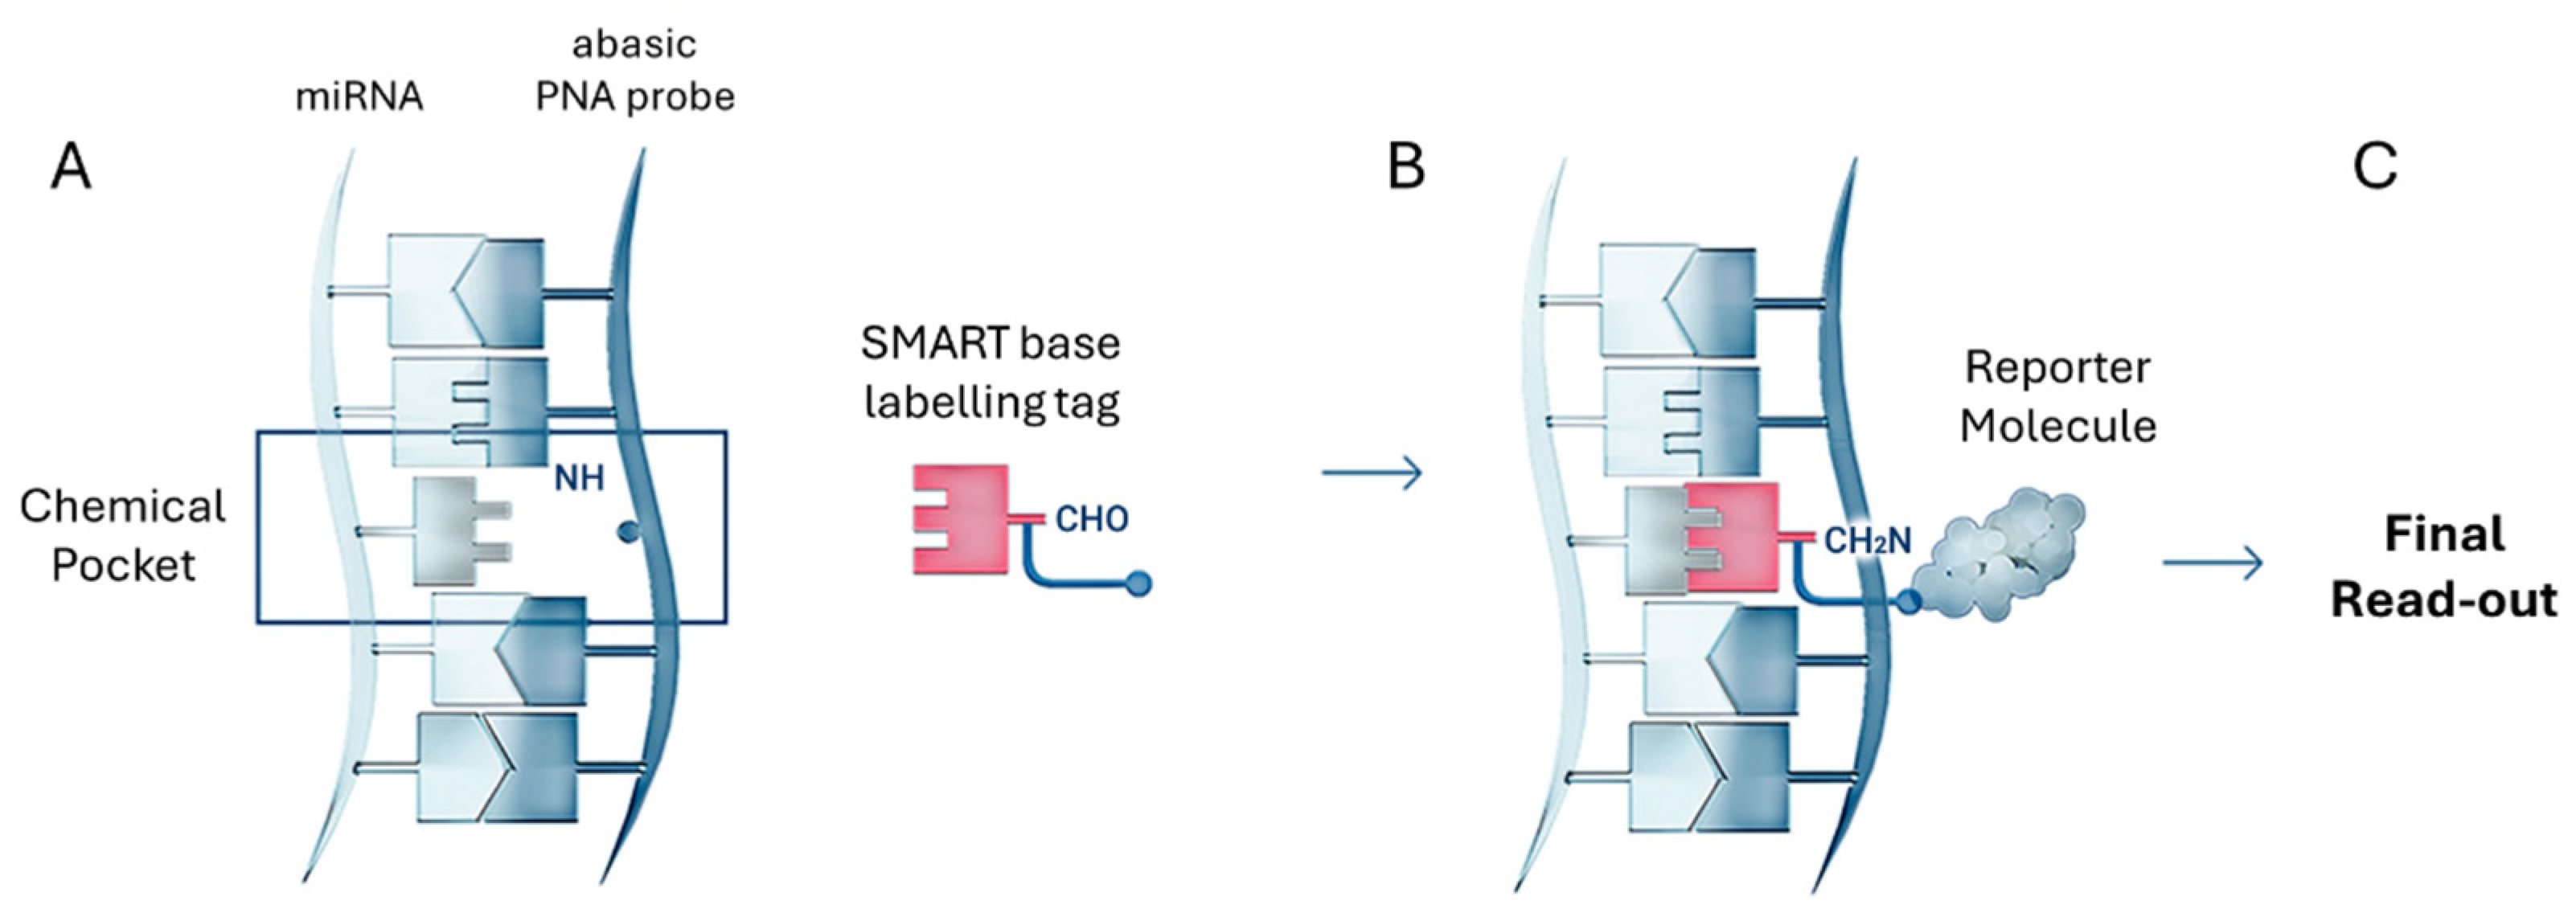
Figure 9.
A) Scheme of the multiplexed analysis of miR-371, miR-451 and miR-122. It uses abasic PNA probes in magnetic beads and three different SNART bases tagged with FMA, Eu and Cy5.. The different spectra and analysis time windows are shown in panels B) and C).
Figure 9.
A) Scheme of the multiplexed analysis of miR-371, miR-451 and miR-122. It uses abasic PNA probes in magnetic beads and three different SNART bases tagged with FMA, Eu and Cy5.. The different spectra and analysis time windows are shown in panels B) and C).
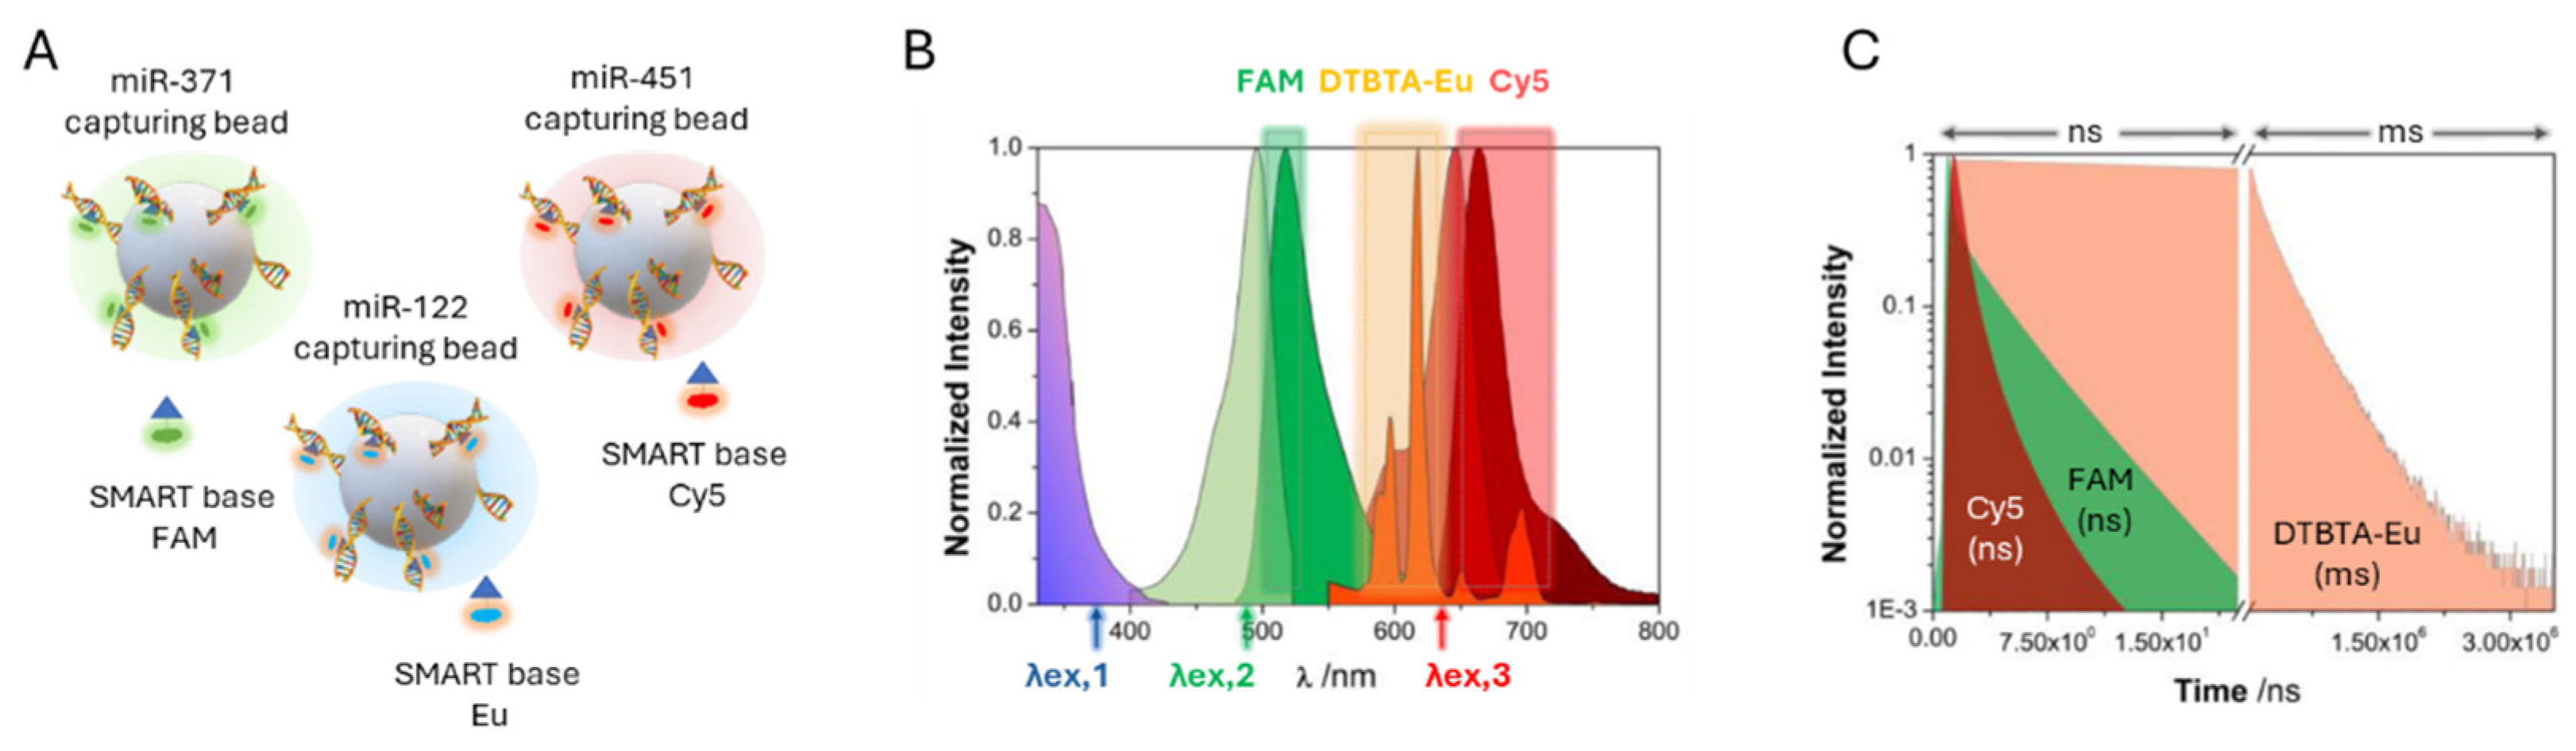
Disclaimer/Publisher’s Note: The statements, opinions and data contained in all publications are solely those of the individual author(s) and contributor(s) and not of MDPI and/or the editor(s). MDPI and/or the editor(s) disclaim responsibility for any injury to people or property resulting from any ideas, methods, instructions or products referred to in the content. |
© 2025 by the authors. Licensee MDPI, Basel, Switzerland. This article is an open access article distributed under the terms and conditions of the Creative Commons Attribution (CC BY) license (http://creativecommons.org/licenses/by/4.0/).
Copyright: This open access article is published under a Creative Commons CC BY 4.0 license, which permit the free download, distribution, and reuse, provided that the author and preprint are cited in any reuse.


