Submitted:
16 July 2025
Posted:
16 July 2025
You are already at the latest version
Abstract
This study focuses on typical slopes in the Qingyuan Ma’anshan Mining Area,China,analyzing land use changes in the strongly deformed front edge of the slope by integrating high-resolution remote sensing imagery,artificial intelligence models,and ArcGIS technology,and comprehensively monitoring slope disasters at Tangjiao slope using 3S technology.Using the sponge city concept as an entry point for mining ecological restoration,combined with software such as ArcGIS to construct an SWMM model for designing sponge transformation schemes,simulating slopes under rainfall events of different return periods,and evaluating cumulative displacement and slope susceptibility in the Qingyuan Ma’anshan Mining Area using“3S+ArcGIS technology+artificial intelligence models.”
Firstly,based on high-resolution remote sensing images of the Ma’anshan slope acquired from 2020 to 2025,3S technology was employed to obtain slope hazard-inducing environmental factors,and a detailed analysis of the geological conditions and slope distribution patterns in Ma’anshan was conducted.On this basis,object-oriented image segmentation and nearest neighbor classification methods were applied for classification,followed by an analysis of slope deformation and failure characteristics,as well as an investigation into the deformation and instability mechanisms of the Ma’anshan slope.Secondly,a combined slope displacement prediction model based on multivariate chaos theory and the Extreme Learning Machine(ELM)was proposed,with model validation performed using cumulative displacement data from the Ma’anshan slope in Qingyuan City as a case study.Finally,based on time-frequency spectrum deep learning combined with the DBSCAN clustering algorithm,the structural surface roughness and shear strength of the rock slope are determined.A convolutional neural network is introduced for deep learning to automatically extract features from the time-frequency spectrum and train the model,providing reference value and practical significance for estimating the shear strength parameters of engineering rock mass structural surfaces.A preliminary slope stability evaluation method based on improved D-S evidence theory selective integration is established to enhance the robustness and determinacy of slope stability evaluation results.
Therefore,addressing issues such as the estimation of rock shear strength parameters,grouping of dominant rock mass structural surfaces,determination of structural surface roughness and shear strength,slope stability prediction,and reliability analysis for the slopes in Ma’anshan,Qingyuan City,this study introduces methods and technologies including ArcGIS,3S,D-S evidence theory,deep learning,and artificial intelligence.A data-driven rock slope stability analysis method is proposed to provide a methodological basis and valuable reference for slope disaster prevention and control.
Keywords:
slope stability
; deep learning
; 3S
; ArcGIS
; AI
1. Introduction
Since the beginning of the 21st century, with the international community placing increasing emphasis on the issue of global ecosystem degradation, ecological restoration has gradually become one of the key approaches to addressing global ecosystem deterioration[1].The advancement of human society is inseparable from mineral extraction;however, mining activities cause significant damage to the ecological environment.Among these, open-pit mining is an efficient and economical method of mineral resource extraction, accounting for approximately 80%of total mining output, and is widely utilized in mineral resource development[2-4].According to geological disaster data from the National Bureau of Statistics for 2020–2025, slope disasters account for more than half of the total cumulative geological disasters nationwide each year.Over the past 30 years, geotechnical engineering projects involving high and steep slopes, large caverns, and deep and long tunnels in sectors such as water conservancy and hydropower, mineral resources, urban construction and municipal administration, and transportation in China have rapidly advanced towards greater height, scale, and depth.As the direct foundation of geotechnical engineering construction, the mechanical properties of rock slopes constitute the fundamental basis for engineering stability and safety, design and construction, reinforcement, and operation.Therefore, research on the rock mass characteristics and stability of rock slope engineering in mining areas is the essential foundation and core for addressing rock mass engineering challenges.The primary intrinsic factors affecting the stability of rock slopes derive from three aspects:(1)the shear strength of rock within the potential sliding surface;(2)the distribution pattern of structural planes within the slope mass;(3)the shear strength of structural planes within the potential sliding surface[5].In-depth research on methods for determining rock mass characteristic parameters is critically important for providing a reliable data foundation and computational support for the stability analysis of rock slopes in mining areas, reducing the likelihood of slope disasters, and proposing effective prevention and control measures.
With the rapid advancement of geoinformation science, digital engineering, artificial intelligence, high-performance computing, and analytical technologies, substantial technological transformations will inevitably occur in the determination of engineering rock mass characteristic parameters and slope stability analysis methods.This will steer research on engineering rock mass characteristics and slope stability in China towards digitalization, informatization, and intelligence.The application of technologies such as GIS, RS, GPS, and ANN in slope monitoring and early warning holds significant importance.This study is based on the on-site geological survey data and fundamental test data from the Qingyuan Ma’anshan Mining Area in China.It incorporates artificial intelligence and deep learning technologies to perform deep learning and data-driven analyses of rock slope stability and common issues.The study conducts an in-depth investigation into the determination methods of engineering rock mass characteristic parameters influencing rock slope stability, including rock shear strength, the stochastic distribution patterns of rock mass structural planes, and the shear strength of structural planes[6].Furthermore, this study integrates software such as ArcGIS to develop the SWMM(Storm Water Management Model), applying LID(Low Impact Development)facilities in mining ecological restoration and optimizing the restoration schemes.This study takes the slopes of the Qingyuan Ma’anshan Mining Area as a case study to establish an inclusive benefit evaluation model that optimizes mine restoration strategies under varying demand objectives, thereby pioneering approaches for future mine restoration planning[7-10].
This paper selects the slopes of the Qingyuan Ma’anshan Mining Area as the subject for slope deformation monitoring and prediction, comprehensively employing technologies such as'ArcGIS+3S+AI'to conduct displacement monitoring and stability analysis and prediction of rock slopes.The significance of this research lies in:1)providing theoretical and technical support for deformation and failure monitoring of rock slopes in Ma’anshan;2)proposing improved methodologies for multivariate and multi-scale modeling of slope displacement prediction in Ma’anshan;3)developing a multivariate chaotic extreme learning machine model for accurate and effective prediction of slope displacement;4)offering substantial theoretical and practical support for regional slope susceptibility evaluation modeling.
2. Literature Review
2.1. Study on Urban Stormwater Flood Model (SWMM)
The Urban Stormwater Model(SWMM)is a model used to simulate and analyze urban runoff, ponding, and drainage systems during a rainfall eventA mathematical model of the response, It can help urban planners and engineers in designing and improving urban drainage systems, mitigating flood risks, and planning urban developmentMake more scientific and rational decisions.Urban stormwater flood model(SWMM model)usually contains complex parameters.Such as rainfall intensity, topography, soil type, vegetation cover, urban land cover type(e.g., roads, buildings), and drainageThe structure and functions of the system, and its main functions and applications include:
Flood forecasting and management:The model can predict the occurrence, flow direction and depth of flood under specific rainfall events.Help city managers to take timely measures to mitigate the impact of floods;
Drainage system design and optimization:By simulating the effect of rainwater drainage under different design schemes, Select the optimal drainage system design to improve the efficiency and toughness of the urban drainage system;
Urban planning and land use planning:the model can assess the impact of future urban development on the drainage system.Guide urban planning and land use to reduce flood risks;
Environmental impact assessment:assess the potential impact of urban drainage and stormwater management measures on the surrounding natural environment(e.g.rivers, lakes), Ensure the health and sustainability of ecosystems.
SWMM is an urban stormwater management model developed by the United States Environmental Protection Agency(USEPA)in 1969-1971.SWMM is widely used to plan, analyze and design related water resources engineering projects.These include stormwater runoff management, combined sewage overflows(CSOs), and stormwater quality issues.It can simulate all aspects of the whole rainfall event.Include rainfall, surface water, runoff, infiltration, groundwater flow, pipe network flow, Pollutant load transfer to the receiving water body, It also supports many different types of infiltration models, pipe network elements(such as pipes, nodes, pumping stations, etc.), and water quality treatment processes.Aguinaga et al.Used the SWMM model to evaluate the performance of the urban drainage system in Gurugram, India.High-resolution remote sensing data sets are used to improve the simulation accuracy[11].
The purpose of this study is to apply the concept of sponge city to the mine ecological restoration in Ma'anshan, Qingyuan, China.Combined with ArcGIS and other software to build SWMM model and design sponge transformation scheme.Rainfall events with different return periods are simulated and the instability problem is controlled.
2.2. Study on Stability of Rock Slope Based on 3s Technology
Ma'anshan mining area is under the influence of reservoir water level fluctuation and heavy rainfall, which leads to the instability of many reservoir bank slopes.The"3s"technology composed of RS, GIS and GPS has been widely used in the monitoring of geological disasters in Maanshan mining area.
RS technology is mainly used to obtain the data source of geological disaster monitoring in Ma'anshan mining area, and monitor the study area from a large scale;
GIS links spatial data and attribute data, and carries out spatial analysis, query and cartographic generalization management of geometric features in the study area;
GPS is mainly used to monitor the deformation of monitoring points on the slope.The geological and physical geographical factors affecting the development of landslides can be divided into the following categories:topography, engineering geology, hydrology and environmental factors.And land cover factors[12-13].
At home and abroad, the important role of 3s technology in slope disaster prevention and control has been fully valued.In the geological disaster prevention plan of the United States Geological Survey, the role of 3s technology in slope disasters has been emphasized many times.The Role of 3s Technology in Monitoring and Predicting Slope Geological Hazards in the Outline of National Medium and Long Term Science and Technology Development Plan 2006-2020It has also been highlighted[14-15].Literature research shows that with the continuous development of geospatial information observation technology based on 3s technology, It provides a new technical support for slope disaster monitoring, slope deformation prediction, slope documentation and regional slope susceptibility evaluation.
Internationally, Chen J[16]applied RS, GIS and GPS technologies to the mapping of slope hazards in a certain area of Pakistan.Paule-Mercado M A et al.[17]used RS and GIS techniques to map slope hazards in the Wadi Watier area of Egypt to study land use.A Akgun et al.[18]used RS and GIS techniques for slope risk assessment in Izmir, western Turkey.M Müller A et al.[19]applied RS and GIS based logistic regression model to slope susceptibility mapping in Penang, Malaysia in 2020.Yang L et al.[20]used RS and GIS technology for slope susceptibility evaluation in Wujing District, Tianjin, China in 2021.Hou J et al.[21]used RS and GPS for slope deformation monitoring during active period, Kong Z et al.[22]used a combination of GPS and SAR interferometry to predict the slow deformation process of the Kahrod slope in the Arbaz Mountains, Iran.Xu H et al.[23]used the multi-sensor DinSAR technology to effectively monitor the slope deformation.Wang J et al.[24]used GIS and RS techniques for the development of a slope logging system in the southern Kyrgyzstan region.Moore T L et al.[25]used RS and GIS technology to catalog seismic slopes, and explained the principle and specific process in detail.Therefore, in this paper, "3s"technology is comprehensively used to study the slope displacement and stability of deformation and failure.
2.3. Research on"Data-Driven+Artificial Intelligence"Analysis Method
"Data-driven+artificial intelligence"is to realize human learning behavior through computer technology.Reorganizing existing knowledge structures and acquiring new patterns or skills, It has been widely used in natural language processing, image recognition, search recommendation and so on.Artificial intelligence is a research hotspot in various industries in recent years, and has been included in China's"13th Five-Year Plan"and"14th Five-Year Plan".It is enough to show the importance and urgency of the research and development of artificial intelligence technology.In the aspect of slope stability analysis, at first, some classical artificial intelligence methods were directly transplanted.Such as K-nearest neighbor(KNN)[26], support vector machine(SVM)[27], artificial neural network(ANN)[28], etc.Mohamed O Arnous et al.[29]constructed ANN models of weight, cohesion, internal friction angle, slope, slope height and safety factor.Compared with the traditional regression method, the method has better prediction effect.
With the rise of artificial intelligence methods such as machine learning and deep learning, The research of artificial intelligence method in slope stability analysis is a blowout trend.More accurate, efficient and reliable theories, models and algorithms have been widely introduced and applied.The success rate and reliability of landslide hazard identification have also been significantly improved.Base on that traditional artificial intelligence model, Scholars combine classical machine learning models with heuristic optimization methods such as genetic algorithm[30], particle swarm optimization(PSO)[31]and firefly algorithm[32].A series of slope stability intelligent analysis system based on data and dominated by algorithm is formed.
In recent years, the prediction model of slope stability has gradually transited from the traditional single model to the integrated model.Ensemble learning methods significantly outperform single models in terms of accuracy and reliability[33].Michel Peyret et al.[34]used ANN as the base learner, Based on the framework of ANN ensemble learning, the numerical relationship between landslide hazard and its influencing factors is constructed;G Herrera et al.[35]compared the application of various ensemble learning algorithms such as Bagging and Boosting in slope stability evaluation.It is considered that the extreme gradient enhanced ensemble algorithm has the best prediction performance and strong applicability to the slope stability data set.Aiming at the defects of the conventional machine learning and ensemble learning models, Selective ensemble learning algorithm has great potential in slope stability analysis.However, up to now, the research and application of slope stability analysis based on selective ensemble learning has not been reported[36-40].
To sum up, abundant slope stability analysis systems have been formed at home and abroad, and each analysis method has its applicability and advantages and disadvantages."Data-driven+artificial intelligence"analysis method has unique advantages in solving complex problems such as multivariable, nonlinear, uncertainty and so on.It is expected that various slope stability analysis methods will be used comprehensively and organically, and the theory and method of slope stability analysis will be gradually improved.It is believed that with the collection of data and the improvement of theory, artificial intelligence method will become a simple and practical analysis method in slope engineering.To better analyze and predict the slope stability state[41-48].
3. Research Overview
3.1. Research Area
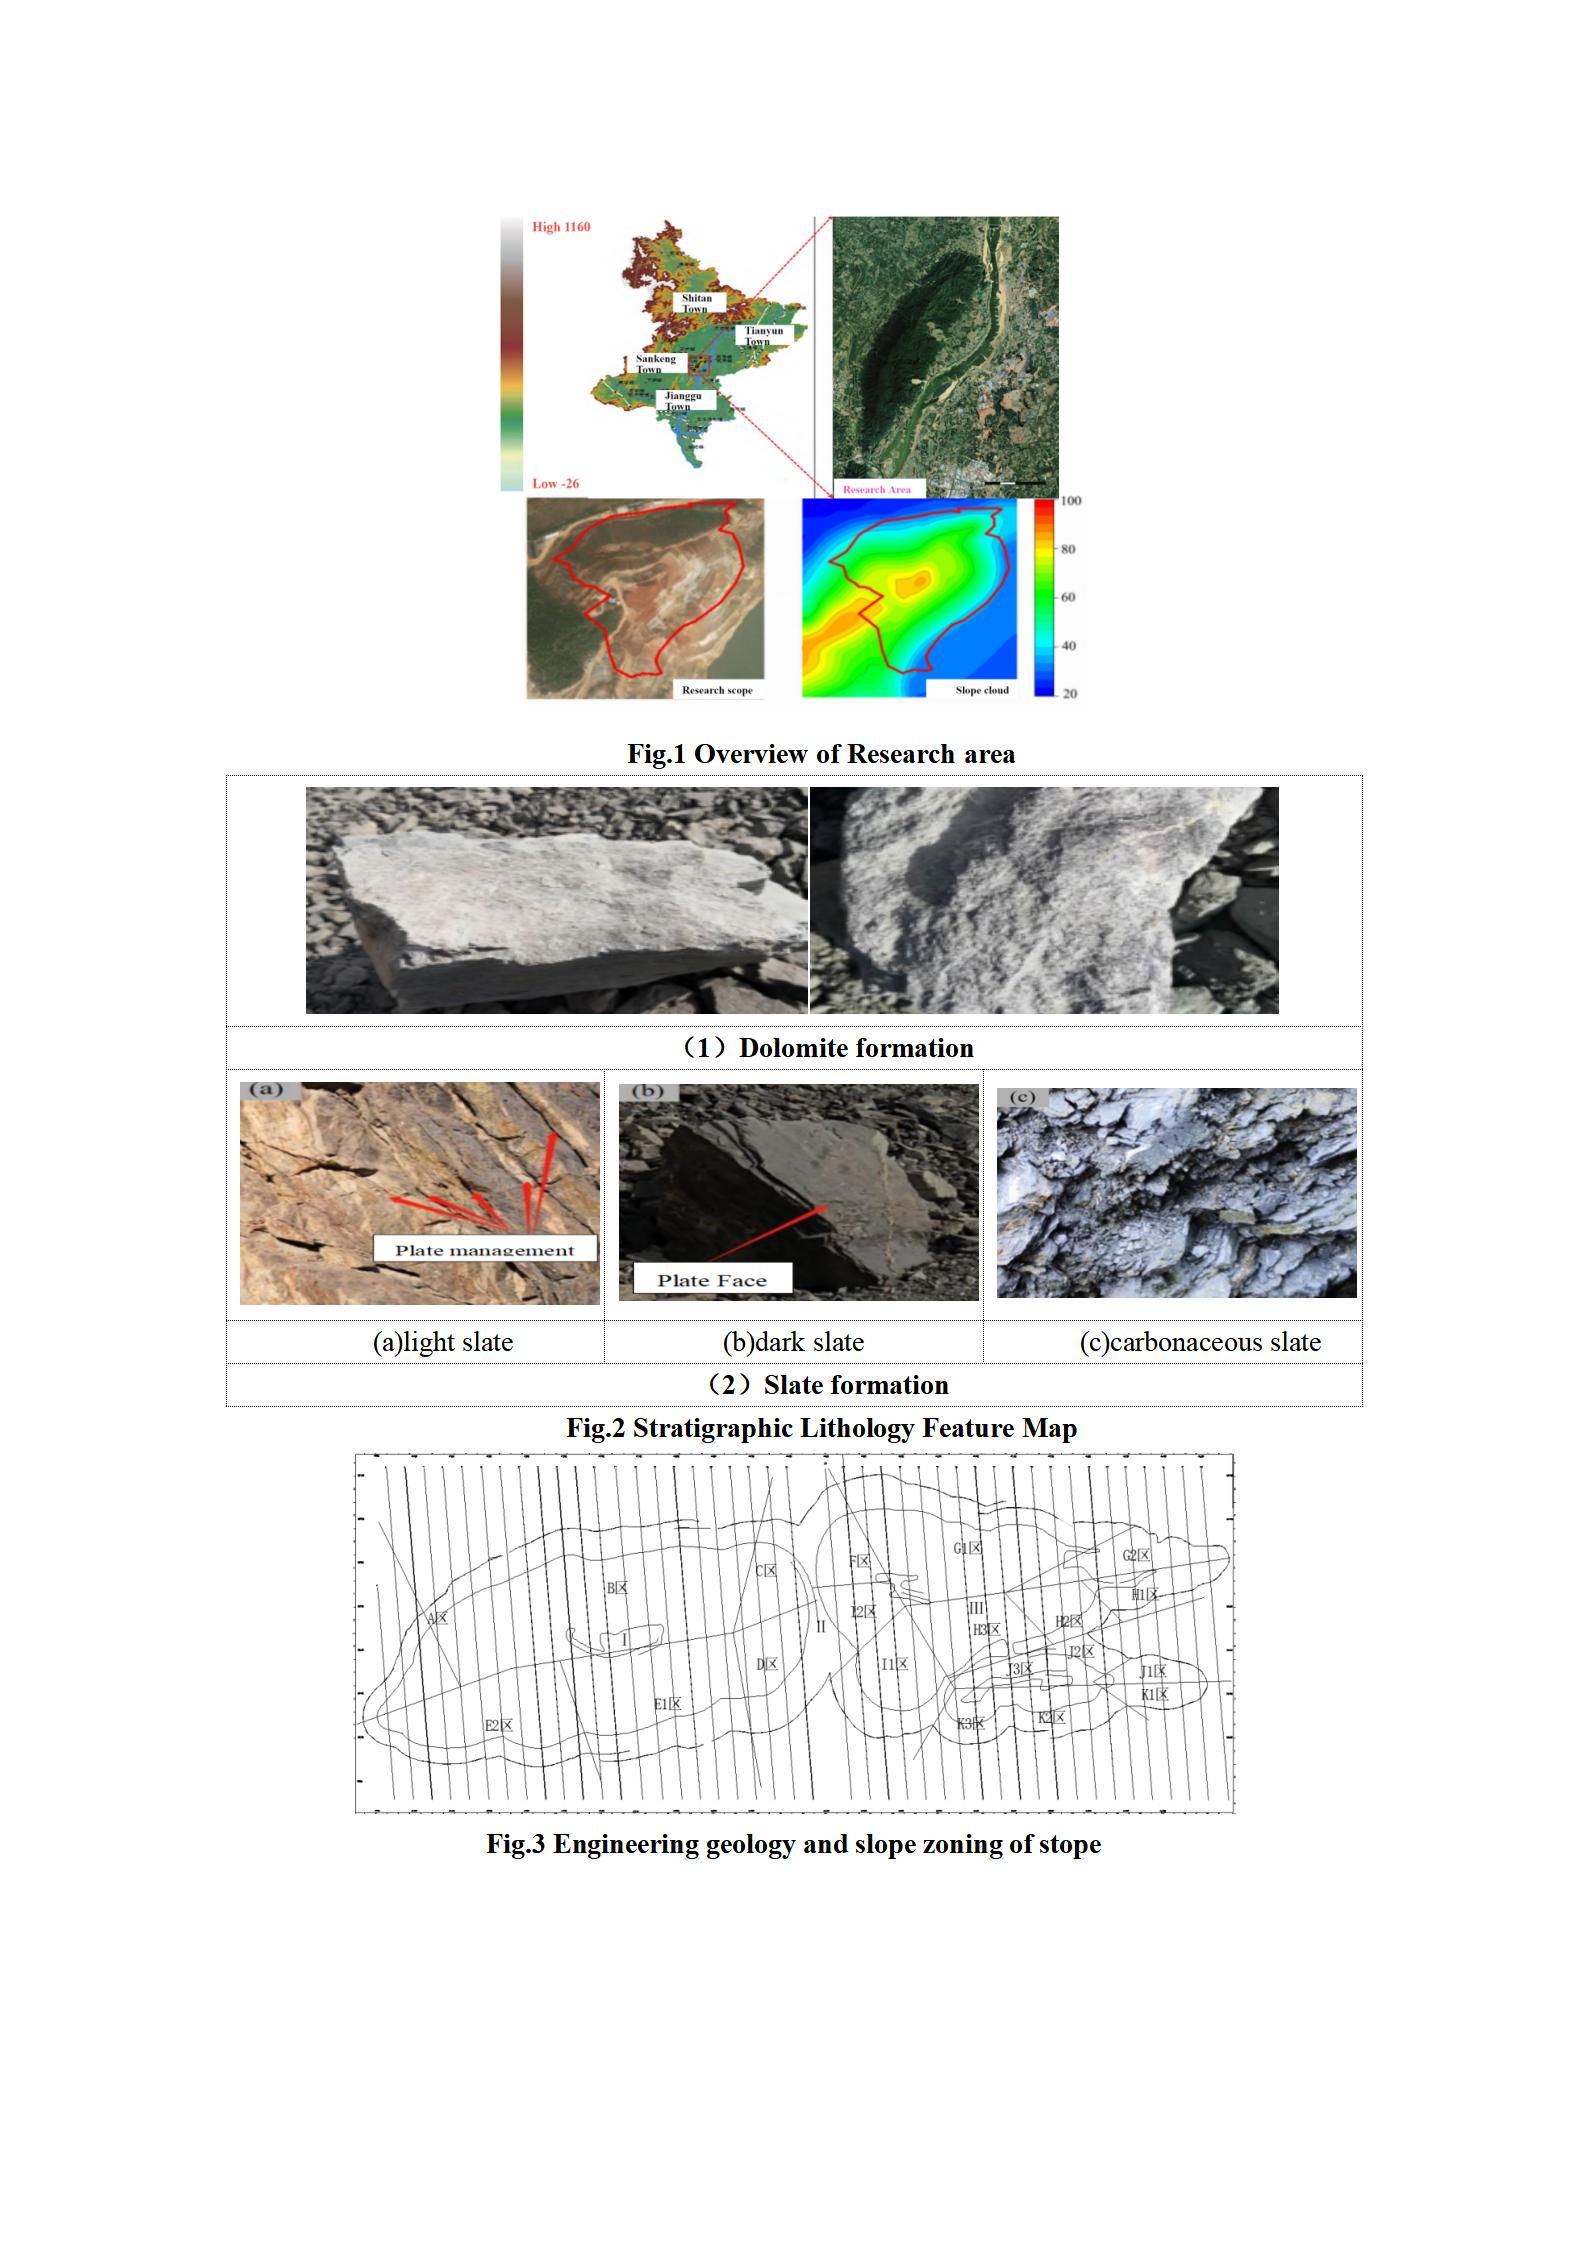
The Research area is located in the mining area of Sankeng Town, Maanshan City, Qingyuan, China, with the longitude ranging from 31°40′10″N to 31°40′30″N.The dimension is between 118°36′25″E and 118°36′40″E, and the total planning area is 11.50ha.Ma'anshan is an important node in the development belt along the Yangtze River in the Pearl River Delta.The Xiangshan area is the strategic fulcrum of the demonstration area of the integrated development of Guangdong-Hong Kong-Macao Greater Bay Area in the central urban area of Ma'anshan.At present, the main problem in Sankengzhen mining area is the destruction of topography and landscape caused by open-pit and underground mining.Long-term super-intensive and large-scale extensive mining has caused environmental problems such as bare mountains, solid waste accumulation, air pollution and water pollution.When carrying out governance, we should choose ecological and green strategies and facilities for planning and layout.We will transform ecological advantages into economic and social development advantages and explore an eco-friendly development model.To achieve more dynamic and sustainable development of high quality.
Figure 1.
Overview of Research area.
3.2. Engineering Geological Conditions
3.2.1. Landform and Meteorological Data
The elevation of Ma'anshan mining area in Qingyuan is 1400~1800 m, which is located in the plain area and dominated by hilly terrain.The terrain shows a clear east-west trend.The terrain of the West Mine is relatively low, with an elevation of less than 1700m, a relative height difference of 10-30m, and little topographic relief.The climate of the mining area belongs to the plateau continental climate type, the annual rainfall is less than evaporation, and the diurnal and annual changes of the climate are very significant.The annual average temperature is 7.4℃, the highest temperature is 35.2℃, and the lowest temperature is 18℃;The highest rainfall in a year is 251.7mm, and the lowest is 141.4mm.
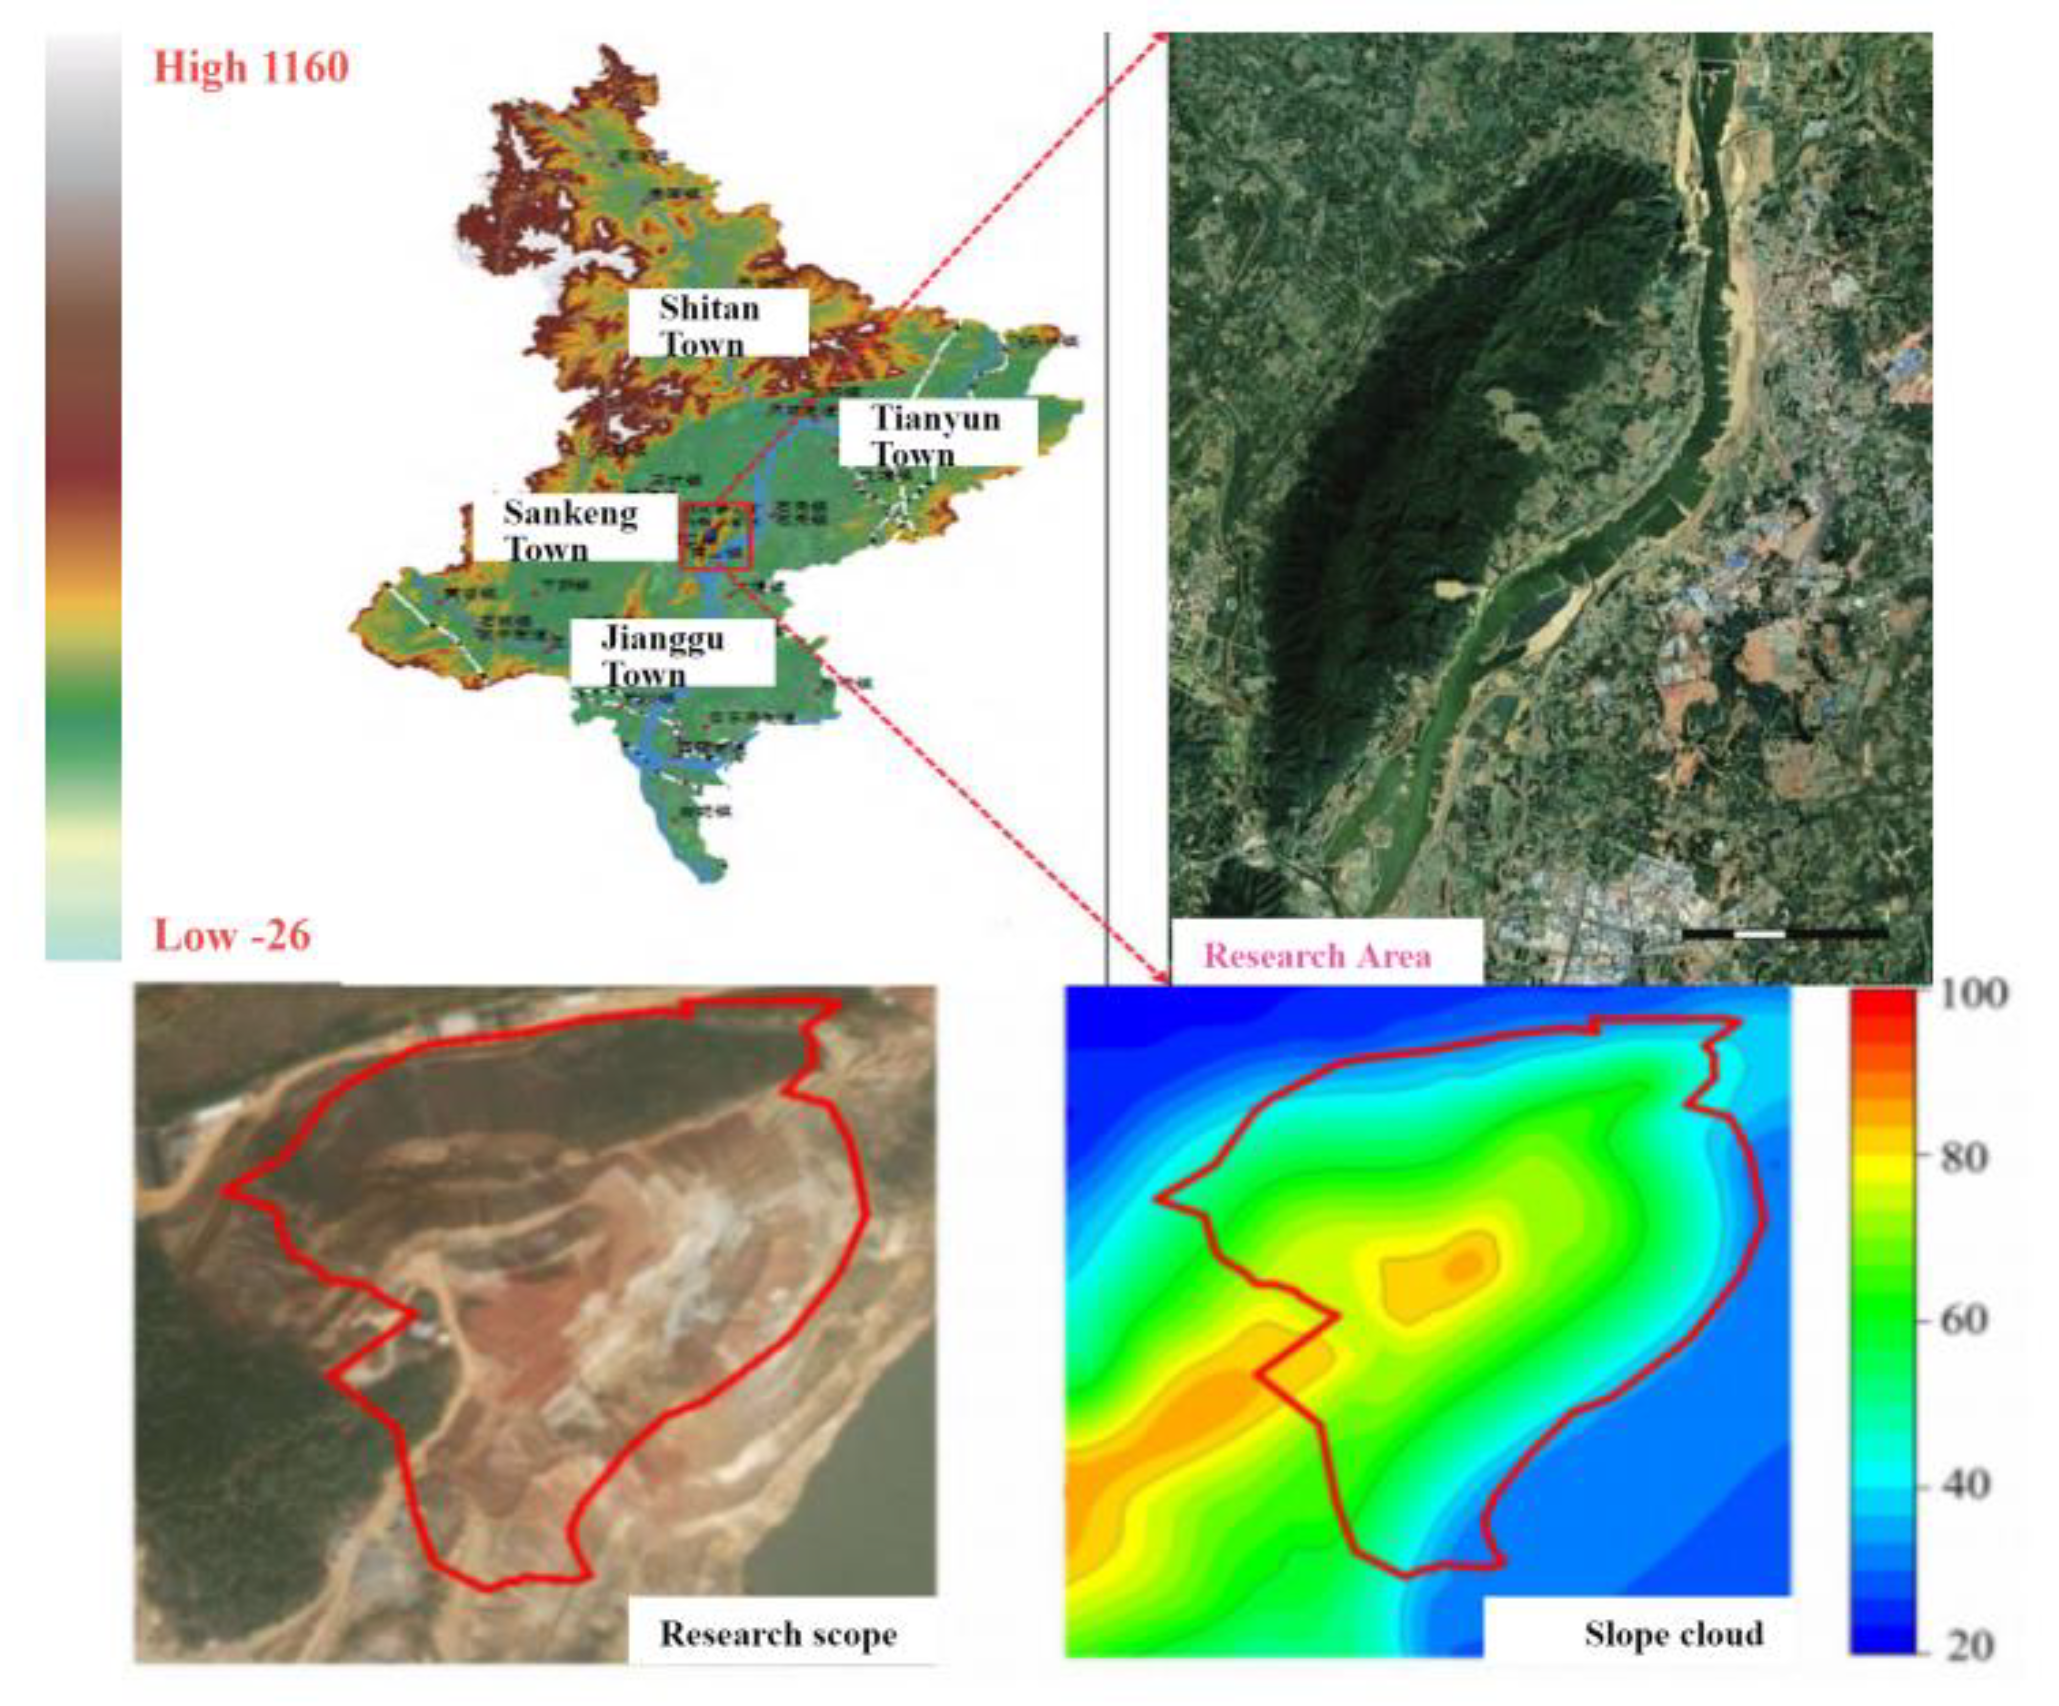
3.2.2. Stratigraphic and Lithological Characteristics
According to the historical geological data, the spatial distribution of strata in the mining area is identified.In combination with the surface geological survey, the stratum is divided into several engineering geological rock groups.From old to new, the strata exposed in the mining area are green crystalline schist of Erdaowa Group of Upper Archean.Proterozoic metamorphic rocks and Cenozoic Tertiary and Quaternary strata can be subdivided into 8 rock sections(H2~H9, H1 rock section is not found in the survey area),which can be found in Table 1.
Figure 2.
Stratigraphic Lithology Feature Map.
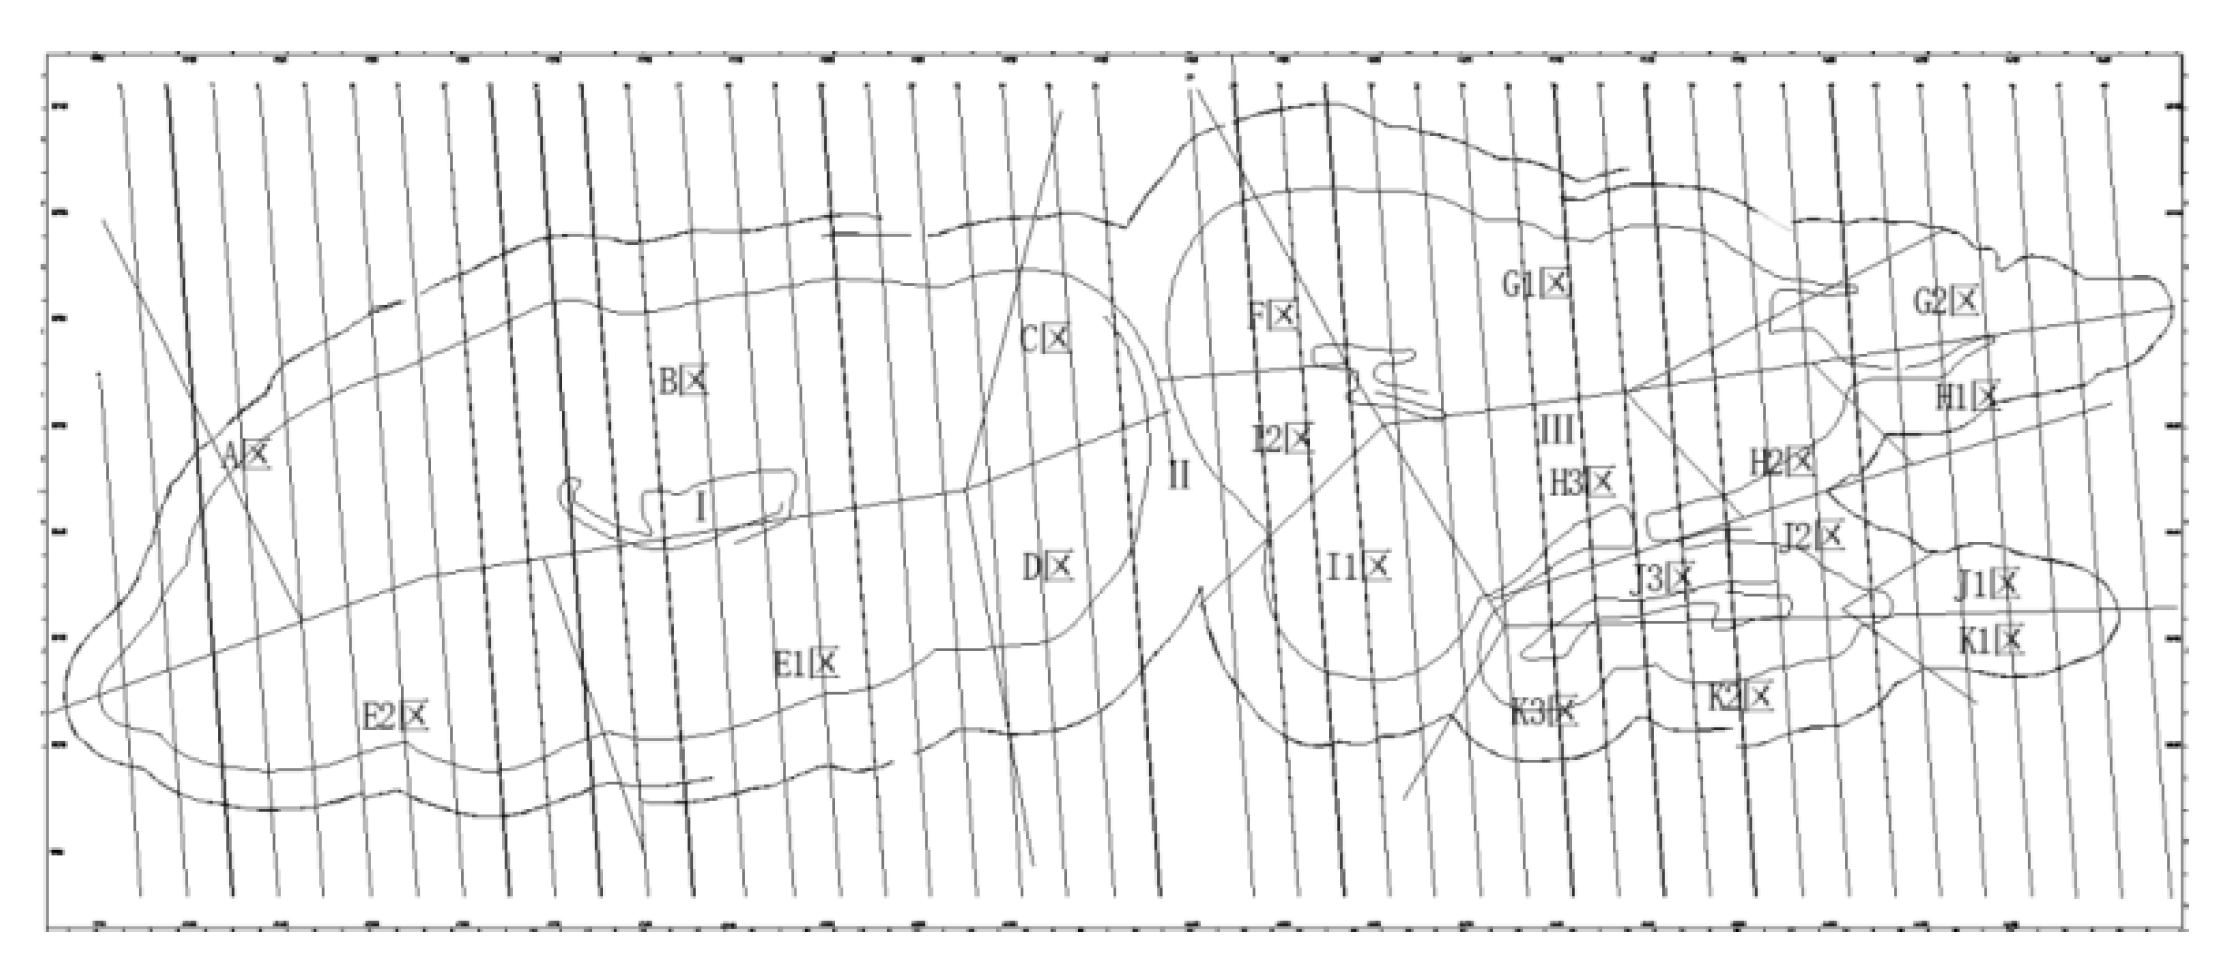
3.2.3. Engineering Geology and Slope Zoning
Due to the long boundary line of the slope and the complex geological conditions, the height and occurrence of the slope vary greatly.In order to evaluate the slope stability, the engineering geological zoning and slope zoning of Ma'anshan mining area in Qingyuan are carried out.Firstly, according to the main factors such as lithology, structure and hydrogeological conditions, there are two kinds of engineering geological rock groups at the slope of the site.Namely dolomite formation and slate formation.These sections with basically similar main factors in the site are divided into the same area.The site is divided into three engineering geological zones(Zone I, Zone II and Zone III).According to the engineering geological conditions, slope geometry and slope tendency, the western slope is divided into different areas.That is to say, the sections with basically the same factors are divided into the same zone, so that the same zone has similar slope geometric parameters.And is convenient for that stability calculation of the subsequent slope engineer.It is divided into 11 slope zones(numbered A~K respectively), and their locations are shown in Fig.3.The west stope has five zones from A to E, in which Zone E is subdivided into Zone E1 and Zone E2;The north stope has four subareas from F to I, in which Area G and Area I are subdivided into two subareas, and Area H is subdivided into three subareas;The south stope has two subareas, namely J and K, which are subdivided into three subareas respectively.
Figure 3.
Engineering geology and slope zoning of stope.
4. Theoretical Methods and Model Analysis
In this regard, the methods used are described and highlighted.Review of the literature indicated that SWMM+ArcGIS, 3S, and DBSCAN were introduced very clearly.Therefore, they are not mentioned in detail in this study.The details of them can be found in[16, 32, 33, 34, 35, 36, 37, 38, 39, 40, 41, 42, 43, 44, 45].In this section, the details of D-S and AI are presented.
4.1. SWMM Model+ArcGIS Terrain Data Processing
4.1.1. SWMM Model Method
The hydrological process simulation principle of the SWMM model is mainly based on several core components, It involves the processes of rainfall runoff, surface water accumulation, infiltration, pipe network flow and water quality simulation.
Rainfall runoff SWMM uses time series data to represent rainfall events, which can be actual observed data or designed rainfall events.The SWMM model is able to process rainfall intensity data at different time steps to simulate the rainfall process.In addition, SWMM uses nonlinear reservoir and infiltration models to simulate the process of runoff generation in the watershed.Combining the two can convert the rainfall received by the watershed into runoff, Simulate the process of water flow converging from the surface of the watershed and flowing to the drainage system.
Infiltration model SWMM provides three types of infiltration models:Horton model, Green-Ampt model, and CurveNumber model:Horton model The Horton infiltration model in SWMM is based on the Horton infiltration equation.It is used to simulate the infiltration process of rainwater on the soil surface.Horton equation reflects the phenomenon that the infiltration rate decreases with time, that is, at the beginning of a rainfall event, the soil is relatively dry.The infiltration rate is higher;As time goes on and soil moisture increases, the infiltration rate decreases gradually until it reaches a stable minimum.The Horton infiltration model is described by the following equation:
In the formula, F is the accumulated infiltration amount mm of TP at the moment;fmax is the initial infiltration rate mm/h, namely the maximum infiltration rate at the beginning of rainfall;fmin is the final stable infiltration rate mm/h i.e.the minimum infiltration rate when the soil is saturated after a long period of rainfall;k is the infiltration decay constant used to describe the rate at which the infiltration rate decreases with time.
(3)Green-Ampt model Green-Ampt model is another method used to simulate rainfall infiltration process.It is based on the Green-Ampt equation to describe the infiltration process of water in unsaturated soil.Compared with the Horton model, the Green-Ampt model focuses more on the description of physical processes, especially on the mechanism of soil wetting front entry.The Green-Ampt model assumes that the infiltration rate depends on the physical properties of the soil and the water head difference at the soil surface.The model is suitable for describing the infiltration process in a single rainfall event or a continuous rainfall event under initial dry conditions.The equation is as follows:
Where, fp is the infiltration rate mm/h;Ks is the saturated hydraulic conductivity mm/h;d is the water depth of the ground area mm;is the current humidity deficit mm;F is the accumulated infiltration amount mm.The Curve Number model is a method for estimating the amount of direct runoff from a rainfall event.It was originally developed by the Natural Resources Conservation Service of the United States Ministry of Agriculture.It aims to simplify the estimation of runoff under different land cover and soil conditions.The original curve model is mainly based on land use types, soil groups and pre-wetting conditions, and its core is an empirical equation.Used to calculate the effective rainfall(the portion that produces runoff)for a rainfall event, using the following equation::
Where Q is the total runoff in mm;P is the total rainfall;Ia is the initial loss in mm;and Smax is the maximum available soil storage in mm.
4.1.2. ArcGIS Terrain Data Processing
ArcGIS(full name:Geographic InformationSystem)is an integrated geographic information system(GIS)software platform developed by Esri Company in the United States.It can create, manage, analyze and display geographic information.It is widely used in map production, geographic analysis, asset management, spatial data management and other fields.Before divide that catchment area, the existing CAD terrain data is proces by using ArcGIS, The topography of the study area is analyzed from three aspects of elevation, slope and aspect.According to the Special Design and Construction Drawing for Comprehensive Treatment of Slope in Sankeng Mining Area of Maanshan City, Before the sponge transformation, the west slope was artificially cut and transformed.Technological parameters for slope cutting above the closed circle of west slope(+30.00m elevation):from top to bottom, slope cutting by steps.+30.00 m to+80.00 m is a bench of 10.0 m with a platform width of 6.0 m, except for the platform width of the+30.0 m bench.The bench slope angle is 33°, the final slope angle is 26°, and the maximum slope height is 55.0 m.Finally, seven platforms are formed:+30.0 m platform, +40.0 m platform, +50.0 m platform, +60.0 m platform, +70.0 m platform, +80.0 m platform and+85.0 m platform.Technological parameters for slope cutting of waste dump:slope cutting from top to bottom by steps, +40.00m~+80.00m is divided into 10.0m steps, and the step gradient is 1:1.75.Platform width 8.0 m.The maximum slope height, the maximum elevation and the minimum elevation of the slope of the back row soil yard are 55.0 m, +80.00 m and+25.00 m respectively, as shown in Fig.4 and Fig.5.
Figure 4.
Comparison of topographic data maps before and after the landslide.
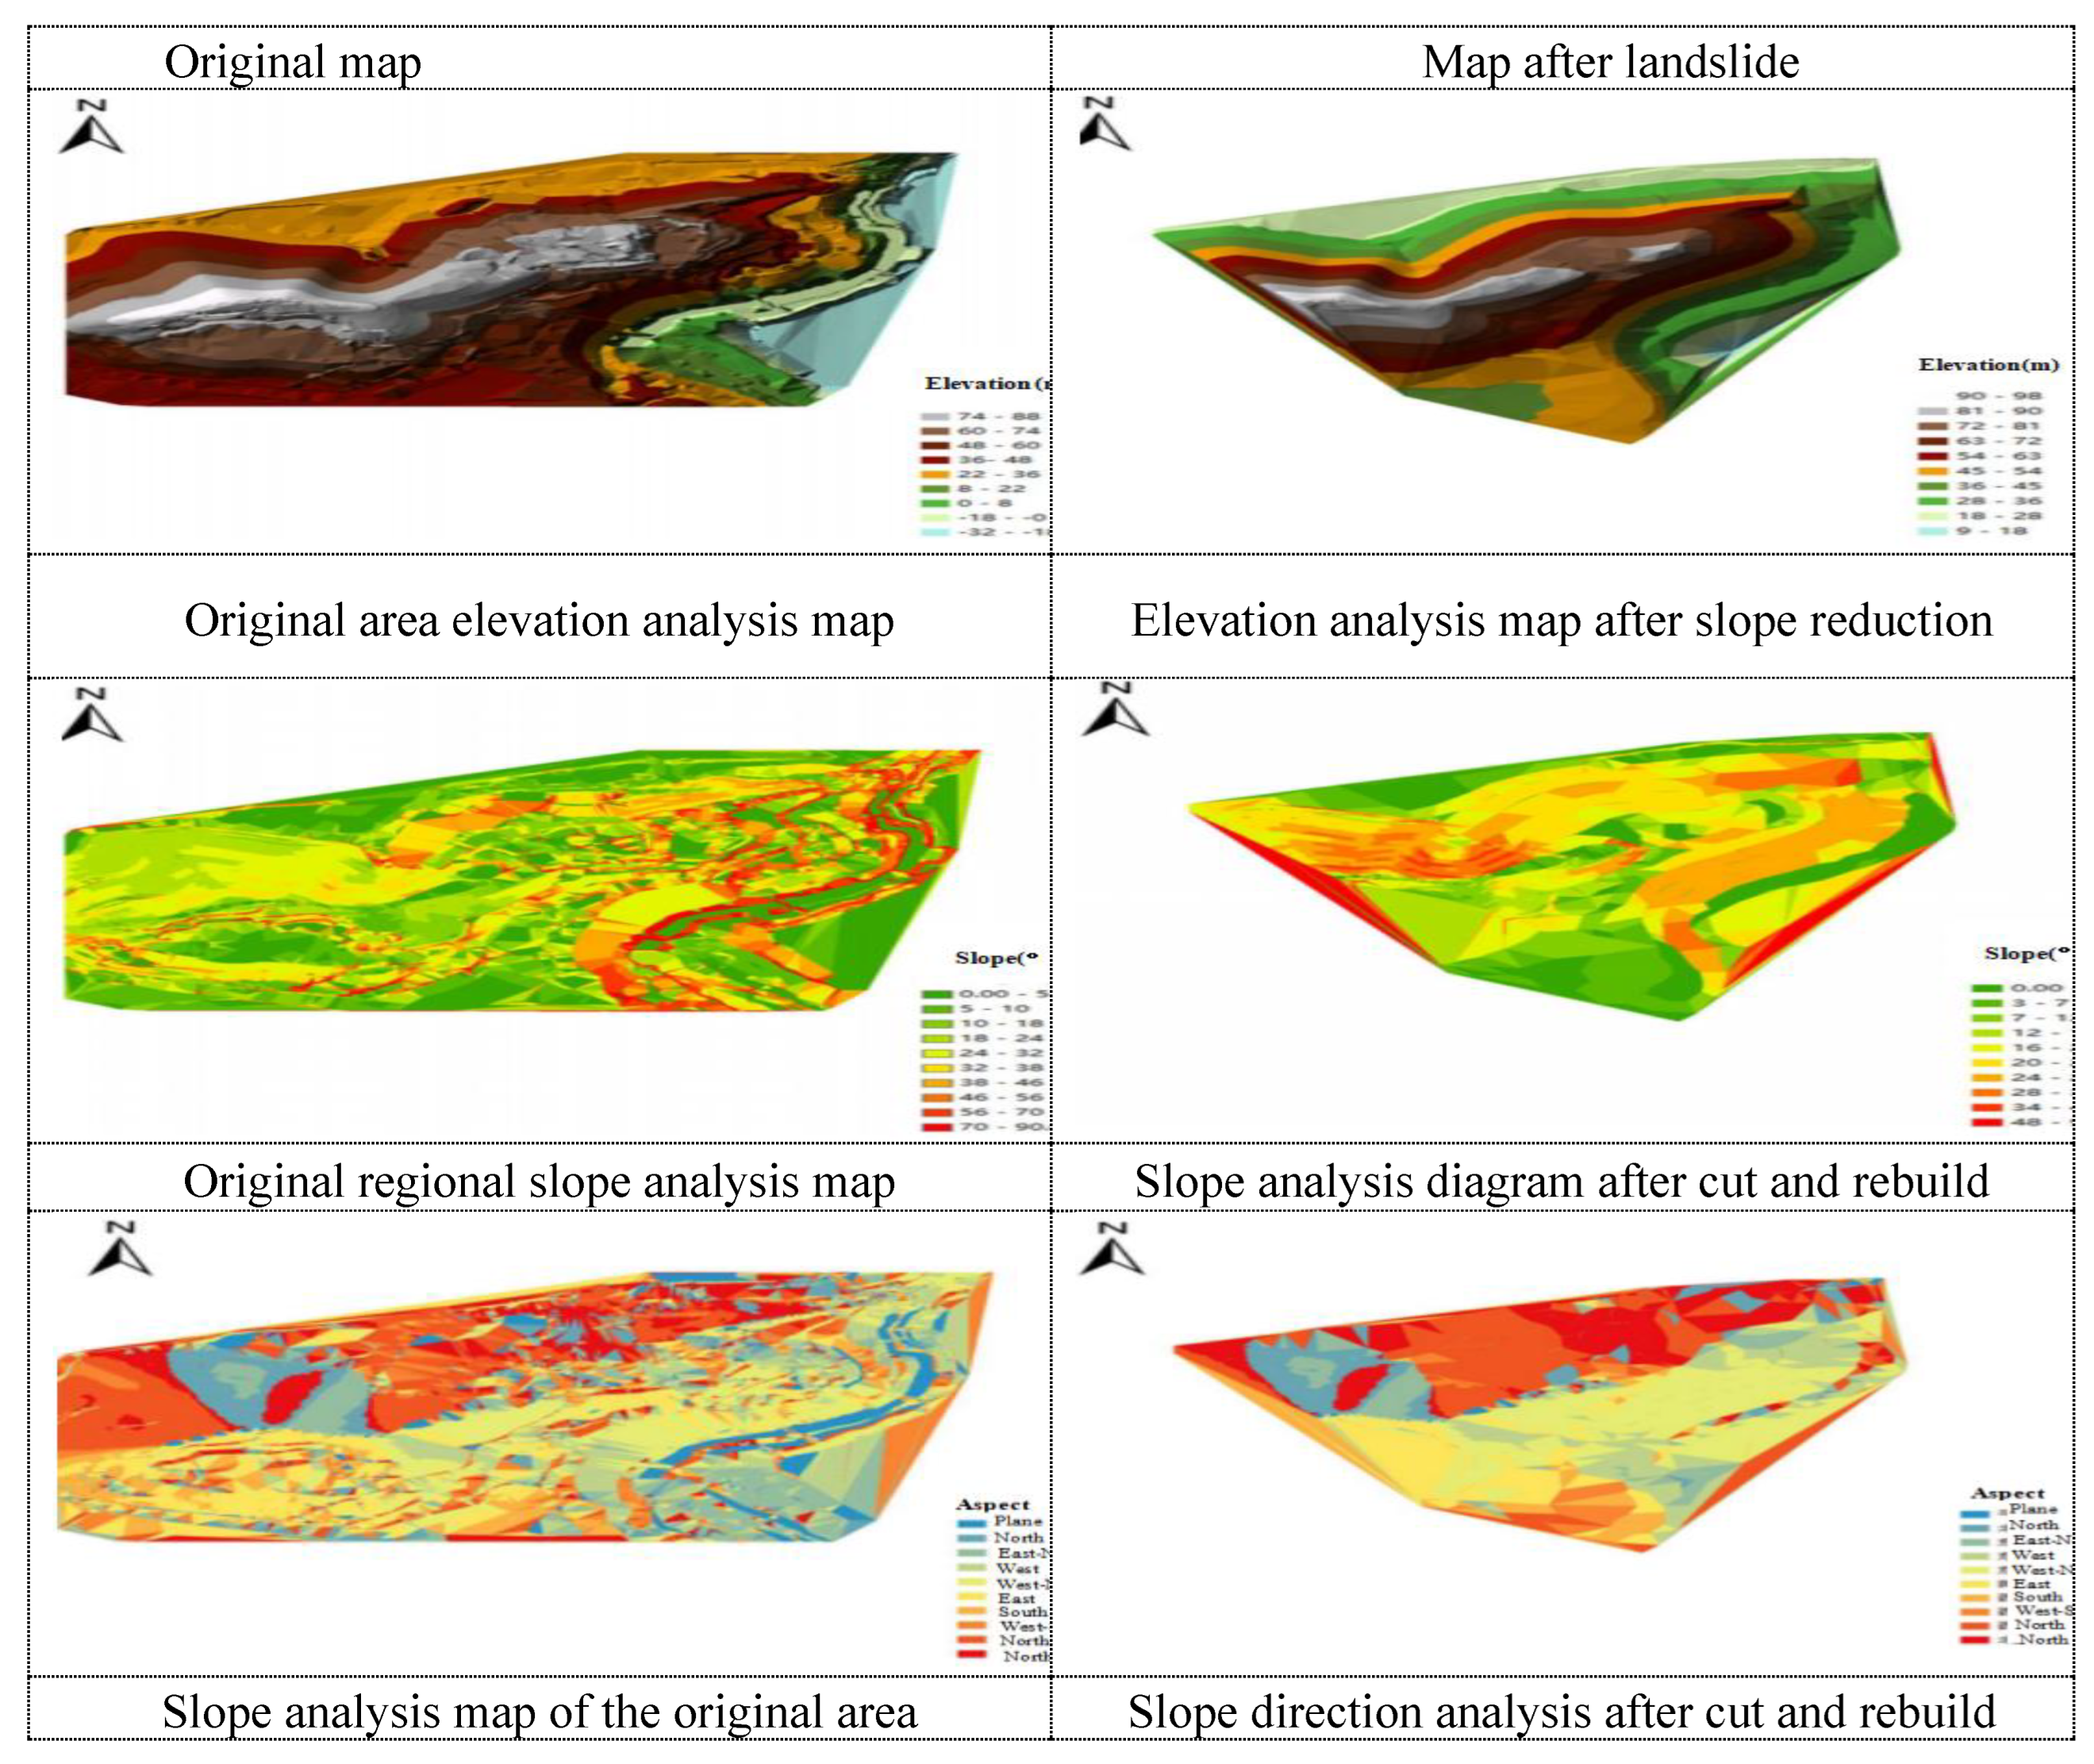
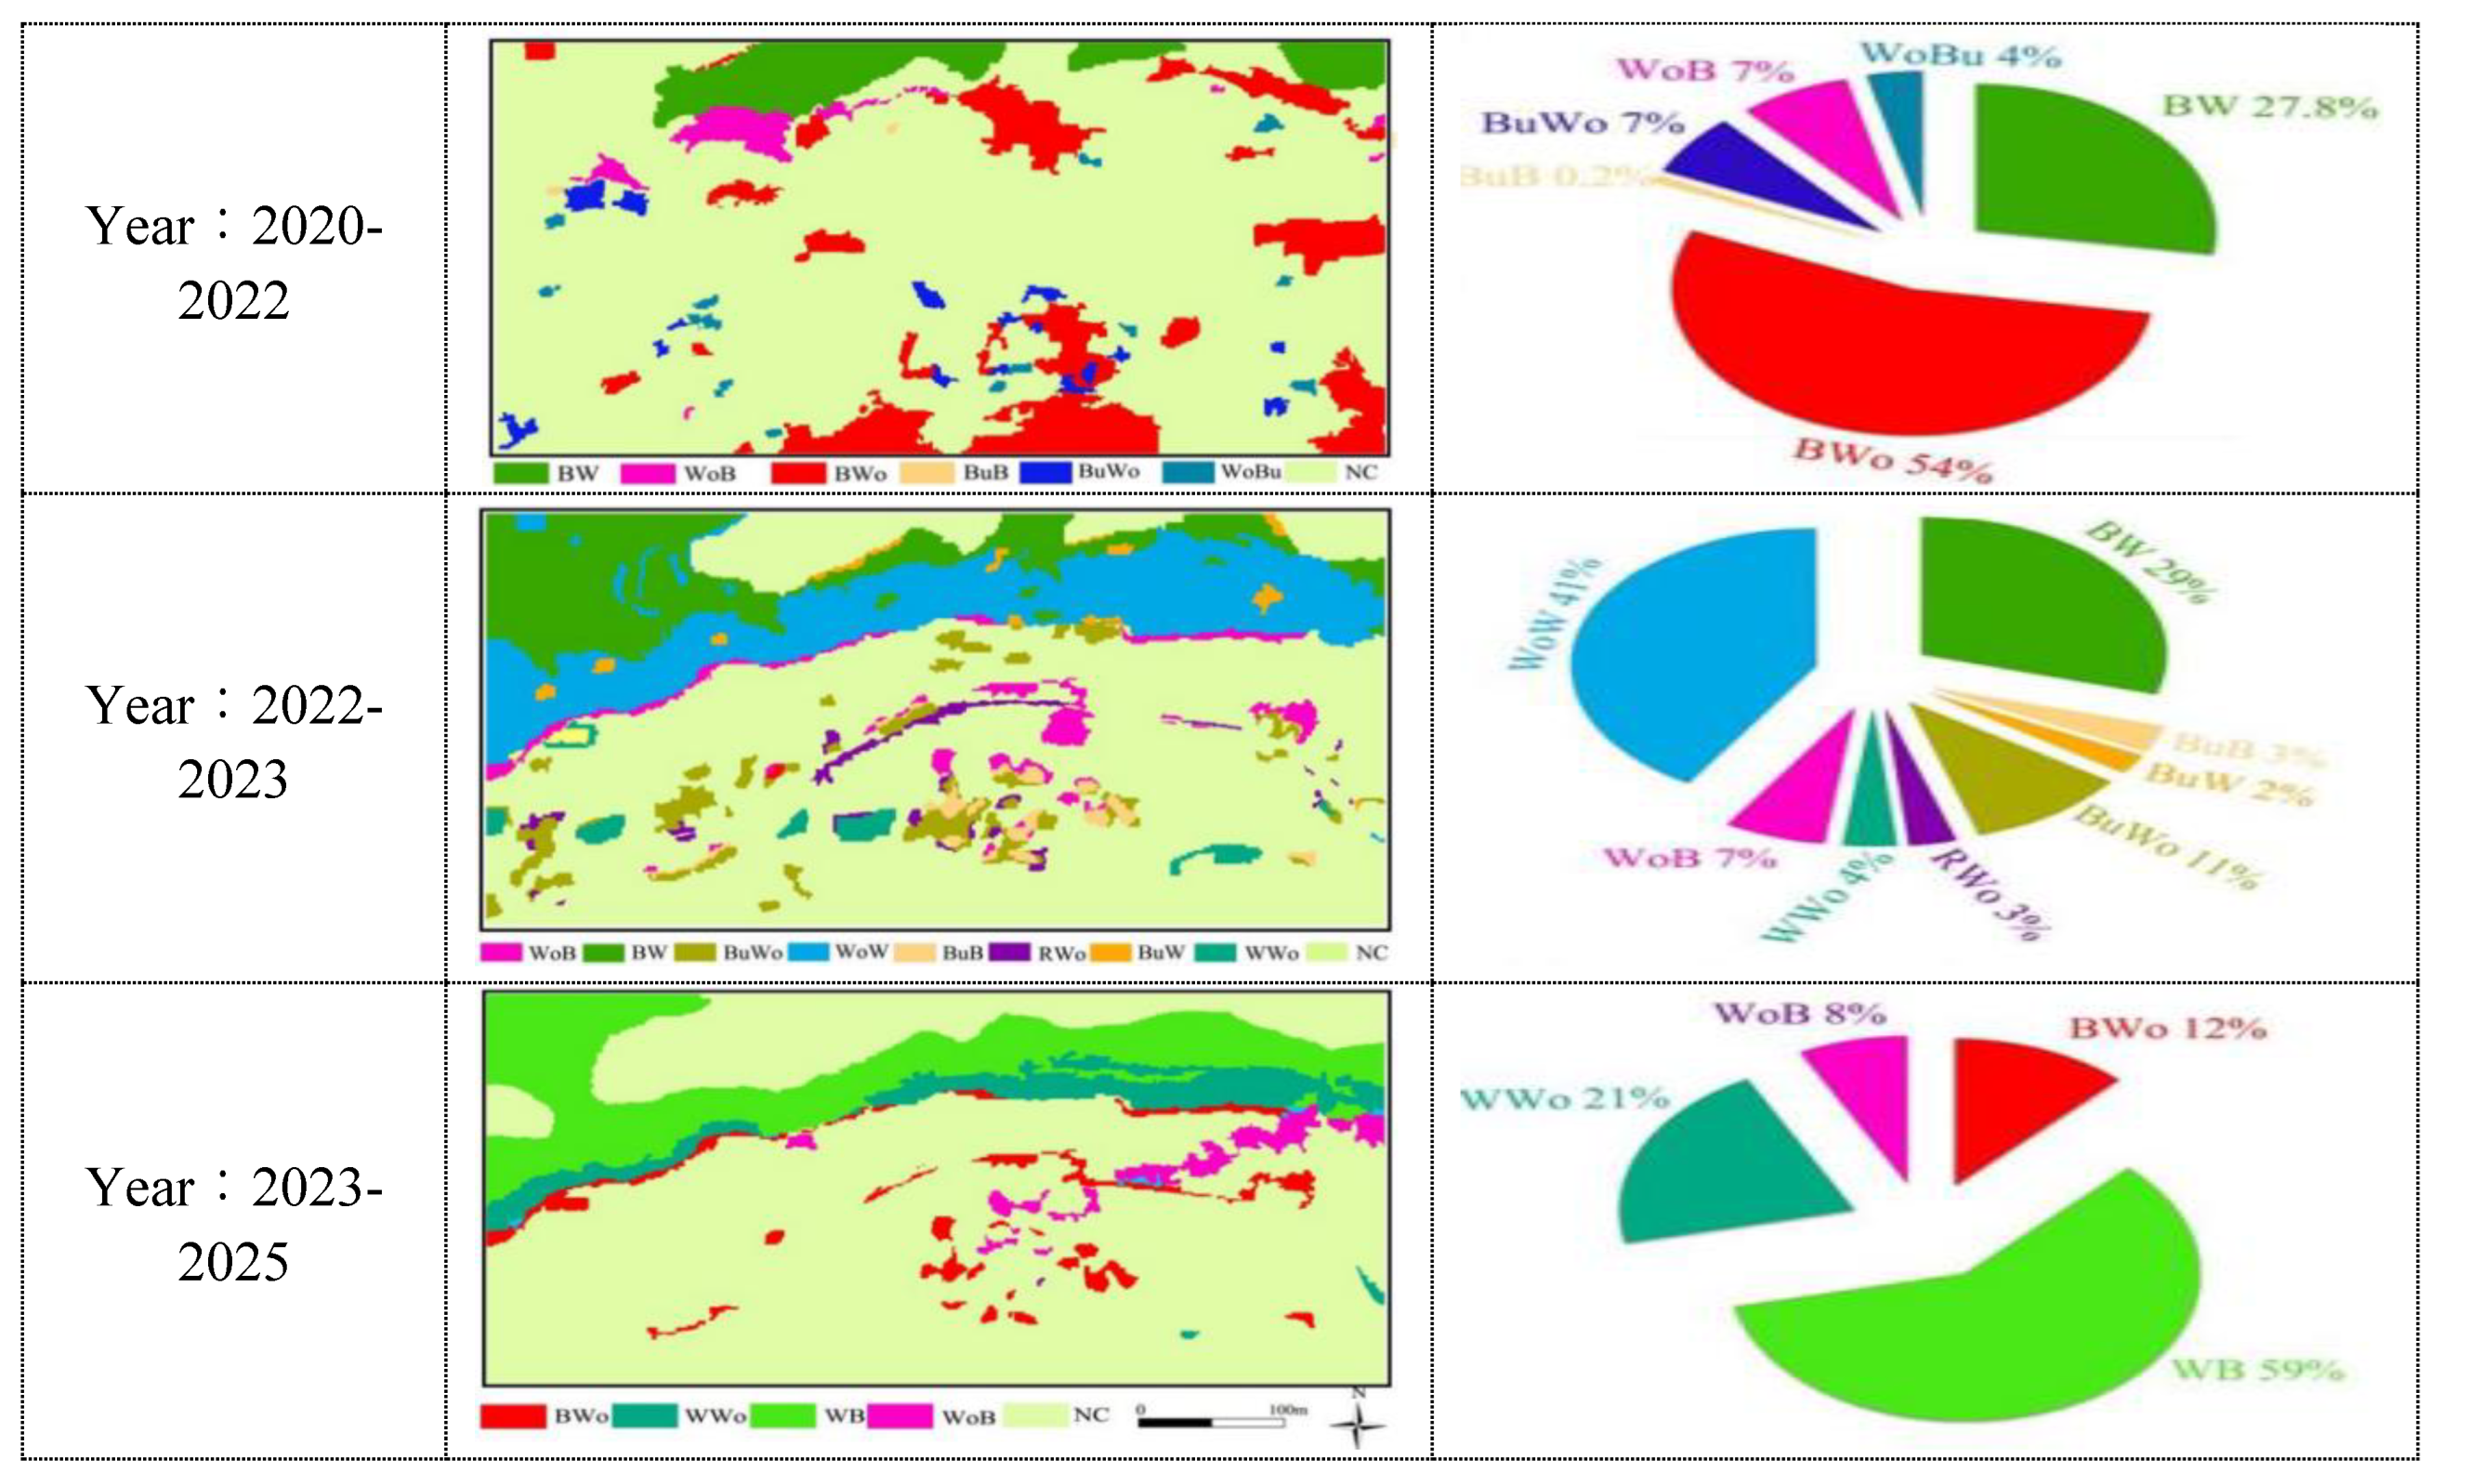
Figure 5.
Comparison of land use change detection in the study area in different time periods.
4.2."RS+GIS+GPS"3s Technology Method
In this paper, 3s technology is applied to the deformation and failure monitoring of single landslide disaster.To solve the problems of land use change, surface deformation and slope damage caused by landslide disasters.Remote sensing is mainly used to obtain the Land Cover Change Detection(LCCD)of landslides in the past 12 years.GPS is used for real-time monitoring of landslide deformation and destruction, while GIS is mainly used for data analysis and management of land use change.And realize drawing output.Finally, on the basis of 3s technology, the comprehensive monitoring of landslides is realized, and the specific research ideas are shown in Figure 6-7.
Figure 6.
Landslide failure characteristics analysing based on“3S+AI”.
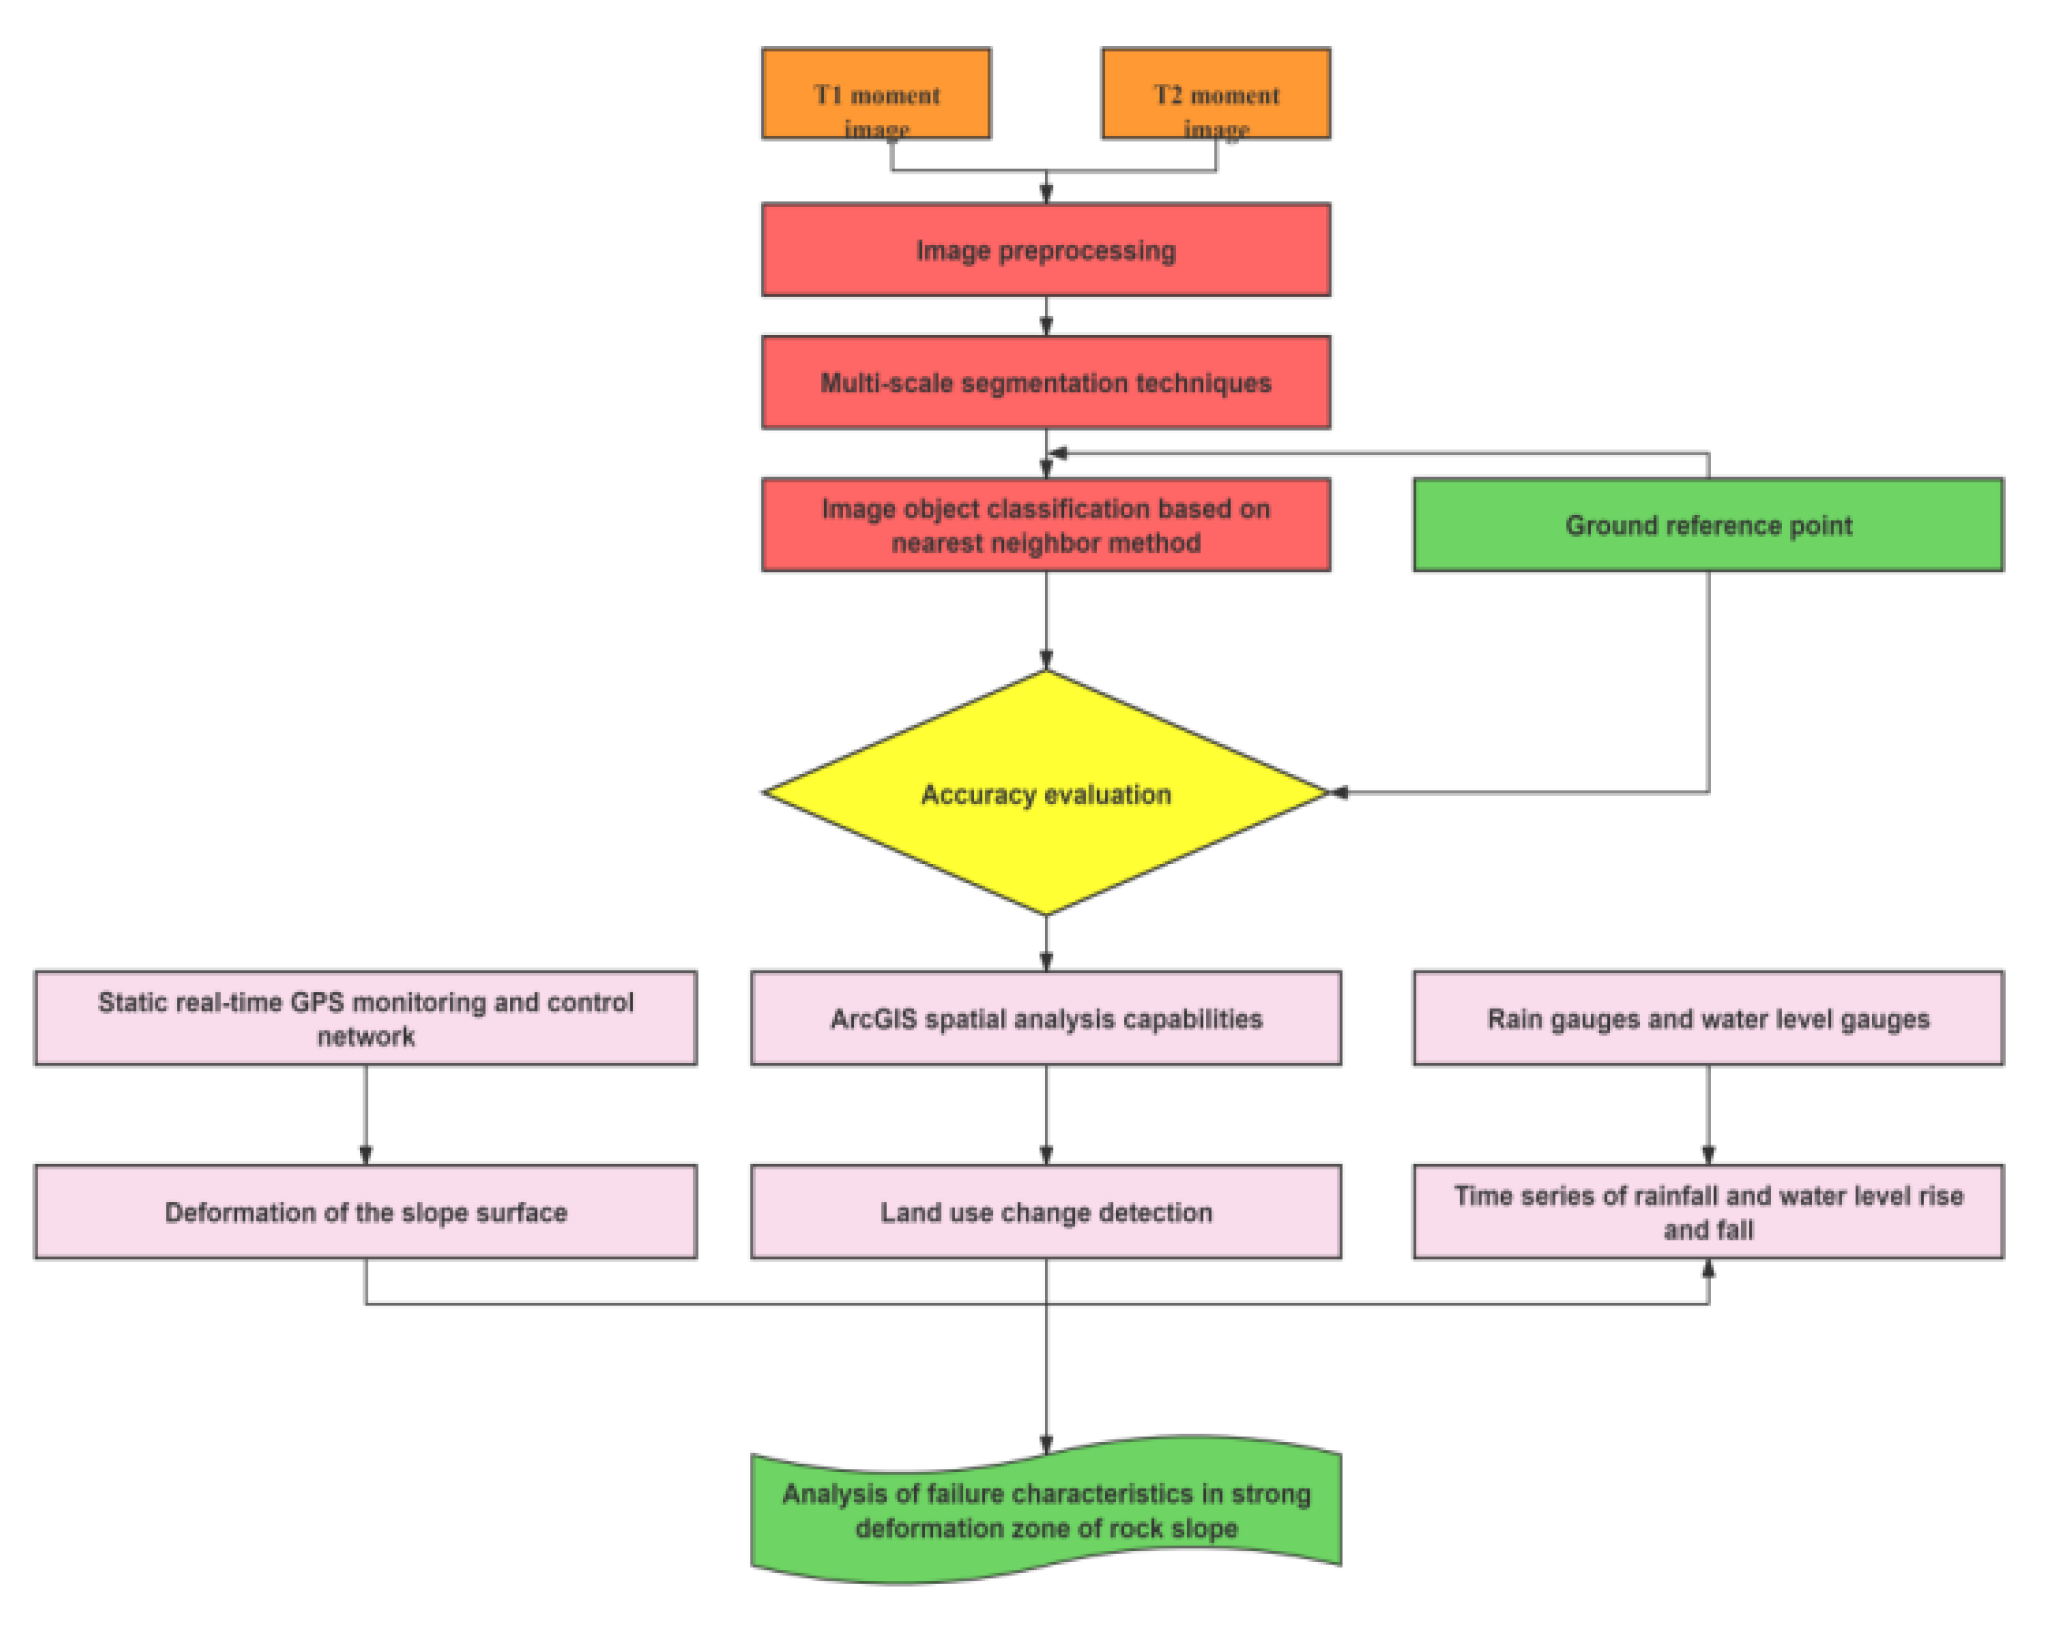
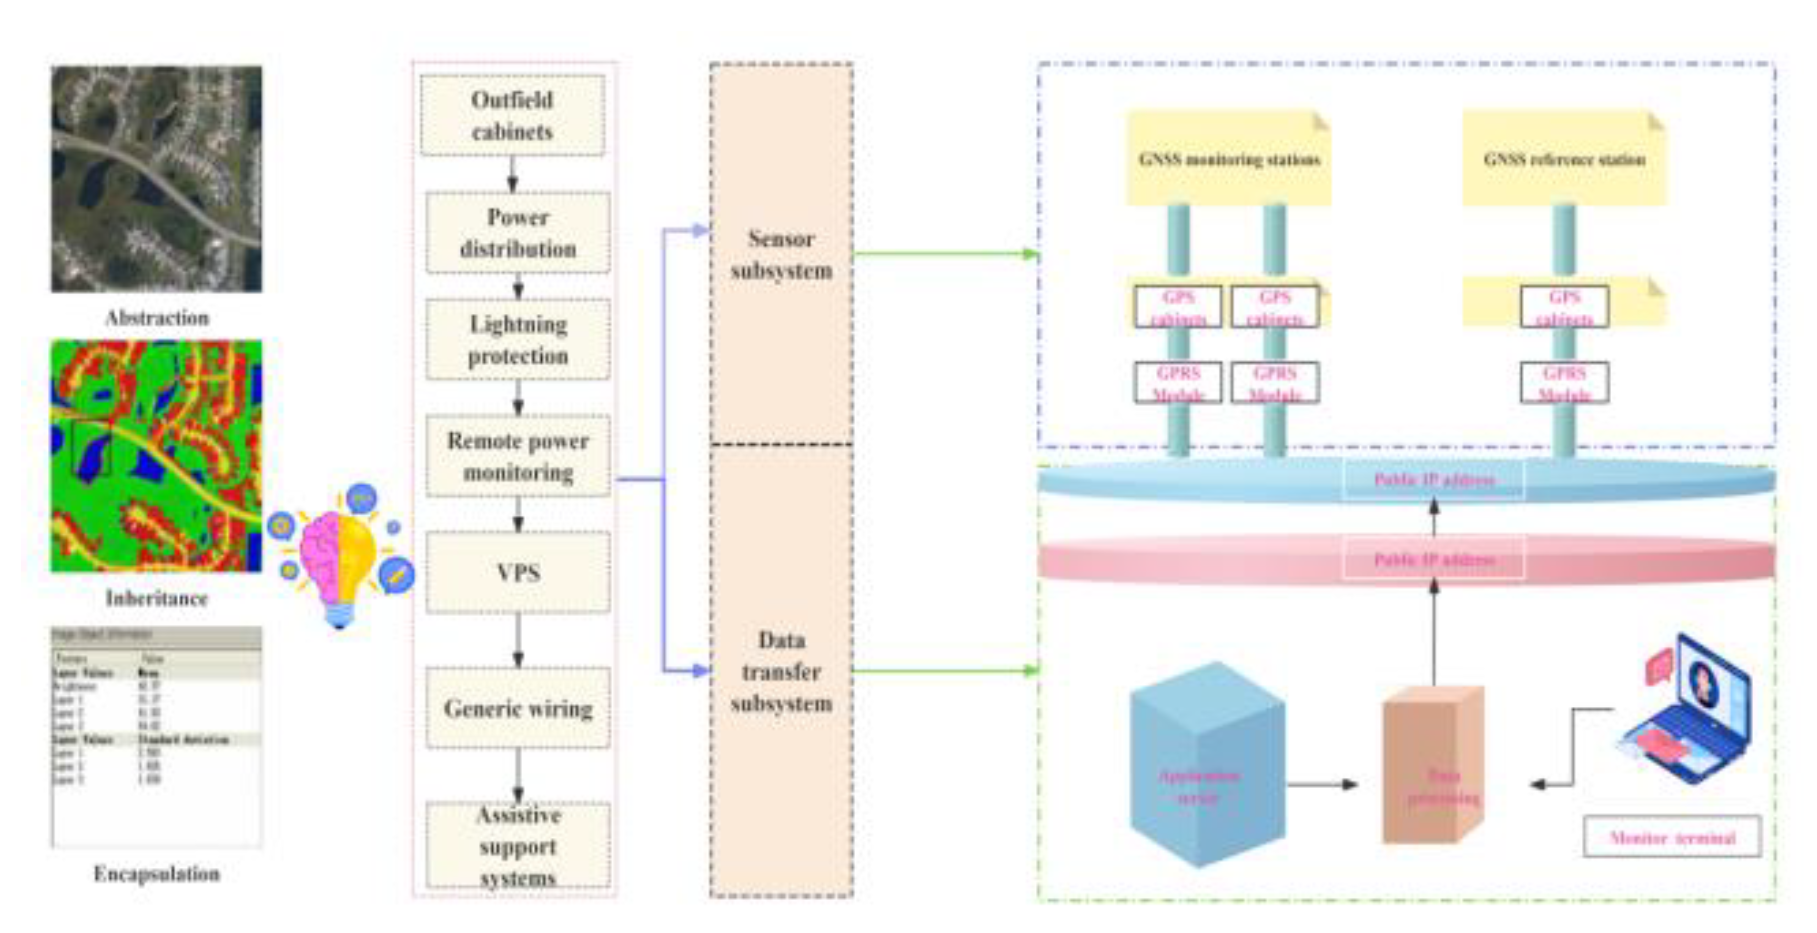
Figure 7.
Structural topology diagram and transmission route of slope GPS monitoring system.
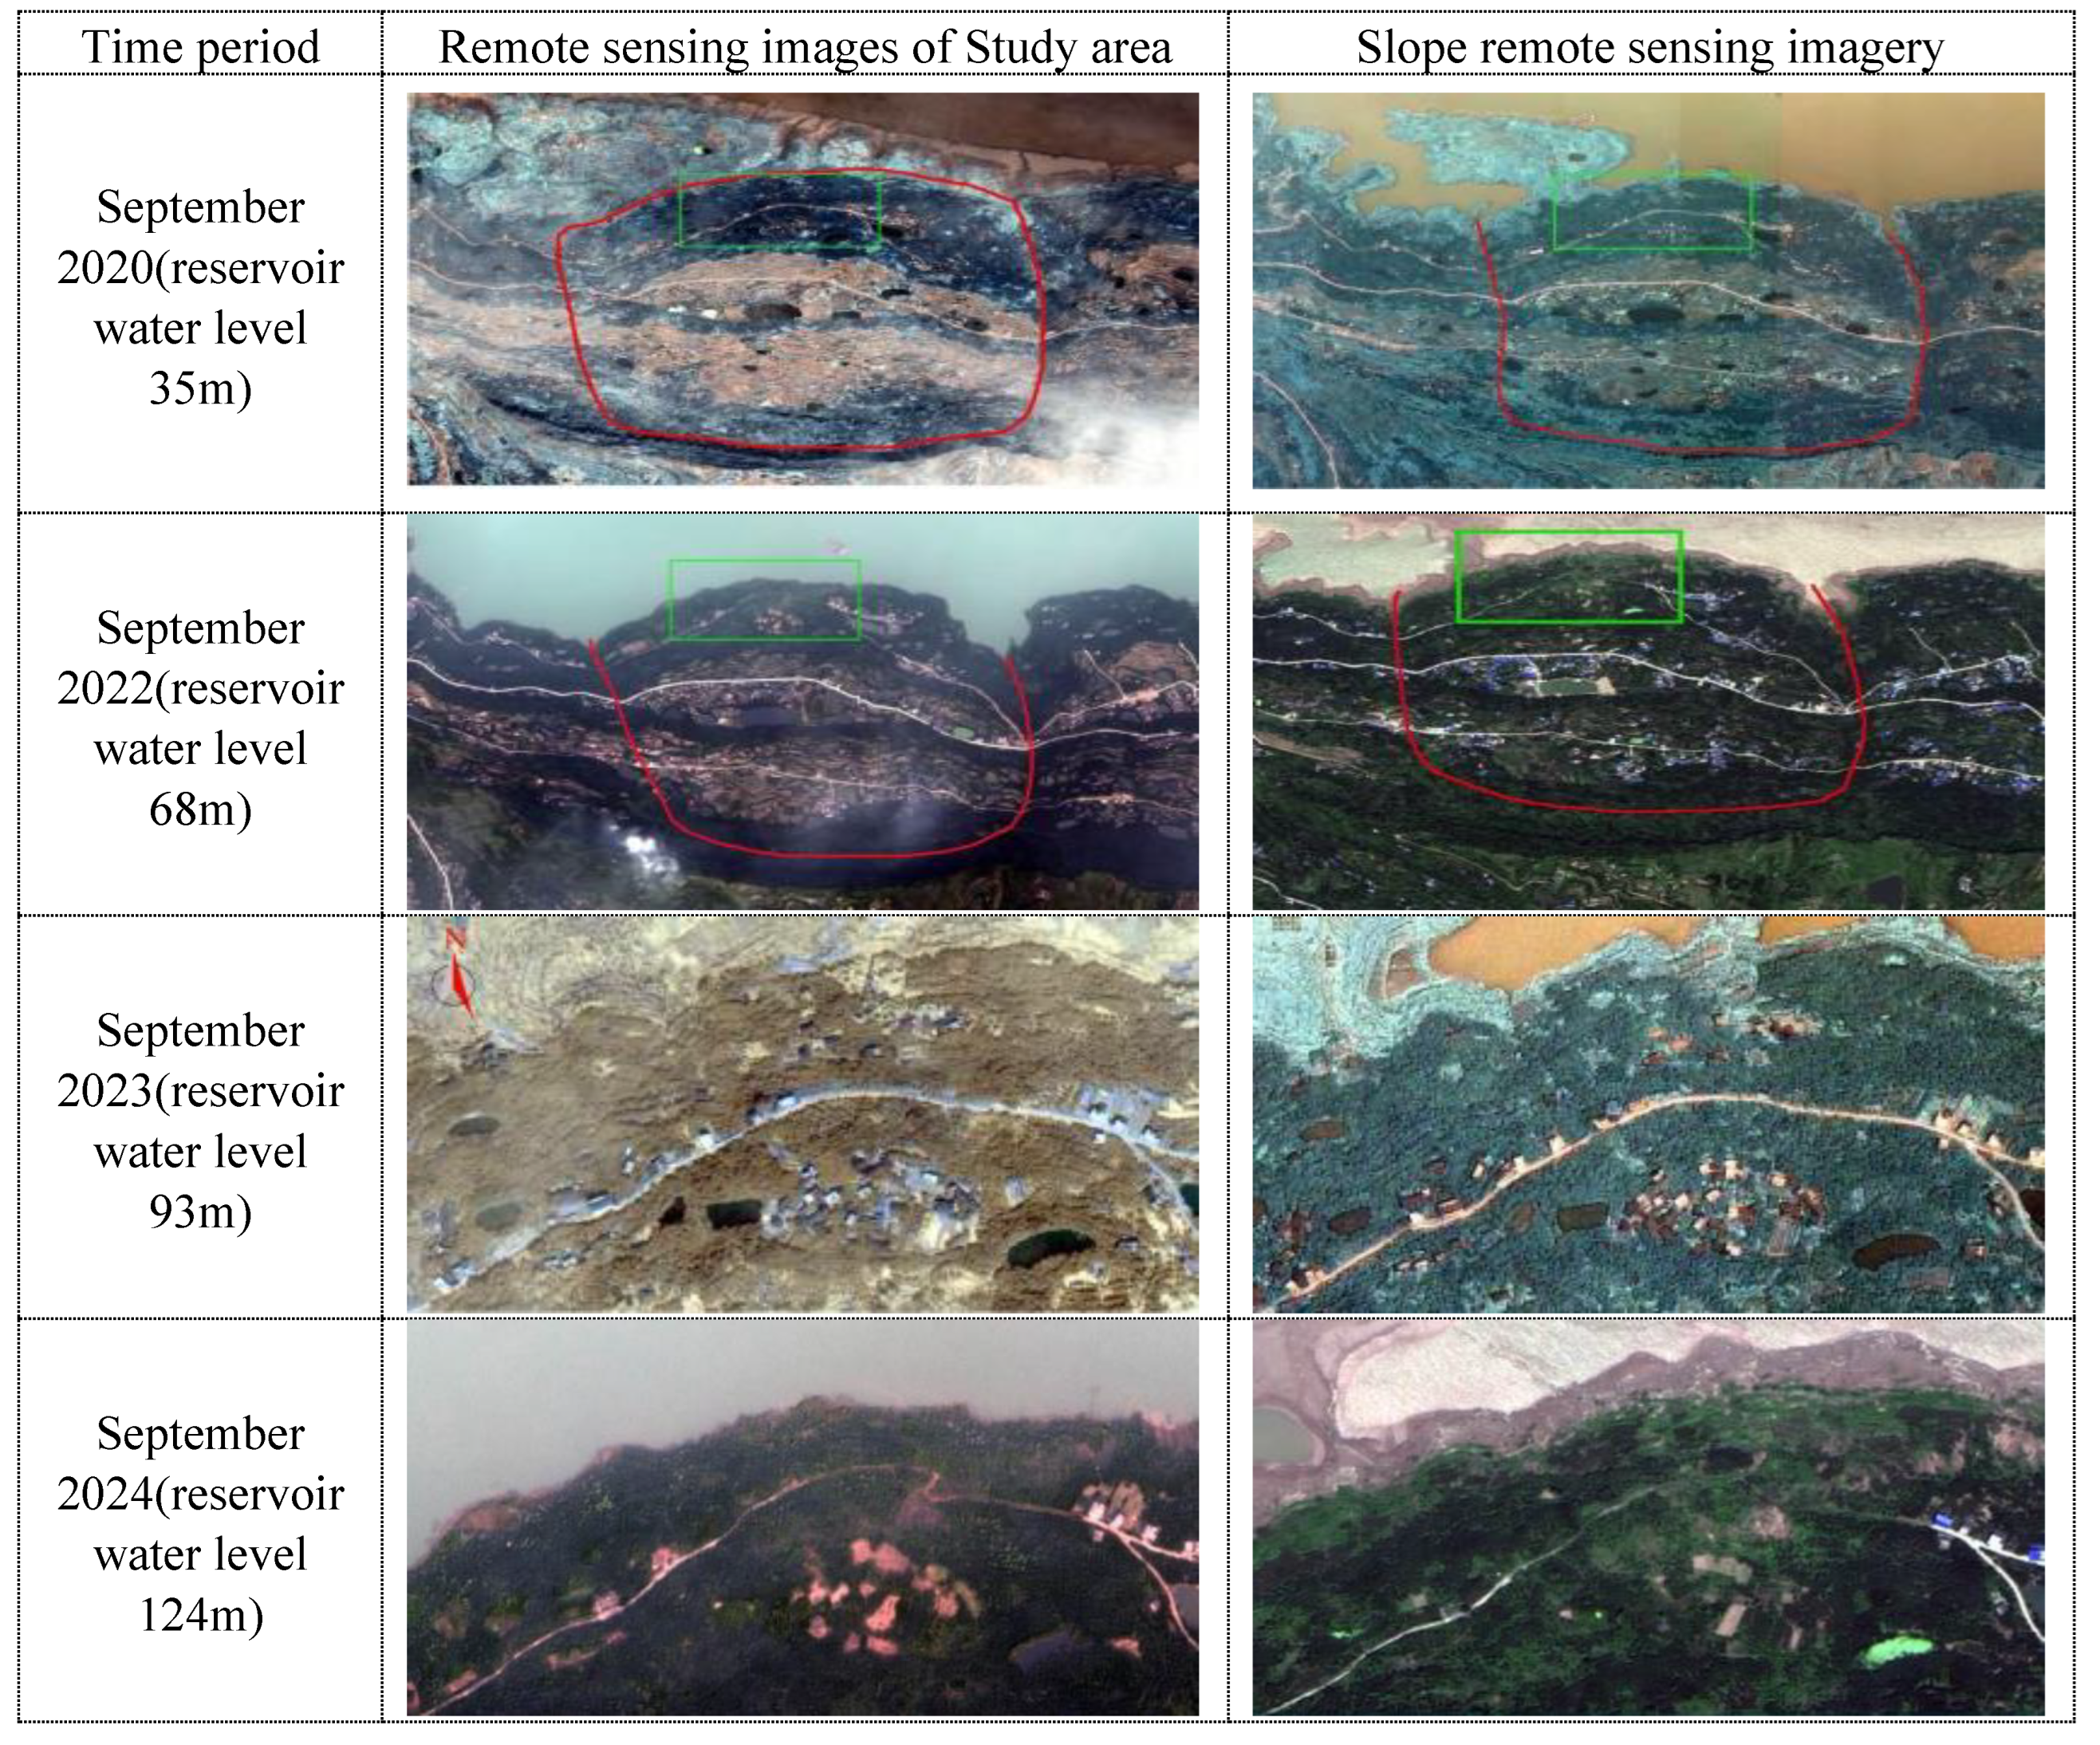
In order to detect the land use change in the study area, four high-resolution remote sensing images were used.One is the IKONOS-1 high score image acquired on September 9, 2020, and the other is the QuickBird high score image acquired on September 20, 2022.The other two scenes are WorldView-II high-resolution images acquired on September 8, 2023 and September 12, 2024.The parameter characteristics of these four high-resolution images are shown in Table 2-1.Through the visual discrimination of these four images(Figure 8), it can be seen that these images are suitable for land use change detection.Meanwhile, the strong deformation area at the front edge of the landslide is taken as the study area, as shown in Fig.9.
Figure 9.
Remote sensing images of the study area. Note:The landslide study area, in which the red part is the Tangjiao landslide boundary and the blue part is the strong deformation area.
Figure 9.
Remote sensing images of the study area. Note:The landslide study area, in which the red part is the Tangjiao landslide boundary and the blue part is the strong deformation area.
A geometric correction method based on an"image to image"strategy is used for land use change detection, The 2020 Quickbird image was used as the base image, and the 2022 IKONOS image and the 2023 and 2024 WorldView images were used as the images to be corrected.In this paper, the quadratic polynomial geometric transformation method is used as the correction model, and 50 feature control points are selected on multiple images.Finally, the accuracy of geometric correction of remote sensing images in 2022, 2023 and 2024 is 1.81, 1.49 and 1.67 pixel units, respectively.The spatial resolution resampling is 0.5 m.The scale parameters were selected in steps of 20, 30, 40, and 50, as shown in fig.10.It can be seen that the IKONOS image is effectively segmented when the segmentation scale is 30, However, when the segmentation scale is 20, 40 and 50, the phenomenon of over-segmentation or incomplete segmentation occurs.
Figure 10.
Multi-scale segmentation results of four images.
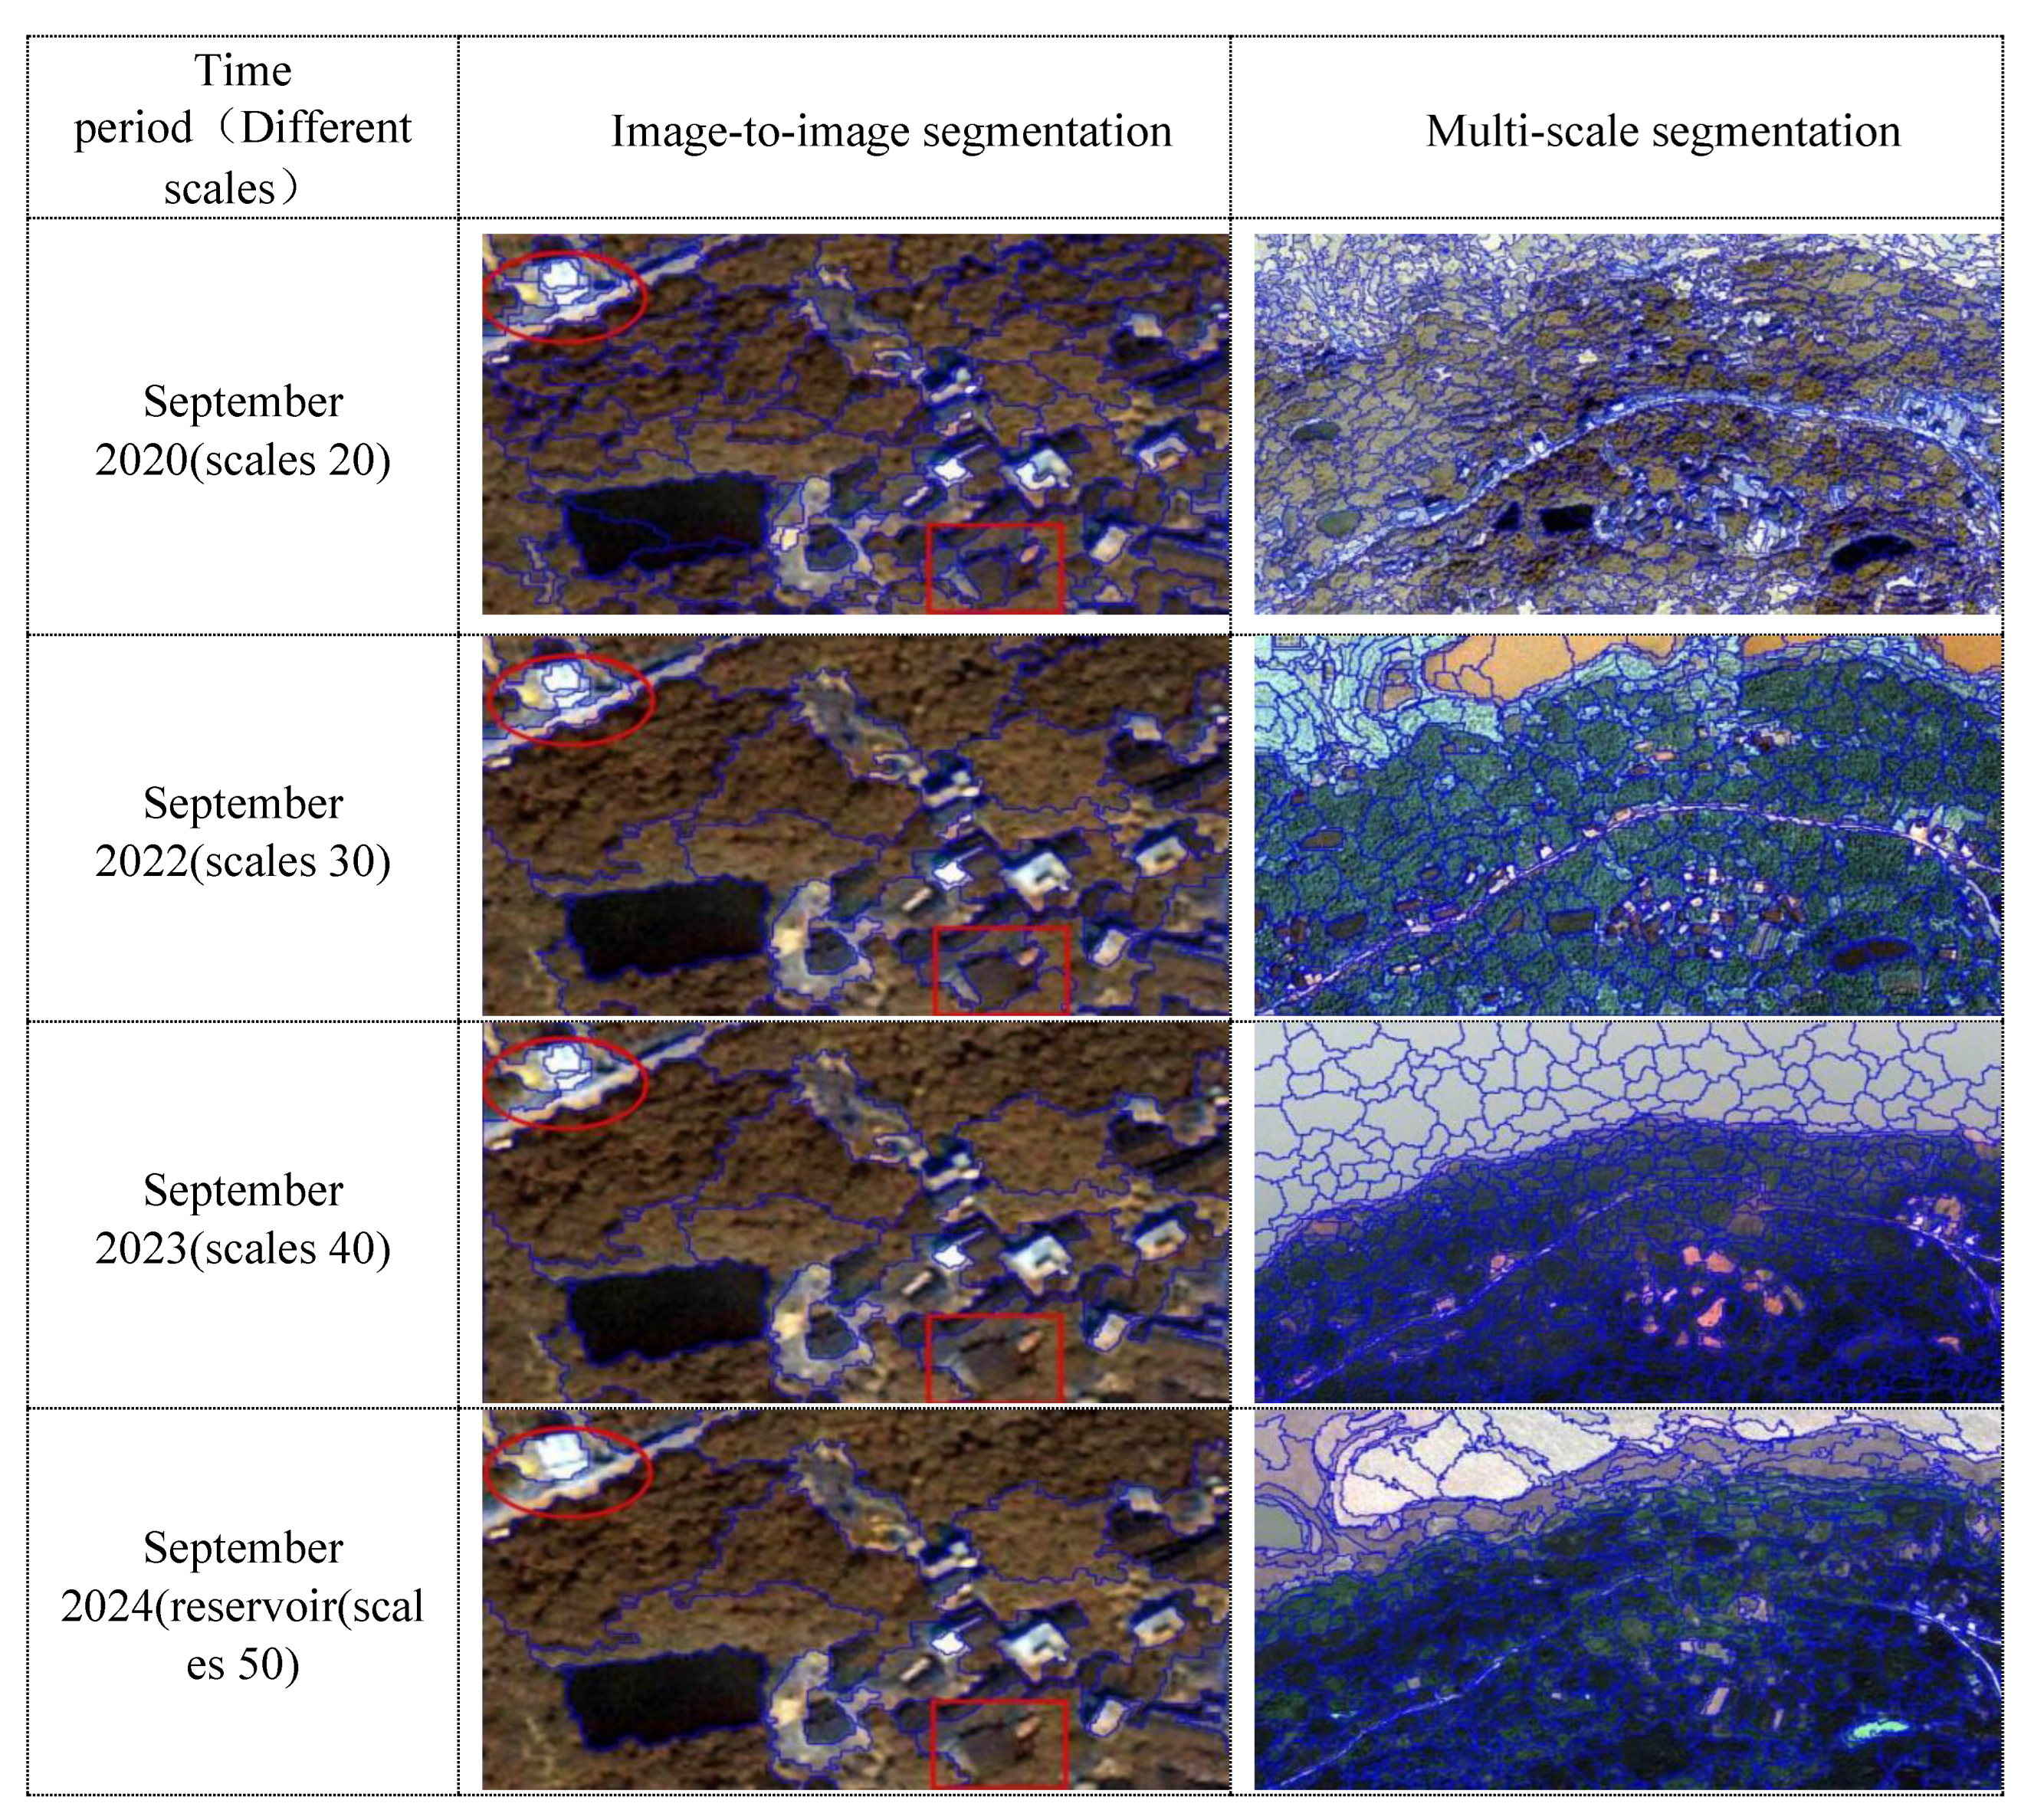
Generally speaking, the color parameter should be set to a larger value and the shape parameter should be set to a smaller value when multi-scale image segmentation is performed.The shape parameter is generally required to be less than 0.3.In this paper, the shape parameter of the four images is set to 0.2, and the color parameter is set to 0.8.In addition, a trial and error method is adopted to select an appropriate compactness parameter, Firstly, the compactness parameters of the four images are set to 0.2, 0.5, 0.7 and 0.9, respectively.The test results show that when the compactness value is 0.7, the best image object segmentation effect can be obtained.The final object segmentation results of the four images are shown in Figure 10.The potential damage factors in the deformation area are analyzed from the land use deformation monitoring map.These phenomena of cyclic changes of bare land and vegetation area caused by the rise and fall of reservoir water level show that.The fluctuation of reservoir water level has an important influence on the physical geography and engineering geological conditions of Ma'anshan slope.The area of bare land has increased greatly and a large surface fissure has appeared, which shows that the deformation area is undergoing continuous deformation.It also indirectly shows that heavy rainfall has a significant impact on landslide deformation.Because rainfall runoff and infiltration can enter the slope through bare land and cracks.
Land use change detection can indirectly reflect the inducing factors of landslide deformation.In addition, this paper also uses GPS.The factors of landslide deformation are analyzed in the correlation diagram of the time series of landslide displacement with rainfall and reservoir water level.The correlation between landslide displacement monitored by GPS from July 27, 2020 to January 18, 2025 and daily rainfall and reservoir water level is analyzed.As shown in fig.11.
Figure 11.
Correlation between GPS-monitored landslide displacement, rainfall and reservoir water level from 2020 to 2025.
Figure 11.
Correlation between GPS-monitored landslide displacement, rainfall and reservoir water level from 2020 to 2025.
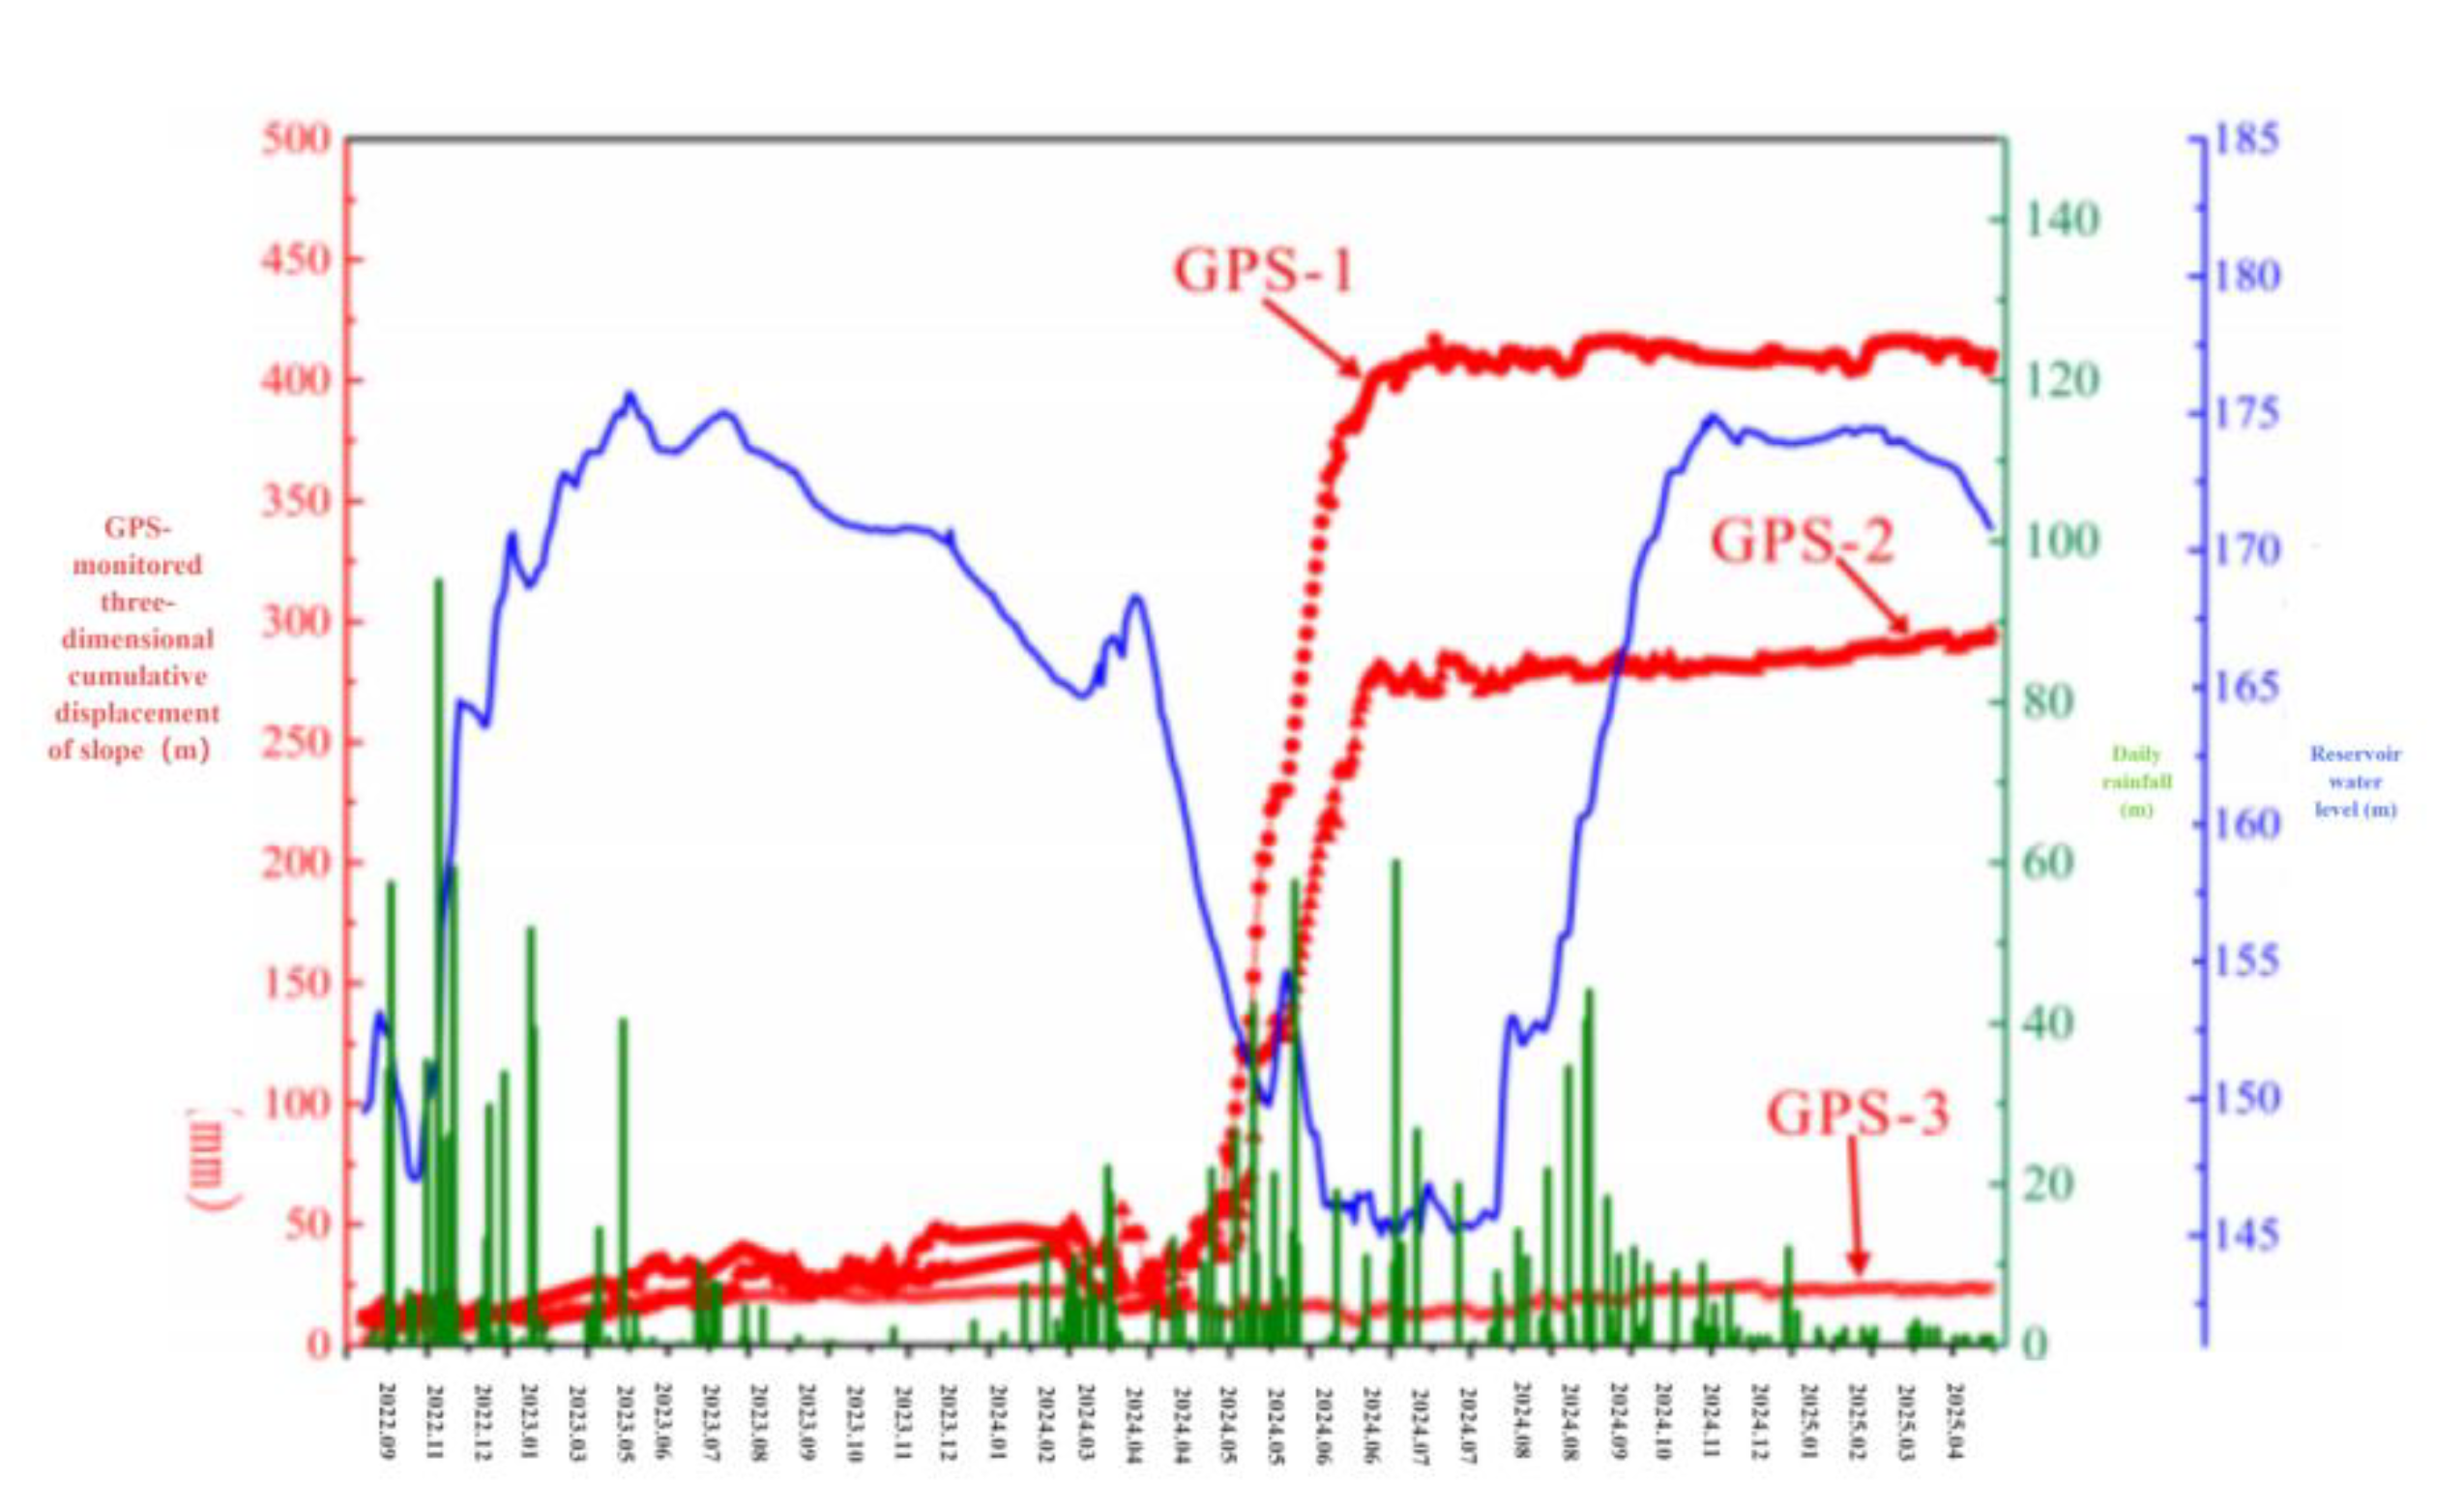
It can be seen from the figure that the leading edge and the middle part of the strong deformation zone have large deformation, while the trailing edge of the deformation zone has almost no deformation.The deformation forms of leading edge GPS-1 and middle GPS-2 are step nonlinear deformation.The surface of Ma'anshan slope has a good water storage environment.Heavy rainfall, water storage in slope ponds and domestic water for local residents will infiltrate into the slope through bare land and vegetation.The landslide has strong permeability, and the increase of groundwater level leads to the increase of seepage pressure, which reduces the stability of the landslide.The enrichment of groundwater can not only soften the material of sliding soil, reduce its shear strength and reduce the resistance to sliding of the slope, Increasing the sliding force of the slope will lead to the instability of the front deformation zone.
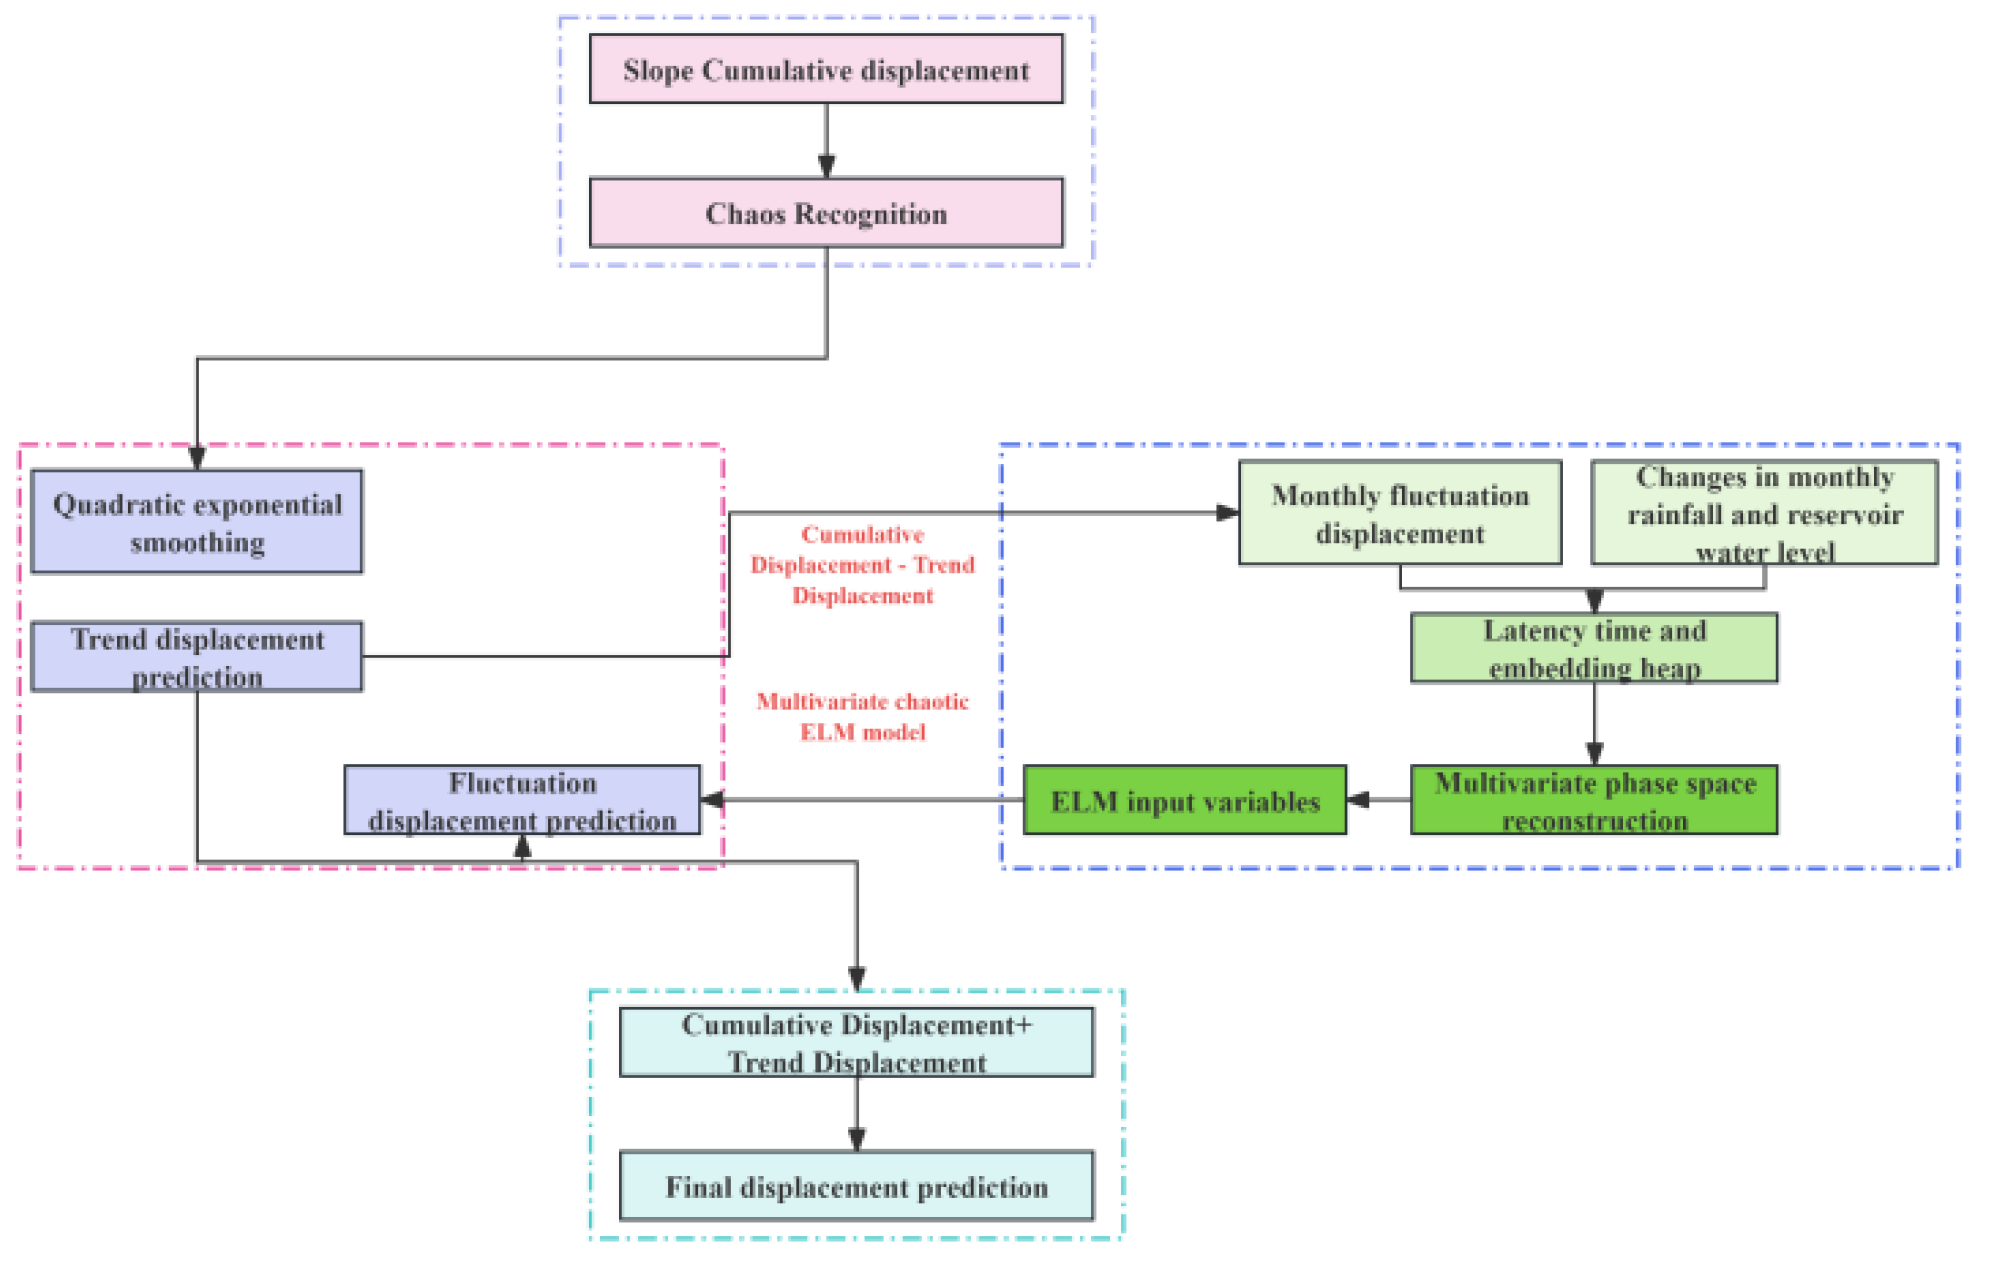
4.3. Combination Prediction Model of Slope Displacement Based on Multivariate Chaos Theory and Extreme Learning Machine(ELM)
Under the influence of induced factors such as heavy rainfall and fluctuation of reservoir water level, Its displacement time series shows the characteristics of step change and may have chaotic characteristics.However, the chaotic models commonly used for landslide displacement prediction are all based on the univariate chaotic theory.Therefore, a combined prediction model of landslide displacement based on exponential smoothing, multivariate chaotic model and extreme learning machine(ELM)is proposed.Firstly, the exponential smoothing multivariate chaotic ELM model is used to identify the chaotic characteristics of the landslide cumulative displacement series;Then the exponential smoothing method is used to predict the cumulative displacement, and the trend displacement is obtained.And subtracting the trend term displacement from the accumulated displacement to obtain the remaining fluctuation term displacement;After that, the multivariate phase space reconstruction is carried out for the three factors of the fluctuation displacement, the rainfall and the reservoir water level variation.The ELM model is used to predict the displacement of the wave term after the multivariate reconstruction;Finally, the predicted trend term is added to the fluctuation term to obtain the final cumulative displacement.The exponential smoothing multivariate chaotic model proposed in this chapter mainly includes four steps::
Identification of Chaotic Characteristics of Landslide Cumulative Displacement by Maximum Lyapunov Exponent Method;
The exponential smoothing method is used to decompose the cumulative displacement into the trend term and the fluctuation term;
And identify that displacement chaos characteristic of the fluctuation term, performing multivariate phase space reconstruction on the displacement chaos characteristic and the induce factors, Then the ELM model is used to predict the displacement of the fluctuation term;
The predicted values of the displacement of the trend term and the fluctuation term are added to obtain the predicted value of the final cumulative displacement, as shown in Figure 12:
Figure 12.
Flow chart of exponentially smoothed multivariate chaotic ELM model.
ELM model is a neural network method proposed in 2006.The training and prediction process of ELM needs to normalize the original data to[0, 1].And that ELM prediction result need to be denormalized to obtain a true prediction value.Any N different sample are provided, wherein, Then the standard single hidden layer feedforward neural network with M hidden layer neurons and the activation function G(X)can be expressed as:
Where:is the connection weight between the input layer node and the ith hidden layer node;Is the connection weight between the ith node of the hidden layer and the node of the output layer;bi is the threshold of the ith neuron of the hidden layer;WiX j is the inner product of Wi and Xj;is the network output value.A standard single hidden layer feedforward neural network with M hidden layer neurons and an activation function G(x)can zero error approximate the training samples such that:
H is the output matrix of the neural network, and the column of H is the output vector of the ith hidden neuron for the input sample.Since the randomly selected input weights and hidden layer thresholds are fixed, the network training is equivalent to solving the least squares solution of equation(2-7):
Theoretically, the minimum value of the least squares solution of the above linear system is:
Where H is the Moore-Penrose generalized inverse of the hidden layer output matrix H.
4.4. DBSCAN Algorithm
4.4.1. DBSCAN-Based Base Clusterer Generation
By generating different base clusters, we can reveal the characteristics of data sets from different levels and compensate for the shortcomings of a single cluster model.In This paper, we use DBSCAN algorithm as the basic clustering algorithm, which is sensitive to the two hyperparameters R and Td.Based on the data set of structural plane occurrence, the DBSCAN clustering algorithm is repeatedly used to calculate H times by combining different R and Td values.H base clustering results with differences are obtained.It is worth mentioning that, unlike other algorithms, DBSCAN does not need to specify the number of clusters in advance.The error caused by subjective judgment can be reduced, and the realization process is simple and convenient.
4.4.2. Selection of Base Clusters Based on Quality and Divergence
The core content of selective clustering ensemble technology is to design appropriate selection strategies.Combining base cluster quality and diversity is an effective base cluster selection strategy, which not only considers the base cluster quality, Eliminate the impact of poor base clustering, but also consider the differences between the base clustering, effectively improve the clustering effect.First, all base clusters are evaluated according to performance metrics, Select the base cluster with the best clustering effect as the reference base cluster(the clustering result is recorded as Po), and the accuracy of other base clusters is:
In the formula, Mi and Mo are the incidence matrices of Pi and P o respectively;||Mi,Mo||represents the similarity calculation of the two matrices.In this paper, the matrix is vectorized, and the vector cosine value is used to measure the similarity of two matrices.The more similar Mi and Mo are, the better the clustering quality of Pi is.Define the objective function as:
Where:(0≤ℇ≤1)is the balance factor, generally taken as 0.5.
4.4.3. Consistency Integration Based on Co-Coordination Matrix
Effective fusion-based cluster is that key to improve the performance of clustering ensemble.Cluster ensemble methods include those based on co-association,
Matrix methods, graph-based methods, feature-based methods, etc[38].Clustering ensemble algorithm based on co-coordination matrix is the most common and effective method.The cluster label corresponding problem of the base clustering result can be solved.The basic idea is to fuse the results of the H basis clusterers through a co-comatrix, then the clustering ensemble result is obtained by using the agglomerative hierarchical clustering algorithm, Define the co-coordination matrix CA:
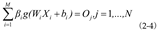
And then cluster that co-association matrix by adopting an agglomerative hierarchical cluster algorithm, The agglomerative hierarchical clustering algorithm adopts the bottom-up clustering idea.Firstly, each sample in the data set is regarded as a separate cluster, and the similarity is determined by calculating the distance between the two clusters.The smaller the distance, the higher the similarity.The two most similar clusters are then combined step by step and iterated until the termination condition is reached or the cluster is finally classified as one cluster, as shown in Figure 13.According to the specific conditions of different grouping numbers obtained from the clustering tree, the clustering tree is divided into 6 clusters, namely, each sample is divided into 1 cluster, and the clustering tree is divided into 3 clusters, namely AB, CDE and F.One cluster is ABCDEF.
Figure 13.
Illustration of agglomerative hierarchical clustering.
4.4.4. Grouping Method of Preferred Structural Plane of Rock Mass
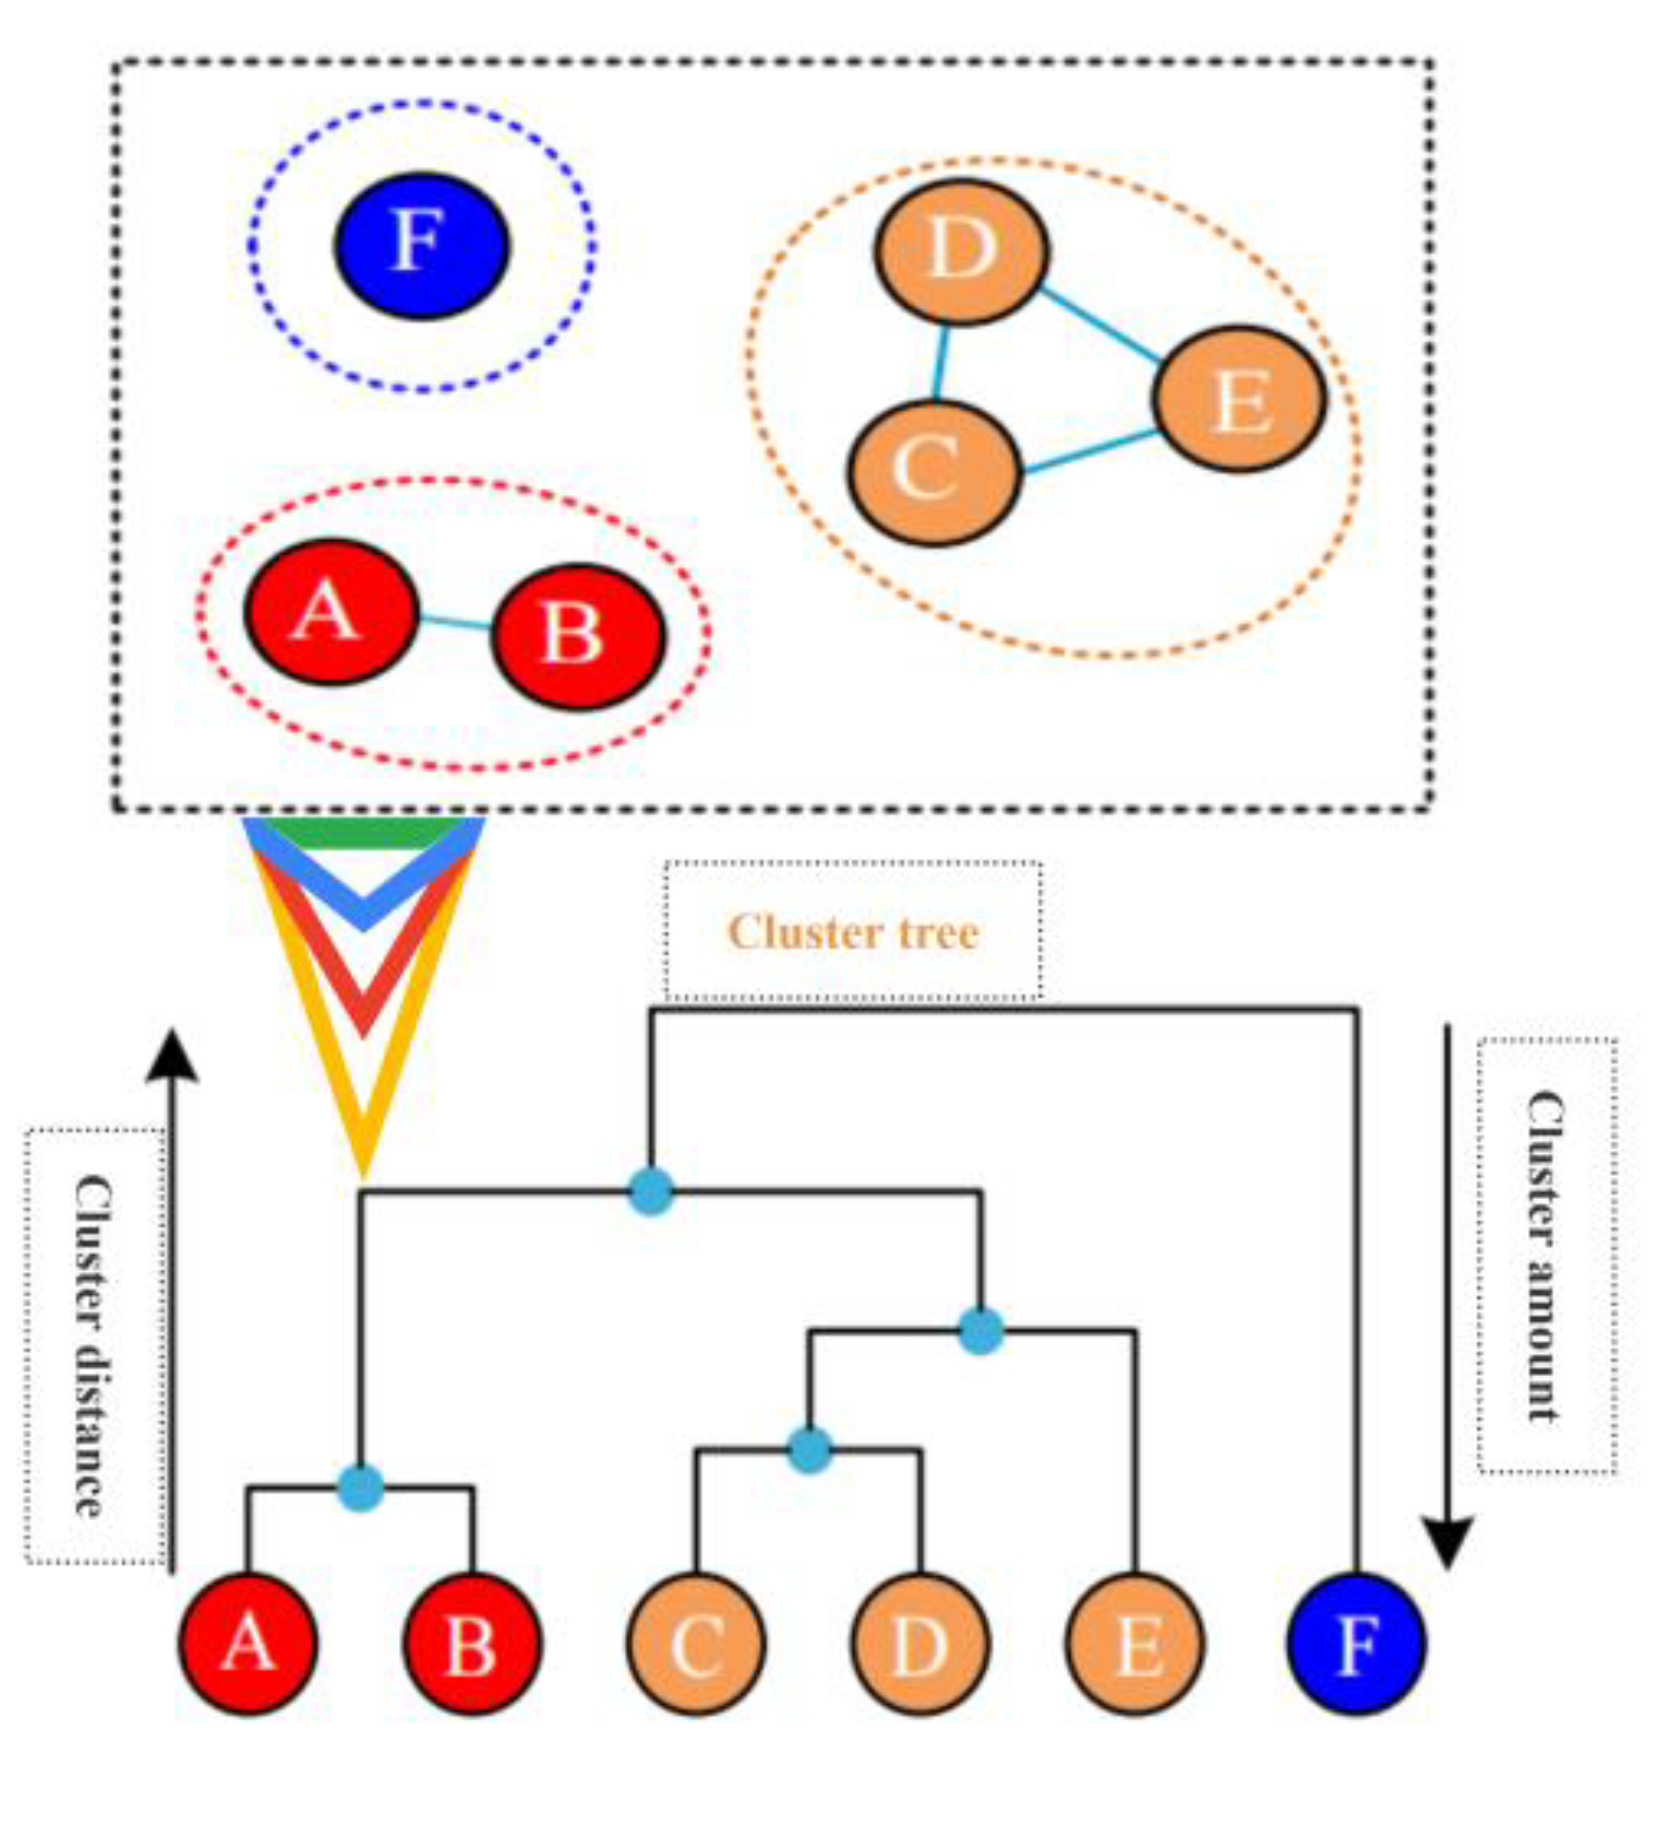
The flow of the preferred structural plane grouping method of rock mass based on DBSCAN selective clustering integration is shown in Fig.14, and the specific steps are as follows:
Input:structural plane occurrence data set XN×2, algorithm hyperparameters R and Td, calculating a distance matrix DN*N between every two structural surfaces in a data set;
Combine that hyperparameters R and Td of the algorithm, repeatedly operate the DBSCAN algorithm for H times, and obtaining H base clusters and result P={P1, P2.PH};
Analyze the clustering effect of each base clustering device, and selecting the base clustering device with the best clustering effect as a reference base clustering device;
Calculate the accuracy and the difference degree of the residual base clustering device and an objective function;Sorting the residual base clusterers in descending order according to the size of OF(Pi), Cohesive hierarchical clustering is adopted to perform consistency integration one by one;
Determine the number H of the integrated base clusterings and the optimal grouping number K according to the clustering effect, and removing noise points and isolated value groups;Output:final grouping result of dominant occurrence of structural plane.
Figure 14.
DBSCAN selective clustering ensemble process.
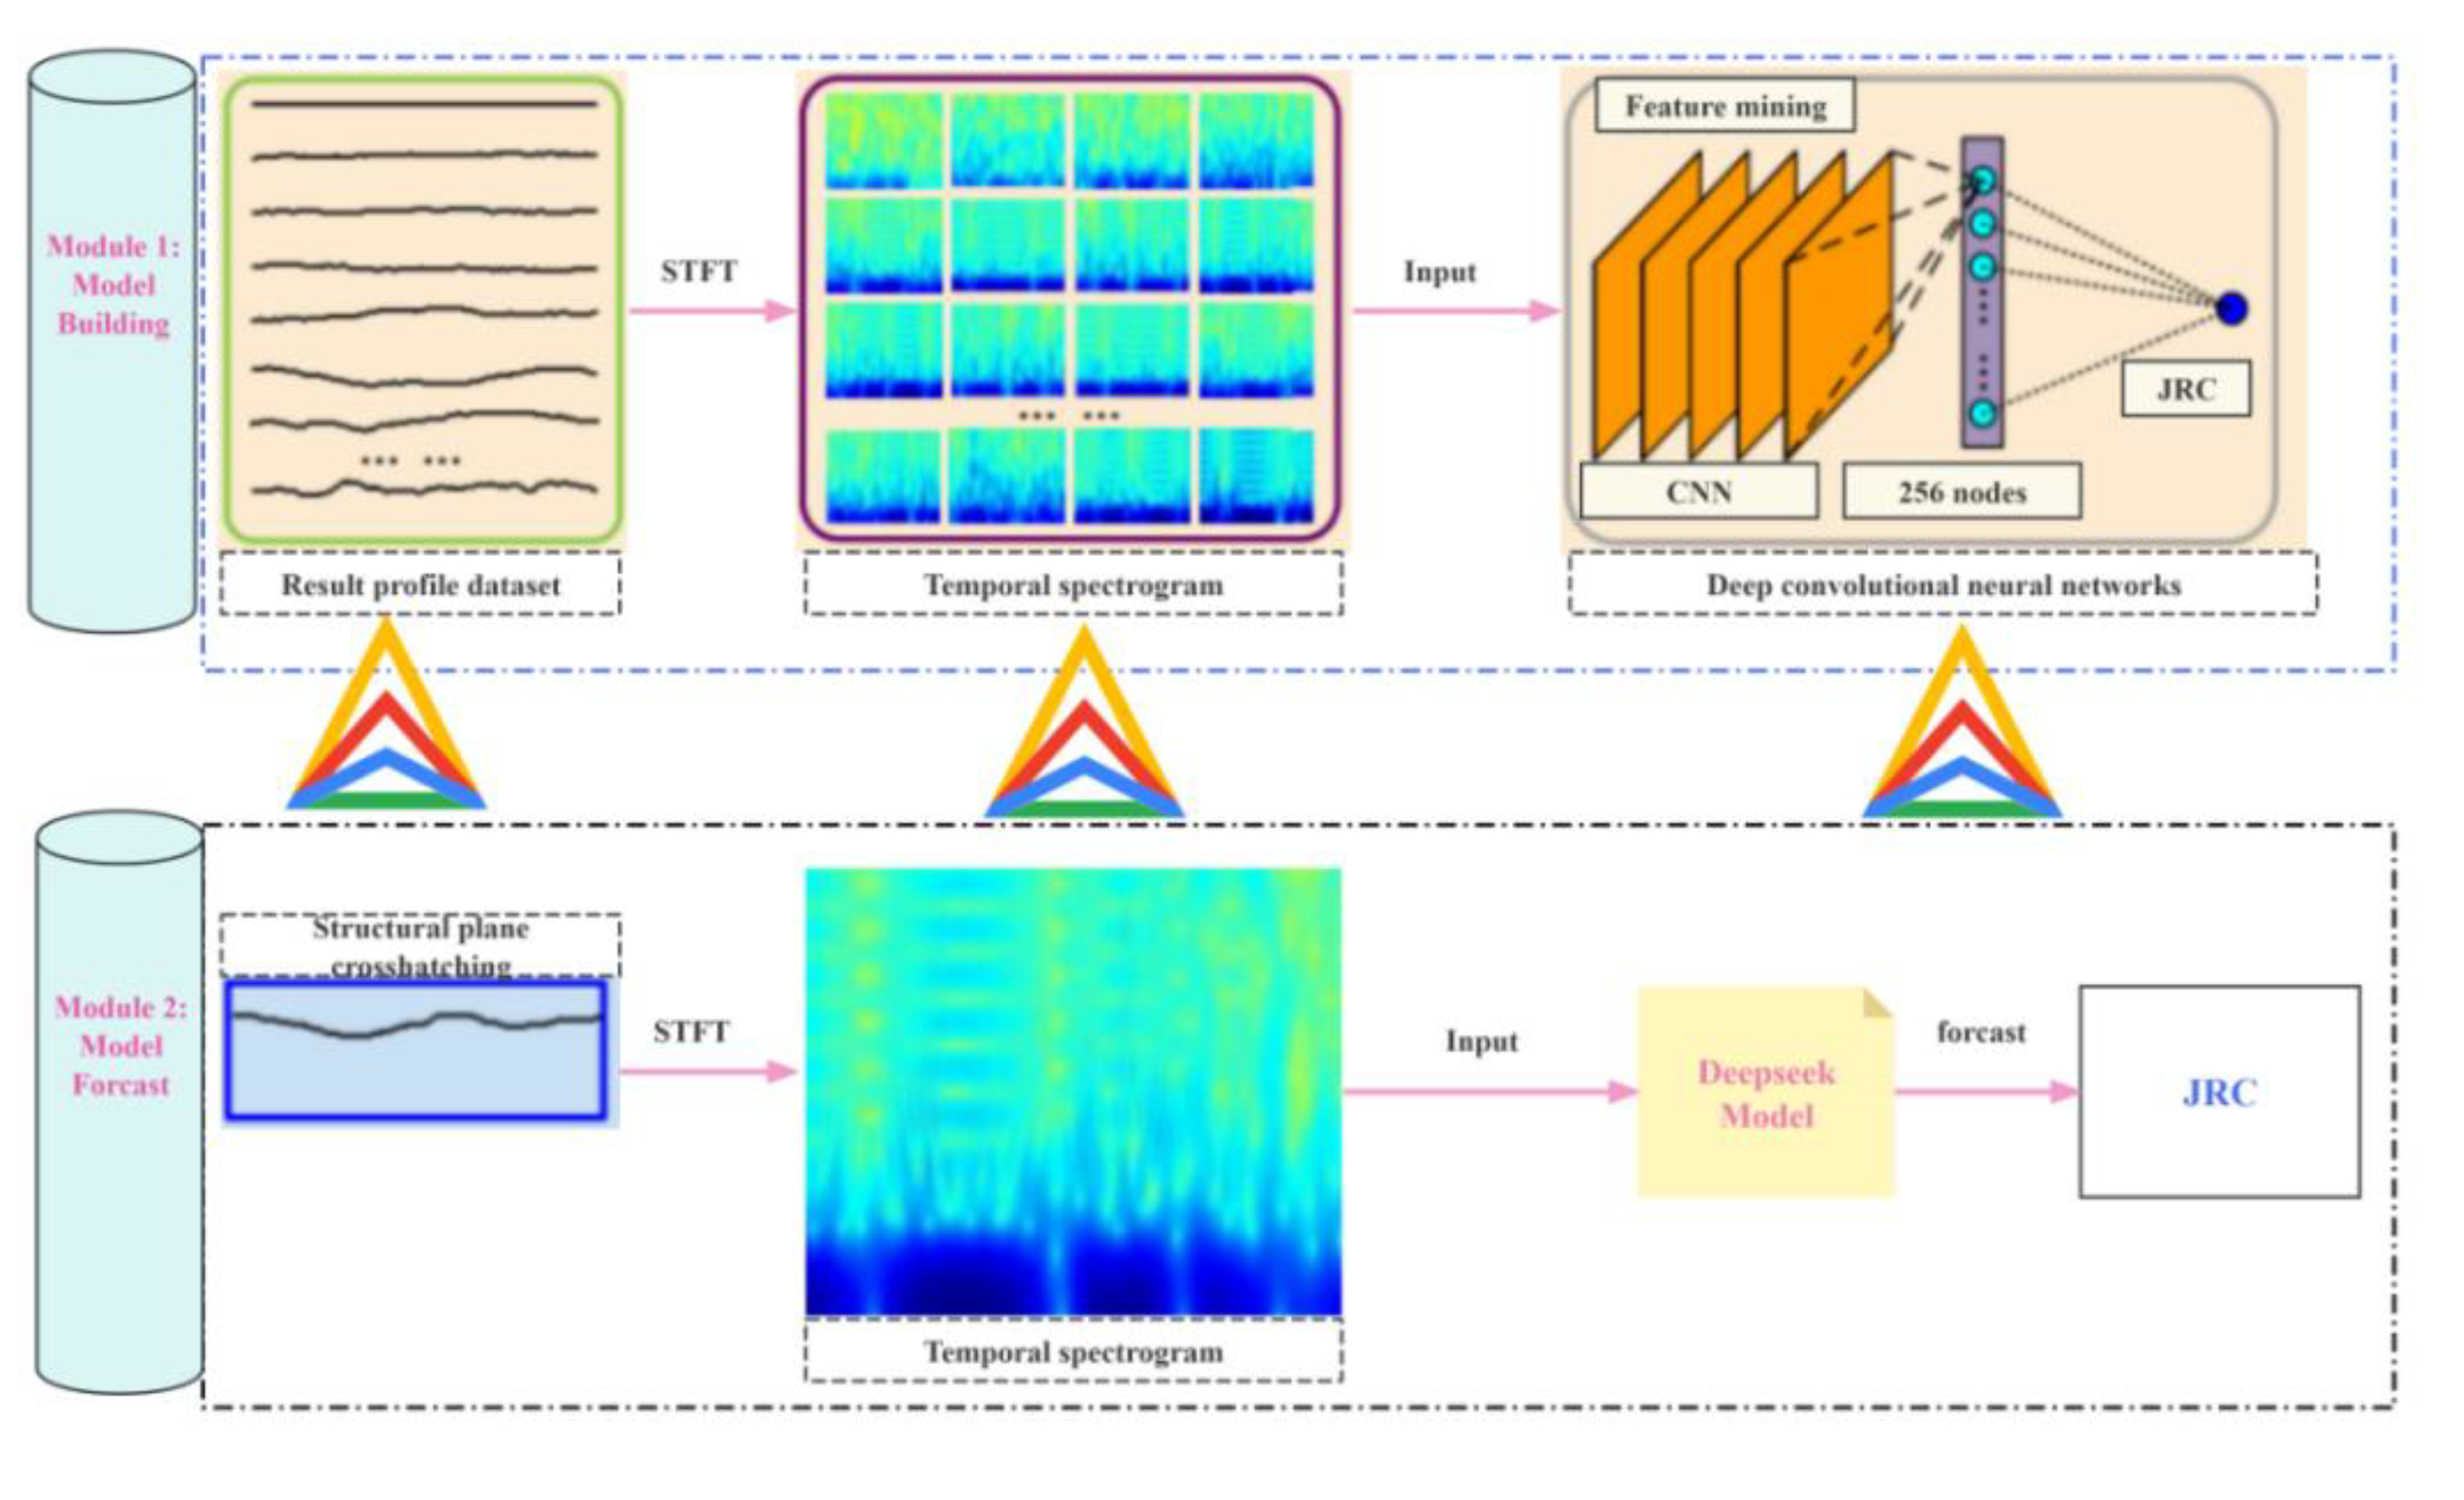
4.5. Time-Frequency Spectrogram on Deep Learning
In this study, the difficult and tedious work of extracting the surface morphological features of the structural plane is abandoned, and the profile line of the structural plane is regarded as a time sequence signal.And is convert into a time-frequency spectrogram to be visually represented, that fluctuation degree and the position information of the section line are comprehensively describe, The deep convolutional neural network is introduced to extract and learn features automatically.A method for determining JRC of rock discontinuity roughness based on deep learning of time-frequency spectrogram is proposed.It opens a new mode of JRC recognition from experience-driven artificial feature paradigm to data-driven self-learning paradigm.It effectively makes up for the shortcomings of visual analogy method and artificial feature parameter analysis method.
4.5.1. Convolutional Neural Network Deep Learning
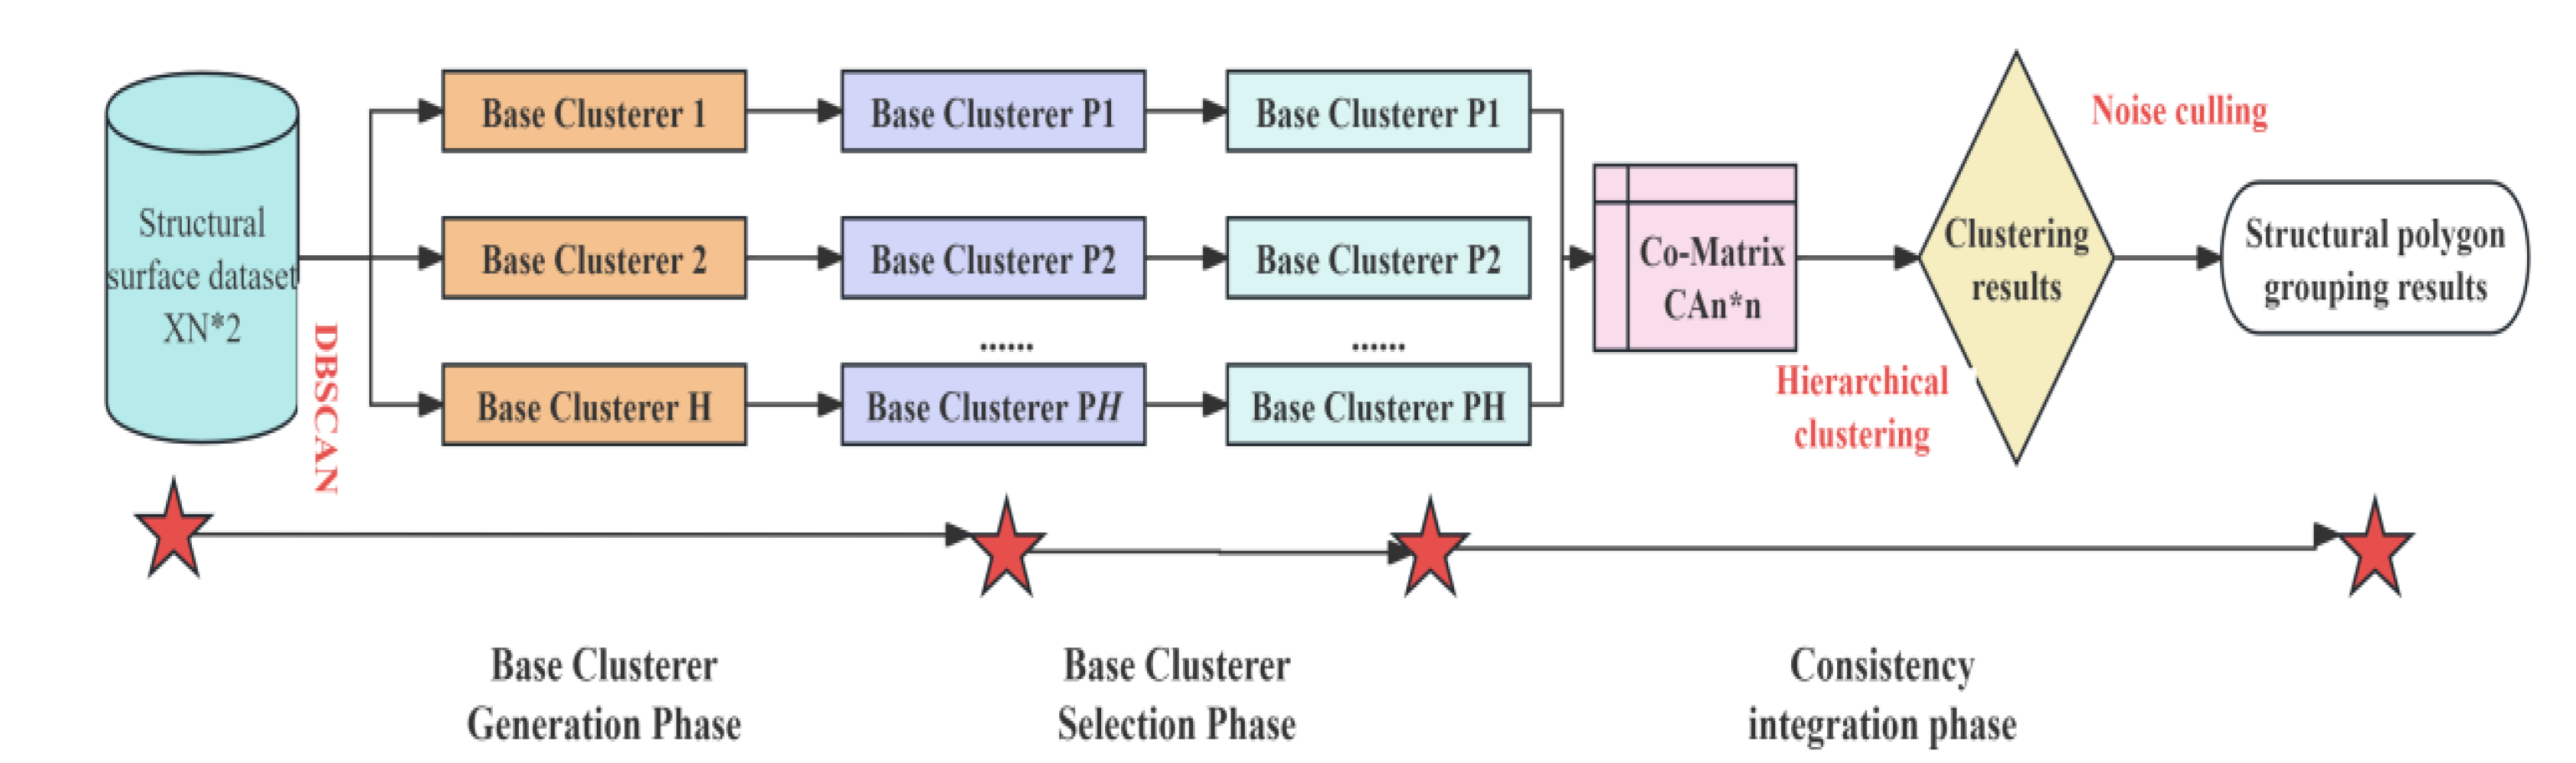
After obtaining the time-frequency spectrogram of the structural plane profile, it is necessary to establish a complex nonlinear prediction model of the time-frequency spectrogram and JRC.Deep learning is the most powerful statistical analysis method today.Convolutional neural network(CNN)is a biophysical model inspired by the information transmission of the visual cortex system of the brain.It is an important branch of in-depth learning and performs well in the fields of image processing and recognition, target location and detection.It is the best choice for automatic extraction of time-frequency spectrogram features, as shown in Figure 15:
Figure 15.
Spectrum and time-frequency spectrogram of profile of 10 standard discontinuities.(a)JRC=0.4;(b)JRC=2.8;(c)JRC=5.8;(d)JRC=6.7;(e)JRC=9.5;(f)JRC=10.8;(g)JRC=12.8;(h)JRC=14.5;(i)JRC=16.7;(j)JRC=18.7.
Figure 15.
Spectrum and time-frequency spectrogram of profile of 10 standard discontinuities.(a)JRC=0.4;(b)JRC=2.8;(c)JRC=5.8;(d)JRC=6.7;(e)JRC=9.5;(f)JRC=10.8;(g)JRC=12.8;(h)JRC=14.5;(i)JRC=16.7;(j)JRC=18.7.
The CNN directly excavates the deep abstract characteristic information from the time-frequency spectrogram, Pattern learning is carried out according to the energy size and distribution characteristics of the time-frequency spectrogram, The automatic recognition of JRC value of section line of structural surface is realized.However, it takes a lot of time and computing power to train a suitable network structure.Transfer learning with existing network models is an effective way to save time and achieve better performance[42].VGG16 is a classic convolutional neural network model with a simple network structure.It has excellent and unique performance advantages for small datasets[46].In order to extract the features of time-frequency spectrogram and meet the JRC regression task, this paper fine-tunes the VGG16 network to achieve transfer learning.The network structure is shown in Figure 16
Figure 16.
Deep convolution neural network structure.
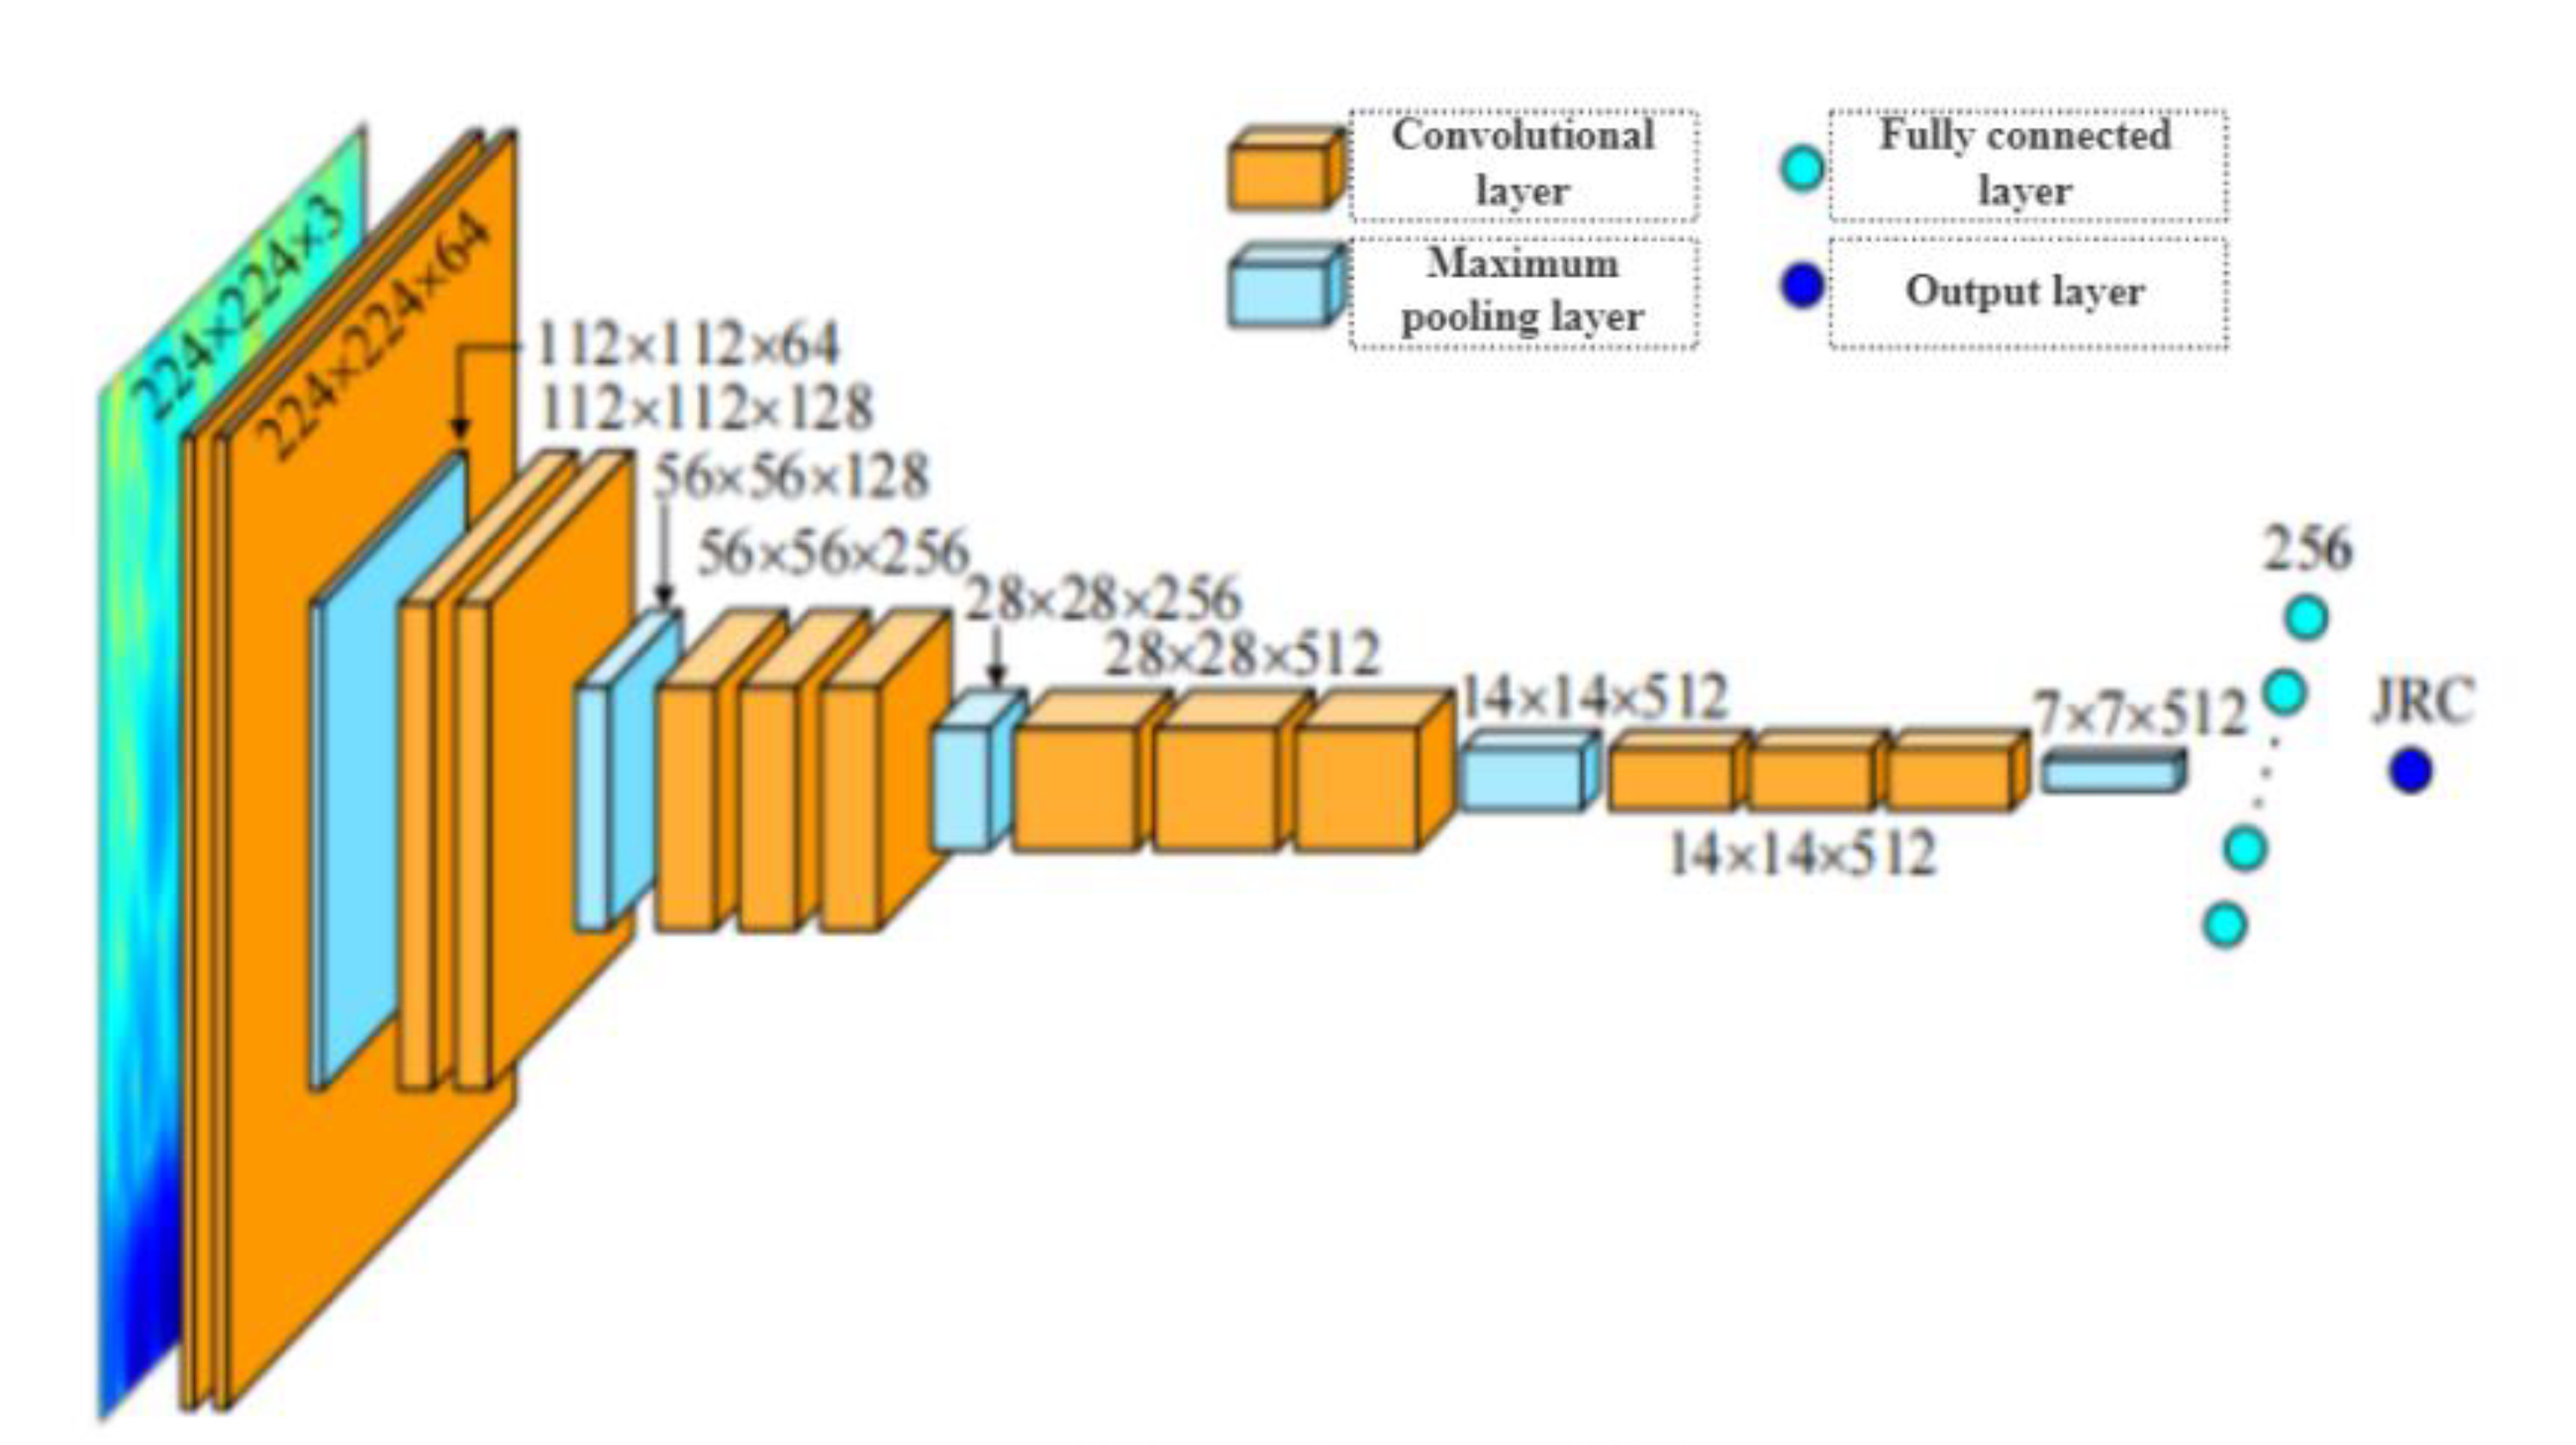
The time-frequency spectrogram is used as the input of the deep learning network to obtain the feature results automatically extracted by the convolutional neural network, as shown in Table 5-1.Because the features extracted by different convolution kernels are different, 64 feature maps will be generated after the first convolution(the second layer);After the fifth pooling(layer 19), 512 feature maps will be generated.The overall feature map can be obtained by fusing the feature maps of each layer according to the ratio of 1:1.By repeatedly superimposing the convolution layer and the pooling layer, CNN gradually changes the low-level features into high-level features.The deeper the layer number is, the more comprehensive and representative the extracted feature information is.And the nonlinear characteristics in the section line of the structural surface are more fully expressed.

Table 2.
Feature extraction results of two JRC time-frequency spectrogram.
| JRC=0.4 | JRC=18.7 | |||
| 2nd floor | 19th floor | 2nd floor | 19th floor | |
| Feature map | 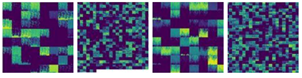 |
|||
| Diagram of the overall characteristics |  |
|||
4.5.2. Determination Method of Roughness of Rock Structural Plane
The time-frequency spectrogram is used as the visual representation of the profile line characteristics of the structural surface, and the time-frequency spectrogram and JRC are used as the input and label data respectively.Combining with the deep learning technology of convolutional neural network, it automatically extracts and learns the surface morphological characteristics of the structural surface from the data.A method for determining the roughness of rock discontinuity based on deep learning of time-frequency spectrogram is proposed, and the overall process framework is shown in Figure 17.Specifically, it is divided into four steps:
(1)acquire a section line sample of a historical structural surface, constructing a data set correspond to that section line and JRC, Carry out preprocessing such as match sampling rate, removing trend and that like;
(2)regarding the section line as a time sequence signal, performing short-time Fourier transform to generate a time-frequency spectrogram, Acquiring the energy distribution of the section line in the time domain and the frequency domain, and compressing the energy distribution to the required size of deep learning;
(3)building a structure based on the convolutional neural network by taking the time-frequency spectrogram and the JRC as input and label data;A surface roughness coefficient deep learning regression model is used for completing automatic feature extraction and training;
(4)generating a time-frequency spectrogram through pretreatment and short-time Fourier transform according to the structural surface profile line acquired on site, It is input into the preloaded deep learning prediction model to quickly determine the roughness coefficient of the structural Surface.
Figure 17.
Flowchart of determination method of rock discontinuities roughness coefficient.
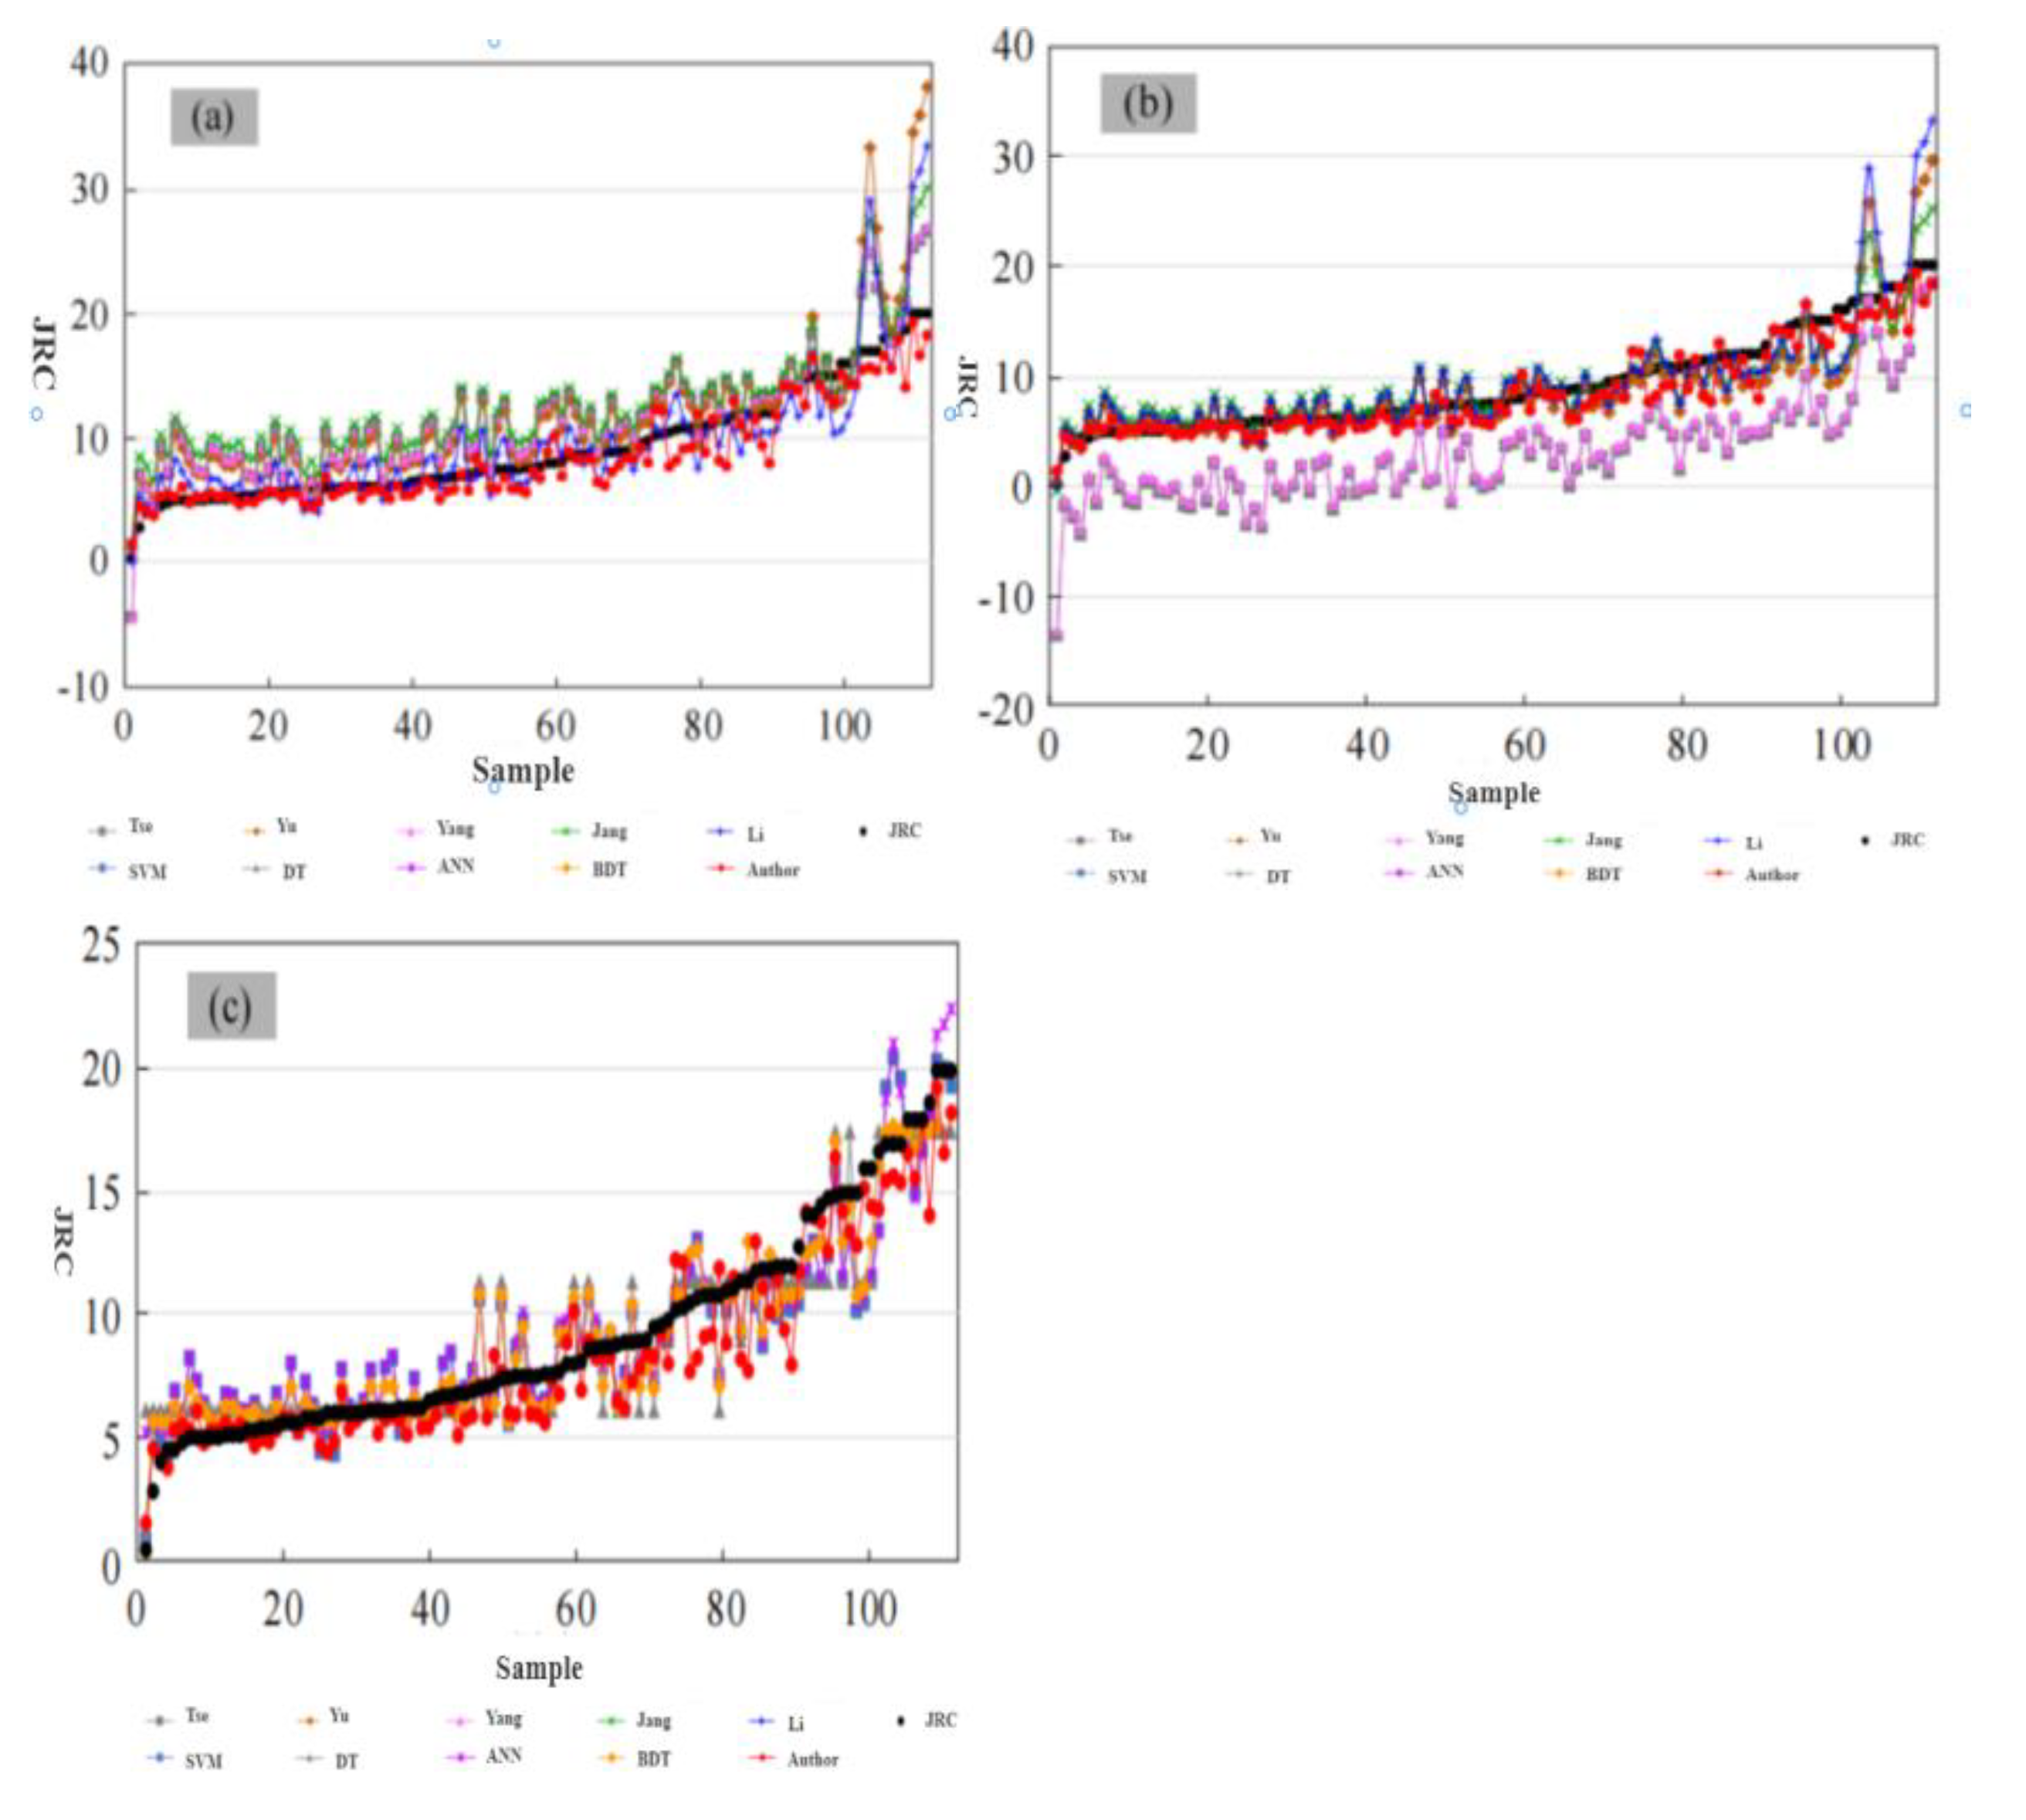
The JRC prediction results of the empirical model, the machine learning model, and the time-frequency spectrogram deep learning model in this paper on the data set are shown in Figure 18.Because that horizontal flip data expansion method is adopted in the invention, Therefore, the JRC value of deep learning prediction is defined as the average value of the prediction results of the two samples before and after the reversal.Compared with the empirical model, the predicted JRC based on the machine learning model is obviously closer to the measured value than empirical model.Machine learning model can deal with nonlinear data flexibly and efficiently, and has stronger generalization ability than empirical formula.Comparing the empirical model with the machine learning model, the JRC prediction results based on the deep learning model of time-frequency spectrogram are the closest to the measured values on the whole.There is no abnormal result with large deviation.
Figure 18.
Prediction results of model(a)empirical models based on Z2;(b)empirical models based on SF;(c)machine learning models.
Figure 18.
Prediction results of model(a)empirical models based on Z2;(b)empirical models based on SF;(c)machine learning models.
5. Example Analysis
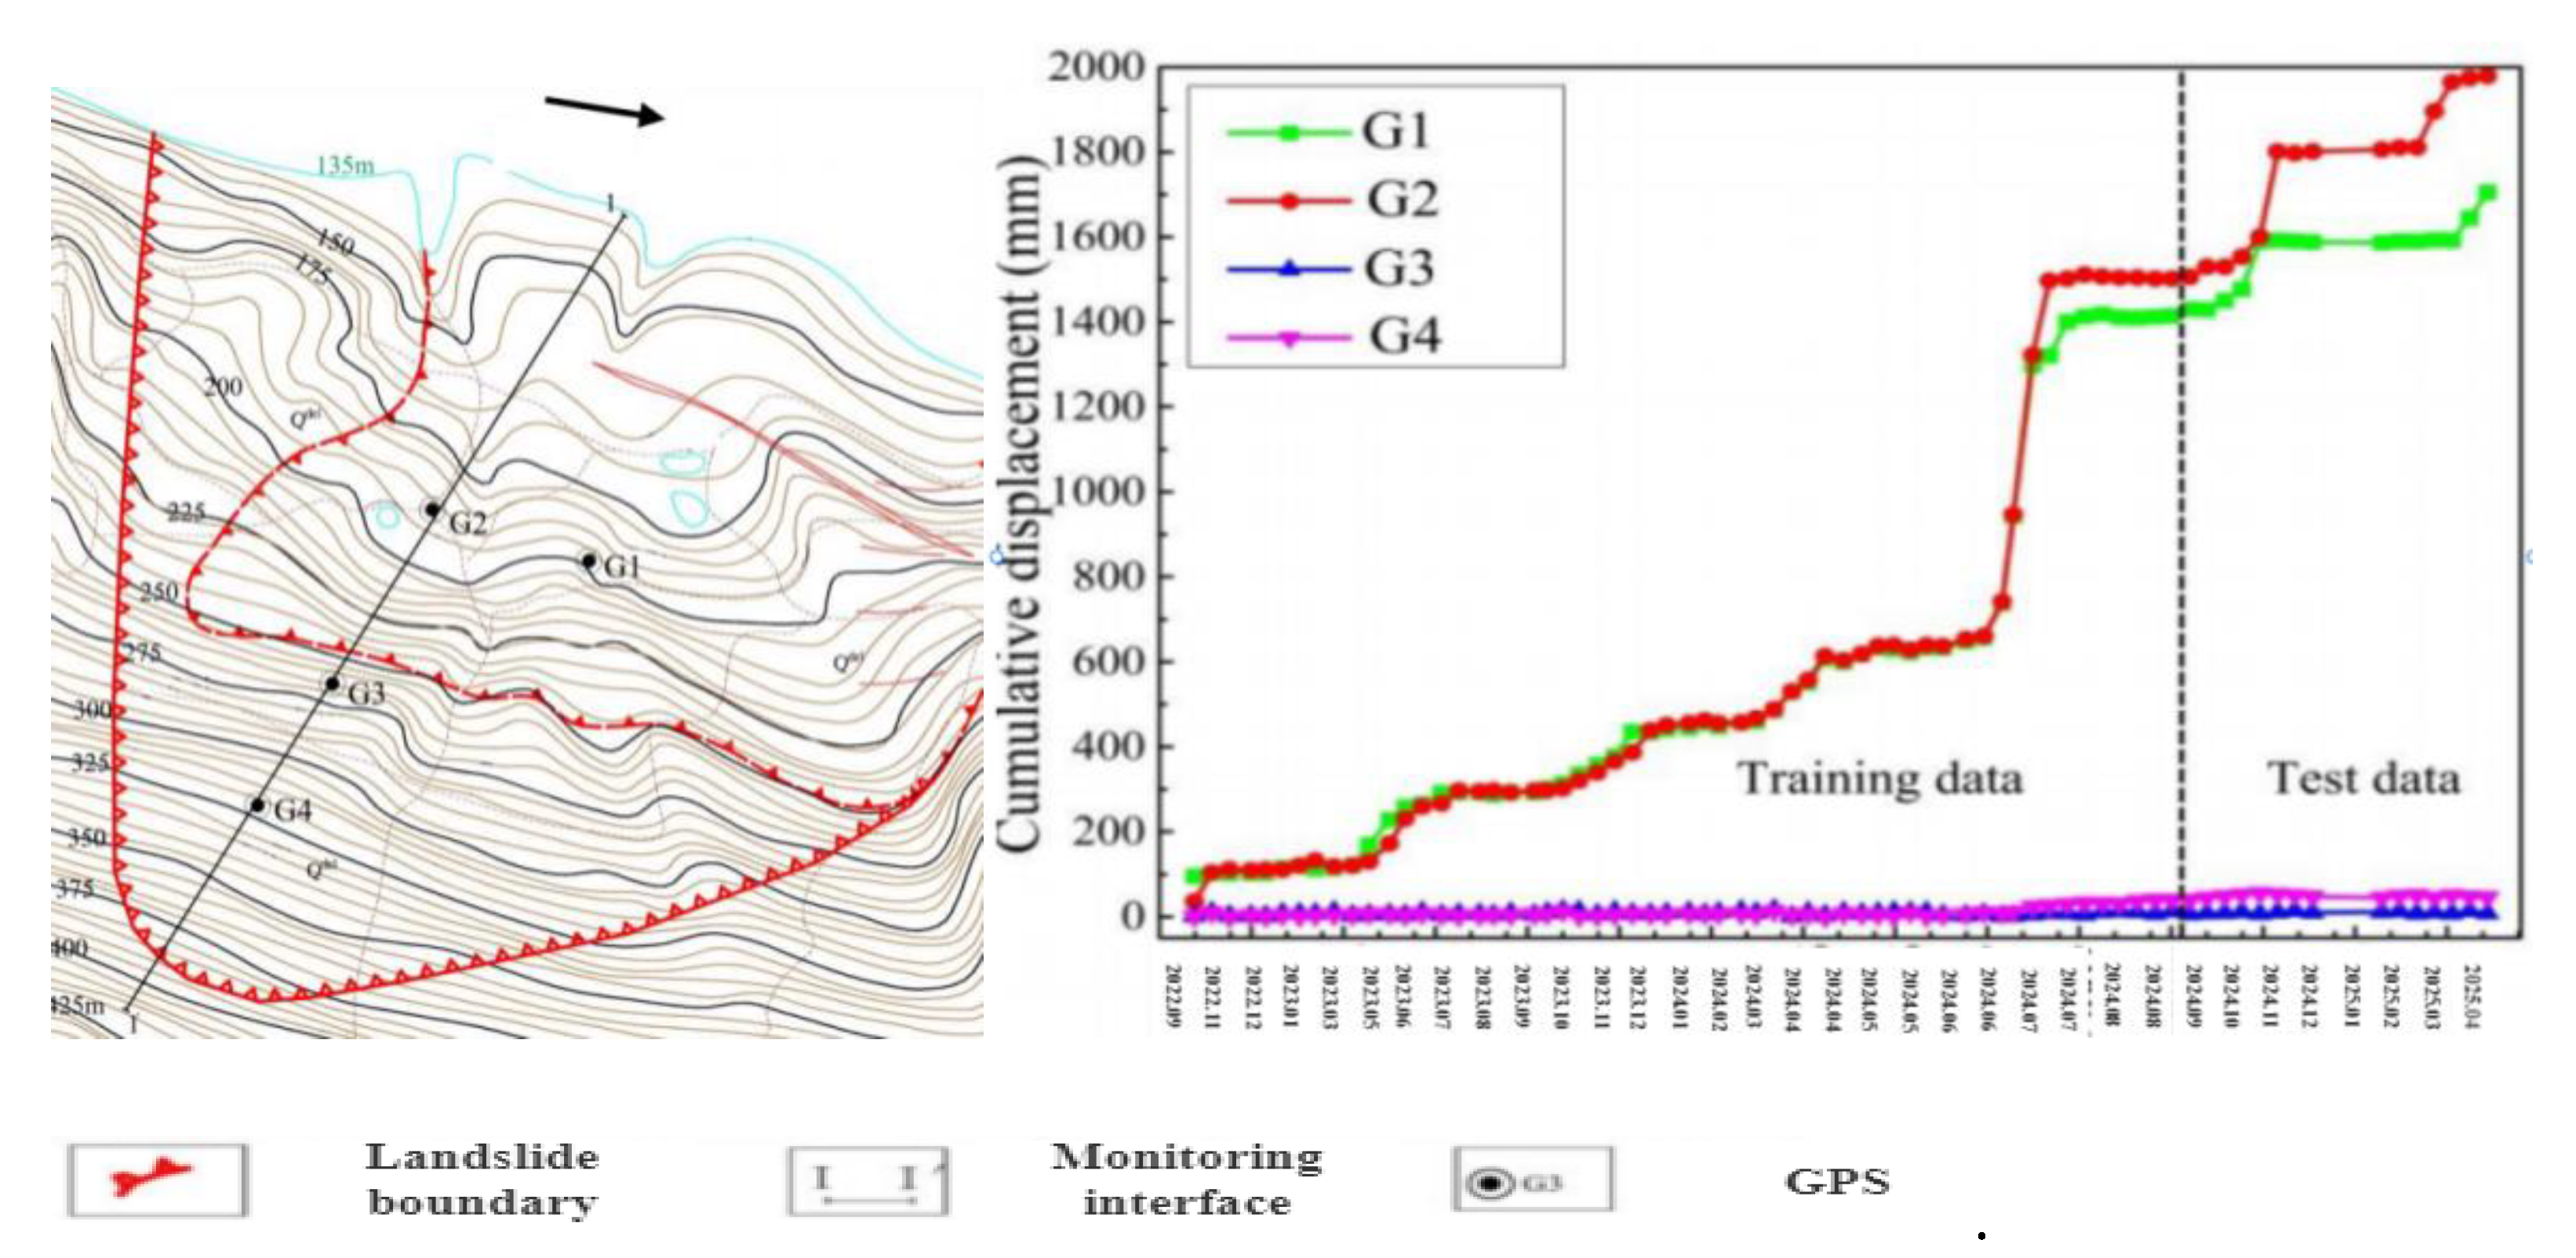
Ma'anshan slope is located in Sankeng Town, Qingyuan City, and is distributed in a ladder shape.The front edge elevation of the landslide is about 70 m, the rear edge elevation is about 390 m, the longitudinal length from north to south is about 780 m, the width from east to west is about 700 m, and the average thickness of the landslide is about 30 m.The total volume is about 1260×104 m3.The slope is mainly composed of Quaternary residual soil and accumulated soil.The lithology of the formation is Jurassic medium and thick bedded sandstone with thin bedded mudstone, and the attitude of the formation is 15°∠36°.Since June 2020, GPS and rain gauge have been used to monitor the cumulative surface displacement and rainfall of the landslide.Landslide plane and monitoring point layout are shown in Figure 4-2.The monitoring value of the cumulative displacement of the landslide from June 2020 to August 2024 is shown in Figure 19.The cumulative displacement series of the landslide shows the nonlinear variation characteristics of step type.In this paper, the GPS monitoring displacement value of G2 point is taken as an example, and 50 values from November 2020 to December 2024 are used for model training.The remaining 20 values from January 2023 to August 2024 are used for model testing.
Figure 19.
Ma'anshan slope plan and monitoring point layout.
5.1. Chaotic Identification of Cumulative Displacement
The maximum Lyapunov exponent is used to identify the chaotic characteristics of the cumulative displacement, and the delay time is selected as 1;The FNN method is used to calculate the embedding dimension of the cumulative displacement, and the threshold value is selected as 10.When the false nearest neighbor rate of the cumulative displacement is less than 5%for the first time with the increase of the embedding dimension, the embedding dimension at this time is considered to be the optimal embedding dimension.It can be seen from Fig20 that the optimal embedding dimension of the cumulative displacement is m=2, and the reconstructed phase space is:
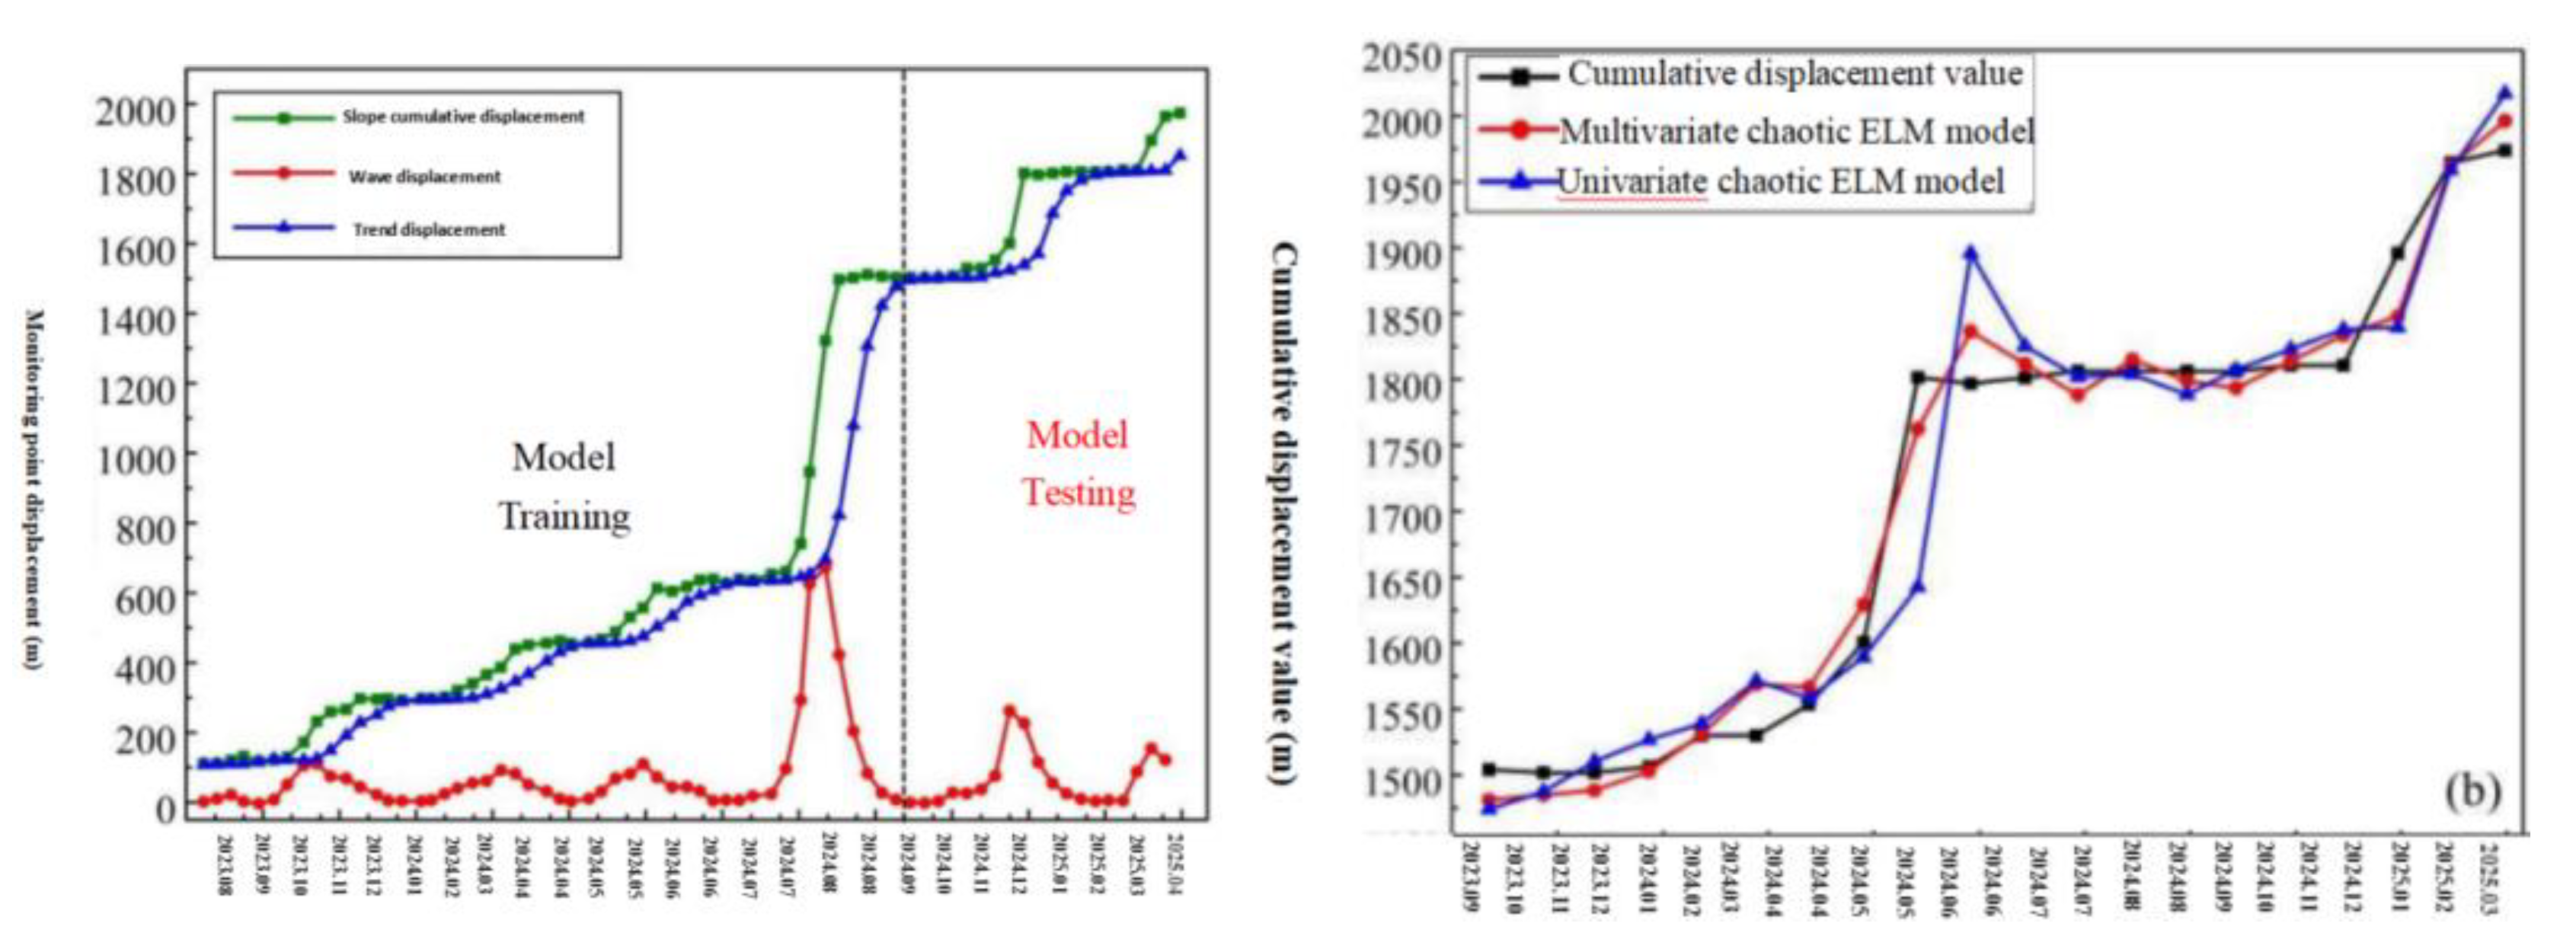
Then calculate the maximum Lyapunov exponent of the cumulative displacement with the small data method, as shown in Figure 4-4.B:the abscissa represents the discrete time step, and the ordinate represents the average discrete distance of two neighboring points after the discrete time step;The red regression line is the least squares linear regression of the R=2, 3, 8 curve.The slope of the regression line is the largest Lyapunov exponent of the displacement time series.It can be seen from the figure that the maximum Lyapunov exponent value of the calculated cumulative displacement is 0.0638, It is proved that the cumulative displacement series of G2 monitoring points has chaotic characteristics.The quadratic exponential smoothing method first assigns C1 to T1 according to Formula(4-1), and then predicts the cumulative displacement according to Formula(18).The predicted value is the displacement of the trend item.Finally, the displacement of the monthly fluctuation item is obtained by subtracting the displacement of the trend item from the cumulative displacement according to Formula(4-2).The cumulative displacement time series decomposition results are shown in Figure 20:
For the predicted values of the displacement of the fluctuation term of different models, Two indicators, root mean square error(RMSE)and fitting coefficient(R2), were used to evaluate the prediction accuracy of the model:
Figure 20.
Comparison of the prediction results of the final cumulative displacement of landslides(quadratic exponential smoothing method).
Figure 20.
Comparison of the prediction results of the final cumulative displacement of landslides(quadratic exponential smoothing method).
5.2. Numerical Simulation Verification of DBSCAN
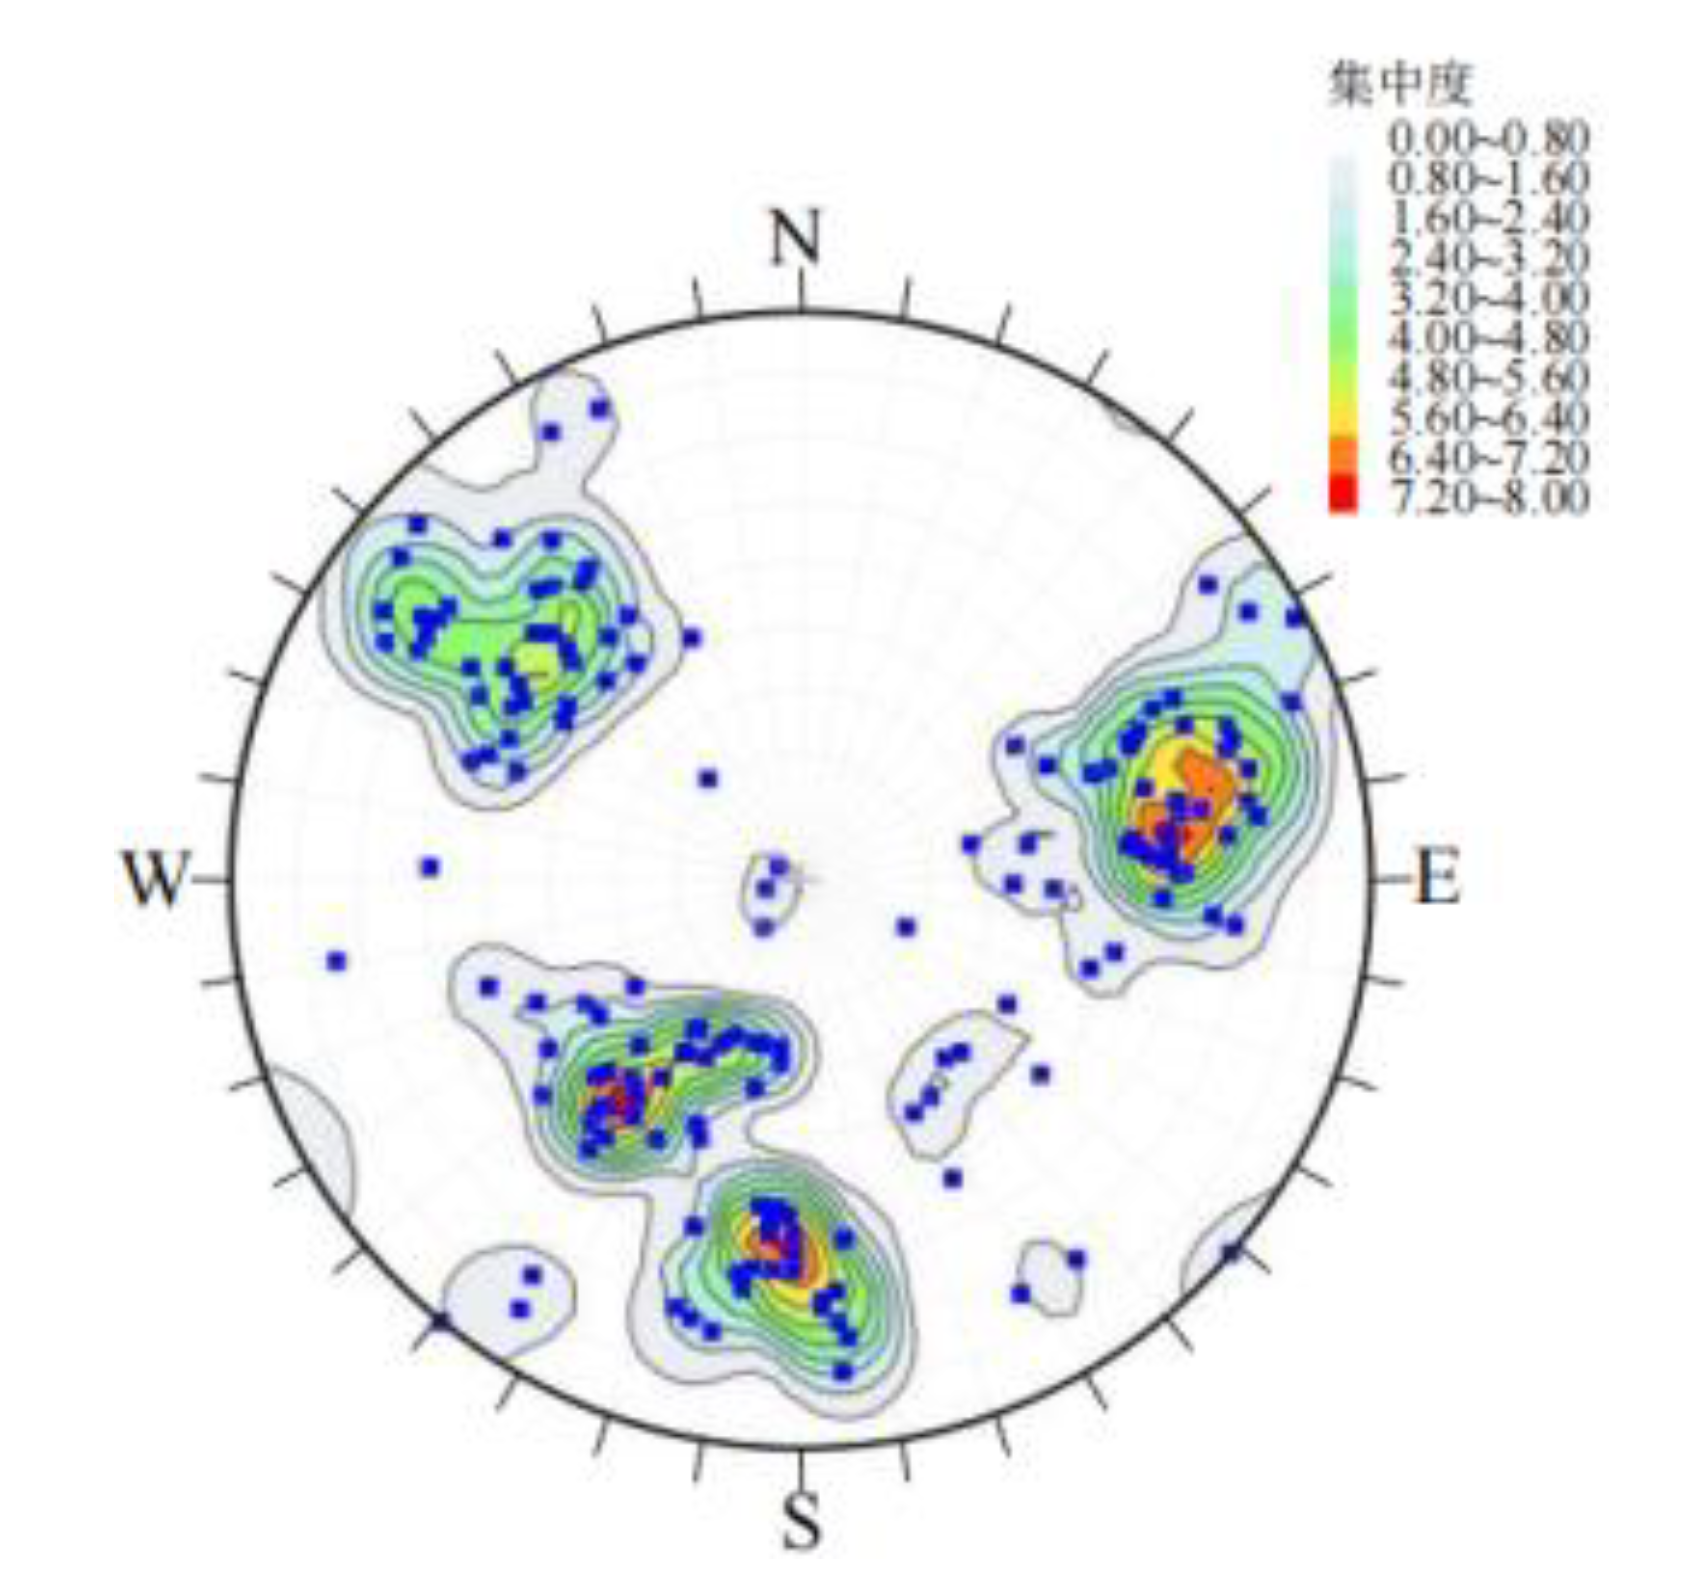
In order to verify the feasibility and effectiveness of DBSCAN and selective clustering ensemble algorithm in the grouping of rock mass preferred discontinuities.The attitude data of structural planes(195 structural planes)in the Exampmin.Dips"file of Dips software are used as the test data set.The structural plane pole isopycnic map prepared by Dips is shown in Figure 21.In this section, the following two aspects are mainly studied based on the test data:
①Confirmatory test, based on DBSCAN clustering algorithm.Comparison of the performance of single optimal base cluster, all cluster ensemble model and selective cluster ensemble model in the grouping of dominant occurrences of structural planesIt can verify the feasibility and effectiveness of selective clustering ensemble technology;
②Comparative test, The performance differences between the DBSCAN-based selective clustering ensemble method and the common clustering algorithms for structural planes are compared.The reliability and superiority of the method are tested.
Figure 21.
Isodensity contour of the poles of discontinuity.
Calculating the value OF(Pi)of the objective function OF(Pi)of the residual basis clustering device, and arranging the value OF(Pi)in descending order according to the size, The reference base clusterings are added one by one and fused to form a clustering integration model corresponding to the number of different base clusterings, The profile coefficients obtained by setting different grouping numbers K in the hierarchical clustering process are shown in fig.22.It can be seen that with the increase of the number of base clusters involved in the fusion, the contour coefficient curve generally shows an upward trend.It shows that the clustering ensemble technology can improve the clustering effect to a certain extent;Except for K=6, the clustering effect of selective cluster ensemble is better than that of all ensemble base cluster;When the number of groups K=5, the clustering effect is significantly better than other groups, indicating that the data set should be divided into five groups.
Figure 22.
Clustering effect of the base clusters number on selective ensemble model.
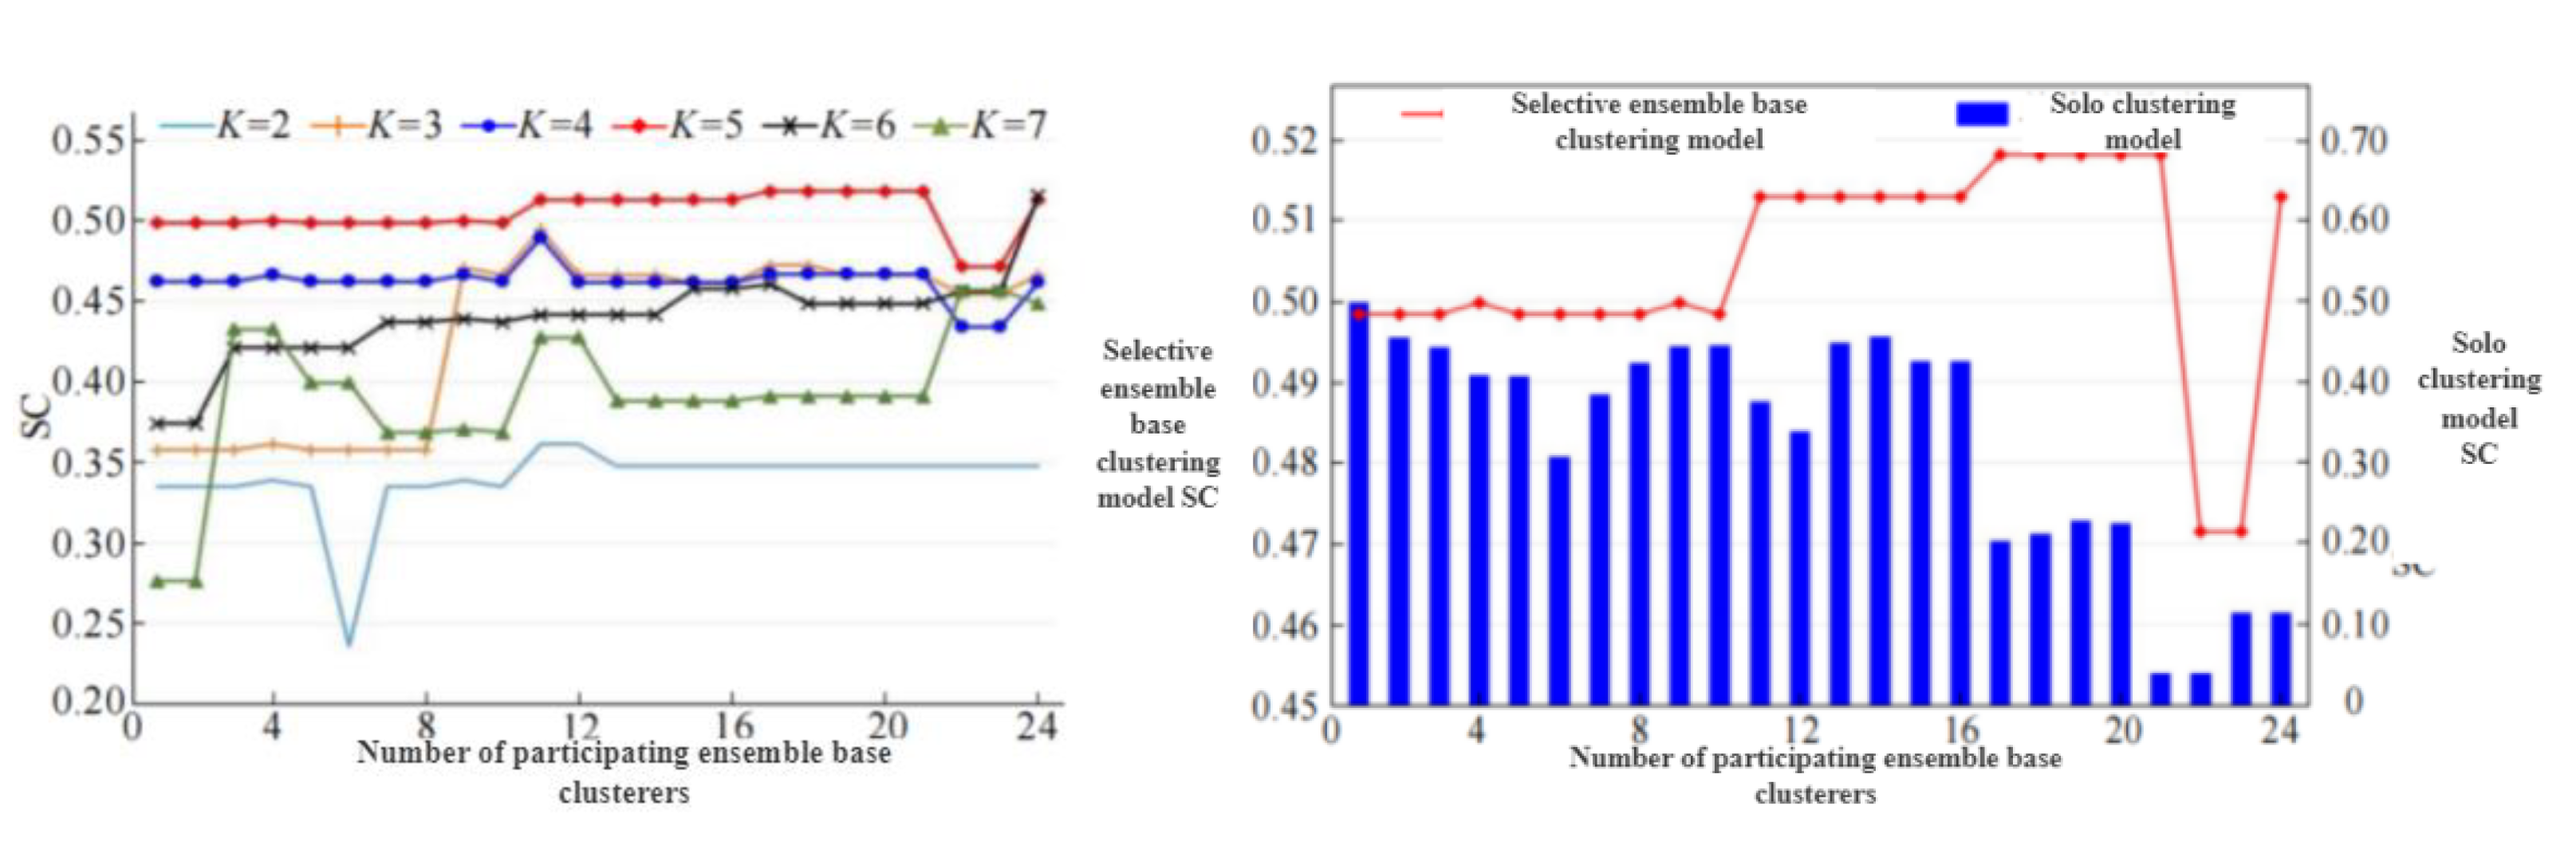
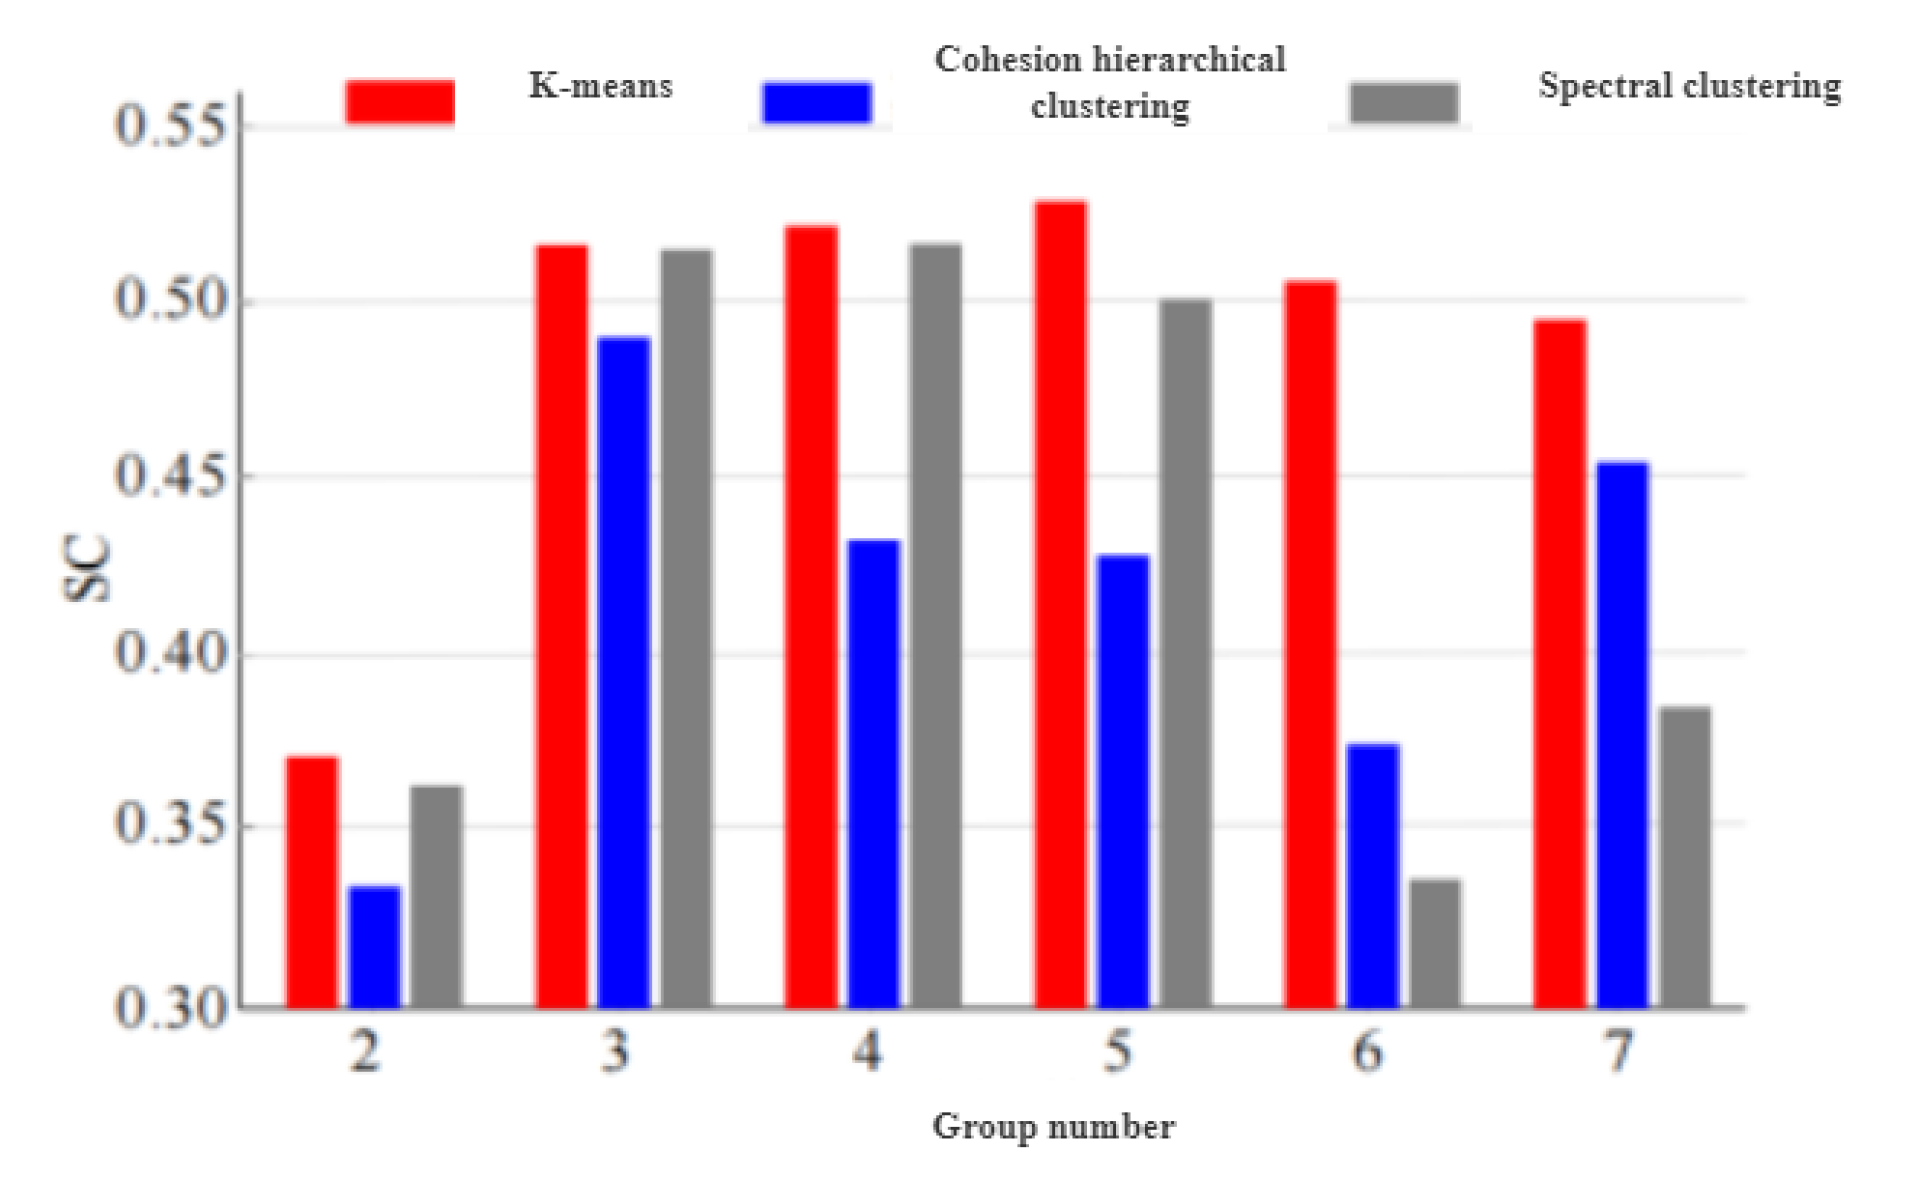
The structural surface grouping results obtained by the optimal base cluster, all cluster ensemble and selective cluster ensemble models are shown in Fig.23.The clustering results of the structural planes are consistent with the isodensity map, and the better clustering results are also obtained.It makes the structural plane data within the group more closely and more separated between the groups, and obtains more reasonable and reliable clustering results than whole cluster ensemble.Aft that noise points and the outlier groups are eliminated, The clustering effect(SC=0.60)of the structural plane based on DBSCAN selective clustering ensemble is significantly better than that of the optimal base clusterer.The group number K[2, 7]is define, that SC value of the grouping number K of each algorithm from 2 to 7 is calculated, The K value with the best clustering effect is selected as the optimal grouping number, as shown in Figure 24.It can be seen that the K-means, agglomerative hierarchy, and spectral clustering algorithms have the largest contour coefficients at K=5, K=3, and K=4, respectively.The optimal packet numbers of the three algorithms are 5, 3 and 4, respectively.
Figure 23.
Discontinuities grouping results(a)optimal basis cluster;(b)all clustering ensemble model;(c)selective clustering ensemble model.
Figure 23.
Discontinuities grouping results(a)optimal basis cluster;(b)all clustering ensemble model;(c)selective clustering ensemble model.
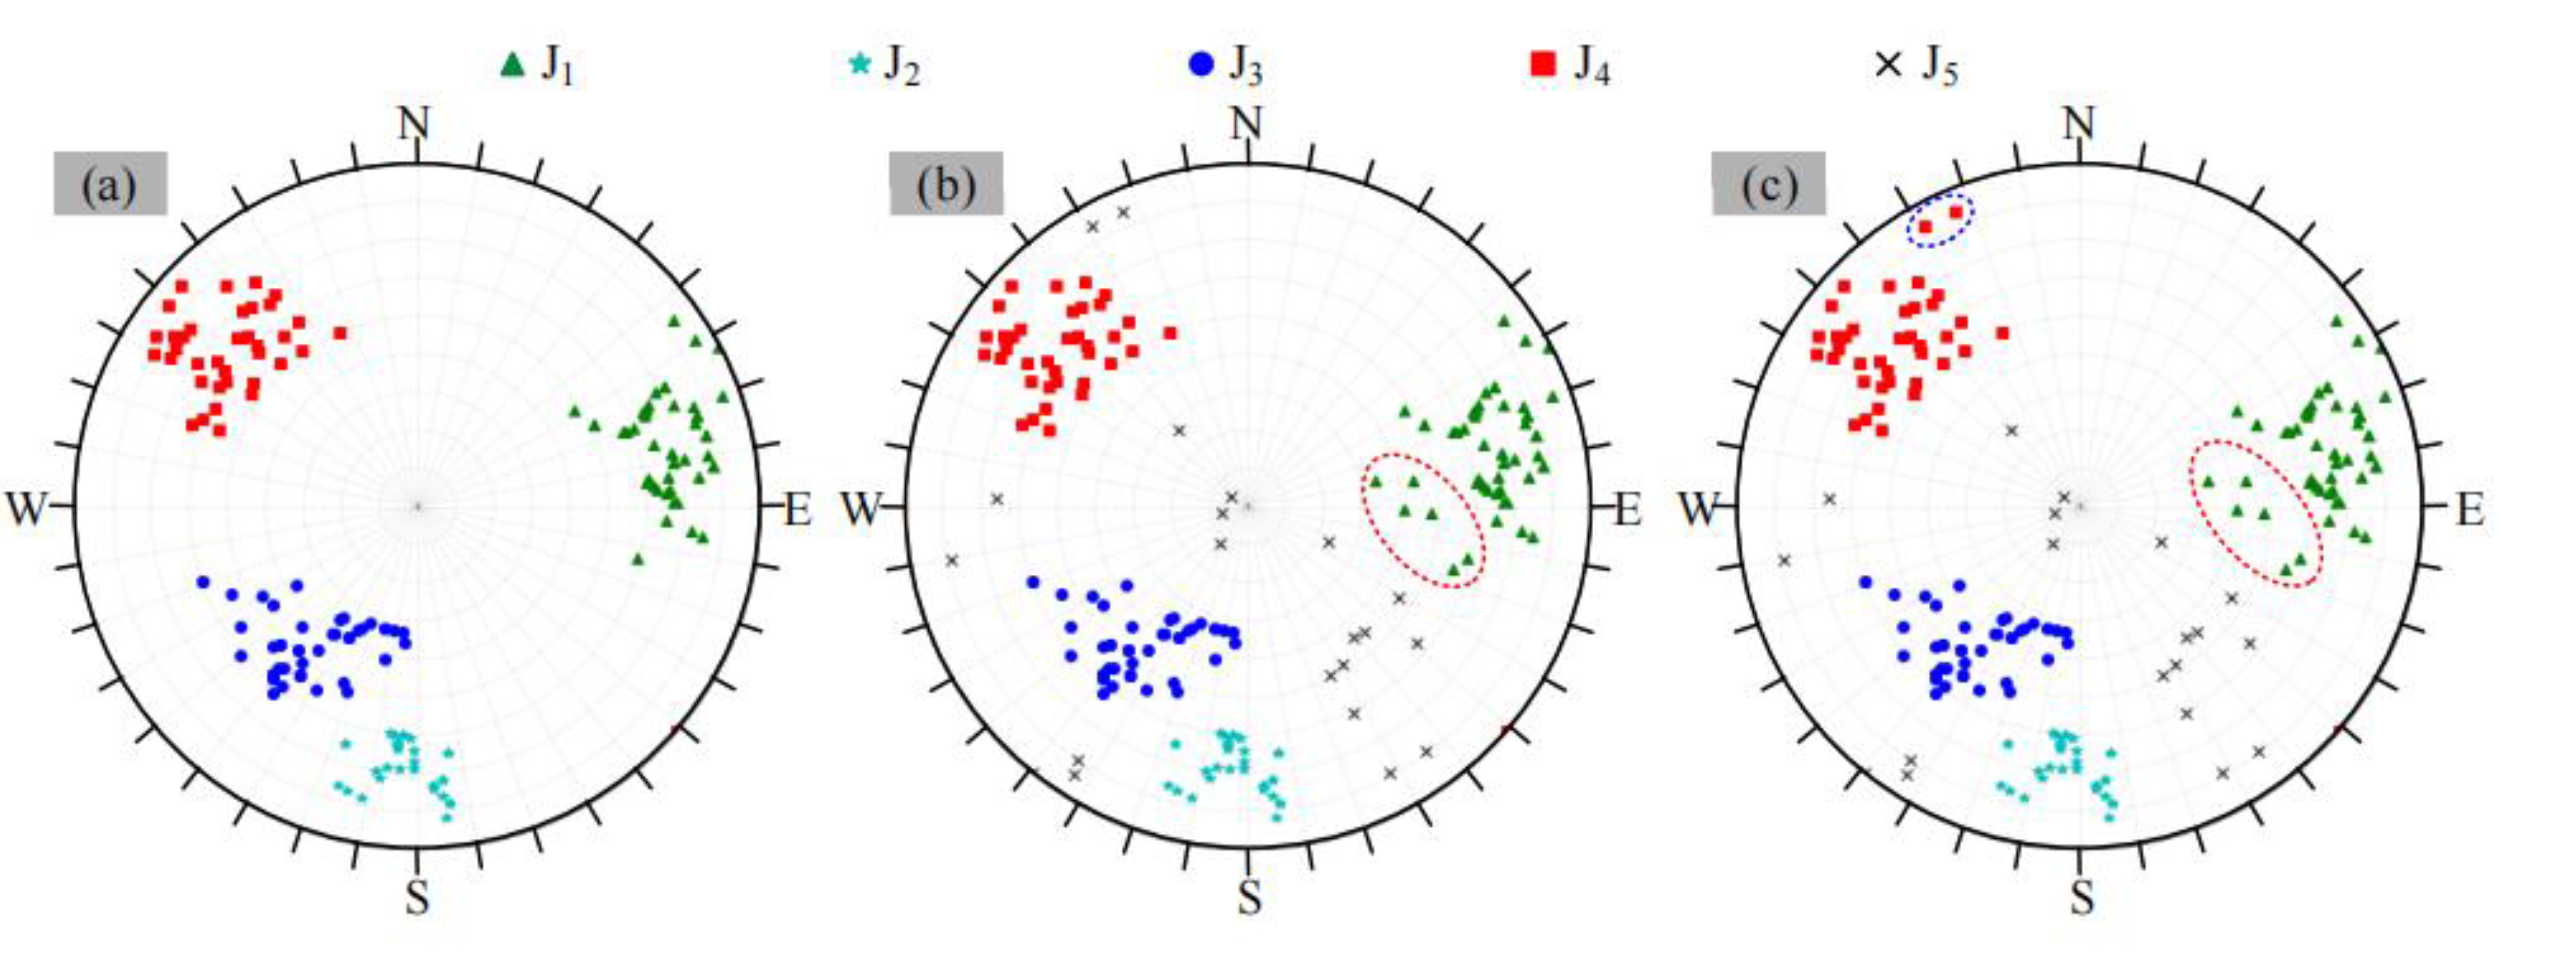
Figure 24.
Silhouette coefficients corresponding to different grouping numbers.
The method is applied to the field structure of Ma'anshan mining area in Qingyuan based on the detailed line survey data of the field structural plane.In the plane analysis, a satisfactory grouping result of the dominant occurrence of rock mass structural planes is obtained, which is in line with the actual situation.According to the occurrence of dominant structural planes, the failure modes of step slopes and overall slopes of 20 engineering slopes in the mining area are judged.The research results can provide reference value for accurately determining the dominant group of structural planes and judging the failure mode of slope.It can also provide technical support for the subsequent acquisition of the statistical law of structural plane geometric parameters.
5.3. Slope Stability Parameters Determination Based on Time-Frequency Spectrogram
Firstly, the profile line of the digitized structural surface is preprocessed by removing the trend, and then the profile line is regarded as a time sequence signal.Carry out short-time Fourier transform to obtain a time-frequency spectrogram which reflects that energy distribution of the section line of the structural surface in a time domain and a frequency domain, As shown in fig.25.
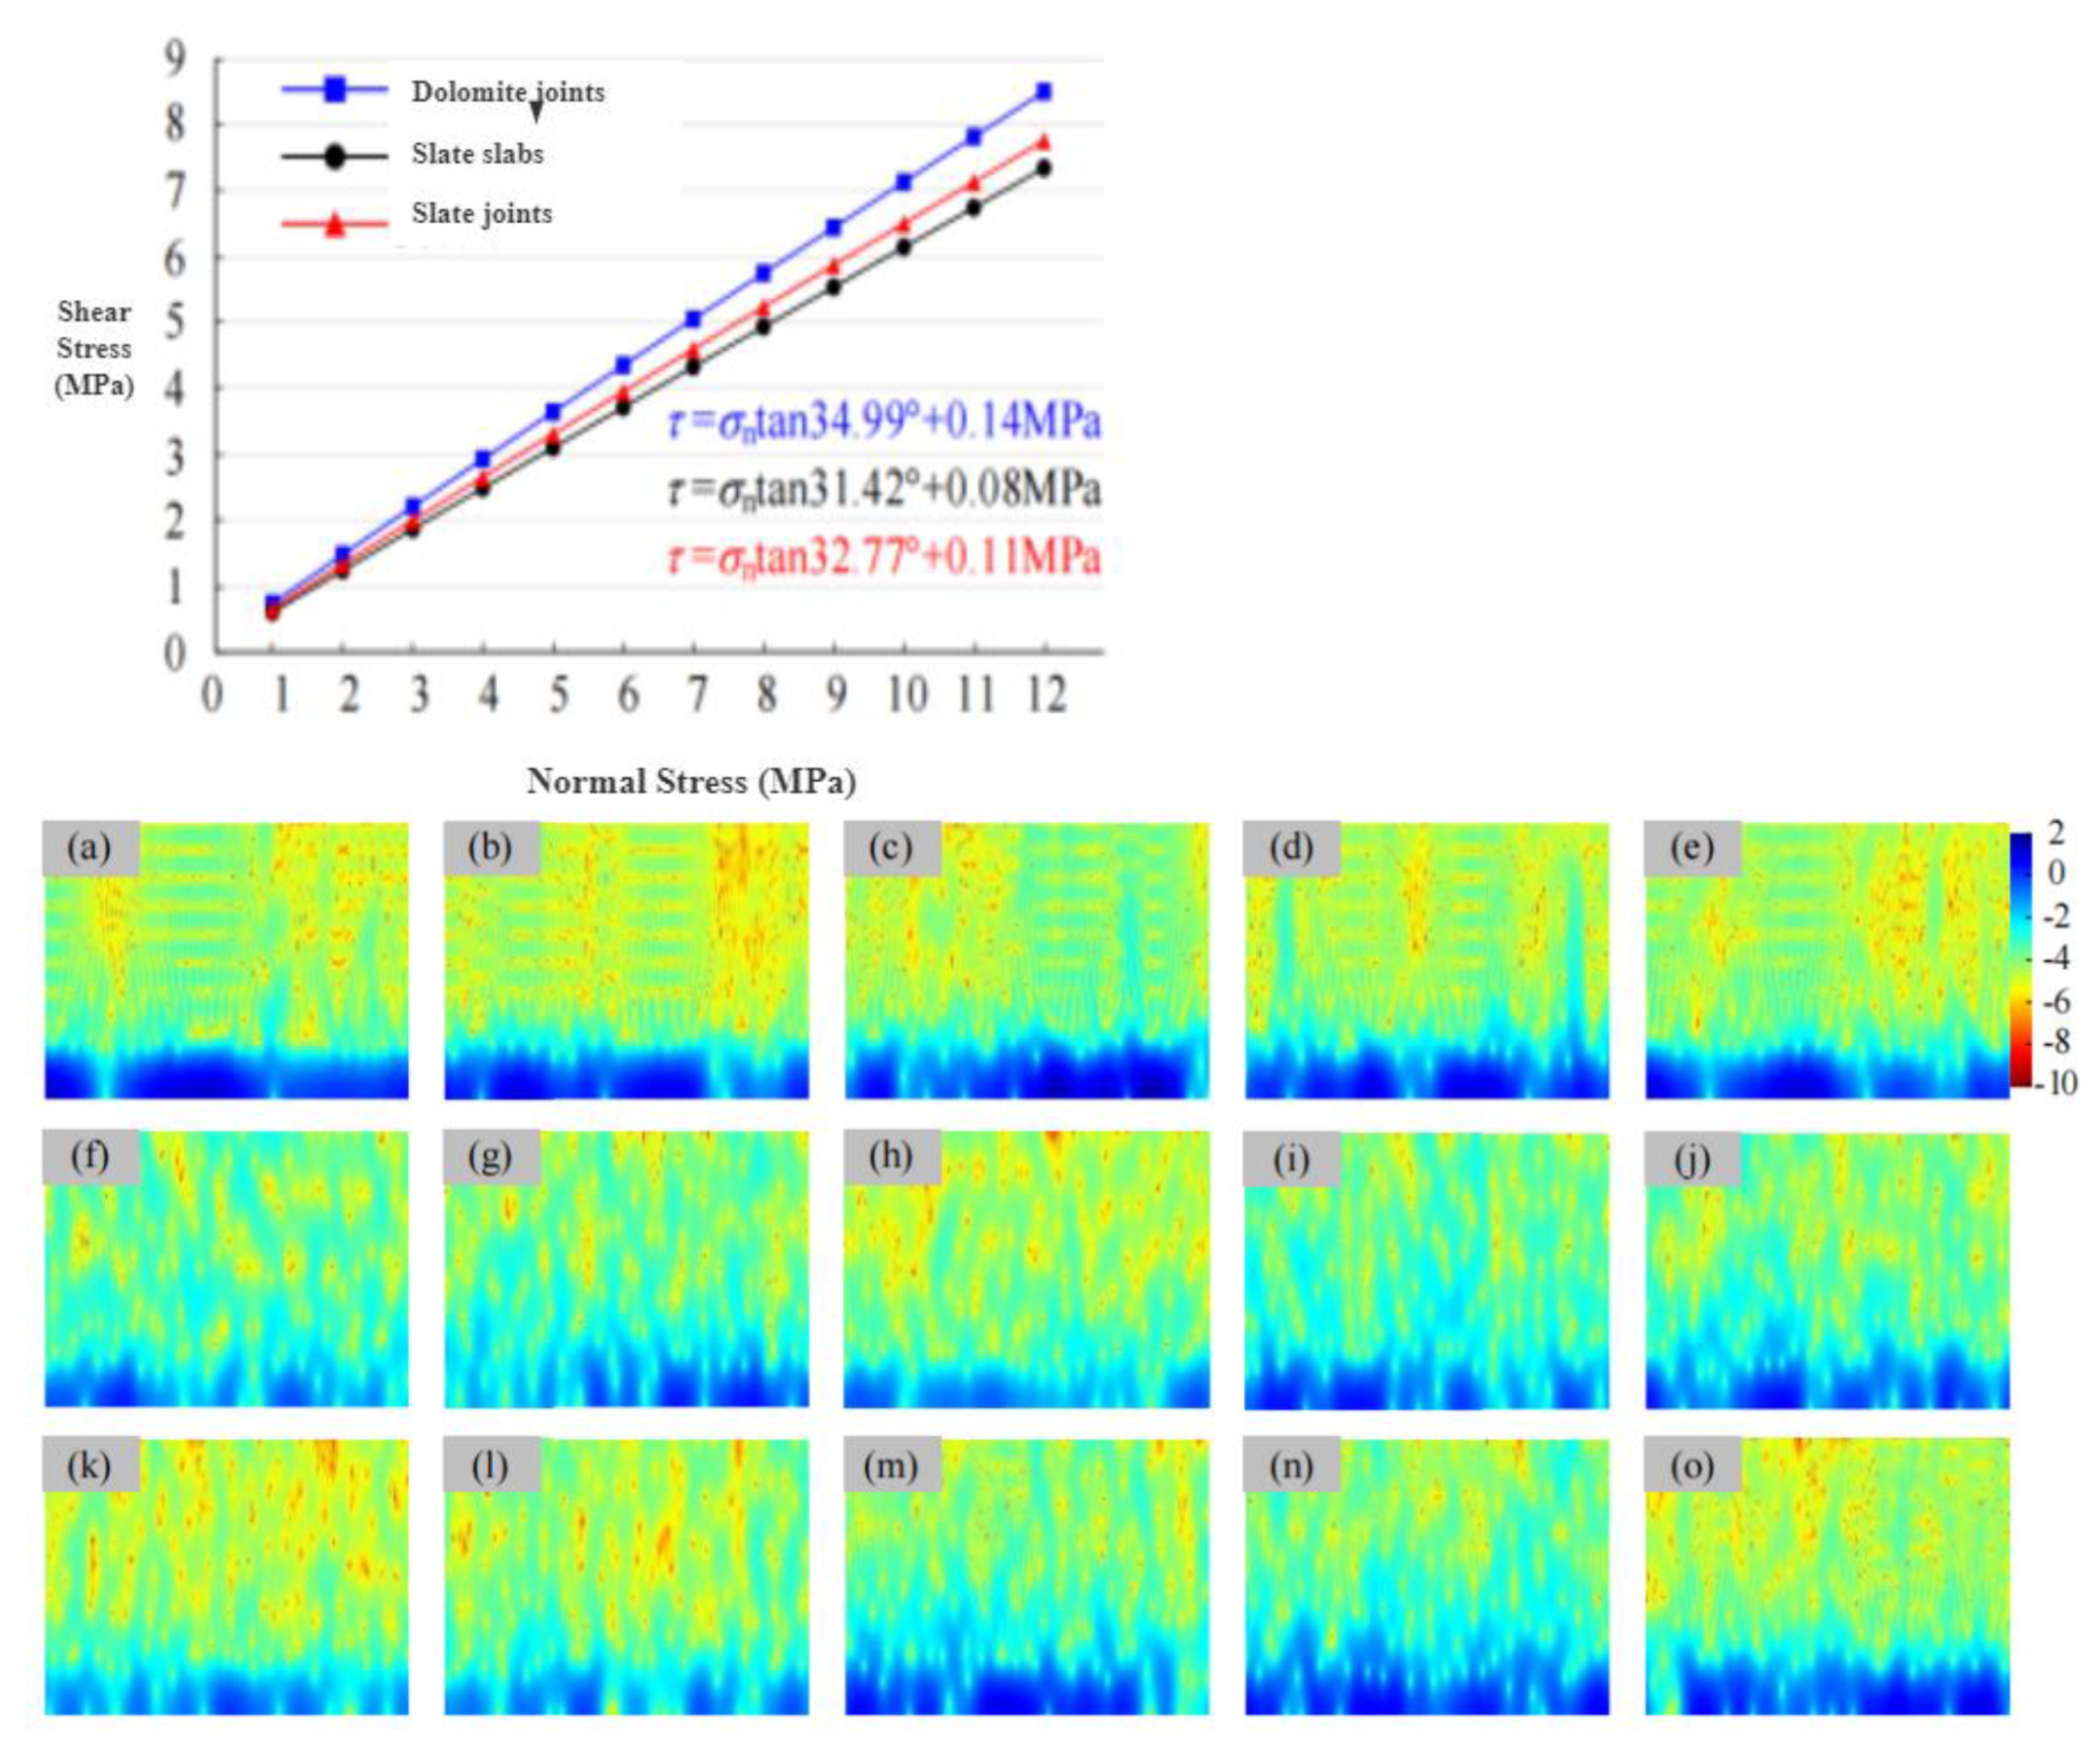
The maximum slope height of Qingyuan Ma'anshan mining area is 480 m, if G is 2.5t/m3, then V=12MPa, and if Poisson's ratio is 0.30, then K=0.43.H=5.16MPa。Considering the variation range of the self-weight stress of the rock mass, the value range of n is 1.0~12.0 MPa when estimating the shear strength.The residual friction angleΦr is the internal friction angle obtained by the residual shear test of the straight joint surface of the actual rock mass, According to the average value of residual strength of rock structural plane in direct shear test, The Residual friction angles of dolomite joints, slate lamellae and slate joints are determined to be 33.60°, 30.42°and 31.52°, respectively.The linear relationship between shear strength and normal stress is further determined, as shown in Fig.25.Therefore, the shear strength parameters of rock mass structural plane, cohesion and internal friction angle, can be obtained.The cohesion and internal friction angle of dolomite joints estimated by JRC-JCS model are 0.14 MPa and 34.The cohesion and internal friction angle of slate are 0.08 MPa and 31.The cohesion and internal friction angle of slate joints are 0.11 MPa and 32.77°, respectively.The shear strength parameters of rock mass structural plane estimated by deep learning+DBSCAN model based on time-frequency spectrogram are very close.In particular, the shear strength parameters of slate lamellae and joints are in good agreement with the proposed values.
Figure 25.
Time-frequency spectrogram of discontinuities profile curve. (a)D-1;(b)D-2;(c)D-3;(d)D-4;(e)D-5;(f)SC-1;(g)SC-2;(h)SC-3;(i)SC-4;(j)SC-5;(k)SJ-1;(l)SJ-2;(m)SJ-3;(n)SJ-4;(o)SJ-5.
Figure 25.
Time-frequency spectrogram of discontinuities profile curve. (a)D-1;(b)D-2;(c)D-3;(d)D-4;(e)D-5;(f)SC-1;(g)SC-2;(h)SC-3;(i)SC-4;(j)SC-5;(k)SJ-1;(l)SJ-2;(m)SJ-3;(n)SJ-4;(o)SJ-5.
5.4. Slope stability evaluation method based on ELM selective integration
Combining the selective ensemble learning based on boundary distance minimization and ELM theory, A slope stability evaluation method based on selective integration of improved ELM theory is proposed, and the process is shown in Fig.26.The specific steps are as follows:
The slope stability data set is collected and constructed, and the data set is divided into a training set and a test set.
Constructing a batch of base classifiers with differences based on a basic machine learning algorithm;
The base classifiers whose accuracy is lower than 75%are eliminated, And search an optimal base classifier subset from that base classifier by using a boundary distance minimization principle;
Then, the improved ELM theory is used to synthesize the base classifier results of the optimal base classifier subset to form the slope stability prediction model;
And finally, inputting the preloaded slope stability prediction model according to the geometric parameters and geological elements of the field slope, Quickly evaluate the slope stability and degree.
Figure 26.
Slide calculation results of north-south profile slope of line 37 in H2 area.
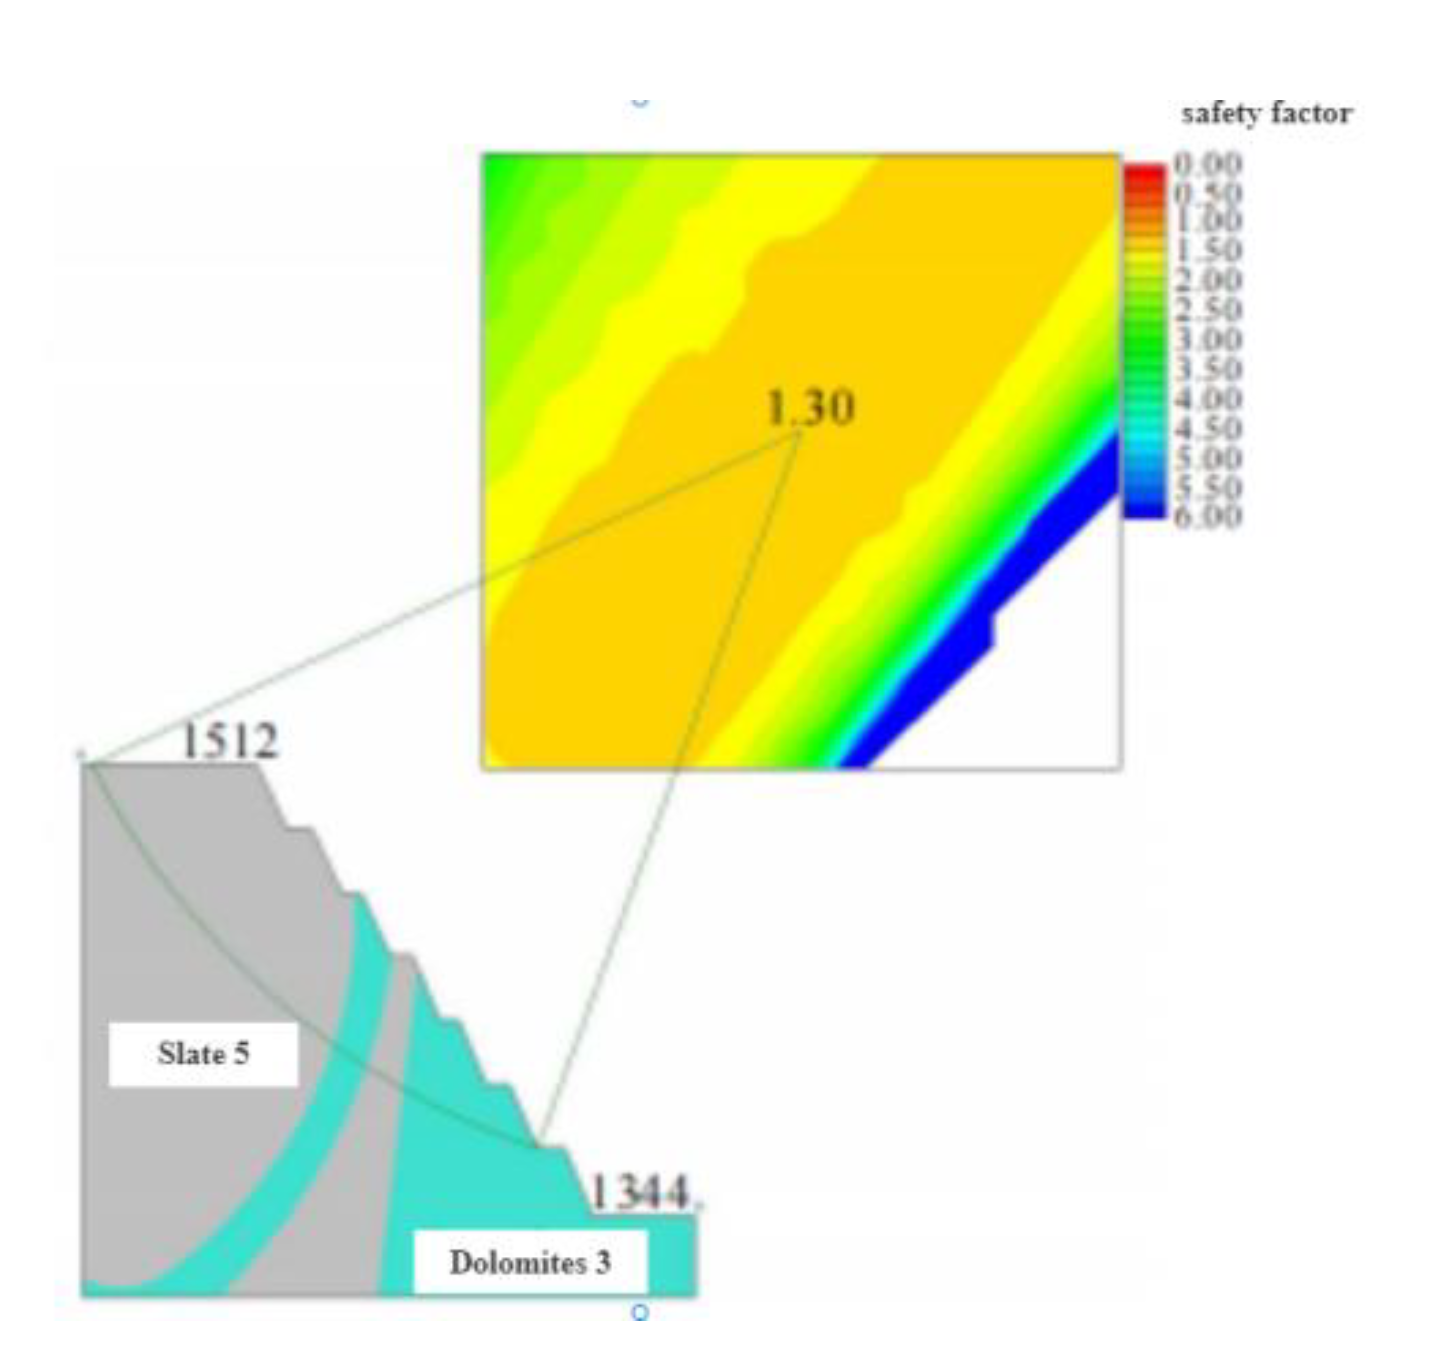
A detailed investigation should be carried out for slopes with such instability or uncertainty of results.After obtaining the detailed information of stratum distribution, structural plane geometry and strength parameters, the quantitative analysis of slope stability is carried out in depth.And quantitatively jud that stability state of the side slope.According to the detailed geological exploration results, part of dolomite III is exposed at the toe of the deep slope.The lithology is much better than slate V used in the preliminary evaluation of the stability.Therefore, the Slide numerical model is established according to the actual stratigraphic distribution of the north-south profile of Line 37 in Area H2, as shown in Fig.26.The calculation results show that the actual safety factor of the slope is 1.30, which is a stable state.Therefore, after further quantitative analysis, it is considered that the north-south section slope of Line 37 in H2 area is in a stable state.This is consistent with the actual stability of the slope.
6. Conclusions
Based on the analysis of the stability of rock slope, the main internal factors affecting the stability of rock slope are analyzed.The grouping method of rock mass dominant discontinuities based on DBSCAN selective clustering ensemble and the rough discontinuity based on time-frequency spectrogram deep learning are proposed.Methods for determining roughness and shear strength.On this basis, according to the requirements of slope engineering stability analysis, The slope stability evaluation method based on the selective integration of the improved ELM theory and the rock edge considering the uncertainty of the spatial distribution of joints are establishedSlope reliability analysis method, It is suitable for the preliminary evaluation of generalized and efficient stability in a wide area and the fine analysis of local important slopes.These methods are applied to the numerical simulation experiment and the slope stability analysis of Ma'anshan mining area in Qingyuan.The feasibility and effectiveness of the analysis method of rock slope stability based on"artificial intelligence+data-driven"are proved.It provides theoretical and technical support for effective prevention and control of landslide disasters.The main conclusions are as follows:
ArcGIS is used to process the data and construct the SWMM model of the mining area.By analyzing the elevation, slope, aspect, and topographical treatment results throughout the region, The whole study area is divided into 98 sub-catchment areas by comprehensively considering the existing slope rectification and drainage pipe network planning in the mining area.There are 61 pipes and 4 discharge outlets.The data of partial sub-catchment areas, pipelines and pipeline junction points(including the area of sub-catchment areas, Slope, characteristic width, the length of the pipeline, the inner bottom surface height of the pipeline junction), the SWMM model of the mining area is established.
The 3s technology, object-oriented image analysis and artificial intelligence model are successfully applied to the landslide deformation and failure monitoring of the Three Gorges Reservoir area.Based on the comprehensive analysis of land use change detection map, displacement time series curve, rainfall and reservoir water level deformation data, The induced mechanism of the landslide is the periodic fluctuation of reservoir water level, seasonal heavy rainfall, surface water infiltration and human engineering activitiesThe impact of.Aiming at the problem that the inducing factors of landslide deformation are not considered in the single variable chaos theory, In this paper, the multivariable chaos theory is firstly used to predict the landslide displacement, and the ELM model is used to establish the mathematical model.The multivariable chaotic ELM model presented in this paper has a clear physical meaning, For the first time, the multivariate phase space reconstruction theory is used to construct the dynamic response among the monthly rainfall, the monthly reservoir level variation and the monthly fluctuation displacement.The relationship provides a theoretical basis for the selection of input variables of the nonlinear model.
The selective cluster ensemble theory is introduced for the first time, and the DBSCAN-based selective cluster ensemble method for grouping the preferred discontinuities of rock mass is proposed.The clustering effect of the method is obviously superior to that of the common single clustering model and the all-integrated model, Overcomes the defect that the traditional single model is easy to be over-segmented or under-segmented, The feasibility and effectiveness of the method in the grouping of preferred discontinuities of rock mass are verified.
The time-frequency spectrogram is used to describe the characteristics of the waviness and roughness of the section line of the structural surface.It overcomes the one-sidedness of the traditional artificial characteristic parameters.Automatic feature extraction and learning based on convolutional neural network, A method for determining the roughness coefficient of structural surface based on deep learning of time-frequency spectrogram is proposed.It opens a new mode of structural surface roughness recognition from experience-driven artificial feature paradigm to data-driven self-learning paradigm.
The method consider that variability of rock mass strength parameter and joint geometry parameters and the randomness of joint position distribution, The influence of the degree truly represents the spatial uncertainty characteristics of the random development of the joints in the rock mass.The method can improve the accuracy and objectivity of the reliability analysis result of the jointed rock slope, It provides an effective way to solve the reliability problem of complex rock slope.
References
- Zhang L, Wang J, Bai Z, et al.Effects of vegetation on runoff and soil erosion onreclaimed land in an opencast coal-mine dump in a loess area[J].CATENA, 2015, 128:44-53. [CrossRef]
- Gu Q, Li X, Chen L, et al.Layout optimization of crushing station in open-pit minebased on two-stage fusion particle swarm algorithm[J].Engineering optimization, 2021, 53(10):1671-1694. [CrossRef]
- Zhao Z, Shahrour I, Bai Z, et al.Soils development in opencast coal mine spoilsreclaimed for 1–13 years in the West-Northern Loess Plateau of China[J].EuropeanJournal of Soil Biology, 2013, 55:40-46.
- Ahirwal J, Maiti S K, Singh A K.Changes in ecosystem carbon pool and soil CO2 fluxfollowing post-mine reclamation in dry tropical environment, India[J].Science ofThe Total Environment, 2017, 583:153-162. [CrossRef]
- Thomas G, Sheridan C, Holm P E.A critical review of phytoremediation for acid minedrainage-impacted environments[J].Science of The Total Environment, 2022, 811:152230.
- Lang Y, Li G, Wang X, et al.Combination of Unmix and positive matrix factorizationmodel identifying contributions to carcinogenicity and mutagenicity for polycyclicaromatic hydrocarbons sources in Liaohe delta reed wetland soils, China[J].Chemosphere, 2015, 120:431-437. [CrossRef]
- Upadhyay N, Verma S, Pratap Singh A, et al.Soil ecophysiological andmicrobiological indices of soil health:a study of coal mining site in sonbhadra, uttarPradesh[J].Journal of soil science and plant nutrition, 2016, 16(ahead):778-800. [CrossRef]
- Shi W, Wang J, Li X, et al.Multi-fractal characteristics of reconstructed landformand its relationship with soil erosion at a large opencast coal-mine in the loess areaof China[J].Geomorphology, 2021, 390:107859.
- Sinha N, Deb D, Pathak K.Development of a mining landscape and assessment of itssoil erosion potential using GIS[J].Engineering Geology, 2017, 216:1-12.
- Rodríguez-Galán M, Baena-Moreno F M, Vázquez S, et al.Remediation of acid minedrainage[J].Environmental Chemistry Letters, 2019, 17(4):1529-1538.
- Aguinaga O E, White K N, Dean A P, et al.Addition of organic acids to acid minedrainage polluted wetland sediment leads to microbial community structure andfunctional changes and improved water quality[J].Environmental Pollution, 2021, 290:118064.
- Zeng C, Aboagye E M, Li H, et al.Comments and recommendations on Sponge City—China's solutions to prevent flooding risks[J].Heliyon, 2023, 9(1):e12745.
- Hua P, Yang W, Qi X, et al.Evaluating the effect of urban flooding reductionstrategies in response to design rainfall and low impact development[J].Journal ofCleaner Production, 2020, 242:118515. [CrossRef]
- Hewitt E, Oberg A, Coronado C, et al.Assessing“green”and“resilient”buildingfeatures using a purposeful systems approach[J].Sustainable Cities and Society, 2019, 48:101546.
- Kreibich H, Van Loon A F, Schröter K, et al.The challenge of unprecedented floodsand droughts in risk management[J].Nature, 2022, 608(7921):80-86.
- Chen J, Theller L, Gitau M W, et al.Urbanization impacts on surface runoff of thecontiguous United States[J].J Environ Manage, 2017, 187:470-481.
- Paule-Mercado M A, Lee B Y, Memon S A, et al.Influence of land development onstormwater runoff from a mixed land use and land cover catchment[J].Science ofThe Total Environment, 2017, 599-600:2142-2155. [CrossRef]
- Müller A, Österlund H, Marsalek J, et al.The pollution conveyed by urban runoff:Areview of sources[J].Science of The Total Environment, 2020, 709:136125.
- Yang L, Li J, Zhou K, et al.The effects of surface pollution on urban river waterquality under rainfall events in Wuqing district, Tianjin, China[J].Journal of CleanerProduction, 2021, 293:126136. [CrossRef]
- Hou J, Yuan H.Optimal spatial layout of low-impact development practices basedon SUSTAIN and NSGA-II[J].DESALINATION AND WATER TREATMENT, 2020, 177:227-235. [CrossRef]
- Kong Z, Shao Z, Shen Y, et al.Comprehensive evaluation of stormwater pollutantscharacteristics, purification process and environmental impact after low impactdevelopment practices[J].Journal of Cleaner Production, 2021, 278:123509.
- Xu H, Zhu L, Mei Y.Effects of high levels of nitrogen and phosphorus on perennialryegrass(Lolium perenne L.)and its potential in bioremediation of highly eutrophicwater[J].Environmental Science and Pollution Research, 2021, 28(8):9475-9483.
- Wang J, Guo Y.Dynamic water balance of infiltration-based stormwater bestmanagement practices[J].Journal of Hydrology, 2020, 589:125174.
- Moore T L, Rodak C M, Ahmed F, et al.Urban Stormwater Characterization, Controland Treatment[J].Water Environment Research, 2018, 90(10):1821-1871.
- Taghizadeh S, Khani S, Rajaee T.Hybrid SWMM and particle swarm optimizationmodel for urban runoff water quality control by using green infrastructures(LIDBMPs)[J].Urban Forestry&Urban Greening, 2021, 60:127032. [CrossRef]
- HX Lan,CH Zhou,LJ Wang,et al.Landslide hazard spatial analysis and prediction using GISin the Xiaojiang watershed, Yunnan, China[J].Engineering geology, 2004, 76(1):109-128. [CrossRef]
- Tahir Ali Akbar,Sung Ryong Ha.Landslide hazard zoning along Himalayan Kaghan Valley ofPakistan—by integration of GPS, GIS, and remote sensing technology[J].Landslides, 2011, 8(4):527-540.
- Mohamed O Arnous.Integrated remote sensing and GIS techniques for landslide hazardzonation:a case study Wadi Watier area, South Sinai, Egypt[J].Journal of Coastal Conservation, 2011, 15(4):477-497.
- Aykut Akgun,Cem Kıncal,Biswajeet Pradhan.Application of remote sensing data and GIS forlandslide risk assessment as an environmental threat to Izmir city(west Turkey)[J].Environmental Monitoring and Assessment, 2012, 184(9):5453-5470. [CrossRef]
- S Lee.Application of logistic regression model and its validation for landslide susceptibilitymapping using GIS and remote sensing data[J].International Journal of Remote Sensing, 2005, 26(7):1477-1491.
- S Reis,A Yalcin,M Atasoy,et al.Remote sensing and GIS-based landslide susceptibilitymapping using frequency ratio and analytical hierarchy methods in Rize province(NETurkey)[J].Environmental Earth Sciences, 2012, 66(7):2063-2073.
- Konstantinos G Nikolakopoulos,Katerina Kavoura,Nikolaos Depountis,et al.Active landslidemonitoring using remote sensing data, GPS measurements and cameras on board UAV[C].International Society for Optics and Photonics,2015:96440E-96440E-9.
- Michel Peyret,Y Djamour,Magali Rizza,et al.Monitoring of the large slow Kahrod landslidein Alborz mountain range(Iran)by GPS and SAR interferometry[J].Engineering Geology, 2008, 100(3):131-141.
- G Herrera,F Gutiérrez,JC García-Davalillo,et al.Multi-sensor advanced DInSAR monitoringof very slow landslides:The Tena Valley case study(Central Spanish Pyrenees)[J].RemoteSensing of Environment, 2013, 128:31-43. [CrossRef]
- Darya Golovko,Sigrid Roessner,Robert Behling,et al.Development of multi-temporallandslide inventory information system for southern Kyrgyzstan using GIS and satellite remotesensing[J].Photogrammetrie-Fernerkundung-Geoinformation, 2015, 2015(2):157-172.
- Chong Xu.Preparation of earthquake-triggered landslide inventory maps using remote sensingand GIS technologies:Principles and case studies[J].Geoscience Frontiers, 2015, 6(6):825-836.
- Huang S, Huang M, Lyu Y.An improved KNN-based slope stability predictionmodel[J].Advances in Civil Engineering, 2020, 2020:8894109.
- Zhang Y, Asce S M, Dai M, et al.Preliminary discussion regarding SVM kernelfunction selection in the twofold rock slope prediction model[J].Journal ofComputing in Civil Engineering, 2015, 30(3):4015031. [CrossRef]
- Salmasi F, Jafari F.A simple direct method for prediction of safety factor ofhomogeneous finite slopes[J].Geotechnical and Geological Engineering, 2019, 37(5):3949-3959.
- Niu P, Zhou A, Huang H.Assessing model of highway slope stability based onoptimized SVM[J].China Geology, 2020, 3(2):339-344.
- Gordan B, Jahed Armaghani D, Hajihassani M, et al.Prediction of seismic slopestability through combination of particle swarm optimization and neural network[J].Engineering with Computers, 2016, 32(1):85-97.
- Hoang N D, Pham A D.Hybrid artificial intelligence approach based onmetaheuristic and machine learning for slope stability assessment:a multinationaldata analysis[J].Expert Systems with Applications, 2016, 46:60-68.
- Rukhaiyar S, Alam M N, Samadhiya N K.A PSO-ANN hybrid model for predictingfactor of safety of slope[J].International Journal of Geotechnical Engineering, 2018, 12(6):556-566.
- Luo Z, Bui X N, Nguyen H, et al.A novel artificial intelligence technique foranalyzing slope stability using PSO-CA model[J].Engineering with Computers, 2021, 37(1):533-544. [CrossRef]
- Zhang H, Wu S, Zhang X, et al.Slope stability prediction method based on themargin distance minimization selective ensemble[J].Catena, 2022, 212:106055. [CrossRef]
- Qi C, Tang X.A hybrid ensemble method for improved prediction of slopestability[J].International Journal for Numerical and Analytical Methods inGeomechanics, 2018, 42(15):1823-1839.
- Bragagnolo L, Silva R, Grzybowski J.Artificial neural network ensembles appliedto the mapping of landslide susceptibility[J].Catena, 2020, 184:104240.
- Pham K, Kim D, Park S, et al.Ensemble learning-based classification models forslope stability analysis[J].Catena, 2021, 196:104886.
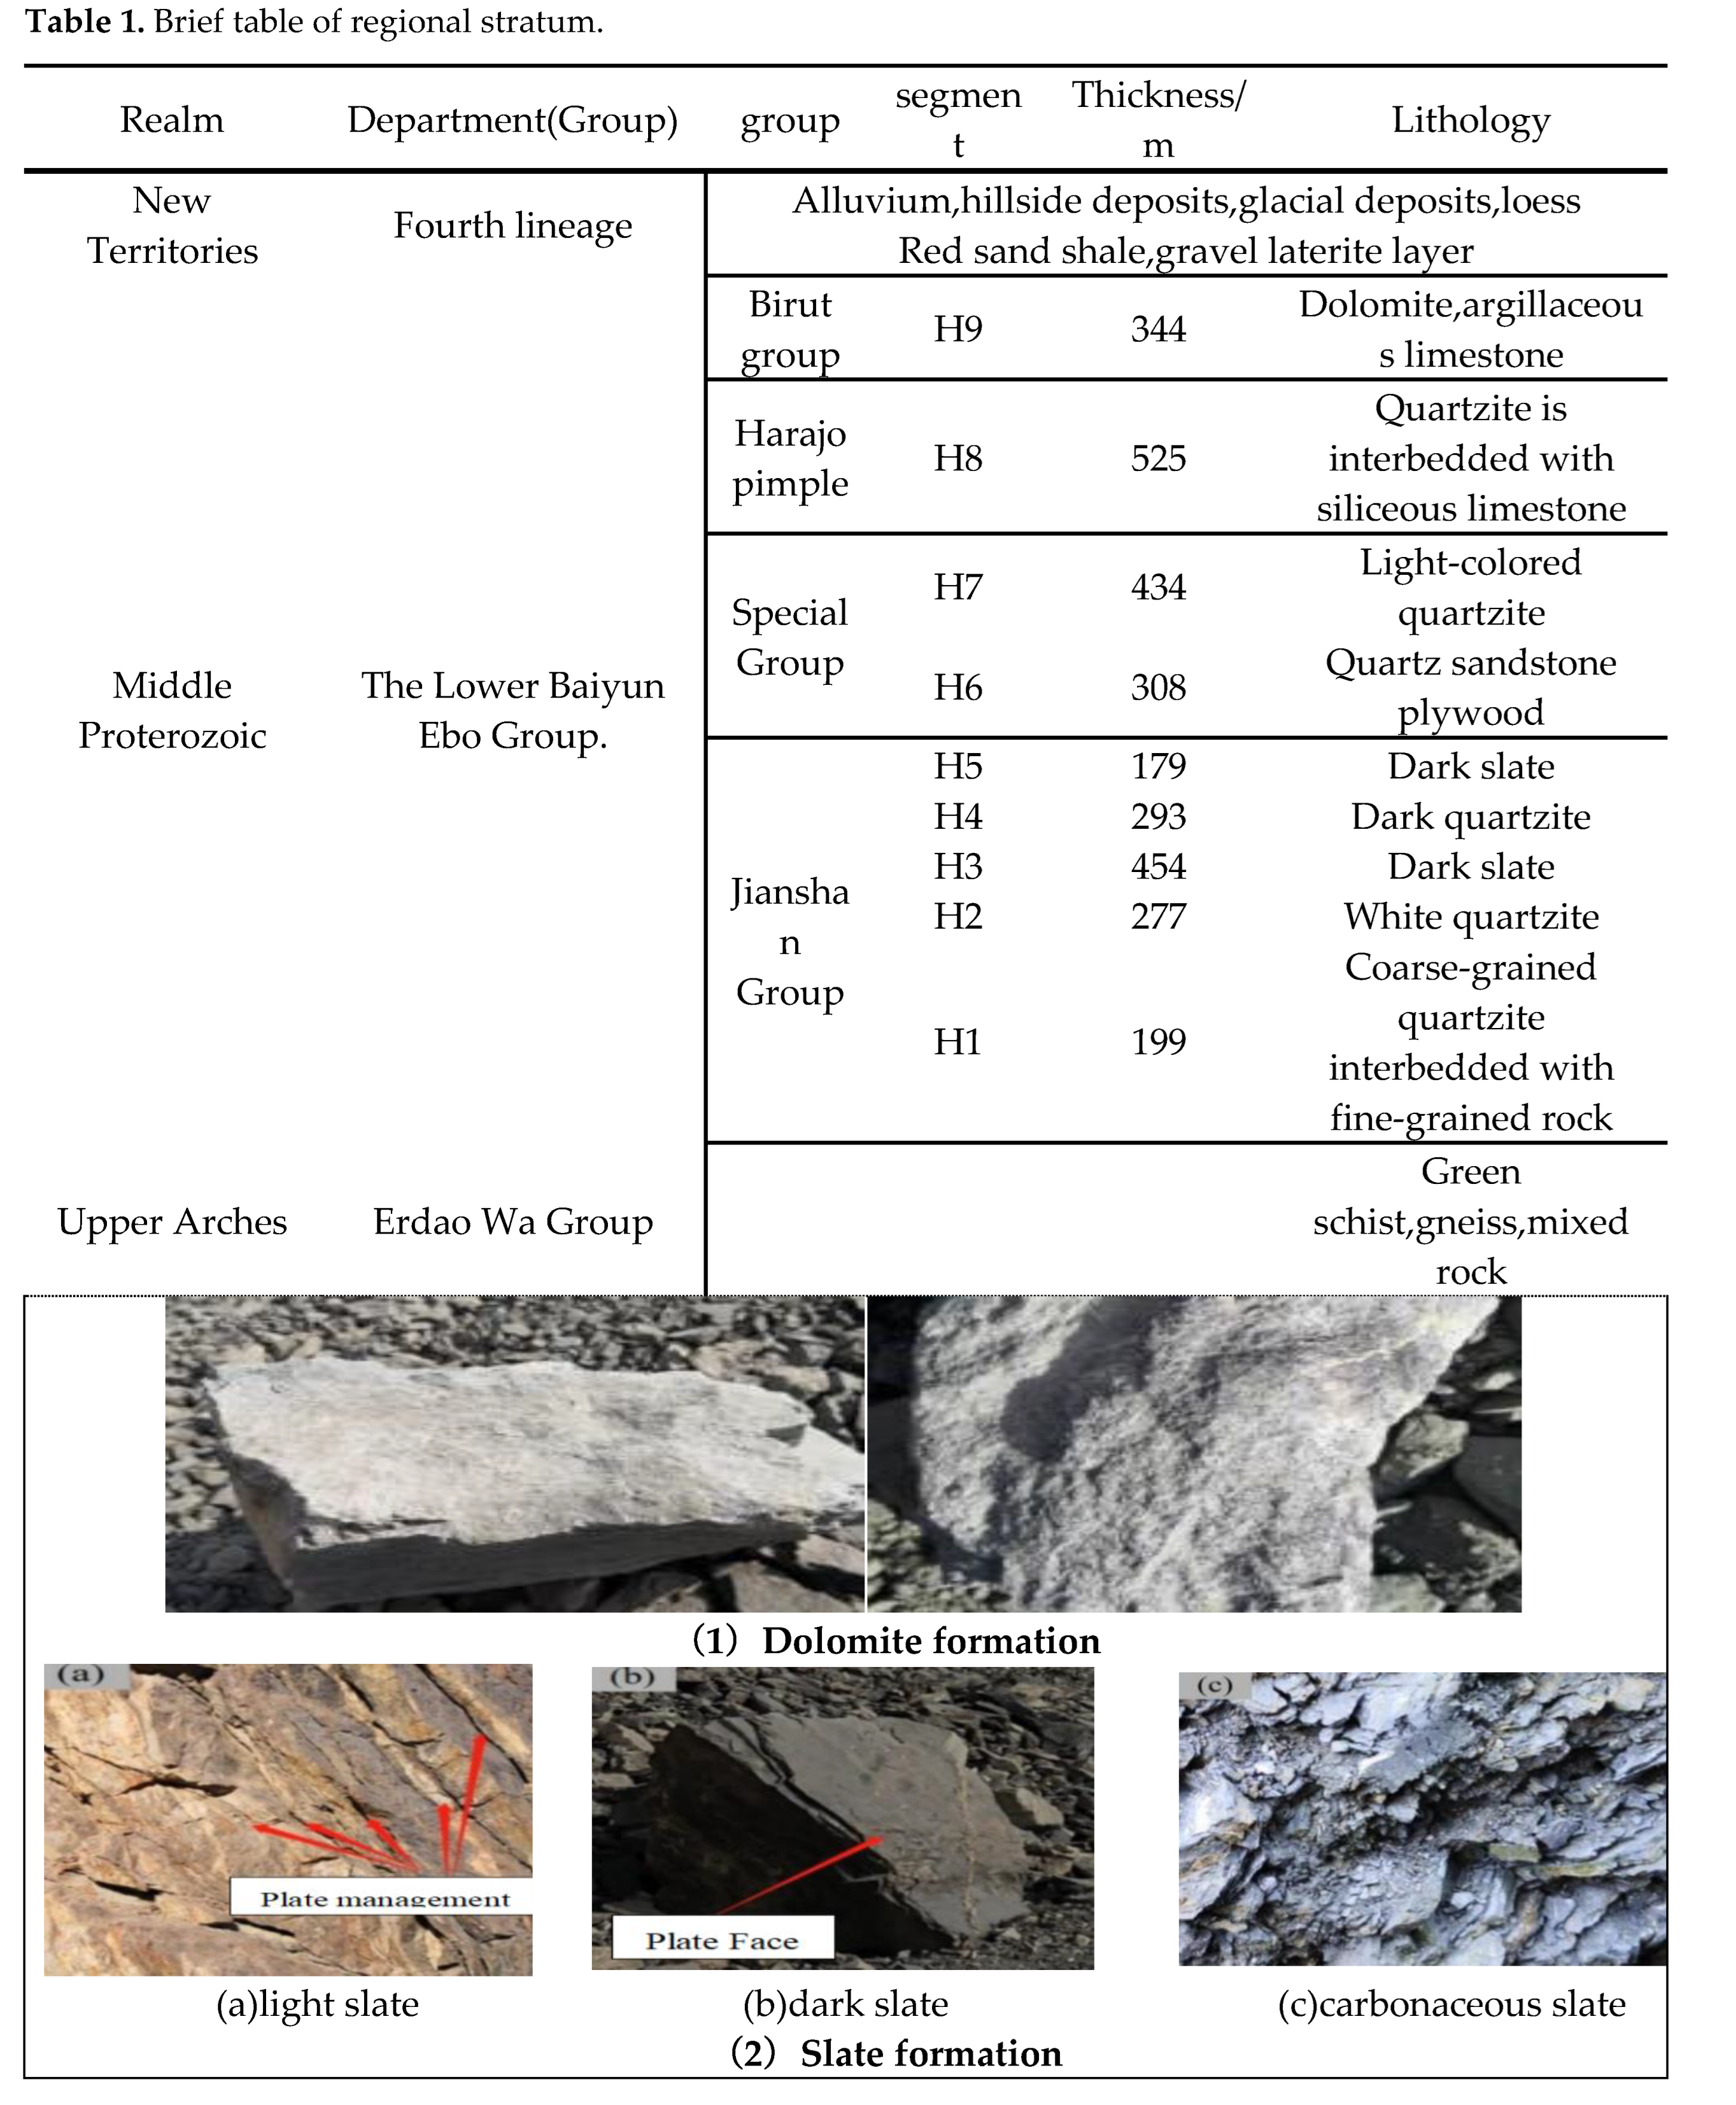
Table 1.
Brief table of regional stratum.
| Realm | Department(Group) | group | segment | Thickness/m | Lithology |
| New Territories | Fourth lineage | Alluvium, hillside deposits, glacial deposits, loess | |||
| Red sand shale, gravel laterite layer | |||||
| Middle Proterozoic | The Lower Baiyun Ebo Group. | Birut group | H9 | 344 | Dolomite, argillaceous limestone |
| Harajo pimple | H8 | 525 | Quartzite is interbedded with siliceous limestone | ||
| Special Group | H7 | 434 | Light-colored quartzite | ||
| H6 | 308 | Quartz sandstone plywood | |||
| Jianshan Group | H5 | 179 | Dark slate | ||
| H4 | 293 | Dark quartzite | |||
| H3 | 454 | Dark slate | |||
| H2 | 277 | White quartzite | |||
| H1 | 199 | Coarse-grained quartzite interbedded with fine-grained rock | |||
| Upper Arches | Erdao Wa Group | Green schist, gneiss, mixed rock | |||
Disclaimer/Publisher’s Note: The statements, opinions and data contained in all publications are solely those of the individual author(s) and contributor(s) and not of MDPI and/or the editor(s). MDPI and/or the editor(s) disclaim responsibility for any injury to people or property resulting from any ideas, methods, instructions or products referred to in the content. |
© 2025 by the authors. Licensee MDPI, Basel, Switzerland. This article is an open access article distributed under the terms and conditions of the Creative Commons Attribution (CC BY) license (http://creativecommons.org/licenses/by/4.0/).
Copyright: This open access article is published under a Creative Commons CC BY 4.0 license, which permit the free download, distribution, and reuse, provided that the author and preprint are cited in any reuse.


