
Submitted:
16 July 2025
Posted:
16 July 2025
You are already at the latest version
Abstract
This paper explores the interplay between cultural organi- zations, safety incidents, and pricing within the context of New York City’s Airbnb hospitality landscape. By analyzing data from Airbnb list- ings, crime incidents, and cultural organizations, the research investigates how these factors influence the attractiveness and pricing of accommo- dations. Using machine learning models and visualization techniques, the paper identifies key trends, including the significant impact of cul- tural organizations on pricing and the trade-offs between affordability, diversity, and safety in districts like Queens and Bronx. The Gradient Boosting Regression model achieved the highest accuracy in predicting listing prices, with a Median Absolute Error of $23.91. These findings highlight how cultural and safety factors contribute to shaping guest ex- periences and pricing dynamics in urban hospitality. The paper provides actionable insights for stakeholders in the hospitality sector, including hosts, travelers, and urban planners, and suggests directions for future work on localized predictors in hospitality services.
Keywords:
airbnb pricing
; urban hospitality
; cultural organizations
; machine learning
; crime and safety
1. Introduction
When selecting an Airbnb listing, guests often consider multiple factors, including affordability, attractiveness due to local events, and safety. In many cases, travelers seek accommodations that are both budget-friendly and located in areas with cultural attractions and entertainment options. At the same time, safety remains a crucial concern, as incidents in a given location can influence travelers’ perceptions and decisions. Prior studies indicate that Airbnb contributes to urban gentrification, reshaping neighborhood dynamics and affordability [1]. Understanding how these factors interact can provide valuable insights for hosts, travelers, and policymakers.
This study investigates the relationship between cultural organizations, reported incidents, and Airbnb listing prices in New York City (NYC). Specifically, the research aims to analyze whether neighborhoods with a higher density of cultural organizations tend to have higher listing prices and whether areas with increased incidents impact the perceived value of accommodations. Understanding these relationships can provide valuable insights for both hosts and guests, as well as policymakers seeking to improve urban planning and tourism development.
To explore this topic, a data-driven approach was applied, utilizing machine learning techniques for price prediction and classification. Various regression models were tested to determine the significance of cultural organizations and incidents in influencing listing prices. Additionally, classification algorithms were employed to categorize the impact of these features on rental pricing trends.
The paper is organized as follows. Section 3 details the methodology and describes how the experimental evaluation was conducted. Section 4 presents the findings and provides an in-depth analysis of the results obtained. Section 5 discusses the challenges encountered during the study, along with potential improvements. Finally, Section 6 summarizes the key conclusions drawn from this research and outlines directions for future work.
2. Related Work
Recent literature on Airbnb and urban hospitality has focused on the multifaceted determinants of listing performance. The spatial distribution of Airbnb listings, for instance, has been extensively analyzed using urban data science techniques. Such studies reveal significant correlations between listing density, neighborhood socio-economic factors, and pricing patterns, offering insights into broader urban phenomena such as gentrification and tourism dynamics [2].
Safety has also emerged as a critical component in this domain. Research leveraging machine learning models has quantified the influence of safety-related metrics—such as crime rates and reported incidents—on rental pricing. These findings suggest that neighborhoods perceived as safer tend to command higher prices, highlighting the essential role of safety in shaping both guest perceptions and host pricing strategies [3].
Complementing these aspects, the role of cultural institutions has garnered significant attention. Cultural organizations not only enhance a neighborhood’s attractiveness but also contribute to a distinctive local identity that drives short-term rental demand. Areas enriched with cultural amenities tend to experience increased visitor engagement, which can, in turn, justify premium pricing for Airbnb listings [4].
Collectively, these studies underscore the intricate interplay between spatial distribution, safety, and cultural vibrancy in urban hospitality markets. By integrating these dimensions, recent research offers a comprehensive framework for understanding how multiple factors converge to shape Airbnb’s market dynamics in contemporary urban environments.
3. Experiment Description
According to my goals, the experiment was guided by the following research question: “How do the incidents and cultural organizations impact listing price?”.
To answer the research question, I compared the results shown on maps, a collinearity matrix among the features, and how the accommodates are distributed. Additionally, I used machine learning with seven regression models, and the results were compared using Median Absolute Error. Besides, two algorithms for classification were used to see the difficulty of predicting the most influential features.
3.1. Target Data
The investigation focused on four datasets collected in open data sites: 1) Listings, 2) Incidents, 3) Cultural Organizations, and 4) NYC Borough. Further information about these datasets is available in Table 1.
To help in the analyses, the Cultural Organizations and Incidents dataset received a score. Since I have five districts in New York, and to simplify, the Cultural Organizations and Incidents dataset was grouped and ranked in relation to the order (1-5), where one is the worst and five the best. In this case, the datasets were ordered by the number in each district, ascendant for Cultural Organizations, and descendant for the Incidents. In the end, it created a unique data frame with the necessary information that contains 37043 rows.
4. Results and Analysis
This section presents and discusses the findings of the research to answer the primary research question. The results are analyzed using statistical visualization and machine learning models to extract meaningful insights.
Figure 2 provides a per-district pairwise correlation matrix for selected features: price, cultural organizations, and incidents. The diagonal cells in the matrix display histograms of individual feature distributions, which help identify trends and potential collinearity.
Based on the figure, it is evident that Queens and Bronx exhibit a trade-off among the analyzed features. To further explore this observation, Figure 3 indicates that Manhattan has the highest mean price for listings, while Queens and Bronx display the lowest values. Figure 4 reveals that cultural organizations are more concentrated in Manhattan, followed by Brooklyn. Conversely, Figure 5 shows that Brooklyn experiences the highest number of incidents, with Manhattan following closely. These insights confirm that Queens and Bronx present the best trade-offs concerning mean price, cultural organizations, and incidents. Furthermore, price distribution aligns with higher cultural organization scores and lower incident scores, suggesting a potential correlation. Figure 1 displays the mean price categorized by the number of accommodations (number of beds), considering listings priced below $1000 and accommodating up to four people. It is evident that Manhattan offers a wider range of accommodations compared to other districts. Additionally, Queens surpasses the Bronx in terms of accommodation diversity.
Figure 1.
Mean Price Grouped by Accommodation Capacity
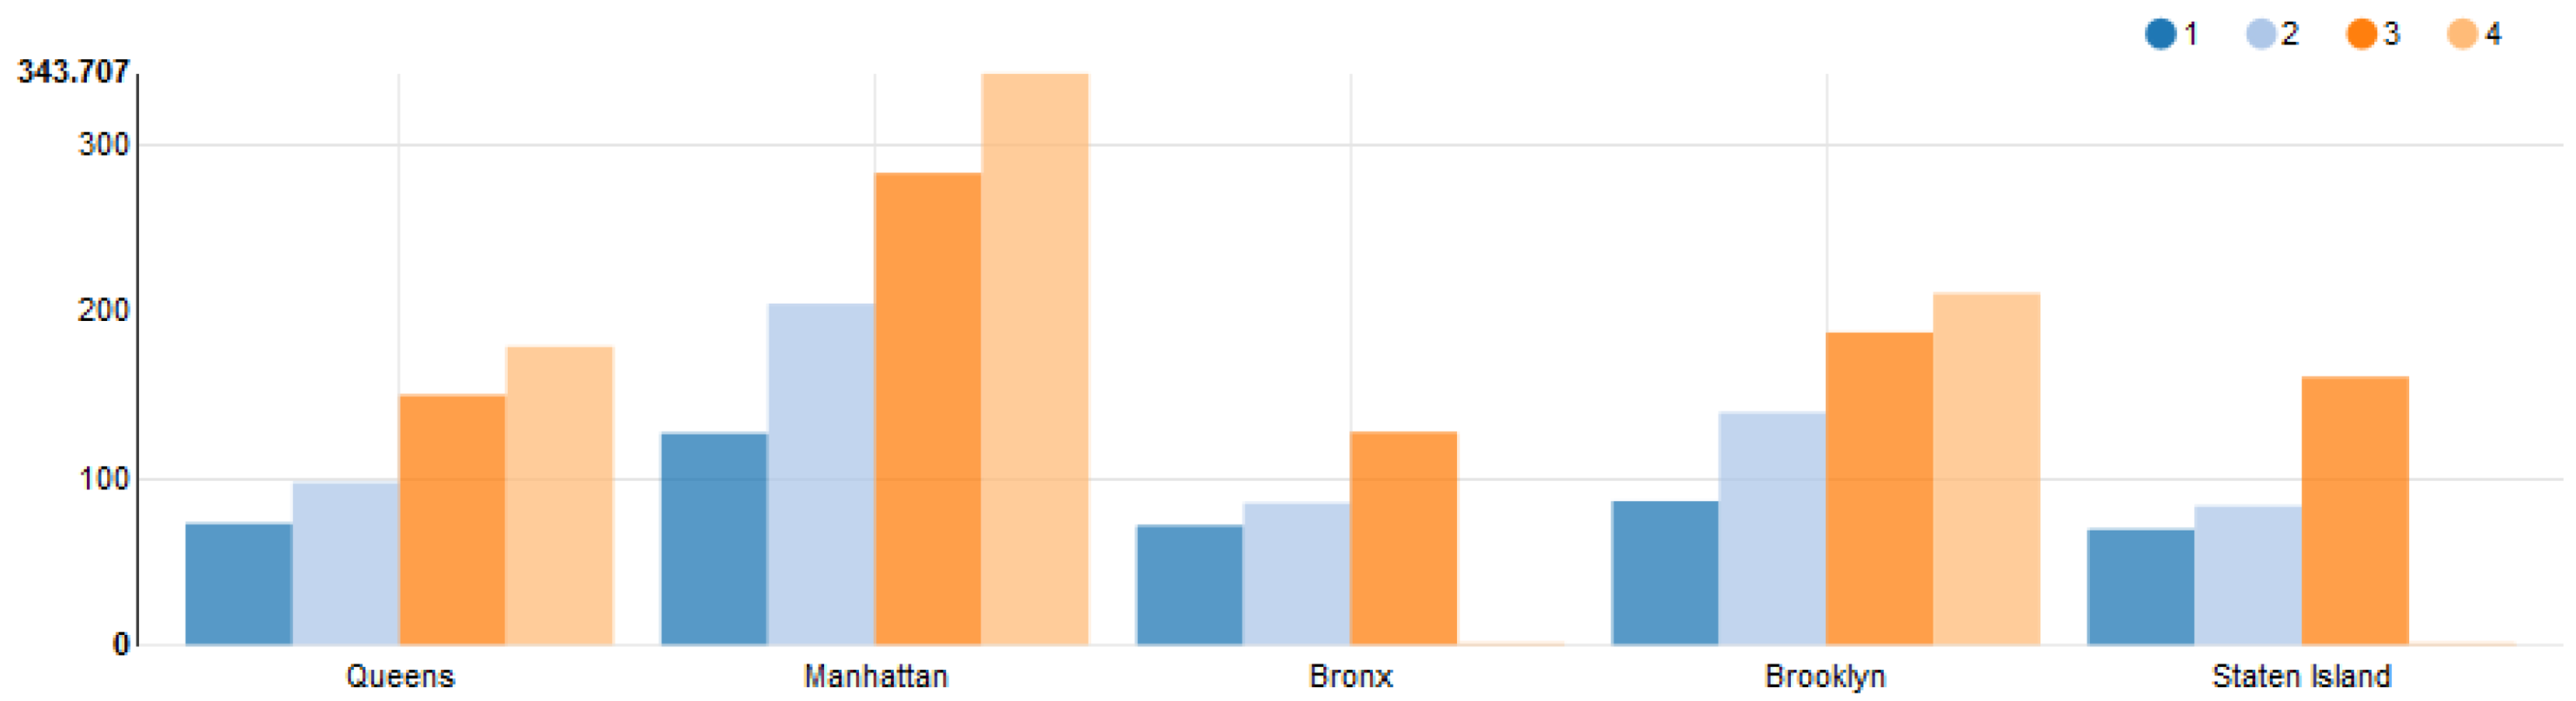
Figure 2.
Collinearity Among the Features
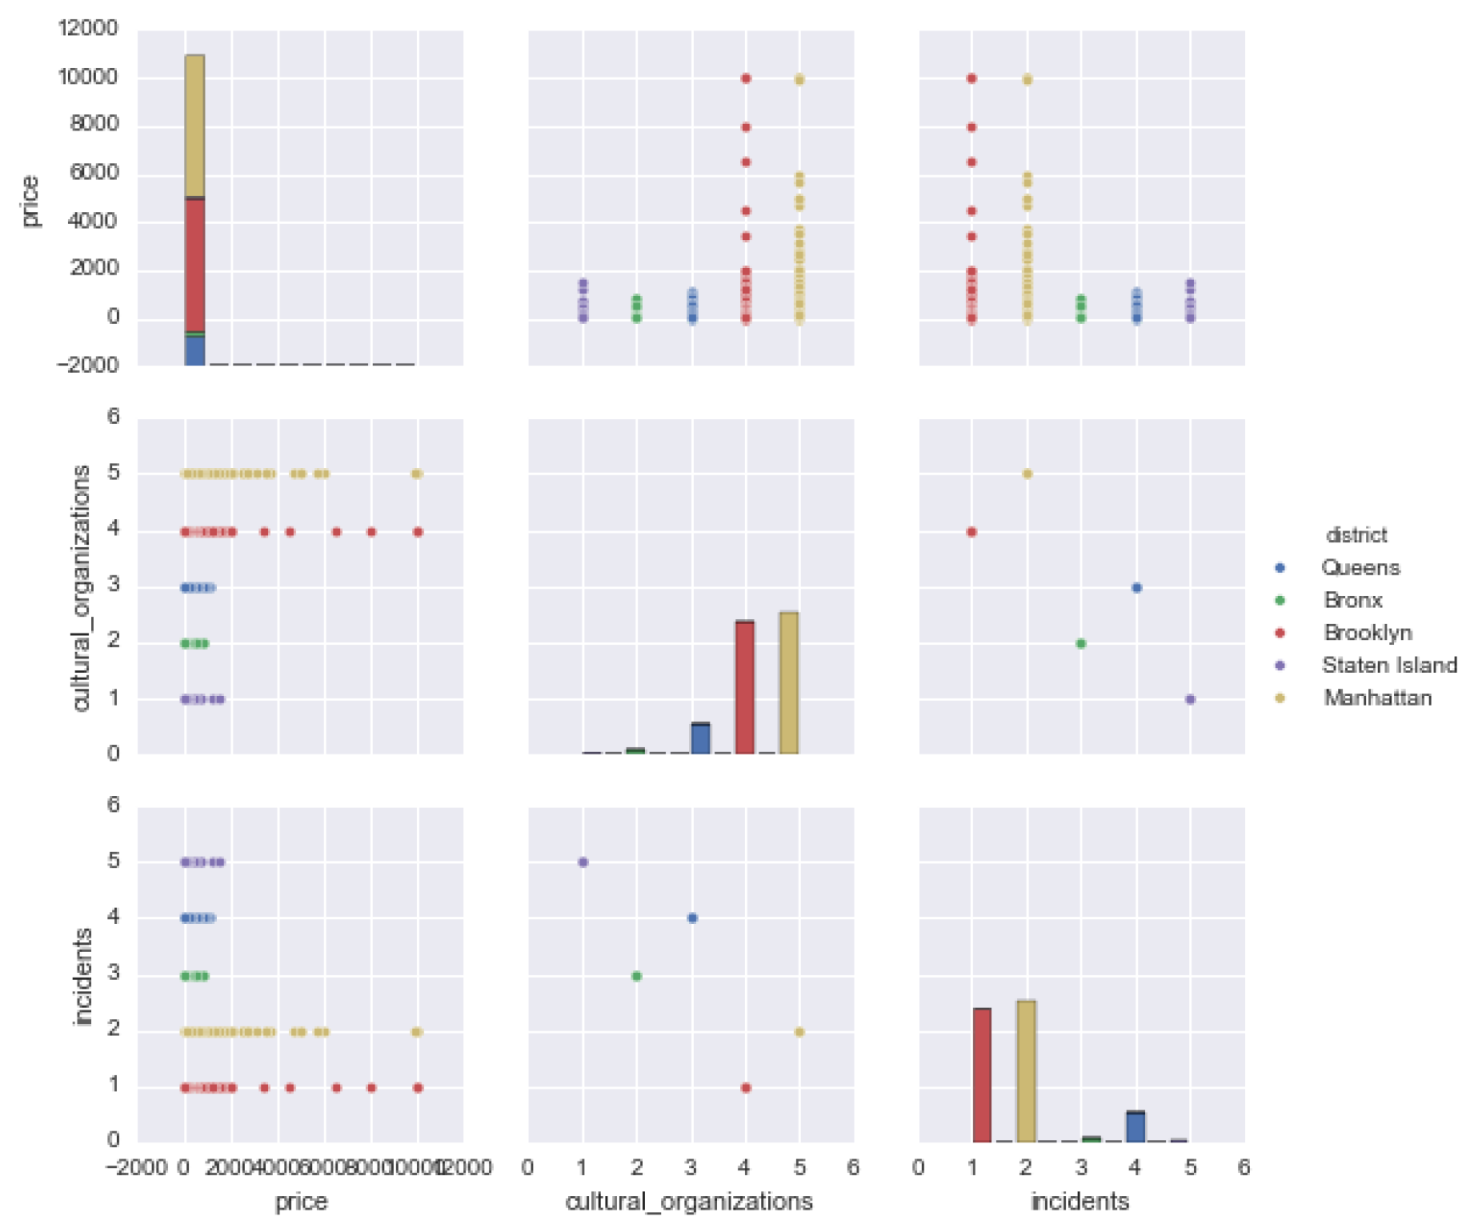
Figure 3.
Price Distribution Across Districts
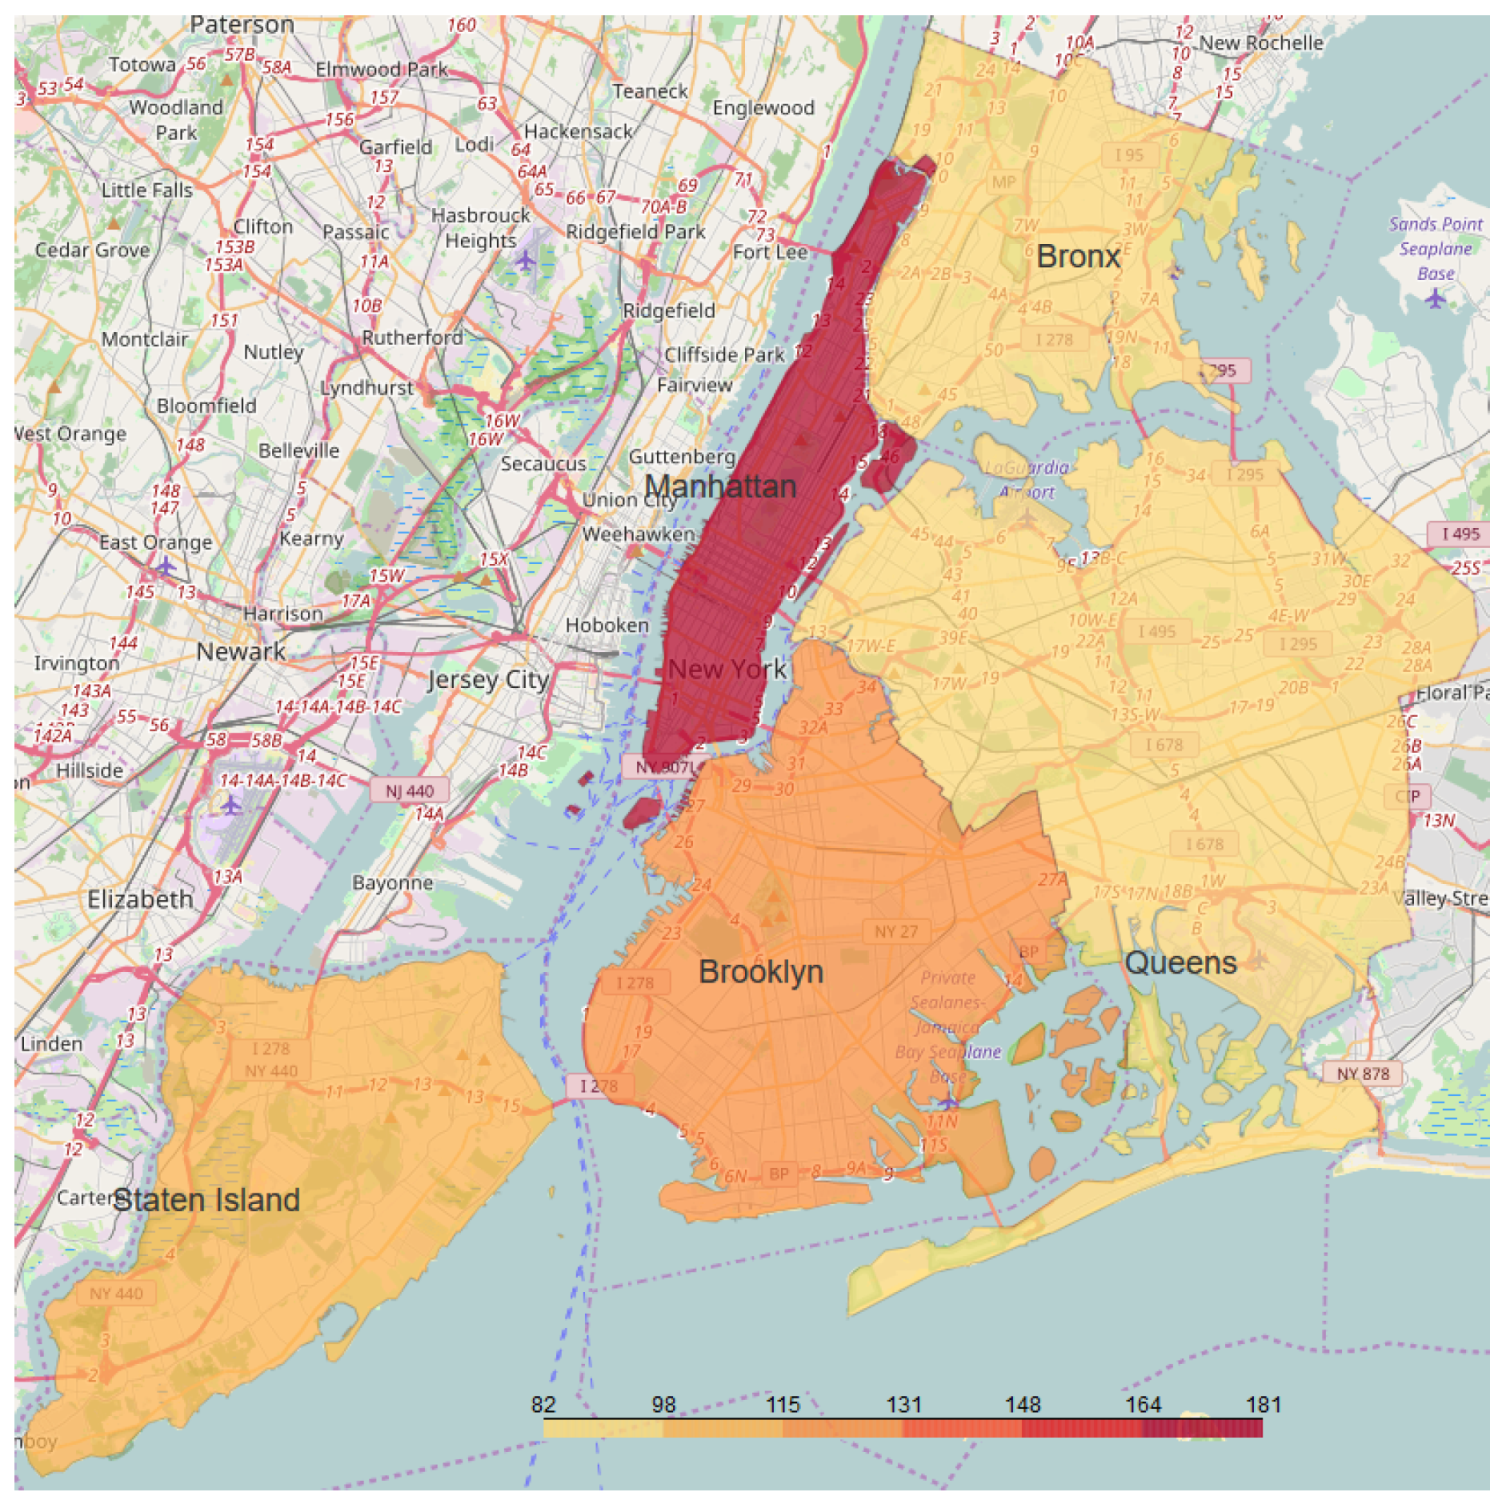
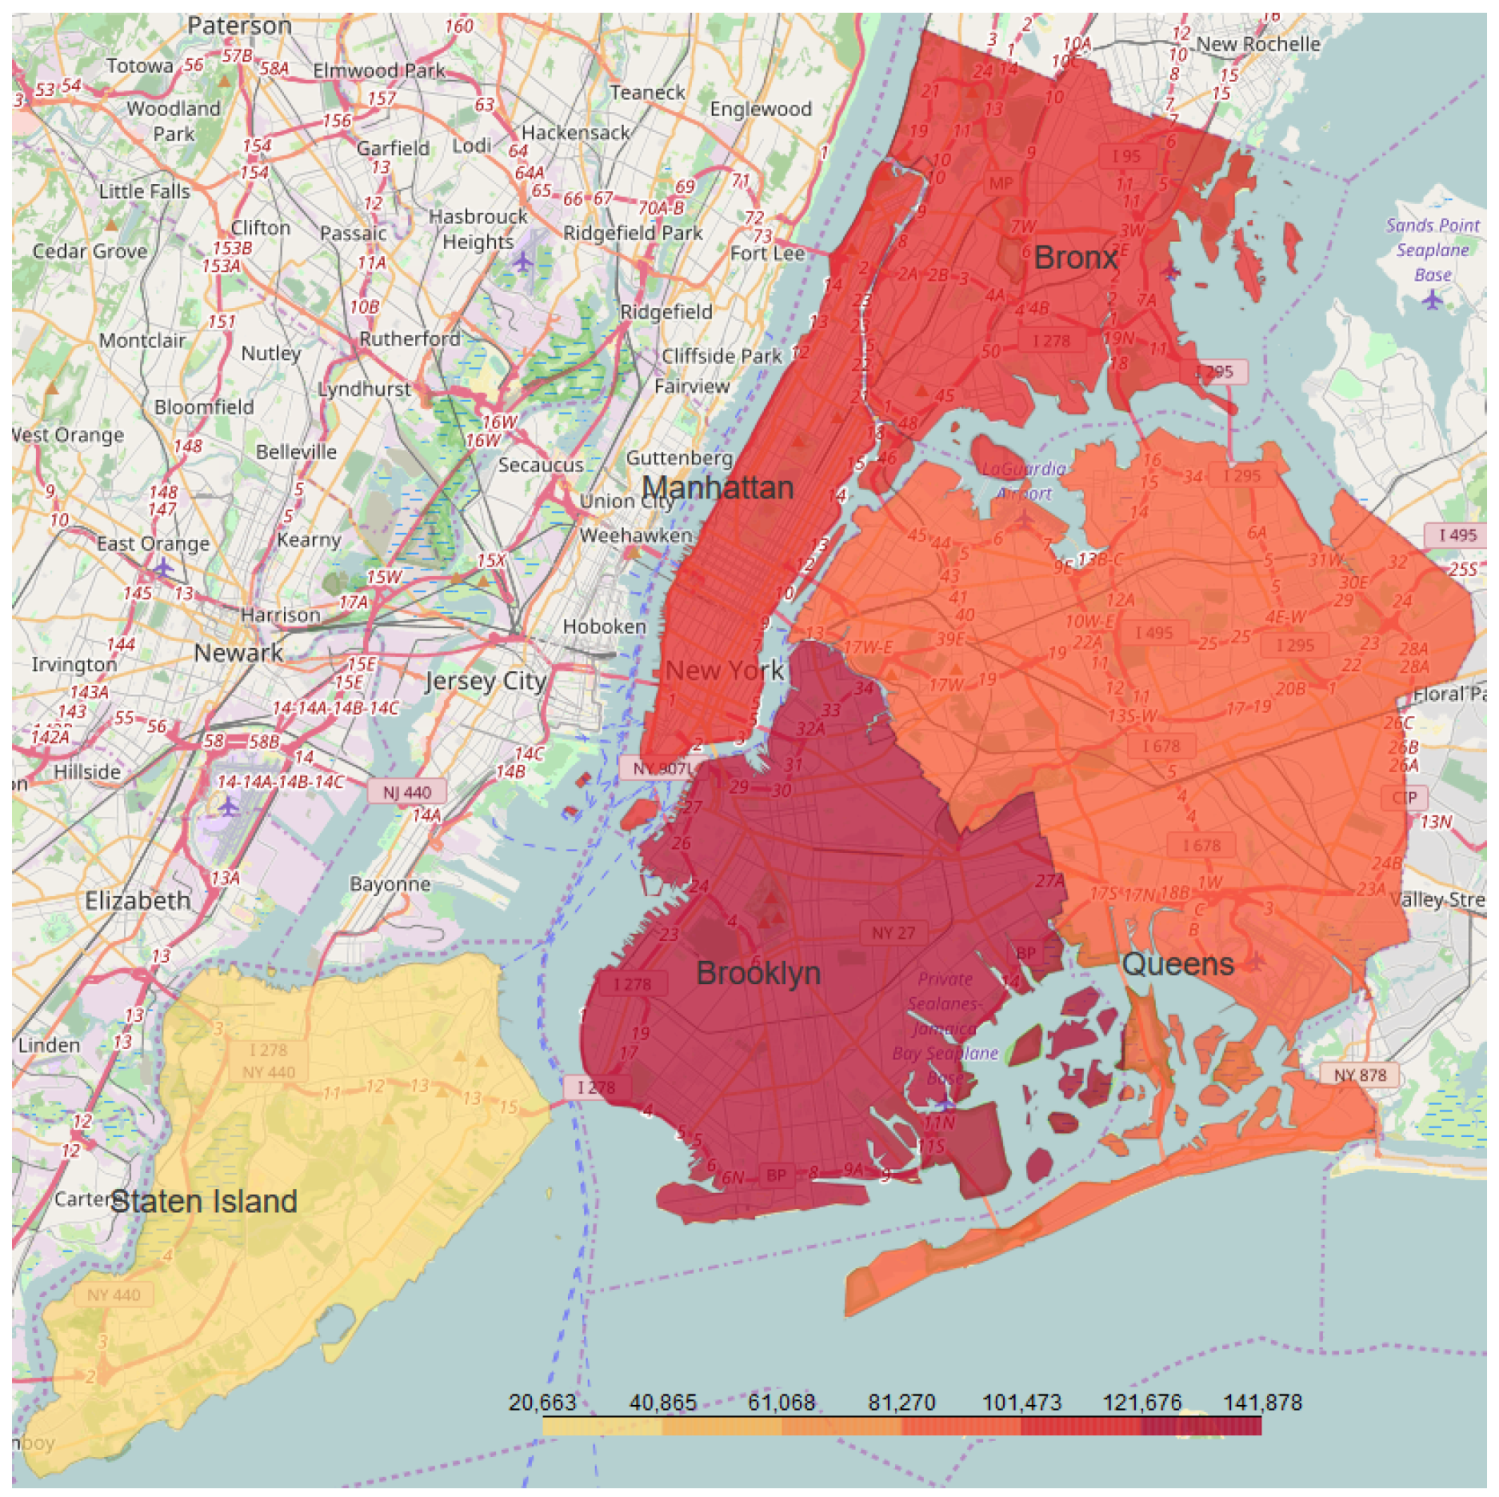
Figure 4.
Cultural Organizations Across Districts
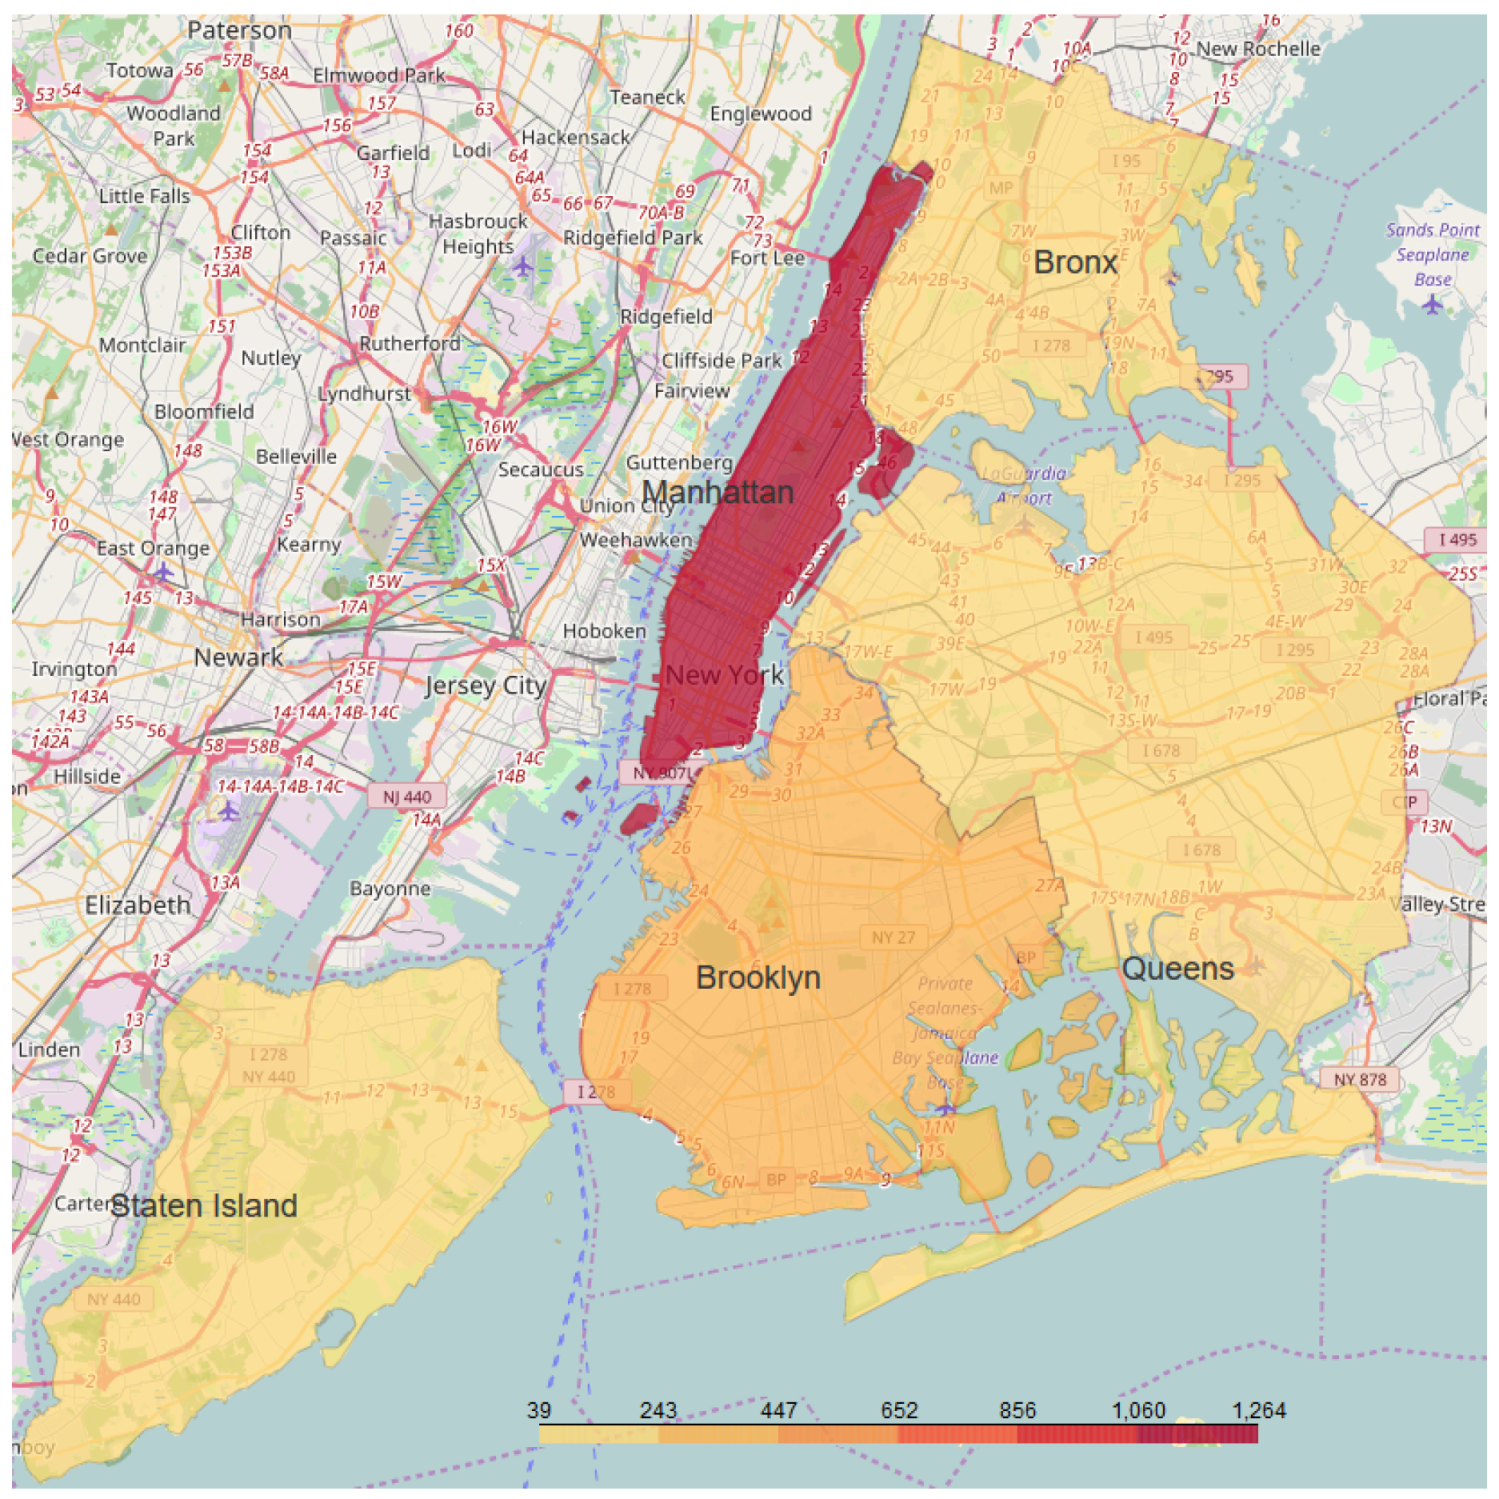
Figure 5.
Incidents Across Districts
To further analyze pricing factors, a machine learning approach was implemented. The dataset was split into an 80% training set and a 20% test set. The selected features included price, accommodates, bedrooms, beds, district, room type, cancellation policy, instant bookable, reviews per month, number of reviews, availability 30, and review scores rating. Categorical variables were transformed accordingly for model compatibility.
Seven regression models were evaluated: Linear Regression, Ridge Regression, Lasso Regression, Elastic Net, Bayes Ridge Regression, Orthogonal Matching Pursuit (OMP), and Gradient Boosting Regressor (GBR). Additionally, Decision Tree and Random Forest algorithms were used for classification. The GBR model underwent hyperparameter tuning using exhaustive grid search with cross-validation.
Figure 6 compares the regression models based on their Median Absolute Error (MAE), which is more robust to outliers than Mean Squared Error (MSE) and provides a direct price estimate.
The GBR model outperforms all others, achieving a Median Absolute Error of $23.86, which is approximately 31% lower than Lasso Regression ($34.59). The feature importance ranking for GBR, as shown in Figure 7, indicates that the most significant predictor is the Entire home/apt attribute, followed by accommodates, cultural organizations, and the Manhattan district. Notably, incidents have a minimal effect on price prediction. To further explore feature predictability, Decision Tree and Random Forest classifiers were applied to the three most influential features. Table 2 presents the classification results, highlighting the lowest test error values in bold. The Decision Tree model outperforms the Random Forest model, and predicting the accommodates feature proves to be the most challenging.
In conclusion, Queens and Bronx offer optimal trade-offs between price, cultural organizations, and incidents. Moreover, Queens surpasses the Bronx in accommodation diversity. Machine learning analysis indicates that the room type has a greater influence on price prediction than location. Additionally, cultural organizations strongly correlate with pricing, suggesting that areas with more cultural organizations tend to be more expensive and attract more incidents.
5. Problems Found
During the paper, several challenges were encountered that required adjustments and alternative approaches. One of the main issues was related to the listings dataset, which presented difficulties in reading and processing. To address this, a workaround was implemented using the R programming language, allowing the dataset to be successfully imported and manipulated. Future research could focus on refining data preprocessing techniques to enhance efficiency and reduce reliance on workarounds.
Another significant limitation was found in the evaluation metrics available in Apache Spark. The regression evaluator in Spark does not support the Median Absolute Error (MedAE) metric, which is crucial for robust performance assessment in regression tasks. To overcome this limitation, the scikit-learn library was used, as it provides built-in support for MedAE, ensuring a more accurate evaluation of model performance. This highlights the importance of carefully selecting evaluation tools to ensure reliable and meaningful results.
These issues underscore the need for improved data handling and model evaluation methods. Future studies could explore optimizing data processing pipelines and integrating additional evaluation metrics within Spark’s framework to enhance the reliability and efficiency of predictive modeling.
6. Conclusions
This paper introduces an analytical approach to investigating the relationship between cultural organizations, incidents, and Airbnb listing prices. The main objectives were to examine collinearity among selected features, predict listing prices using regression models, assess the influence of different factors on price prediction, and classify these factors using machine learning algorithms.
The analysis was conducted using data from New York City Airbnb listings, revealing important insights into urban dynamics. The findings suggest that neighborhoods with a higher density of cultural organizations also exhibit a greater probability of incidents. Furthermore, using Gradient Boosting Regression, a model was trained that achieved a Median Absolute Error (MedAE) of $23.91 for all listing data. Among the factors influencing price prediction, cultural organization density was identified as the third most significant.
In terms of classification, Decision Tree algorithms were employed to categorize key features while maintaining minimal test error. These results indicate the potential for further development of predictive models that could be applied in real-world scenarios to assess pricing dynamics in urban rental markets.
However, predicting listing prices remains a challenging task due to the right-skewed nature of the price distribution. Addressing this complexity requires further refinements in modeling techniques. Future work should explore the use of alternative regression methods, such as quantile regression or Bayesian approaches, to better handle skewed distributions. Additionally, incorporating a broader range of socioeconomic and geographic factors, such as population density, property market trends, and neighborhood characteristics, could enhance predictive accuracy.
Moreover, improving data processing strategies is essential to mitigate issues encountered during dataset import and model evaluation. Future research should also focus on refining classification techniques, potentially employing ensemble-based classifiers such as Random Forest and XGBoost to enhance interpretability and accuracy. These enhancements would contribute to the development of a more robust and practical model for assessing the impact of cultural infrastructure and urban dynamics on rental pricing.
References
- Xie, K.; Kwok, L. Understanding the impact of Airbnb on urban gentrification: A literature review and research agenda. Journal of Travel & Tourism Marketing 2020, 37, 708–722. [Google Scholar] [CrossRef]
- Gutiérrez, J.; García-Palomares, J.C.; Romanillos, G.; Salas-Olmedo, M.H. Airbnb’s spatial distribution: A global analysis using urban data science techniques. Annals of Tourism Research 2021, 89, 103209. [Google Scholar] [CrossRef]
- Zhang, L.; Fan, D.X.; Wen, H. The role of neighborhood safety in Airbnb pricing: Evidence from a machine learning approach. Tourism Economics 2022, 28, 1350–1370. [Google Scholar] [CrossRef]
- Lee, D.; Kim, H. Cultural tourism and Airbnb: Examining the impact of cultural institutions on short-term rental demand. Journal of Hospitality & Tourism Research 2023, 47, 456–472. [Google Scholar] [CrossRef]
- Airbnb, I. Listings. https://goo.gl/dT6m7H, 2017. Acessed Apr 2017. Date Compiled April 2, 2017.
- Department, N.Y.C.P. Incidents. https://goo.gl/gzZFg2, 2016. Acessed Apr 2017.
- of Cultural Affairs, D. Cultural Organizations. https://goo.gl/5jHzxa, 2017. Acessed Apr 2017. Last Update April 7, 2017.
- BetaNYC. NYC Borough. https://goo.gl/gWP1yp, 2015. Acessed Apr 2017.
Figure 6.
Price Prediction - Median Absolute Error
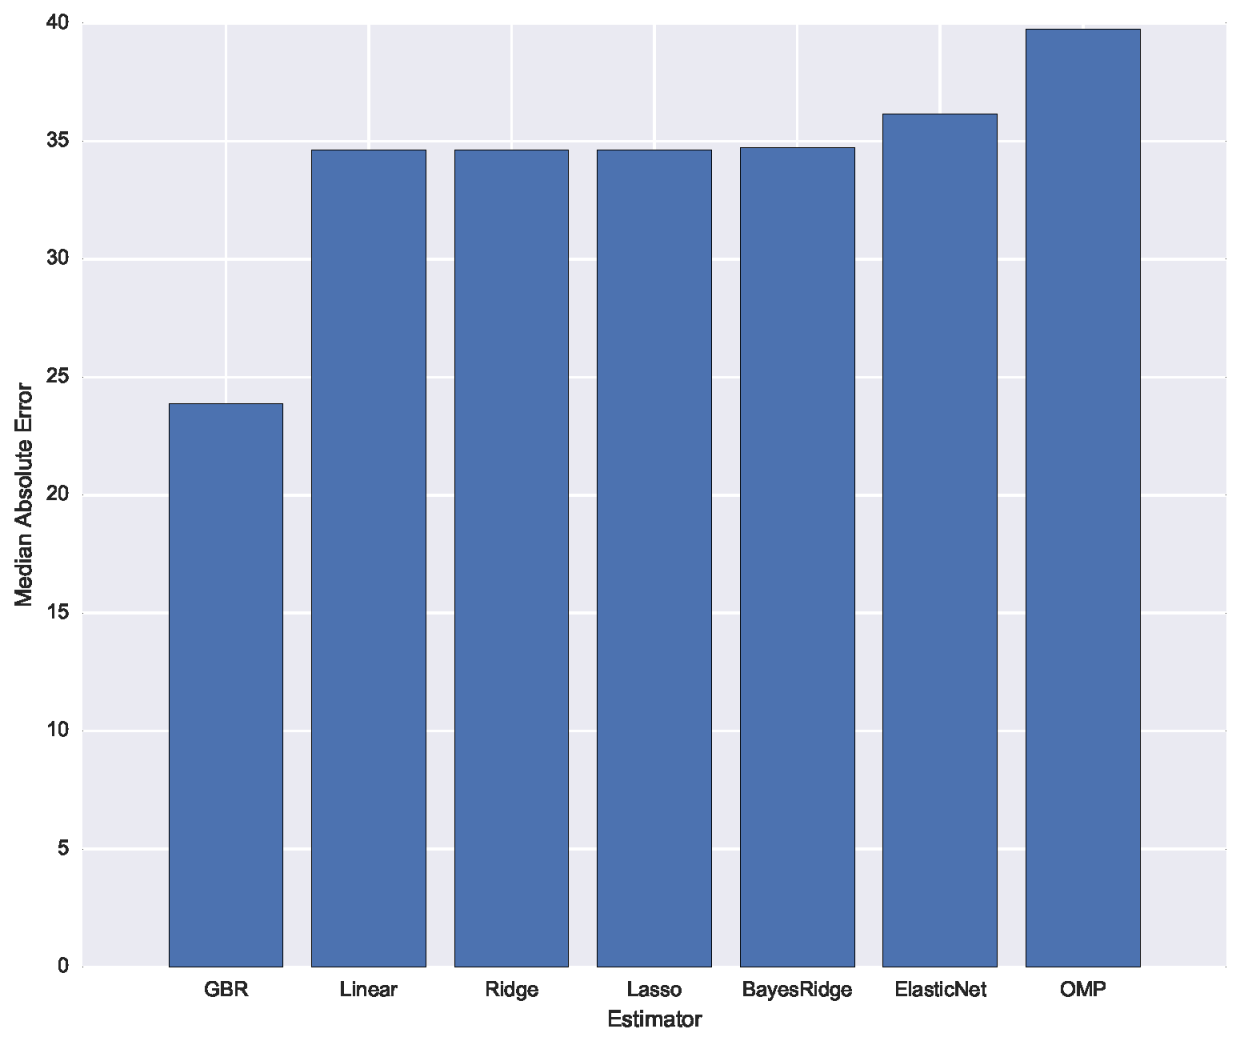
Figure 7.
Feature Importance - Gradient Boosting Regressor
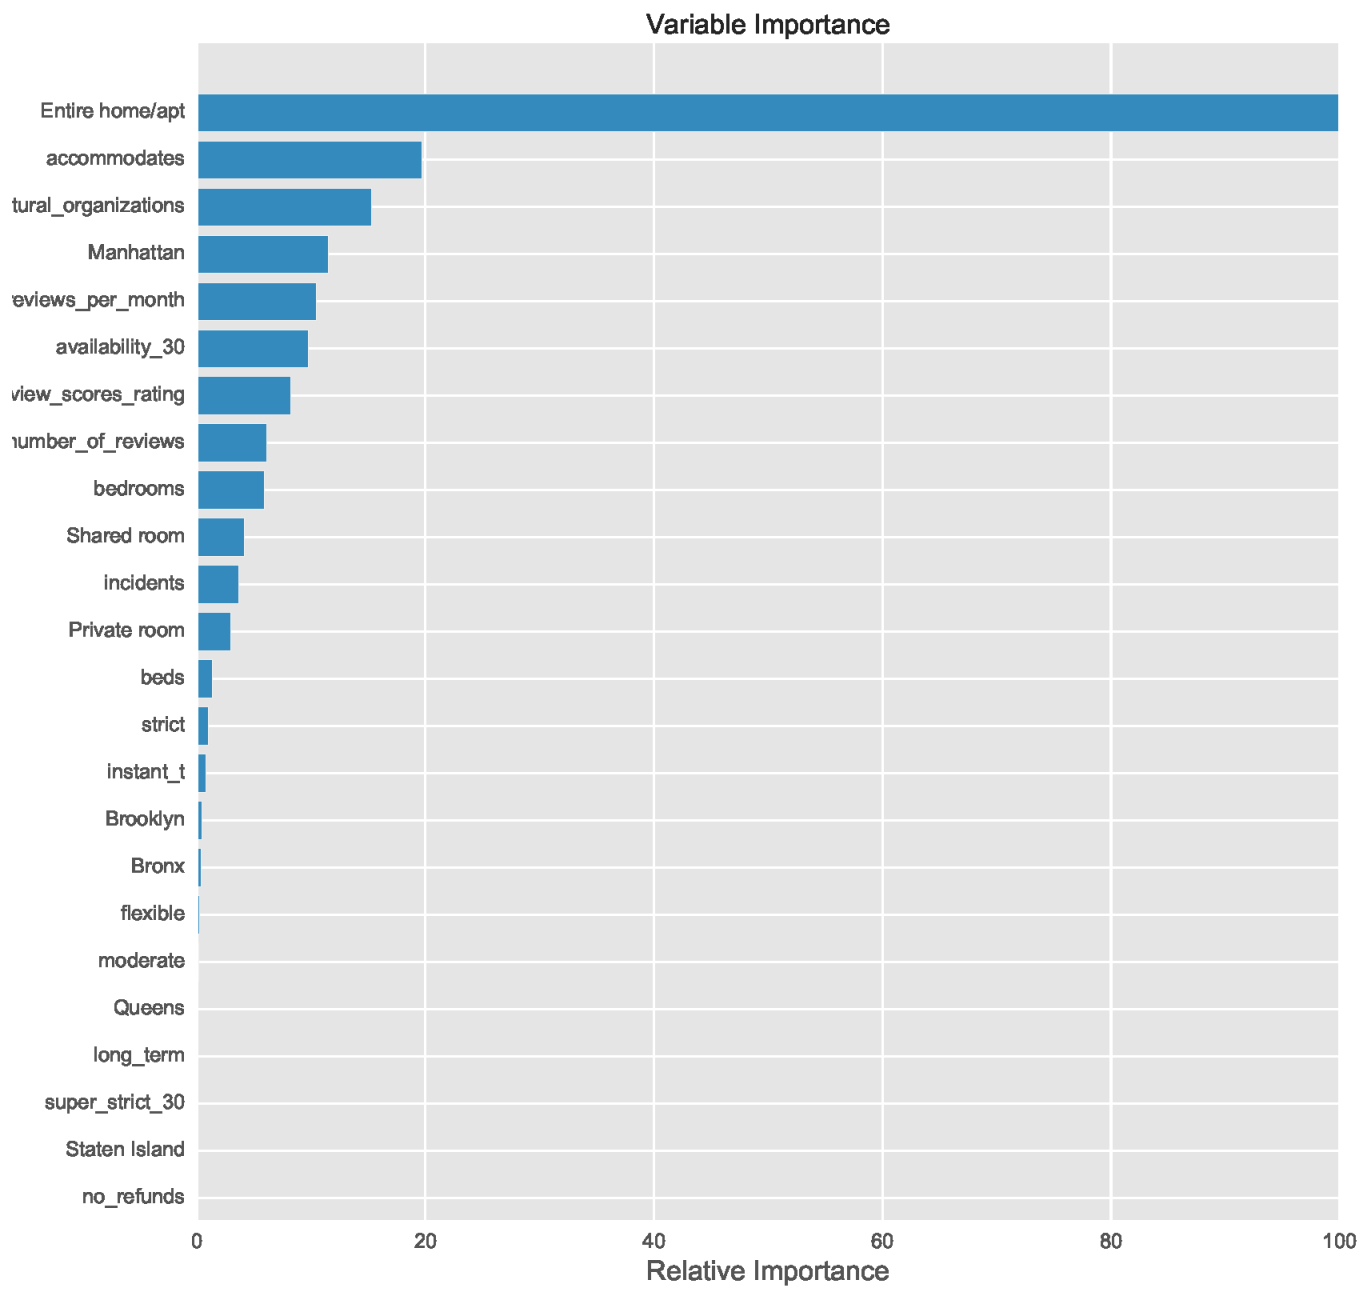

Table 1.
Data sets used in the experiment
| Dataset | Description | Size | Format |
|---|---|---|---|
| Listings [5] | Detailed listings data, including various attributes (features) of each listing such as number of bedrooms, bathrooms, location, etc. | 153,7MB | csv |
| Incidents [6] | All valid felony, misdemeanor, and violation crimes reported to the New York City Police Department for all complete quarters in 2016. | 124,2MB | csv |
| Cultural Org. [7] | Listing of all Cultural Organizations in the Department of Cultural Affairs directory (2017). | 333,3kB | csv |
| NYC Borough [8] | Polygon boundaries of boroughs (water areas excluded). | 400,5kB | GeoJson |
Table 2.
Classification Performance by Feature Importance
| Feature | Decision Tree | Random Forest |
|---|---|---|
| Entire home/apt | 0.0000 | 0.0009 |
| Accommodates | 0.4115 | 0.4151 |
| Cultural Organizations | 0.0000 | 0.0000 |
Disclaimer/Publisher’s Note: The statements, opinions and data contained in all publications are solely those of the individual author(s) and contributor(s) and not of MDPI and/or the editor(s). MDPI and/or the editor(s) disclaim responsibility for any injury to people or property resulting from any ideas, methods, instructions or products referred to in the content. |
© 2025 by the authors. Licensee MDPI, Basel, Switzerland. This article is an open access article distributed under the terms and conditions of the Creative Commons Attribution (CC BY) license (http://creativecommons.org/licenses/by/4.0/).
Copyright: This open access article is published under a Creative Commons CC BY 4.0 license, which permit the free download, distribution, and reuse, provided that the author and preprint are cited in any reuse.


