
Submitted:
14 July 2025
Posted:
15 July 2025
You are already at the latest version
Abstract
The present study aimed to quantify changes in spinal kinematics during Nordic walking compared to regular walking for 60 seconds on a training path among physically fit young males (n = 20, aged 19–22 years). Two walking speeds were analyzed: 3 km/h and 5 km/h. The experimental setup was designed to assess spinal angular rotations using five kinematic parameters: upper spine, lower spine, thoracic region, lumbar region, and pelvis. The data is acquired from 9 compact inertial sensors and the following motion analysis is carried out using 3D MioMotion IMU sensor’s analysis system. The differences in the obtained cyclic biomechanical parameters are detetcted using functional ANOVA (fANOVA) statistical tests. The key finding of the study is that Nordic walking significantly alters the angular kinematic pattern of spinal movement by revealed significant differences in all five measured parameters when compared to normal walking. Notably, the most pronounced changes were observed in the upper spine and pelvis motion. Additionally, the influence of Nordic walking on the two phases of the gait cycle, the stance and swing phases, was evaluated: i) significantly increased the duration of the stance phase in all three planes of motion; ii) significantly increased the velocity during the stance phase across all three planes. These reported findings highlight the biomechanical, preventive, therapeutic, and rehabilitative potential of Nordic walking.
Keywords:
nordic walking kinematics
; spine movement analysis
; upper spine kinematics
; lower spine kinematics
; pelvis kinematics
1. Introduction
Nordic walking (NW) has gained popularity under various names such as ski walking, walking with sticks or fitness walking. This sport appeared with the original purpose of filling the break of the ski season. Nordic walking is a combination of cross-country skiing and regular walking. It can be practiced all year round and anywhere. NW originated in Finland a few decades ago. In recent years, it has become extremely popular and more than 14 million people are already using it as a means of maintaining their condition worldwide. In recent years, NW has been widely used by both athletes in training and by ordinary people for health. It is done with walking sticks, as an aid to traction, better stability and inclusion of the hands when moving [1]. Although relatively recent, its international development is significant due to its advantages [2,3,4,5,6,7].
Nordic walking (NW) has gained popularity under various names such as ski walking, pole walking, or fitness walking. Originally developed to fill the gap during the off-season for cross-country skiers, NW combines the techniques of cross-country skiing and regular walking. It can be practiced year-round and in a variety of environments. Nordic walking originated in Finland several decades ago and has since become a global phenomenon, with over 14 million people worldwide now using it as a means of maintaining physical fitness.
In recent years, NW has been widely adopted by both professional athletes for training and by the general population for health improvement. The activity involves the use of specially designed poles, which aid in propulsion, enhance stability, and engage the upper limbs during locomotion [1]. Despite being a relatively recent discipline, its international adoption has been significant, largely due to its wide-ranging health benefits [2,3,4,5,6,7].
The use of poles in NW provides numerous benefits, including:
- Engagement of upper limb muscles [3];
- Facilitated movement through reduced muscular effort and lower limb load;
- Increased total body energy expenditure due to upper limb involvement;
- Reduced mechanical load on lower extremities [4];
- Enhanced overall endurance [5];
- Decreased vertical ground reaction forces on the legs—NW promotes higher ground reaction force (GRF) and speed compared to regular walking [6];
- Reduced stress on the knee and hip joints [3];
- Offer a potentially effective approach for reducing pain and fatigue in individuals living with chronic conditions [10];
- Useful therapeutic intervention for improving the exercise capacity and gait technique in male ischemic heart disease patients [11];
- The combination of NW training and time-restricted eating is a welltolerated intervention for individuals with an abnormal body composition [12].
- Demonstrated notable enhancements in glycemic control and aerobic capacity in individuals with type 2 diabetes and a normal BMI [13];
- 8.6 months of NW training is effective in preventing/delaying the sarcopenia among postmenopausal women with NAFLD and pre-diabetes [14];
Nordic walking (NW) is recognized as a form of physical activity with substantial overall health benefits. It provides superior short- and long-term effects on the cardiorespiratory system compared to regular walking. Short-term physiological responses include increased heart rate, VO₂ uptake, respiratory exchange ratio, lactate thresholds, and caloric expenditure, alongside improvements in lipid profiles [7]. Additionally, NW has been shown to enhance core stability [21], positively affecting resting heart rate, blood pressure, exercise capacity, maximal oxygen consumption, and overall quality of life.
NW involves the active engagement of upper body muscles, which remain largely underutilized during regular walking, while simultaneously reducing the load on the lower extremities [1,2,3]. It recruits over 90% of the body's muscles—compared to less than 70% during normal walking. Energy expenditure increases by 20–40%, promoting a balanced full-body workout. NW stimulates the cardiovascular system, improves coordination and balance, strengthens the thighs, knees, and ankles, boosts mood, and helps reduce stress levels. It also facilitates recovery from musculoskeletal pain and lowers the risk of injury [13,22,23,24,25,26].
Various gait modification techniques—such as reduced walking speed, toe-out gait, medial thrust gait, increased trunk sway, and assisted walking with pole supports—have been reported to effectively reduce joint loads and contact forces [27,28,29].
Global literature reports diverse findings regarding the kinematic and biomechanical changes associated with NW in comparison to regular walking (i.e., without poles) [1,2,3,4,5,6,7,21,22,23,24,25,26,27,28,29,30]. For instance, in a 2024 study involving older adults, Szpala et al. concluded that anticipated biomechanical advantages of NW—such as reduced cadence and enhanced joint mobility—were not observed [30]. However, the study was limited by a small sample size of only seven participants.
From a biomechanical standpoint, NW is frequently compared to regular walking to assess whether pole use influences joint loading. Most studies focus on the lower limbs, particularly the knee joint, but results remain inconclusive and sometimes contradictory [31,32,33,34,35,36].
Numerous studies have demonstrated the metabolic effects of NW [37,38,39,40,41]. Most report an increase in oxygen consumption of 18–25% compared to walking at the same speed [42,43]. It is also known that energy expenditure in NW varies depending on factors such as terrain inclination [44,45]. However, there is a lack of studies exploring whether variations in NW technique affect physiological responses to exercise, although some research suggests this as a plausible hypothesis [42,46].
There is also a noticeable gap in the literature regarding comparisons between free gait and NW gait in healthy elderly individuals, especially with a focus on spinal kinematics [30]. Most existing studies concentrate on NW as a training modality for improving functional efficiency in elderly populations or for managing conditions associated with circulatory, vascular, musculoskeletal, or neurological disorders [30].
Тhe present study aimed to quantify alterations in spinal kinematics during Nordic walking in comparison to regular walking among physically fit young males, using two walking speeds: 3 km/h and 5 km/h. A functional ANOVA (fANOVA) statistical approach was employed to analyze the data and identify statistically significant differences in cyclic biomechanical parameters.
2. Materials and Methods
2.1. Participants and Measurements
In this study were tested twenty (n=20) male students in the 19-22 age range . They completed an injury record and were informed in detail about the aim of the experiments and the procedure. All participants provided informed consent. The experimental procedure was approved by the Scientific Council of the Anatomy and biomechanics Department, NSA “Vassil Levski”, Sofia, Bulgaria, ПР2/31.01.2020.
All experimental measurements were performed on a training path, allowing the selection of a constant walking speed (Figure 1). Two slow walking speeds of 3 and 5 km/h were chosen due to the fact that Nordic walking is practiced unprofessionally mainly by the elderly.
The experimental model used contains four types of walking for 60 seconds, which following one after the other. It was recorded of certain quantitative parameters:
- -
- normal walking at a speed of 3 km/h on a training track for 1 minute;
- -
- Nordic walking at a speed of 3 km/h on a training trail for 1 minute;
- -
- normal walking at a speed of 5 km/h on a training track for 1 minute;
- -
- Nordic walking at a speed of 5 km/h on a treadmill for 1 minute.
Each of the study participants conducted these four types of walking. An analytical formula was used to determine the length of the poles used, taking into account the height of the particular participant.
Using the 3D MioMotion IMU sensor’s analysis system (Noraxon) motion analysis is carried out using compact inertial sensors, which are placed on Figure 2 selected placements under body segments. The data is acquired from 9 IMU sensors positioned in groups of 3 items on left lower and upper limbs and on the spine (Figure 2). From this interaction structure five parameters are studied in all 3 spatial directions for two different speeds - 3 and 5 km/h - Upper spine, Lower spine, Thoracic, Lumbar, Pelvis. All tests were repeated for Normal and Nordic walking.
2.2. Data Models
The standard statistical theory is designed to deal with independent and identically distributed (i.i.d.) data. However, the assumption of independence does not hold for many biomechanical data. As a result, the analysis is performed using Functional data analysis (FDA). It is a branch of statistics which analyzes observations treated as functions, curves, or surfaces. In particular, the obtained time point data observed in this experiment can be transformed into functional data. This is a usual approach for similar cases. For more information, see [47].
The Nordic walking tests are performed for 20 fit athletic students (). The measurements are split on two paired experiments for participants walking with speeds of and km/h. They are measured for more than time points. In aim to get a common grid, the data is aggregated to equally spaced intervals of length representing the complete movement cycle (% stance).
The data consist of groups and explained by functions , where and . In terms of our paired experiment, , and the measurements are bounded in the interval (%stance) . These functions are stochastic process, with mean function and covariance function . We follow strictly the definitions and assumptions in [48], where is defined in , a Hilbert space consisting of square integrable functions on .
The genral functional test is Functional One-Way ANOVA (analysis of variances). It compares the means of studied groups determining whether there is statistical evidence that the population means are equal (not significantly different):
There are many methods how to measure the statistical significance for validity of against the alternative hypothesis for significant difference (). All of them rely partly or completely on sample group mean functions:
The between subject () and within-subject variations () are obtained from:
(1.1)
(1.2.)
Finally, from the common covariance function can be derived and .
The theory has been expanding largely with development of many different tests for years. But most of the popular of them rely on pointwise F-test statistics, derived from (1.1) and (1.2), and as it is described in [36] equal to:
Then, the test statistics is:
For large number of observations or Gaussian samples, the p-values are obtained by approximation -distribution by . The widely addopted F-type tests are naive (FN) and bias-reduced methods (FB). Another popular approach is to use L2-norm based tests, naïve (L2N) and biased-reduced (L2B) variants. All of them are well explained in [48]
The t-test statistic for paired data of a sample of random variables with pair difference , is yielded from
where and the sample variance is . However, when we consider functional data, the basic statistic differs and it is obtained from SSA(t):
However, more powerful criteria is derived from unbiased estimators of covariance function and asymptotic covariance function :
Having them, the modified statistics similar to pointwise F-test for analysis of variances is:
Another, even more powerful statistics can be obtained from:
The statistics outperforms in cases of high and moderate correlation between observations at any two different time points. Actually, the tests based on the test statistics and are more powerful testing procedures than , which we will not consider. More detailed explanations are available in [49,50].
For visual data analysis the results are presented with graphs of group trajectories with their overall data means and their pointwise SSA(t) statistic plots. Their role is to outline stance (phase) dependent differences between two groups. The numerical estimates for differences are obtained from Dn(t) and En(t) p-values. The computations rely on permutation approach proposed by [50,51]. For this work it is considered P1 permutation model because its best performance for and in case when according [52]. For implementation, it is used the rmfanova library [52] in R statistics [53].
3. Results
The used and described experimental setup was designed to assess the angular rotations of the spine in the three directions (Figure 3). By comparing the results obtained for the two types of walking, we obtained information about the 3D Spine kinematic alterations in NW under two different speeds of 3 and 5 km/h for five parameters studied Upper spine, Lower spine, Thoracic, Lumbar and Pelvis.
3.1. Upper Spine
By examining the upper spine graphs obtained (Figure 4, Figure 5 and Figure 6) we can note especially in the case of upper spine pitch (Figure 5) that we have a real difference of around 3 degrees angle for whole cycle which should be put on quantitatively.
After applying the modified statistical approach the obtained data for all directions are plotted for all measured trajectories and mean values for Normal and NW samples (Figure 4, Figure 5 and Figure 6).
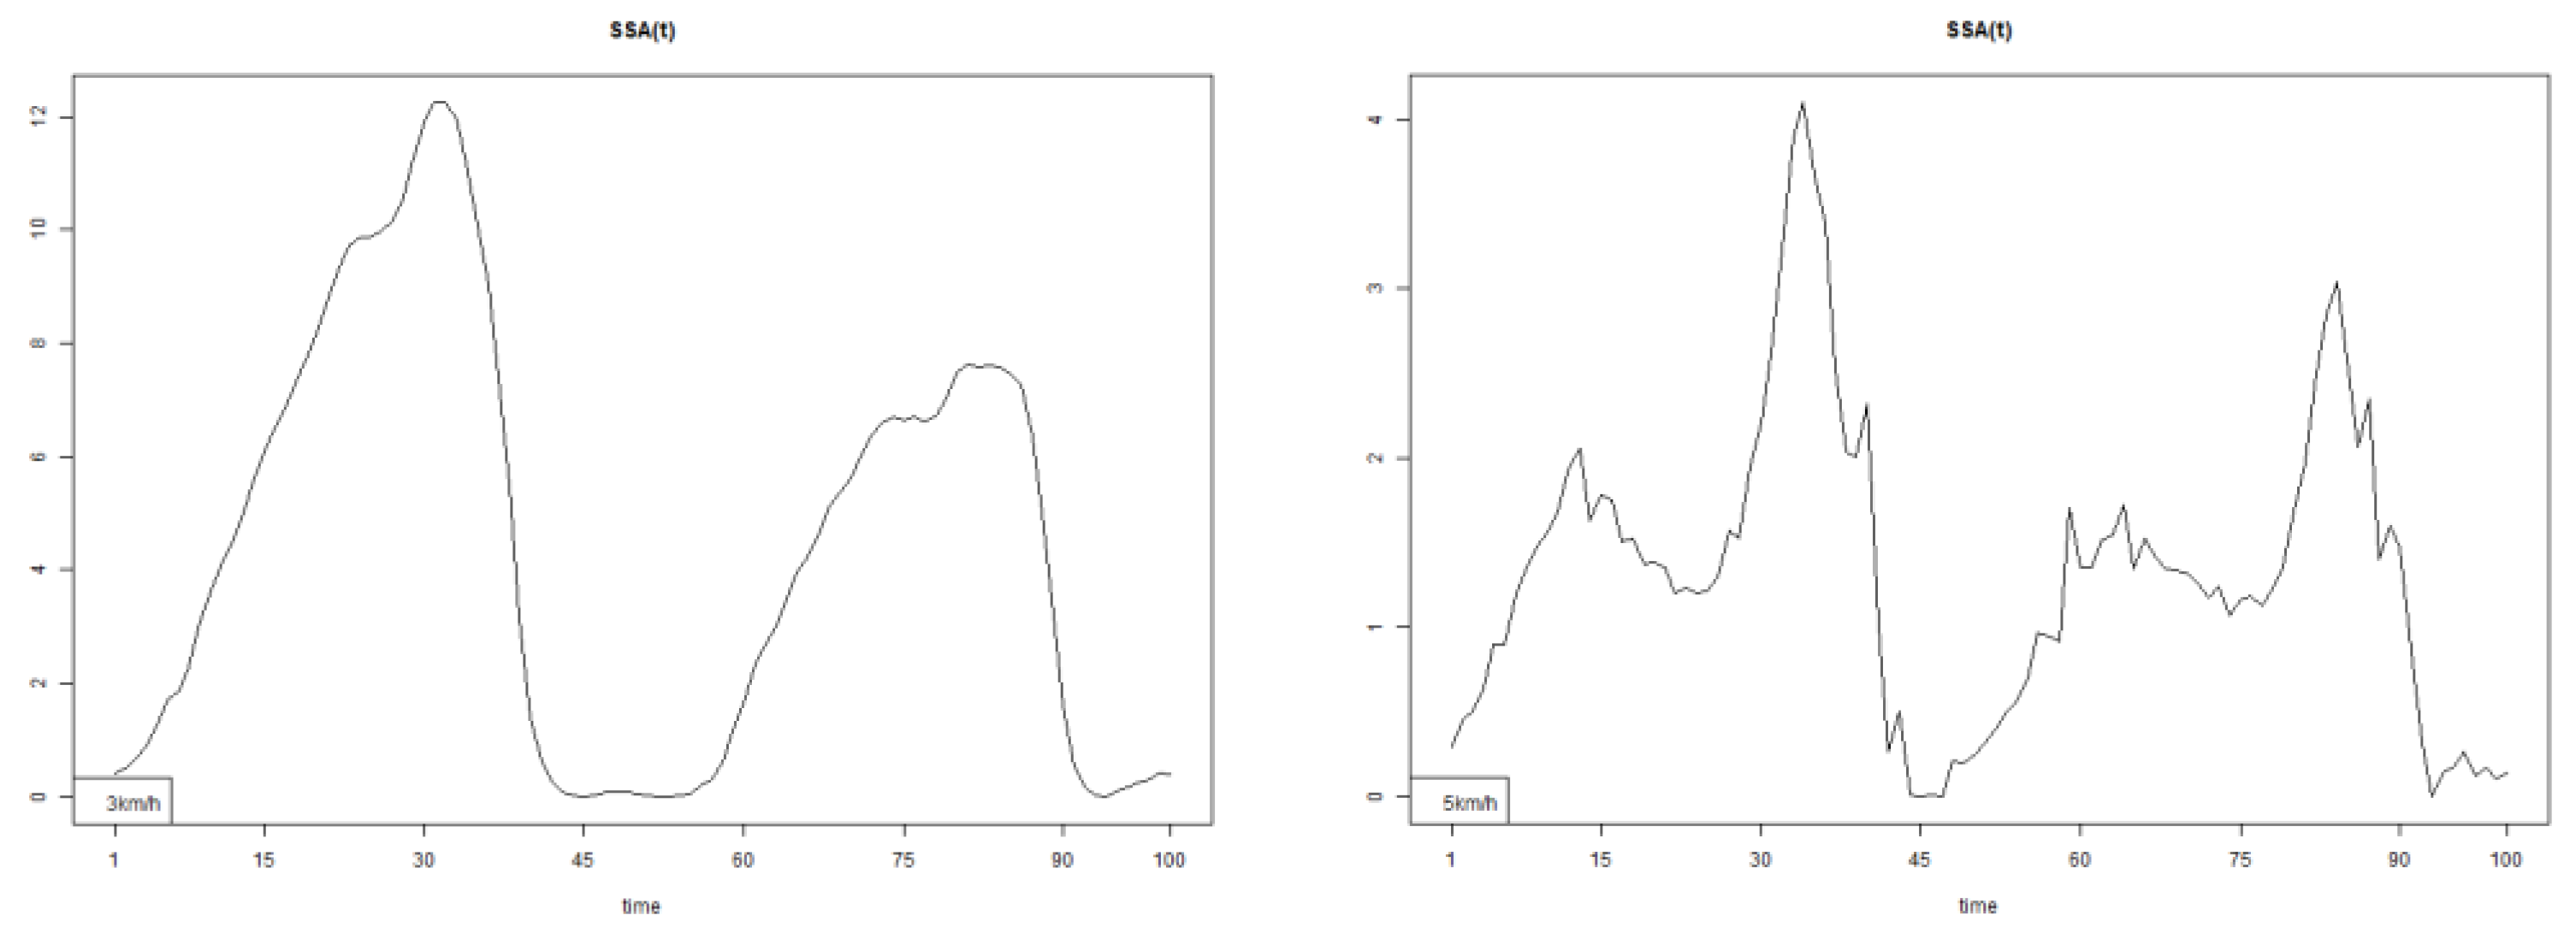
All statistics show statistical differences (Table 1) at particular parts of rotation cycle detected by SSA(t) –
The all -direction plots and results are listed below in following order - course, pitch, roll for both walking speeds.
The pointwise statistic’s estimates in which part of the cycle we have clearly expressed statistically significant differences in SSA(t). It can be seen that this statistical differences varies according the concrete cycle. The level of the maximum of the curves on Figure 7, Figure 8 and Figure 9 (as with all similar graphs further down in the text for the other measured parameters) indicates a significant difference at the corresponding location of the corresponding cycle for concrete parameter. The maximum values of the SSA(t) curve show the cycle points at which we have the maximum statistically significant difference between the compared walking modes. The minimum values of the curve (near to 0) show the cycle points at which the twist trajectories coincide.
For instance, for Upper spine pitch we can see that throughout the entire cycle we have a statistically significant difference in favor of 20-50 degrees of squared error of the angle difference (Y axes scale of SSA(t)). This is not the case with the other two parameters. This means that the statistical model proposed by us sensitively and accurately reflects the differences throughout the entire walking cycle.
The structure of the results presentation for the remaining four parameters is the same as the presentation in this paragraph.
3.2. Lower Spine
3.3. Thoracic
The plots for thoracic flexion, axial and lateral data of two walking velocities (3 km/h data is on left, 5 km/h data is on right) are shown in (Figure 16, Figure 17 and Figure 18).
There are some particular points on stance cycle range that imply differences. They are outlined by the highest values of pointwise SSA(t) and F(t) plots (Figure 19, Figure 20 and Figure 21).
The all -direction plots and results are listed bellow in following order - flexion, axial, lateral rotations for both walking speeds.
3.4. Lumbar
The plots for lumbar flexion data of two walking velocities (3 km/h data is on left, 5 km/h data is on right) is below:
3.5. Pelvis
The tests result for all 3 directions are listed below. The plots for pelvis course data of two walking velocities (3 km/h data is on left, 5 km/h data is on right) is below:
All pointwise SSA(t) statistics show differences at particular parts of rotation cycle (detected as higher values) (Table 1). The all -direction plots and results are listed below in following order - course, pitch, roll for both walking speeds.
The outlined differences in plotted pointwise SSA(t) results imply that walking with poles significantly changes the kinematic structure of walking. This observation is tested for all studied parameters and confirmed numerically for many of them. The tests’ results are presented by their p-values obtained from Dn(t) and En(t) statistics in Table 1.
These changes, as we showed above, have an angular component, but what happens in the relationship between the two phases of walking, the stance phase and the swing phase, is interesting to be clarified. So we included in our study an additional Mann-Whitney U statistical comparison between Normal and NW for three parameters – Range, Duration and Velocity of the walk cycle for upper spine course parameter. These three parameters were obtained for every tested participant from Noraxon software automatically.
The additional comparison is performed using Mann-Whitney U test due to small sample size. The tested Null hypothesis (H0) is that both paired groups come from the same non-parametric distribution with no difference in medians. All results are tabulated in Table 2.
The results obtained in this statistical comparison (Table 2) strictly confirmed the change in the kinematic temporal structure of walking in both the stance phase and the swing phase.
4. Discussion
The pointwise SSA(t) graphs illustrate the specific phases of the gait cycle where statistically significant differences occur, complementing the overall results presented in Table 1. For instance, the peaks in Figure 7, Figure 8 and Figure 9 (as well as the similar trends in Figures 13–15, 19–21, 25–27, and 31–33) indicate the locations within the cycle where statistically significant differences are observed for specific parameters. This provides more detailed insights into exactly where in the cycle these differences occur, enhancing our understanding of how NW affects kinematic patterns in tested participants.
From a practical perspective, these results highlight the phases of the gait cycle where NW exerts a pronounced influence on spinal movement and kinematic structure compared to normal walking.
According to Huang et al. (2021) NW requires a forward torso inclination, which typically results in a reduced torso flexion angle [56,57] and increased activation of trunk muscles [58]. However, scientific studies examining the effect of NW on spinal posture remain limited [56,57,59,60]. Furthermore, the observed effect of NW has been reported on groups of elderly people with pathological conditions with different individual level, after NW program for a period of time [56,59,60]. The findings of Huang et al. (2021) [56], which reported no significant changes in spinal posture, align with previous studies showing that 6–8 weeks of NW training did not significantly alter spinal posture in healthy older adults [57] or in older women with Parkinson’s disease [60]. In contrast, our study covers a target group of completely healthy young students with a good fitness status and similar age. Another significant difference of our experimental approach is that the two compared modes - normal and NW follow one after the other. Such a sequence has the advantage of allowing the detection of kinematic changes that occurred solely as a result of the use of poles. In this way, two undesirable factors are avoided. The first is the existing pathology and its varying degree in each individual participant in the cited articles [56,59,60]. The second is the strictly individual degree of adaptation over time to poles of each NW practitioner. These important considerations, reflected in our experimental approach, allow us to synthesize conclusions regarding changes in both the angular spinal kinematics (Table 1) and the temporal structure of pole walking (Table 2).
Our results clearly demonstrate that the kinematic structure of walking is significantly altered when comparing NW to normal walking at both speeds of 3 km/h and 5 km/h. The chosen IMU sensor configuration allowed us to collect precise data from five critical anatomical locations that characterize the walking kinematics. The statistical estimates are obtained from computed p-values of Dn(t) and En(t) as they are defined in (2) and (3) (see Table 1).
4.1. Upper Spine
Statistically significant differences were observed in all three rotational directions (pitch, roll, and yaw) at both walking speeds.
4.2. Lower Spine
Significant differences were also found in all three directions, except for the pitch direction (DN.p value = 0.107) at 3 km/h.
4.3. Thoracic Region
Statistically significant differences were observed in all directions except for DN.p and EN.p values in the axial (3 km/h) and lateral (3 km/h) rotations.
4.4. Lumbar Region
Significant differences were found in all directions for DN.p and EN.p values.
4.5. Pelvis
Here, statistically significant differences were observed in all three compared rotational directions.
In an attempt to summarize the obtained tabular results, it can be said that walking with poles significantly changes the kinematic structure of walking in healthy persons — an important finding that supports the health and functional benefits of NW.
These changes have an angular kinematic component. The additional statistical significances at comparison between Normal and Nordic walking for three parameters – Range, Duration and Velocity of the walk cycle for upper spine course confirm changed angular spine kinematics, showing temporal component. The results obtained in this statistical comparison strictly confirmed the change in the kinematic structure of walking in both the stance phase and the swing phase (Table 2).
4.6. Limitations of the Study
The limitations of this research are in two directions. The first is related to the used experimental model, namely the use of a treadmill for the research, which introduces uncertainty. However, in our opinion, this uncertainty does not change the significance of the data obtained and does not invalidate the truth of the conclusions drawn. The second important limitation is the target group and its size. It consists of only fit young men. Considering female and older in age participants may deliver more interesting observations and conclusions. Also, the number of participants is limited to 20. Despite of applied permutations for computations of Dn(t) and En(t) statistics, it is only partially substitutes the advantage of higher sample volumes.
5. Conclusions
Based on the obtained results, important and detailed conclusions can be drawn regarding changes in spinal angular kinematics during Nordic Walking (NW) using poles. Angular changes were observed across five measured parameters (Table 1):
5.1. Upper Spine
5.2. Lower Spine
Axial Rotation (Course) – NW reduces body rotation in the horizontal plane at 3 km/h (Figure 10). The most statistically significant differences occur at 30% and 80% of the gait cycle (Figure 13).
5.3. Thoracic Region
5.4. Lumbar Region
5.5. Pelvis
Axial Rotation (Course) – NW decreases body rotation in the horizontal plane at both speeds (Figure 28). Significant differences are observed at 75% (3 km/h) and 60% (5 km/h) of the gait cycle (Figure 31).
Pitch – NW reduces sagittal plane rotation at both speeds (Figure 29). The most significant differences occur at 50% (3 km/h) and 45% (5 km/h) of the gait cycle (Figure 32).
Roll – NW increases frontal plane rotation while maintaining the profile of motion (Figure 30). Significant differences are seen at 30% of the gait cycle at both speeds (Figure 33).
Figure 22.
The plots for lumbar flexion data of two walking velocities (3 km/h data is on left, 5 km/h data is on right).
Figure 22.
The plots for lumbar flexion data of two walking velocities (3 km/h data is on left, 5 km/h data is on right).
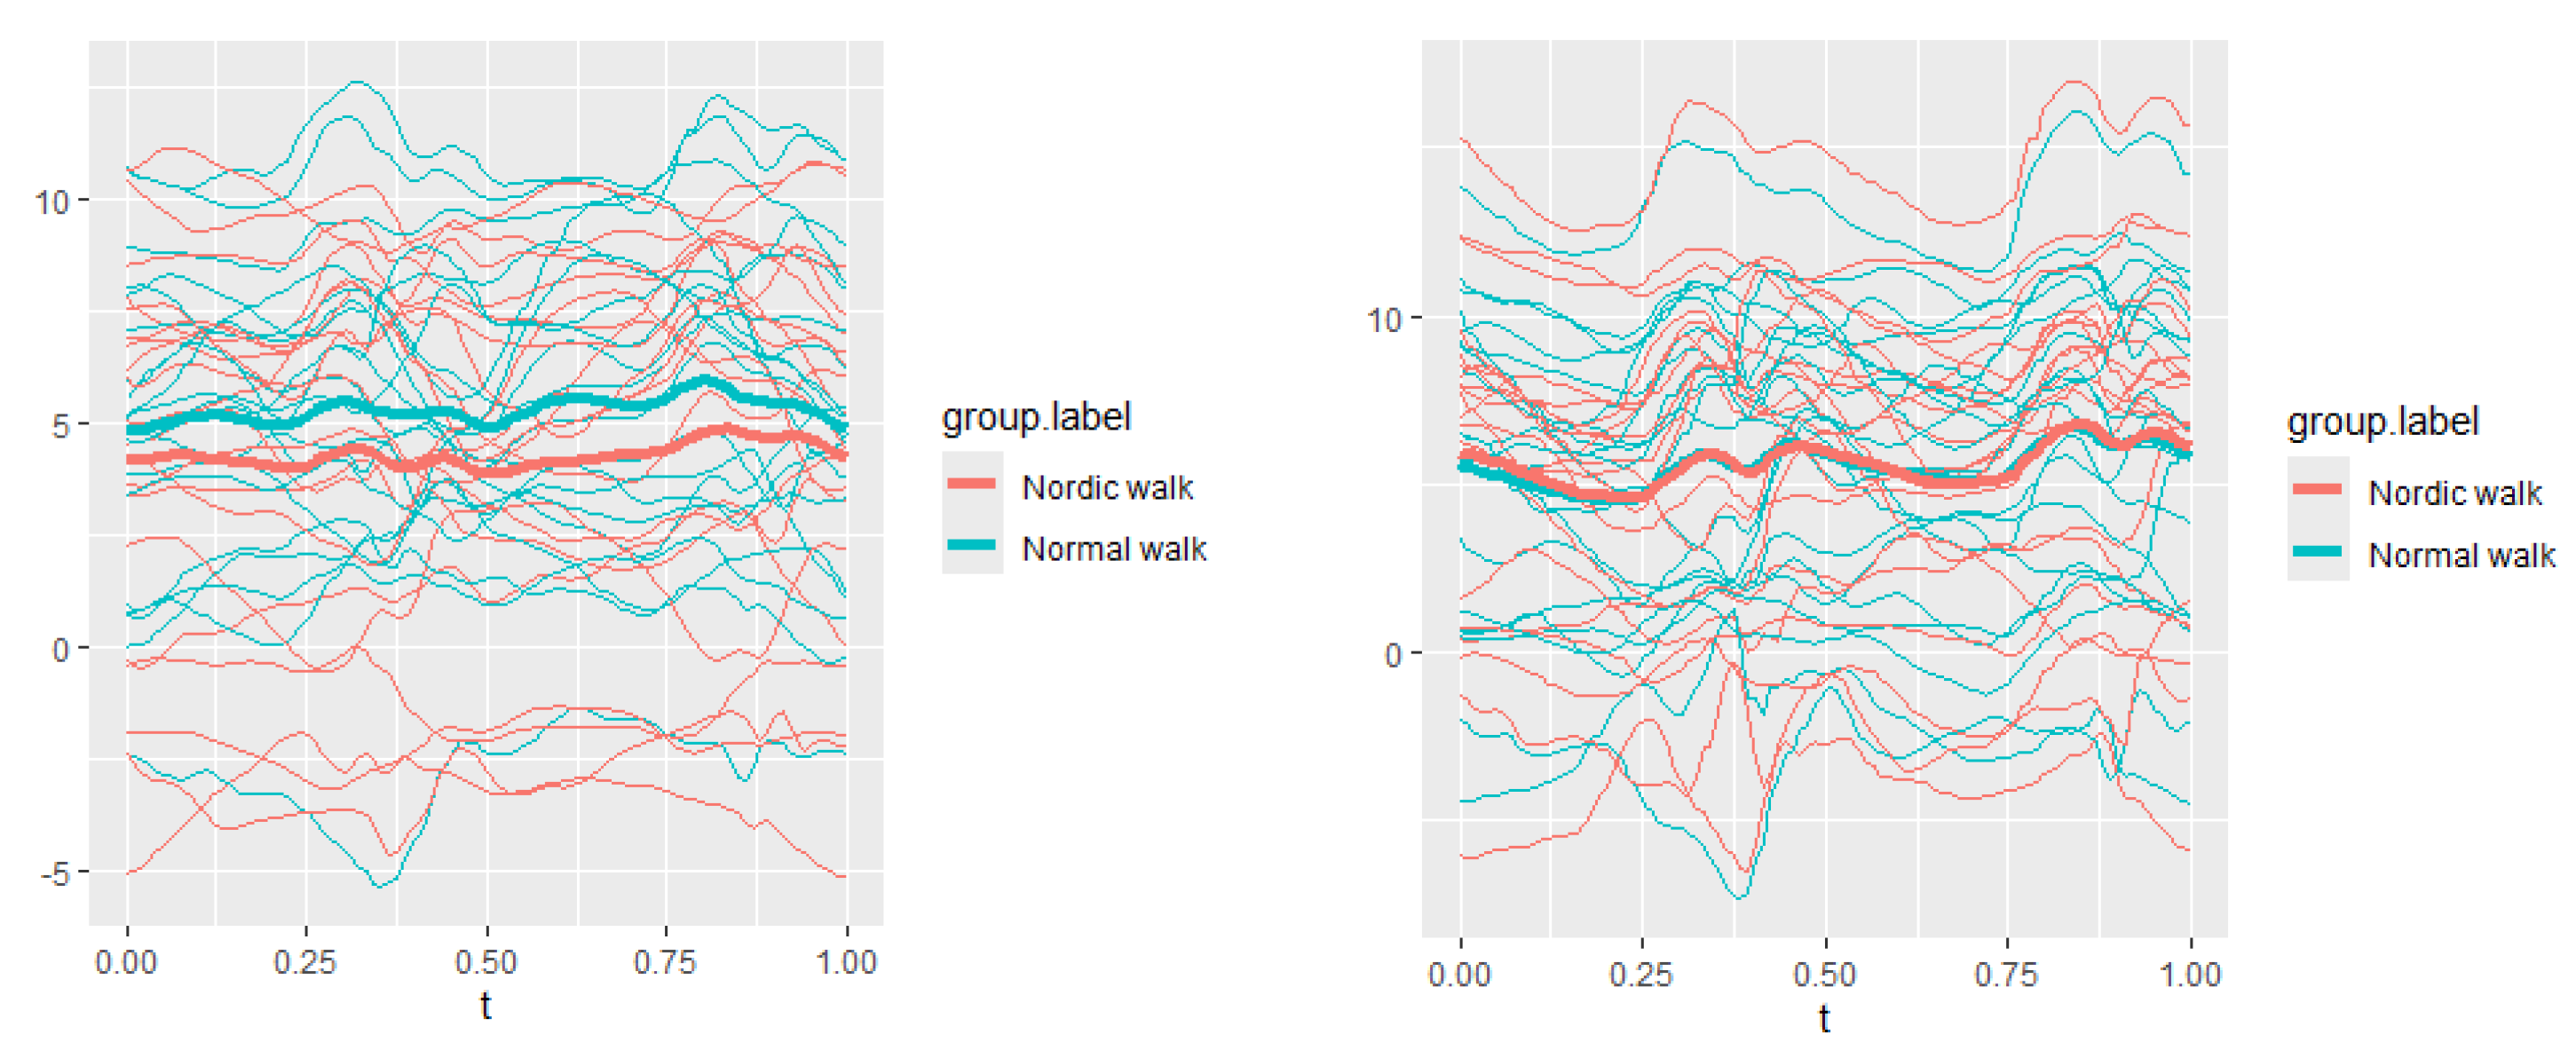
Figure 23.
The plots of lumbar axial data of two walking velocities (3 km/h data is on left, 5 km/h data is on right).
Figure 23.
The plots of lumbar axial data of two walking velocities (3 km/h data is on left, 5 km/h data is on right).
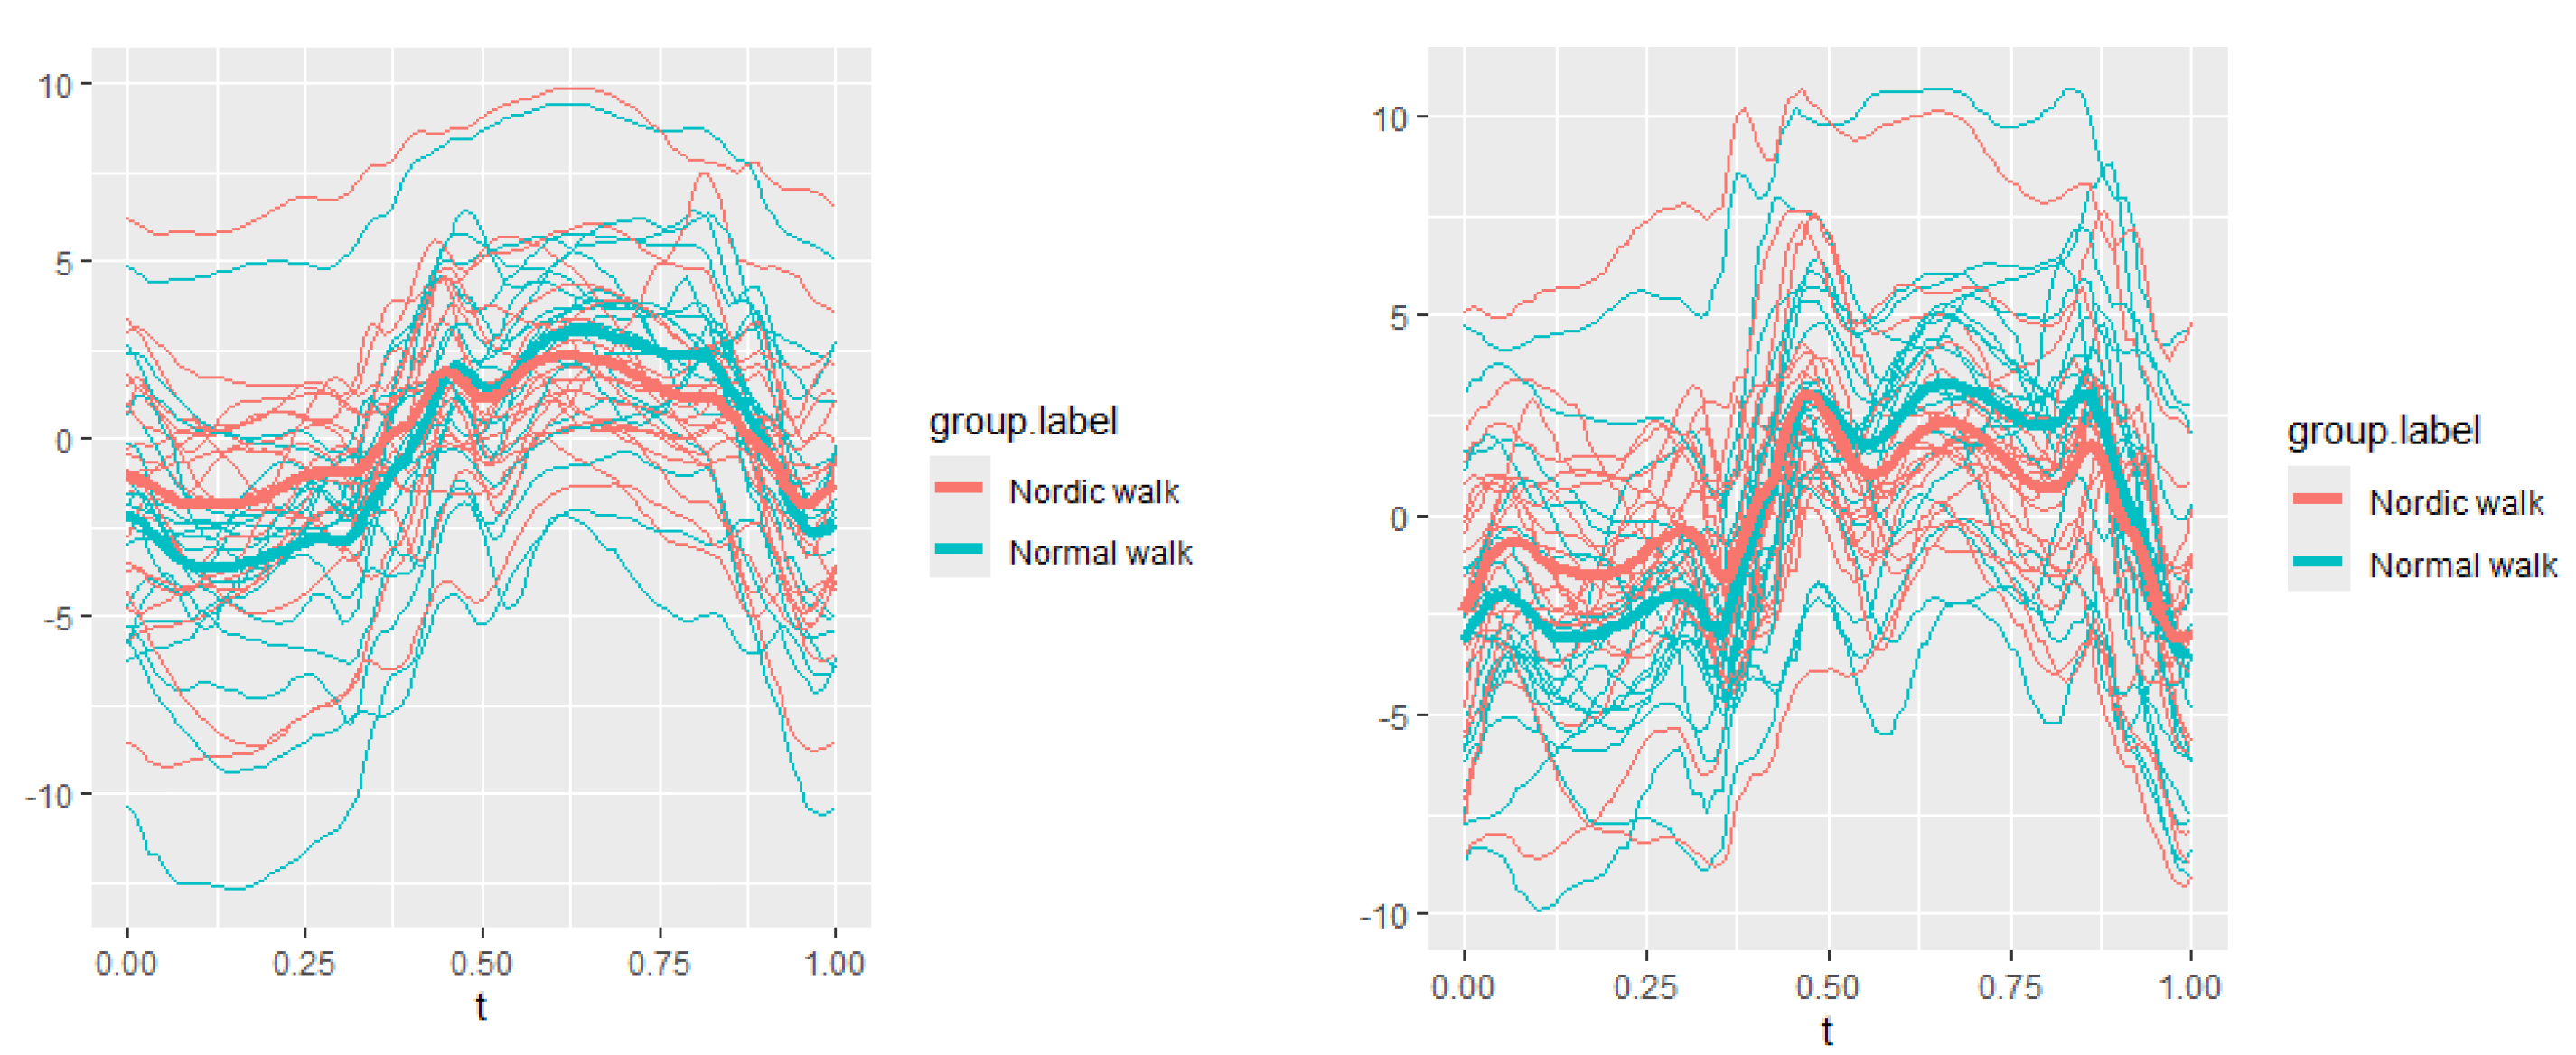
Figure 24.
The plots of lumbar lateral data of two walking velocities (3 km/h data is on left, 5 km/h data is on right).
Figure 24.
The plots of lumbar lateral data of two walking velocities (3 km/h data is on left, 5 km/h data is on right).
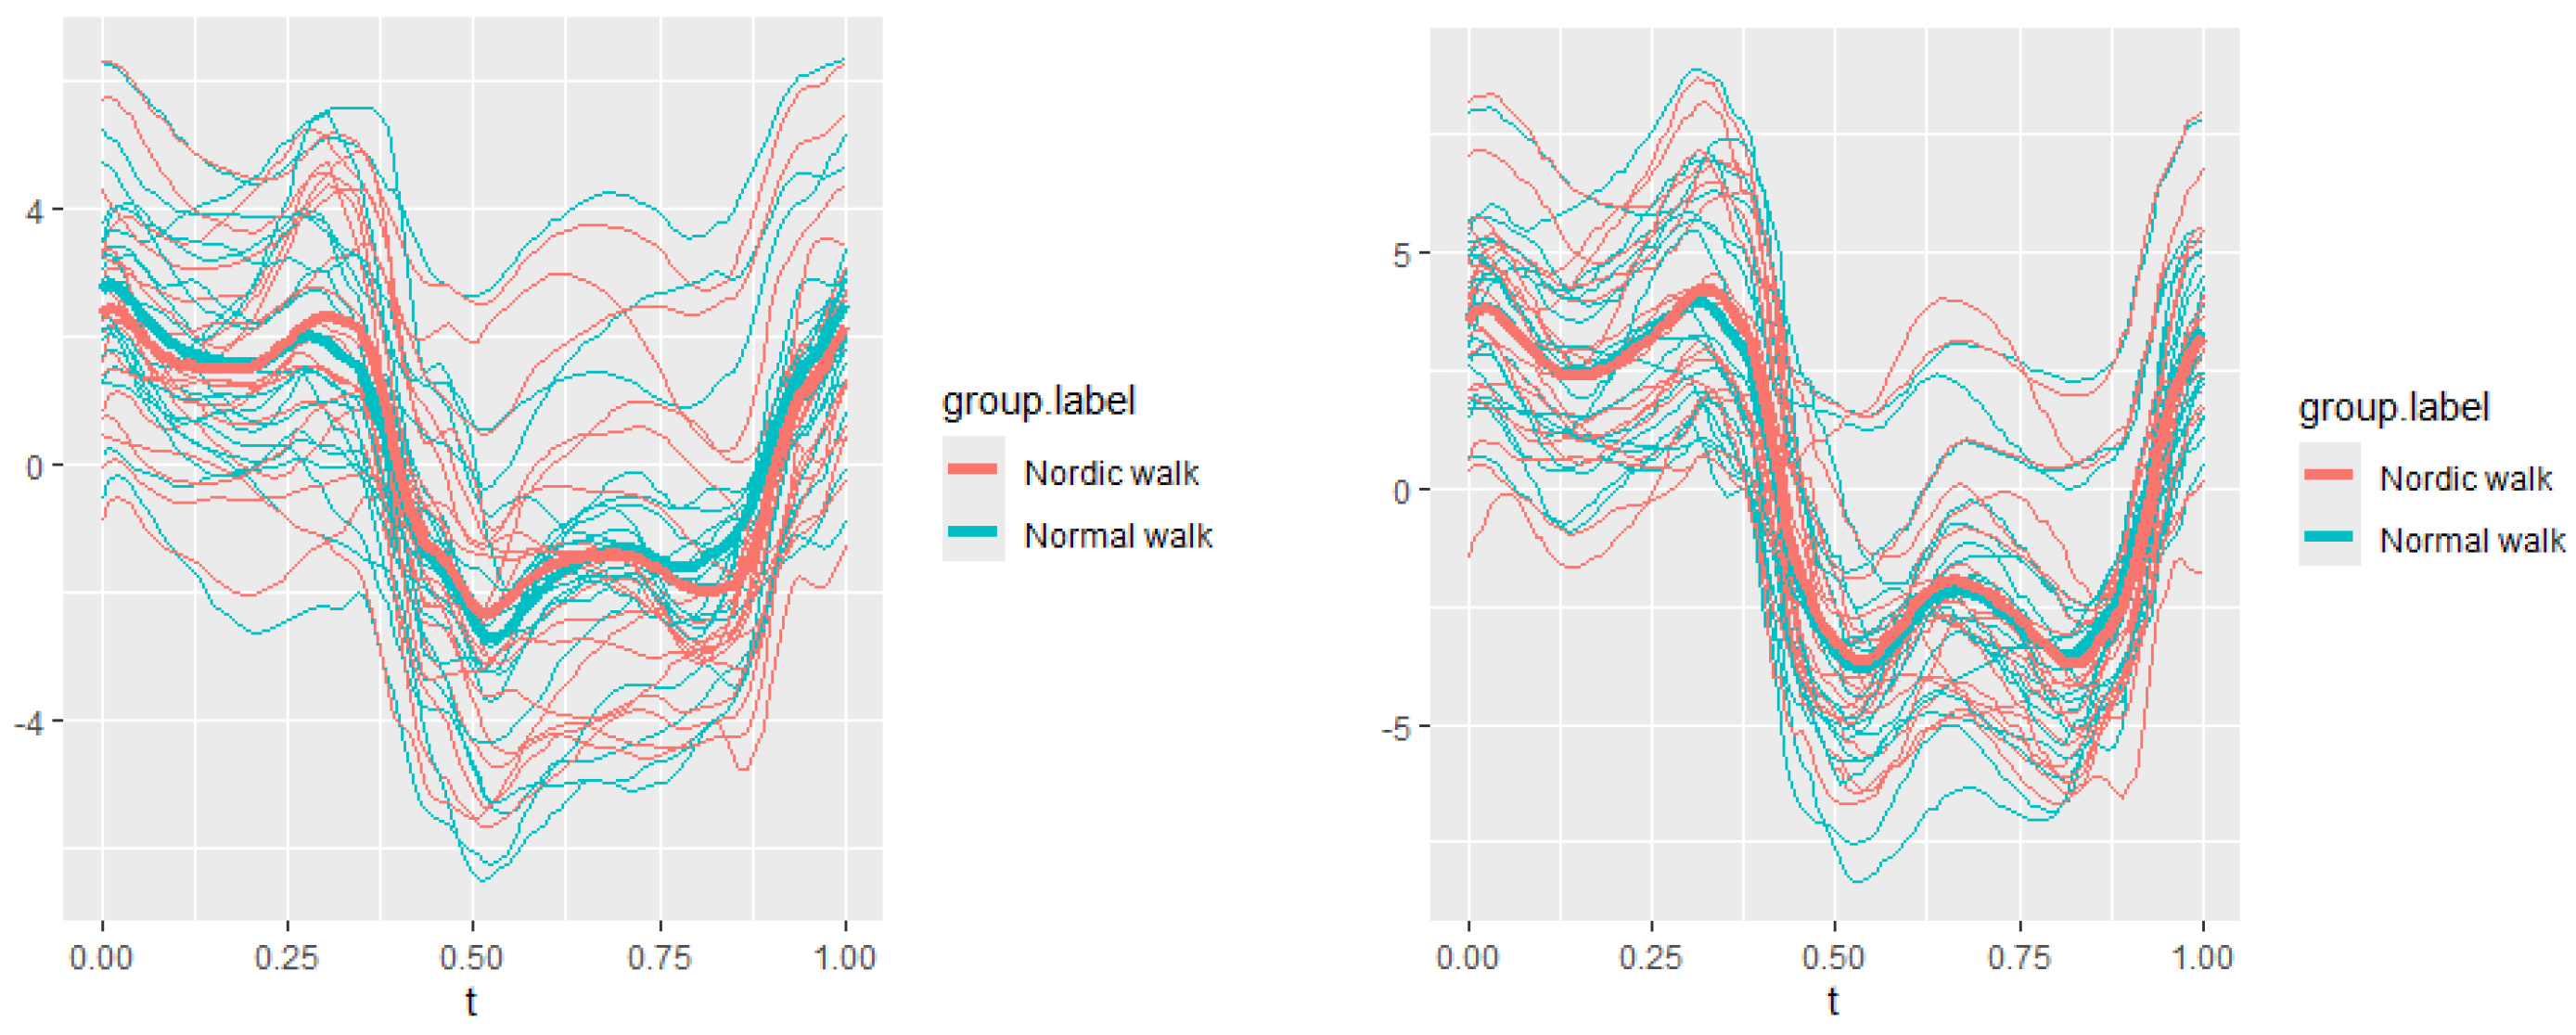
Figure 25.
Pointwise SSA(t) statistics for lumbar flexion rotation at 3 and 5 km/h.
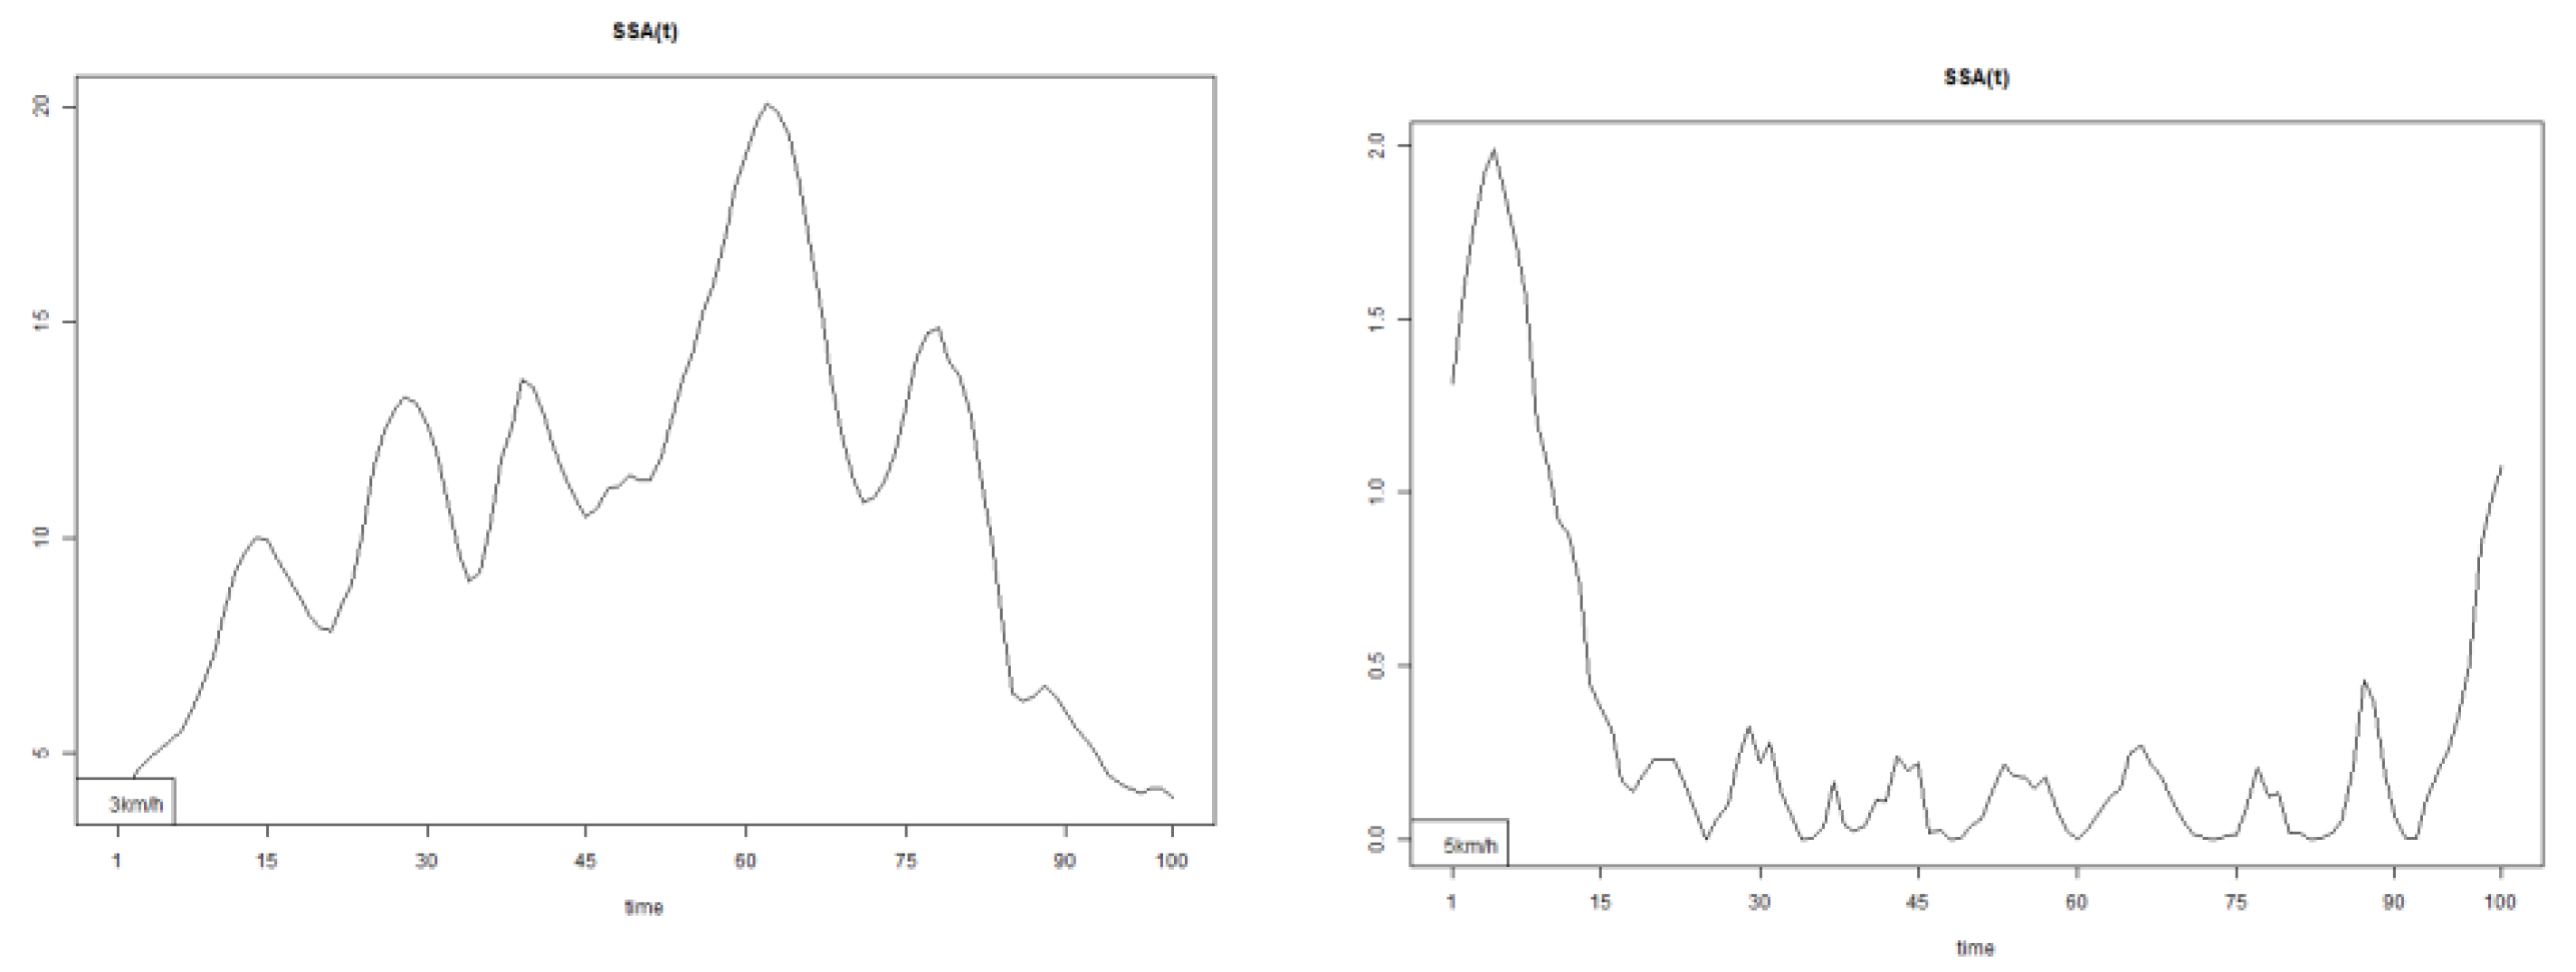
Figure 26.
Pointwise SSA(t) statistics for lumbar axial rotation at 3 and 5 km/h.
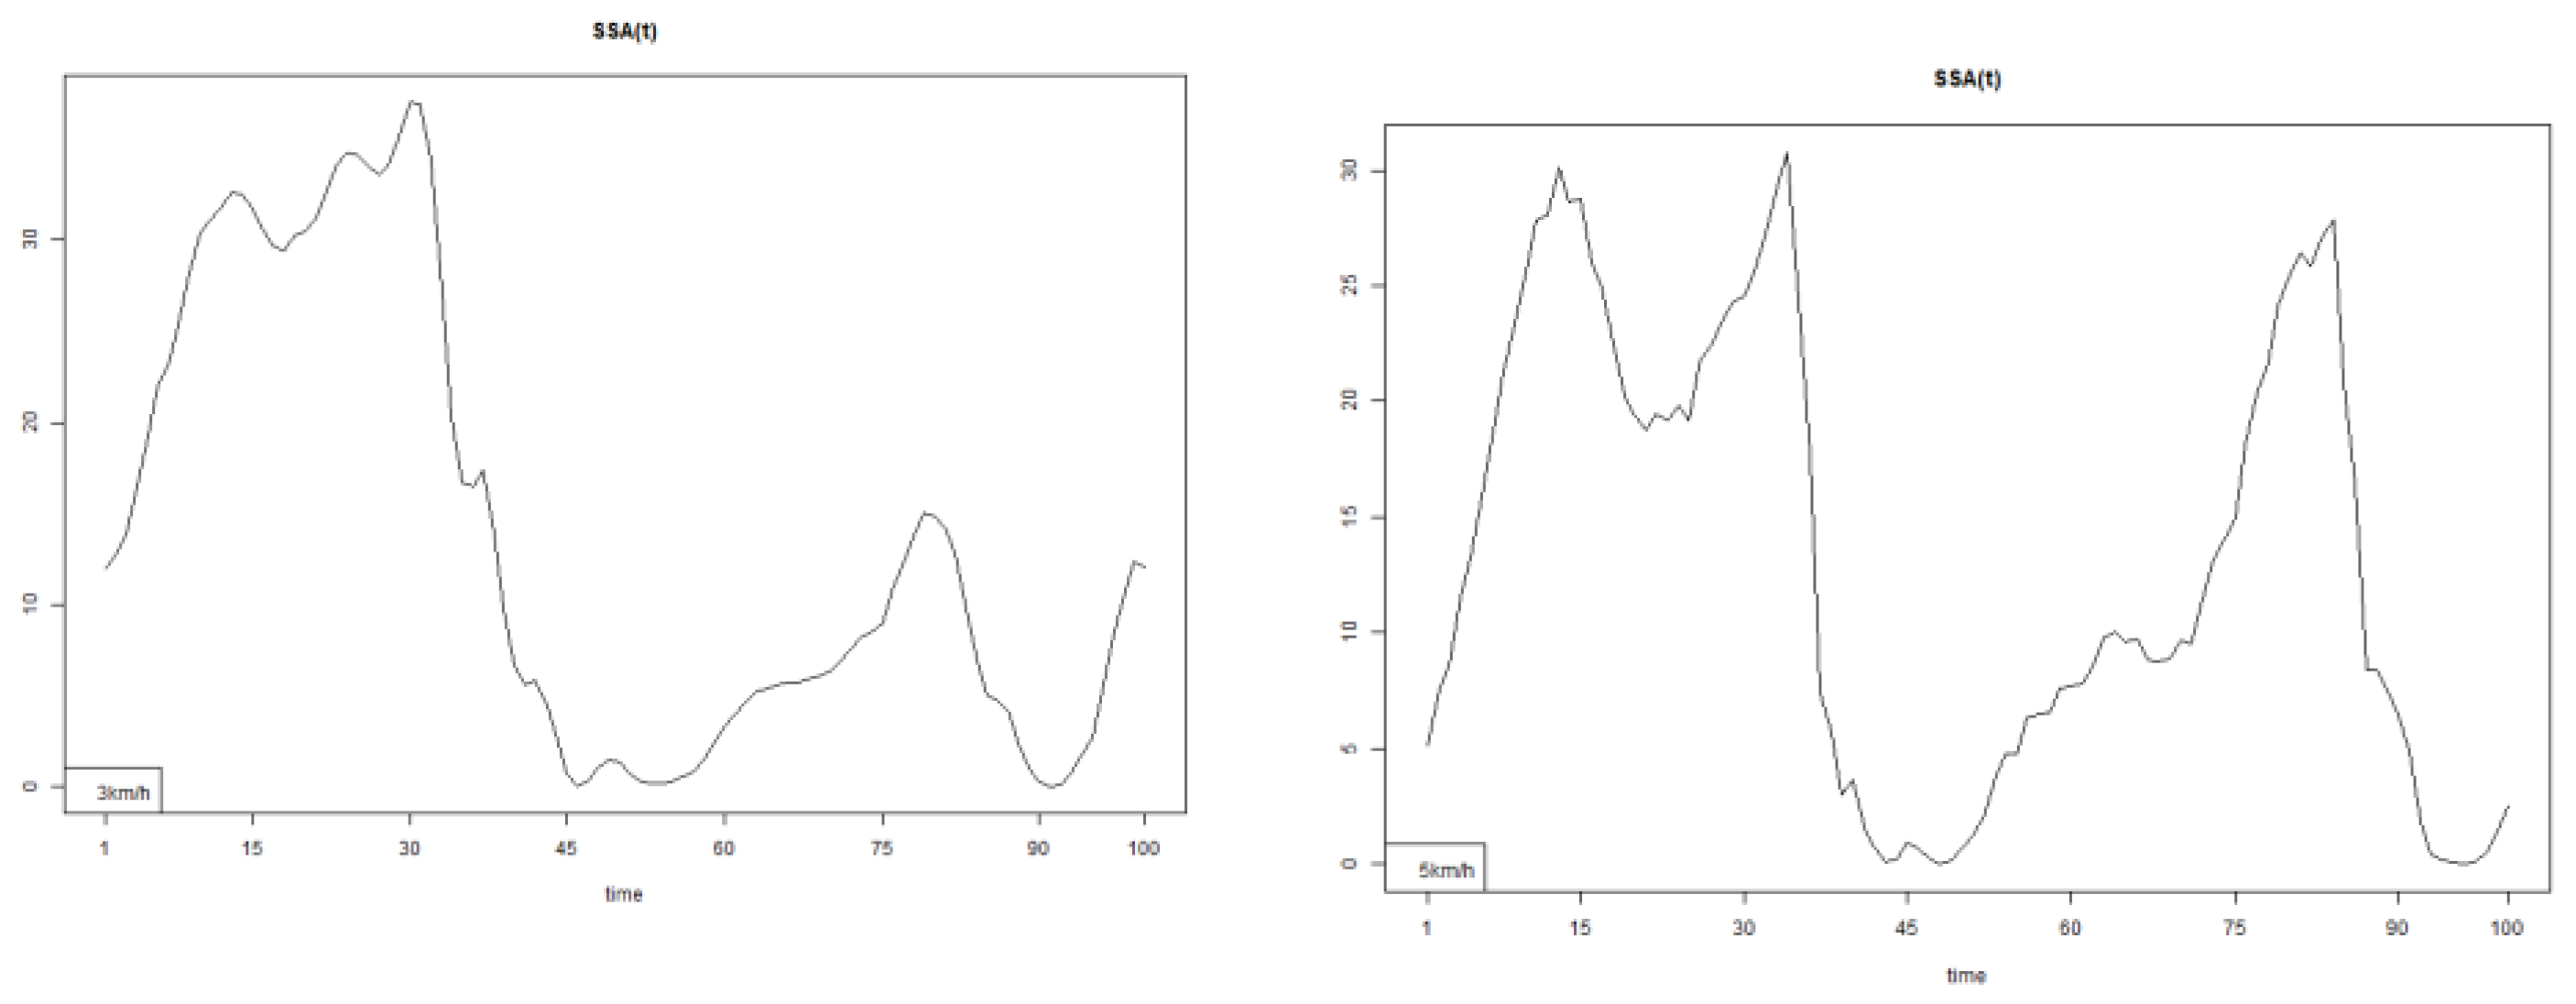
Figure 27.
Pointwise SSA(t) statistics for lumbar lateral rotation at 3 and 5 km/h.
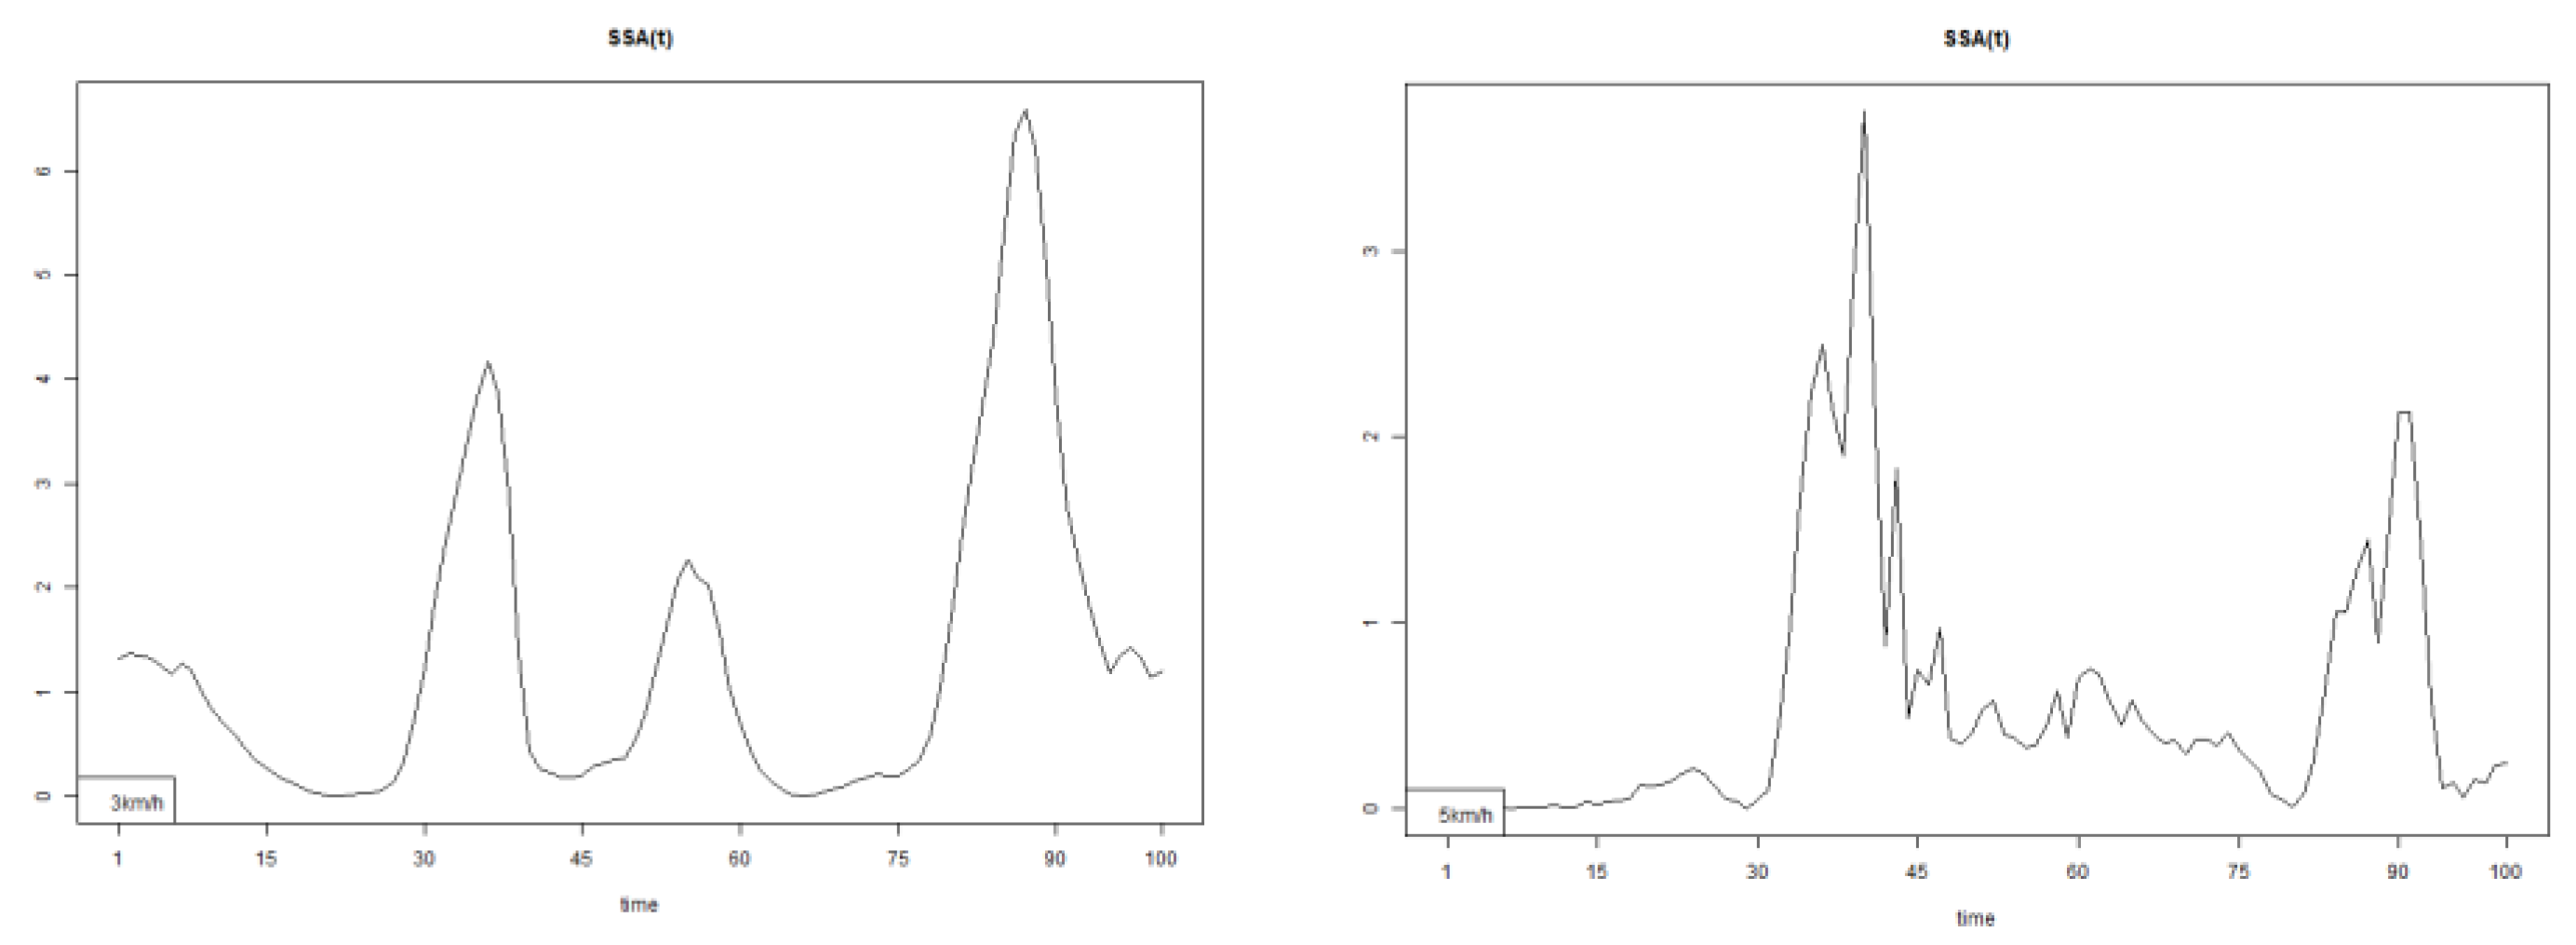
Figure 28.
The plots of pelvis course data of two walking velocities (3 km/h data is on left).
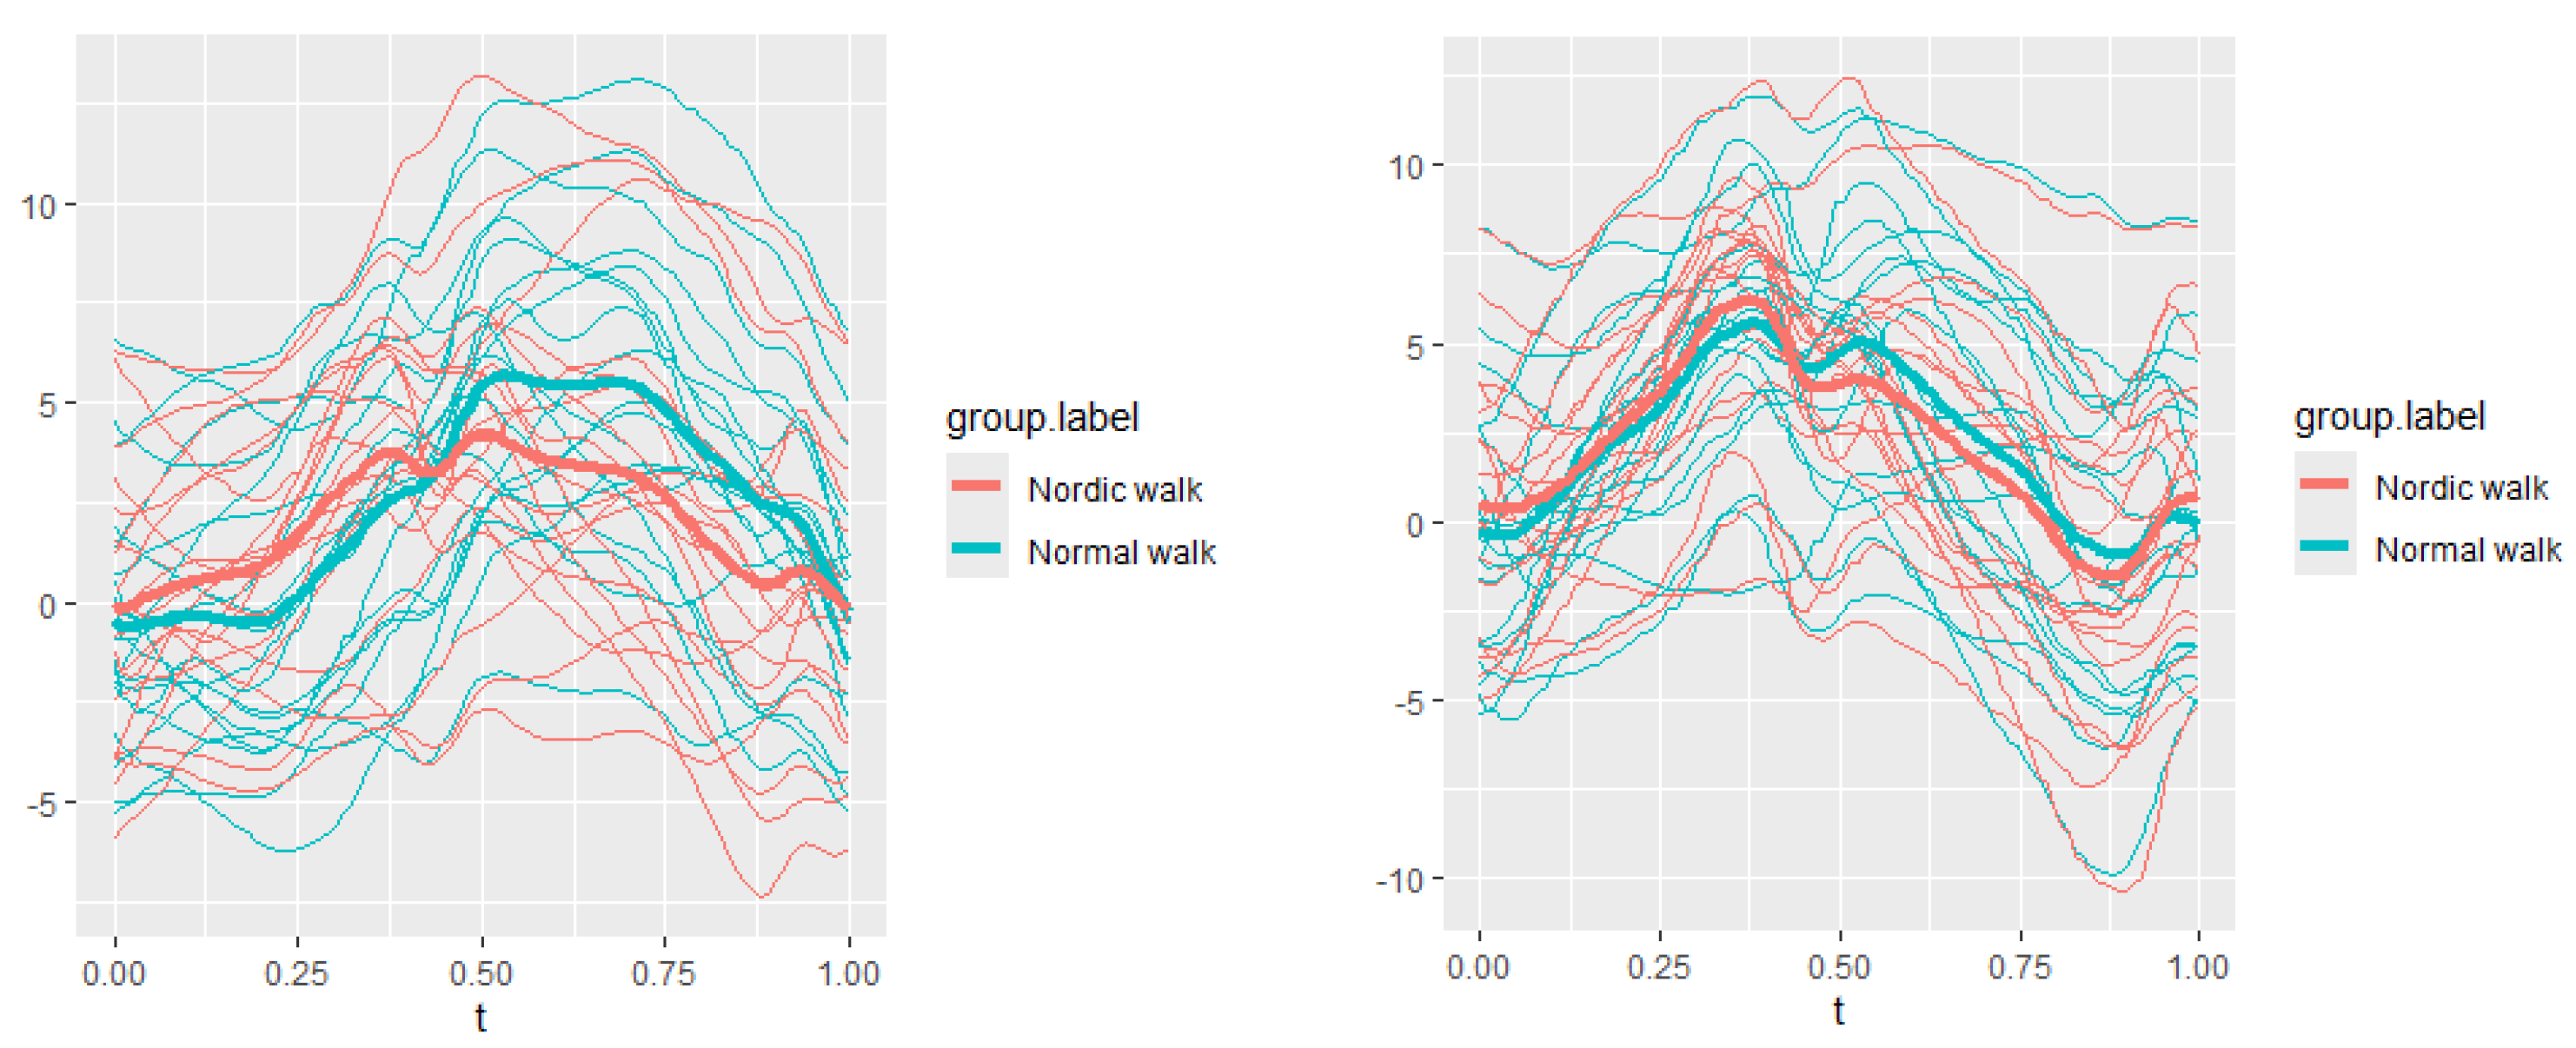
Figure 29.
The plots of pelvis pitch data of two walking velocities (3 km/h data is on left).
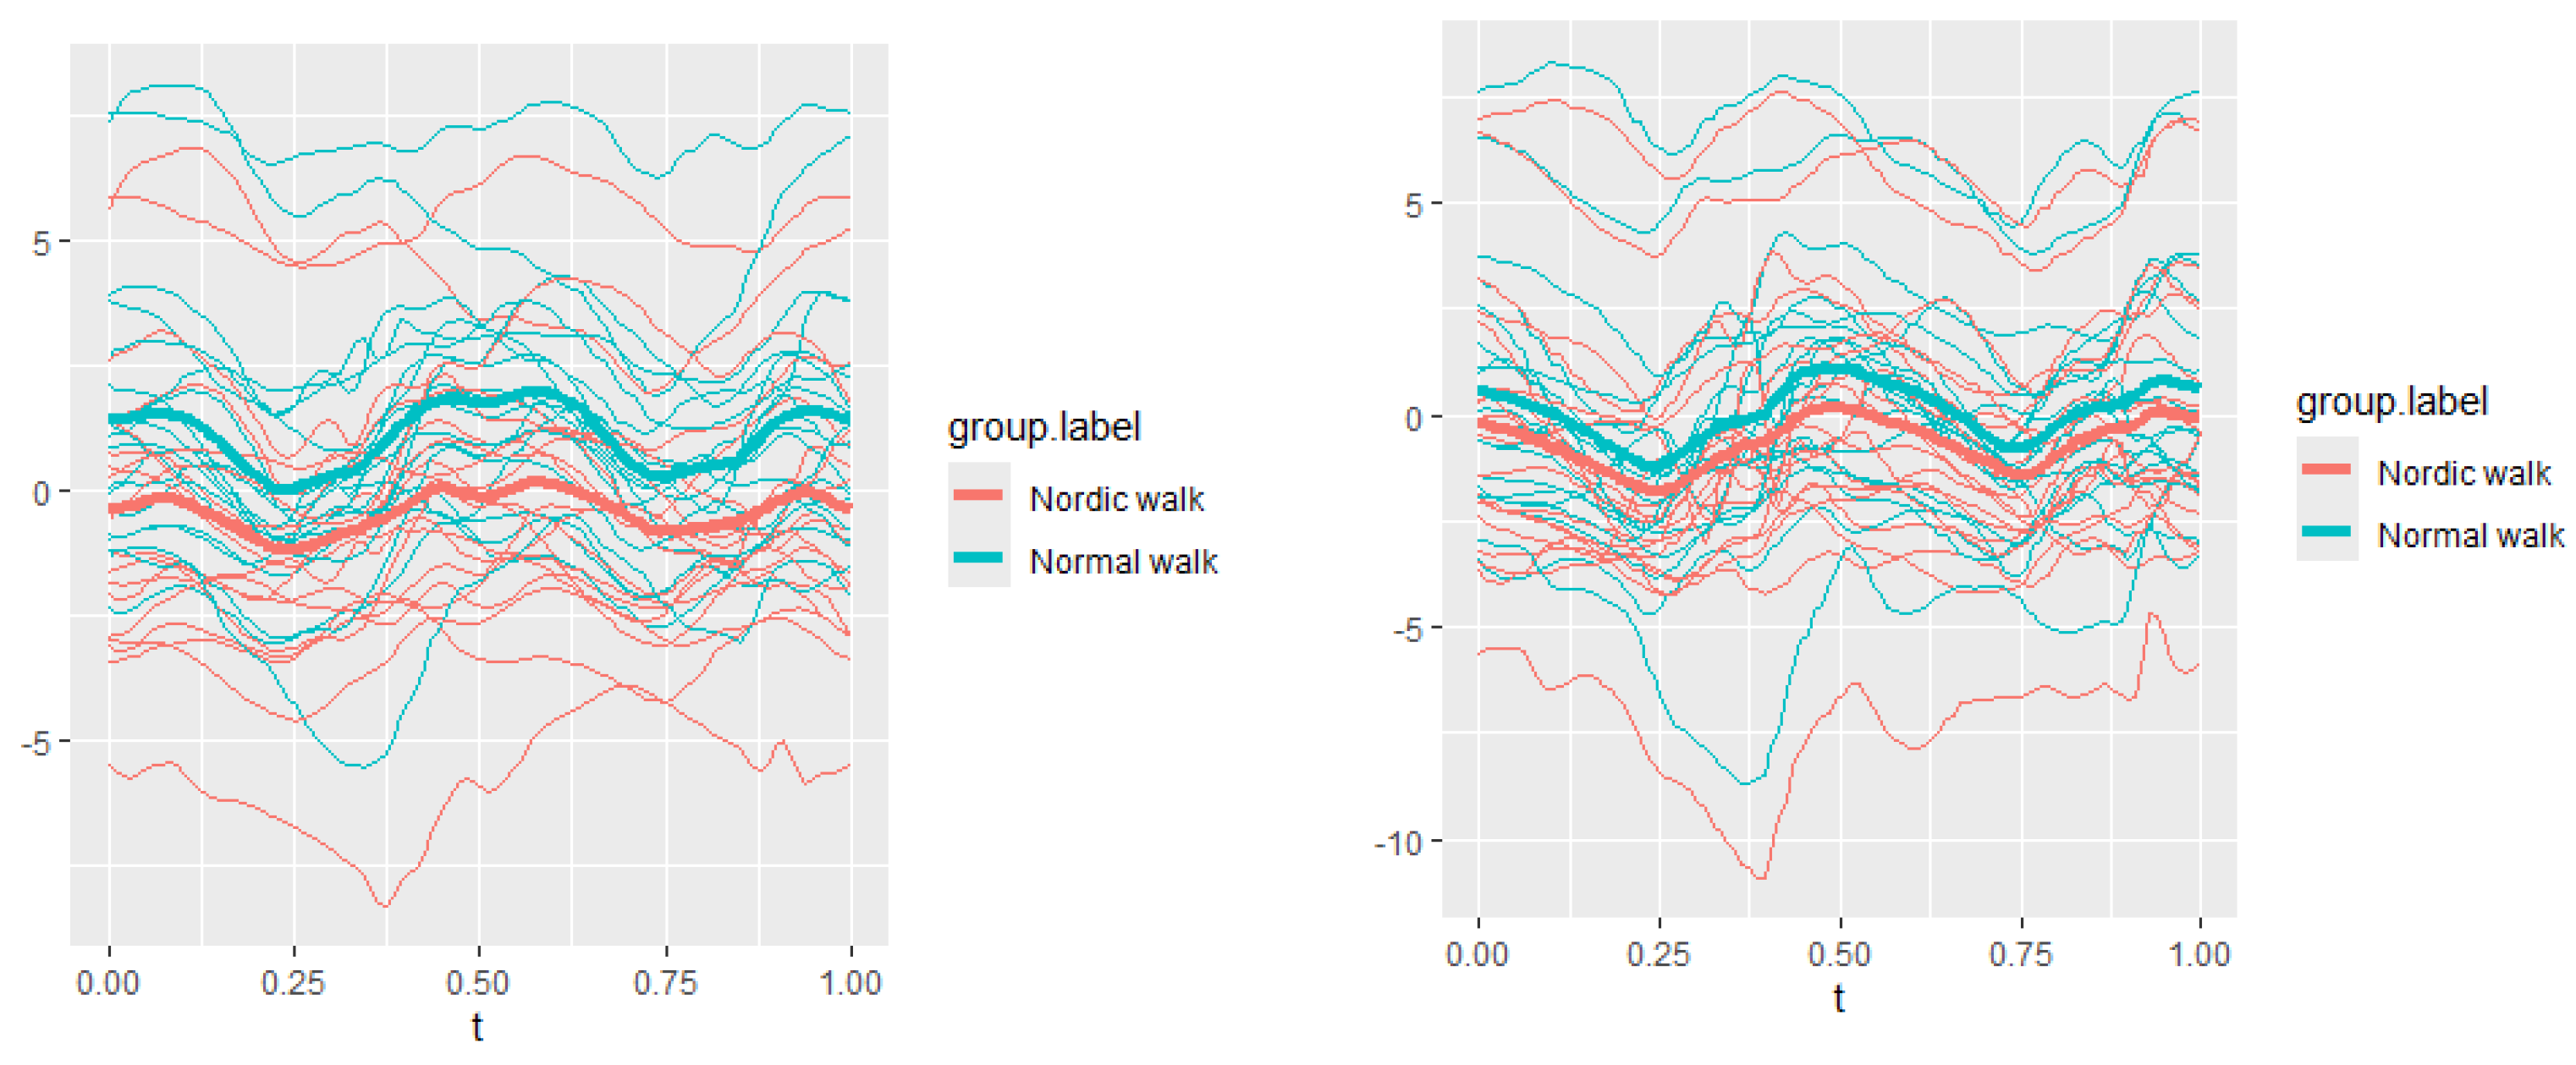
Figure 30.
The plots of pelvis roll data of two walking velocities (3 km/h data is on left).
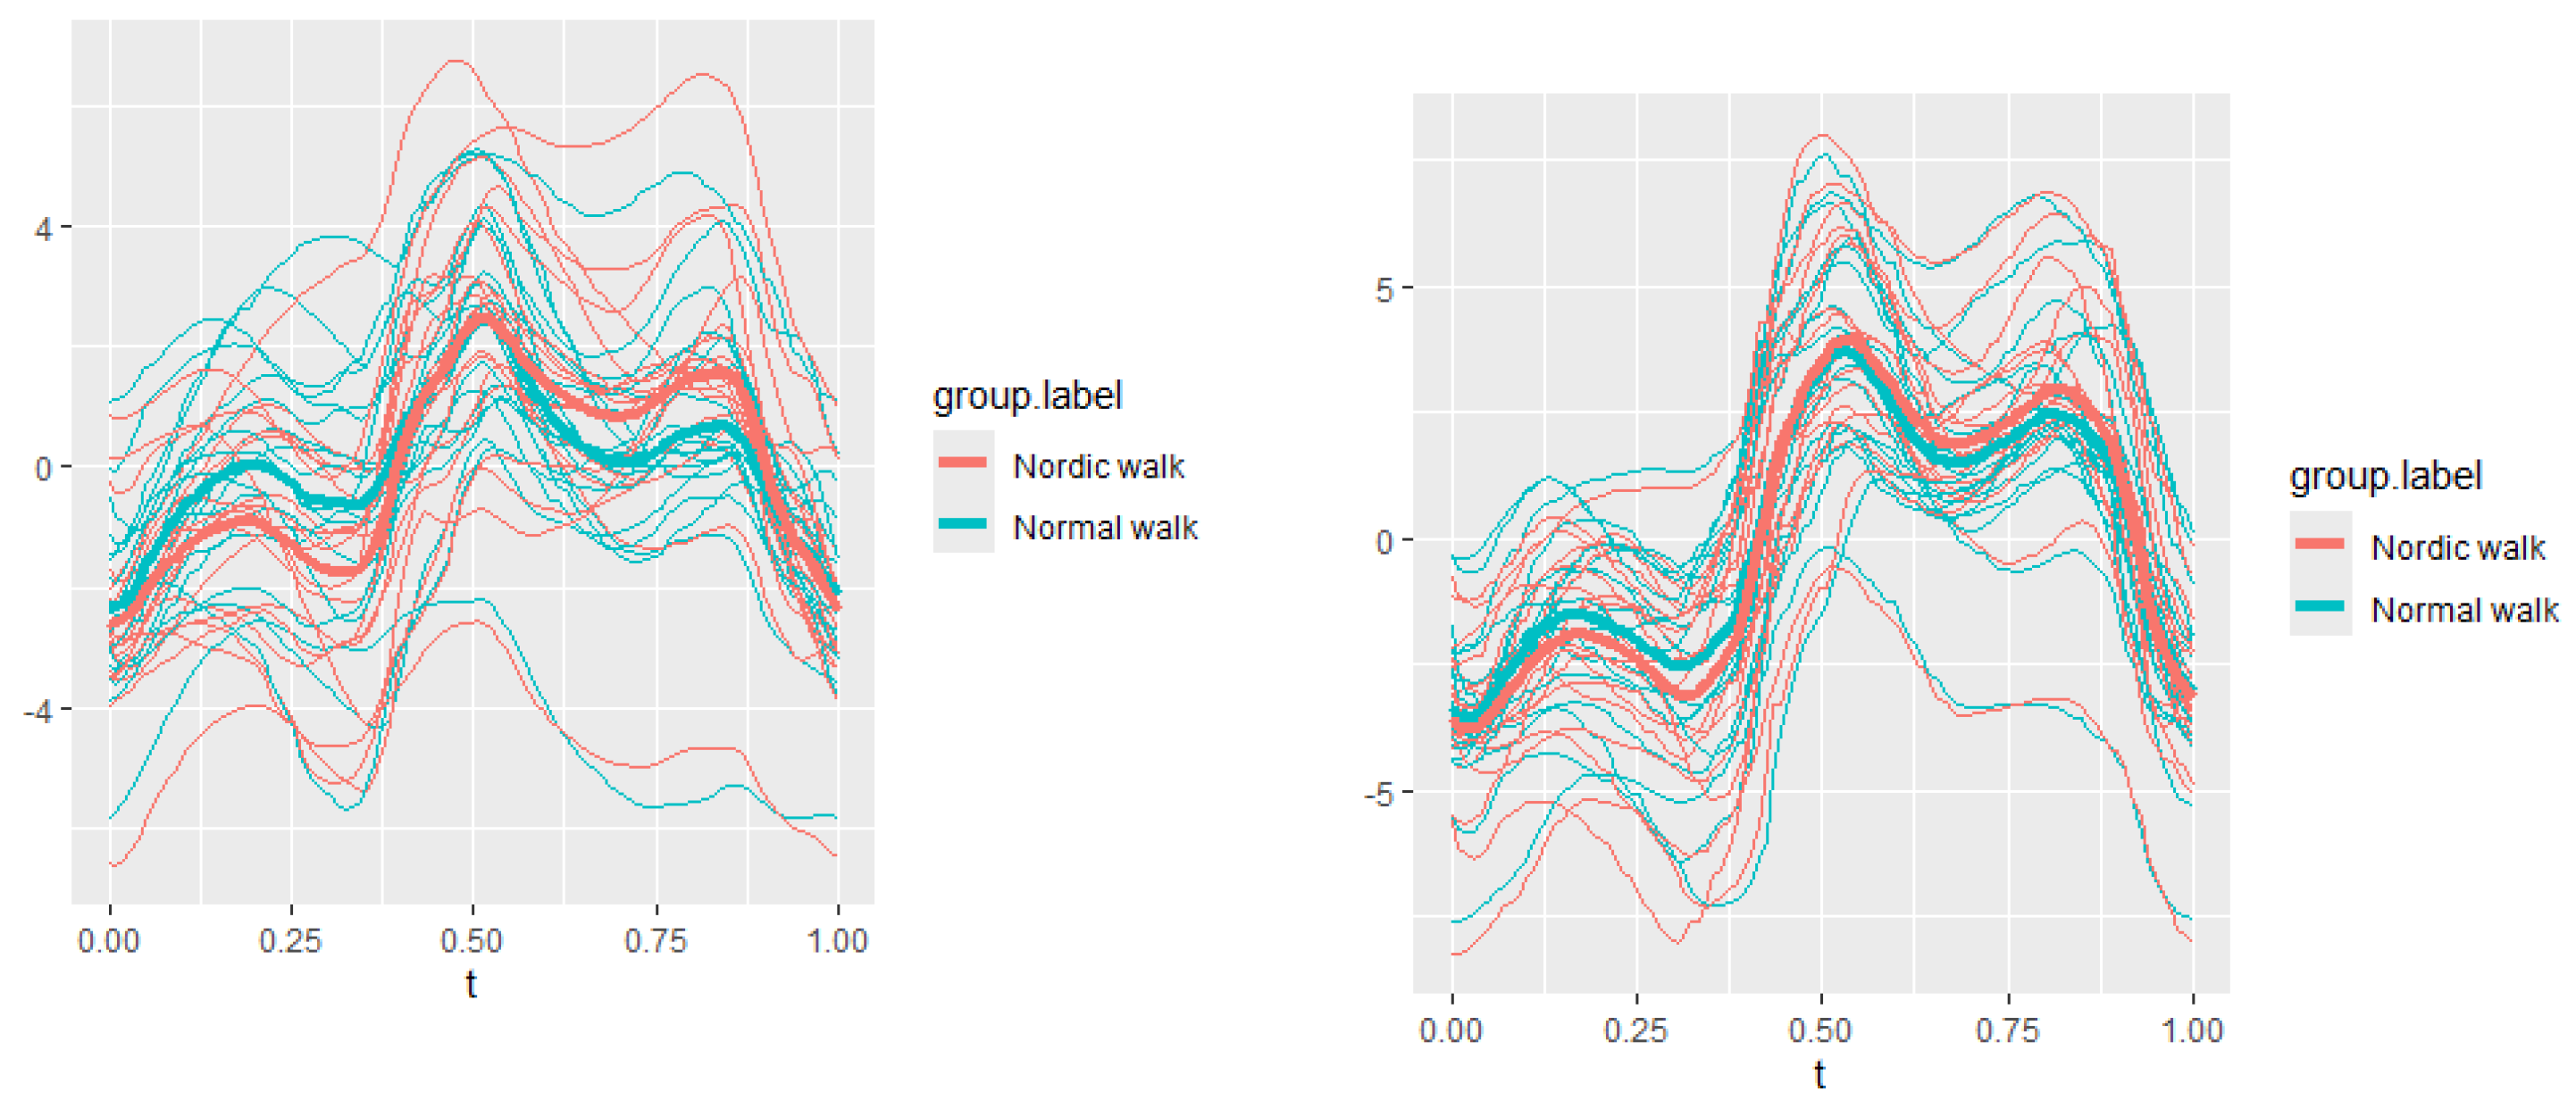
Figure 31.
Pointwise SSA(t) statistics for pelvis course angle at 3 and 5 km/h.
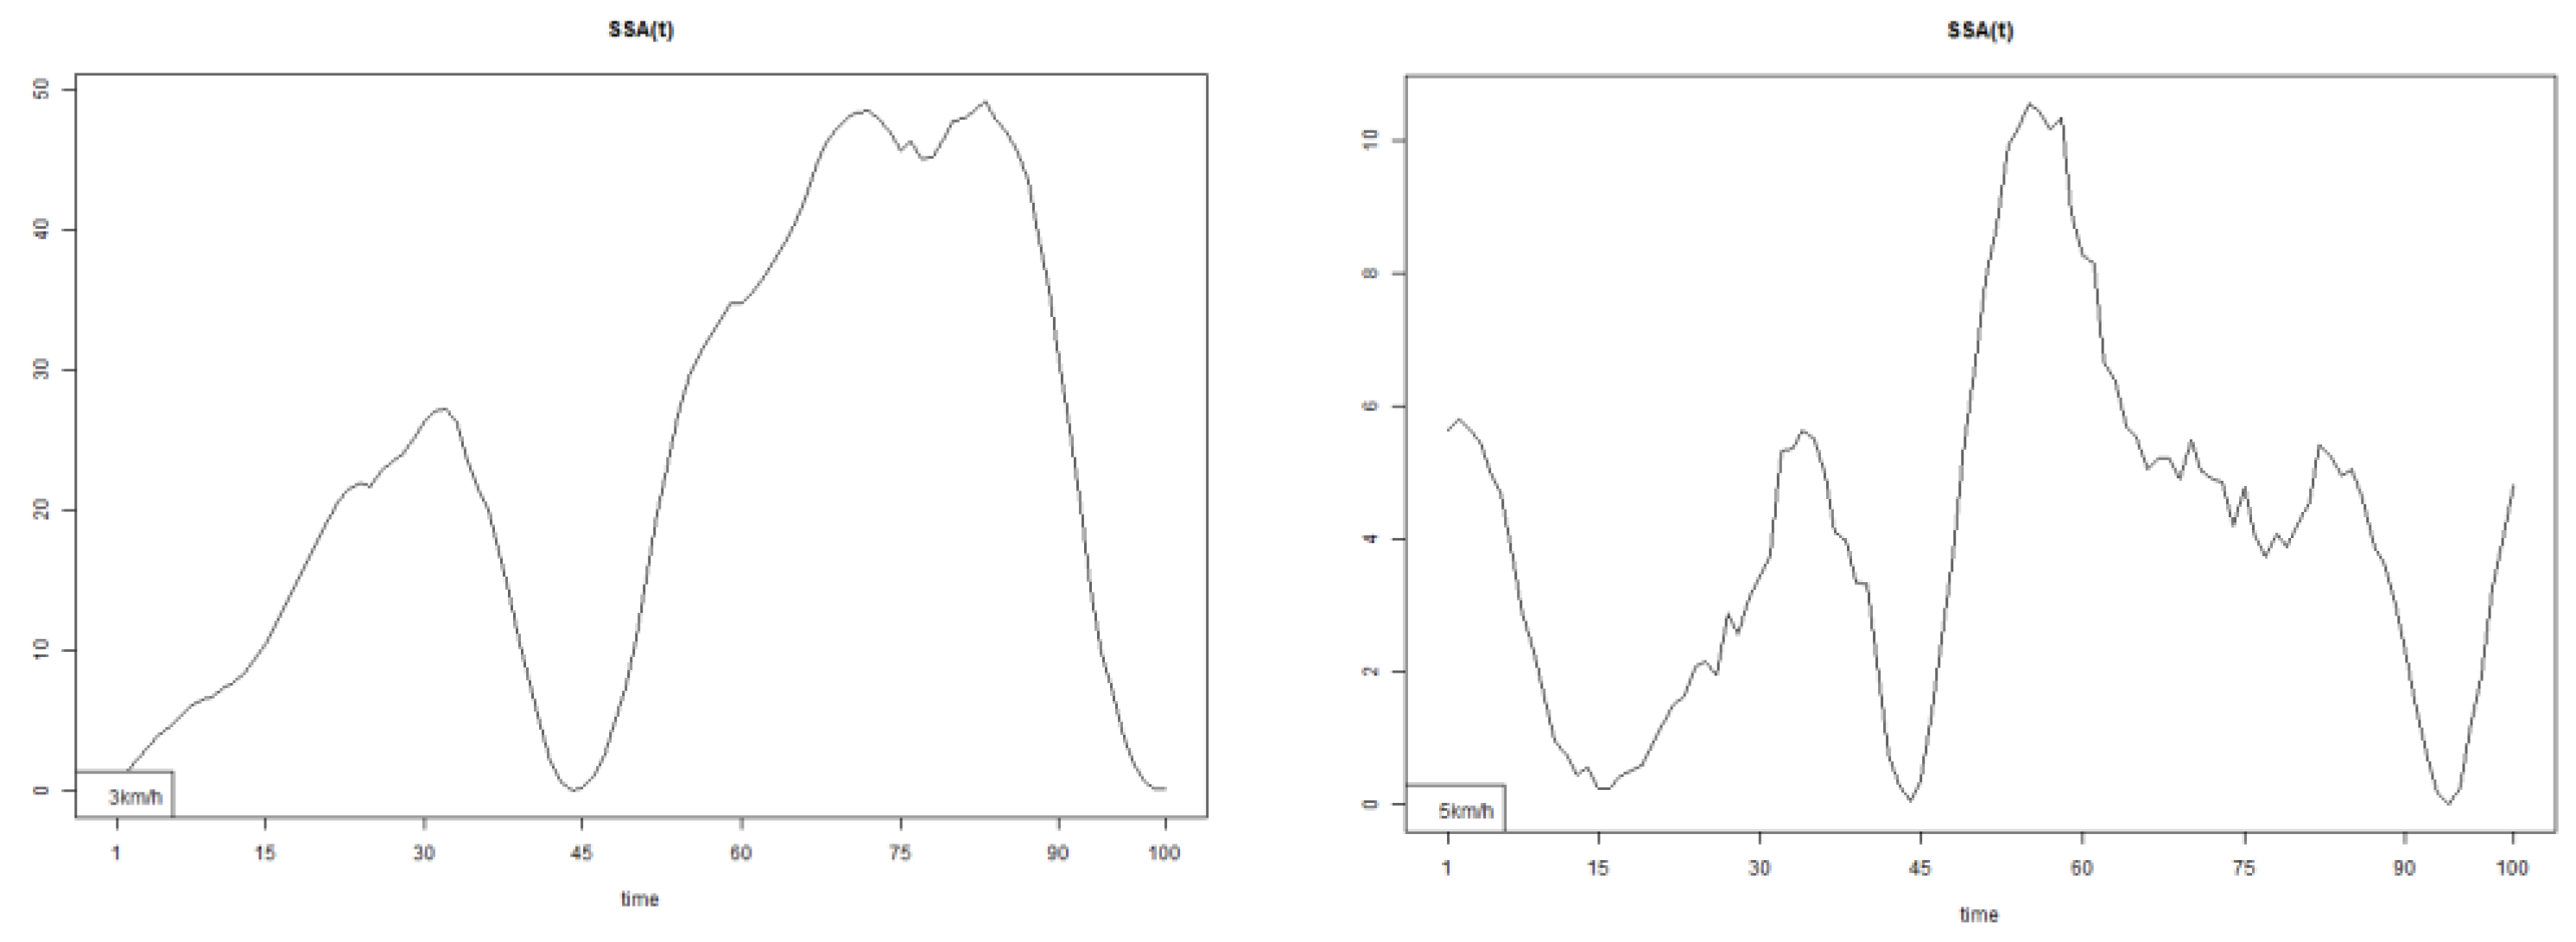
Figure 32.
Pointwise SSA(t) statistics for pelvis pitch angle at 3 and 5 km/h.
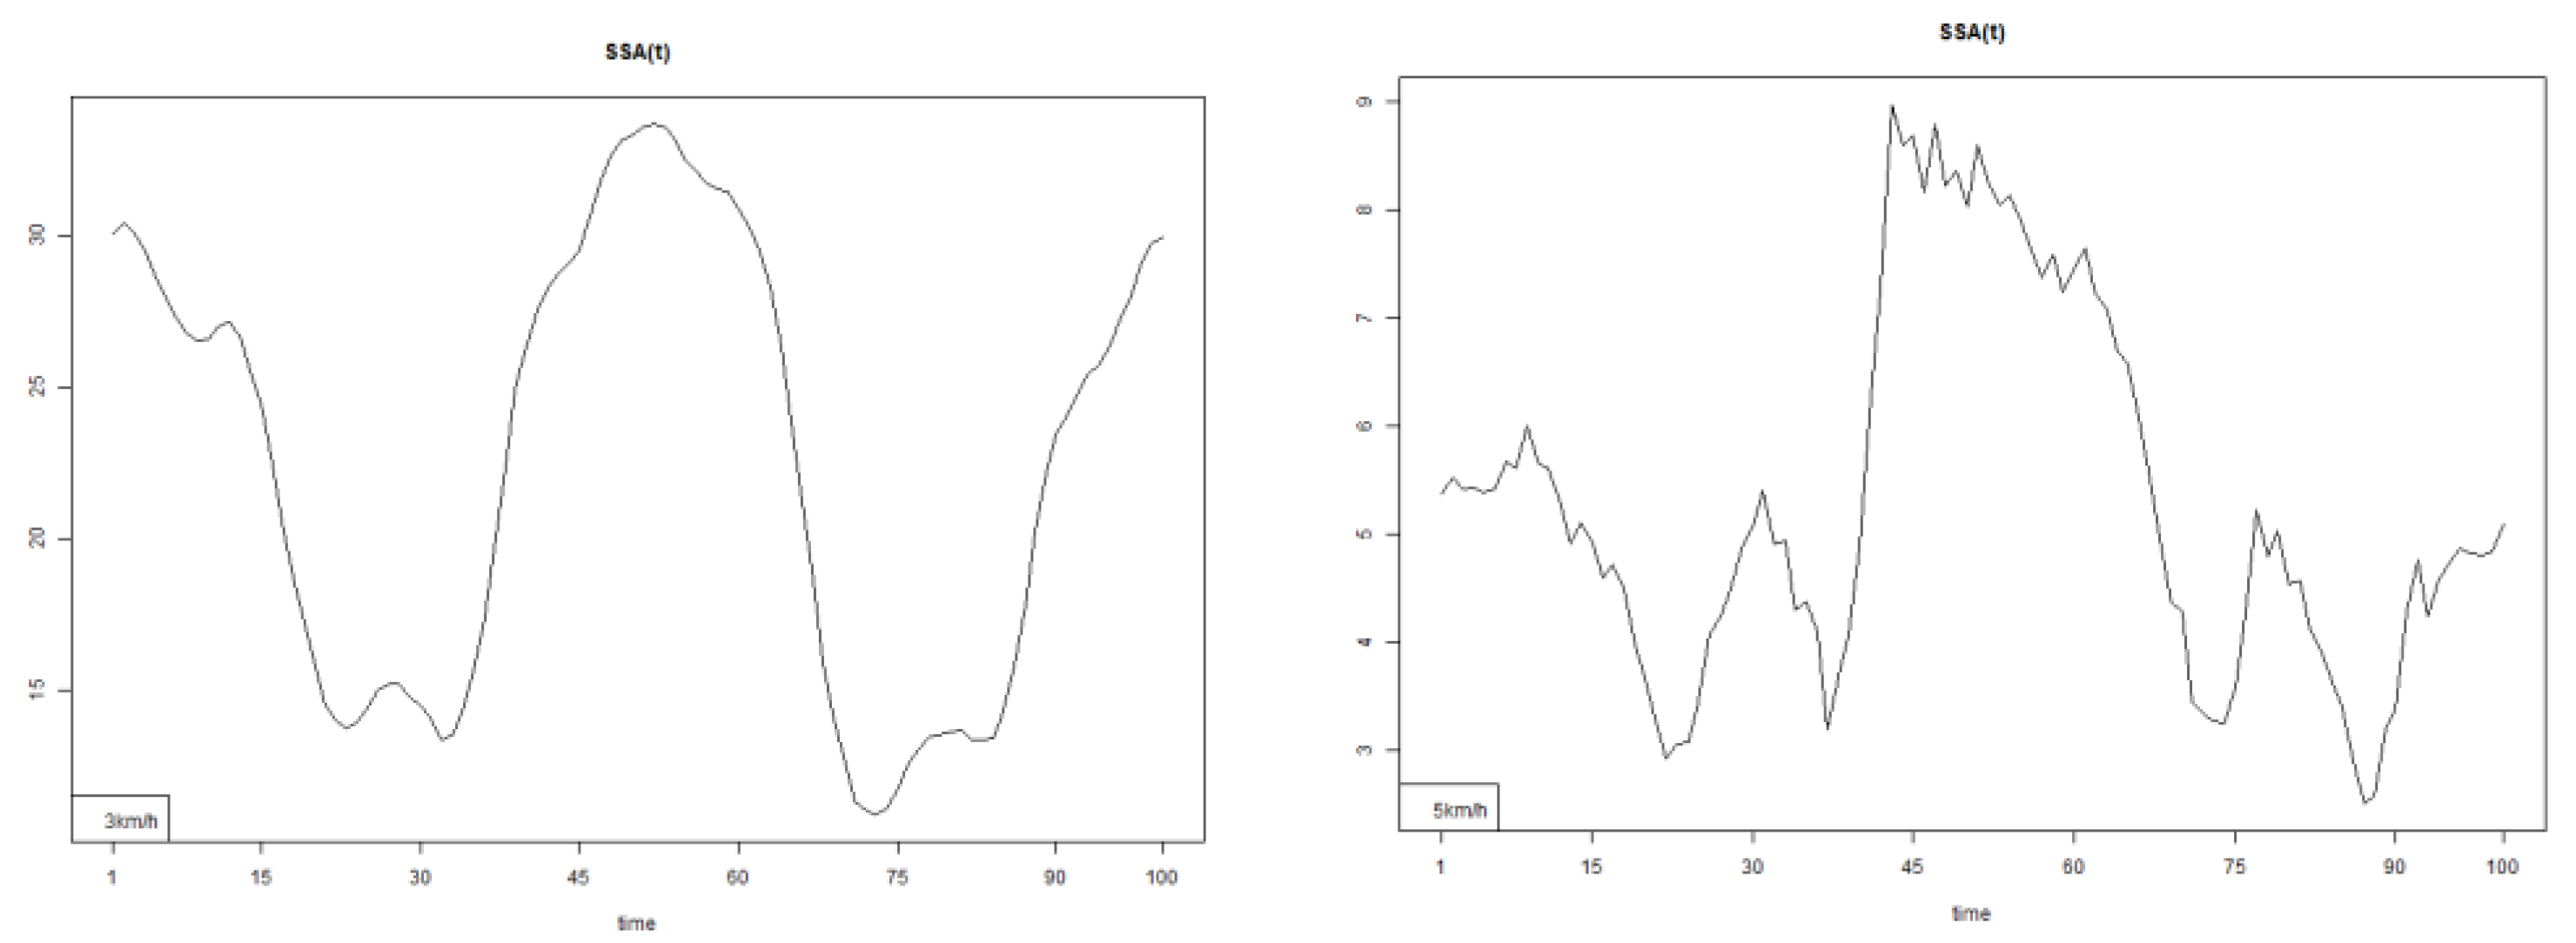
Figure 33.
Pointwise SSA(t) statistics for pelvis roll angle at 3 and 5 km/h.
Temporal changes were observed across three measured step phases parameters (Table 2):
Significantly decrease the range of the stance and swing phases in the frontal plane.
Significantly increase the stance phase duration in all three planes of motion.
Significantly decrease the swing phase duration in all three planes.
Significantly increase stance phase velocity in all three planes.
Alter step kinematics, depending on walking speed.
The most important conclusion of the study is that Nordic Walking significantly changes the kinematic structure of spinal movement. The proposed statistical approach confirmed statistically significant differences in all five measured parameters compared to normal walking. Notably, the most substantial differences were observed in the upper spine and pelvis. The NW modified spinal kinematics at both speeds tested adaptations are highly individual, depending on each person’s physical condition and personal pole usage technique. In some cases, these biomechanical changes are extremely pronounced, highlighting the individualized nature of NW’s impact.
These findings emphasize the biomechanical, preventive, therapeutic, and rehabilitative potential of Nordic Walking.
5.6. Future Research Directions
The current measurements and conclusions suggest that future research should aim to further clarify the trends identified in this study. Incorporating additional biomechanical analysis methods will be essential for gaining a more comprehensive understanding of spinal and whole-body biomechanics during Nordic Walking.
Author Contributions
Conceptualization, I.I., A.T., O.H., P.P., G.G.; methodology, I.I., A.T., O.H., P.P., G.G., S.I.; software, A.T., O.H.; validation, I.I., A.T.; formal analysis, I.I., A.T.; investigation, I.I., A.T., O.H., P.P., G.G., S.I.; resources, I.I., A.T., O.H.; data curation, A.T., O.H.; writing—original draft preparation, I.I., A.T.; writing—review and editing, I.I., A.T.; visualization, I.I., A.T., O.H.; supervision, I.I.; project administration, I.I.; funding acquisition, I.I., O.H., P.P., G.G., S.I. All authors have read and agreed to the published version of the manuscript.
Funding
This study was supported by Grant CRAS-11/21.02.2020 from the National Sports Academy, Sofia, Bulgaria.
Institutional Review Board Statement
The experimental procedure was approved by the Scientific Council of the Anatomy and biomechanics Department, NSA “Vassil Levski”, Sofia, Bulgaria, ПР2/31.01.2020.
Informed Consent Statement
All participants provided informed consent.
References
- Dae-JungYang, Yong-Seon Lee, Seung-KyuPark, Jeong-IlKang, Joon-Hee Lee, Yang-HoonKang, (2011). Biomechanical Analysis of Lower Limbs on Speed of Nordic Walking, Korean Journal of Sport Biomechanics Vol. 21, No. 3, 383-390. [CrossRef]
- Pérez-Soriano, P., Encarnación-Martínez, A., Aparicio-Aparicio, I., Giménez, J. V., &Llana-Belloch, S. (2014). Nordic walking: a systematic review. European Journal of Human Movement, 33, 26-45.
- Koizumi, T., Tsujiuchi, N., Takeda, M., &Murodate, Y. (2008). Physical motion analysis of Nordic walking. The Engineering of Sports, 7(2), 379-85. [CrossRef]
- Strutzenberger, G., Rasp, B., &Schwameder, H. (2007, December). Effect of walking speed and pole length on kinematics and dynamics in Nordic walking. In ISBS-Conference Proceedings Archive.
- Willson, J. O. H. N., Torry, M. R., Decker, M. J., Kernozek, T. H. O. M. A. S., & Steadman, J. R. (2001). Effects of walking poles on lower extremity gait mechanics. Medicine & Science in Sports & Exercise, 33(1), 142-14. [CrossRef]
- Encarnación-Martínez, A., Catalá-Vilaplana, I., Aparicio, I., Sanchis-Sanchis, R., Priego-Quesada, J. I., Jimenez-Perez, I., & Perez-Soriano, P. (2023). Does Nordic Walking technique influence the ground reaction forces?. Gait & Posture, 101, 35-40. [CrossRef]
- Tschentscher, M., Niederseer, D., & Niebauer, J. (2013). Health benefits of Nordic walking: a systematic review. American journal of preventive medicine, 44(1), 76-84. [CrossRef]
- Laguarta-Val S, Varillas-Delgado D, Lizcano-Álvarez Á, Molero-Sánchez A, Melian-Ortiz A, Cano-de-la-Cuerda R, Jiménez-Antona C. Effects of Aerobic Exercise Therapy through Nordic Walking Program in Lactate Concentrations, Fatigue and Quality-of-Life in Patients with Long-COVID Syndrome: A Non-Randomized Parallel Controlled Trial. Journal of Clinical Medicine. 2024; 13(4):1035. [CrossRef]
- Lizcano-Álvarez, Á., Varillas-Delgado, D., Cano-de-la-Cuerda, R., Jiménez-Antona, C., Melián-Ortiz, A., Molero-Sánchez, A., & Laguarta-Val, S. (2024). The Association of Genetic Markers Involved in Muscle Performance Responding to Lactate Levels during Physical Exercise Therapy by Nordic Walking in Patients with Long COVID Syndrome: A Nonrandomized Controlled Pilot Study. International Journal of Molecular Sciences, 25(15), 8305. [CrossRef]
- González-Devesa D, Varela S, Sanchez-Lastra MA, Ayán C. Nordic Walking as a Non-Pharmacological Intervention for Chronic Pain and Fatigue: Systematic Review. Healthcare. 2024; 12(12):1167. [CrossRef]
- Szpala, A., Winiarski, S., Kołodziej, M. et al. Effects of nordic walking training on gait and exercise tolerance in male ischemic heart disease patients. Sci Rep 14, 11249 (2024). [CrossRef]
- Czerwińska-Ledwig, O., Kryst, J., Ziemann, E., Borkowska, A., Reczkowicz, J., Dzidek, A., ... & Piotrowska, A. (2024). The Beneficial Effects of Nordic Walking Training Combined with Time-Restricted Eating 14/24 in Women with Abnormal Body Composition Depend on the Application Period. Nutrients, 16(10), 1413. [CrossRef]
- Athwale, R. M., & Shukla, M. P. (2024). Effect of supervised nordic walking on glycemic control and maximal aerobic capacity in patients with type 2 diabetes mellitus: a randomized controlled trial. European Journal of Physiotherapy, 27(2), 106–111. [CrossRef]
- Du, X., Gao, F., Wang, X., Lei, S. M., Cheng, S., & Le, S. (2025). The benefits of Nordic walking training on parameters related to sarcopenia in postmenopausal women with non-alcohol fatty liver disease and pre-diabetes: Secondary analyses of a randomized controlled trial. Science & Sports, 40(3), 233-238. [CrossRef]
- Cokorilo, N., Ruiz-Montero, P. J., González-Fernández, F. T., & Martín-Moya, R. (2022). An intervention of 12 weeks of Nordic walking and recreational walking to improve cardiorespiratory capacity and fitness in older adult women. Journal of Clinical Medicine, 11(10), 2900. [CrossRef]
- Della Guardia, L., Pellino, V. C., Filipas, L., Bonato, M., Gallo, G., Lovecchio, N., ... & Codella, R. (2023). Nordic Walking Improves Cardiometabolic Parameters, Fitness Performance, and Quality of Life in Older Adults With Type 2 Diabetes. Endocrine Practice, 29(2), 135-140. [CrossRef]
- Szpala, A., Winiarski, S., Kołodziej, M., Jasiński, R., Lejczak, A., Kałka, D., ... & Pietraszewski, B. (2024). Effects of nordic walking training on gait and exercise tolerance in male ischemic heart disease patients. Scientific Reports, 14(1), 11249. [CrossRef]
- Salse-Batán, J., Sanchez-Lastra, M. A., Suarez-Iglesias, D., Varela, S., & Ayan, C. (2022). Effects of Nordic walking in people with Parkinson's disease: A systematic review and meta-analysis. Health & Social Care in the Community, 30(5), e1505-e1520. [CrossRef]
- Saulicz, M., Saulicz, A., Myśliwiec, A., Knapik, A., Rottermund, J., & Saulicz, E. (2023). Effect of Nordic Walking Training on Physical Fitness and Self-Assessment of Health of People with Chronic Non-Specific Lower Back Pain. International Journal of Environmental Research and Public Health, 20(9), 5720. [CrossRef]
- Huang, Y. H., Fang, I. Y., & Kuo, Y. L. (2021, September). The influence of Nordic walking on spinal posture, physical function, and back pain in community-dwelling older adults: A pilot study. In Healthcare (Vol. 9, No. 10, p. 1303). MDPI. [CrossRef]
- Zoffoli L, Lucertini F, Federici A, et al. Trunk muscles activation during pole walking vs. walking performed at different speeds and grades. Gait Posture. 2016; 46:57–62. [CrossRef]
- Allet, L., Leemann, B., Guyen, E., Murphy, L., Monnin, D., Herrmann, F.R. y cols., (2009). Effect of different walking aids on walking capacity of patients with poststroke hemiparesis. Archives of Physical Medicine and Rehabilitation, 90(8), 1408-1413. [CrossRef]
- Church, T. S., Earnest, C. P., &Morss, G. M. (2002). Field testing of physiological responses associated withNordic walking. Research Quarterly for Exercise&Sport. 73(3), 296-300. [CrossRef]
- Jacobson, B. H., Caldwell, B., &Kulling, F. A. (1997). Comparison of hiking stickuse on lateral stability while balancing with and without a load. Perceptualandmotorskills, 85(1), 347-350. [CrossRef]
- Figard-Fabre, H., Fabre, N., Leonardi, A., y Schena, F. (2010). Physiological and perceptual responses to Nordic walking in obese middle-aged women in comparison with the normal walk. European Journal of Applied Physiology, 108(6), 1141-1151. [CrossRef]
- Gram, B., Christensen, R., Christiansen, C., y Gram, J. (2010). Effects of nordic walking and exercise in type 2 diabetes mellitus: A randomized controlled trial. Clinical Journal of Sport Medicine, 20(5), 355-361. [CrossRef]
- Mazumder, O., Poduval, M., Ghose, A., & Sinha, A. (2021, November). Walking Pole Gait to Reduce Joint Loading post Total Knee Athroplasty: Musculoskeletal modeling Approach. In 2021 43rd Annual International Conference of the IEEE Engineering in Medicine & Biology Society (EMBC) (pp. 4605-4610). IEEE.
- Kemp G, Crossley KM, Wrigley TV, Metcalf BR, Hinman RS. Reducing joint loading in medial knee osteoarthritis: shoes and canes. Arthritis and Rheumatism. 2008; vol:59, pp:609-614. [CrossRef]
- Mndermann A, Dyrby C, Hurwitz DE, Sharma L, Andriacchi TP. Potential strategies to reduce medial compartment loading in patients with knee osteoarthritis of varying severity. Arthritis and Rheumatism. 2004; vol:50, pp: 1172-1178. [CrossRef]
- Szpala, A.; Winiarski, S.; Kołodziej, M.; Pietraszewski, B.; Jasinski, R.; Niebudek, T.; Lejczak, A.; Lorek, K.; Bałchanowski, J.; Wudarczyk, S.; et al. Comparative Analysis of Gait Kinematics in Older Adults: Free Walking vs. Nordic Walking with Classic and Mechatronic Poles. Appl. Sci. 2024, 14, 3057. [CrossRef]
- Russo, L.; Belli, G.; Di Blasio, A.; Lupu, E.; Larion, A.; Fischetti, F.; Montagnani, E.; Di Biase Arrivabene, P.; De Angelis, M. The Impact of NordicWalking Pole Length on Gait Kinematic Parameters. J. Funct. Morphol. Kinesiol. 2023, 8, 50. [CrossRef]
- Dziuba, A.K.; Zurek, G.; Garrard, I.; Wierzbicka-Damska, I. Biomechanical Parameters in Lower Limbs during Natural Walking ˙ and Nordic Walking at Different Speeds. Acta Bioeng. Biomech. 2015, 17, 95–101.
- Schwameder, H.; Roithner, R.; Müller, E.; Niessen, W.; Raschner, C. Knee Joint Forces during Downhill Walking with Hiking Poles. J. Sport. Sci. 1999, 17, 969–978. [CrossRef]
- Jensen, S.B.; Henriksen, M.; Aaboe, J.; Hansen, L.; Simonsen, E.B.; Alkjær, T. Is It Possible to Reduce the Knee Joint Compression Force during Level Walking with Hiking Poles? Scand. J. Med. Sci. Sport. 2011, 21, e195–e200. [CrossRef]
- Willson, J.; Torry, M.R.; Decker, M.J.; Kernozek, T.; Steadman, J.R. Effects of Walking Poles on Lower Extremity Gait Mechanics. Med. Sci. Sport. Exerc. 2001, 33, 142–147. [CrossRef]
- Stief, F.; Kleindienst, F.I.; Wiemeyer, J.; Wedel, F.; Campe, S.; Krabbe, B. Inverse Dynamic Analysis of the Lower Extremities during Nordic Walking, Walking, and Running. J. Appl. Biomech. 2008, 24, 351–359. [CrossRef]
- Schiffer, T.; Knicker, A.; Hoffman, U.; Harwig, B.; Hollmann, W.; Strüder, H.K. Physiological Responses to Nordic Walking, Walking and Jogging. Eur. J. Appl. Physiol. 2006, 98, 56–61. [CrossRef]
- Perrey, S.; Fabre, N. Exertion during uphill, level and downhill walking with and without hiking poles. J. Sport. Sci. Med. 2008, 7, 32–38.
- Saunders, M.J.; Hipp, G.R.; Wenos, D.L.; Deaton, M.L. Trekking Poles Increase Physiological Responses to Hiking without Increased Perceived Exertion. J. Strength Cond. Res. 2008, 22, 1468–1474. [CrossRef]
- Figard-Fabre, H.; Fabre, N.; Leonardi, A.; Schena, F. Physiological and Perceptual Responses to Nordic Walking in Obese Middle-AgedWomen in Comparison with the NormalWalk. Eur. J. Appl. Physiol. 2010, 108, 1141–1151. [CrossRef]
- Hansen, E.A.; Smith, G. Energy Expenditure and Comfort during Nordic Walking with Different Pole Lengths. J. Strength Cond. Res. 2009, 23, 1187–1194. [CrossRef]
- Pellegrini, B., Boccia, G., Zoppirolli, C., Rosa, R., Stella, F., Bortolan, L., ... & Schena, F. (2018). Muscular and metabolic responses to different Nordic walking techniques, when style matters. PLoS One, 13(4), e0195438. [CrossRef]
- Pellegrini B, Peyre-Tartaruga LA, Zoppirolli C, Bortolan L, Bacchi E, Figard-Fabre H, et al. Exploring Muscle Activation during Nordic Walking: A Comparison between Conventional and Uphill Walking. PLoS One. 2015; 10(9). [CrossRef]
- Porcari JP, Hendrickson TL, Walter PR, Terry L, Walsko G. The physiological responses to walking with and without Power Poles on treadmill exercise. Res Q Exerc Sport. 1997; 68(2):161–6. [CrossRef] [PubMed]
- Church TS, Earnest CP, Morss GM. Field testing of physiological responses associated with Nordic Walking. Res Q Exerc Sport. 2002; 73(3):296–300. [CrossRef] [PubMed]
- Figard-Fabre H, Fabre N, Leonardi A, Schena F. Physiological and perceptual responses to Nordic walking in obese middle-aged women in comparison with the normal walk. Eur J Appl Physiol. 2010; 108(6):1141–51. [CrossRef] [PubMed]
- Gertheiss, J., Rügamer, D., Liew, B.X.W. and Greven, S. (2024), Functional Data Analysis: An Introduction and Recent Developments. Biometrical Journal., 66: e202300363. [CrossRef]
- Górecki, Tomasz, and Łukasz Smaga. 2019. “fdANOVA: An r Software Package for Analysis of Variance for Univariate and Multivariate Functional Data.” Computational Statistics 34 (2): 571–97. [CrossRef]
- Ramsay, James O, and Bernard W Silverman. 2002. Applied Functional Data Analysis: Methods and Case Studies. Springer.
- Smaga, Łukasz. 2020. “A Note on Repeated Measures Analysis for Functional Data.” AStA Advances in Statistical Analysis 104 (1): 117–39. [CrossRef]
- Martı́nez-Camblor, Pablo, and Norberto Corral. 2011. “Repeated Measures Analysis for Functional Data.” Computational Statistics & Data Analysis 55 (12): 3244–56.
- Kuryło, K., & Smaga, Ł. (2024). Functional repeated measures analysis of variance and its application. Statistics in Transition new series, 25(2), 185-204. [CrossRef]
- R Core Team. 2023. R: A Language and Environment for Statistical Computing. Vienna, Austria: R Foundation for Statistical Computing. https://www.R-project.org/.
- Ko, J. B., Kim, K. B., Shin, Y. S., Han, H., Han, S. K., Jung, D. Y., & Hong, J. S. (2021). Predicting sarcopenia of female elderly from physical activity performance measurement using machine learning classifiers. Clinical Interventions in Aging, 1723-1733. [CrossRef]
- Tudor, G. S. J., Bernstein, D., Riley, S., Rimmer, Y., Thomas, S. J., Van Herk, M., & Webster, A. (2020). Geometric uncertainties in daily online IGRT: refining the CTV-PTV margin for contemporary photon radiotherapy. Br Inst Radiol.
- Huang, Y.-H.; Fang, I.-Y.; Kuo, Y.-L. The Influence of Nordic Walking on Spinal Posture, Physical Function, and Back Pain in Community-Dwelling Older Adults: A Pilot Study. Healthcare 2021, 9, 1303. [CrossRef]
- Dalton, C.; Nantel, J. Nordic walking improves postural alignment and leads to a more normal gait pattern following weeks of training: A pilot study. J. Aging Phys. Act. 2016, 24, 575–582. [CrossRef]
- Zoffoli, L.; Lucertini, F.; Federici, A.; Ditroilo, M. Trunk muscles activation during pole walking vs. walking performed at different speeds and grades. Gait Posture 2016, 46, 57–62. [CrossRef]
- Hanuszkiewicz, J.; Woźniewski, M.; Malicka, I. The influence of Nordic walking on isokinetic trunk muscle endurance and sagittal spinal curvatures in women after breast cancer treatment: Age-specific indicators. Int J. Environ. Res. Public Health 2021, 18, 2409. [CrossRef]
- Gougeon, M.A.; Zhou, L.; Nantel, J. Nordic Walking improves trunk stability and gait spatial-temporal characteristics in people with Parkinson disease. NeuroRehabilitation 2017, 41, 205–210. [CrossRef]
Figure 1.
Experimental structure of data collection.
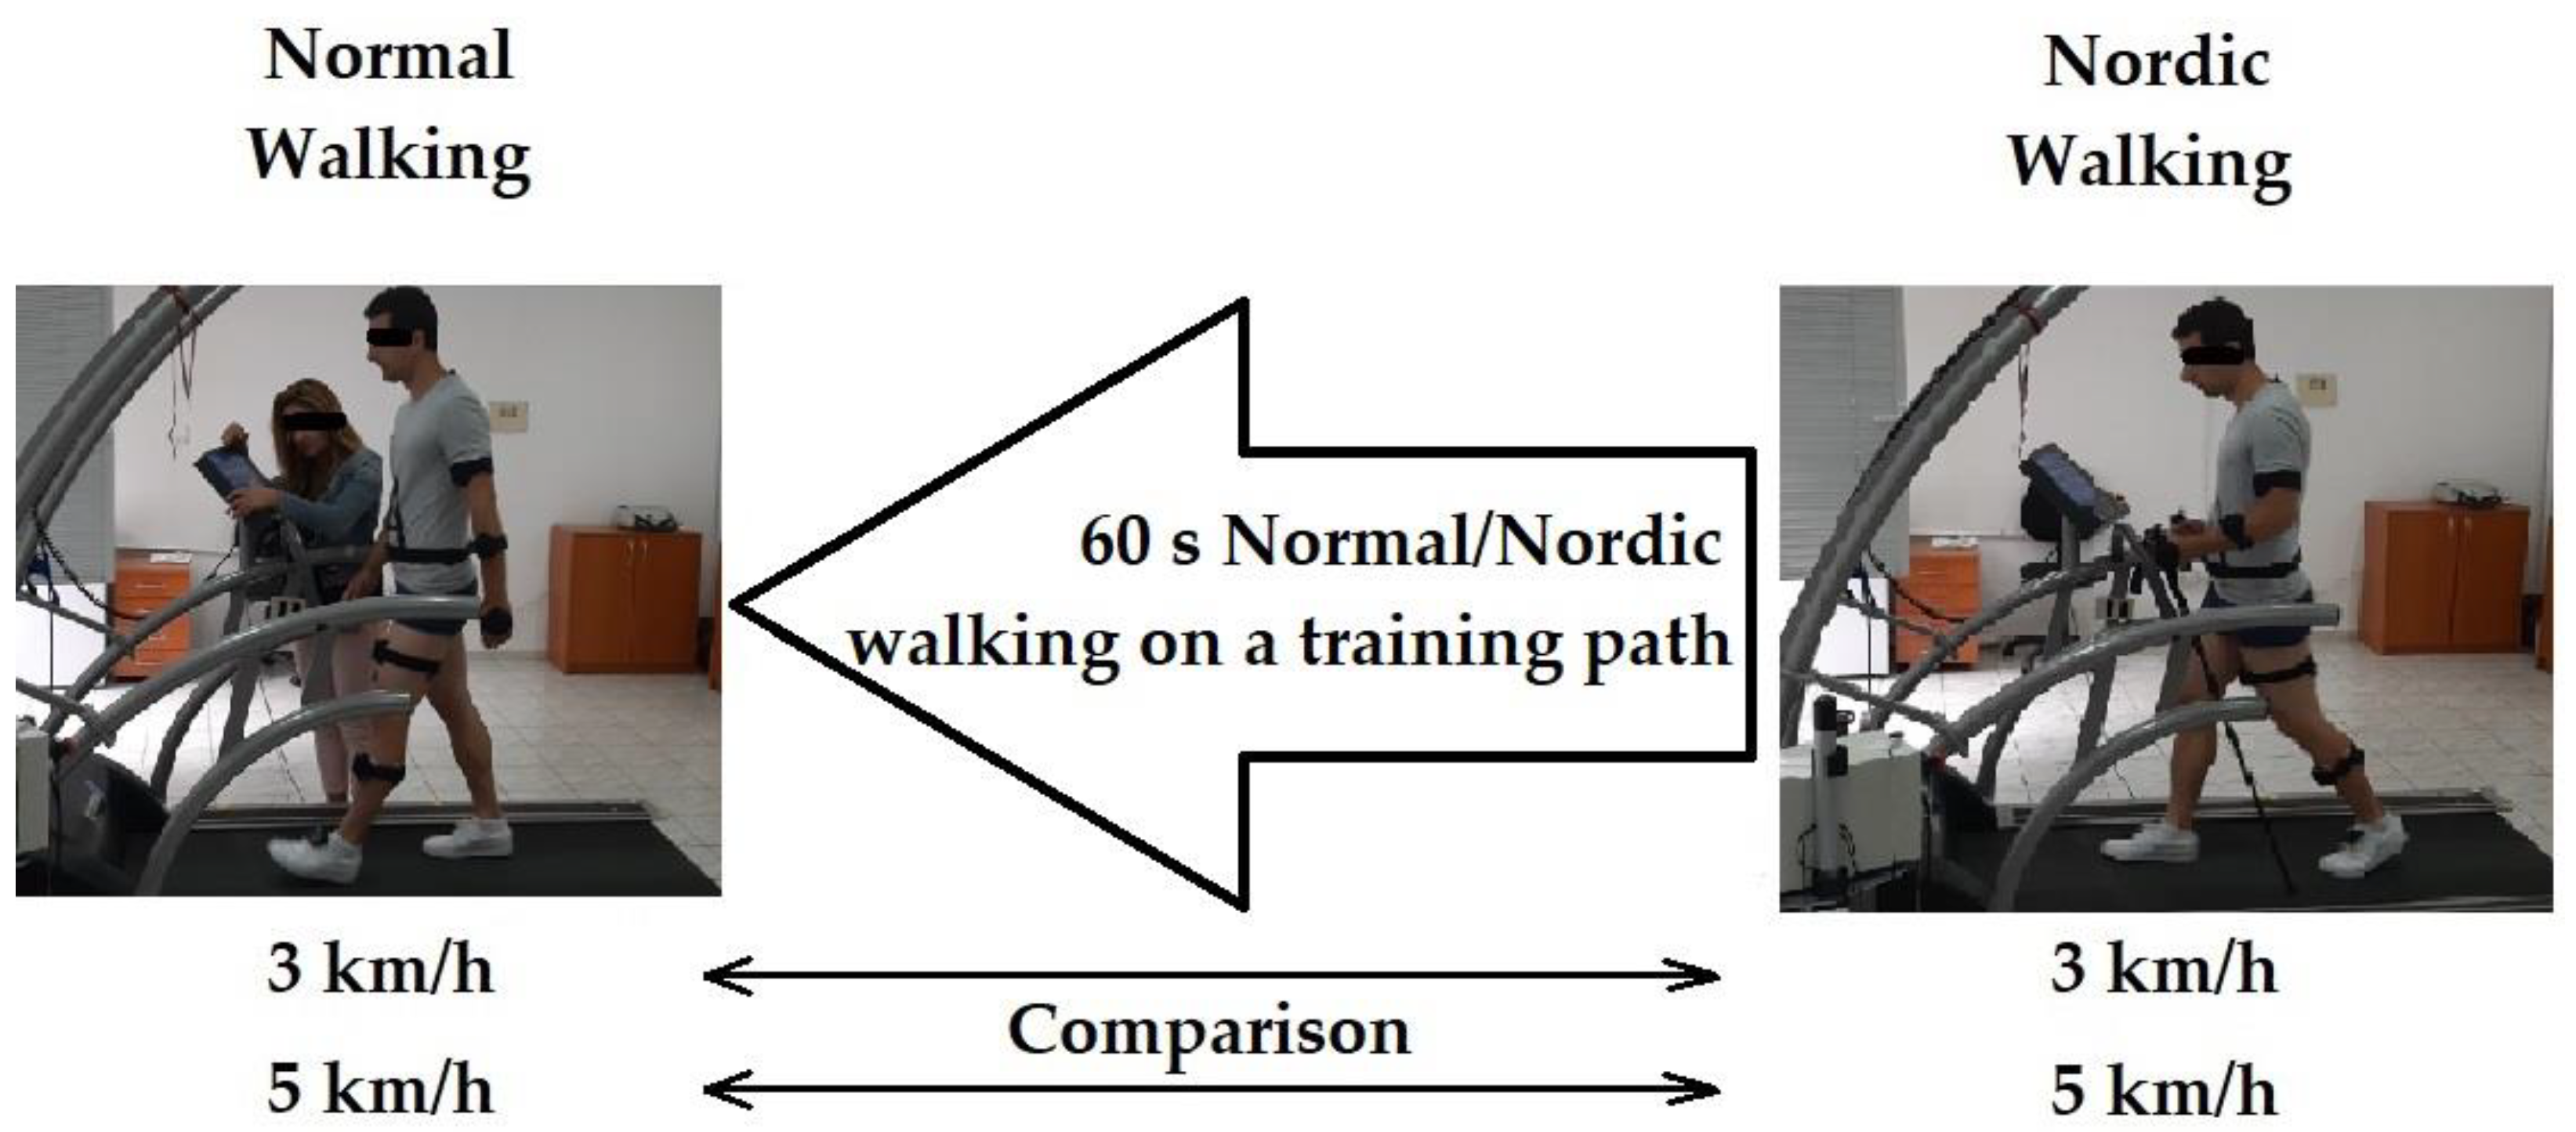
Figure 2.
IMU senzors placement geometry.
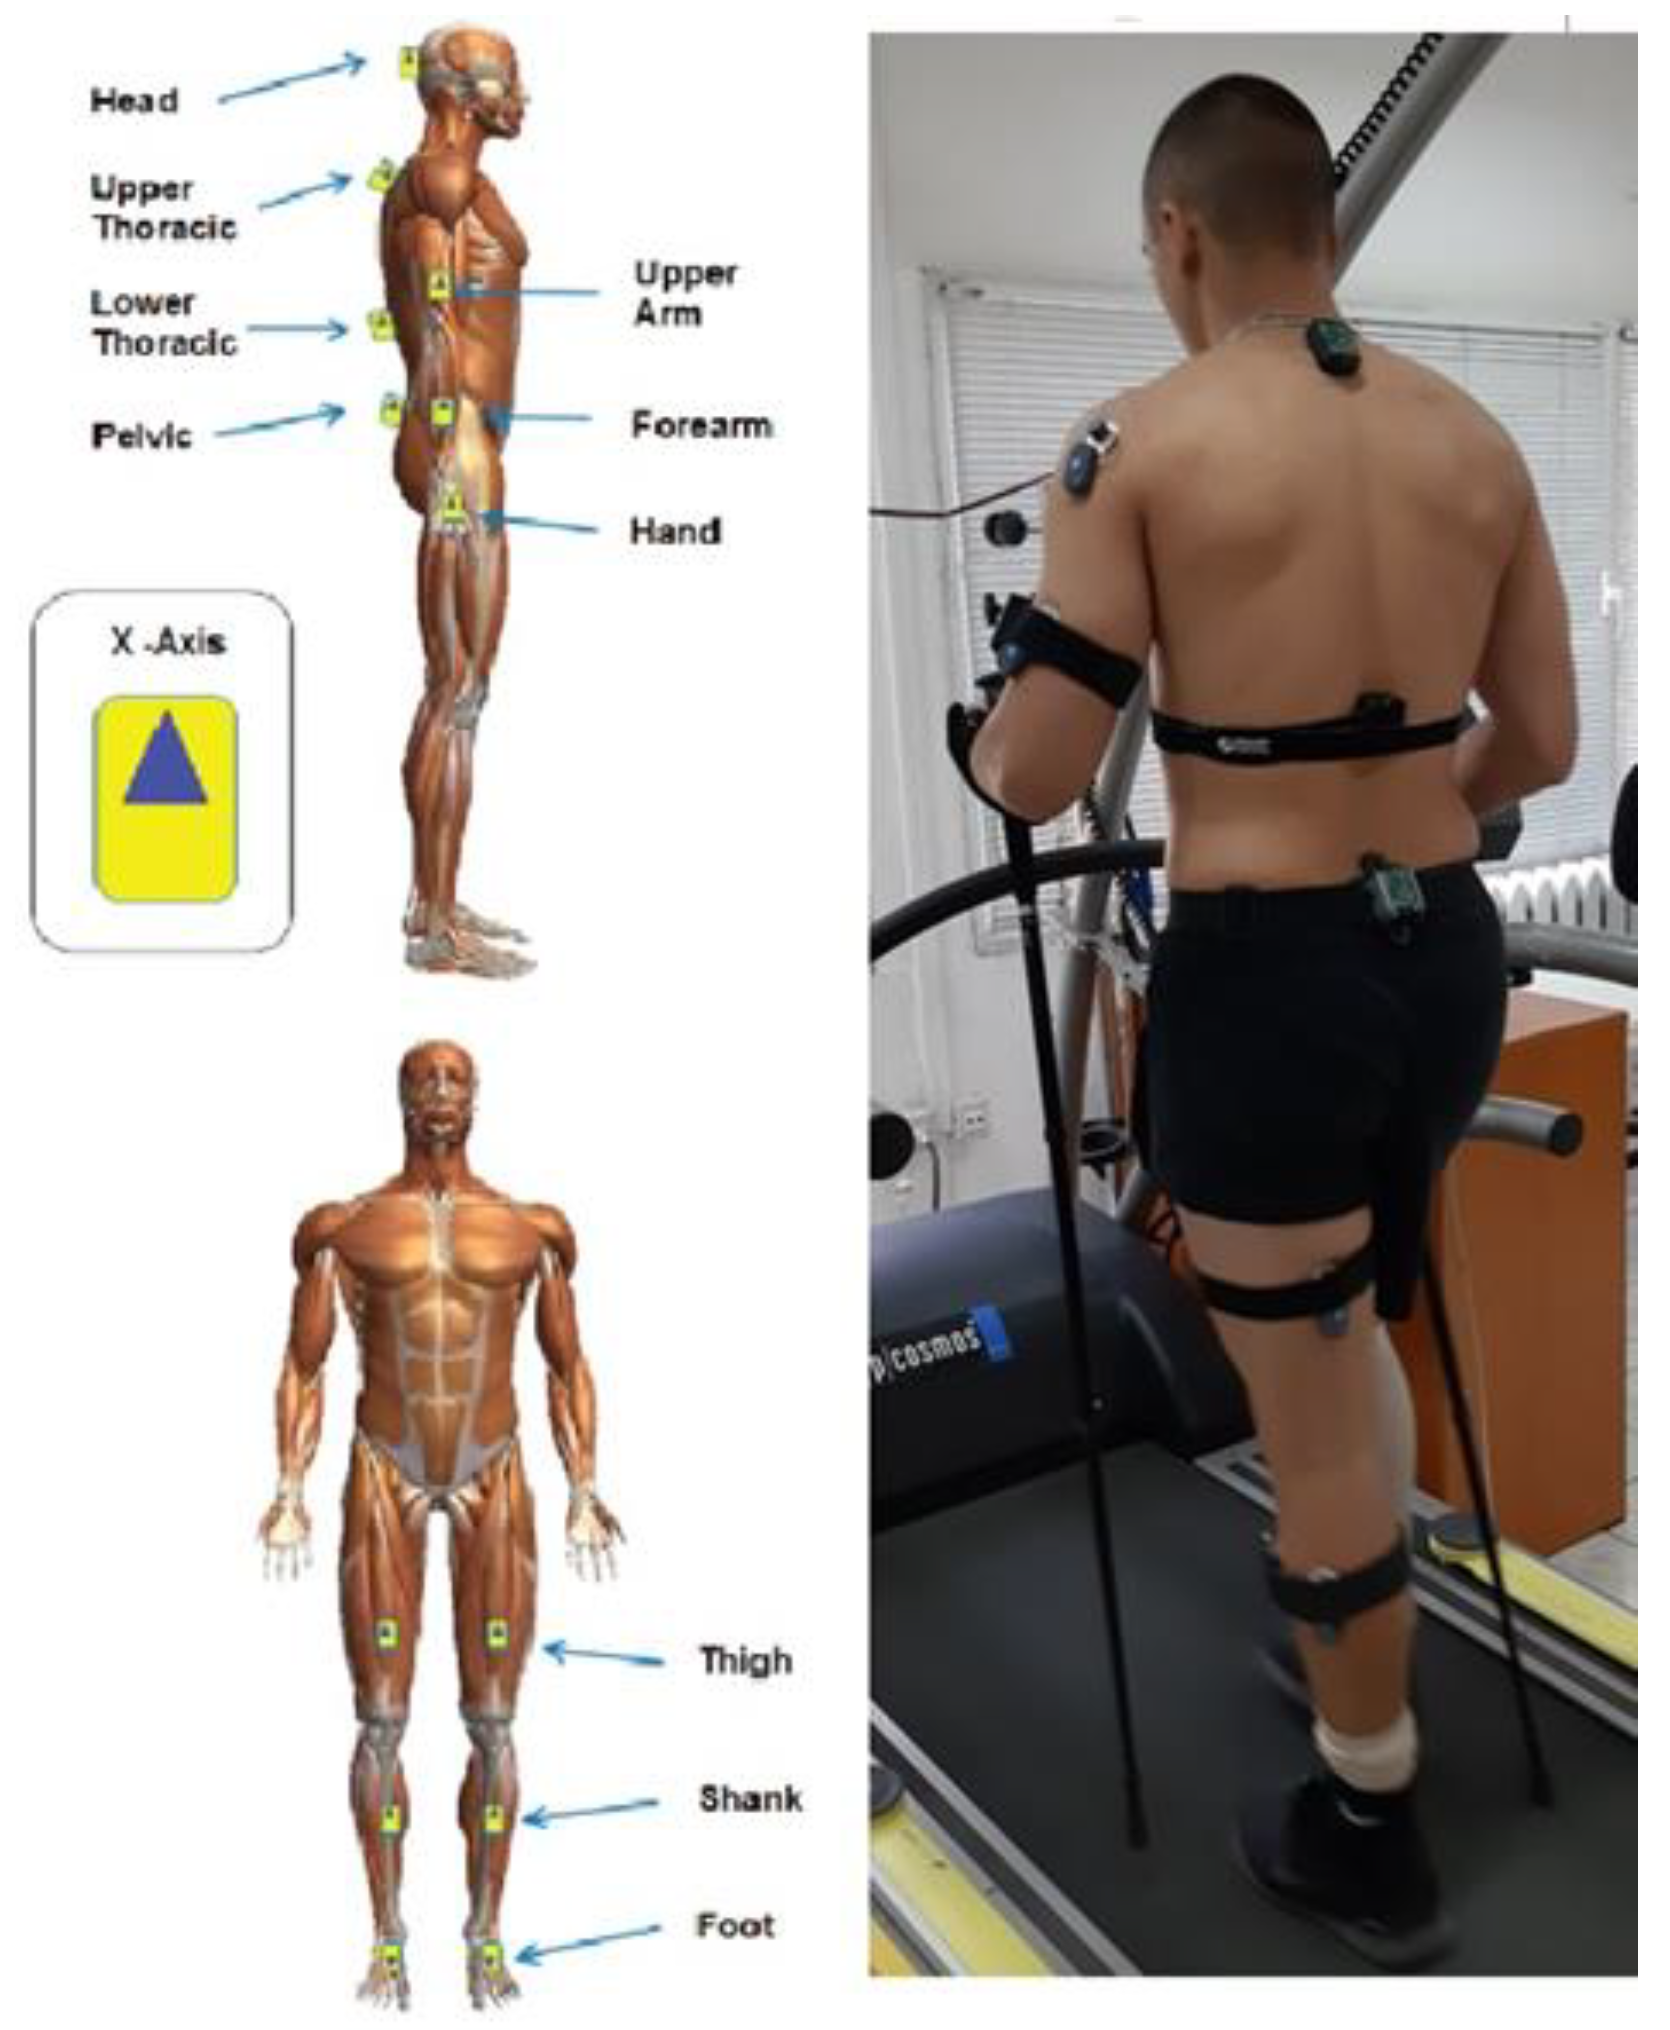
Figure 4.
Upper spine course data of two walking velocities (3 km/h data is on left, 5 km/h data is on right).
Figure 4.
Upper spine course data of two walking velocities (3 km/h data is on left, 5 km/h data is on right).
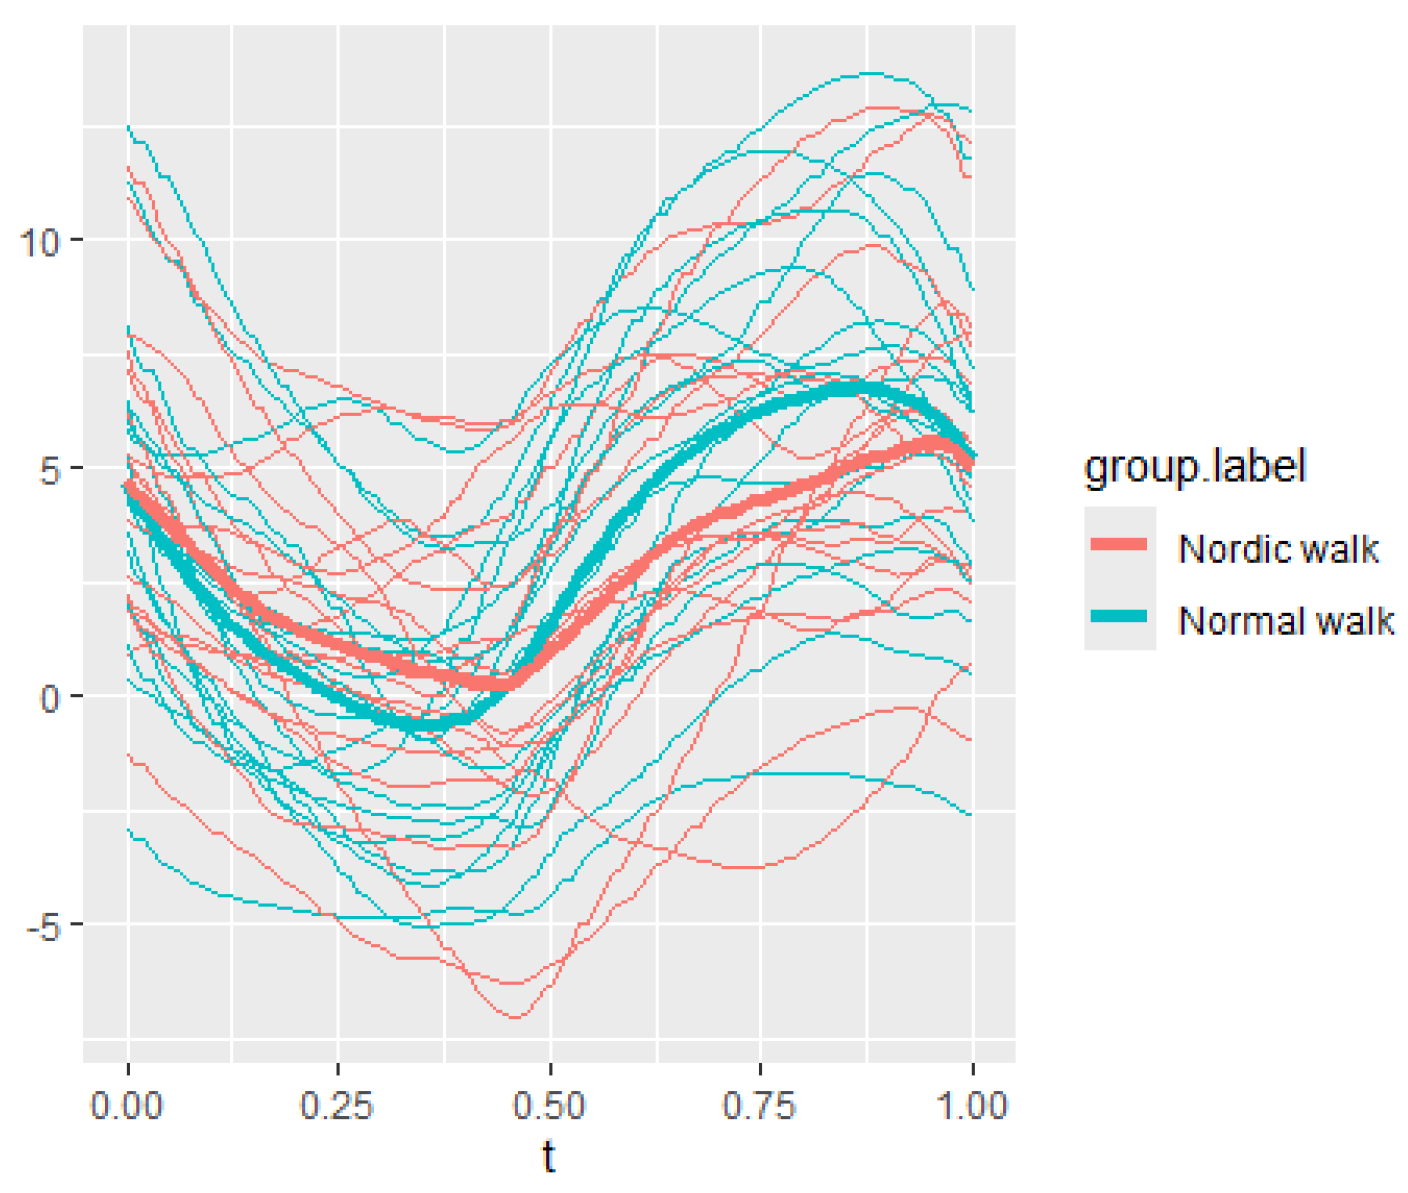
Figure 5.
Upper spine pitch data of both walking velocities (3 km/h data is on left, 5 km/h data is on right).
Figure 5.
Upper spine pitch data of both walking velocities (3 km/h data is on left, 5 km/h data is on right).
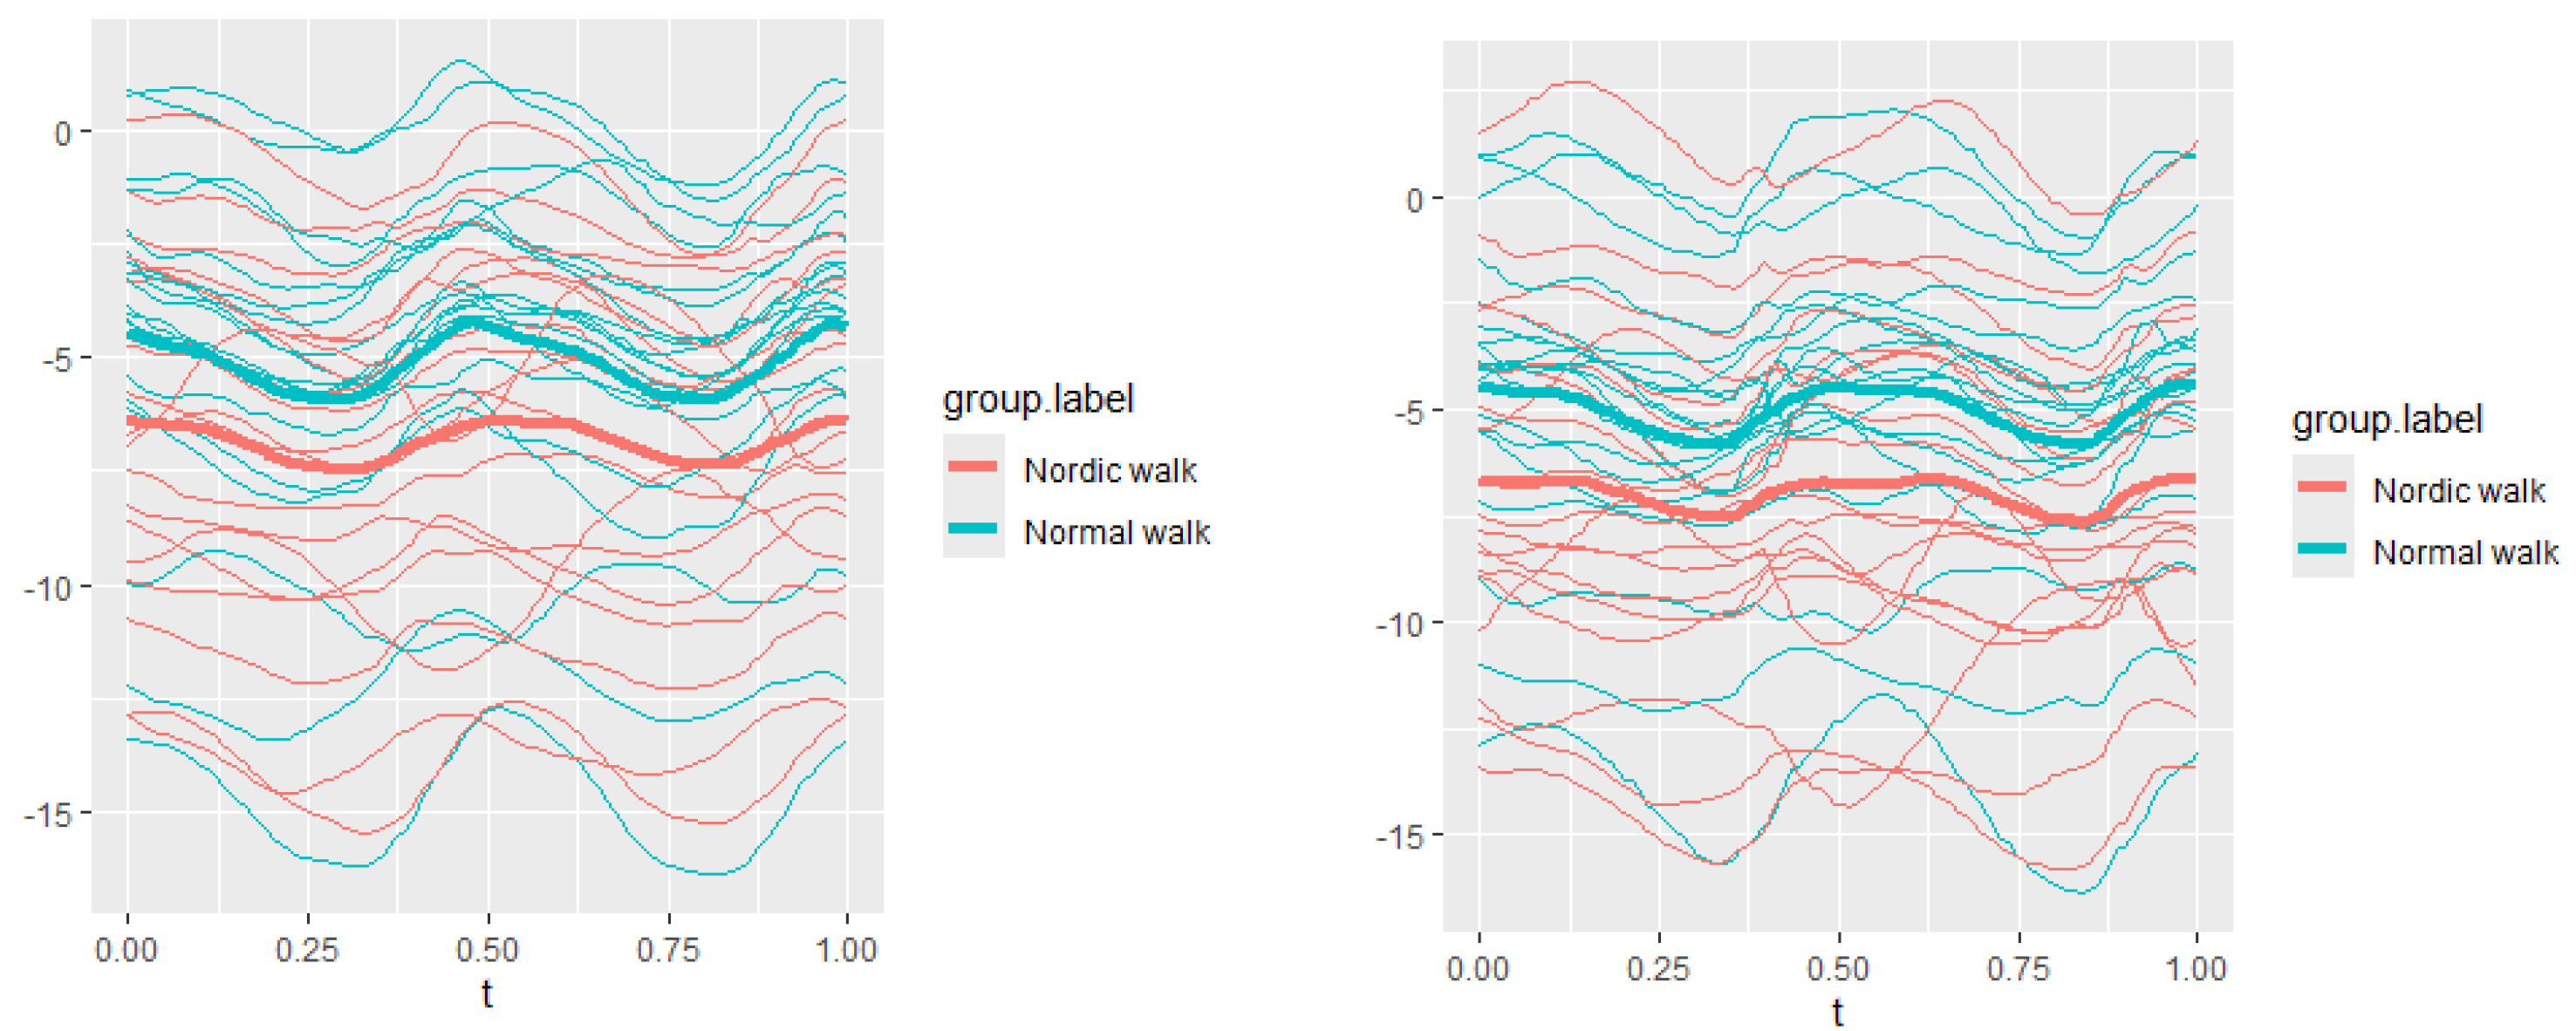
Figure 6.
Upper spine roll data of two walking velocities (3 km/h data is on left, 5 km/h data is on right).
Figure 6.
Upper spine roll data of two walking velocities (3 km/h data is on left, 5 km/h data is on right).
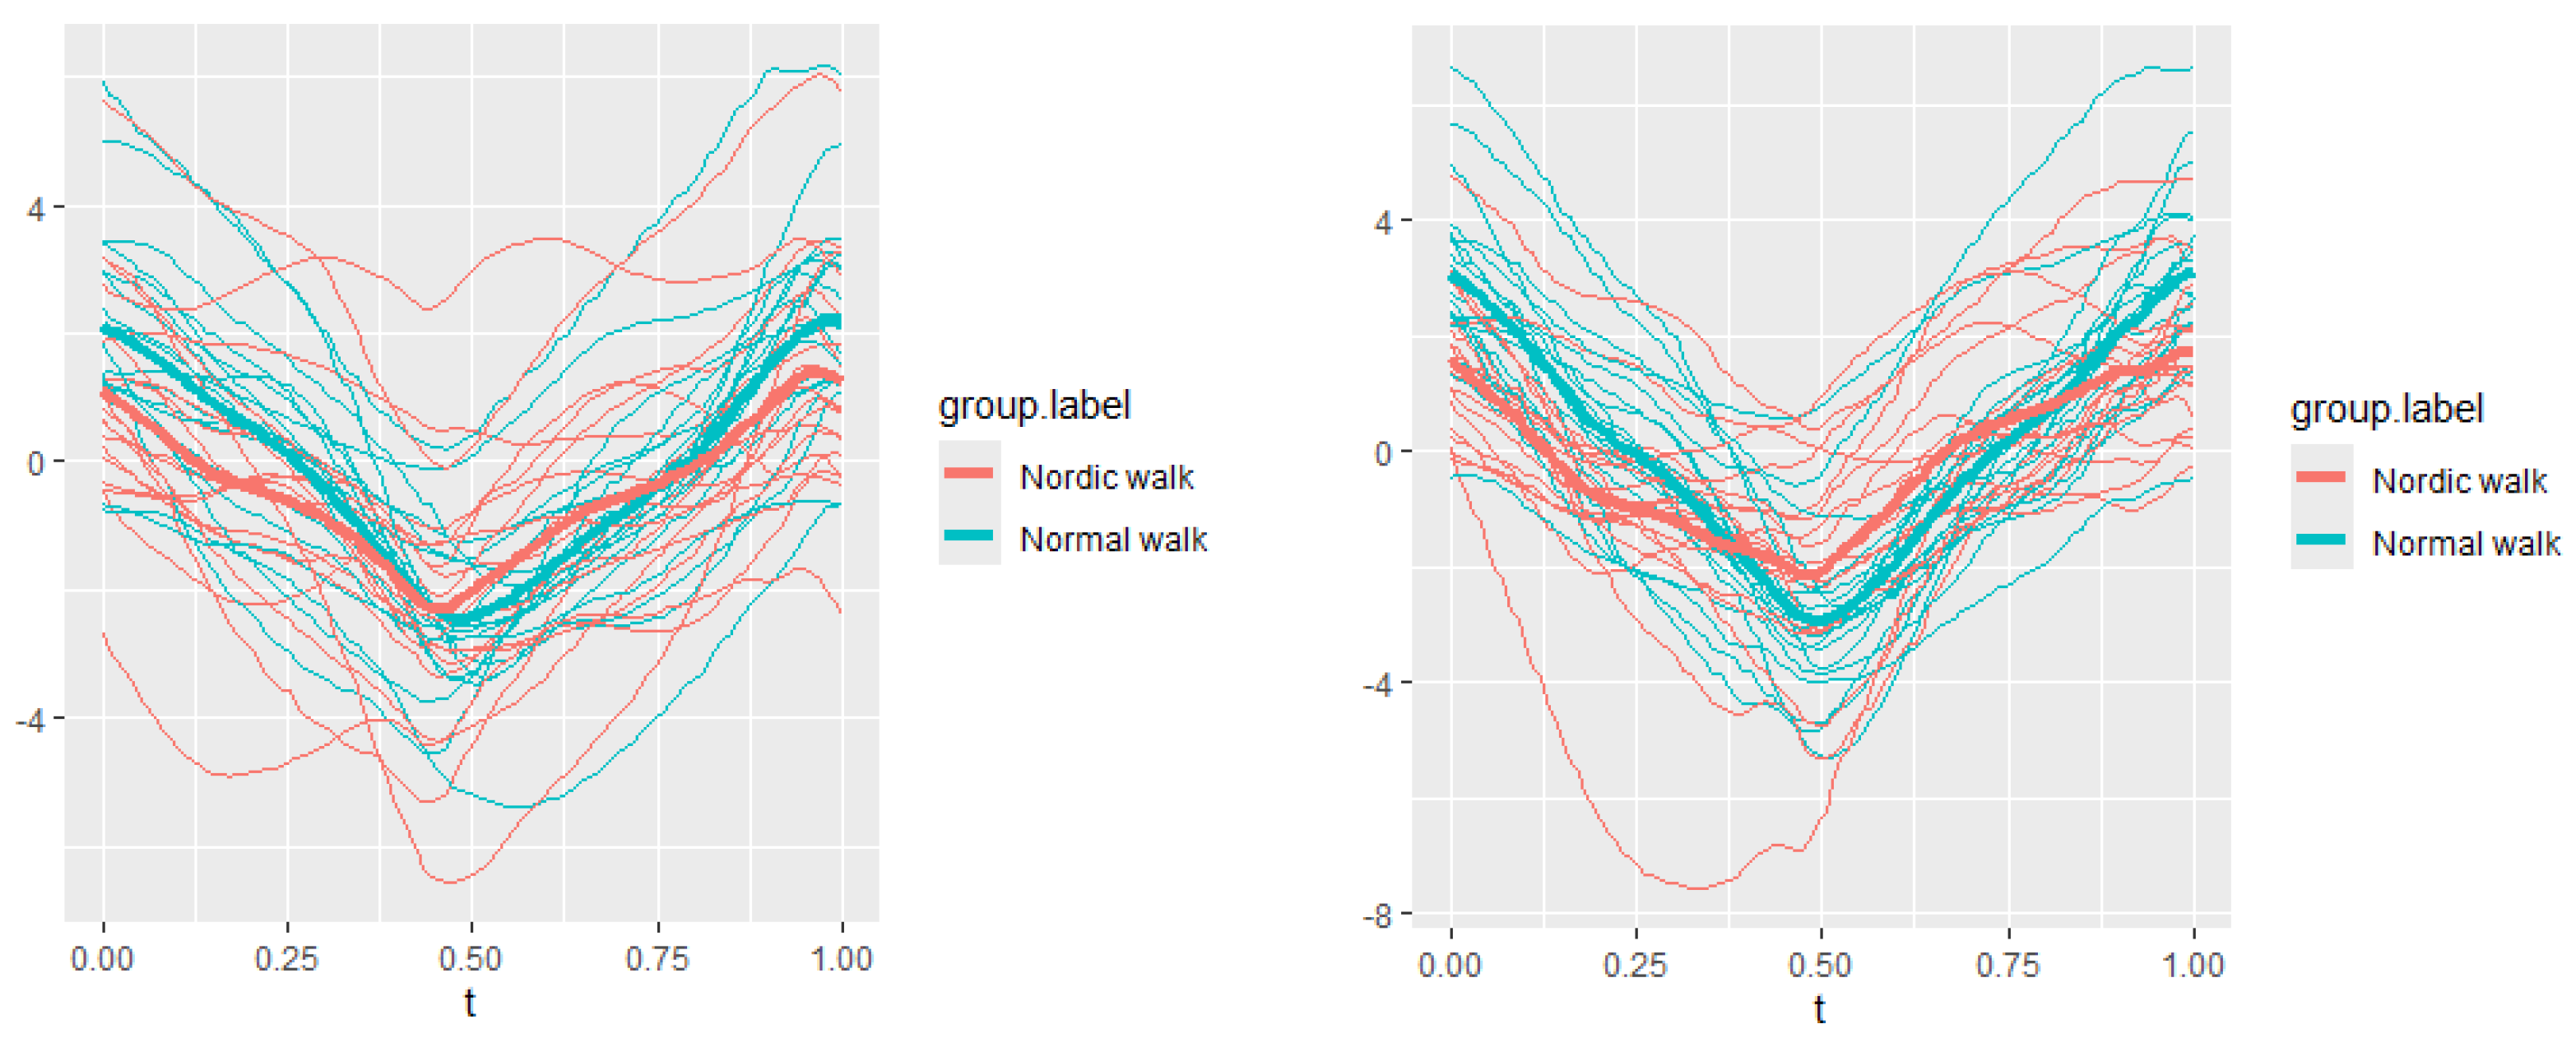
Figure 7.
Pointwise SSA(t) statistics for upper spine course angle at 3 and 5 km/h.
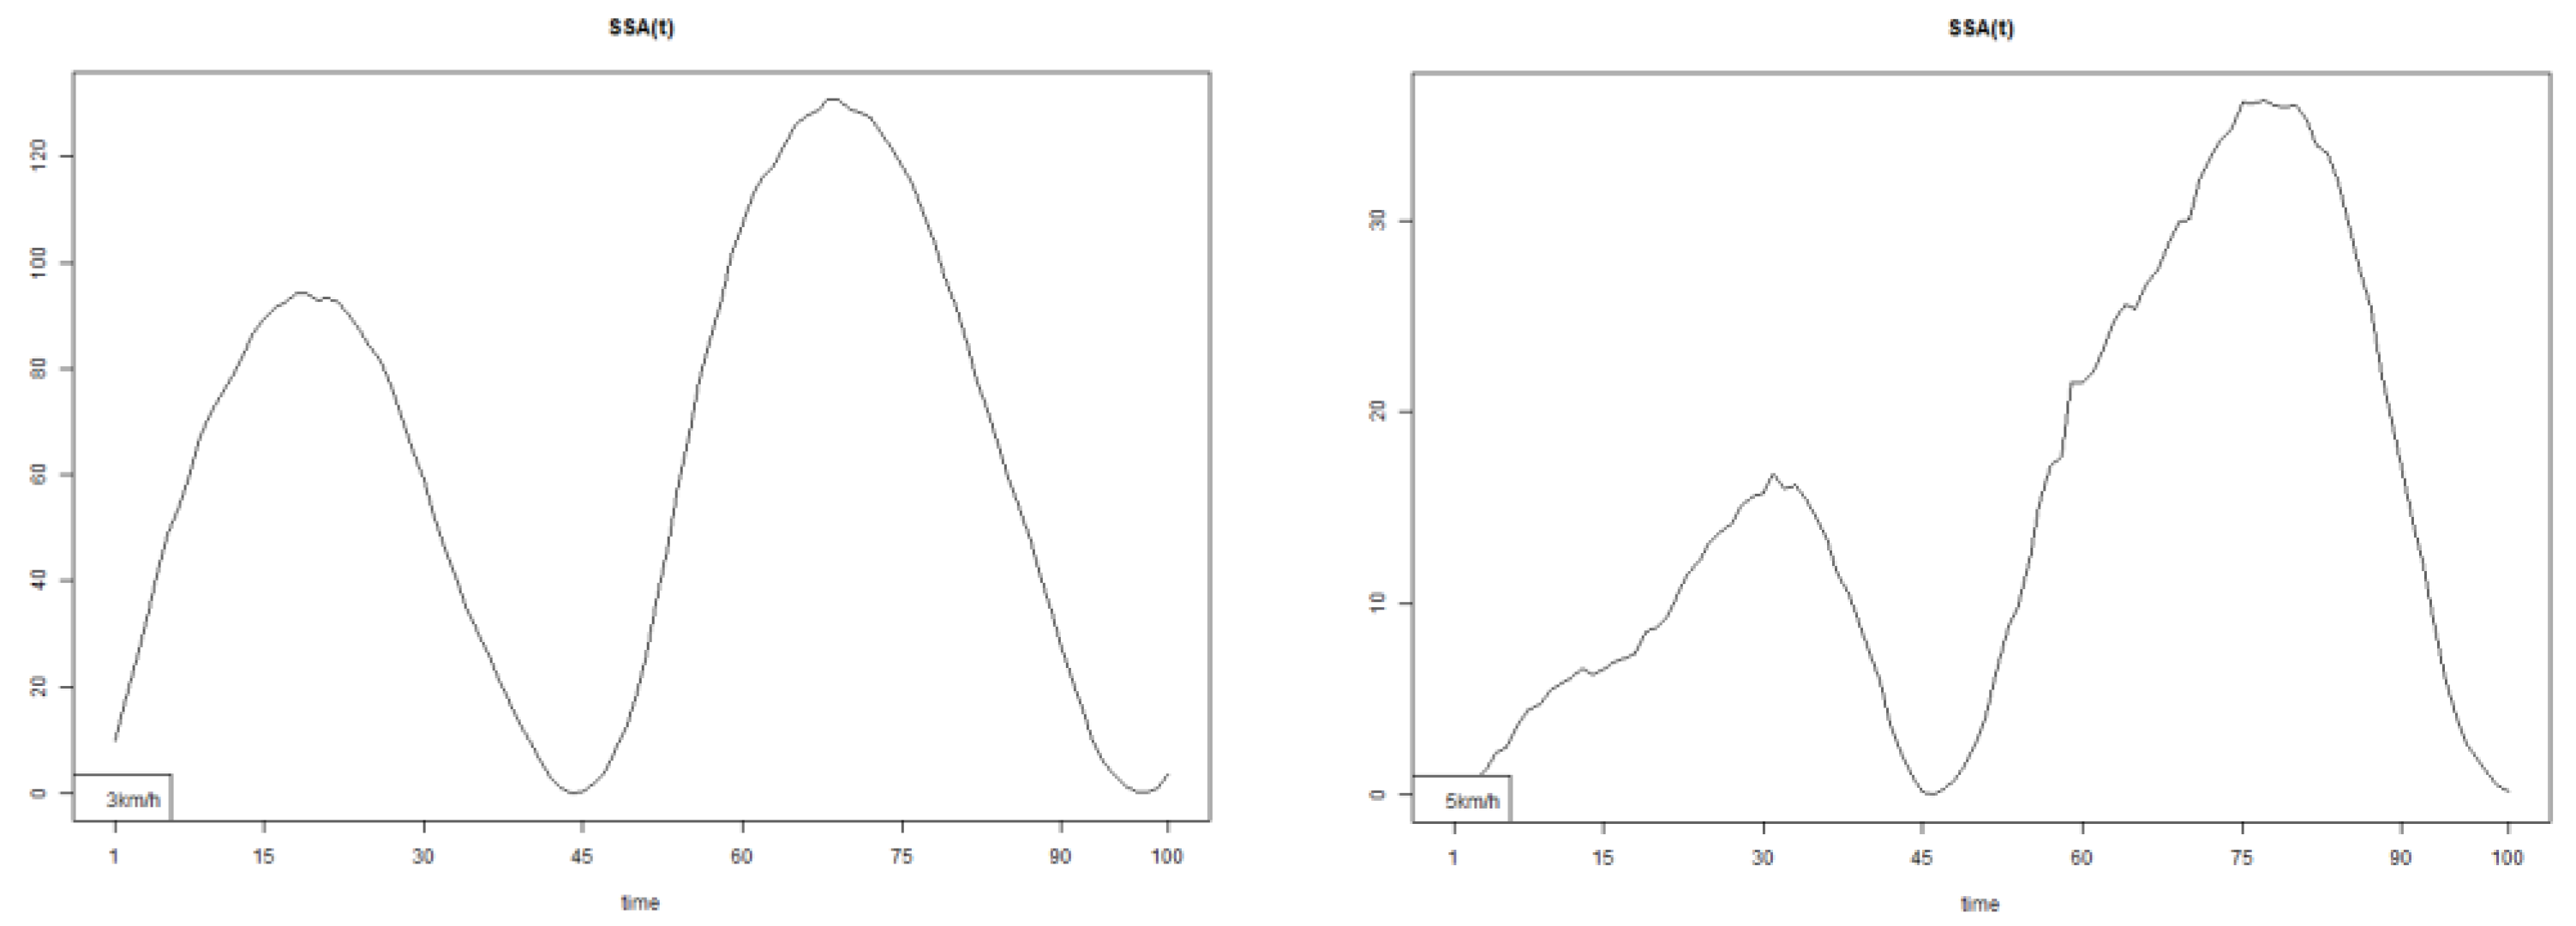
Figure 8.
Pointwise SSA(t) statistics for upper spine pitch angle at 3 and 5 km/h.
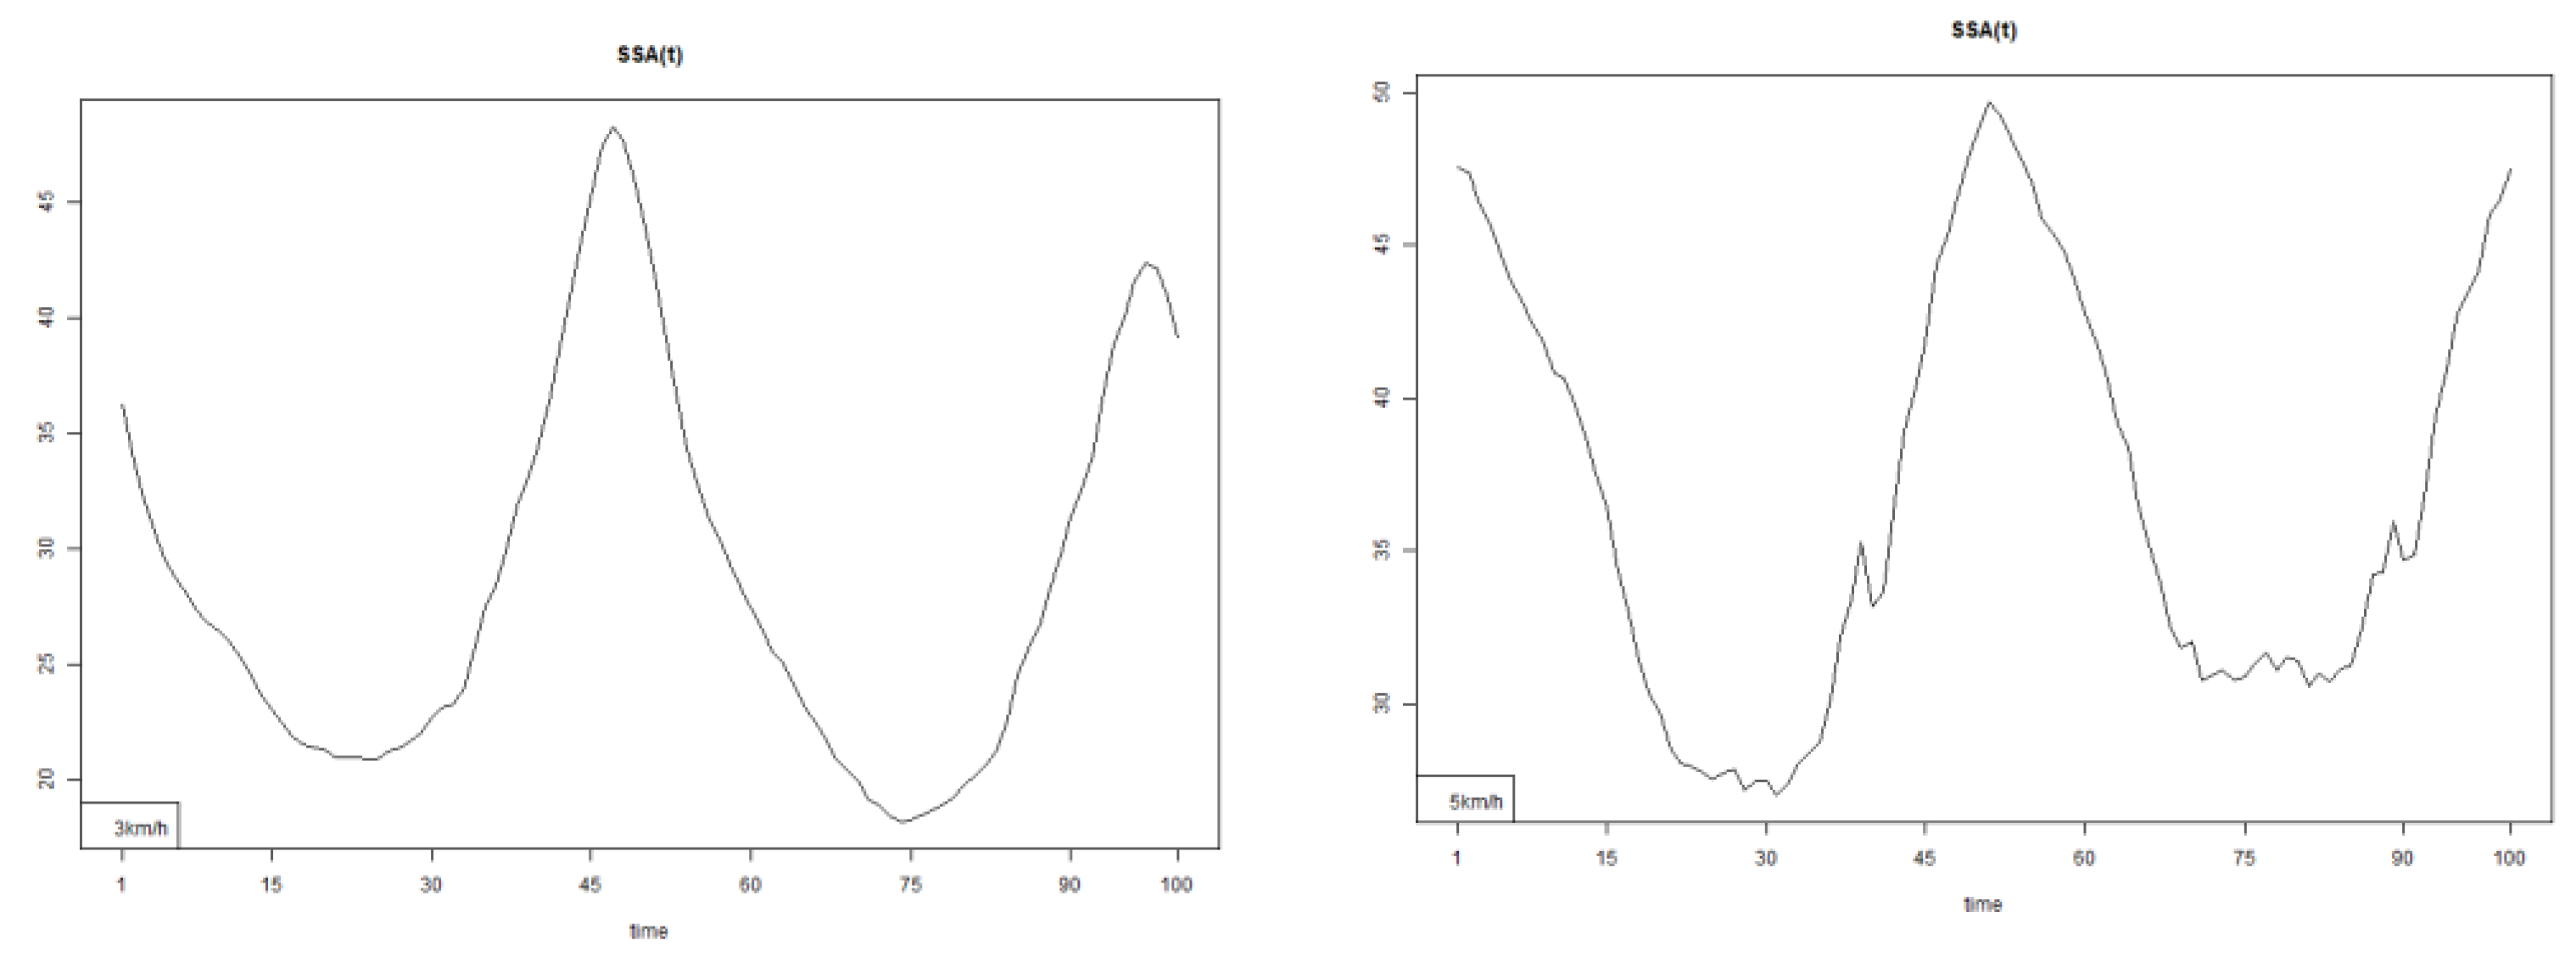
Figure 9.
Pointwise SSA(t) statistics for upper spine roll angle at 3 and 5 km/h.
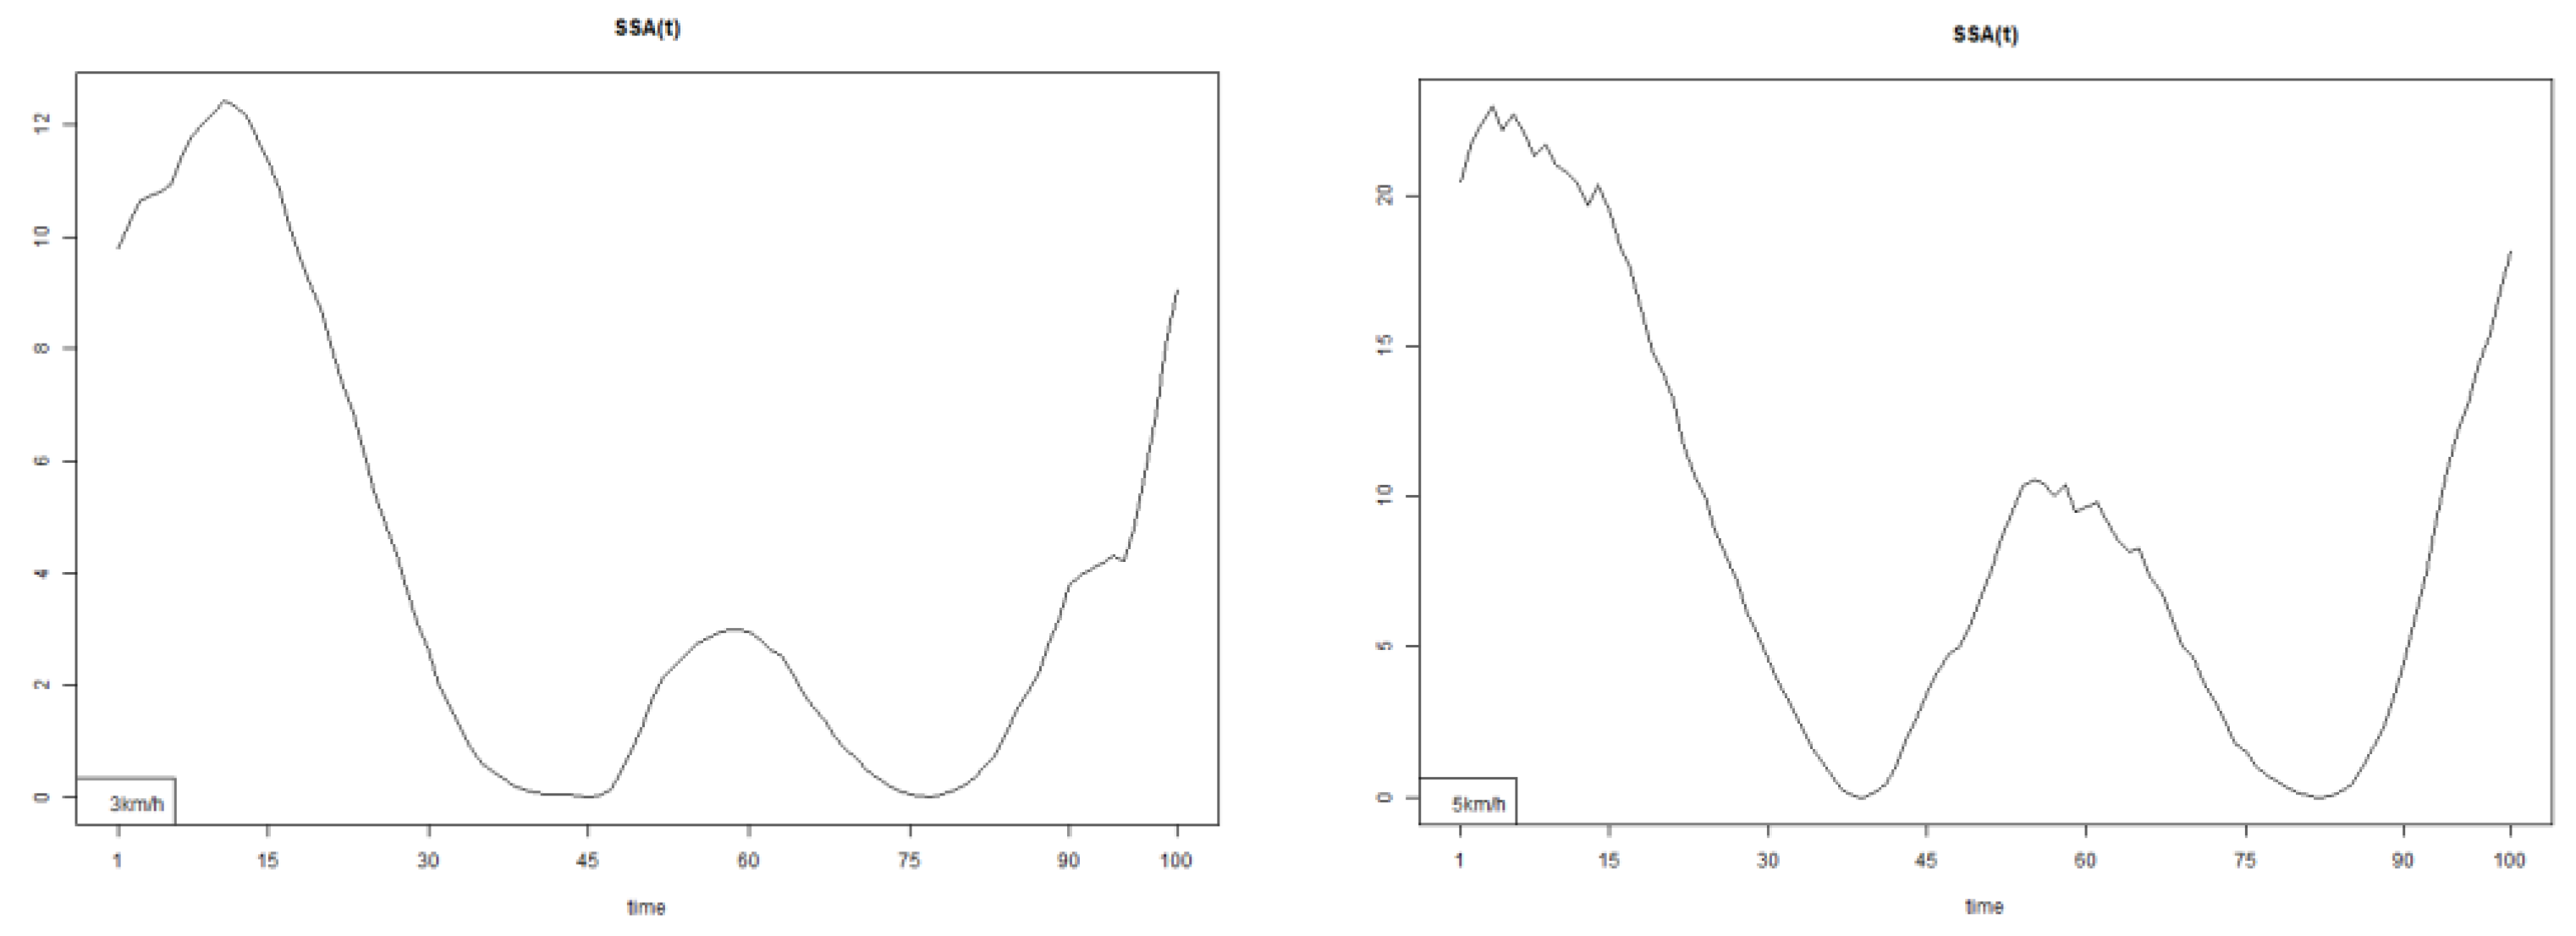
Figure 10.
Lower spine course data of two walking velocities (3 km/h data is on left, 5 km/h data is on right).
Figure 10.
Lower spine course data of two walking velocities (3 km/h data is on left, 5 km/h data is on right).
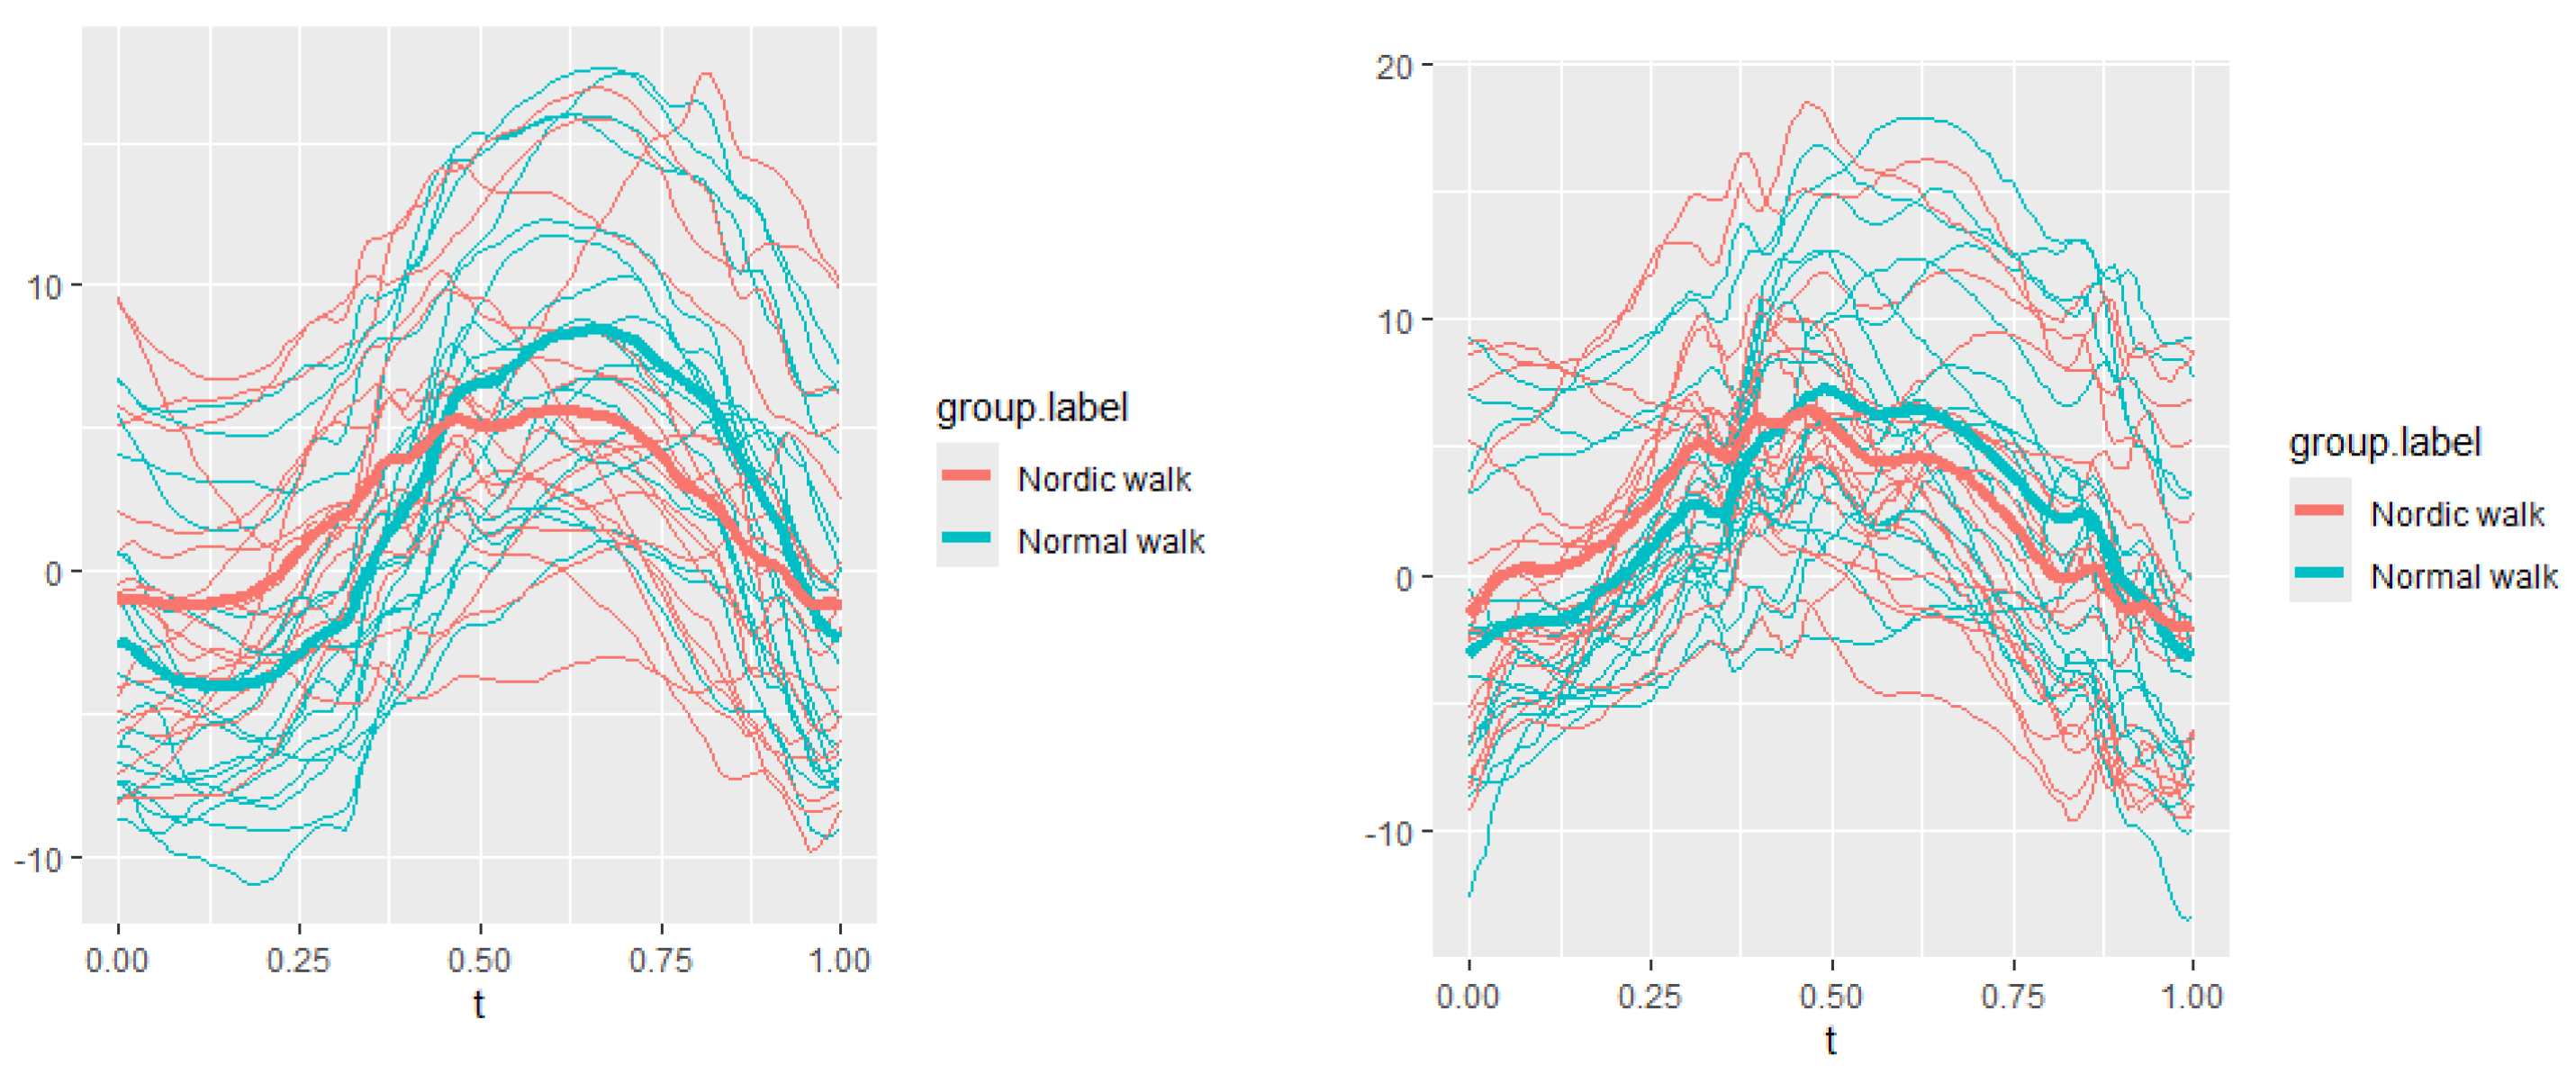
Figure 11.
Lower spine pitch data of two walking velocities (3 km/h data is on left, 5 km/h data is on right).
Figure 11.
Lower spine pitch data of two walking velocities (3 km/h data is on left, 5 km/h data is on right).
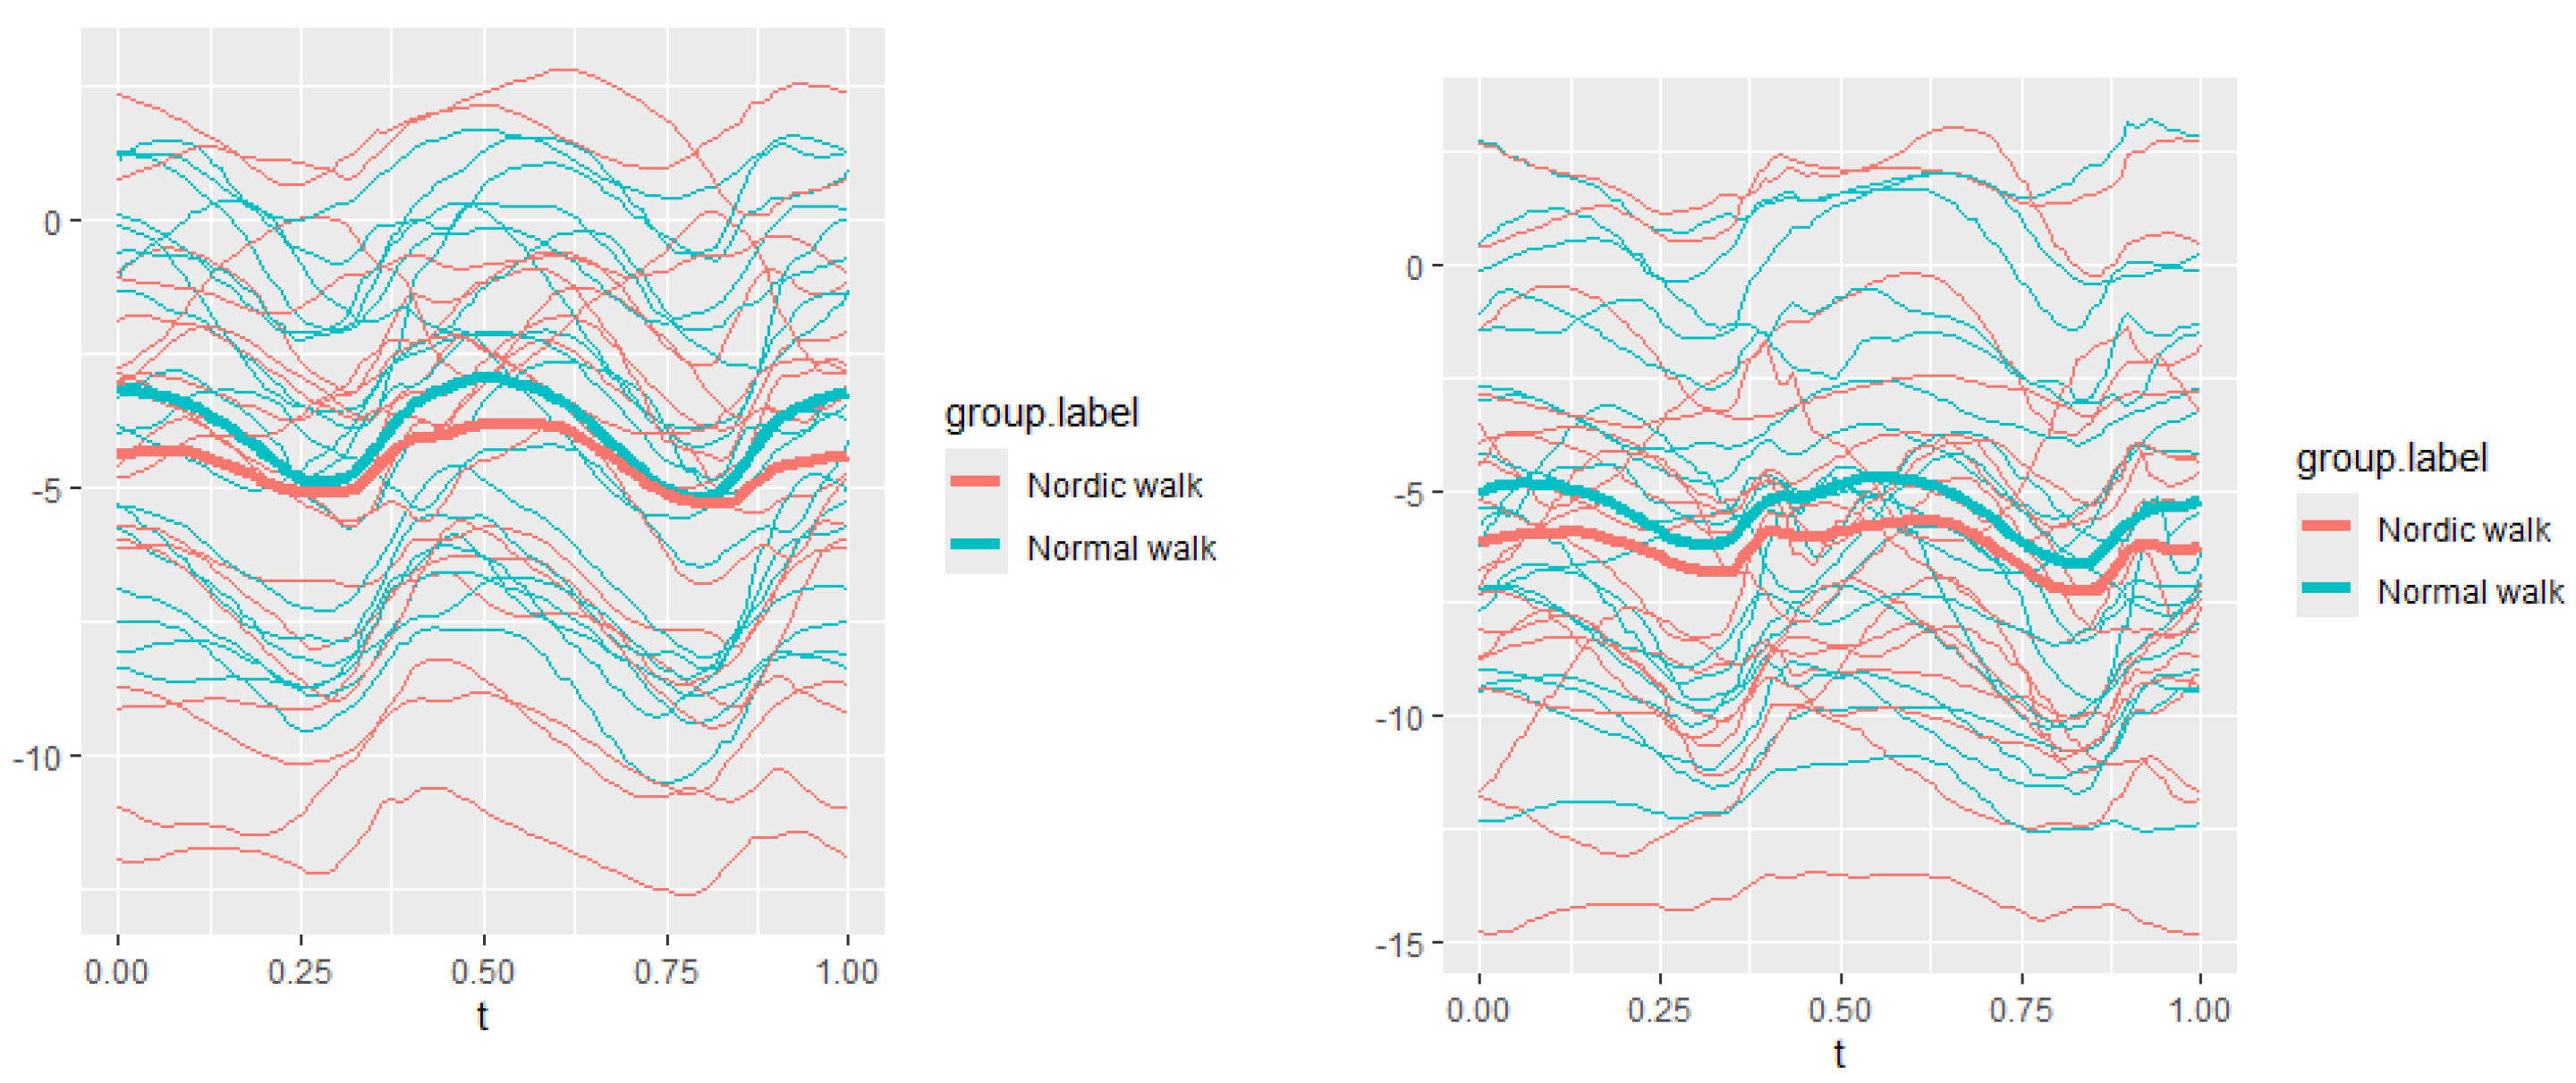
Figure 12.
Lower spine roll data of two walking velocities (3 km/h data is on left, 5 km/h data is on right).
Figure 12.
Lower spine roll data of two walking velocities (3 km/h data is on left, 5 km/h data is on right).
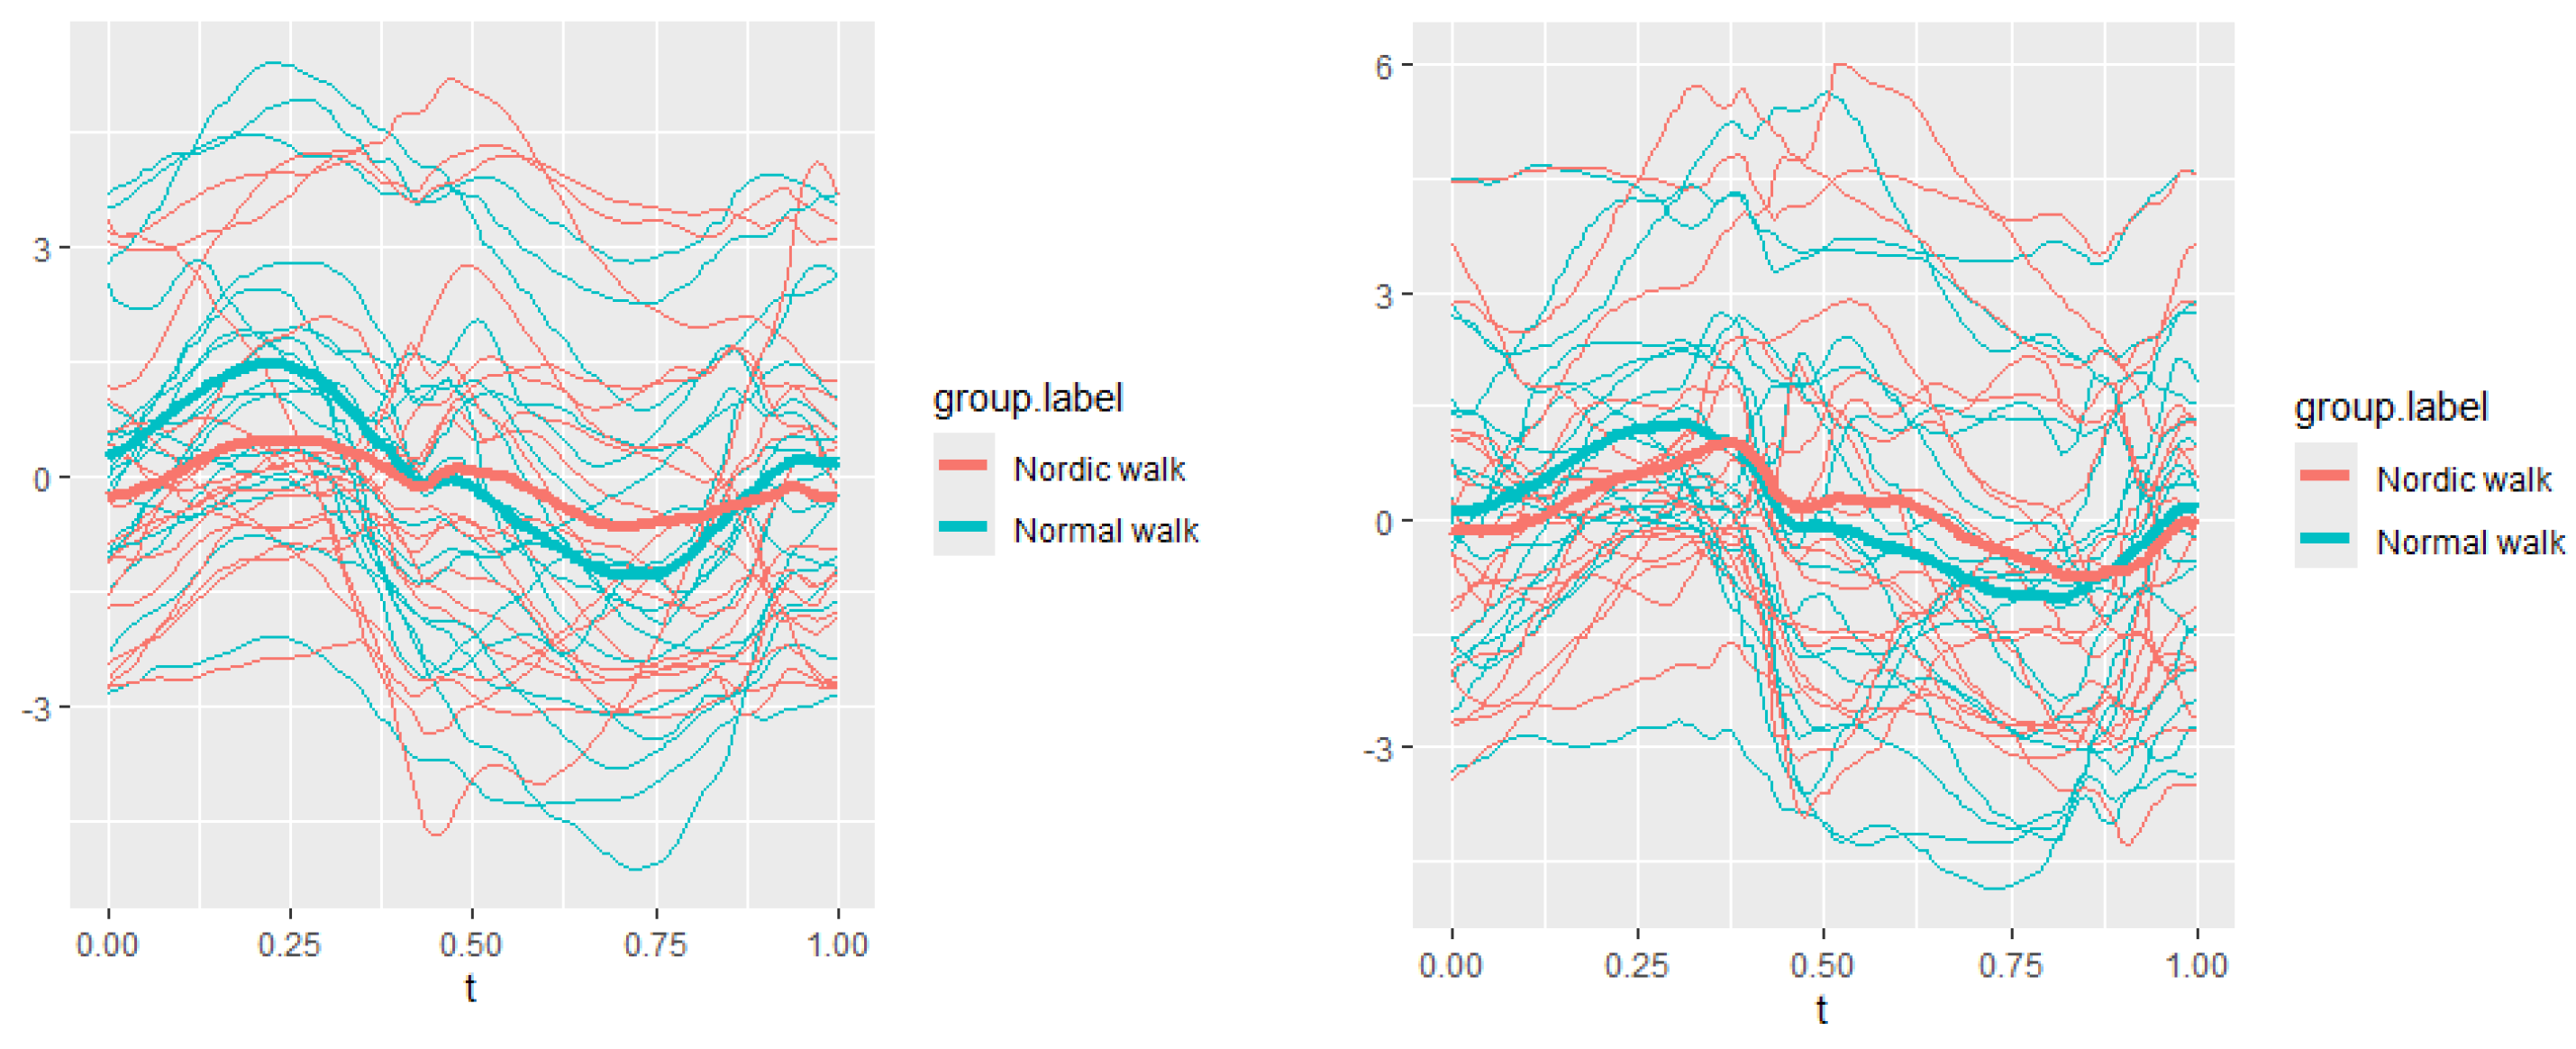
Figure 13.
Pointwise SSA(t) statistics for lower spine course angle at 3 and 5 km/h.
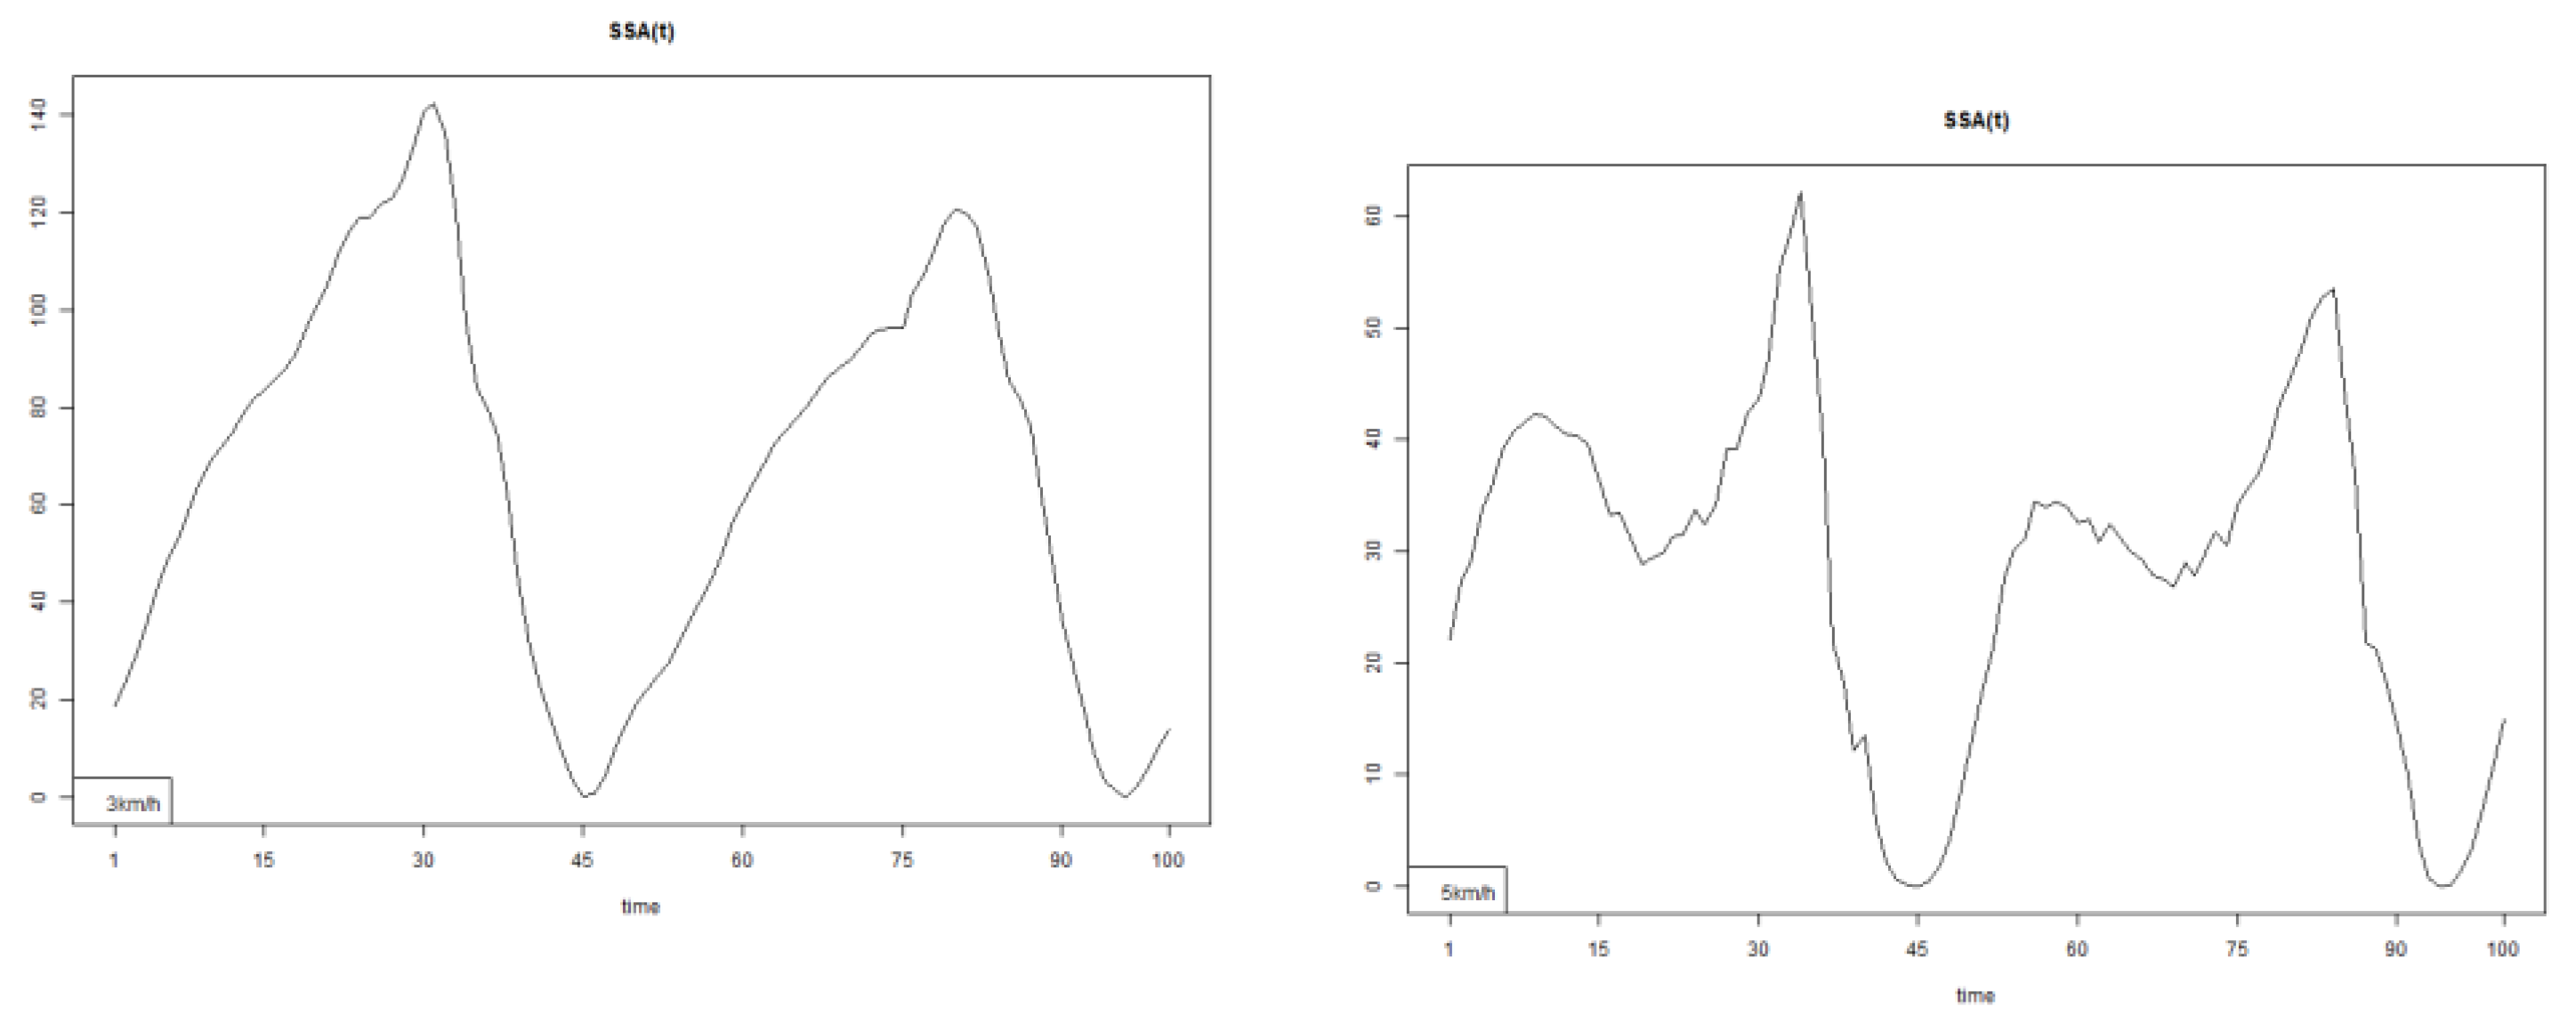
Figure 14.
Pointwise SSA(t) statistics for lower spine pitch angle at 3 and 5 km/h.
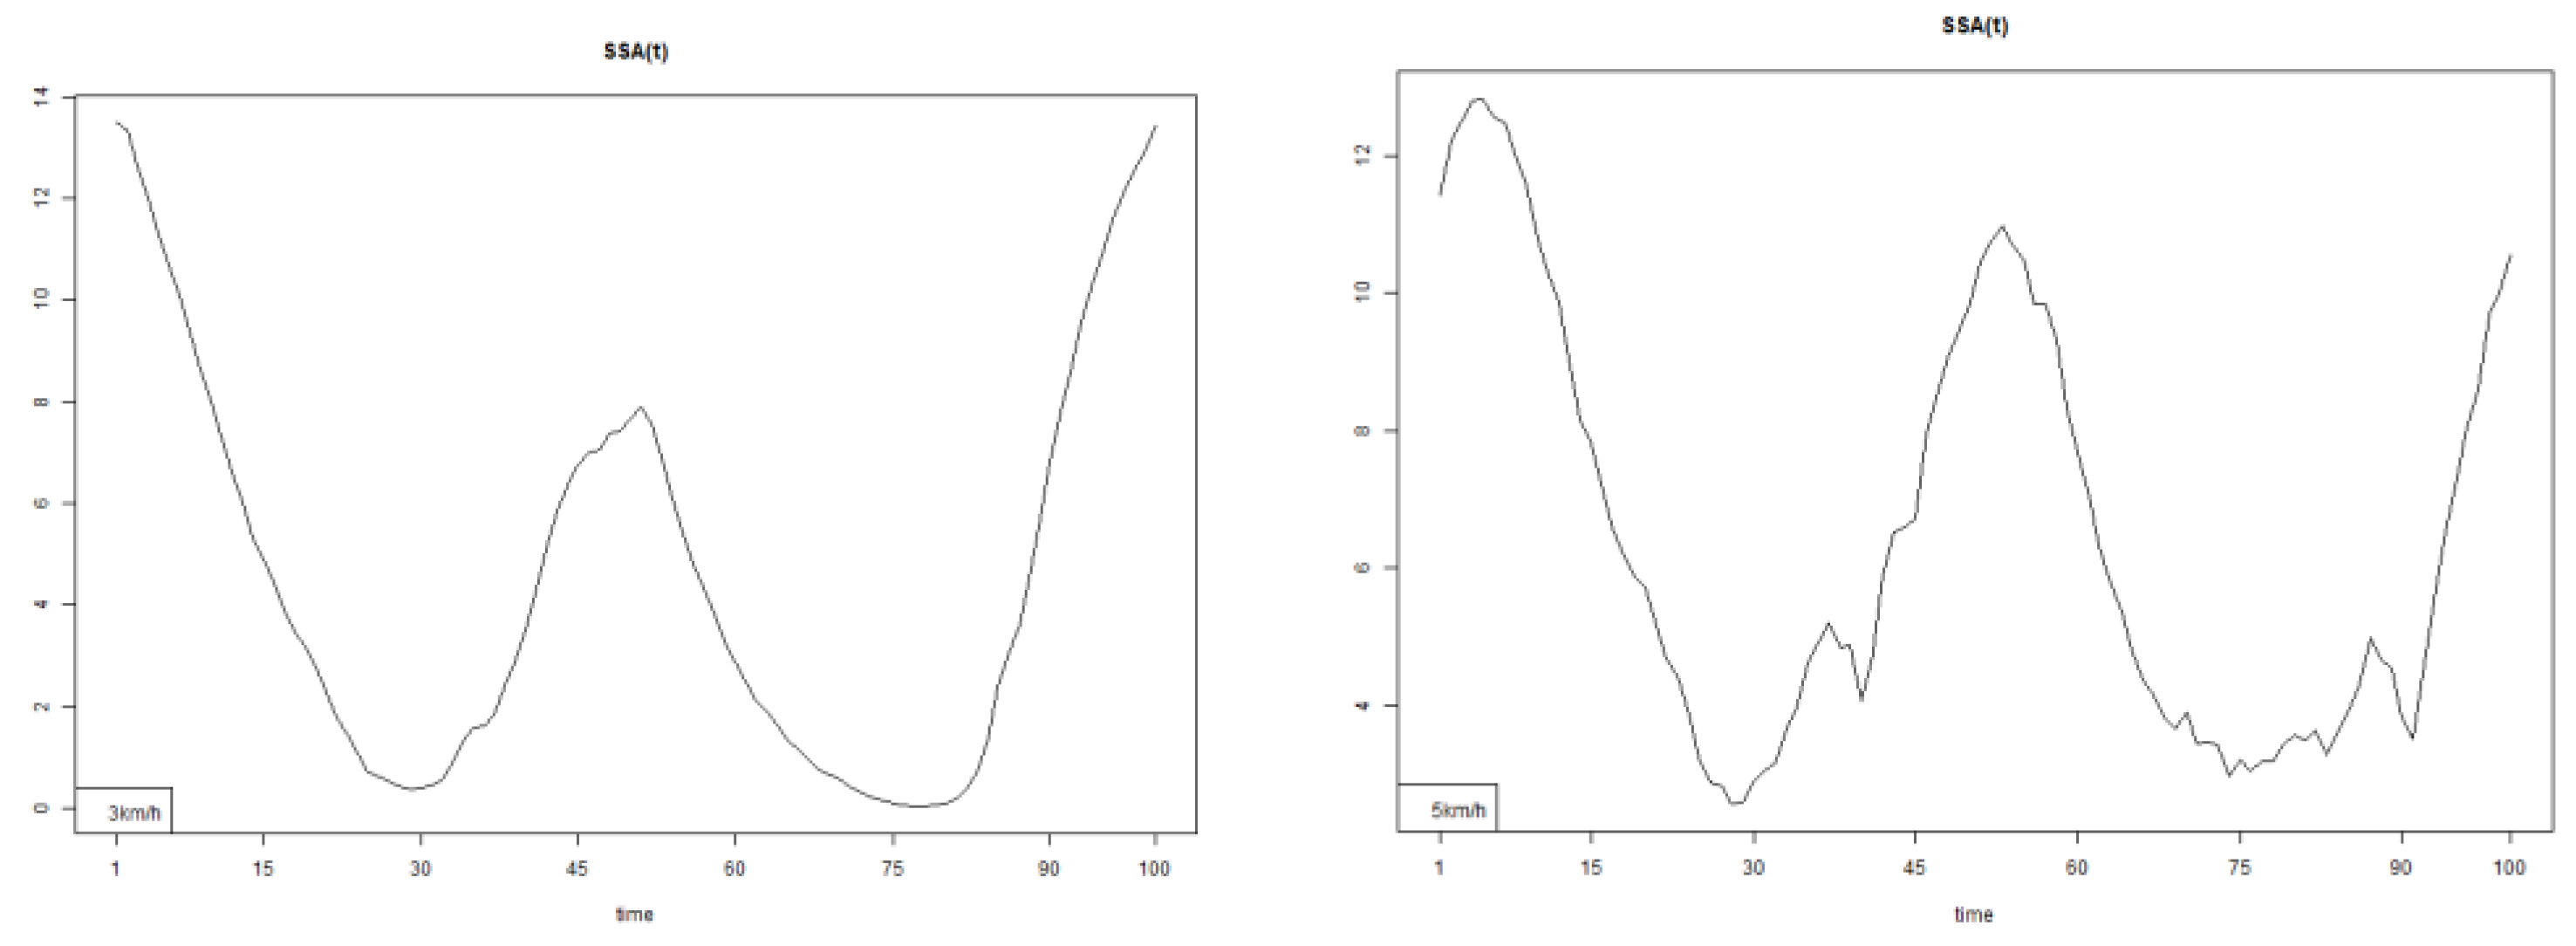
Figure 15.
Pointwise SSA(t) statistics for lower spine roll angle at 3 and 5 km/h.
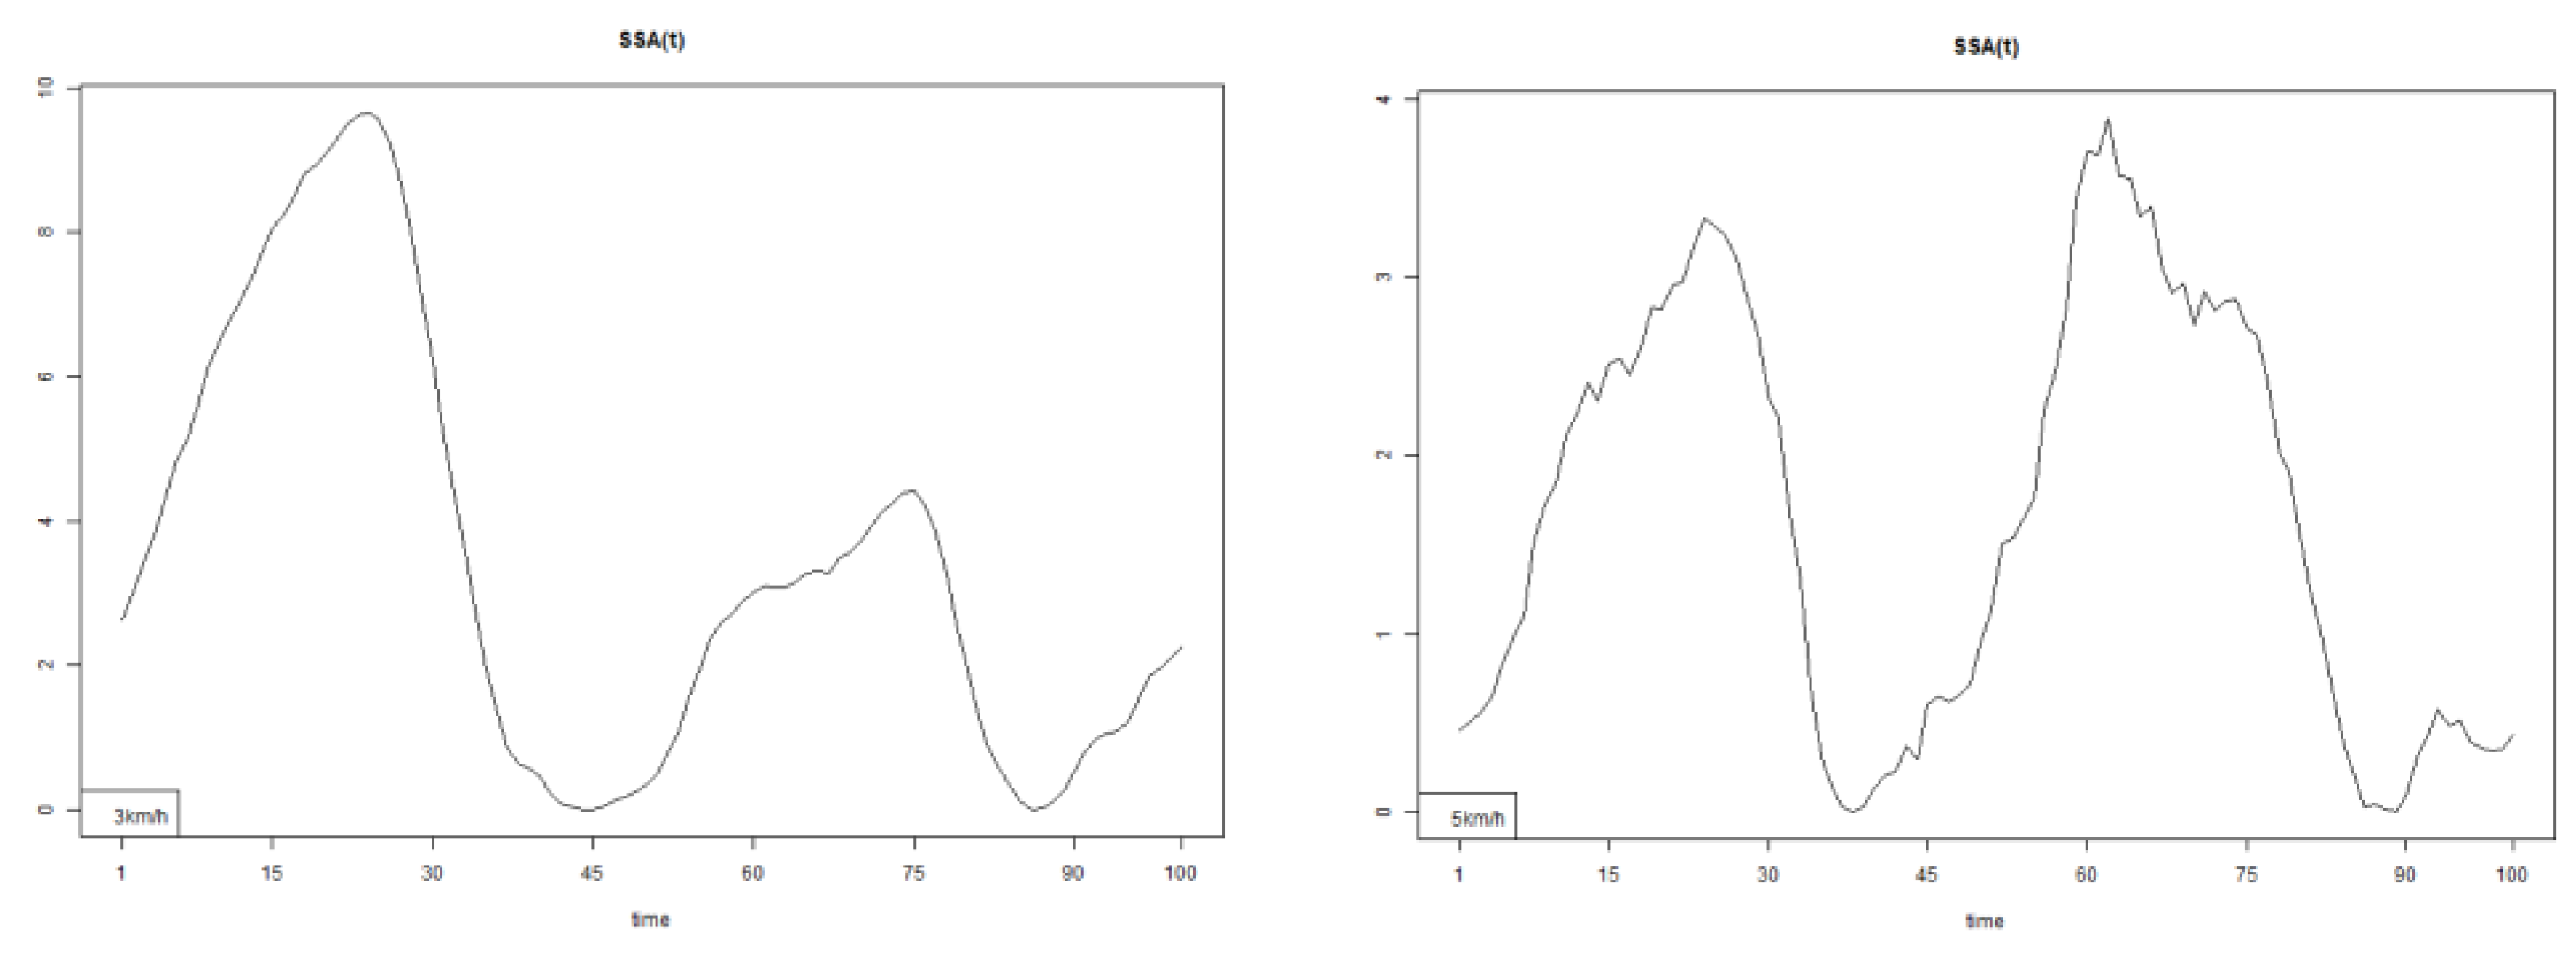
Figure 16.
The plots for thoracic flexion data of two walking velocities (3 km/h data is on left, 5 km/h data is on right).
Figure 16.
The plots for thoracic flexion data of two walking velocities (3 km/h data is on left, 5 km/h data is on right).
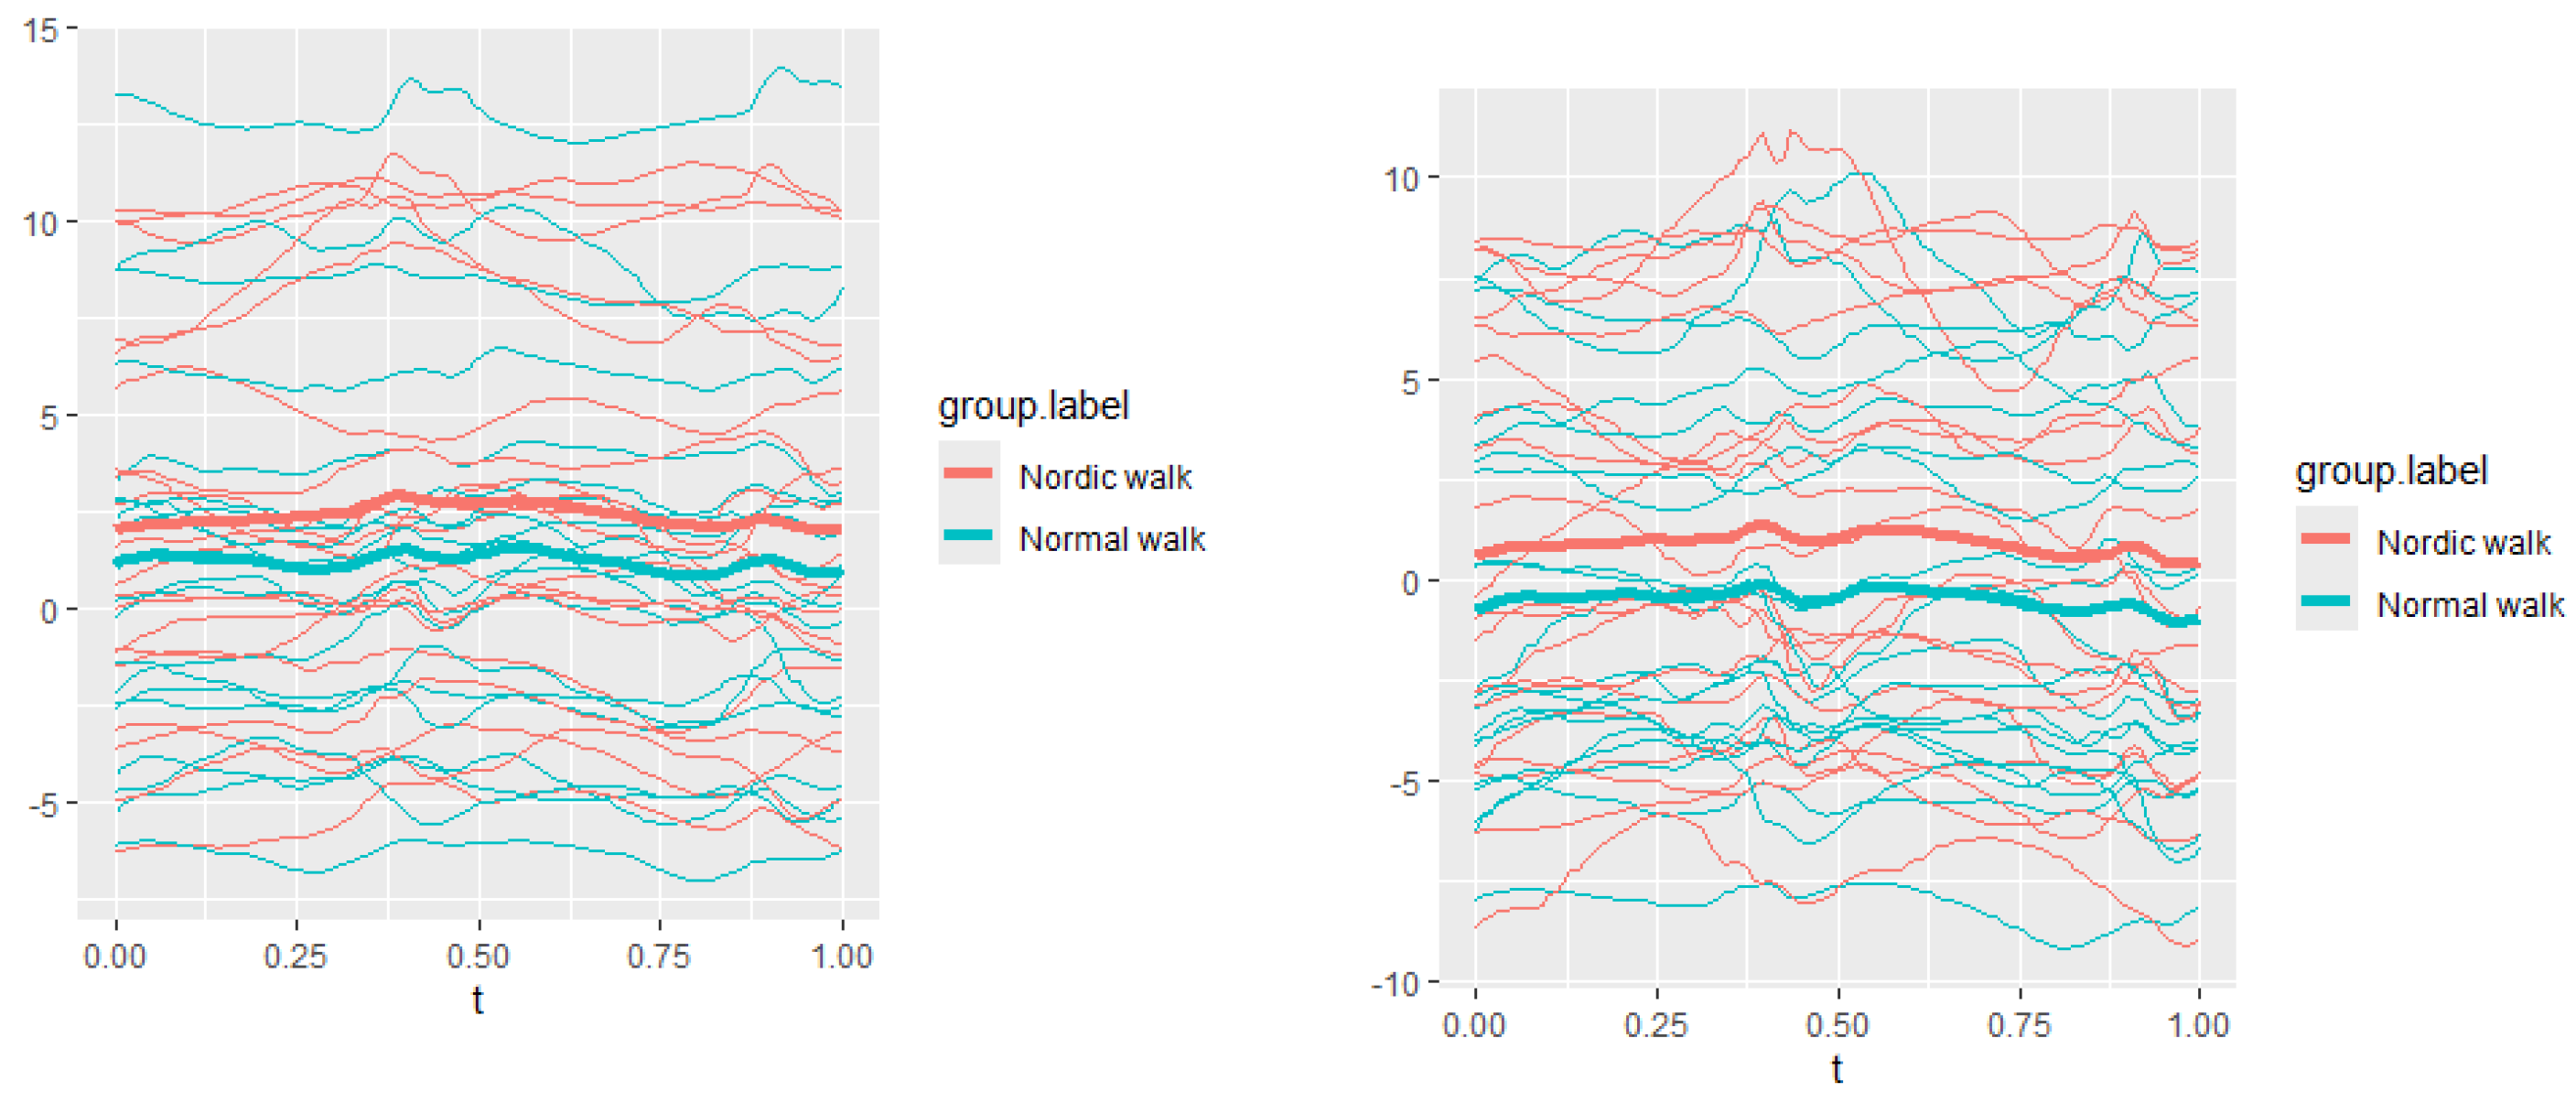
Figure 17.
The plots of thoracic axial data of two walking velocities (3 km/h data is on left, 5 km/h data is on right).
Figure 17.
The plots of thoracic axial data of two walking velocities (3 km/h data is on left, 5 km/h data is on right).
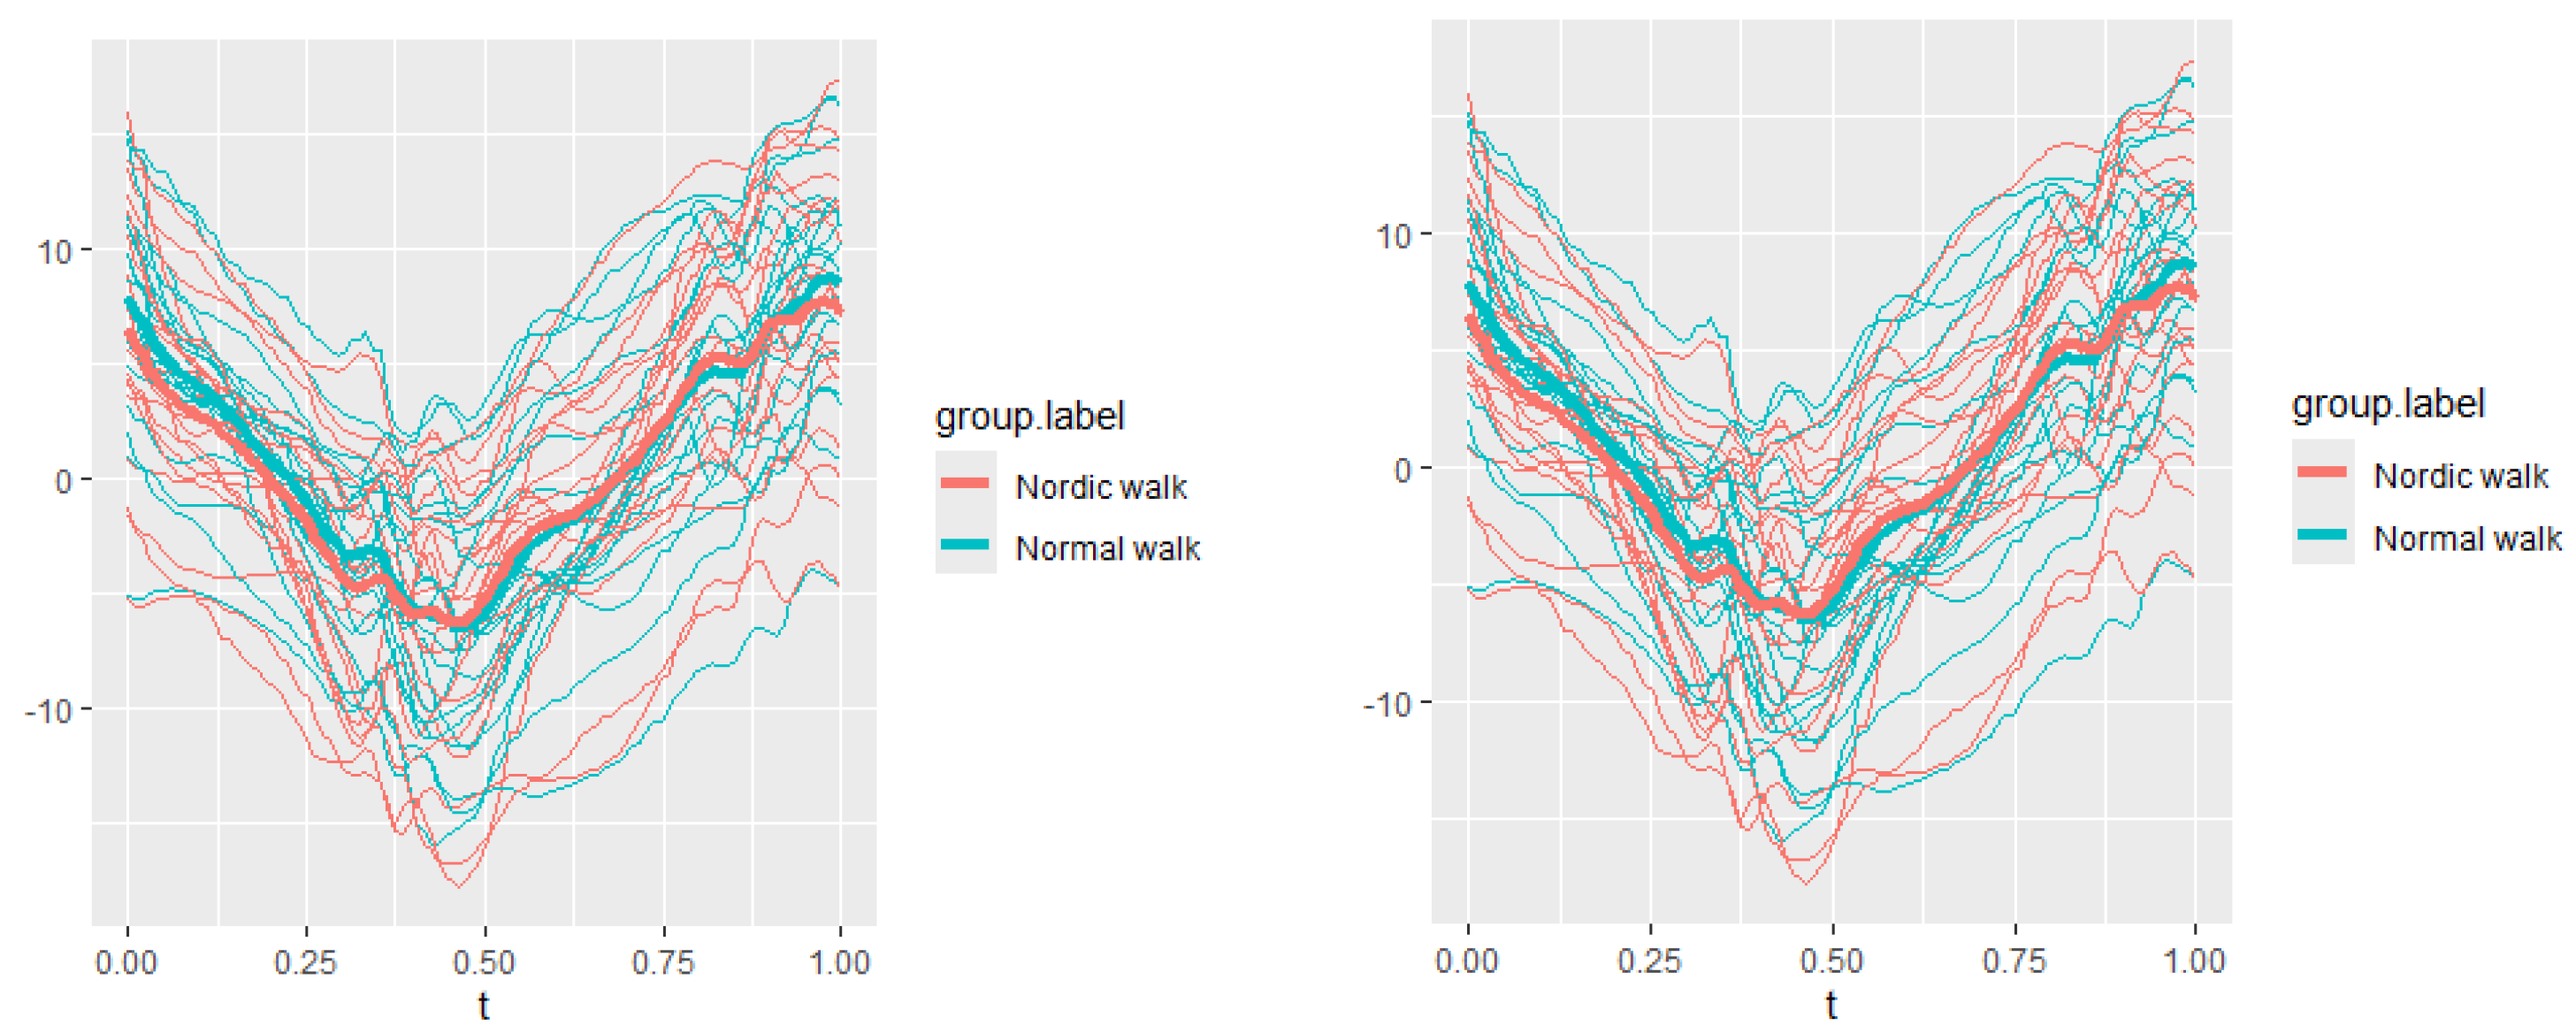
Figure 18.
The plots of thoracic lateral data of two walking velocities (3 km/h data is on left, 5 km/h data is on right).
Figure 18.
The plots of thoracic lateral data of two walking velocities (3 km/h data is on left, 5 km/h data is on right).
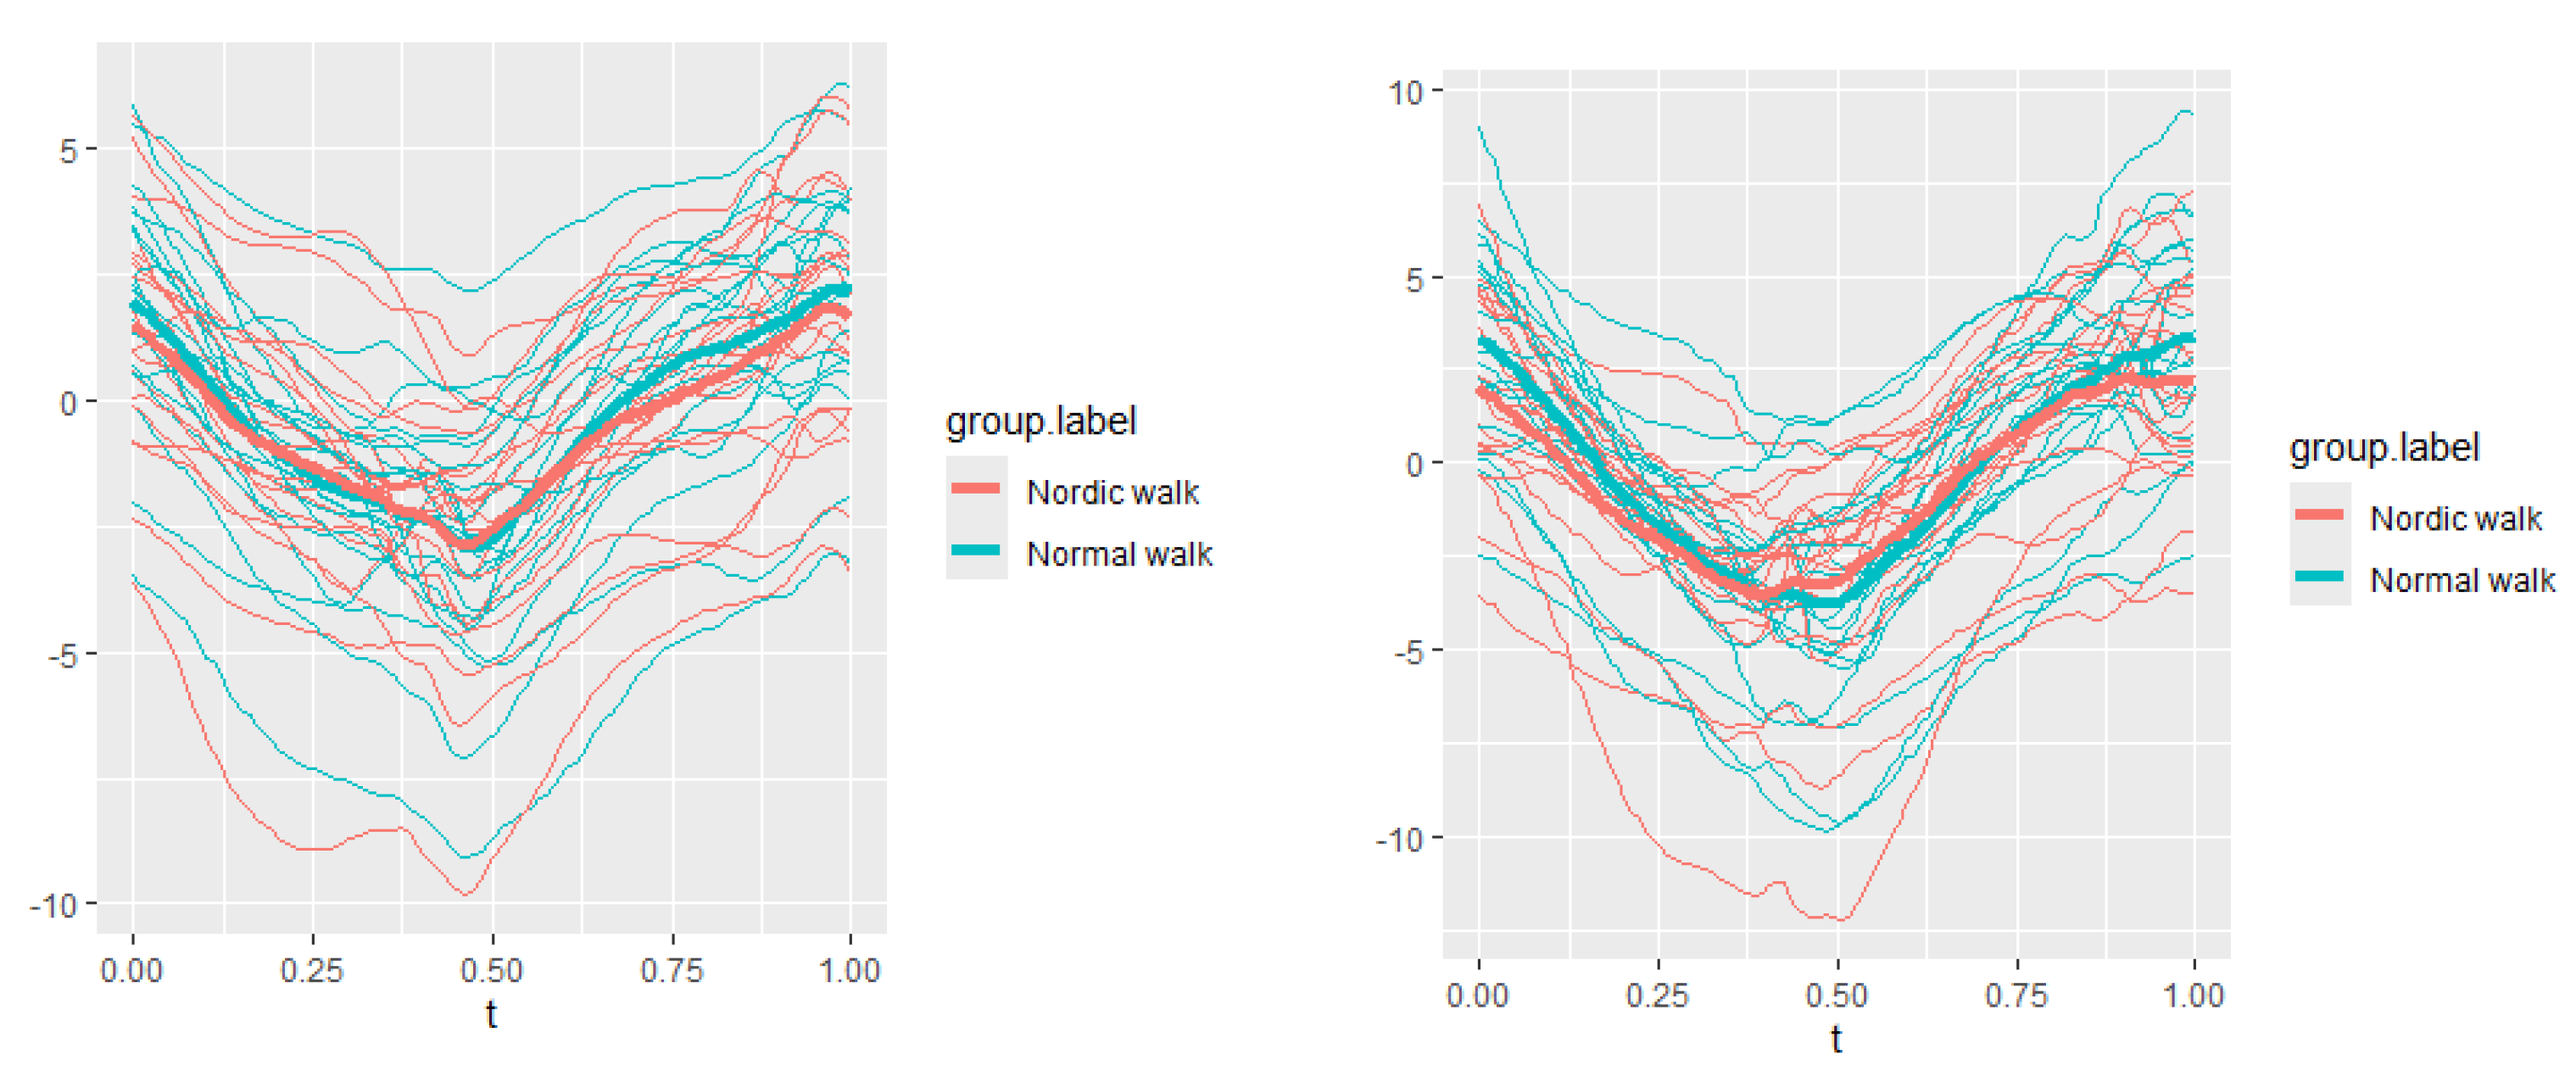
Figure 19.
Pointwise SSA(t) statistics for flexion rotation at 3 and 5 km/h.
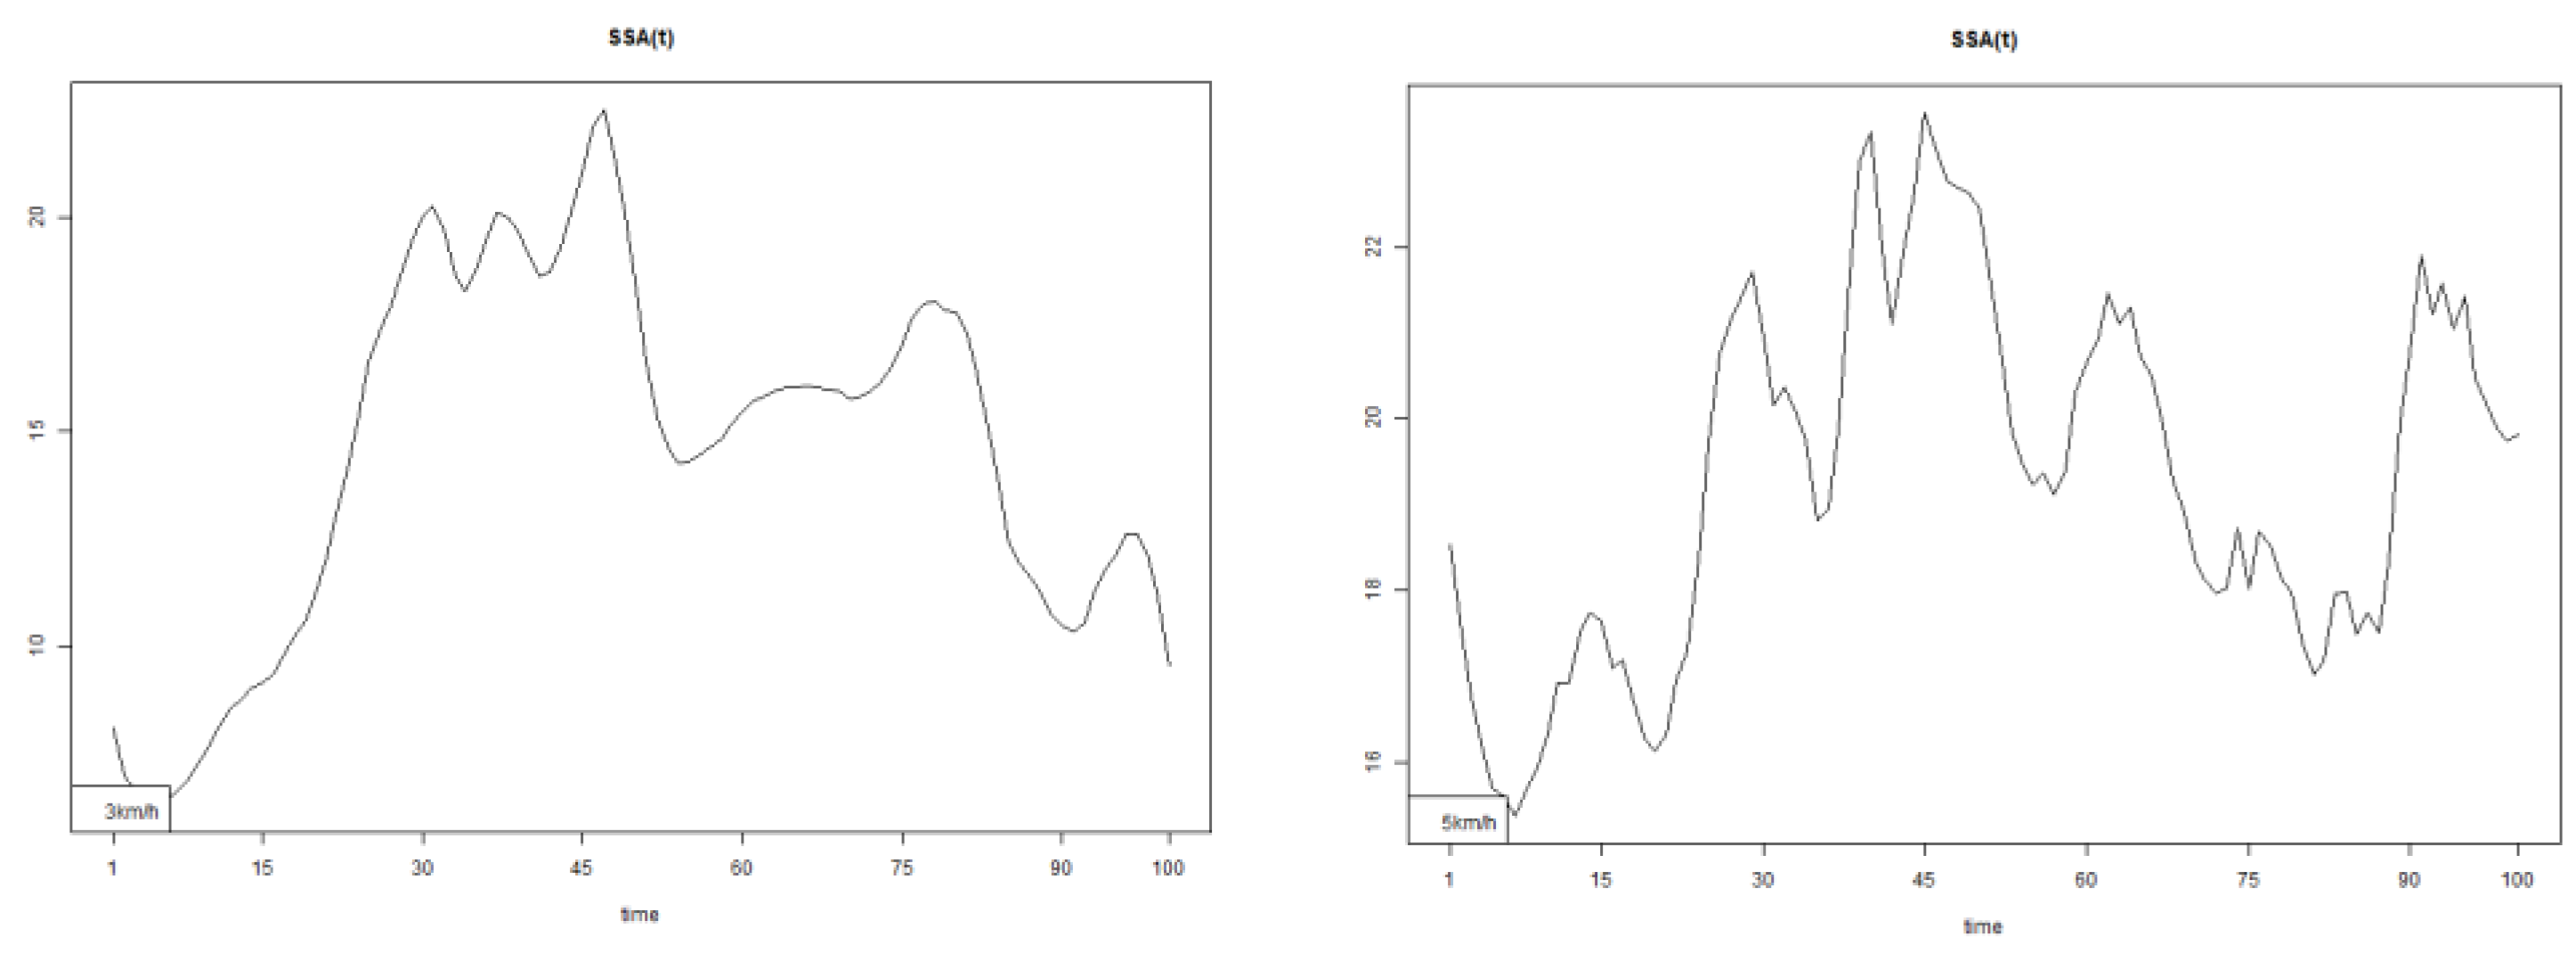
Figure 20.
Pointwise SSA(t) statistics for axial rotation at 3 and 5 km/h.
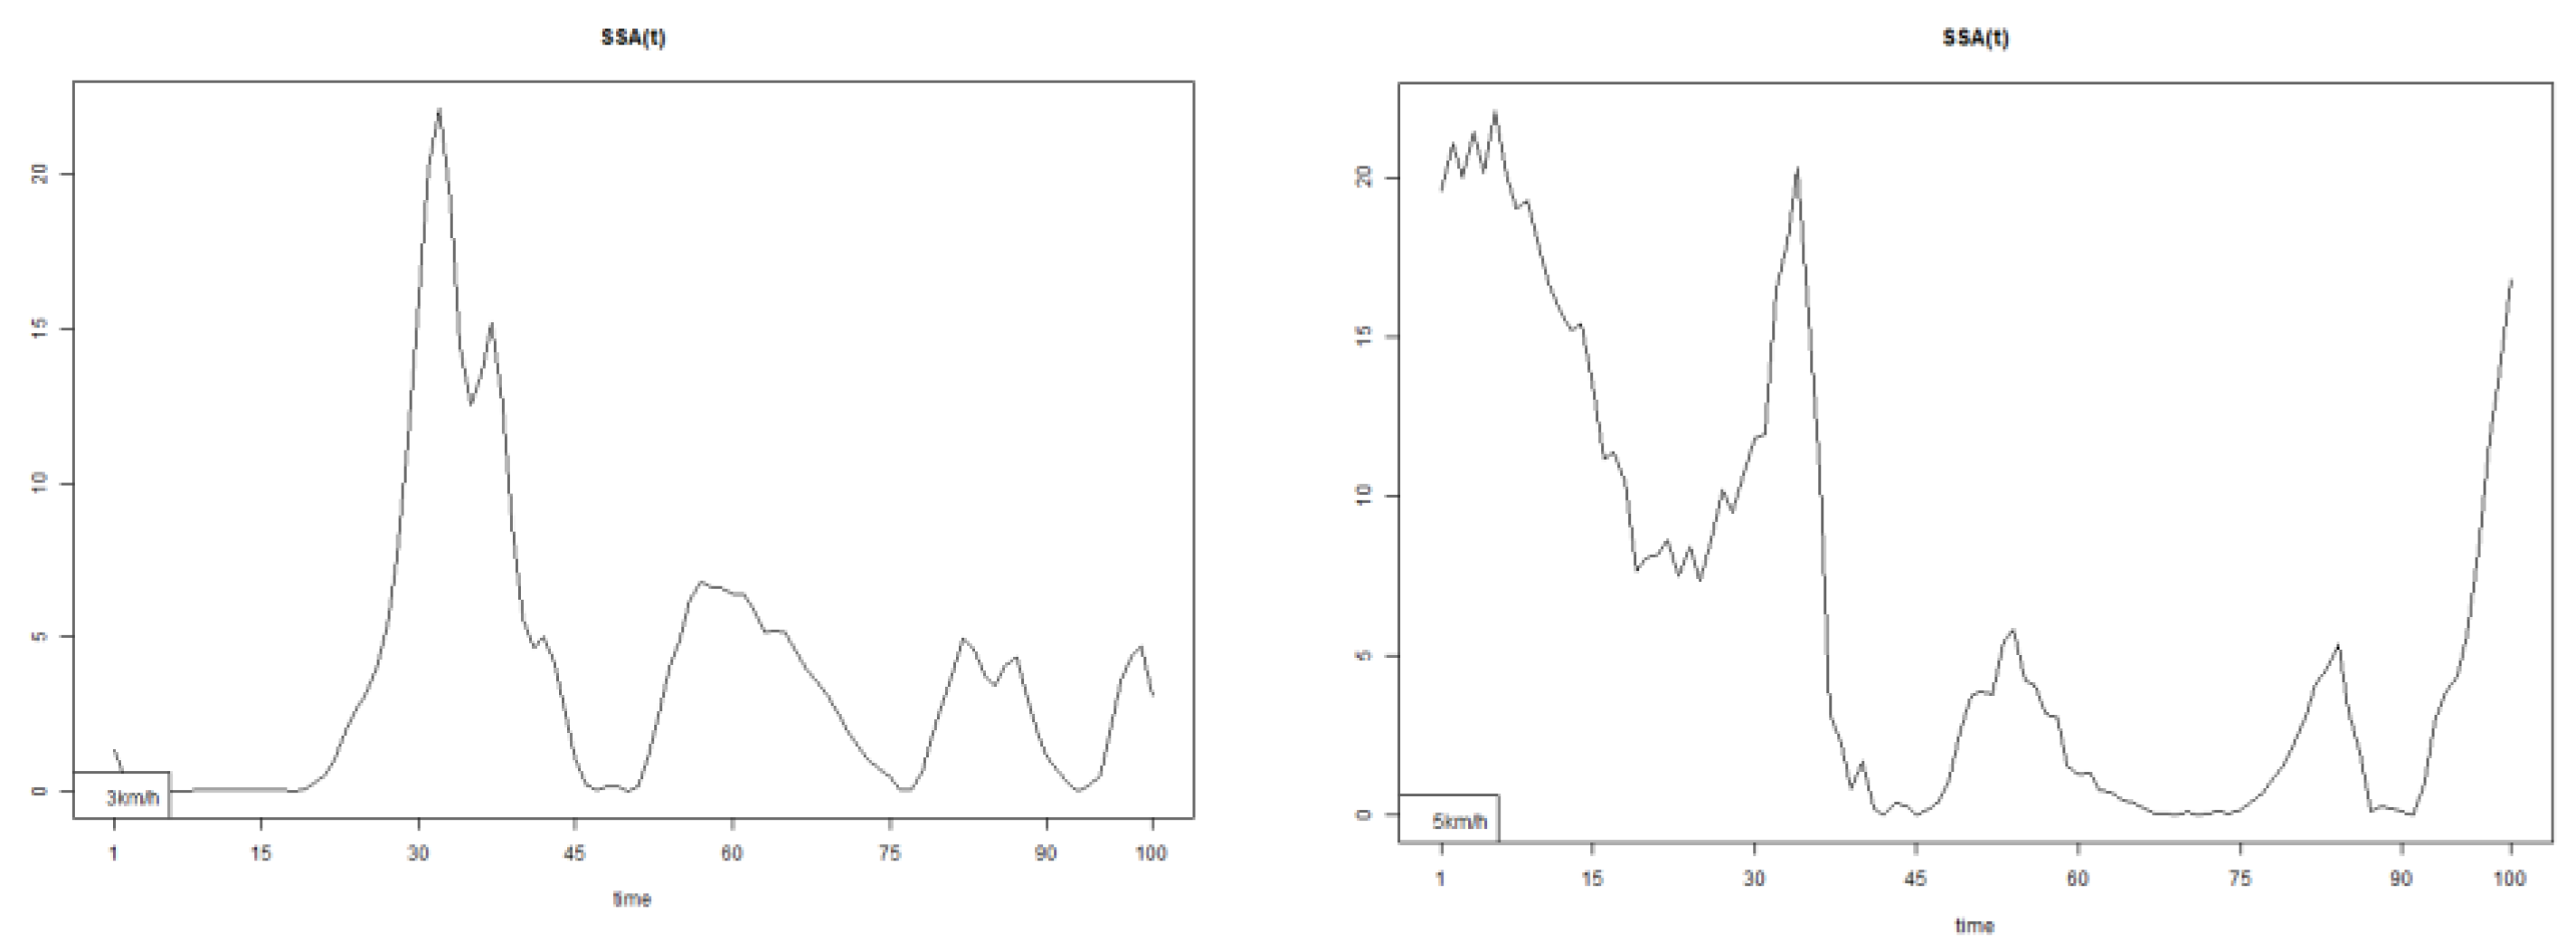
Figure 21.
Pointwise SSA(t) statistics for lateral rotation at 3 and 5 km/h.
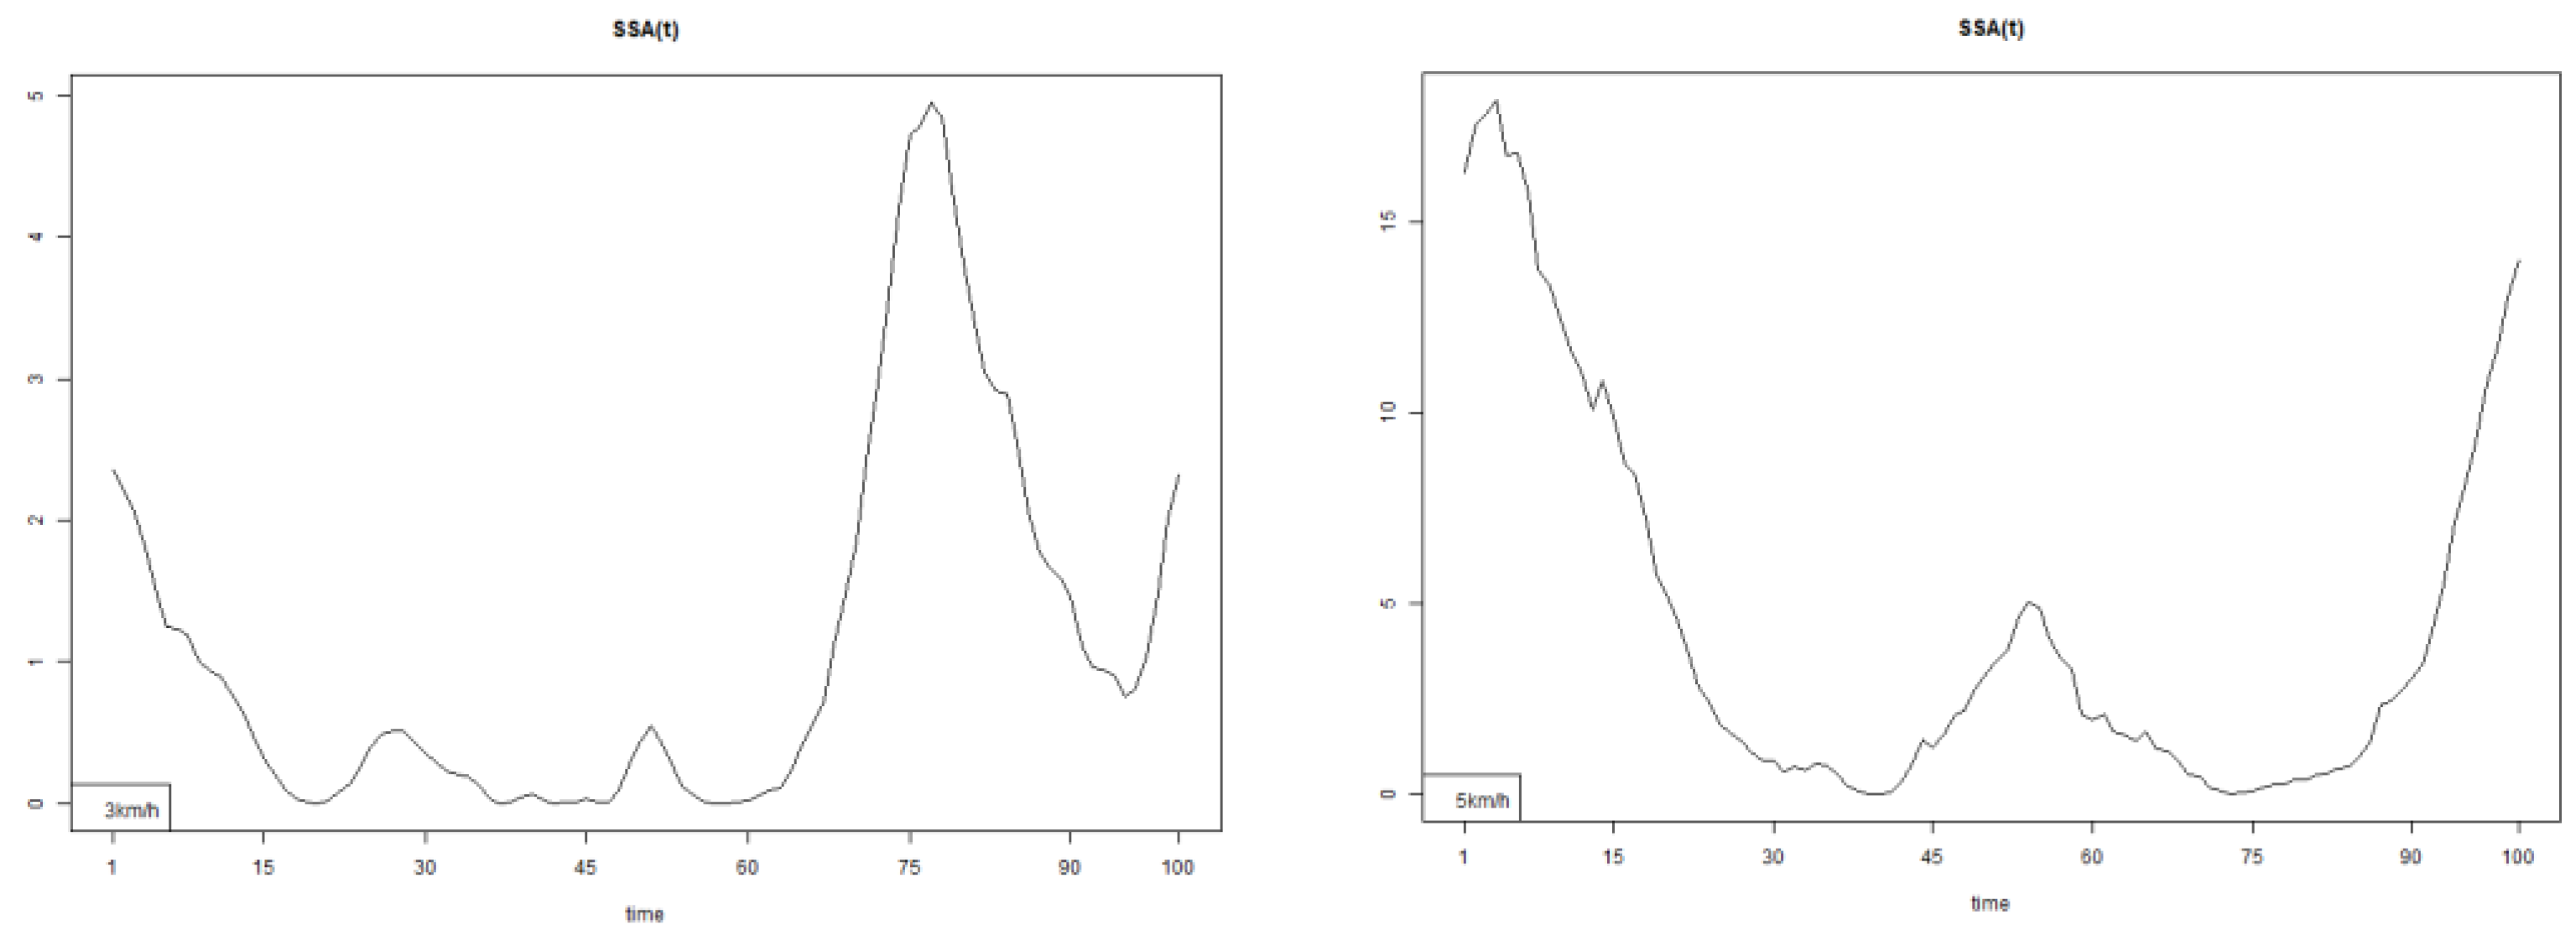

Table 1.
P-values of five observed parameters in three directions under Dn(t) and En(t) tests. The stars notation is used to mark the significance (*p≤0.05 and **p≤0.01).
Table 1.
P-values of five observed parameters in three directions under Dn(t) and En(t) tests. The stars notation is used to mark the significance (*p≤0.05 and **p≤0.01).
| Normal 3 km/h - Nordic 3 km/h | Normal 5 km/h - Nordic 5 km/h | |||
|---|---|---|---|---|
| Statistic protocol | Dn(t) (p-value) | En(t)(p.value) | Dn(t)(p.value) | En(t)(p.value) |
| Upper spine course | 0.000 ** | 0.000** | 0.000** | 0.000** |
| Upper spine pitch | 0.001** | 0.000** | 0.000** | 0.001** |
| Upper spine roll | 0.01** | 0.007* | 0.000** | 0.000** |
| Lower spine course | 0.000** | 0.000** | 0.000** | 0.000** |
| Lower spine pitch | 0.107 | 0.047* | 0.020* | 0.010** |
| Lower spine roll | 0.000** | 0.000** | 0.006** | 0.026* |
| Thoracic axial | 0.209 | 0.129 | 0.009** | 0.011* |
| Thoracic flexion | 0.011* | 0.008* | 0.004** | 0.006* |
| Thoracic lateral | 0.188 | 0,073 | 0.004** | 0.000** |
| Lumbar axial | 0.000** | 0.001** | 0.000** | 0.000** |
| Lumbar flexion | 0.033* | 0.030* | 0.707 | 0.567 |
| Lumbar lateral | 0.006** | 0.002** | 0.161 | 0.068 |
| Pelvis course | 0.000** | 0.000** | 0.006** | 0.016* |
| Pelvis pitch | 0.000** | 0.000** | 0.000** | 0.000** |
| Pelvis roll | 0.000** | 0.000** | 0.000** | 0.000** |
Table 2.
Measured walking upper spine characteristics – range, duration and velocity in comparison between Normal and NW for stance and swing walking phases. The plus sign indicates that the corresponding parameter is increased after NW. The minus sign indicates that the corresponding parameter is decreased after NW. The star’s notation is used to mark the significance (*p≤0.05 and **p≤0.01).
| Upper Spine course 3 km/h | Upper Spine course 5 km/h | Upper Spine Pitch 3 km/h | Upper Spine Pitch 5 km/h | Upper Spine Roll 3 km/h | Upper Spine Roll 5 km/h |
|---|---|---|---|---|---|
| Stance phаsе range 0.0068 * - |
Stance phаsе range 0.0762 - |
Stance phаsе range 0.2627 - |
Stance phаsе range 0.4222 - |
Stance phаsе range 0.0419 * - |
Stance phаsе range 0.0095 * - |
| Swing phase range 2e-04 ** - |
Swing phase range 0.0569 - |
Swing phase range 0.2111 - |
Swing phase range 0.695 - |
Swing phase range 0.0027 ** - |
Swing phase range 0.0012 ** - |
| Stance phаsе Duration 0.0062 * + | Stance phаsе Duration 0.0061 * + | Stance phаsе Duration 0.0055 * + |
Stance phаsе Duration 0.0061 * + |
Stance phаsе 0.0062 * + |
Stance phаsе 0.0061 * + |
| Swing phase Duration 0.0079 * - | Swing phase Duration 0.0045 ** - |
Swing phase Duration 0.007 * - |
Swing phase Duration 0.0045 ** - |
Swing phase Duration 0.0079 * - |
Swing phase Duration 0.0045 ** - |
| Stance phаsе Velocity 0.0196 * + | Stance phаsе Velocity 0.0594 + |
Stance phаsе Velocity 0.0217 * + |
Stance phаsе Velocity 0.013 * + |
Stance phаsе Velocity 0.0196 * + |
Stance phаsе Velocity 0.0054 * + |
| Swing phase Velocity 0.0145 * - |
Swing phase Velocity 0.0594 - |
Swing phase Velocity 0.1044 | Swing phase Velocity 0.0239 * | Swing phase Velocity 0.0239 * | Swing phase Velocity 0.0095 * - |
Disclaimer/Publisher’s Note: The statements, opinions and data contained in all publications are solely those of the individual author(s) and contributor(s) and not of MDPI and/or the editor(s). MDPI and/or the editor(s) disclaim responsibility for any injury to people or property resulting from any ideas, methods, instructions or products referred to in the content. |
© 2025 by the authors. Licensee MDPI, Basel, Switzerland. This article is an open access article distributed under the terms and conditions of the Creative Commons Attribution (CC BY) license (http://creativecommons.org/licenses/by/4.0/).
Copyright: This open access article is published under a Creative Commons CC BY 4.0 license, which permit the free download, distribution, and reuse, provided that the author and preprint are cited in any reuse.


