
Submitted:
14 July 2025
Posted:
16 July 2025
You are already at the latest version
Abstract
Microorganisms significantly affect the brewing process and product quality of liquors. The brewing process of traditional Chinese Luzhou-flavour liquor involves solid-state fermentation in an open environment with grains as the fermentation substrates and Daqu as the saccharifying fermenter. To identify the functional microbes in Luzhou-flavour liquor fermentation, the diversity and population succession of fungal and bacterial species were investigated using high-throughput sequencing (HTS) and a culture- dependent method. In total, 932 bacterial and 980 fungal operational taxonomic units (OTUs) were identified using HTS, and 256 bacterial and 130 yeast strains were isolated and identified using 16S rDNA, and 26S D1/D2 rDNA, and ITS v4/v5, respectively. Results of population succession determined using HTS showed that the dominant populations were yeasts, Lactobacillus, and Bacillus at the early stage, and yeasts and Lactobacillus in the late stage. Lactobacillus, Pichia, Bacillus, and Candida were abundant among all the three layers of fermented grains, indicating that they are the key dominant bacteria and yeasts. However, Candida ethanolica, Saccharomycete sp., and a non identified Saccharomyces cerevisiae were more abundant in the lower layer than in the middle and upper layers, and Lactobacillus parabuchneri, Oceanobacillus oncorhynchi, and Thermoactinomyces sp., were present only in the lower layer. Correlations between enzyme activity, volatile production, and dominant microbes during fermentation indicated that Pichia fermentans, Lactobacillus suebicus, Lactobacillus acetotolerans, Pichia kudriavzevii, Pichia exigua, and Bacillus tequilensis were significantly affected during brewing. These observations will assist in elucidating the mechanisms underlying Chinese Luzhou-flavour liquor production and in improving the quality and efficiency of traditional liquor brewing.
Keywords:
baijiu
; fermented grain
; high-throughput sequencing
; culture-dependent method
; dominant microbes
; succession
1. Introduction
Alcoholic beverages are popular worldwide, and the types of non-distilled and distilled alcoholic beverages vary in different countries. Traditional Chinese Baijiu (also known as Chinese spirit) is one of the oldest known distilled spirits [1,2,3]. Compared with other distilled liquors, the ethanol content of traditional Chinese liquors is typically 40–55% [3,4]. In China, raw materials and brewing processes vary with the environment in different regions, leading to substantial variations in product flavour. Based on flavour characteristics, the traditional Chinese Baijiu flavour type can be divided into strong-(or Luzhou-), jiang-(or Maotai-), mild-(or Fen-), and nine other flavours, with Luzhou-, Maotai-, and Fen-flavours considered as the basic flavour types [1,2]. The characteristic flavour of Luzhou-flavoured liquor, which accounts for over 70% of entire liquor production [5], is derived from ethyl caproate [6].
During the Baijiu brewing process, the growth and metabolism of microorganisms have an important impact on the flavour and quality of Baijiu. Therefore, it is important to explore the succession of microbial communities, in which high-throughput sequencing (HTS) technology plays a crucial role.
Xiang et al. [7] and Li et al. [8] used small subunit (SSU) rRNA profiles to evaluate microbial succession, providing a preliminary perspective for understanding dynamic changes in the microbial community. However, this method has certain limitations in terms of the comprehensiveness and accuracy of detection. Subsequently, used quantitative fluorescence polymerase chain reaction (PCR) to accurately quantify Streptomyces which produces oxytetracycline during the solid-state fermentation of Baijiu. This technology can quantitatively analyse specific microorganisms but lacks the overall diversity of the microbial community. Liang et al. [9] used a combination of polymerase chain reaction-denaturing gradient gel electrophoresis (PCR-DGGE) and quantitative polymerase chain reaction (qPCR) to analyse bacterial communities in the pit mud of strong-flavour Baijiu factories in different regions. To a certain degree, this compensated for the shortcomings of the single-technology approach; however, it still did not fully display the complete picture of the microbial community.
Technological developments have led to the emergence of the HTS technology. Fu et al. [10] determined the microbial community structure in pits of strong-flavour Baijiu using metagenomic sequencing, assembly, and classification methods. This provided an understanding gardinge the types, quantities, and interrelationships of microorganisms at a broader level, thereby greatly expanding our understanding of microbial communities. Liu et al. [11] used Illumina MiSeq sequencing (HTS technology) and liquid chromatography-mass spectrometry (LC-MS) to study bacterial communities in fermented grains (ZAO PEI). In addition to finding that the bacterial abundance and percentages of Lactobacillus and Pseudomonas increased with an increase in the depth of ZAO PEI, they also analysed the relationship between microorganisms and the fermentation process at the molecular level.
Compared with traditional technologies, HTS can sequence a large number of DNA or RNA entities in a sample, thereby comprehensively and efficiently revealing the composition, structure, and function of the microbial community [12]. HTS provides a powerful tool for in-depth research on microbial community succession, enabling more in-depth research in the field of Baijiu brewing microorganisms and elucidating additional microbial mystery related to the fermentation process and product quality [13].
Based on the analysis of 16S rRNA gene sequences, we isolated and identified bacteria in wine mash at different stages of the brewing process of strong-flavoured liquor. A homologous sequence search (BLAST) was performed using the GenBank database to compare the homology of the test strains with sequences of known bacteria [14]. At the same time, the sequence of the 26S rRNA D1/D2 region of the yeast strains isolated from the wine at different stages was analysed. The basic search tool BLAST was used for local sequence alignment to identify homologous sequences in the gene sequence data (GenBank). The test strains were compared with the corresponding sequences of known yeasts. PCR amplification of the 26S rRNA D1/D region of the isolated yeast was performed, and the amplification products were analysed using single-strand conformation polymorphism (SSCP) and sequence determination [15,16]. Strains with a similarity rate of > 99% were defined as belonging to the same species, and those with a similarity rate of 95% to 99% defined as belonging to the same genus. At the same time, the species and quantity of bacteria and yeast at different stages were summarized and collated according to the analysis and identification results. The law of bacterial populations in the process of wine mash fermentation was analysed to lay a foundation for clarifying the main microorganisms involved in the brewing process of strong-flavoured Chinese liquor. In the present study, microbial diversity and population succession during the solid-state brewing of Luzhou-flavoured liquor were studied using HTS to establish the dominant microorganisms.
2. Materials and Methods
2.1. Materials
A GT9612 gradient thermal cycler (Hangzhou Bio-Gener Technology Co., Ltd., China) was used for DNA amplification, a CF15R centrifuge (Hitachi, Tokyo, Japan), a JK600C electrophoresis device (Beijing Junyi-Dongfang Electrophoresis Equipment Co., Ltd., China), an Alpha Innotech imager (San Leandro, CA, USA) for gel imaging, and an Illumina sequencing platform (San Diego, CA, USA). Taq PCR Master Mix and primers (27f and 1492r) were purchased from Beijing Auwigene Technology, Inc. (Beijing, China). All standard laboratory reagents were purchased from Beijing Hua’aozheng Technology Co. Ltd. (China).
2.2. Luzhou-Flavour Liquor Manufacturing Process and Sample Collection
Luzhou-flavoured liquor was prepared from cereals (sorghum only or mixed with corn, rice, wheat, and glutinous rice), Daqu, rice hulls, and water in a pit (8 × 10 m3) using natural solid-state fermentation for 2–3 months, followed by solid-state distillation at atmospheric pressure [17]. Daqu acts as a saccharification–fermentation starter, similar to Japanese koji. Daqu was prepared as previously described method [15,16,18]. The Daqu production process consists of three stages. The first stage involved the production of brick-shaped Daqu (raw wheat material). The second stage allows the microorganisms to accumulate and produce aromatic metabolites. During this process, the temperature was changed three times: low temperature (days 3–5), high temperature (days 5–7), and low temperature (days 7–12). The third stage is the maturation stage, in which the temperature of Daqu decreases to ambient temperature and dries further. The preparations were stored for two to three months. For the fermentation of Luzhou-flavoured liquor, the three layers of fermented grains from the last fermentation were treated. The upper layer was distilled to obtain the liquid and discarded. The middle layer was mixed with rice hulls, distilled for liquor, cooled to room temperature, and supplemented with 20% prepared Daqu for use as the upper layer of fermented grains in the next fermentation cycle (2–3 months). The lower layer was mixed with soaked fresh sorghum (approximately 33% water) and distilled to obtain liquor. The mixture was cooled to room temperature after distillation and supplemented with 20% Daqu for use as middle and lower layer fermented grains in the next fermentation cycle (2–3 months). The procedure was repeated until the end of each fermentation period. In each cycle, fresh sorghum was added to the lower layers and maintained at a mass ratio of 2:1. The newly distilled liquor was stored in pottery at a low temperature for over a year, after which it was blended and filled into the final product.
The cell temperature increased rapidly from day 0 to 12 (peak) and gradually decreased thereafter. The upper, middle, and lower layers of the fermented grains in the pit were selected for sampling. Days 0, 4, 8, 12, 20, 30, and 44 were selected as the sampling time points, and the positions were selected based on changes in cellular temperature [19]. Samples were obtained from different layers; three samples were collected at each point and mixed for further analysis.
2.3. Analysis of Glucoamylase and Liquefying Enzyme Activity and Volatile Compound Content in Fermented Grains During Fermentation
Glucoamylase and liquefying enzyme activities during fermentation were determined using methods described by Yang et al. [18]. Volatile compounds were analysed using headspace solid-phase microextraction, followed by gas chromatography–mass spectrometry (HS-SPME-GC-MS). Finally, a typical canonical correlation analysis was performed on the dominant microbes, enzymes, and volatile compounds using constrained correspondence analysis in the R vegan software package [18,20]. The correlations between bacteria and fungi, as well as the saccharifying enzyme, liquefying enzyme, and protease activities in fermented grains of Luzhou-flavoured liquor, were analysed using constrained correspondence analysis of the R vegan software package [20].
2.4. High-Throughput Sequencing (HTS) Analysis
2.4.1. Extraction of Total DNA from Samples for HTS
High-quality total DNA was extracted according to the standard method described by Narayan et al. [21].
2.4.2. Bioinformatics Analysis
Data Quality Control
The concentration of the purified PCR products was measured using a Qubit® 2.0 fluorescence spectrophotometre (Invitrogen, Carlsbad, CA, USA). Samples with different barcodes were mixed at equal masses to construct a database using the KAPA HyperPrep kit (KAPA Biosystems, Boston, MA, USA). Using 500 ng of DNA as the input, the sizes and molar masses of the fragments were detected using an Agilent 2100 bioanalyzer system (Santa Clara, CA, USA) to perform quantitative PCR. Qualified entries were pooled and subjected to paired-end HTS using Illumina MiSeq PE300. The read length for each sequence was 300 bp.
The original image data of the HTS generated by the Illumina MiSeq PE300 were converted to raw sequences after base recognition and then stored in the FASTQ (fq) format. The files contained sequence information and corresponding sequencing quality information. Quality checks were performed on these files using fastqc with the following data filtering steps: removal of reads with adapters, discarding paired-end reads with a percentage N (unspecified base) > 10%, and removal of low-quality reads (criteria: Q20 ≥ 90%).
Read Merging and Optimization
Reads were joined into tags using Connecting Overlapping Pair-End (COPE, V1.2.3.3) software according to the overlaps among paired-end reads. The barcodes on both sides of the tags and primer sequences were trimmed using a code developed by our group to obtain raw tags; tags < 200 bp in length and chimeras were filtered to obtain clean tags. To ensure the quality of data for subsequent analysis, the raw tags from paired-end read merging were optimised to obtain clean tags using Mothur software [22]. Raw tags were screened for anomalies. Unique tags were selected to minimise redundancy and compared with the SILVA reference database (version 119, http://www.arb-silva.de/) using the Needleman–Wunsch algorithm [36] for target region matching. These clustered low- and high-abundance tags had minor mismatches to reduce erroneous operational taxonomic unit (OTU) determination. Chimeric sequences were identified using the UCHIME algorithm (v4.2, http://drive5.com/uchime) [23]. Sequences annotated as nonbacterial or fungal were excluded.
3. Results
3.1. HTS Rarefaction Curves
Rarefaction curves were plotted for the species present in a number of randomly selected samples together with their OTU numbers. These can be used to compare species richness in samples with different amounts of sequenced data, and to determine whether the amount of sequenced data is reasonable. A flat curve indicates a reasonable amount of sequenced data, that is, additional sequencing will produce only a small number of new OTUs, whereas an opposite curve indicates that additional new OTUs can be produced by further sequencing [24]. Thus, the rarefaction curves provide the sequencing depth of the sample. The relationship between the number of sequences obtained during liquor brewing and fungal diversity is shown in Figure 1A. The curves approached a plateau when 25,000 sequences were randomly selected, indicating sequencing saturation and good species coverage. The 1,045,836 sequences obtained from the ITS1 region of the fermented grain samples (an average of 49,801 effective sequences per sample) were representative of winemaking fungal populations. The species richness of the upper layer fermented grains was the highest on the 44th day and the lowest on the 8th day (Figure 1A), whereas that of both the middle- and lower-layer fermented grains was the highest on the 12th day and the lowest on the 0th day (Figure 1B and C). The plots indicated satisfactory sequencing results for the samples and provided a general understanding of the differences in species diversity between the upper, middle, and lower fermented grain layers.
3.2. HTS Shannon–Wiener Curve
The Shannon–Wiener curve reflects the sample microbial diversity. Microbial diversity indices of samples sequenced at different depths were plotted to reveal the microbial diversity as different quantities of data were sequenced. A flat curve indicates a sufficient amount of sequencing data containing most of the microbial information in the sample. The Shannon index on the vertical axis reflects the diversity of the sample species diversity [25] in the Shannon–Wiener curves for fungi (Supplementary Figures S1A, B, and C) and bacteria (Supplementary Figures S1a, b, and c) in the upper, middle, and lower layers of the fermented grains. The point where all curves approach a plateau indicates that sufficient data have been sequenced and the results are illustrative of microbial populations. The figures clearly show the differences in fungal and bacterial diversity of the layers at different brewing times.
3.3. Dominant Microbes in the Fermented Grain Layers Based on HTS
Figure 2.
(A, B, and C) shows the results of HTS analysis at the genus level. Figure 2 (a, b, and c) shows the results of the dominant fungi in the upper, middle, and lower layers based on the number of sequences of each OTU, which were compared with the model strains in GenBank and the data of the isolated strains in the data bank of Baijiu. It can be seen that the fungi that occupied > 90% of the microbial population in all three layers comprised Pichia fermentans, Pichia exigua, Pichia kudriavzevii, Candida ethanolica, Candida humilis, Aspergillus chevalieri, Saccharomycete, Geotrichum candidum, Vishniacozyma victoriae, Scytalidium thermophilum, Saccharomyces cerevisiae, Cladosporium phlei, and Vishniacozyma tephrensis. Their layer distributions followed the same pattern with only small differences. For example, P. fermentans was proportionally the highest in the three layers, with its abundance decreasing as the deeper layers were sampled. Conversely, the abundances of P. exigua and P. kudriavzevii increased in the deeper layers. These dominant strains act as important references for studying functional microorganisms in Baijiu brewing and flavour formation in the future.
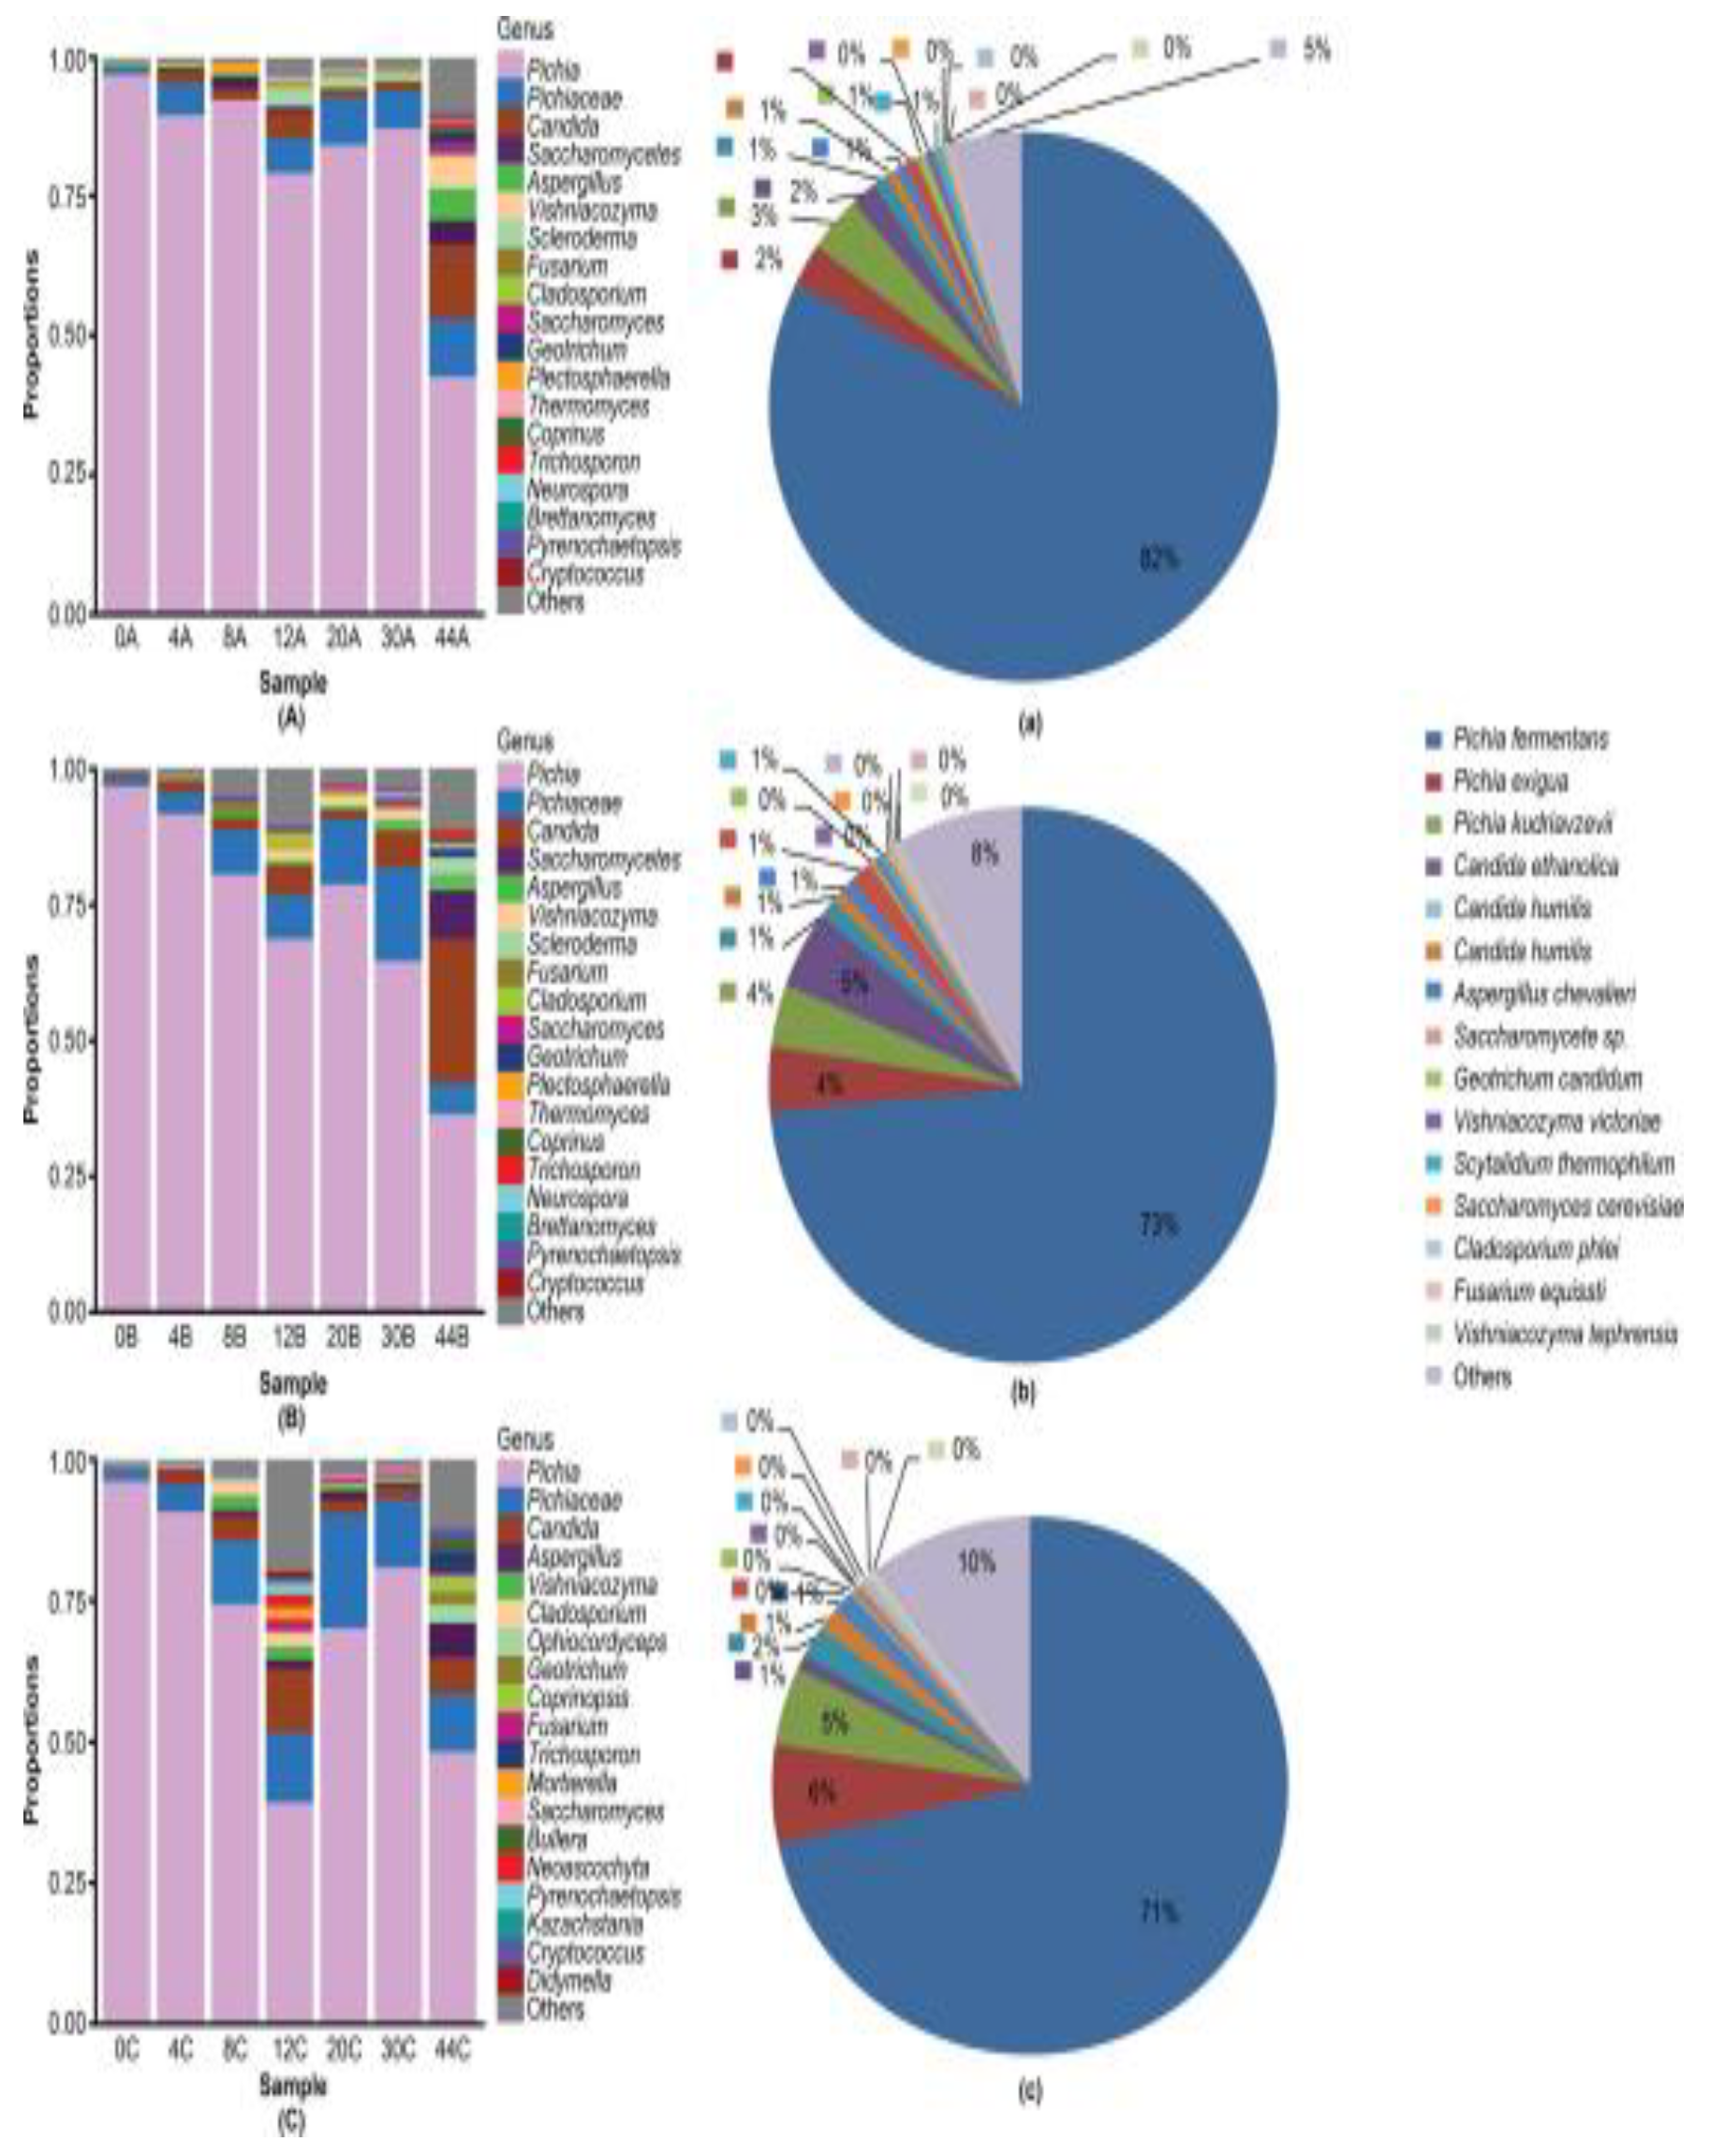
Figure 3.
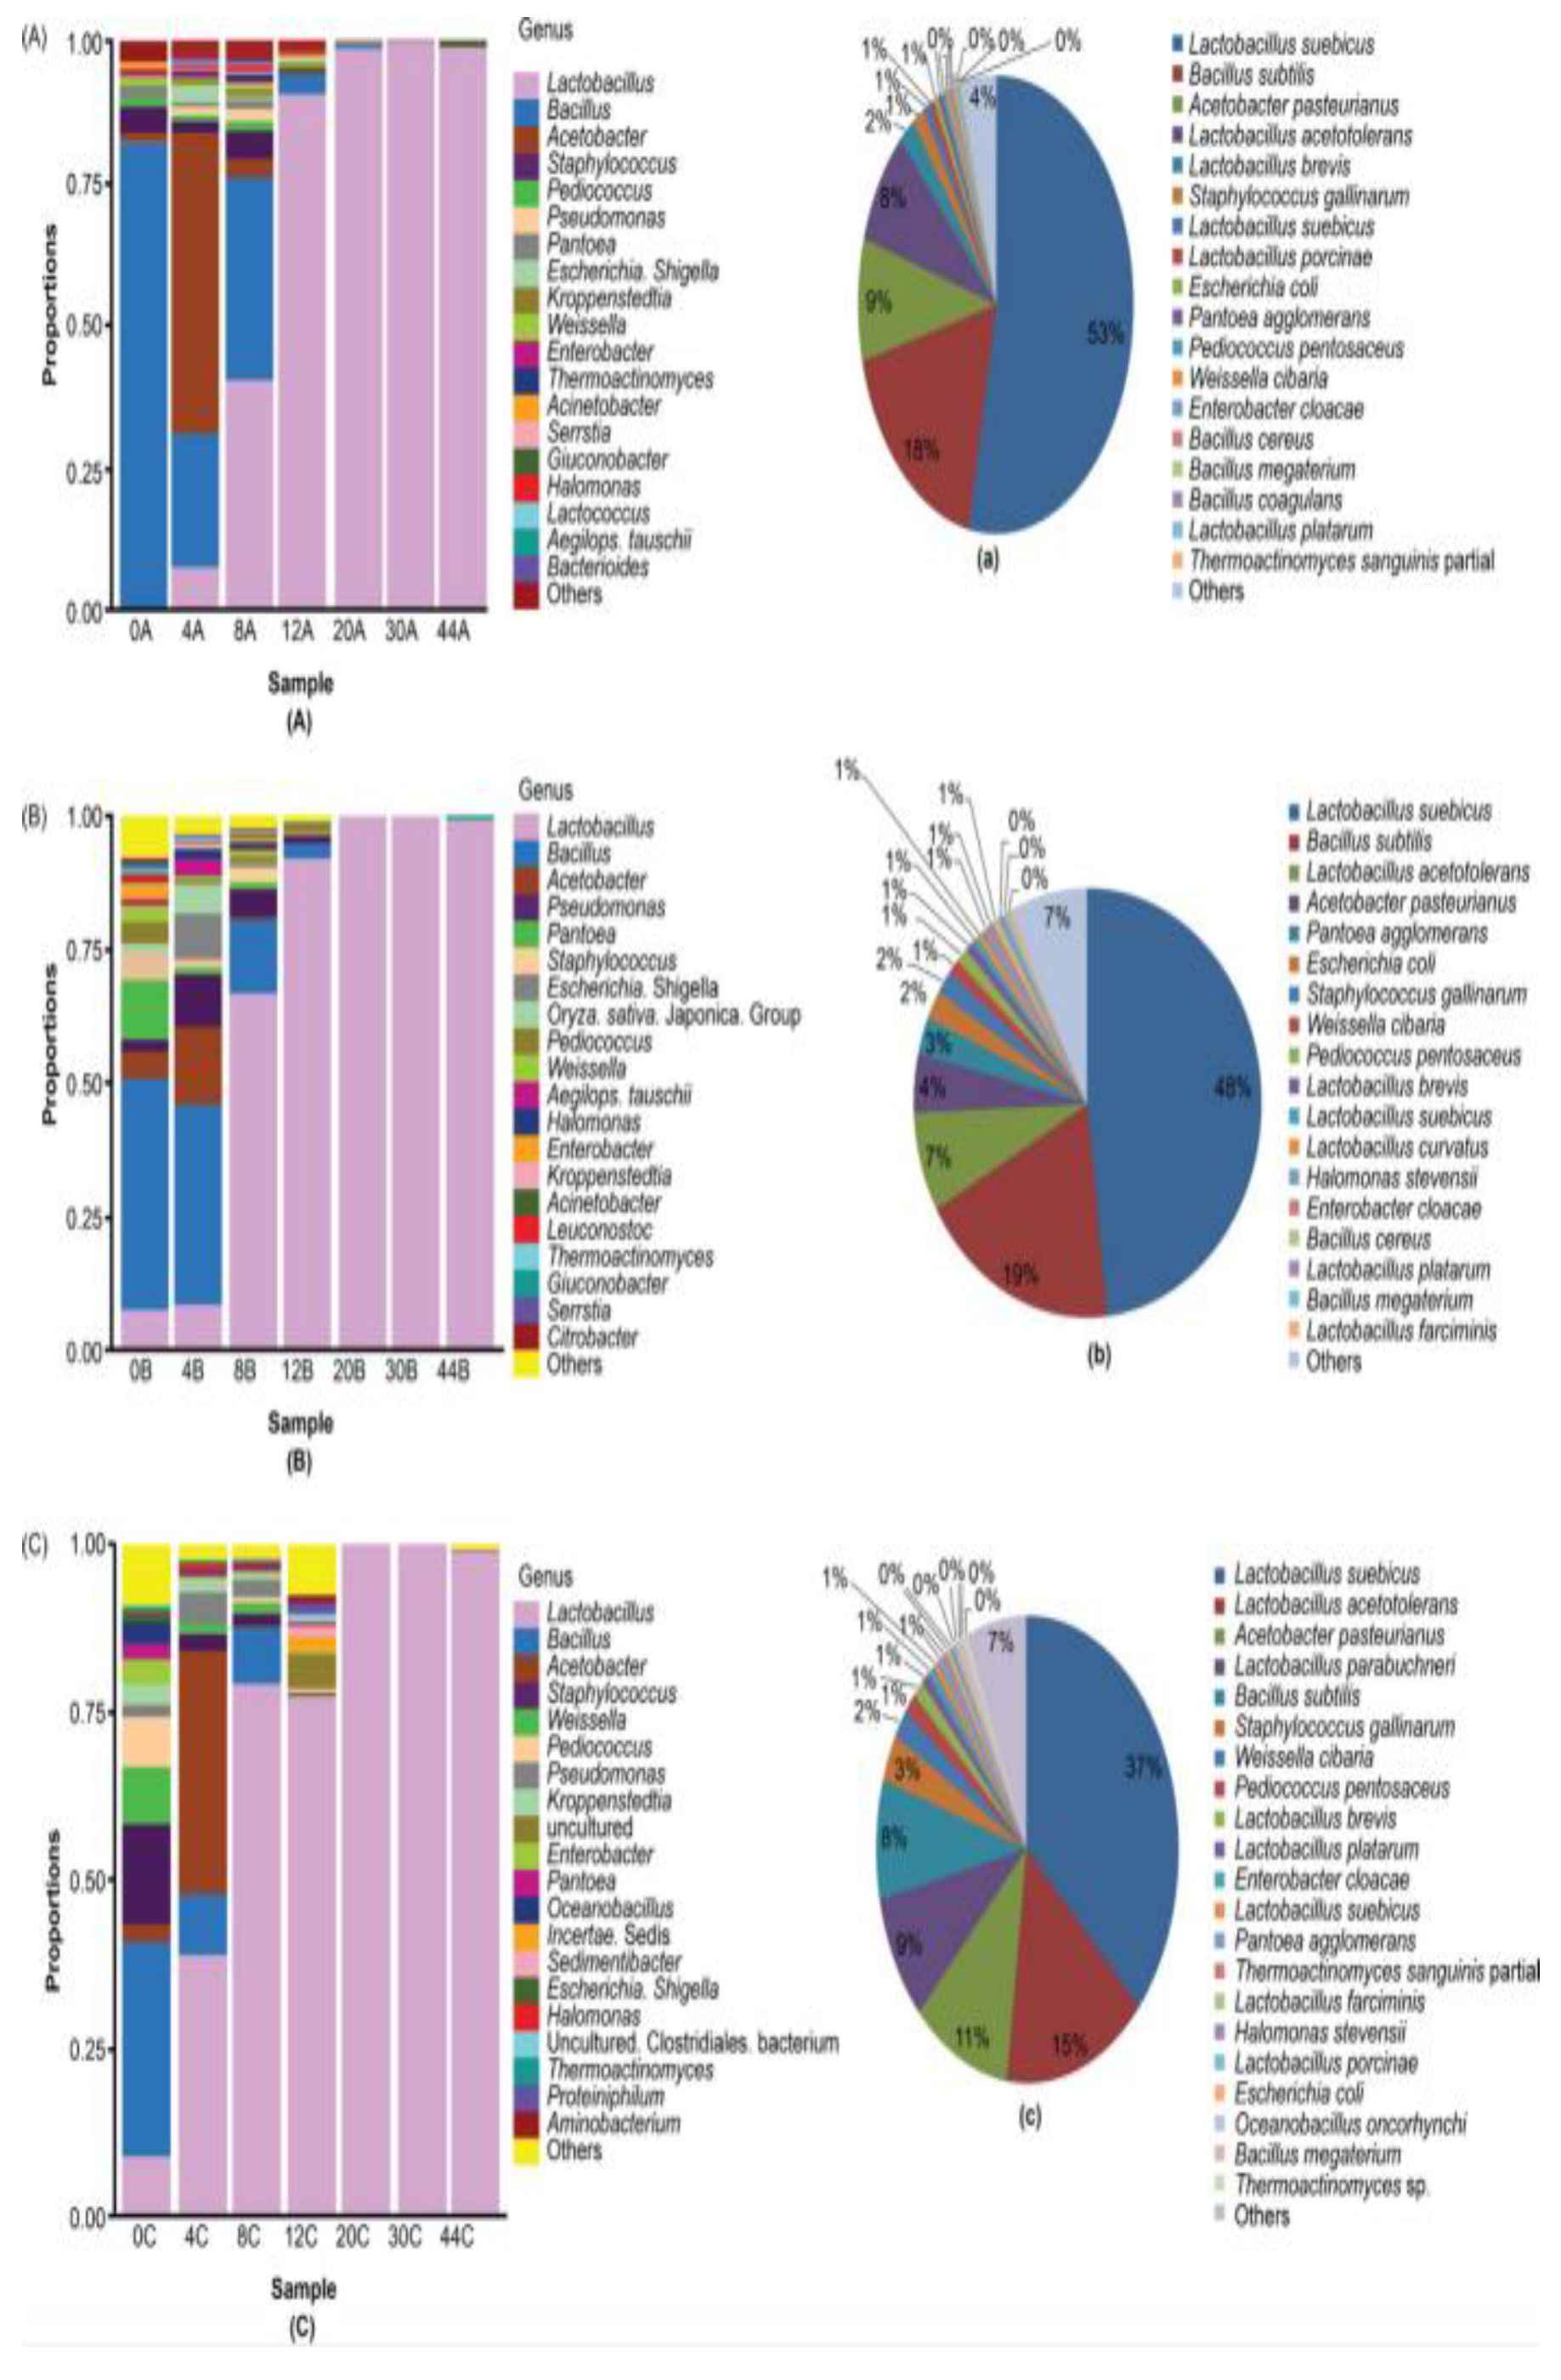
(A, B, and C) show the results of HTS analysis at the genus level. Figure 3 (a, b, and c) shows the results of the dominant bacteria in the upper, middle, and lower layers based on the number of sequences of each OTU, which were compared with the model strains in GenBank and the data of isolated strains in the data bank of Baijiu. The following dominant bacterial species were identified (Figure 3): Lactobacillus suebicus, Bacillus subtilis, Acetobacter pasteurianus, Lactobacillus acetotolerans, Lactobacillus brevis, Staphylococcus gallinarum, Lactobacillus suebicus, Escherichia coli, Pantoea agglomerans, Pediococcus pentosaceus, Weissella cibaria, Enterobacter cloacae, Bacillus megaterium, and Lactobacillus plantarum. Conversely, Bacillus cereus, Lactobacillus porcinae, Thermoactinomyces sanguinis, Halomonas stevensii, and Lactobacillus farciminis were the dominant species that appeared only in the two layers. Bacillus coagulans (upper panel), Lactobacillus curvatus (middle panel), Lactobacillus parabuchneri, Oceanobacillus oncorhynchi, and T. sanguinis. (lower panel) was dominant in only one layer. In particular, L. suebicus was the most abundant species in all three layers and can thus be considered the dominant bacteria in liquor brewing. Different species and their proportions may result in variations in the fermentation of different layers.
Figure 3.
(A, B, and C) show the results of HTS analysis at the genus level. Figure 3 (a, b, and c) shows the results of the dominant bacteria in the upper, middle, and lower layers based on the number of sequences of each OTU, which were compared with the model strains in GenBank and the data of isolated strains in the data bank of Baijiu. The following dominant bacterial species were identified (Figure 3): Lactobacillus suebicus, Bacillus subtilis, Acetobacter pasteurianus, Lactobacillus acetotolerans, Lactobacillus brevis, Staphylococcus gallinarum, Lactobacillus suebicus, Escherichia coli, Pantoea agglomerans, Pediococcus pentosaceus, Weissella cibaria, Enterobacter cloacae, Bacillus megaterium, and Lactobacillus plantarum. Conversely, Bacillus cereus, Lactobacillus porcinae, Thermoactinomyces sanguinis, Halomonas stevensii, and Lactobacillus farciminis were the dominant species that appeared only in the two layers. Bacillus coagulans (upper panel), Lactobacillus curvatus (middle panel), Lactobacillus parabuchneri, Oceanobacillus oncorhynchi, and T. sanguinis. (lower panel) was dominant in only one layer. In particular, L. suebicus was the most abundant species in all three layers and can thus be considered the dominant bacteria in liquor brewing. Different species and their proportions may result in variations in the fermentation of different layers.
3.4. Tree-Structure Analysis of Multiple Sample Similarity Based on UniFrac of HTS
Visualisations such as evolution trees were constructed using the unweighted pair-group method with arithmetic means (UPGMA) for hierarchical clustering to observe similarities and differences in microorganism evolution in different environmental samples [26]. Cluster analysis based on sample similarity was performed on the fungal communities of the upper, middle, and lower layer fermented grains at various fermentation stages. The upper layer samples on day 44 differed markedly, whereas the samples on day 20 were the most similar. The day 44 middle layer samples differed the most, whereas the samples on days 8 and 20 were most similar to each other and to the day 30 samples (Supplementary Figures S2A, B, and C). The changes were mainly detected in day 4 and day 8 samples. The lower layer resembled the middle layer, differing only on day 44. Differences between the samples during fermentation may be related to changes in the environment and microbial populations in the layers. Cluster analysis based on sample similarity was performed on the bacterial communities of the upper, middle, and lower layers of fermented grains at various fermentation stages. Samples from all three layers were clustered into two groups, with day 12 as the division line (Supplementary Figure S2a, b, and c, bottom). The cluster results of the upper and middle layers group the day 12 sample with those of days 0–8, whereas the cluster results of the lower layer group the day 12 sample with those of days 20–44. The lower and middle/upper layer samples were slightly different, whereas the upper and middle layers were more similar. These differences may be related to the changes in the environment and microbial populations in the layers.
3.5. Principal Component Analysis (PCA)
PCA was performed on the fungal and bacterial communities in the fermented grains during fermentation (Supplementary Figure S3). Fungi from the upper layer were considerably different from those from other samples (middle and lower) on day 44. These results are similar to those obtained using the cluster analysis mentioned above. At other time points, the differences were mainly apparent in the longitudinal direction of the sample, indicating the effects of the main acceptor components in PC2. Overall, the results obtained using principal component and cluster analyses for the three different layers agreed with each other. In addition, the three layers were highly similar, indicating that the results of the PCA and clustering analyses were consistent among the samples.
3.6. Population Succession of Dominant Microorganisms During Liquor Fermentation Based on HTS
Variations in the dominant bacteria by layer were also evident (Figure 4). The dominant bacteria present in all three layers during fermentation days 0–12 were B. subtilis, A. pasteurianus, L. brevis, S. gallinarum, L. suebicus, E. coli, P. agglomerans, P. pentosaceus, W. cibaria, E. cloacae, B. megaterium, and L. plantarum, the numbers of which decreased from days 0 to 8 (as the highest fermentation temperature was reached on day 12). The dominant bacteria on days 12–44 were L. suebicus and L. acetotolerans, the numbers of which increased during the late fermentation stage. The differences in the population succession of the upper-, middle-, and lower-layer bacteria were mainly reflected in L. brevis, L. porcinae, B. cereus, T. sanguinis, L. curvatus, L. parabuchneri, O. oncorhynchi, and Thermoactinomyces sp.
The bacterial isolation and culturing efforts [14] revealed a small number of bacteria. However, it is noteworthy that the species richness was high from day 0. Among them, the number of Acetobacter malorum, Acetobacter cerevisiae and Bacillus methylotrophicus was slightly higher, and on day 4, the number of species of bacteria increased significantly; this increase was mainly driven by Bacillus methylotrophicus, Acetobacter aceti, Acetobacter estunensis, Acetobacter pasteianus subsp. Pasteurianus and Bacillus vanillea. On day 8, the abundance and diversity of bacteria were still very high, and the fermentation temperature of the wine lees had also increase; the dominant bacteria in this period were Bacillus amyloliquefaciens subsp. plantar, Bacillus methylotrophicus and Bacillus atrophaeus. On approximately day 12, the fermentation temperature of the wine lees reached its peak, with the abundance and diversity of bacteria also peaking at this point. The dominant strains in this period were Bacillus subtilis subsp. inaquosorum, Bacillus amyloliquefaciens subsp. plantarum Lactobacillus buchneri, Lactobacillus paracasei subsp. tolens and Bacillus vanillea. On day 20, the abundance and diversity of bacteria began to decrease; this decrease was suspected to be driven by the observed temperature increases. On day 3, the bacteria to reproduce, with this trend mainly driven by Bacillus subtilis subsp. inaquosorum, Bacillus sonorensis, Bacus amyloliquefaciens subsp. plantarum, Bacillus methylotrophicus, Bacillus vanillea and Bacillusrophaeus. On day 44, the fermentation ended, and the abundance and diversity of bacteria began to decline; the dominant species at this point were Bacillus amyloliquefaciens subsp. plantarum, Bacillus methylotrophicus and Gluconobacter cerinus.
3.7. Correlation Between Dominant Strains, Enzyme Activity, and Volatile Component Content
Figure 5.
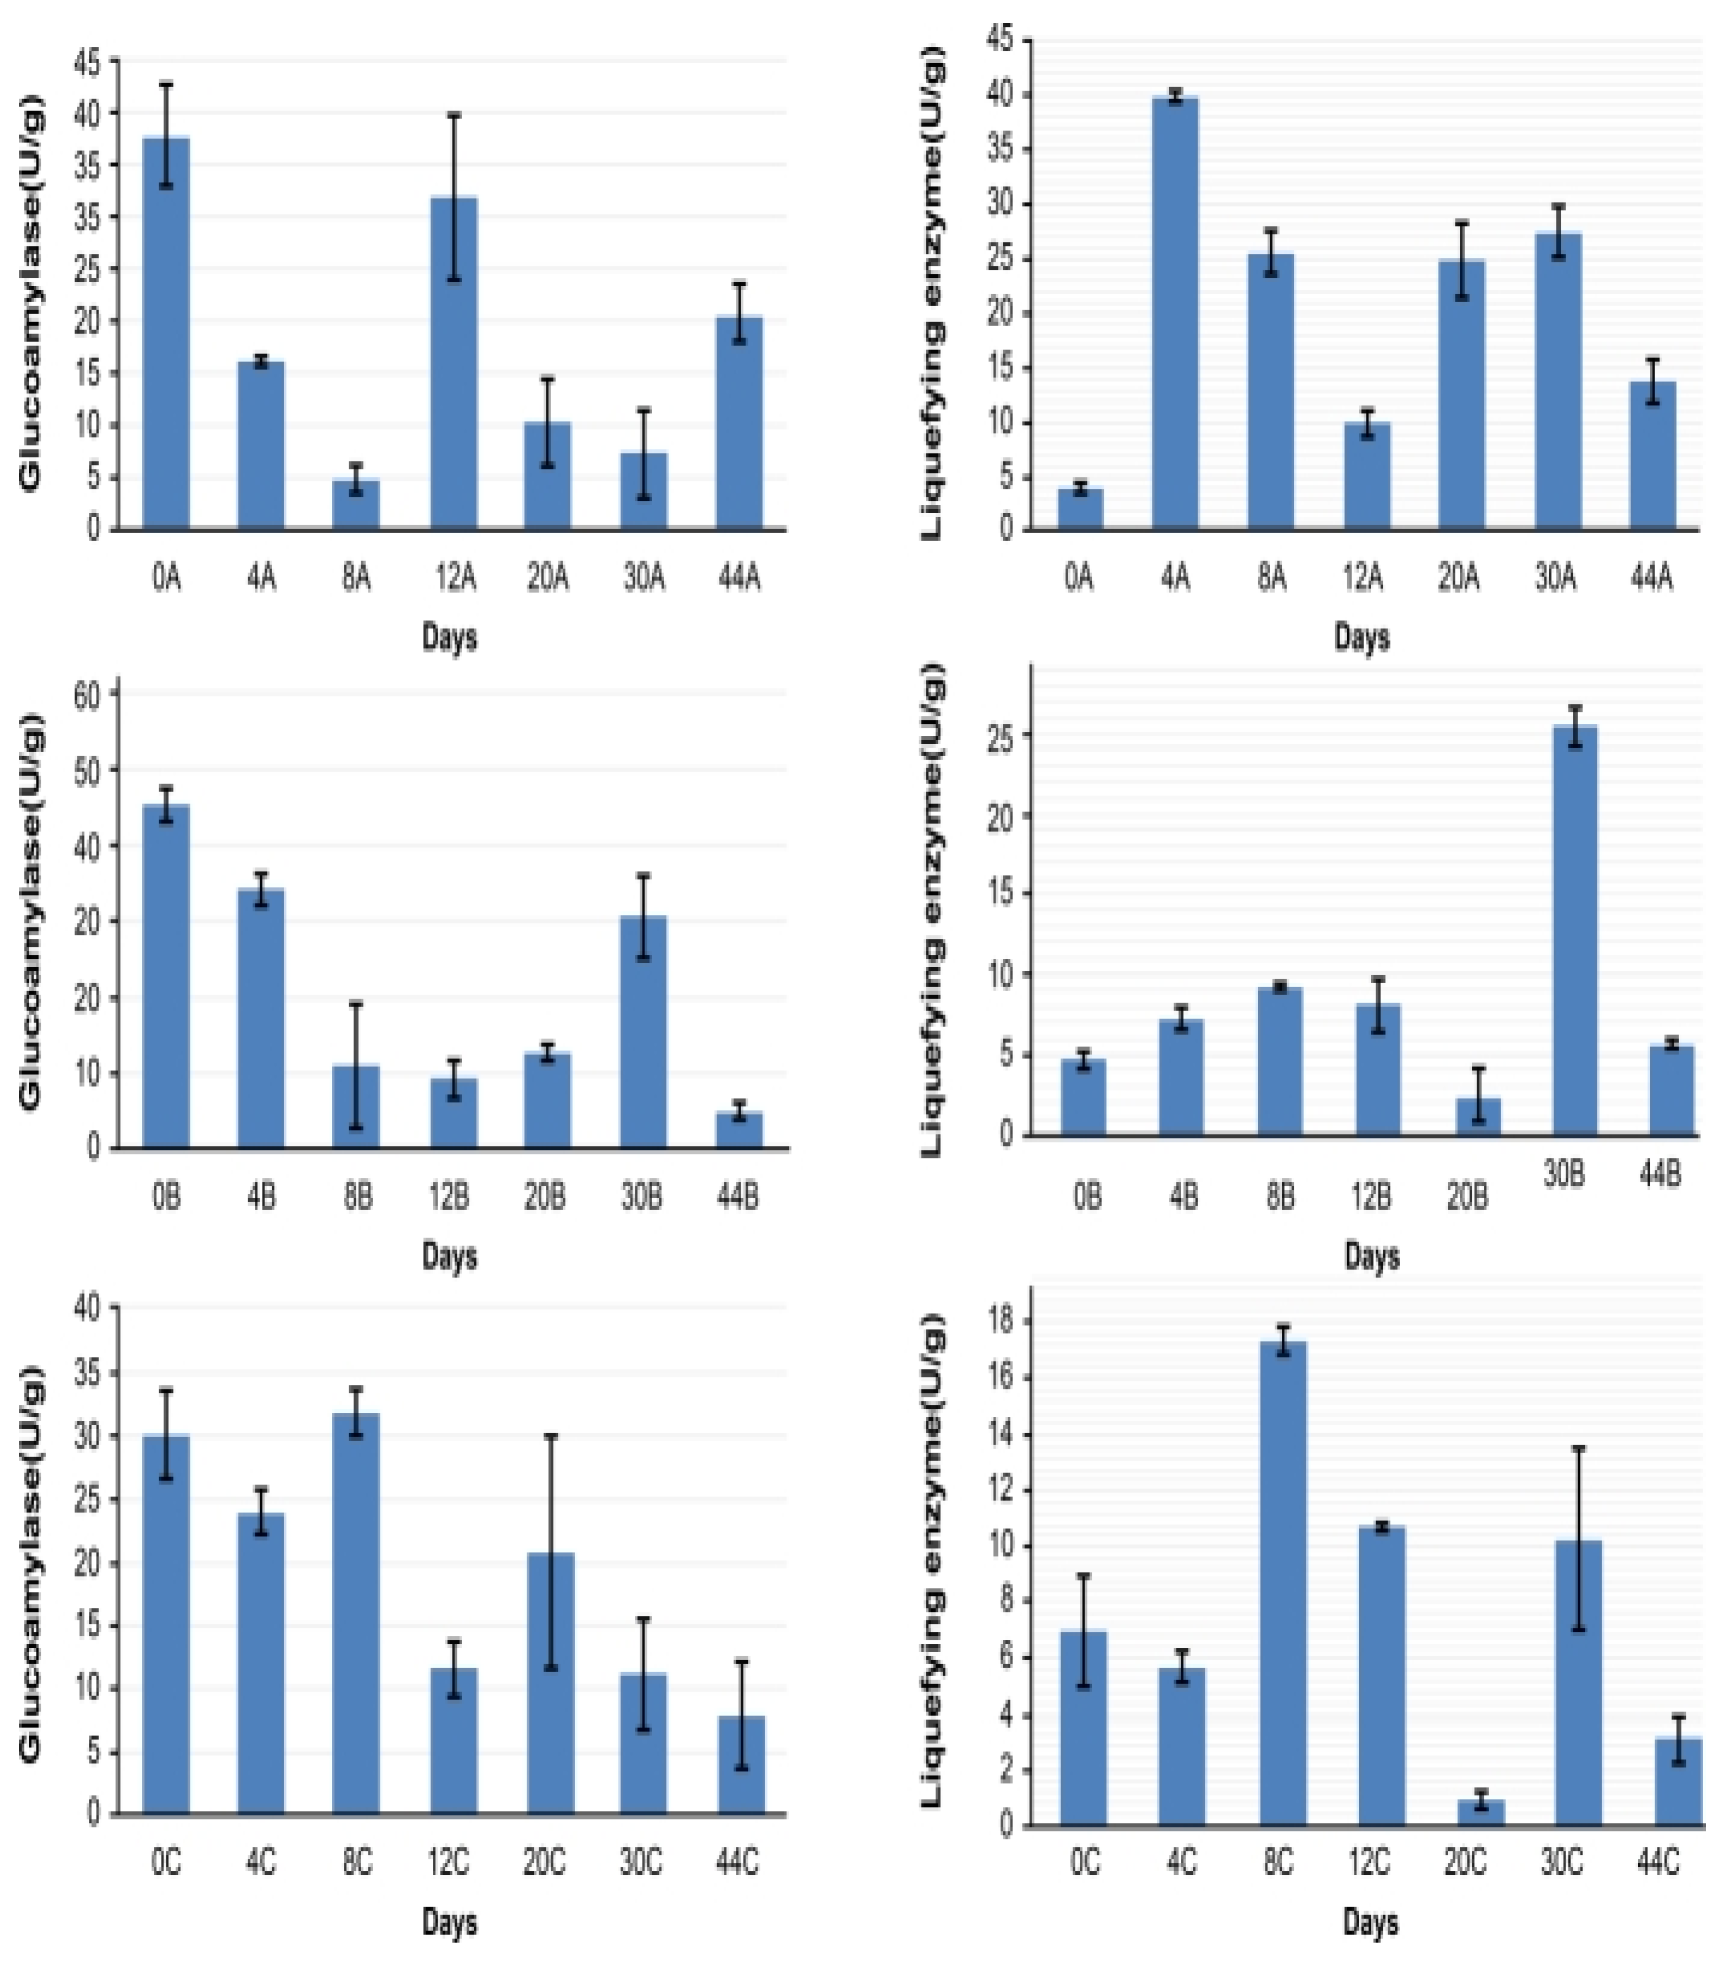
the activity in the upper grains first decreased, whereas it first increased and then decreased in the other layers. Due to the specialty of the Luzhou liquor-making process, environmental differences were relatively large in the upper, middle, and lower layers, accounting for the differences in enzyme activity. In the upper layer, liquefying enzyme activity fluctuated from day 0 to day 12. In the middle layer, the liquefying enzyme activity was generally low, whereas in the lower layer, the activity changed markedly, increasing considerably on days 8 and 30 with large decreases on days 20 and 44 (Figure 5).
Figure 5.
the activity in the upper grains first decreased, whereas it first increased and then decreased in the other layers. Due to the specialty of the Luzhou liquor-making process, environmental differences were relatively large in the upper, middle, and lower layers, accounting for the differences in enzyme activity. In the upper layer, liquefying enzyme activity fluctuated from day 0 to day 12. In the middle layer, the liquefying enzyme activity was generally low, whereas in the lower layer, the activity changed markedly, increasing considerably on days 8 and 30 with large decreases on days 20 and 44 (Figure 5).
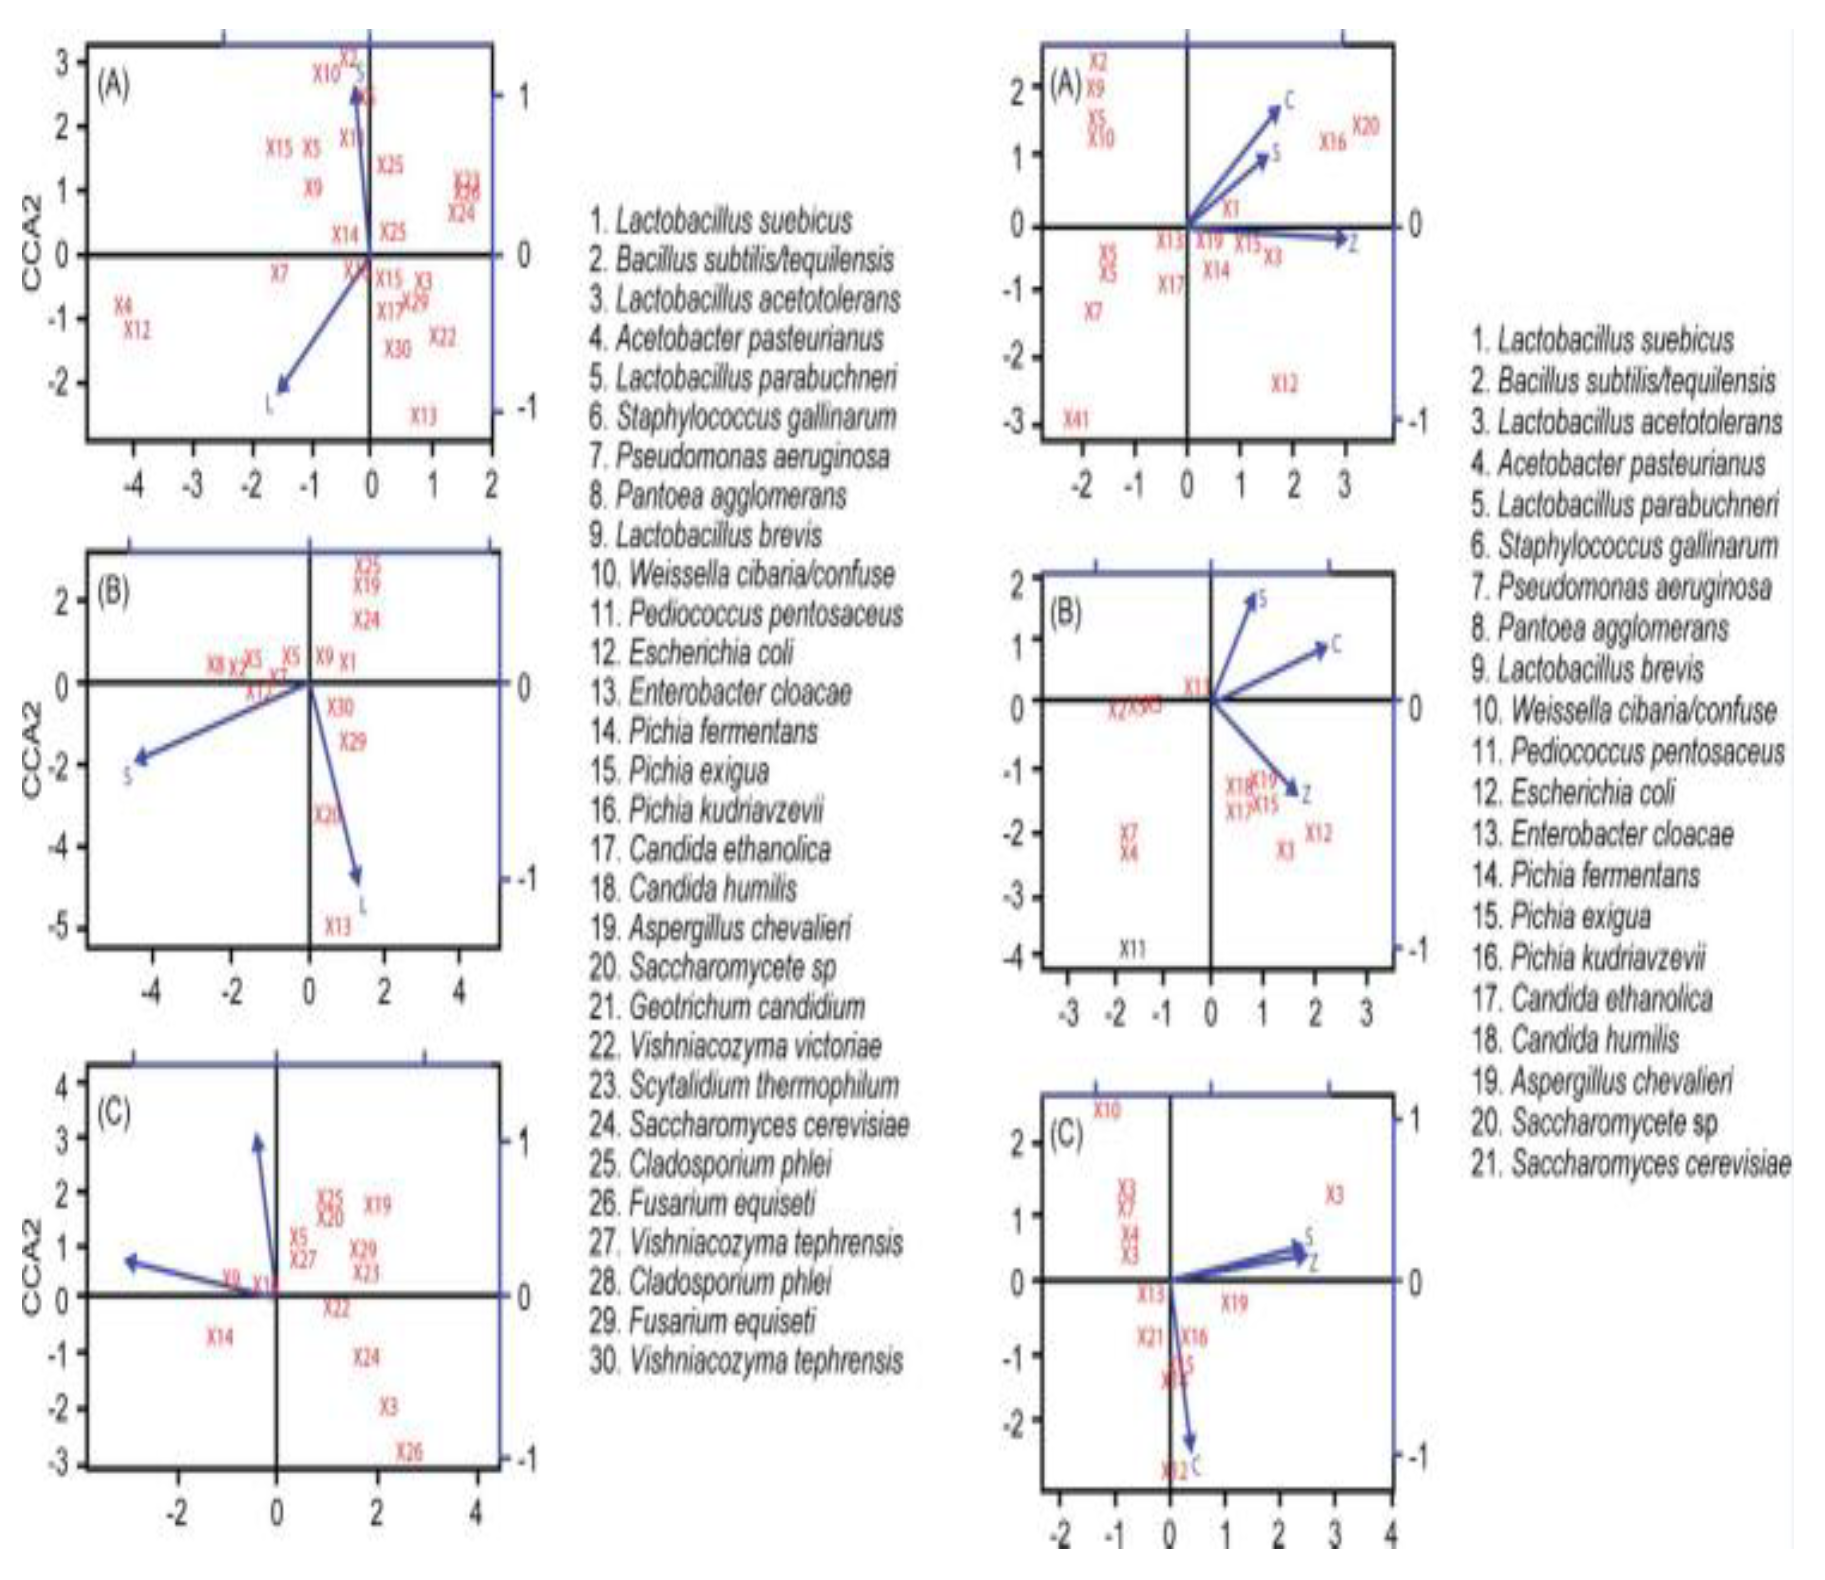
Volatile substances in different samples from each layer were analysed using HS-SPME-GC-MS (Supplemental Tables S1-S3). Overall, 74 types of volatile substances were identified in the upper layer: 33 esters, 17 alcohols, 4 acids, 5 phenols, 5 aldehydes, 4 ketones, and 6 others; 96 types of volatile substances were identified in the middle layer: 34 esters, 18 alcohols, 4 acids, 7 phenols, 12 aldehydes, ketones, and 21 others; and 83 types of volatile substances were identified in the lower layer: 34 esters, 15 alcohols, 10 acids, 6 phenols, 8 aldehydes, ketones, and 10 others. The correlation between these strains and esters was stronger than that with alcohols, followed by that with acids. High middle layer correlations between acids, alcohols, and strains X1 (Lactobacillus suebicus) and X14 (Pichia exigua) are shown in Figure 6 (right, B). Higher correlations between esters and X12 (L. suebicus) were observed. Figure 6 (right) C (bottom) shows strong correlations between the acids, esters, and X3 (Lactobacillus acetotolerans). A strong correlation between alcohol consumption and X12 (Lactobacillus suebicus) was also observed. The microbes that correlate with enzymes and volatile substances may be the functional brewing microorganisms of strong-flavour liquor.
4. Discussion
Evaluation of fermented grain microbial communities may provide a fundamental understanding of the species responsible for liquor quality, in addition to generating important resources for regulating annual fermentation processes and developing strategies to ensure product quality [5]. In this study, numerous dominant bacteria and fungi were identified using a combination of HTS and culture-dependent methods, accounting for 92.5% of the total bacteria and 92.7% of the dominant fungi.
Lactococcus, Sporolactobacillus, and Streptococcus were isolated using the culture-dependent method[37]; Pichia, Saccharomycopsis, and Talaromyces were dominant on the first day, whereas the fungi Eurotium and the bacteria Burkholderia, Lactobacillus, and Streptococcus were abundant on the seventh day, and only Burkholderia and Lactobacillus were detected in the SSU rRNA profiles on days 1, 7, and 60 [7]. Consistent with the present findings, Zhang et al. (2005a) [35]showed that the genera Saccharomyces and Saccharomycopsis were the dominant fungi in Luzhou-flavoured liquor. However, their observations revealed changes in the microbial population during fermentation only at the genus level, and did not reveal the succession of dominant species populations, as shown in this study. Chen et al. [38] isolated the genera Candida, Pichia, and Aspergillus from fermented grains, as also observed in the current study. The studies may differ not only in the method but also due to the fact that the growth and metabolism of microorganisms are influenced by the substrates, water, pH, temperature, oxygen, and the complex micro-ecosystem, achieving dynamic balance through coordination and inhibition.
In a previous study, we isolated and identified bacterial microorganisms from fermented grains at different stages of Luzhou-flavour liquor by 16S rRNA gene sequence analysis; a total of 258 strains of bacteria were isolated, and the dominant bacterial microorganisms in different fermentation stages of wine lees fermentation were quickly and accurately found [14]. The bacterial diversity in the early stages of fermentation was very rich, and there were no obvious differences between the various genera. In the middle stages of fermentation, the bacteria were mainly Bacillus and Lactobacillus, whereas in the later stages of fermentation, Bacillus was the predominant genus. The results of this study show that Bacus and Lactobacillus are the main functional microorganisms in the fermentation process of Luzhou-flavoured liquor, which play an important role in the flavour formation of Luzhou-flavoured liquor, and also verify the relevant research of predecessors. Yeasts were also isolated from fermented grains at different stages of fermentation, and variations among different yeast species were analyzed using SSCP. Furthermore, the sequences of the D1/D2 region of the 26S rRNA gene of 130 yeast strains belonging to nine genera and 15 species, Pichia fermentans, Naumovozymacastellii, Torulaspora delbrueckii, Saccharomyces cerevisiae, P. membranifaciens, Candida humilis, Kazachstania exigua,Saccharomycopsis fibuligera, Millerozyma farinosa, C. cabralensis, P. kudriavzevii, C. ethanolica, P. occidentalis, Zygosaccharomyces bailii and C. rugopelliculosa, were analyzed and identified.
In this study, we observed that the dominant fungal population succession was nearly identical across the layers during fermentation. In particular, the abundance of Candida ethanolica, Saccharomycete sp., and Saccharomyces cerevisiae was higher in the lower layer than in the middle and upper layers. By convention in liquor making, liquor distilled from the lower layer is typically of higher quality than that distilled from the middle and upper layers, which may be explained by the different microorganism successions in the different layers. To date, few studies have examined Candida ethanolica. It differs from other species in the genus in that it does not assimilate nitrate, produce urease, or ferment sugars. Bacteria, which are the main driving forces in solid-state fermentation and acid formation and are important for yeast growth and flavour development in various types of traditional Chinese liquors, are indispensable for Daqu preparation [18], grain fermentation [17], and pit mud [27]. Here, the middle and lower layer bacterial diversities were substantially higher than those in the upper layer, with the dominant bacteria common to the middle layers exhibiting similar changes. Interspecific association analysis identified 30 bacterial species. Phylogenetic analysis using 16S rDNA of the genus Bacillus isolated from the fermented grains of Luzhou-flavoured liquor, demonstrated that the genus is diverse, without a clearly dominant species. Wang et al. (2011) [39] studied the diversity of culturable bacteria in Luzhou-flavoured liquor brewing of Yibin and observed that the genus Bacillus was the dominant bacterium in fermentation, whereas the genera Streptomyces and Staphylococcus were secondary. These studies are limited because they were based on culturable bacteria and did not consider non-culturable microorganisms in their analyses. Zhang et al. (2005a) [35] used PCR to identify bacterial communities and identified Lactobacillus as the dominant genus, as shown in the present study. However, they only analysed middle layer samples, whereas the present study examined the bacteria present in all three layers during Luzhou-flavored liquor brewing, thereby allowing for more accurate determination of the dominant species and their population succession. The differences in bacterial species between the lower and upper or middle layers were evidenced by the dominance of L. parabuchneri, O. oncorhynchi, and Thermoactinomyces sp. only in the lower layer. To observe the diversity and abundance of microorganisms present in each of the three layers more clearly, the different species and numbers of isolates obtained from each layer should be determined. L. parabuchneri is a heterofermentative lactic acid bacterium capable of reducing lactic acid content and increasing acetic acid production [28]. Excess lactic acid inhibits the growth and proliferation of beneficial microorganisms in Luzhou-flavour liquor brewing, such as caproic acid-producing bacteria, which have limited acid tolerance and only live at weakly acidic or nearly neutral pH. As a high 708 lactic acid content impairs their vitality, L. parabuchneri is important for the suppression of lactic acid and elevation of caproic acid-producing bacteria. Studies on O. oncorhynchi, a salt-tolerant, gram-positive, rod-shaped, flagellate, obligate alkaliphile that produces oval spores [29], are limited. He et al. [34] characterised Actinobacteria isolated from Luzhou-flavoured liquor and studied the fragrances of their metabolites, resulting in the separation of 123 strains producing volatile products. Their metabolites include numerous acids, alcohols, and esters that constitute their liquor flavour. He et al. (2019) also observed that Streptomyces mutabilis, S. vinaceusdrappus, S. coelicoflavus, and S. violascens were involved in increasing the content of flavour compounds, such as ethyl acetate, ethyl caproate, ethyl lactate, butanoic acid, and furfural. The different characteristics of these bacteria may affect fermentation during Luzhou-flavoured liquor production. The correlation between enzyme activity and changes in volatile compound content was similar to that previously reported for stabilising persistent microbial succession. This indicates that P. fermentans, L. suebicus, L. acetotolerans, P. kudriavzevii, P. exigua, and B. tequilensis in fermented grains significantly affected the brewing of Luzhou-flavoured liquor. Therefore, HTS analysis can accurately reveal the population composition, structure, and function of microorganisms, as well as their succession. It can also identify dominant microorganisms, thereby providing a foundation for further research.
Traditional Chinese Luzhou-flavoured liquor has a long history, spanning thousands of years. However, its traditional production technology has gaps compared to other brewing technologies, mainly because functional microorganisms have not been clearly identified to date; therefore, the specific brewing mechanism remains unknown [18]. Many studies have been conducted to understand this phenomenon [5,17,30,31]. It was recently reported that the dominant bacteria in fermented grains of Luzhou-flavoured liquor were Lactobacillus, Bacillus, Weissella, Dysgonomonas, Comamonas, and Ruminococcaceae [32], and the dominant fungi in the middle layer of fermented grains were mainly Kazachstania, Aspergillus, Thermomyces, Thermoascus and Eurotium [33]. However, the results of the present study showed that the dominant populations at the early fermentation stage were Lactobacillus, Bacillus, and yeasts, and Lactobacillus in the late stage of fermentation. These differences may be related to the differences of the samples obtained using different brewing technologies [5,17]. These observations will help elucidate the functional microorganisms and mechanisms underlying traditional Chinese Baijiu production and, therefore, will have a considerable impact on improving the quality and efficiency of traditional liquor brewing. However, to confirm their functionality, samples from each period are required for transcriptome analysis. Finally, pure culture experiments are required to confirm the microbes associated with flavour.
Supplementary Materials
The following supporting information can be downloaded at the website of this paper posted on Preprints.org: Figure S1: Shannon-Wiener analysis based on the Shannon indices for ITS1 (A-C) and 16S V3/V4 (a-c) from fermented grain samples taken separately from upper (A), middle (B), and lower (C) layers (THS data; A, upper; B, middle; C, lower layers; the number indicates days); Figure S2: Clustering analysis of ITS1 (A-C) and 16S V3/V4 (a-c) from upper, middle, and lower fermented grain layers (HTS data). Clustering analysis was performed using UPGMA, a type of hierarchical clustering method based on unweighted UniFrac distance metrics (A, upper; B, middle; C, lower layers; the number indicates days); Figure S3: PCA analysis of fungal (upper) and bacterial (lower) community in fermenting grains (fungus: A, upper; B, middle; C, lower layers. bacteria: a, upper; b, middle; c, lower layers) during fermentation; Table S1: Peak area percentage of volatile compounds in upper layer (A) fermented grains during Luzhou-flavour liquor production; Table S2: Peak area percentage of volatile compounds in fermented grain middle layer (B) during Luzhou-flavour liquor production; Table S3: Peak area percentage of volatile compounds in the fermented grain lower layer (C) during Luzhou-flavour liquor production.
Author Contributions
Xiao Dou collected and analysed the data. Zaibin Xie: Writing–original draft. Shunchang Pu and Yu Zhang: Writing-review and editing. Xiaohui Zhou: Methodology and editing. Jiangang Yang: Writing-review and editing, Methodology, Funding acquisition, and conceptualisation.
Funding
This research was funded by a Project of Bozhou University, grant number BYKQ2021Z03 and Anhui Province Higher Education Institutions Scientific Research Projects [grant number: 2022AH052419].
Data Availability Statement
The authors declare that the data supporting the findings of this study are available within the paper and its Supplementary Information files.
Acknowledgments
We thank Dr. Feng-Yan Bai and Mr. Pei-Jie Han of the State Key Laboratory of Mycology, Institute of Microbiology, for technical support, and Editage (www.editage.com) for English language editing.
Conflicts of Interest
The authors declare that there are no conflicts of interest.
References
- Li, Q.; Lin, B.; Tang, J.; An, L.; Jiang, W.; Li, R.; Zhang, G.; Yang, Q.; Yang, S.; Chen, S. Studying on genetic diversity and metabolic differences of Saccharomyces cerevisiae in baijiu. Eur Food Res Technol 2024, 250, 1619–1640. [Google Scholar] [CrossRef]
- Li, W.; Han, M.; Zhang, H.; Zhang, Q.; Lang, Y.; Hu, S.; Li, X.; Sun, B. Exploring the differences in sauce-flavour Daqu from different regions and its contribution to baijiu brewing based on microbial communities and flavours. Int J Food Sci Technol 2024, 59, 7357–7371. [Google Scholar] [CrossRef]
- Xia, Y.; Luo, H.; Wu, Z.; Zhang, W. Microbial diversity in jiuqu and its fermentation features: saccharification, alcohol fermentation and flavors generation. Appl Microbiol Biotechnol 2023, 107, 25–41. [Google Scholar] [CrossRef] [PubMed]
- Wei, Y.; Zou, W.; Shen, C.H.; Yang, J.G. Basic flavor types and component characteristics of Chinese traditional liquors: a review. J Food Sci 2020, 85, 4096–4107. [Google Scholar] [CrossRef] [PubMed]
- Xu, Y.; Sun, B.; Fan, G.; Teng, C.; Xiong, K.; Zhu, Y.; Li, J.; Li, X. The brewing process and microbial diversity of strong flavour Chinese spirits: a review. J Inst Brew 2017, 123, 5–12. [Google Scholar] [CrossRef]
- Gao, J.; Liu, G.; Li, A.; Liang, C.; Ren, C.; Xu, Y. Domination of pit mud microbes in the formation of diverse flavour compounds during Chinese strong aroma-type baijiu fermentation. LWT 2021, 137, 110442. [Google Scholar] [CrossRef]
- Xiang, W.; Li, K.; Liu, S.; Xing, Y.; Li, M.; Che, Z. Microbial succession in the traditional Chinese Luzhou-flavor liquor fermentation process as evaluated by SSU rRNA profiles. World J Microbiol Biotechnol 2013, 29, 559–567. [Google Scholar] [CrossRef] [PubMed]
- Li, K.; Zhang, Q.; Zhong, X.T.; Jia, B.H.; Yuan, C.H.; Liu, S.; Che, Z.M.; Xiang, W.L. Microbial diversity and succession in the Chinese Luzhou-flavor liquor fermenting cover lees as evaluated by SSU rRNA profiles. Indian J Microbiol 2013, 53, 425–431. [Google Scholar] [CrossRef] [PubMed]
- Liang, H.; Luo, Q.; Zhang, A.; Wu, Z.; Zhang, W. Comparison of bacterial community in matured and degenerated pit mud from Chinese Luzhou-flavour liquor distillery in different regions. J Inst Brew 2016, 122, 48–54. [Google Scholar] [CrossRef]
- Fu, J.; Chen, L.; Yang, S.; Li, Y.; Jin, L.; He, X.; He, L.; Ao, X.; Liu, S.; Liu, A.; et al. Metagenome and analysis of metabolic potential of the microbial community in pit mud used for Chinese strong-flavor liquor production. Food Res Int 2021, 143, 110294. [Google Scholar] [CrossRef] [PubMed]
- Liu, K.Y.; Wang, Q.; Chen, Z.; Mao, D.M.; Liang, Z.W. Correlation analysis between amino acids and bacterial communities of Wuliangye-flavour liquor fermentation in aged fermentation pit. Int Food Res J 2022, 29, 892–899. [Google Scholar] [CrossRef]
- Wu, X.; Pan, D.; Xia, Q.; Sun, Y.; Geng, F.; Cao, J.; Zhou, C. The combination of high-throughput sequencing and LC-MS/MS reveals the mechanism of Staphylococcus inoculation on bacterial community succession and taste development during the processing of dry-cured bacon. J Sci Food Agric 2023, 103, 7187–7198. [Google Scholar] [CrossRef] [PubMed]
- Metin, B.; Pehlivanoğlu, H.; Yildirim Servi, E.Y.; Arıcı, M. Bacterial dynamics of Hardaliye, a fermented grape beverage, determined by highthroughput sequencing. J Agr Sci-Tarim Bili 2023, 29, 756–764. [Google Scholar] [CrossRef]
- Dou, X.; Han, P.J.; Liu, L.; Zhang, Y.H.; He, J.M.; Zhou, X.X.; Wu, Y.Y.; Bai, F.Y.; Yang, J.G. Study on isolation and identification and population succession law of bacterial in fermented grains during the brewing of Luzhou-flavour Liquor. Sci Technol Food Ind 2017, 30, 169–174. [Google Scholar]
- Yang, J.G.; Su, C.; Dou, X.; Guo, J.; Zhang, Q.; Zhang, S.; Ao, Z.; Shen, C. Analysis of yeast succession during the fermentation of Luzhou-flavor liquor and its effect on the formation of selected flavor components. Food Sci. [CrossRef]
- Yang, J.G.; Dou, X.; Ma, Y.Y. Diversity and dynamic succession of microorganisms during Daqu preparation for Luzhou-flavour liquor using second-generation sequencing technology. J Inst Brew 2018, 124, 498–507. [Google Scholar] [CrossRef]
- Sun, W.; Xiao, H.; Peng, Q.; Zhang, Q.; Li, X.; Han, Y. Analysis of bacterial diversity of Chinese Luzhou-flavor liquor brewed in different seasons by Illumina MiSeq sequencing. Ann Microbiol 2016, 66, 1293–1301. [Google Scholar] [CrossRef]
- Yang, J.G.; Dou, X.; Han, P.J.; Bai, F.Y.; Zhou, J.; Zhang, S.Y.; Qin, H.; Ma, Y.Y. Microbial diversity in Daqu during production of Luzhou flavored liquor. J Am Soc Brew Chem 2017, 75, 136–144. [Google Scholar] [CrossRef]
- Yan, S.B.; Wang, S.C.; Wei, G.G.; Zhang, K.G. Investigation of the main parameters during the fermentation of Chinese Luzhou-flavour liquor. J Inst Brew 2015, 121, 145–154. [Google Scholar] [CrossRef]
- Oksanen, J.; Blanchet, F.; Kindt, R.; Legendre, P.; McGlinn, D.; Minchin, P.R. Vegan: community ecology package. Rpackage Version 1.17-3, 2010. Available online:.
- Narayan, A.; Jain, K.; Shah, A.R.; Madamwar, D. An efficient and cost-effective method for DNA extraction from athalassohaline soil using a newly formulated cell extraction buffer. 3 Biotech 2016, 6, 62. [Google Scholar] [CrossRef] [PubMed]
- Schloss, P.D.; Westcott, S.L.; Ryabin, T.; Hall, J.R.; Hartmann, M.; Hollister, E.B.; Lesniewski, R.A.; Oakley, B.B.; Parks, D.H.; Robinson, C.J.; et al. Introducing Mothur: open-source, platform-independent, community -supported software for describing and comparing microbial communities. Appl Environ Microbiol 2009, 75, 7537–7541. [Google Scholar] [CrossRef] [PubMed]
- Edgar, R.C.; Haas, B.J.; Clemente, J.C.; Quince, C.; Knight, R. Uchime improves sensitivity and speed of chimera detection. Bioinformatics 2011, 27, 2194–2200. [Google Scholar] [CrossRef] [PubMed]
- Amato, K.R.; Yeoman, C.J.; Kent, A.; Righini, N.; Carbonero, F.; Estrada, A.; Gaskins, H.R.; Stumpf, R.M.; Yildirim, S.; Torralba, M.; et al. Habitat degradation impacts black howler monkey (Alouatta pigra) gastrointestinal microbiomes. ISME J 2013, 7, 1344–1353. [Google Scholar] [CrossRef] [PubMed]
- Wang, Y.; Sheng, H.F.; He, Y.; Wu, J.Y.; Jiang, Y.X.; Tam, N.F.Y.; Zhou, H.W. Comparison of the levels of bacterial diversity in fresh water, intertidal wetland, and marine sediments by using millions of Illumina tags. Appl Environ Microbiol 2012, 78, 8264–8271. [Google Scholar] [CrossRef] [PubMed]
- Noval Rivas, M.; Burton, O.T.; Wise, P.; Zhang, Y.Q.; Hobson, S.A.; Garcia Lloret, M.; Chehoud, C.; Kuczynski, J.; DeSantis, T.; Warrington, J.; et al. A microbiota signature associated with experimental food allergy promotes allergic sensitization and anaphylaxis. J Allergy Clin Immunol 2013, 131, 201–212. [Google Scholar] [CrossRef] [PubMed]
- Ding, X.F.; Wu, C.D.; Zhang, L.Q.; Zheng, J.; Zhou, R.Q. Characterization of eubacterial and archaeal community diversity in the pit mud of Chinese Luzhou-flavor liquor by nested PCR–DGGE. World J Microbiol Biotechnol 2014, 30, 605–612. [Google Scholar] [CrossRef] [PubMed]
- Hong, M.; Diao, Q.Y.; Jiang, C.G.; Yan, G.L.; Tu, Y.; Zhang, N.F. Review for effect of Lactobacillus buchneri on the silage in the journal listing of OriProbe. Acta Prataculturae Sin 2011, 5, 266–271. [Google Scholar]
- Yumoto, I.; Hirota, K.; Nodasaka, Y.; Nakajima, K. Oceanobacillus oncorhynchi sp. nov., a halotolerant obligate alkaliphile isolated from the skin of a rainbow trout (Oncorhynchus mykiss), and emended description of the genus Oceanobacillus. Int J Syst Evol Microbiol 2005, 55, 1521–1524. [Google Scholar] [CrossRef] [PubMed]
- Li, P.; Lin, W.; Liu, X.; Wang, X.; Gan, X.; Luo, L.; Lin, W.T. Effect of bioaugmented inoculation on microbiota dynamics during solid-state fermentation of Daqu starter using autochthonous of Bacillus, Pediococcus, Wickerhamomyces and Saccharomycopsis. Food Microbiol 2017, 61, 83–92. [Google Scholar] [CrossRef] [PubMed]
- Liu, H.; Sun, B. Effect of fermentation processing on the flavor of baijiu. J Agric Food Chem 2018, 66, 5425–5432. [Google Scholar] [CrossRef] [PubMed]
- Xiao,C., Lu, Z., Zhang X., Wang, S., Li,D., Shen, C., Shi,J.; Xu, Z. Bacterial community succession in fermented grains of Luzhou-flavor baijiu. Acta Microbiologica Sinica 2019. 59(1), 195-204. [CrossRef]
- Xiao,C.; Lu, Z.; Zhang, X.; Wang, S.; Ao, L.; Sen C.; Shi, J.; Xu, Z. Succession of the fungal community on fermented grains of Luzhou-flavor baijiu through fermentation. Chin J Appl Environ Biol 2018,24 ( 5 ): 1081-1086. [CrossRef]
- He, G.; Huang, J.; Zhou, R.; Wu, C.; Jin, Y. Effect of fortified Daqu on the microbial community and flavor in Chinese strong-flavor liquor brewing process. Front Microbiol 2019, 10, 56. [Google Scholar] [CrossRef] [PubMed]
- Zhang, W.; Qiao, Z.; Shigematsu, T.; Tang, Y.; Hu, C.; Morimura, S.; Kida, K. Analysis of the bacterial community in Zaopei during production of Chinese Luzhou-flavor liquor, J. Inst. Brew. 2005, 111, 215–222. [Google Scholar] [CrossRef]
- Quast, C. , Pruesse, E., Yilmaz, P., Gerken, J., Schweer, T., Yarza, P., Peplies, J.; Glockner, F.O. The SILVA ribosomal RNA gene database project: improved data processing and web-based tools. Nucleic Acids Research. [CrossRef]
- Wang, H.Y. , Zhang, X. J., Zhao, L.P., and Xu, Y. Analysis and comparison of the bacterial community in fermented grains during the fermentation for two different styles of Chinese liquor. J. Ind. Microbiol. Biotechnol. 2008, 35, 603–609. [Google Scholar] [CrossRef]
- Chen, S.; Huang, J.; Qin, H.; He, G.; Zhou, R.; Yang, Y.; Qiu, C.; Zhang, S. Evolving the core microbial community in pit mud based on bioturbation of fortified Daqu. Can J Microbiol 2021, 67, 396–405. [Google Scholar] [CrossRef] [PubMed]
- Wang,W.; Zhao,D.; Tian,S.; You,L.; Wang,S.; Feng,R.; Feng,F.; Zhang, Z.; Cui,X. Phylogenetic diversity of cultivable bacteria during the brewing process of the Luzhou-flavor liquor in Yibin,Sichuan province,China. Acta Microbiologica Sinica 2011, 51( 10), 1351 - 1357. [CrossRef]
Figure 1.
a, b, and c (bottom) show the relationship between the number of sequences obtained during liquor brewing and the bacterial diversity. The curves approached a plateau as 15,000 sequences were randomly selected, indicating sequencing saturation and good species coverage. The 976,670 sequences obtained for the 16S V3/V4 regions (an average of 46,508 effective sequences per sample) are representative of winemaking bacterial populations. The OTU number was b > c > a on the 0th day under the same sequencing depth, and it was almost the same for all three layers on the 8th day. The OTU number was a > b on the 8th day, c > a > b on the 12th day, and a > b > c on the 20th day. The number was small and similar for all three layers on the 30th day and increased on the 44th day, but it still did not vary markedly across the layers. For the upper layer, the bacterial diversity increased during days 0–8 and gradually decreased during days 8–12. During days 12–44, it increased and decreased, followed by another small increase. During the elaboration of Luzhou-flavour liquor, the upper layer becomes the middle layer and eventually the lower layer in subsequent fermentation cycles, with the microorganisms therein supplying and controlling the microbial populations in the other layers.
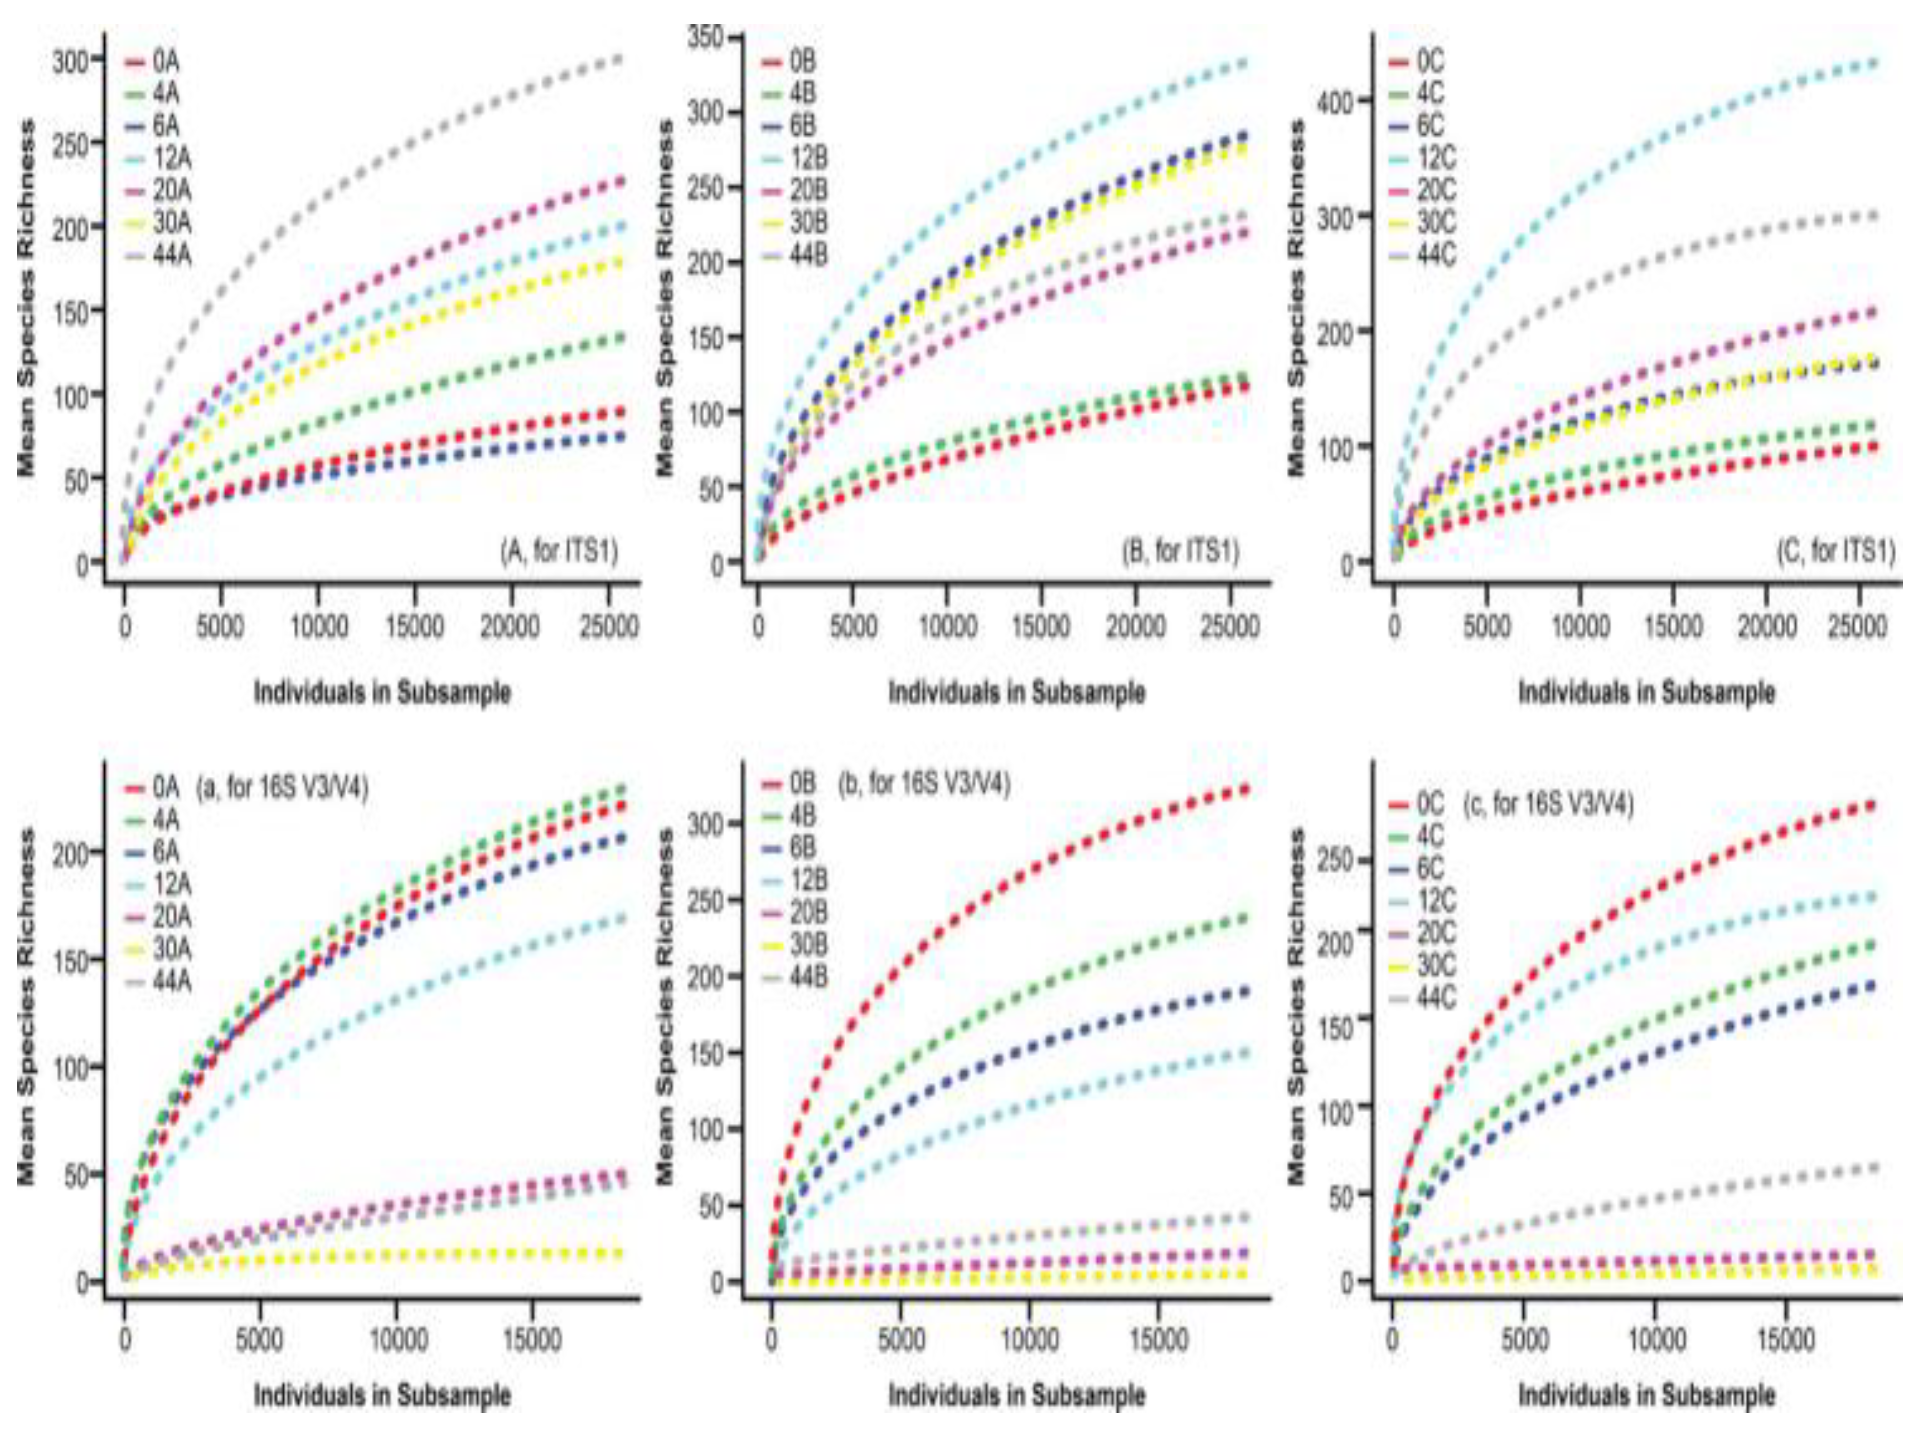
Figure 4.
shows a thermographic clustering map of the dominant fungi and bacteria at different fermentation stages obtained using HTS. Variations in the dominant fungi and bacteria by layer were clearly discernible. A similarity was observed in the variation of microbial composition in the layers where P. fermentans, P. exigua, C. humilis, P. kudriavzevii, A. chevalieri, S. cerevisiae, and C. ethanolica were the most prominent. P. fermentans was found to be abundant throughout the fermentation process. The levels of P. exigua, C. humilis, and S. cerevisiae initially increased and then decreased as fermentation proceeded. The numbers of P. kudriavzevii and A. chevalieri increased during fermentation. Although many microbial populations varied similarly across all the three layers, some differed from each other. C. ethanolica and an unidentified Saccharomycete, for example, were abundant in the upper and middle layers at the end of fermentation (day 44), but not in the lower layer. According to the thermographic clustering map of dominant fungi, the population succession of S. cerevisiae differed in each layer during fermentation. Thus, fungal succession in the upper and middle layers followed similar patterns, which were different from that in the lower layer. This may be related to the different environments in each layer. During strong-flavour liquor solid-state fermentation, water and microbial metabolites begin to concentrate in the lower layer, producing higher-quality liquor. Upon metabolite accumulation, the acidity of the lower layer and the alcohol content slowly increase. Therefore, certain low-tolerance microorganisms die, resulting in lower-and middle/upper-layer differences.
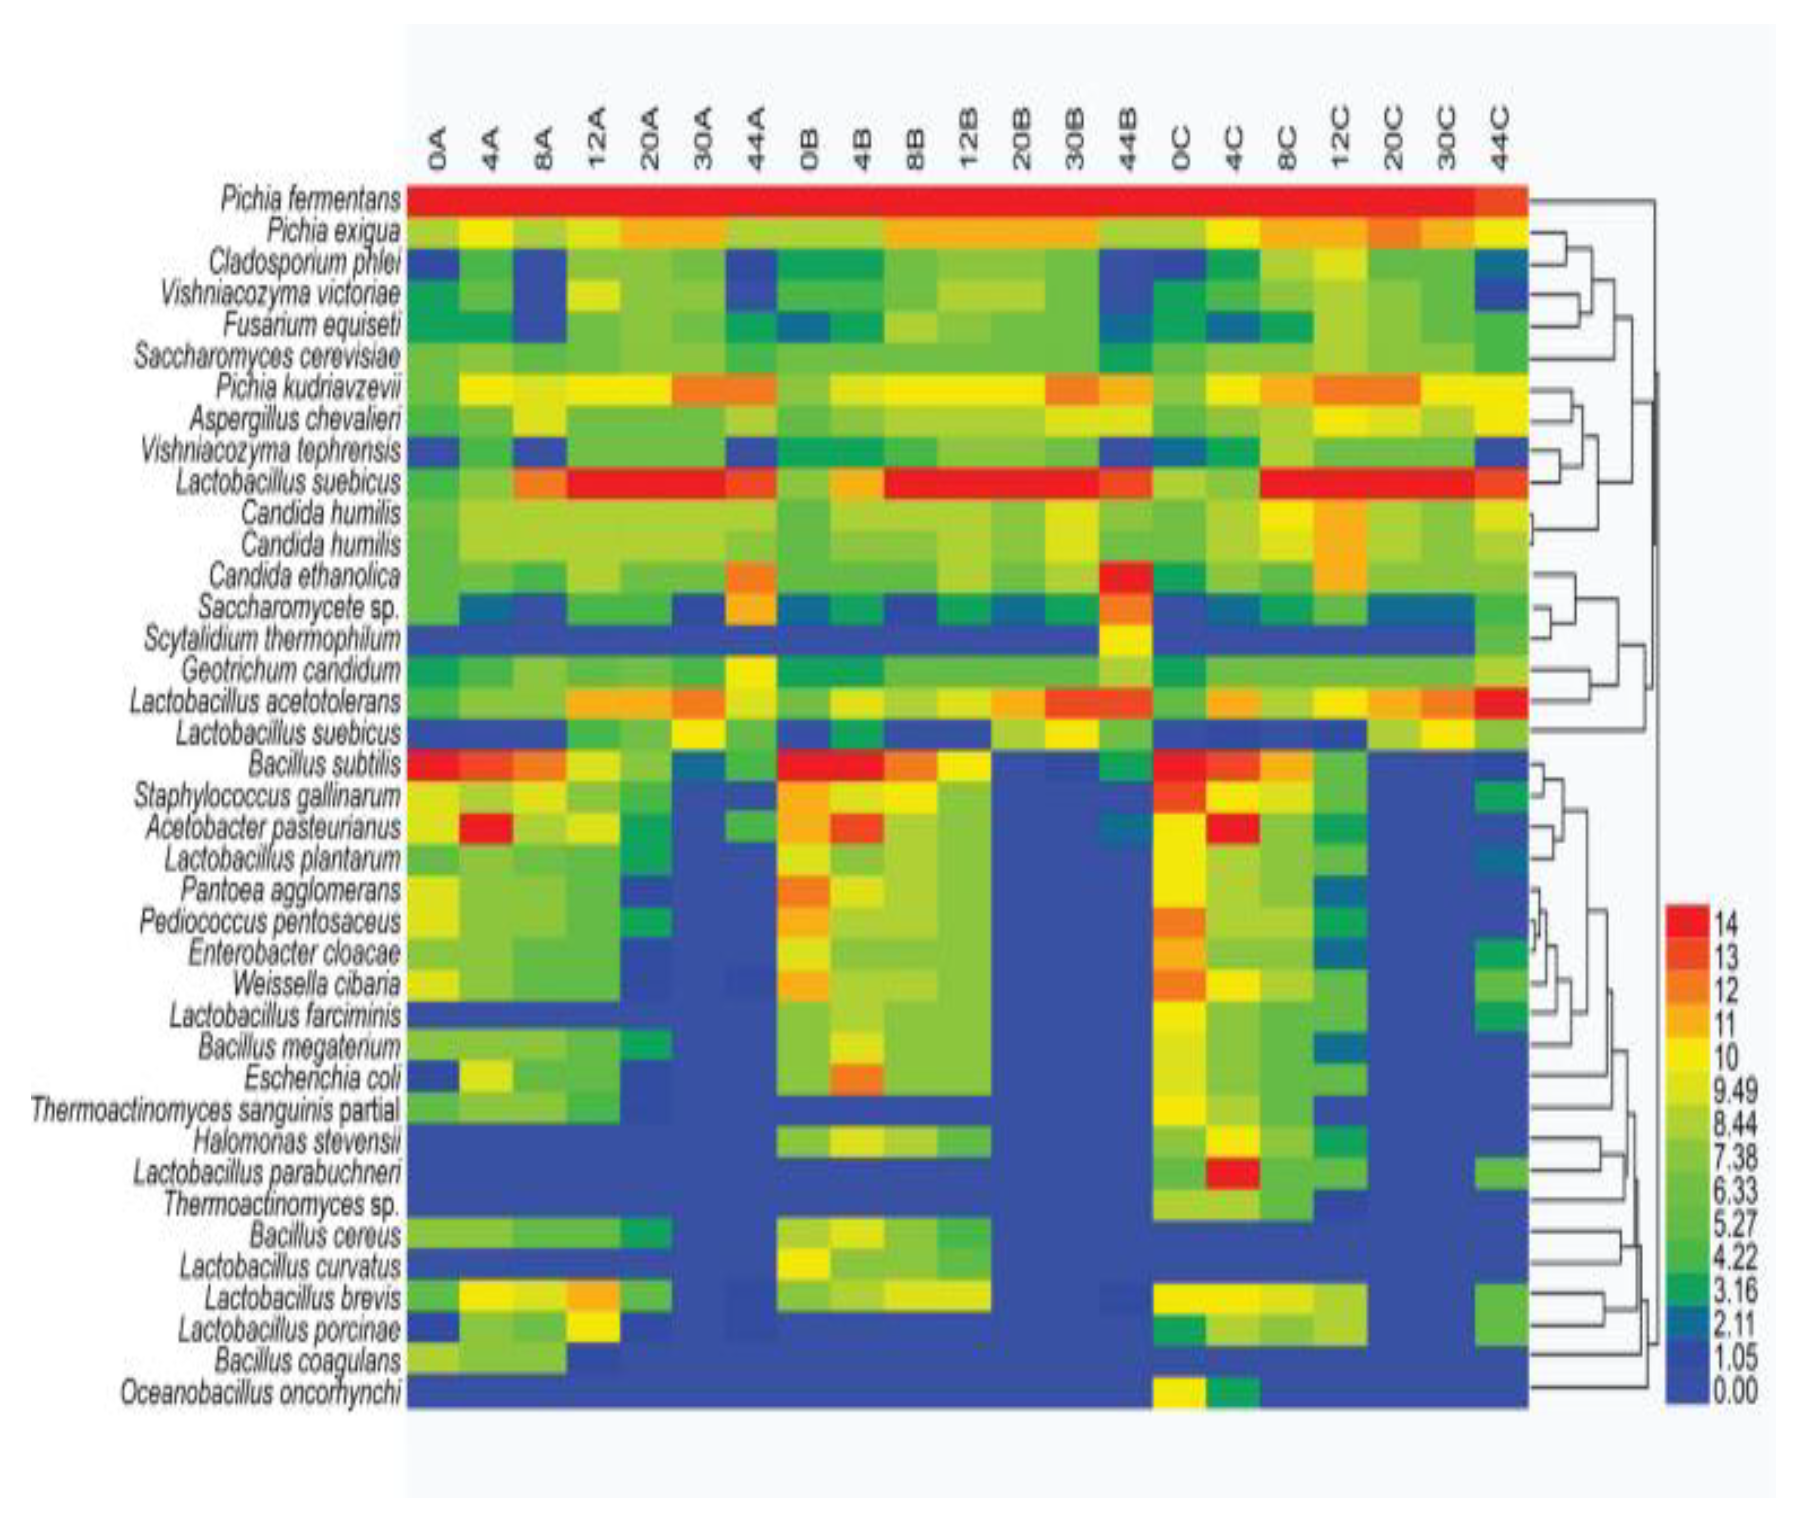
Figure 6.
A (left) shows that the strains that correlated highly with glucoamylase activity in the upper layer were X2 (Bacillus subtilis/tequilensis), X10 (Weissella cibaria/confuse), X8 (Pantoea agglomerans), X6 (Staphylococcus gallinarum), and X11 (Pediococcus pentosaceus) and the liquefying enzyme-related strains X4, X12 (Escherichia coli), and X13. The strains that correlated with glucoamylase activity in the middle layer (Figure 6B) were X8, X2, X10, X6, and X4, while the liquefying enzyme-related strains were X13 and X20. The strains that correlated with glucoamylase activity (Figure 6C) in the lower layer were X8, X2, X10, and X12, whereas the liquefying enzyme-related strains were X30, X28, and X20. The common strains that were highly correlated with glucoamylase activity were Bacillus and Weiss, whereas those related to liquefying enzymes were Bacillus and Candida.
Disclaimer/Publisher’s Note: The statements, opinions and data contained in all publications are solely those of the individual author(s) and contributor(s) and not of MDPI and/or the editor(s). MDPI and/or the editor(s) disclaim responsibility for any injury to people or property resulting from any ideas, methods, instructions or products referred to in the content. |
© 2025 by the authors. Licensee MDPI, Basel, Switzerland. This article is an open access article distributed under the terms and conditions of the Creative Commons Attribution (CC BY) license (http://creativecommons.org/licenses/by/4.0/).
Copyright: This open access article is published under a Creative Commons CC BY 4.0 license, which permit the free download, distribution, and reuse, provided that the author and preprint are cited in any reuse.


