
Submitted:
14 July 2025
Posted:
15 July 2025
You are already at the latest version
Abstract
Cloud seeding is a targeted weather modification strategy aimed at enhancing precipitation, particularly in regions facing water scarcity. This study evaluates the impacts of wintertime cloud seeding events in the western United States, focusing on three key regions: the Lake Tahoe Area, the Santa Rosa Range, and the Ruby Mountains, using an integrated remote sensing approach. Ground-based AgI generators were deployed to initiate seeding, and the atmospheric responses were assessed using multispectral observations from the Advanced Baseline Imager (ABI) aboard the GOES-R series satellites and regional radar reflectivity mosaics derived from NEXRAD data. Satellite-derived cloud microphysical properties, including cloud-top brightness temperatures, optical thickness, and phase indicators, were analyzed in conjunction with radar reflectivity to evaluate microphysical changes associated with seeding. The analysis revealed significant regional variability: Tahoe events consistently exhibited strong seeding signatures, such as droplet-to-ice phase transitions, cloud-top cooling, and thickened cloud structures, often followed by increased radar reflectivity. These outcomes were linked to favorable atmospheric conditions, including colder temperatures, elevated mid-to-upper tropospheric moisture, and sufficient supercooled liquid water. In contrast, events in the Santa Rosa Range generally showed weaker responses due to warmer, drier conditions and limited cloud development, while the Ruby Mountains presented mixed outcomes. A key contribution of this study is the development of a reproducible satellite–radar integration framework that improves the detection and interpretation of cloud seeding impacts. This combined approach allows for a more comprehensive assessment of seeding outcomes, capturing the progression from initial cloud-phase transitions to potential hydrometeor development. The results highlight the importance of aligning seeding strategies with local atmospheric conditions and demonstrate the practical value of satellite-based tools for evaluating seeding effectiveness, particularly in data-sparse regions. Overall, this work contributes to advancing both the scientific insight and operational practices of weather modification through remote sensing.
Keywords:
remote sensing
; weather modification
; radar reflectivity
; cloud seeding
; GOES-R satellite
; cloud microphysics
1. Introduction
Cloud seeding is a weather modification technique designed to enhance precipitation by introducing aerosols such as silver iodide (AgI) into clouds [1,2,3,4]. These aerosols serve as nuclei around which water droplets can form, or initiate ice nucleation, facilitating the coalescence process and increasing the likelihood of precipitation. AgI is widely used due to its crystal structure, which closely resembles that of ice, promoting ice formation in supercooled clouds. Cloud seeding is often applied in regions experiencing drought conditions or to enhance snowfall in mountainous areas [3,5]. While its effectiveness depends on various factors, including cloud type and environmental conditions, cloud seeding has been utilized as a tool to manage water resources and mitigate the impacts of drought [6,7]. Despite ongoing debates about its efficacy in natural variability, operational programs continue to expand with support from both governmental and regional stakeholders.
Cloud-seeding methodologies are commonly classified as glaciogenic or hygroscopic [8]. Glaciogenic seeding introduces efficient ice-nucleating particles, most often AgI or, in some programs, calcium chloride, into mixed-phase clouds to stimulate the Bergeron–Findeisen process, enlarge ice crystals and hasten their descent as snow or rain [9,10]. Hygroscopic seeding, by contrast, releases micron-scale salt aerosols into warm convective clouds, broadening the droplet spectrum, intensifying collision–coalescence, and ultimately increasing rainfall at the surface [11]. Current operations integrate high-resolution numerical weather prediction, radar nowcasting, and in-situ cloud-physics measurements to optimize launch timing from aircraft, ground generators, rockets, or autonomous uncrewed aerial platforms [12,13]. This systems-based approach underscores the interdisciplinary character of modern weather-modification research and provides the physical baseline against which remote sensing-based evaluations of post-seeding cloud responses can be interpreted.
At present, more than forty sustained programs employ cloud seeding for diverse objectives that include winter orographic snow-pack enhancement in the western United States, warm-cloud rainfall augmentation across the Arabian Peninsula and Southeast Asia, hail-suppression initiatives in parts of Europe and Canada, and fog-dispersion at major transportation hubs [14,15,16]. Cost–benefit assessments suggest favorable economic returns when precipitation increases are integrated over reservoir inflows or reduced hail damage to agriculture and infrastructure [17]. Long-term environmental monitoring further shows that background concentrations of AgI or other seeding agents remain several orders of magnitude below established ecotoxicological thresholds, though continued surveillance is recommended as operational scales expand [18]. These cumulative operational findings furnish critical context for evaluating seeding outcomes through satellite observations and help frame the practical value of refining detection algorithms for seeding-induced cloud and precipitation modifications. As global water demands increase and climate variability intensifies, scalable and verifiable enhancement strategies are gaining renewed attention.
Understanding the atmospheric processes that influence cloud formation and precipitation is critical for improving weather modification techniques such as cloud seeding [3]. As global climate patterns shift and water scarcity issues intensify, the need for reliable and efficient cloud seeding methods has become more pressing [19]. Ensuring access to clean and dependable water resources also demands integrated environmental monitoring and modeling strategies [20,21,22]. There have been many studies focusing on the environmental impacts of human interventions and climate-related changes [23,24,25]. Satellite remote sensing provides a powerful approach for monitoring cloud seeding activities and assessing their impacts on cloud microphysics, precipitation, and aerosol-cloud interactions, enhancing our understanding through advanced retrieval methodologies [13,26,27,28,29]. Moreover, the integration of geostationary satellite data with ground-based and airborne observations is helping to identify microphysical signatures of seeded clouds in near real time, contributing to improved targeting and post-event validation.
1.1. Remote Sensing in Cloud Seeding
1.1.1. Satellite Observations and Technological Developments
The first satellite-based observation of glaciogenic cloud-seeding signatures was recorded in 2005, when the Advanced Very High-Resolution Radiometer (AVHRR)[30] satellite imagery captured a distinct cloud track resulting from the seeding of a thick supercooled cloud layer over central China, with cloud microphysical property retrievals revealing glaciation and cloud-top sinking, which were further validated by simulations of seeding material dispersion [31]. Yu et al. (2005) utilized NOAA-14 satellite imagery alongside numerical modeling to validate the effects of cloud seeding over Shaanxi, China, where a distinct cloud formation appeared shortly after seeding and corresponded with the dispersion of silver iodide; their simulations closely aligned with the satellite observations, confirming the seeding’s impact on cloud development and duration [32]. Wang et al. (2021) [33] used the Moderate Resolution Imaging Spectroradiometer (MODIS) [34] and FengYun-3C [35] polar-orbiting meteorological satellite, CINRAD/CB radar (C-band component of the China New Generation Doppler Weather Radar) [36], and PARSIVEL disdrometer (Particle Size Velocity) [37,38] data to track AgI cloud seeding in central China. Satellite imagery captured a glaciated seeding track shortly after treatment, confirming ice formation and cloud-top collapse, and subsequent radar and disdrometer measurements validated the track’s expansion and increased precipitation, thereby supporting the effectiveness of cloud seeding. Utilizing MODIS-derived cloud characteristics, Morrison et al. (2013) identified areas with supercooled liquid water, which are considered optimal targets for glaciogenic cloud seeding [39]. Observations from the Himawari-8 satellite [40], a geostationary satellite operated by Japan, confirmed these effects by detecting a rise in cloud brightness temperature after seeding, attributed to ice particle fallout and the subsequent collapse of the cloud top within the seeding track. These studies highlight the role of satellite remote sensing in monitoring and evaluating cloud seeding impacts, providing valuable insights for weather modification research.
1.1.2. Advancements in Geostationary Satellite Capabilities
The Geostationary Operational Environmental Satellites (GOES) [41] have played a key role in advancing meteorological observations and forecasts since their deployment. These satellites provide continuous, high-temporal-resolution monitoring of atmospheric conditions, including cloud development, convection, cloud-top properties essential for weather analysis, and cloud seeding assessments. The GOES-R series introduced significant technological advancements, enhancing data quality and expanding application capabilities for atmospheric monitoring [42]. These improvements in spatial, temporal, and spectral resolution, along with enhanced radiometric accuracy, have particularly benefited cloud microphysics studies and atmospheric analyses relevant to cloud seeding. The ABI serves as the primary imaging device on NOAA’s GOES-R Series satellites, capturing data on various surface and atmospheric features such as clouds, moisture levels, and smoke [43,44,45]. The ABI enhances the monitoring of these features with improved spectral bands, enabling more precise observations of atmospheric conditions and surface changes. This capability is particularly valuable for tracking weather events, wildfire activity, and cloud characteristics relevant to cloud seeding applications [46]. ABI operates with 16 spectral bands, comprising two visible, four near-infrared (NIR), and ten infrared (IR) channels [44,47,48,49,50]. Furthermore, ABI’s data assimilation into numerical weather prediction models has led to improved forecast accuracy. The comprehensive observations of atmospheric parameters enhance model initialization, resulting in better predictions of weather patterns and climate phenomena [51].
This paper aims to investigate the application of satellite remote sensing to gain deeper insight into the impacts of cloud seeding. Real-time monitoring of cloud properties offers valuable insights into the dynamics of cloud seeding, allowing for more accurate assessments and improved weather modification strategies. We hypothesize that spectral analysis from satellite remote sensing can detect seeding-induced changes, thereby refining current methodologies and enhancing effective cloud seeding operations. In this study, we compare different GOES satellite bands across various cloud seeding events to identify key post-seeding atmospheric and cloud features. By analyzing spectral signatures and cloud microphysical properties, we aim to develop methodologies for detecting seeding-induced modifications using satellite observations. Section 2 outlines the methodology, including satellite bands and their characteristics. Section 3 presents case studies of cloud seeding events. Section 4 discusses the implications of these findings for improving cloud seeding assessments, followed by conclusions and future research directions in Section 5.
2. Data and Methodology
2.1. Case Study: Wintertime Cloud Seeding in Targeted Western U.S. Regions
Wintertime cloud seeding programs in the western United States have been ongoing since the early 1960s, with initial studies focused on the Lake Tahoe region [52,53]. These operations typically utilize ground-based generators that burn an AgI solution, a method in use since the 1980s. Estimates of seasonal seeding effectiveness indicate snowfall increases ranging from 4% to 10% have been achieved [52]. Through science-based techniques, these programs aim to enhance snowpack and increase runoff in mountainous areas. These efforts are aimed to enhance precipitation formation efficiency during winter storms, while maintaining environmentally responsible practices that support sustainable water resources for both ecosystems and communities.
The weather sensors installed at ground-based cloud seeding generators include instruments capable of measuring meteorological conditions at high temporal resolution for operational monitoring. Wind speed and direction are measured using anemometers, which provide a wind speed resolution of approximately 0.098 m/s per Hz of pulse output and a directional resolution of 0.5°, with accuracies of ±0.3 m/s and ±3°, respectively. Temperature and relative humidity sensors offer resolutions of 0.1 °C and 0.1 % RH, with accuracies of ±0.6 °C and ±3 % RH. Precipitation is recorded using all-weather weighing gauges, which detect incremental changes as small as 0.05–0.1 mm depending on capacity and sensor configuration. Meteorological parameters are typically logged at 15-minute intervals, although the system supports sub-minute sampling depending on deployment settings.
Cloud seeding operations examined in this study focus on key areas, such as the Lake Tahoe Basin, the Ruby Mountains, and the Santa Rosa Range in Nevada (Figure 1). Seeding operations in the Ruby Mountains were conducted on January 2, 3, and 13, 2024. In the Santa Rosa Range, key seeding dates included January 2, 3, and 13, 2024, as well as March 1, 2024. The Lake Tahoe Basin experienced observed seeding events on February 1 and 20, 2024, November 11, 2024, and February 16, 2025. Ground-based generators are strategically installed at elevations ranging from 1,500 to 2,900 meters in Tahoe, 1,829 to 2,010 meters in the Rubies, and 1,460 to 1,493 meters in Santa Rosa. These placements facilitate the effective dispersal of seeding materials into cloud systems to stimulate snowfall over key watersheds. Operations are primarily carried out during winter months, from November through May, and are implemented in collaboration with local, and federal partners.
To evaluate the effects of cloud seeding operations, satellite remote sensing data were analyzed to monitor cloud properties and atmospheric changes. While remote sensing analyses were conducted across all three regions, Tahoe, the Ruby Mountains, and the Santa Rosa Range, only the Tahoe-area cases are presented in the main text to illustrate representative outcomes. The satellite imagery for each region covered the following spatial domains: Tahoe (38.27°–39.37° N, 119.15°–120.59° W), Santa Rosa Range (41.19°–41.59° N, 117.03°–118.04° W), and Ruby Mountains (40.05°–41.09° N, 114.37°–115.49° W). The corresponding satellite imagery and analysis for the Ruby and Santa Rosa regions are provided in the Supplementary Material for completeness. The following section describes the satellite instruments and imagery used for this analysis.
2.2. Advanced Baseline Imager of GOES-R Series
To investigate cloud seeding case studies, the ABI GOES-R series observations were utilized due to several key advantages [54]. GOES-R offers high temporal resolution, enabling frequent imaging and continuous tracking of cloud dynamics [55]; its geostationary orbit allows continuous observation of a fixed region, facilitating the observation of localized cloud modifications resulting from seeding activities [56]; and its broad multispectral capability is essential for distinguishing cloud phases and detecting snow and ice [44]. The geostationary positioning ensures the availability of near real-time data, which are critical for assessing the temporal evolution of cloud systems and cloud seeding impacts [31].
The ABI sensor on GOES-R series satellites, including GOES-16, GOES-17, and GOES-19, provides 16 multispectral bands with advanced imaging capabilities for weather, ocean, and environmental monitoring [47,51]. It covers the Western Hemisphere with temporal resolutions from 30 seconds to 15 minutes and spatial resolutions of 0.5 km for visible band, 1 km for the NIR, and 2 km for the IR bands [45,51]. ABI operates in two scan modes: Full-Disk Mode, capturing a full-disk image every 5 minutes, and Flex Mode, which scans the full disk every 10 minutes, Continental U.S. (CONUS) every 5 minutes, and two mesoscale sectors every minute [57]. Prior to April 2019, Flex Mode produced a full-disk image every 15 minutes. Prior to April 2019, the Full-Disk scan interval was 15 minutes.
Among these, the visible bands, particularly Band 2 (0.64 µm), provide high spatial resolution (0.5 km), enabling detailed observation of cloud and surface boundaries. NIR bands are crucial for snow/ice detection, and cloud phase discrimination, as they distinguish reflectance differences between ice, snow, and liquid water clouds [44,58]. IR bands are essential for assessing cloud-top temperature, identifying convective development, and retrieving atmospheric temperature and humidity profiles, supporting applications in weather forecasting, climate monitoring, and cloud-seeding assessments [59,60]. Table 1 provides a summary of the ABI’s 16 spectral bands used in this research, including their central wavelengths and highest spatial resolutions.
With its broad spectral coverage and fine spatiotemporal resolution, ABI is a powerful tool for monitoring cloud microphysical and thermodynamic properties. In this study, we utilized ABI imagery to analyze cloud seeding events, leveraging the specific spectral bands optimized for cloud analysis. This approach supports improved understanding of seeding-induced changes to cloud dynamics and precipitation processes. To facilitate targeted analysis, the following section provides an overview of key ABI channels, highlighting their distinct observational capabilities and importance in atmospheric monitoring.
- a)
- Band 2 (0.64 µm) – Red Visible Band
The ABI Band 2, known as the “Red Visible Band,” operates at 0.64 µm with the highest spatial resolution (0.5 km) [61,62]. This fine resolution is particularly effective for identifying localized meteorological and surface features, such as fog boundaries and cumulus clouds [51]. This band plays an essential role in daytime cloud analysis, capturing reflected visible solar radiation and distinguishing clouds from land surface [44,62]. It remains essential for monitoring atmospheric conditions and characterizing daytime clouds relevant to cloud seeding applications.
- b)
- Band 3 (0.86 µm) – Vegetation Band
The 0.86 µm is a NIR channel used during daytime that help to identify cloud boundaries and surface moisture conditions important for cloud formation and seeding. It enhances land-water contrast but requires adjustments for true-color imagery due to higher vegetation reflectance compared to the green band (0.51 µm) [44,51].
- c)
- Band 5 (1.61 µm) – Snow/Ice Band
ABI Band 5 (1.61 µm) with 1 km resolution, is essential for distinguishing cloud phase by differentiating water-based (bright) from ice-based (dark) clouds due to ice absorption [44]. It effectively identifies snow and ice, which appear dark in this band compared to the 0.86 µm band, aiding in monitoring surface and cloud conditions important for cloud seeding. Although cloud cover and motion can affect observations, Band 5 remains essential for daytime and nighttime environmental monitoring [48,51].
- d)
- Band 8 (6.2 µm) – Upper-Level Water Vapor Band
The 6.2 µm band detects moisture in the upper troposphere (250–500 hPa, ~5.5–10.3 km) [51,63], helping identify atmospheric features such as jet streams, troughs, and ridges that influence storm development. It tracks air movement in cloud-free areas, detects dry air intrusions, and provides information on upper-level moisture and vertical air motion. These capabilities support evaluating cloud seeding effectiveness. However, its ability to observe lower atmospheric moisture is limited in areas with dense cloud cover [51].
- e)
- Band 9 (6.9 µm) – Mid-Level Water Vapor Band
The 6.9 µm band monitors moisture and atmospheric motion in the mid-troposphere, important for understanding cloud formation stability [64]. It helps evaluate conditions relevant to cloud seeding by monitoring mid-level moisture and atmospheric dynamics. Its effectiveness is reduced in areas with dense cloud cover, limiting detection of lower-level moisture [51,65,66].
- f)
- Band 10 (7.3 µm) – Lower-Level Water Vapor Band
The 7.3 µm band monitors moisture and wind patterns in the lower troposphere (500–750 hPa), providing key information on low-level humidity and wind dynamics essential for cloud seeding. It offers clearer insights into lower atmospheric moisture compared to mid- and upper-level water vapor bands. However, thick clouds can limit their observations [51,64,65].
- g)
- Band 13 (10.3 µm) – Clean Infrared Window Band
ABI Band 13 is less affected by water vapor absorption, making it effective for detecting atmospheric features and cloud properties. It measures cloud-top brightness temperatures (BTs), which aids in cloud phase identification, as colder clouds at high altitudes typically contain ice. Its applications include continuous cloud classification, including nighttime observations, and help estimate of cloud-top temperature and particle size [64]. However, BTs may not always correspond precisely to surface or near-surface air temperatures due to atmospheric absorption effects.
- h)
- Band 14 (11.2 µm) – Infrared Longwave Window Band
The 11.2 µm Infrared Longwave Window Band is useful for atmospheric and surface observations. Although classified as a window channel, it experiences some water vapor absorption, leading to slightly cooler BTs compared to the clean window channel (10.3 µm) [51]. This band contributes to cloud detection and precipitable water estimation, which are relevant for assessing atmospheric conditions in cloud seeding [64].
- i)
- Band 15 (12.3 µm) – Dirty Window Band
The 12.3 µm Dirty Window Band is an IR channel sensitive to atmospheric moisture and aerosols with more water vapor absorption than the Clean Window Band, resulting in slightly lower observed BTs, particularly in humid regions. Due to its sensitivity to both moisture and airborne particles, 12.3 µm band is effective in identifying dust plumes and other atmospheric aerosols. When combined with 10.3 µm channel, this band helps differentiate silicate-based particles, such as desert dust and volcanic ash, from cloud water and ice [64]. However, due to its interaction with atmospheric moisture, it is less effective for direct surface observations compared to other longwave infrared window channels.
2.3. Cloud Microphysical and Atmospheric Properties
- a)
- Cloud particle size
The 0.86 µm and 1.6 µm bands are commonly used to analyze cloud properties relevant to cloud seeding [43,67]. The 0.86 µm band, sensitive to surface reflectance and cloud cover but provides limited microphysical detail. In contrast, the 1.6 µm band detects differences in cloud particle size and phase, which is valuable for identifying ice formation triggered by seeding agents, as ice particles absorb strongly at this wavelength [68,69]. This enables evaluation of microphysical processes and potential snowfall enhancement [67,69].
- b)
- Cloud phase
Cloud phase can be inferred using BT and reflectivity differences between the 1.61 µm and 10.3 µm bands [70]. The 1.61 µm band highlights reflectance variations: brighter areas indicate liquid water clouds, while darker areas suggest ice clouds [71]. The 10.3 µm band provides cloud-top temperature, where colder temperatures correspond to higher-altitude ice clouds [70,72]. Post-seeding analysis using these bands helps identify ice formation, indicating successful nucleation [70]. Mixed-phase clouds, containing both supercooled liquid water and ice, are ideal targets, as they respond well to seeding [73,74,75]. Seeding agents such as AgI act as ice-nucleating particles, enhancing precipitation through processes such the Wegener-Bergeron-Findeisen mechanism and riming [74,76,77].
- c)
- Cloud top temperature
Cloud top temperature is derived from BTs using the 10.3 µm and 11.2 µm bands. In deep convective clouds, BTs at 10.3 µm closely reflect actual cloud-top temperatures due to minimal water vapor interference [51,78,79]. The 11.2 µm band, though also a window channel, experience more absorption from atmospheric moisture, resulting in cooler BTs in clear sky conditions [43,80]. These bands are useful for distinguishing cloud structure and seeding impacts.
- d)
- Cloud optical depth and thickness
Cloud optical depth is estimated using visible and IR channels. The 0.64 µm band measures cloud reflectance, where higher reflectivity signals optically thicker clouds [81]. The 0.86 µm band captures reflectance variations associated with cloud particle density and improves contrasts between clouds and land surface features [82]. The 10.3 µm band complements this with BT data, where colder values indicate thicker and more developed clouds [83,84].
- e)
- Ice and liquid water path
To evaluate the ice and liquid water path, GOES ABI bands differentiate between cloud phases [51,79]. The 1.6 µm band detects ice formation, as ice absorbs more light than liquid water [80]. Brightened regions in this band over seeded areas indicate ice development, especially when supported by colder BTs from the 10.3 µm [78]. Daytime analysis may include the 0.64 µm band to optical thickness, while nighttime assessments observations use 10.3 and 12.3 µm band comparisons to infer ice-phase formation [79].
- f)
- Water vapor content
Atmospheric moisture is evaluated using the GOES ABI water vapor bands, which probe different vertical layers [51,78]. The 6.2 µm wavelength captures upper-level moisture, 6.9 µm monitors mid-level moisture, and 7.3 µm focused on lower-level moisture [43,79,80]. Comparing moisture distribution across these bands reveals atmospheric stability and conditions favor or suppress cloud development. Combining this with IR BT data (e.g., 10.3 µm) further supports the understanding of how cloud seeding effects on moisture transport and cloud microphysics.
- g)
- Precipitation potential
Precipitation potential is evaluated through cloud-top temperature and phases analysis using IR bands [47,51]. The 11.2 µm band detects cold, thick clouds likely to produce precipitation, while the 12.3 µm band helps distinguish non-precipitating clouds. A reduction in BT difference between these bands can indicate ice-phase development post-seeding, suggesting enhanced precipitation potential [85].
2.4. Radar Reflectivity
Radar reflectivity provides a quantitative measure of the energy reflected back to the radar from hydrometeors such as raindrops, snowflakes, or ice particles, and is typically expressed in decibels of reflectivity (dBZ). The National Radar Reflectivity Mosaic [86] integrates data from multiple ground-based weather radars, primarily from the NEXRAD (Next-Generation Radar) network, into a unified map, displaying the spatial distribution and intensity of precipitation over a large region [87]. The radar data used in these mosaics represent near real-time 24-hour coverage and are updated every 5 minutes, providing high temporal resolution necessary for detailed tracking of atmospheric processes [86]. In this study, the mosaic reflectivity data specifically cover the Lake Tahoe region, spanning approximately 38.89° to 39.27° N latitude and −120.39° to −119.86° W longitude.
These mosaics are particularly valuable for capturing the evolution of meso-scale convective systems and are widely used in cloud seeding studies to monitor seeded clouds and assess potential enhancements in precipitation attribute to seeding activity. Reflectivity mosaics support the comparison of precipitation pattern between target and control regions, track the movement of seeded clouds, and analyze the development of precipitation over time [88]. In this context, reflectivity data serve as a critical observational tool for post-event evaluations of seeding effectiveness [89].
3. Results and Discussion
3.1. Meteorological Criteria for Effective Cloud Seeding
Table 2 summarizes the meteorological conditions recorded at the initiation of cloud seeding operations, as measured by the weather stations installed on the seeding generators across three key locations: the Ruby Mountains, the Santa Rosa Range, and the Tahoe area. Across all three sites, the data shows a consistent pattern of below- or near-freezing temperatures and moderate to high Relative Humidity (RH), both of which are essential for effective glaciogenic seeding. Such atmospheric conditions promote the growth of ice crystals following the introduction of seeding agents, particularly in supercooled liquid cloud environments. At Ruby Mountain, air temperatures during seeding operations ranged from -1°C to 0°C, with RH values fluctuating between 56% and 94%. The wind direction varied considerably, spanning from 190° to 268°, while wind speeds remained relatively low, with gusts reaching a maximum of 18 mph. While sufficient for seeding initiation, the relatively week wind speeds may limit the dispersion and vertical lofting of seeding aerosols. In the Santa Rosa Range, seeding events occurred under air temperatures ranging from -2°C to 4°C, and RH values between 57% and 88%. Wind direction varied more consistently from 195° to 337°, and gusts peaked at 16 mph. The more stable wind direction at this site, compared to the Ruby Mountains, may have supported more efficient transport of seeding aerosols into the target region, enhancing the probability of cloud-aerosol interaction and subsequent precipitation formation.
Seeding operations in the Tahoe region, where characterized by the coldest observed temperatures, with values dropping to -6°C, and the highest RH values, which consistently remained at 96%. Wind direction was stable at 195°, while wind speeds ranged from 10 to 14 mph. These conditions represent an optimal environment for cold cloud seeding, with sustained high humidity and subfreezing temperatures facilitating effective nucleation and ice crystal growth. The consistent wind field likely aided in the efficient advection of seeded material into cloud updrafts.
Collectively, these site-specific observations provide important baseline information for identifying meteorological conditions that are favorable for effective cloud seeding operations. Such analyses are required for determining optimal timing and location for seeding, as they help ensure that the physical environment supports cloud microphysical processes necessary for precipitation enhancement. Furthermore, consistent characterization of pre-seeding conditions across different sites contributes to the reproducibility and reliability of seeding programs, informing both operational strategies and future experimental designs.
These observed meteorological conditions are generally consistent with established criteria for effective cloud seeding in mountainous regions. Previous studies and operational guidelines suggest that optimal seeding conditions typically include temperatures near or below freezing (approximately -2°C to 0°C), RH above 50%, and moderate, steady winds to facilitate the transport and dispersion of seeding agents within target cloud formations [1,90,91]. The recorded temperature ranges and RH values across the Ruby Mountains, Santa Rosa Range, and Tahoe area fall within these favorable parameters, supporting the potential effectiveness of seeding operations conducted during this period. Additionally, the relatively stable wind directions at Santa Rosa and Tahoe locations indicate conducive atmospheric flow patterns, which are important for the efficient delivery of seeding materials.
3.2. Site-Specific Variability in Atmospheric Conditions During Cloud Seeding
As a complement to the event-based meteorological summaries presented in the previous section, this section provides a statistical overview of the distributions of air temperature, wind speed and direction, and RH across the 288 seeding events conducted in 2024 (Figure 2). The 288 cloud seeding events were distributed across three locations: Tahoe (165 events), the Ruby Mountains (69 events), and Santa Rosa Range (54 events). Box-and-whisker plots are used to illustrate the variability and central tendencies of each parameter across the three locations. Each colored box plot represents the interquartile range (IQR) with the box spanning from the 25th percentile (Q1) to the 75th percentile (Q3), and the median (50th percentile) shown as the central line. Whiskers extend to the minimum and maximum values within 1.5 times the IQR, excluding statistical outliers, while a mean value is denoted by an “X” marker. This visualization facilitates a comparison of the central tendency and spread of meteorological variables across different seeding regions, highlighting site-specific variability that may influence cloud seeding operations.
Figure 2a shows the air temperature distributions. Tahoe exhibits the lowest overall temperatures, with a median near -2°C and whiskers extending from -10°C to 7°C. In contrast, Santa Rosa has a median around 0°C and the broadest range, spanning from -8°C to 11°C. Ruby’s temperatures center slightly below 0°C, with whiskers from -8°C to 8°C, indicating moderate variability. These distributions reinforce the earlier observation that Tahoe is generally colder than the other two sites, while Santa Rosa experiences the widest temperature fluctuations.
Figure 2b illustrates the distribution of RH. Tahoe generally experiences higher and more stable RH levels, with the box centered around 86–97%, whereas Santa Rosa and Ruby exhibit wider spreads, extending down to approximately 21% and 27%, respectively. This suggests that although all three locations occasionally reach high, R.H.; only Tahoe consistently maintain RH levels near saturation – conditions particularly favorable for hydroscopic could seeding techniques.
Wind direction (Figure 2c) shows substantial variability at all sites, with Santa Rosa displaying the broadest directional spread, whereas Tahoe wind direction appears somewhat more concentrated, indicating potentially steadier airflow patterns that may support more predictable plume transport.
Figure 2d presents wind speed distributions. Tahoe exhibits slightly higher median wind speeds and a wider range than the other locations. This observation aligns with the notion that stronger or more variable winds at Tahoe may enhance seeding material dispersal but also pose challenges for targeting.
Figure 2e reveals notable differences in wind gusts. Tahoe recorded the highest gust values - approaching 58 mph - and exhibits the greatest gust variability. Santa Rosa and Ruby remain within more moderate gust ranges (up to about 13–15 mph), suggesting relatively more stable condition that may favor controlled seeding dispersion.
Taken together, these plots highlight additional insight into the local microclimate characteristics at each site. Tahoe tends to be colder and more humid, with stronger winds, and greater gust variability. Santa Rosa and Ruby while exhibiting greater variability in humidity and wind direction, generally experience milder wind speeds and gusts. These spatial differences highlight the importance of tailoring cloud seeding strategies to site-specific atmospheric dynamics, as variations in temperature, humidity, wind speed, and direction can significantly influence the dispersion, activation, and effectiveness of seeding agents.
3.3. Satellite–Radar Analysis of Tahoe Region Cloud Seeding Events
In this section, we present detailed analyses of cloud seeding events over the Tahoe region using satellite remote sensing and ground-based radar observations to evaluate cloud microphysical changes and precipitation responses. These cases serve as representative examples of the broader study. Although the satellite and radar analyses in the main text focus on Tahoe-area cases to highlight typical seeding-related signatures, all cloud seeding events, spanning Tahoe, the Ruby Mountains, and Santa Rosa Range, were analyzed using a consistent method to ensure a regional comparability. Results from the Ruby and Santa Rosa events are detailed in the Supplementary Material. The GOES satellite imagery used in this analysis was sourced from the NOAA/NESDIS Center for Satellite Applications and Research [92], and the radar images were obtained from the NOAA National Centers for Environmental Information’s Radar Viewer [86].
3.3.1. Seeding Event 1: 11 November 2024
- a)
- Satellite Remote Sensing Analysis
The analysis of GOES ABI satellite imagery across multiple spectral bands provided key insights into cloud microphysics properties and precipitation potential influenced by cloud seeding. Figure 3 presents different ABI channels at 20:00 UTC during the seeding event over the Tahoe region. Cloud particle size characterization utilized the 0.86 µm (NIR) and 1.6 µm (Shortwave IR) bands, which have differential sensitivities to liquid and ice phases.
In 0.86 µm band, clouds appear bright due to strong reflectance from cloud droplets, making this band particularly effective for detecting water clouds. Conversely, 1.61 µm band is more sensitive to ice particles, as ice strongly absorbs radiation at this wavelength, causing ice clouds to appear darker relative to liquid clouds. The comparative analysis between these two bands reveals regions where bright reflectance in 0.86 µm corresponds to darker in 1.61 µm, suggesting localized ice particle formation likely induced by seeding, consistent with effective ice nucleation.
Cloud phase determination using combined 1.61 µm and 10.3 µm bands confirmed the presence of ice-phase clouds in the seeded region. A moderately dark region in the 1.61 µm band that simultaneously appears colder in the 10.3 µm band likely indicates a mixed-phase cloud (a combination of supercooled liquid water and ice) or fully glaciated clouds at higher altitudes.
The intermediate darkness in the 1.61 µm band, reflects partial glaciation, where some reflectance remains, while the colder temperature in the 10.3 µm band imply high-altitude cloud tops. In the context of cloud seeding, bright reflectance in the 1.61 µm band that transitions to darker tones while remaining cold in the 10.3 µm band is indicative of favorable conditions for ice nucleation. Distinguishing mixed phase from fully glaciated clouds using the GOES ABI channels enhances the ability to monitor seeding impacts and improve numerical weather prediction models.
Further evaluation of cloud top temperature using the 10.3 µm band, and the longwave IR Window channel (11.2 µm) revealed extensive cold cloud tops in the seeded areas. The 10.3 µm band, less affected by atmospheric water vapor absorption, provides a more accurate representation of cloud-top temperatures, while the 11.2 µm band shows slightly increased sensitivity to atmospheric moisture. The observed dark blue to light blue shading in both bands indicates high-altitude, glaciated clouds likely undergoing ice-phase precipitation development. The evaluation of water vapor content using the 6.2 µm, 6.9 µm, and 7.3 µm bands revealed a well-saturated upper and mid-level atmosphere, favorable for cloud development. Bright blue and white areas in the 6.2 µm, 6.9 µm bands show enhanced moisture upstream and over the like region, while the yellow shading in the 7.3 µm band indicates drier air intrusion from the east. Nonetheless, the seeded mountain regions exhibit well-saturated low-level moisture condition, consistent with environments conductive to precipitation formation. Precipitation potential was further evaluated using BT differences between the 11.2 µm and 12.3 µm bands. These differences indicate cloud phase transitions from liquid to ice, with the spatial expansion of cold, thick clouds observed in the 11.2 µm band reinforcing the likelihood of precipitation following seeding.
This multi-spectral satellite analysis demonstrates how GOES ABI can capture cloud microphysical changes associated with seeding operations. The presence of colder cloud tops, increased cloud optical thickness, and favorable moisture profile support the hypothesis that seeding influenced cloud dynamics to enhance precipitation potential. While direct in situ precipitation measurements remain necessary to conclusively quantify seeding effectiveness, these remote sensing observations provide valuable indicators of cloud response and can guide optimization of future seeding strategies.
- b)
- Radar-Based Analysis
Figure 4 presents radar reflectivity associated with the same 11 November 2024 event, with the first frame taken at 19:00 UTC, approximately one hour prior to the satellite observations, and the subsequent frames captured at 20-minute intervals (20:00, 20:20, and 20:40 UTC) to depict the temporal evolution of precipitation. Reflectivity values, ranging from weak returns in blues (~10-20 dBZ) to stronger returns in green (>30 dBZ), illustrate dynamic changes in precipitation intensity and coverage.
As the event progresses, reflectivity patterns expand and intensify, suggesting cloud growth and enhanced hydrometeor development. High reflectivity exceeding 30 dBZ is especially concentrated west and southwest of each frame, indicative of widespread moderate to heavy precipitation, likely associated with ice-phase processes such as graupel or aggregated snowflakes.
The development and merging of precipitation cells, particularly observed downwind and southwest of Lake Tahoe, point to potential orographic and seeding-enhanced effects, where supercooled liquid water was likely converted to ice, increasing precipitation efficiency. These downwind developments emerge clearly between 20:20 and 20:40 UTC, aligning with satellite-based microphysical indicators of successful seeding.
While reflectivity alone does not confirm seeding efficacy, the observed spatial growth, intensification, and persistence of radar echoes in seeded regions provide indirect evidence of enhanced precipitation processes. Such variability across different time steps and regions also reflects the influence of local atmospheric conditions, such as stability, moisture availability, and vertical wind shear, in modulating seeding outcomes.
- c)
- Integrated Satellite–Radar Interpretation for Seeding Event 1
Multi-spectral satellite imagery and radar reflectivity collectively highlight a coherent evolution of cloud and precipitation structures during the 11 November 2024 seeding event over the Tahoe region. Satellite observations indicated the development of optically thick, glaciated cloud tops and a well-saturated upper and mid-troposphere, particularly over and west of the lake - conditions favorable for ice-phase precipitation. These microphysical signatures coincided with radar-detected intensification and spatial broadening of precipitation echoes, with reflectivity exceeding 30 dBZ primarily in the western downwind region during the 20:20 - 20:40 UTC interval. The temporal progression from glaciation signals in the satellite data to the strengthening of radar echoes supports a sequence consistent with seeded cloud development. The satellite imagery revealed cloud-top structure and phase transition processes, while the radar data captured the resulting hydrometeor growth and areal precipitation response. Together, these integrated observations provide strong, event-specific evidence of seeding enhanced precipitation during Event 1.
3.3.2. Seeding Event 2: 20 February 2024
- a)
- Satellite Remote Sensing Analysis
Satellite remote sensing observations during February 20, 2024 (Figure 5), cloud seeding event over the Tahoe region reveal moderate cloud development with localized indications of ice-phase processes. the analysis of cloud particle size indicates limited ice crystal growth, with subtly darkened regions in the 1.61 µm band suggesting early-stage or partial glaciation in the targeted area. This interpretation is supported by BTs from the 10.3 µm and 11.2 µm bands, which show moderately cold cloud tops in the seeded zone, suggesting glaciated clouds with shallow vertical cloud development and potential for ice-phase precipitation, though less extensive and colder than in Event 1. The evaluation of cloud optical depth using the 0.64 µm and 0.86 µm bands shows moderate reflectance, indicative of optically denser clouds in parts of the region but without the pronounced structure or depth observed in the previous case. Water vapor content, examined across the 6.2 µm, 6.9 µm, and 7.3 µm bands, indicates the presence of sufficient upper-, mid-, and lower-level moisture to support cloud development. Finally, precipitation potential, inferred from BT differences between the 11.2 µm and 12.3 µm bands, shows subtle gradients, pointing to partial phase transition with reduced glaciation efficiency compared to Event 1.
The comparison between Events 1 and 2 highlights differences and similarities in cloud development and seeding effectiveness. The first case exhibits stronger signals of ice-phase cloud evolution, as evidenced by the pronounced dark regions in the 1.61 µm band and colder, more expansive cloud tops in the 10.3 µm and 11.2 µm bands, suggesting greater ice particle formation. Additionally, higher optical thickness in the 0.64 µm and 0.86 µm, along with enhanced mid- and upper-level moisture in the 6.2 µm and 6.9 µm bands, supports the hypothesis that cloud seeding had a more substantial impact on cloud growth in this case.
Conversely, while the second case also shows evidence of cloud phase transition, the overall intensity of cloud development appears weaker. Some regions retain liquid-phase characteristics, as indicated by the subtler contrast between the 0.86 µm and 1.61 µm bands, and slightly warmer cloud-top temperatures, implying reduced vertical cloud growth or limited ice-phase processes. Additionally, lower upper-level humidity may have contributed to the reduced optical depth and glaciation, thereby limiting the effectiveness of seeding efforts.
- b)
- Radar-Based Analysis
Figure 6 shows radar reflectivity images associated with Cloud Seeding Event 2, capturing the temporal development of precipitation through four frames. The first frame at 21:25 UTC, which is approximately one hour before the satellite observation, shows spare and weak reflectivity, with only isolated low-intensity echoes (<20 dBZ) scattered across the region. This frame represents the background atmospheric state, indicating minimal natural precipitation prior to seeding.
By 21:50 UTC, a slight increase in reflectivity emerges, primarily to the southwest of Lake Tahoe, though returns remain relatively weak and scattered. By 22:10 UTC, the radar imagery shows a clear intensification in both reflectivity and areal coverage, with echoes reaching 30-35 dBZ, particularly in areas extending northward and eastward from the Lake. At 22:30 UTC, the reflectivity field becomes more organized, with persistent moderate returns spanning significant portion of the region.
This gradual amplification and spatial expansion of radar echoes following the onset of seeding activity may reflect hydrometeor growth triggered by seeding-induced ice formation. While the initial atmospheric conditions were less active than those observed in the November case, the temporal progression of precipitation intensity, in tandem with satellite-indicated glaciation, supports the interpretation of a measurable seeding response during Event 2.
- c)
- Integrated Satellite–Radar Interpretation for Seeding Event 2
The combined satellite and radar observations for the February 20, 2024, seeding event reveal a moderate cloud and precipitation response. GOES ABI imagery showed localized darkening in the 1.61 µm band with modest BT depressions in the 10.3 and 11.2 µm bands, suggesting partial glaciation within optically shallow clouds but with adequate mid- and upper-level saturation. Approximately 20-40 minutes after seeding initiation, radar reflectivity increased from isolated weak echoes (<20 dBZ) to more widespread areas exceeding 30 dBZ, particularly north and east of Lake Tahoe. This temporal evolution points to delayed hydrometeor growth, likely seeded ice-phase development progressing into organized precipitation.
While both platforms show signatures consistent with seeded cloud modification, the signal strength was weaker and more gradual compared to Event 1. The radar-sensed precipitation intensification lagged the glaciation signals, suggesting a slower cloud response under marginal thermodynamic conditions. Together, the multi-sensor evidence points to a measurable but less robust seeding impact, constrained by less favorable vertical cloud structure.
3.3.3. Seeding Event 3: 1 February 2024
- a)
- Satellite Remote Sensing Analysis
As seen in Figure 7, ABI satellite data was analyzed to examine the effects of cloud seeding over the Tahoe area on 1 February 2024 at 18:16 UTC. In 0.86 µm wavelength band, brighter reflectance indicates optically thick cloud cover, while the corresponding darkening in the 1.61 µm band indicated enhanced absorption by ice particles, suggesting active droplet-to-ice phase transition within seeded clouds. This transition is further supported by cloud particle size analysis, which shows the expected reflectance-absorption contrast between the NIR and shortwave IR bands, consistent with ice crystal growth.
Cloud phase analysis based on the alignment of dark regions in the 1.61 µm and 10.3 µm bands with colder cloud tops in the 10.3 µm IR window band reinforces the presence of glaciated clouds, implying successful heterogeneous ice nucleation potentially induced by seeding. In addition, the 10.3 µm and 11.2 µm bands show moderately cold cloud tops, warmer than those seen during the February 20 (Figure 5), November 11 (Figure 3), and February 16 (Figure S1) events in Tahoe. These signatures indicate vertical cloud development favorable for ice-phase precipitation, though somewhat limited in spatial extent.
The visible (0.64 µm) and NIR (0.86 µm) bands display high reflectance values over the seeded region, indicating optically dense and well-structured cloud layers. Minimal BT differences between the 11.2 µm and 12.3 µm bands further support enhanced cloud glaciation, as phase transitions reduce emissivity contrasts in these longwave channels.
Water vapor analysis indicates a saturated mid- and upper-troposphere, with no significant dry-air intrusion, suggesting a supportive thermodynamic environment for cloud development and sustained ice growth. Compared to the February 20 event, Event 3 exhibits a weaker glaciation signal and more favorable moisture structure, though still more limited in areal coverage and intensity than the November 11 case. These combined spectral observations indicate a moderate seeding response under partially supportive meteorological conditions.
- b)
- Radar-Based Analysis
Figure 8 presents radar reflectivity images for cloud seeding Event 3, capturing the temporal evolution of precipitation over the Tahoe region. The first frame at 17:25 UTC shows isolated weak echoes (<15 dBZ), indicating limited background precipitation prior to the seeding operation. By 18:15 UTC, coinciding with satellite observations, low-level reflectivity begins to emerge in the southern sector of the domain, though still weak and scattered. At 18:35 UTC, the radar signal becomes more organized, with reflectivity increasing into the 25–30 dBZ range, particularly to the east and northeast of Lake Tahoe. By 18:55 UTC, the reflectivity field expands further, with localized areas exceeding 30 dBZ, consistent with the development of moderate precipitation intensity. The overall trend shows a gradual intensification and spatial expansion of radar echoes following the initiation of seeding, pointing to active hydrometeor growth under moderately supportive conditions.
- c)
- Integrated Satellite–Radar Interpretation for Seeding Event 3
Satellite and radar observations for the February 1, 2024, seeding event indicate a measurable but spatially confined atmospheric response. ABI imagery captured distinct signatures of ice-phase cloud development, including high reflectance in the visible bands, differential absorption in the 1.61 µm band, and moderately depressed BTs in the IR window channels. These features suggest active droplet-to-ice conversion within a cloud layer that, while optically thick, lacked the vertical depth seen in stronger cases.
Radar reflectivity patterns evolved gradually following seeding initiation, with echoes increasing from isolated low intensity returns to organized patches exceeding 30 dBZ. The reflectivity growth lagged the satellite-observed glaciation, aligning with a seeding-induced delay in hydrometeor formation. Unlike the broader and more intense response observed during the Event 1, the radar and satellite signals here remained localized but coherent, pointing to a seeding response shaped by marginally supportive thermodynamic conditions.
3.3.4. Seeding Event 4: 4 April 2024
- a)
- Satellite Remote Sensing Analysis
Figure 9 presents multi-spectral GOES ABI satellite imagery during the cloud seeding event on April 4, 2024, over the Tahoe region. A transition from small liquid droplets to ice particles is observed through NIR and shortwave IR bands with bright reflectance in the 0.86 µm band and enhanced absorption in the 1.61 µm band. This result confirms the presence of ice-phase clouds, suggesting that cloud seeding could promote ice nucleation. Further support for this transition comes from the cloud phase assessment, where darker regions in 1.61 µm band correspond with colder cloud tops in the 10.3 µm band, demonstrating the conversion of supercooled liquid water to ice. Cloud-top temperature analysis using 10.3 µm and 11.2 µm bands reveals widespread cold cloud tops, with deep blue shading suggesting enhanced vertical cloud development and glaciation. This cooling implies cloud deepening, which is typically associated with enhanced precipitation potential. The same pattern can be seen in some Ruby and Santa Rosa mountains seeding events (Figures S2, S3, S5, S6, and S8). The cloud optical depth and thickness assessment, conducted using visible and near-infrared bands, indicated that seeded clouds exhibited increased optical thickness, as evidenced by high reflectance in 0.64 µm and 0.86 µm bands. These optically thick clouds suggest robust cloud microphysical development sustained during the event.
Water vapor content evaluation across 6.2 µm, 6.9 µm, and 7.3 µm bands shows strong moisture availability throughout the vertical profile. Ample mid- and upper-level moisture, seen in white, provided a favorable thermodynamic environment for cloud persistence and ice-phase growth. Finally, the precipitation potential analysis, based on BT differences between the 11.2 µm and 12.3 µm bands, shows minimal separation, reinforcing the presence of glaciated, thick clouds. This signature, together with cloud-top cooling and phase transition indicators, suggests the cloud system evolved under conditions conducive to precipitation enhancement. Compared to earlier events, Event 4 displays similar spectral evidence of glaciation as Events 1 and 2 yet is distinguished by broader cold cloud coverage and uniformly moist profiles, highlighting its particularly favorable seeding environment. These findings demonstrate that cloud seeding facilitated ice nucleation, accompanied by thickening clouds and increasing precipitation potential under favorable atmospheric conditions.
- b)
- Radar-Based Analysis
Figure 10 shows radar reflectivity evolution during this seeding event, revealing a sustained increase in echo intensity and spatial coverage following the seeding window. Early frames display weak, scattered returns (<20 dBZ), but subsequent frames depict enhanced reflectivity, particularly over and downwind of the seeded region. The progression toward broader and more coherent radar returns, ranging from 20 to >30 dBZ, suggests hydrometeor growth likely supported by seeding-induced ice nucleation. Compared to previous events, this case exhibits a reflectivity response stronger than Event 3 but slightly weaker in areal coverage than Event 1, with spatial structure resembling Event 2.
The timing of radar intensification, relative to seeding initiation and the observed increase in dBZ values support the interpretation of enhanced precipitation development, potentially modulated by favorable mid- and upper-level moisture as seen in satellite observations. Collectively, these radar trends reinforce the hypothesis that cloud seeding in this event contributed to precipitation enhancement under conducive synoptic and thermodynamic conditions
- c)
- Integrated Satellite–Radar Interpretation for Seeding Event 4
The temporal consistency between the development of radar echoes and the satellite-indicated glaciation suggests a coherent atmospheric response to cloud seeding on 4 April 2024. While radar reflectivity values remained moderate, the spatial expansion and structural organization of echoes following seeding indicate active hydrometeor growth. Unlike some previous events where the radar response was either minimal or fragmented, Event 4 demonstrates sustained echo development across the seeded region. This evolution aligns temporally with the expected post-seeding interval and reflects a stable precipitation regime. The collocation of radar intensification with favorable satellite-derived thermodynamic indicators, without relying solely on peak reflectivity, offers a more nuanced view of seeding effectiveness. In combination, the observations point to a productive interaction between the seeded clouds and the prevailing atmospheric conditions, resulting in a measurable, if moderate, enhancement of precipitation processes.
4. Summary and Conclusions
This study investigated the microphysical and thermodynamic responses to glaciogenic cloud seeding across multiple winter weather events in three mountainous regions of Nevada: Tahoe, the Ruby Mountains, and the Santa Rosa Range. Using multispectral satellite imagery from the GOES-16 ABI and regional NEXRAD radar reflectivity, we evaluated the extent to which seeded clouds displayed physical signatures associated with enhanced precipitation potential. The central hypothesis guiding this analysis was that remote sensing observations, particularly satellite-derived indicators of glaciation, cloud-top cooling, and optical thickening, could be linked with radar-observed hydrometeor growth to assess seeding impacts in varying atmospheric regimes.
Although the visual analysis presented in the main text focused on four representative seeding events from the Tahoe region, all events across the three study regions were analyzed using a consistent methodology. Satellite imagery for the Ruby Mountains and Santa Rosa Range are provided in the Supplementary Material. The meteorological conditions for all study regions were included in the main analysis, offering crucial context for interpreting the seeding outcomes.
Our analysis revealed that seeding responses varied significantly by region, reflecting differences in local meteorological conditions and cloud properties. Events in the Tahoe region consistently exhibited strong seeding signatures, including clear transitions from liquid to ice phase in satellite observations, colder and thickening cloud tops, and sustained increases in radar reflectivity. These responses were most apparent when ambient conditions supported seeding effectiveness - namely, cold temperatures, abundant mid- and upper-tropospheric moisture, and favorable wind shear. In contrast, cases in the Santa Rosa Range typically lacked sufficient supercooled liquid water and exhibited warmer cloud tops and thinner cloud optical depth, resulting in weaker cloud and radar responses. The Ruby Mountains presented mixed results, with some events, such as on January 13, 2024, at 17:11 UTC (Figure S7) displaying strong microphysical changes, while others revealed only marginal seeding effects. Key satellite-derived indicators of successful seeding included enhanced absorption in the 1.61 µm band paired with bright reflectance in the 0.86 µm band, suggesting droplet-to-ice conversion. These spectral patterns were often accompanied by cloud-top cooling in the 10.3 and 11.2 µm bands, and minimal BT differences between 11.2 µm and 12.3 µm, evidence of glaciation and precipitation potential. Radar reflectivity complemented these findings, especially when increases in dBZ were observed following the initiation of seeding. Meteorological analysis further clarified these findings by identifying region-specific atmospheric conditions that influenced seeding effectiveness. Tahoe events benefited from colder environments and deeper moisture profiles, while Santa Rosa and Ruby displayed broader variability in temperature, humidity, and wind structure. These results underscore the importance of tailoring cloud seeding strategies to regional atmospheric conditions, particularly those that support supercooled liquid water, vertical development, and ice-phase transitions.
A major contribution of this study is the development of a reproducible framework for satellite–radar integration, which enables a more robust and multi-dimensional assessment of seeding outcomes. While satellite data alone can reveal microphysical cloud changes, and radar data can verify precipitation development, their combined use allows for a fuller characterization of the seeding lifecycle from initial cloud-phase transitions to hydrometeor growth and potential surface impacts. This dual approach is particularly effective in marginal or ambiguous cases, where individual sensor data may be inconclusive. In practical terms, the findings from this study can inform more precise and adaptive operational seeding programs. By leveraging satellite and radar data in tandem, cloud seeding efforts can be better targeted, monitored, and evaluated, ensuring greater efficiency and effectiveness. Moreover, the satellite–radar framework presented here provides a scalable and transferable tool for similar evaluations in other regions, particularly where ground-based observations may be limited. Overall, this work contributes to both the scientific understanding and operational practice of cloud seeding by demonstrating that spectral and structural cloud properties observed through remote sensing can reliably indicate seeding outcomes. By aligning physical cloud processes with observational evidence, this integrative approach strengthens our ability to assess and optimize precipitation enhancement strategies in diverse atmospheric environments.
Supplementary Materials
The following supporting information can be downloaded at the website of this paper posted on Preprints.org, Figure S1: GOES BI satellite imagery from the cloud seeding event on 16 February 2025 over the Tahoe region, showing multiple spectral bands for cloud microphysical analysis; Figure S2: Same as Figure S1 but for 17 January 2024 over the Santa Rosa Mountains; Figure S3: Same as Figure S1 but for 2 January 2024 over the Santa Rosa Mountains; Figure S4: Same as Figure S1 but for 3 January 2024 over the Santa Rosa Mountains; Figure S5: Same as Figure S1 but for 2 March 2024 over the Santa Rosa Mountains; Figure S6: Same as Figure S1 but for 16 February 2025 over the Ruby Mountains; Figure S7: Same as Figure S1 but for 13 January 2024 over the Ruby Mountains; Figure S8: Same as Figure S1 but for 2 January 2024 over the Ruby Mountains; Figure S9: Same as Figure S1 but for 3 January 2024 over the Ruby Mountains.
Author Contributions
Conceptualization, F.H. and G.M.; methodology, F.H. and G.M.; validation, G.M. and F.H.; formal analysis, G.M. and F.H.; investigation, G.M. and F.H.; resources, F.M. and F.H.; data curation, G.M. and F.H.; writing—original draft preparation, G.M.; writing—review and editing, G.M. and F.H.; visualization, G.M.; supervision, F.H.; project administration, F.H. and F.M.; funding acquisition, F.M. All authors have read and agreed to the published version of the manuscript.
Funding
This research received no external funding.
Data Availability Statement
The data utilized in this study are publicly available from the following sources: Geostationary Operational Environmental Satellites (GOES) data, provided by NOAA, are accessible at https://www.star.nesdis.noaa.gov/GOES/index.php (accessed on 6 July 2025). Radar reflectivity data from the NOAA National Centers for Environmental Information (NCEI) are available at https://www.ncei.noaa.gov/maps/radar/ (accessed on 6 July 2025). Atmospheric variable data during cloud seeding operations are provided by the Western Regional Climate Center (WRCC) and can be accessed at https://wrcc.dri.edu/weather/WxMod.html (accessed on 6 July 2025).
Acknowledgments
We gratefully acknowledge Farnaz Hosseinpour for her expert guidance and meaningful contributions throughout this research. Her knowledge and support played a vital role in the success of the project.
Conflicts of Interest
The authors declare no conflicts of interest.
References
- Bruintjes, R.T. A review of cloud seeding experiments to enhance precipitation and some new prospects. Bull Am Meteorol Soc. 1999, 80, 805–820. [Google Scholar] [CrossRef]
- Guo, X.; Zheng, G.; Jin, D. A numerical comparison study of cloud seeding by silver iodide and liquid carbon dioxide. Atmos Res. 2006, 79, 183–226. [Google Scholar] [CrossRef]
- Essien, M. Evaluation of cloud seeding techniques for precipitation enhancement. Glob J Clim Stud. 2023, 1, 53–64. [Google Scholar]
- Mehdizadeh, G.; Erfani, E.; McDonough, F.; Hosseinpour, F. Quantifying the influence of cloud seeding on ice-particle growth and snowfall through idealized microphysical modeling. Atmosphere (Basel). 2024, 15, 1460. [Google Scholar] [CrossRef]
- Mehdizadeh, G.; Hosseinpour, F.E.; McDonough, F.; Erfani, E. Studying the mechanistic impacts of cloud seeding on snowfall with insights from a cloud microphysical model [poster]. Graduate Poster Symposium; 2023 Nov; Reno, NV. [CrossRef]
- Yu, X.; Dai, J.; Lei, H.; Xu, X.; Fan, P.; Chen, Z.; et al. Physical effect of cloud seeding revealed by NOAA satellite imagery. Chin Sci Bull. 2005, 50, 45–52. [Google Scholar] [CrossRef]
- Lin, K.I.; Chung, K.S.; Wang, S.H.; Chen, L.H.; Liou, Y.C.; Lin, P.L.; et al. Evaluation of hygroscopic cloud seeding in warm-rain processes by a hybrid microphysics scheme using a WRF model: a real case study. Atmos Chem Phys. 2023, 23, 10423–10438. [Google Scholar] [CrossRef]
- Mehdizadeh, G.; Hosseinpour, F.; Erfani, E.; McDonough, F. Impacts of atmospheric conditions on cloud seeding: a numerical approach. In: AGU Fall Meeting Abstracts; 2024 Dec; San Francisco, CA. Washington (DC): American Geophysical Union; 2024. Abstract A21G-1809.
- Cotton, W.R.; Pielke, R.A. Human Impacts on Weather and Climate. 2nd ed. Cambridge: Cambridge University Press; 2007.
- Flossmann, A.I.; Manton, M.; Abshaev, A.; Bruintjes, R.; Murakami, M.; Prabhakaran, T.; Yao, Z. Review of advances in precipitation-enhancement research. Bull Am Meteorol Soc. 2019, 100, 1465–1480. [Google Scholar] [CrossRef]
- Geerts, B.; Pokharel, B. ; Kristovich DAR. Blowing snow as a natural glaciogenic cloud-seeding mechanism. Mon Weather Rev. 2015, 143, 5017–5033. [Google Scholar]
- Jensen, A.; Watts, A.; Richards, M. DRI unmanned cloud-seeding realizes beyond visual line of sight. Phys.org [Internet]. 2017 Feb 17 [cited 2025 Jul 9]. Available from: https://phys.org/news/2017-02-dri-unmanned-cloud-seeding-visual-line.
- Wu, X.; Yan, N.; Yu, H.; Niu, S.; Meng, F.; Liu, W.; Sun, H. Advances in the evaluation of cloud seeding: statistical evidence for the enhancement of precipitation. Earth Space Sci. 2018, 5, 425–439. [Google Scholar] [CrossRef]
- Dong, X.; Zhao, C.; Huang, Z.; Mai, R.; Lv, F.; Xue, X.; et al. Increase of precipitation by cloud seeding observed from a case study in November 2020 over Shijiazhuang, China. Atmos Res. 2021, 262, 105766. [Google Scholar] [CrossRef]
- Muñoz LMP. Seeding change in weather modification globally. WMO Bull. 2017, 66, 16.
- Silverman, B.A. A critical assessment of glaciogenic seeding of convective clouds for rainfall enhancement. Bull Am Meteorol Soc. 2001, 82, 903–924. [Google Scholar] [CrossRef]
- United States Government Accountability Office. Cloud Seeding Technology: Assessing Effectiveness and Other Challenges [Internet]. Washington (DC): GAO; 2024. Report No.: GAO-25-107328. [cited 2025 Jul 9]. Available from: https://www.gao. 1073.
- Fajardo, C.; Costa, G.; Sánchez-Fortún, S. Potential risk of acute toxicity induced by AgI cloud seeding on soil and freshwater biota. Ecotoxicol Environ Saf. 2016, 133, 433–441. [Google Scholar] [CrossRef] [PubMed]
- Malik, S.; Bano, H.; Rather, R.A.; Ahmad, S. Cloud seeding: its prospects and concerns in the modern world—a review. Int J Pure Appl Biosci. 2018, 6, 791–796. [Google Scholar] [CrossRef]
- Gholaminejad, A.; Mehdizadeh, G.; Dolatimehr, A.; Arfaeinia, H.; Farjadfard, S.; Dobaradaran, S.; et al. Phthalate esters pollution in the leachate, soil, and water around a landfill near the sea, Iran. Environ Res. 2024, 248, 118234. [Google Scholar] [CrossRef]
- Mehdizadeh, G.; Nikoo, M.R.; Talebbeydokhti, N.; Vanda, S.; Nematollahi, B. Hypolimnetic aeration optimization based on reservoir thermal stratification simulation. J Hydrol. 2023, 625, 130106. [Google Scholar] [CrossRef]
- Birgani, S.A.; Zadeh, S.S.; Davari, D.D.; Ostovar, A. Deep learning applications for analysing concrete surface cracks. Int J Appl Data Sci Eng Health. 2024, 1, 69–84. [Google Scholar]
- Ostovar, A. Comparative Life Cycle Assessment (LCA) of Different Asphalt Emulsion Types [master’s thesis]. Reno (NV): Univ. of Nevada, Reno; 2023.
- Mardi, R.; Ostovar, A. Seismic performance and sustainability of BRB and SMA-braced structures under incremental dynamic analysis. J Sustainabil. 2025, 1(1).
- Ostovar, A.; Davari, D.D.; Dzikuć, M. Determinants of design with multilayer perceptron neural networks: a comparison with logistic regression. Sustainability. 2025, 17, 2611. [Google Scholar] [CrossRef]
- Dong, X.; Zhao, C.; Yang, Y.; Wang, Y.; Sun, Y.; Fan, R. Distinct change of supercooled liquid cloud properties by aerosols from an aircraft-based seeding experiment. Earth Space Sci. 2020, 7, e2020EA001196. [Google Scholar] [CrossRef]
- Rosenfeld, D.; Zhu, Y.; Wang, M.; Zheng, Y.; Goren, T.; Yu, S. Aerosol-driven droplet concentrations dominate coverage and water of oceanic low-level clouds. Science. 2019, 363, eaav0566. [Google Scholar] [CrossRef]
- Yue, Z.; Rosenfeld, D.; Liu, G.; Dai, J.; Yu, X.; Zhu, Y.; et al. Automated mapping of convective clouds (AMCC) thermodynamical, microphysical, and CCN properties from SNPP/VIIRS satellite data. J Appl Meteorol Climatol. 2019, 58, 887–902. [Google Scholar] [CrossRef]
- Anuar SNS, Narashid, R.H.; Razak, T.R.; Hashim, S.; Rahim, A.; Boharsi, S.N. Cloud seeding potential areas from remote sensing of low-level cloud. In: Proc 20th IEEE Int Colloquium on Signal Processing & Its Applications (CSPA); 2024 Mar; Penang, Malaysia. Piscataway (NJ): IEEE; 2024. p. 35-40.
- Rosenfeld, D.; Lensky, I.M. Satellite-based insights into precipitation formation processes in continental and maritime convective clouds. Bull Am Meteorol Soc. 1998, 79, 2457–2476. [Google Scholar] [CrossRef]
- Rosenfeld, D.; Yu, X.; Dai, J. Satellite-retrieved microstructure of AgI seeding tracks in supercooled layer clouds. J Appl Meteorol. 2005, 44, 760–767. [Google Scholar] [CrossRef]
- Yu, X.; Dai, J.; Rosenfeld, D.; Lei, H.; Xu, X.; Fan, P.; et al. Comparison of model-predicted transport and diffusion of seeding material with NOAA satellite-observed seeding track in supercooled layer clouds. J Appl Meteorol. 2005, 44, 749–759. [Google Scholar] [CrossRef]
- Wang, J.; Yue, Z.; Rosenfeld, D.; Zhang, L.; Zhu, Y.; Dai, J.; et al. Evolution of an AgI cloud-seeding track in central China as seen by a combination of radar, satellite, and disdrometer observations. J Geophys Res Atmos. 2021, 126, e2020JD033914. [Google Scholar] [CrossRef]
- Pagano, T.S.; Durham, R.M. Moderate resolution imaging spectroradiometer (MODIS). In: Sensor Systems for the Early Earth Observing System Platforms. Proc SPIE 1939, 1993. p. 2-17.
- Jin, S.; Gao, C.; Li, J. Atmospheric sounding from Fengyun-3C GPS radio occultation observations: first results and validation. Adv Meteorol. 2019, 2019, 4780143. [Google Scholar] [CrossRef]
- Zheng, S.; Wang, G.; Huang, X.; Miao, C.; Xing, W.; Chen, S.; et al. Improvement and design of transmitter modifier wind cooling protection for CINRAD/CB weather radar. J Geosci Environ Prot. 2018, 6, 139–146. [Google Scholar] [CrossRef]
- Friedrich, K.; Higgins, S.; Masters, F.J.; Lopez, C.R. Articulating and stationary PARSIVEL disdrometer measurements in conditions with strong winds and heavy rainfall. J Atmos Oceanic Technol. 2013, 30, 2063–2080. [Google Scholar] [CrossRef]
- Raupach, T.H.; Berne, A. Correction of raindrop size distributions measured by Parsivel disdrometers, using a two-dimensional video disdrometer as a reference. Atmos Meas Tech. 2015, 8, 343–365. [Google Scholar] [CrossRef]
- Morrison, A.E.; Siems, S.T.; Manton, M.J. On a natural environment for glaciogenic cloud seeding. J Appl Meteorol Climatol. 2013, 52, 1097–1104. [Google Scholar] [CrossRef]
- Bessho, K.; Date, K.; Hayashi, M.; Ikeda, A.; Imai, T.; Inoue, H.; et al. An introduction to Himawari-8/9—Japan’s new-generation geostationary meteorological satellites. J Meteorol Soc Jpn. 2016, 94, 151–183. [Google Scholar] [CrossRef]
- Greenwald, T.J.; Pierce, R.B.; Schaack, T.K.; Otkin, J.A.; Rogal, M.; Bah, K.; et al. Real-time simulation of the GOES-R ABI for user readiness and product evaluation. Bull Am Meteorol Soc. 2016, 97, 245–261. [Google Scholar] [CrossRef]
- Schmit, T.J.; Gunshor, M.M.; Menzel, W.P.; Gurka, J.J.; Li, J.; Bachmeier, A.S. Introducing the next-generation Advanced Baseline Imager on GOES-R. Bull Am Meteorol Soc. 2005, 86, 1079–1096. [Google Scholar] [CrossRef]
- Schmit, T.J.; Lindner, B.L.; Jung, J.A.; Gunshor, M.M. GOES-R Advanced Baseline Imager (ABI) spectral bands. J Appl Meteorol. 2005, 44, 1735–1742. [Google Scholar]
- Schmit, T.J.; Lindstrom, S.S.; Gerth, J.J.; Gunshor, M.M. Applications of the 16 spectral bands on the Advanced Baseline Imager (ABI). J Oper Meteorol. 2018, 6, 33–46. [Google Scholar] [CrossRef]
- Kalluri, S.; Alcala, C.; Carr, J.; Griffith, P.; Lebair, W.; Lindsey, D.; et al. From photons to pixels: processing data from the Advanced Baseline Imager. Remote Sens. 2018, 10, 177. [Google Scholar] [CrossRef]
- Flossmann, A.I.; Wyszogrodzki, A.A.; Jensen, D. Review of advances in precipitation-enhancement research. Bull Am Meteorol Soc. 2019, 100, 1465–1490. [Google Scholar] [CrossRef]
- Heidinger, A.K.; Pavolonis, M.J.; Calvert, C.; Hoffman, J.; Nebuda, S. ; Straka W III, et al. ABI cloud products from the GOES-R series. In: Goodman, S.J.; Schmit, T.J.; Daniels, J.M.; Jamilkowski, M.L.; editors. The GOES-R Series. Amsterdam: Elsevier; 2020. p. 43-62.
- Afzali Gorooh, V.; Kalia, S.; Nguyen, P.; Hsu, K.L.; Sorooshian, S.; Ganguly, S.; et al. Deep neural network cloud-type classification (DeepCTC) model and its application in evaluating PERSIANN-CCS. Remote Sens. 2020, 12, 316. [Google Scholar] [CrossRef]
- Gunshor, M.M.; Schmit, T.J.; Pogorzala, D.; Lindstrom, S.; Nelson, J.P. GOES-R series ABI imagery artifacts. J Appl Remote Sens. 2020, 14, 032411. [Google Scholar]
- Zheng, G.; Brown, C.W.; DiGiacomo, P.M. Retrieval of oceanic chlorophyll concentration from GOES-R Advanced Baseline Imager using deep learning. Remote Sens Environ. 2023, 295, 113660. [Google Scholar] [CrossRef]
- Schmit, T.J.; Griffith, P.; Gunshor, M.M.; Daniels, J.M.; Goodman, S.J.; Lebair, W.J. A closer look at the ABI on the GOES-R series. Bull Am Meteorol Soc. 2017, 98, 681–698. [Google Scholar] [CrossRef]
- Griffith, D.A.; Solak, M.E. The potential use of winter cloud seeding programs to augment the flow of the Colorado River. Colorado White Paper: report to the Upper Colorado River Commission; 2006 Mar.
- Simon, M. Enhancing the weather: governance of weather modification activities in the United States. Wm Mary Environ Law Policy Rev. 2021, 46, 149–207. [Google Scholar]
- Guo, X.; Lin, D.; Wu, F. Analysis of precipitation process and operational precipitation enhancement in Panxi region based on cloud parameters retrievals from China’s next-generation geostationary meteorological satellite FY-4A. Atmosphere (Basel). 2023, 14, 922. [Google Scholar] [CrossRef]
- Yan, L.; Zhou, Y.; Wu, Y.; Cai, M.; Peng, C.; et al. FY-4A measurement of cloud-seeding effect and validation of a catalyst T&D algorithm. Atmosphere (Basel). 2024, 15, 556. [Google Scholar]
- Helder, D.; Doelling, D.; Bhatt, R.; Choi, T.; Barsi, J. Calibrating geosynchronous and polar orbiting satellites: sharing best practices. Remote Sens. 2020, 12, 2786. [Google Scholar] [CrossRef]
- Schmit, T.J.; Gunshor, M.M. ABI imagery from the GOES-R series. In: Goodman, S.J.; Schmit, T.J.; Daniels, J.M.; Jamilkowski, M.L.; editors. The GOES-R Series. Amsterdam: Elsevier; 2020. p. 23-34.
- Miller, S.D.; Seaman, C.J.; Rogers, M.A.; Kidder, S.Q. The importance of shortwave-infrared observations for remote sensing of snow and ice properties from space. Remote Sens. 2021, 13, 873. [Google Scholar]
- Schmit, T.J.; Li, J. ; Lee S-J, Li, Z. ; Dworak, R.; Lee Y-K. Legacy atmospheric profiles and derived products from GOES-16: validation and applications. Earth Space Sci. 2019, 6, 1730–1748. [Google Scholar]
- Li, Z.; Xu, J.; Schmit, T.J.; Zhou, X. Observing convective cloud development using GOES-16 ABI: a case study analysis. Atmosphere (Basel). 2021, 12, 1013. [Google Scholar]
- Dror, T.; Chekroun, M.D.; Altaratz, O.; Koren, I. Deciphering organization of GOES-16 green cumulus through the empirical orthogonal function lens. Atmos Chem Phys. 2021, 21, 12261–12272. [Google Scholar] [CrossRef]
- Bah, M.K.; Gunshor, M.M.; Schmit, T.J. Generation of GOES-16 true color imagery without a green band. Earth Space Sci. 2018, 5, 549–558. [Google Scholar] [CrossRef]
- Wimmers, A.; Griffin, S.; Gerth, J.; Bachmeier, S.; Lindstrom, S. Observations of gravity waves with high-pass filtering in the new generation of geostationary imagers and their relation to aircraft turbulence. Weather Forecast. 2018, 33, 139–144. [Google Scholar] [CrossRef]
- Nam, K.; Wang, F.; Yan, K.; Zhu, G. Characteristics and time-series monitoring by GOES-17 of volcano plume on 15 Jan 2022 from Tonga submarine eruption. Geoenviron Disasters. 2023, 10, 1–17. [Google Scholar] [CrossRef]
- Lee, J.R.; Li, J.; Li, Z.; Wang, P.; Li, J. ABI water vapor radiance assimilation in a regional NWP model by accounting for the surface impact. Earth Space Sci. 2019, 6, 1652–1666. [Google Scholar] [CrossRef]
- Miller, N.B.; Gunshor, M.M.; Merrelli, A.J.; L’Ecuyer, T.S.; Schmit, T.J.; Gerth, J.J.; et al. Imaging considerations from a geostationary orbit using the short-wavelength side of the mid-infrared water-vapor absorption band. Earth Space Sci. 2022, 9, e2021EA002080. [Google Scholar] [CrossRef]
- Lensky, I.M.; Rosenfeld, D. Clouds-Aerosols-Precipitation Satellite Analysis Tool (CAPSAT). Atmos Chem Phys. 2008, 8, 6739–6753. [Google Scholar] [CrossRef]
- Peng, J.; Yu, Y. GOES-R Advanced Baseline Imager (ABI) algorithm theoretical basis document for surface albedo. Washington (DC): NOAA; 2020.
- Xu, W. ; Chang F-L, Li, Z. ; Guo, J. Satellite-based retrieval of cloud microphysical properties: recent advances and perspectives. Remote Sens. 2023, 15, 678. [Google Scholar]
- Mayer, B.; Emde, C.; Gasteiger, J. Radiative transfer in cloudy atmospheres: challenges and advances. J Quant Spectrosc Radiat Transf. 2024, 205, 123–145. [Google Scholar]
- Bachmeier, S. Mixed-phase stratiform clouds in an Arctic air mass. CIMSS Satellite Blog [Internet]. 2017 Dec 28 [cited 2025 Jul 9]. Available from: https://cimss.ssec.wisc.
- Harkema, S.; DiGangi, J.P.; Zondlo, M.A. Observations of ice supersaturation and cirrus clouds using a novel water vapor sensor. Atmos Meas Tech. 2021, 14, 1231–1245. [Google Scholar]
- Wang, Y.; Fan, J.; Zhang, R.; Leung, L.R.; Franklin, C. Improving bulk microphysics parameterizations in simulations of aerosol effects. J Geophys Res Atmos. 2024, 119, 4564–4582. [Google Scholar] [CrossRef]
- Mülmenstädt, J.; Sourdeval, O.; Delanoë, J.; Quaas, J. Frequency of occurrence of rain from liquid-, mixed-, and ice-phase clouds derived from A-Train satellite retrievals. Geophys Res Lett. 2015, 42, 6502–6509. [Google Scholar] [CrossRef]
- Noh, Y.J.; Seaman, C.J.; Vonder Haar, T.H.; Hudak, D.R.; Rodriguez, P. Comparisons and analyses of aircraft and satellite observations for wintertime mixed-phase clouds. J Geophys Res Atmos. 2011, 116(D18).
- Korolev, A. Limitations of the Wegener–Bergeron–Findeisen mechanism in the evolution of mixed-phase clouds. J Atmos Sci. 2007, 64, 3372–3375. [Google Scholar] [CrossRef]
- Costa, A.; Sherwood, S.C.; Renno, N.O. Role of supercooled water in decay of mixed-phase clouds over the Southern Ocean. J Clim. 2017, 30, 6229–6240. [Google Scholar]
- Bedka, K.M.; Minnis, P.; Duda, D.P. Properties of satellite-observed transient tropospheric cooling events associated with overshooting convection. J Appl Meteorol Climatol. 2021, 60, 3–23. [Google Scholar]
- Lindsey, D.T.; Grasso, L.D.; Monette, S. Use of the 1. 38 µm channel for improved thin cirrus detection. J Appl Meteorol Climatol. 2012, 51, 998–1012. [Google Scholar]
- Hillger, D.W.; Kopp, T.J.; Lee, T.F. GOES-14 Super Rapid Scan Operations to prepare for GOES-R. J Appl Remote Sens. 2013, 7, 073462. [Google Scholar]
- Walther, A.; Heidinger, A.K. The IAPP cloud detection and analysis package. J Geophys Res Atmos. 2012, 117(D19).
- Minnis, P.; Harrison, E.F.; Stowe, L.L.; Gibson, G.R.; Denn, F.M.; Doelling, D.R.; et al. Radiative climate forcing by the Mount Pinatubo volcanic eruption. Science. 1995, 270, 75–77. [Google Scholar]
- Minnis, P.; Young, D.F.; Garber, D.P.; Nguyen, L. Cloud optical properties derived from satellite data. J Clim. 2002, 15, 1261–1282. [Google Scholar]
- Platnick, S.; King, M.D.; Ackerman, S.A.; Menzel, W.P.; Baum, B.A.; Riedi, J.; et al. The MODIS cloud products: algorithms and examples from Terra. IEEE Trans Geosci Remote Sens. 2003, 41, 459–473. [Google Scholar] [CrossRef]
- Kuo, C.P.; Kummerow, C. Merging TEMPEST microwave and GOES-16 geostationary IR soundings for improved water vapor profiles. Atmos Meas Tech. 2024, 17, 5637–5653. [Google Scholar] [CrossRef]
- NOAA National Centers for Environmental Information. NCEI radar viewer: composite reflectivity radar image [Internet]. Asheville (NC): NOAA; 2025 [cited 2025 Jul 9]. Available from: https://www.ncei.noaa.
- Tang, J.; Matyas, C.J. High-efficiency weather radar mosaic image generation framework. In: Proc IEEE Int Geosci Remote Sens Symp (IGARSS); 2021 Jul; Brussels, Belgium. Piscataway (NJ): IEEE; 2021. p. 367-9.
- Zhang, J.; Howard, K.; Langston, C.; Vasiloff, S.; Kaney, B.; Arthur, A.; et al. National Mosaic and Multi-Sensor QPE (NMQ) system: description, results, and future plans. Bull Am Meteorol Soc. 2011, 92, 1321–1333. [Google Scholar] [CrossRef]
- Geerts, B.; Miao, Q.; Yang, Y.; Rasmussen, R.; Breed, D. An airborne profiling radar study of the impact of glaciogenic cloud seeding on snowfall from winter orographic clouds. J Atmos Sci. 2010, 67, 3286–3302. [Google Scholar] [CrossRef]
- Breed, D.; Rasmussen, R.; Weeks, C.; Boe, B.; Deshler, T. Evaluating winter orographic cloud seeding: design of the Wyoming Weather Modification Pilot Project. J Appl Meteorol Climatol. 2014, 53, 282–299. [Google Scholar] [CrossRef]
- Langerud, D.W.; Boe, B.A.; Keyes CG, Jr. How to implement a cloud-seeding program. In: Guidelines for Cloud Seeding to Augment Precipitation. Reston (VA): ASCE; 2016. p. 163-89.
- NOAA STAR. GOES-West – sector view: Pacific Southwest [Internet]. College Park (MD): NOAA/NESDIS Center for Satellite Applications and Research; accessed 2025 Jul 6. Available from: https://www.star.nesdis.noaa.gov/GOES/sector.php?sat=G18§or=psw.
Figure 1.
Locations of ground-based AgI generators used in cloud seeding operations across the Lake Tahoe Area, Ruby Mountains, and Santa Rosa Range in Nevada, shown with red polygons. (Base map image created using Google Earth ©).
Figure 1.
Locations of ground-based AgI generators used in cloud seeding operations across the Lake Tahoe Area, Ruby Mountains, and Santa Rosa Range in Nevada, shown with red polygons. (Base map image created using Google Earth ©).
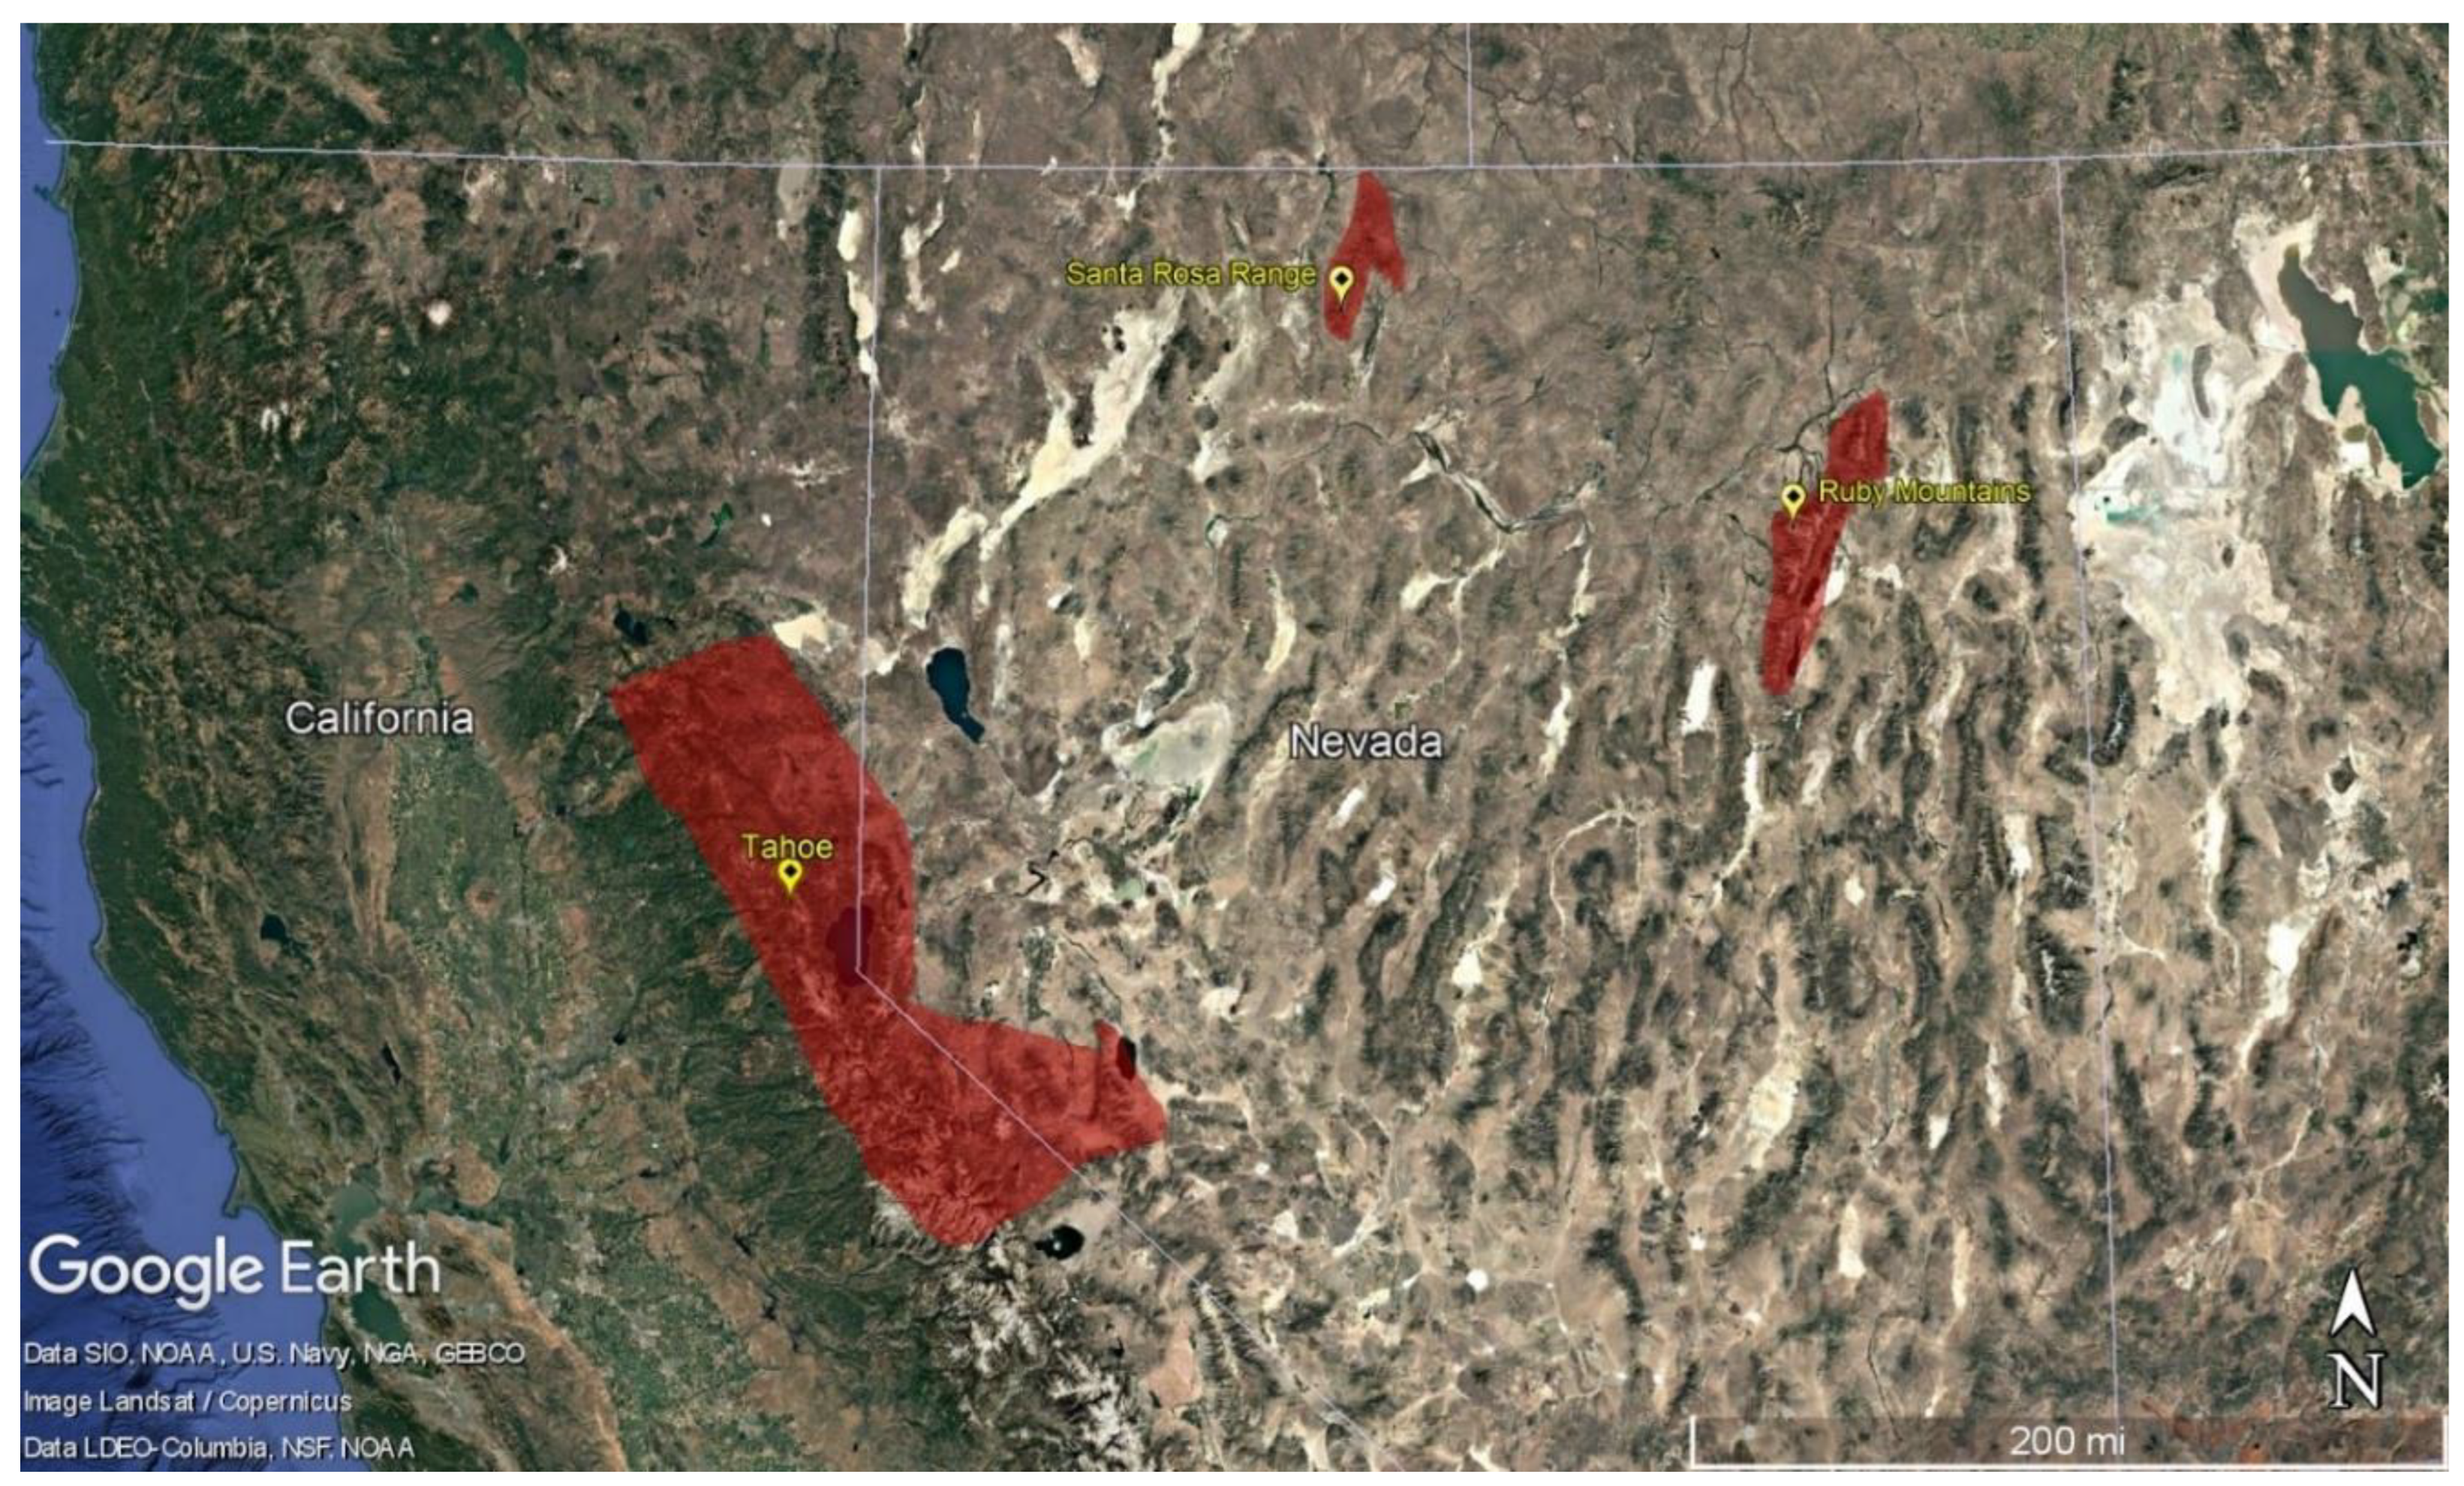
Figure 2.
Box-and-whisker plots depicting the distribution of air temperatures recorded at Tahoe, Santa Rosa, and Ruby locations during the cloud seeding operations.
Figure 2.
Box-and-whisker plots depicting the distribution of air temperatures recorded at Tahoe, Santa Rosa, and Ruby locations during the cloud seeding operations.
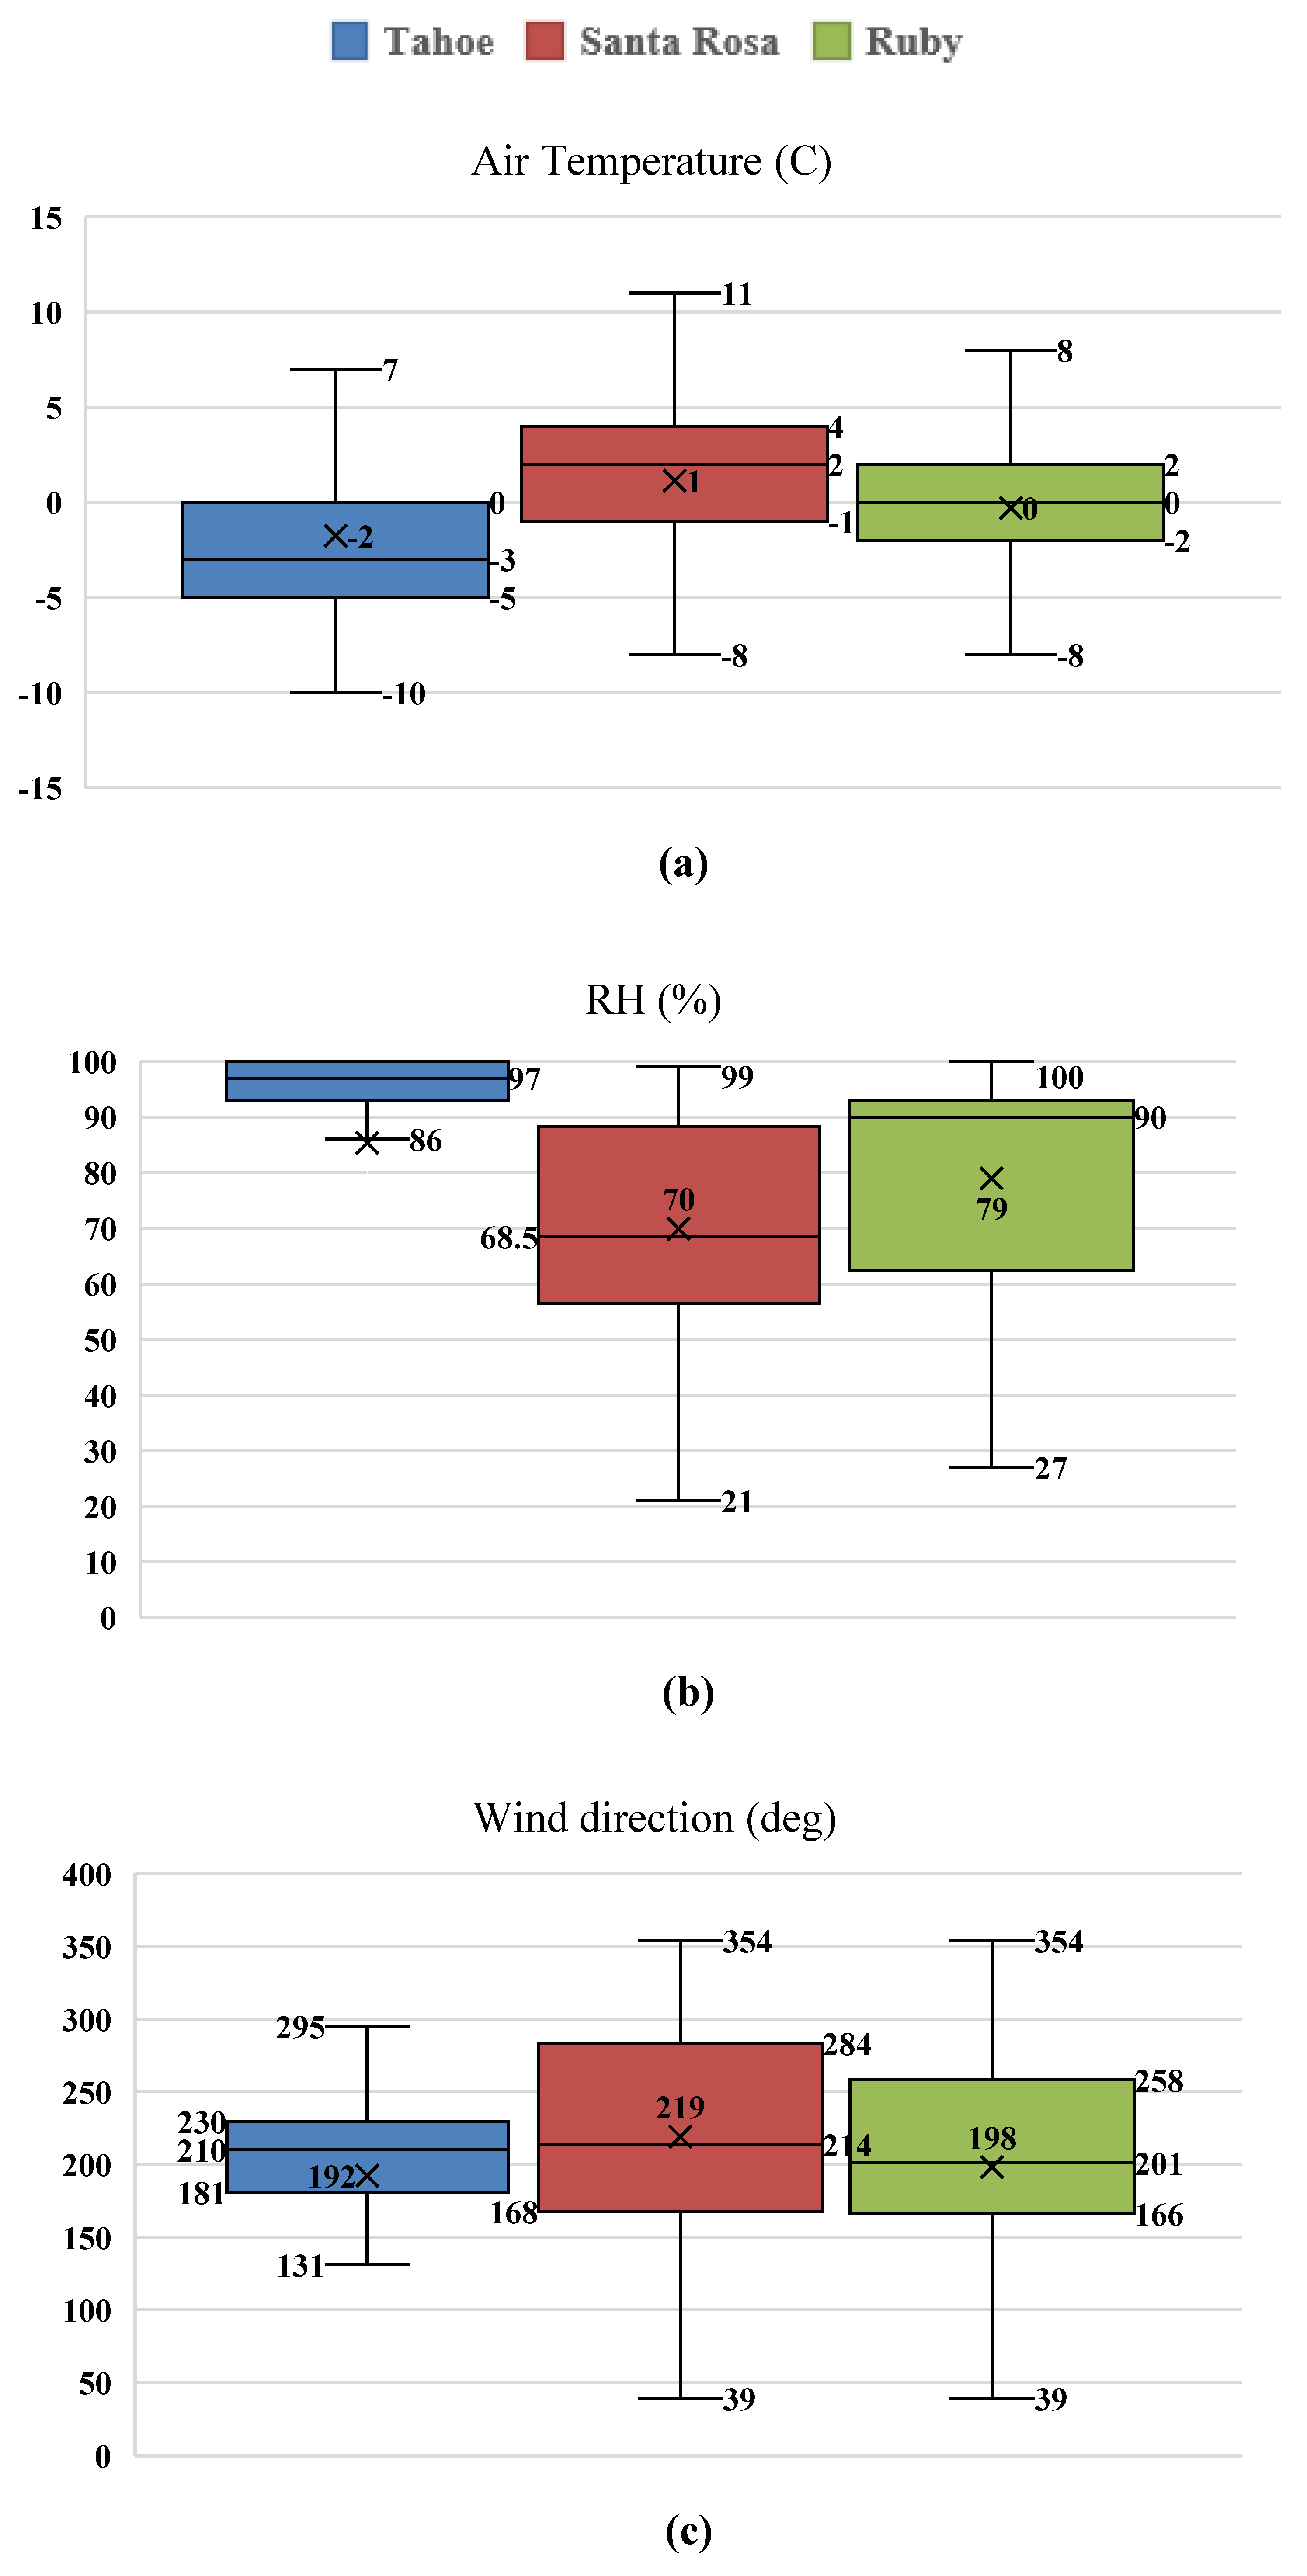
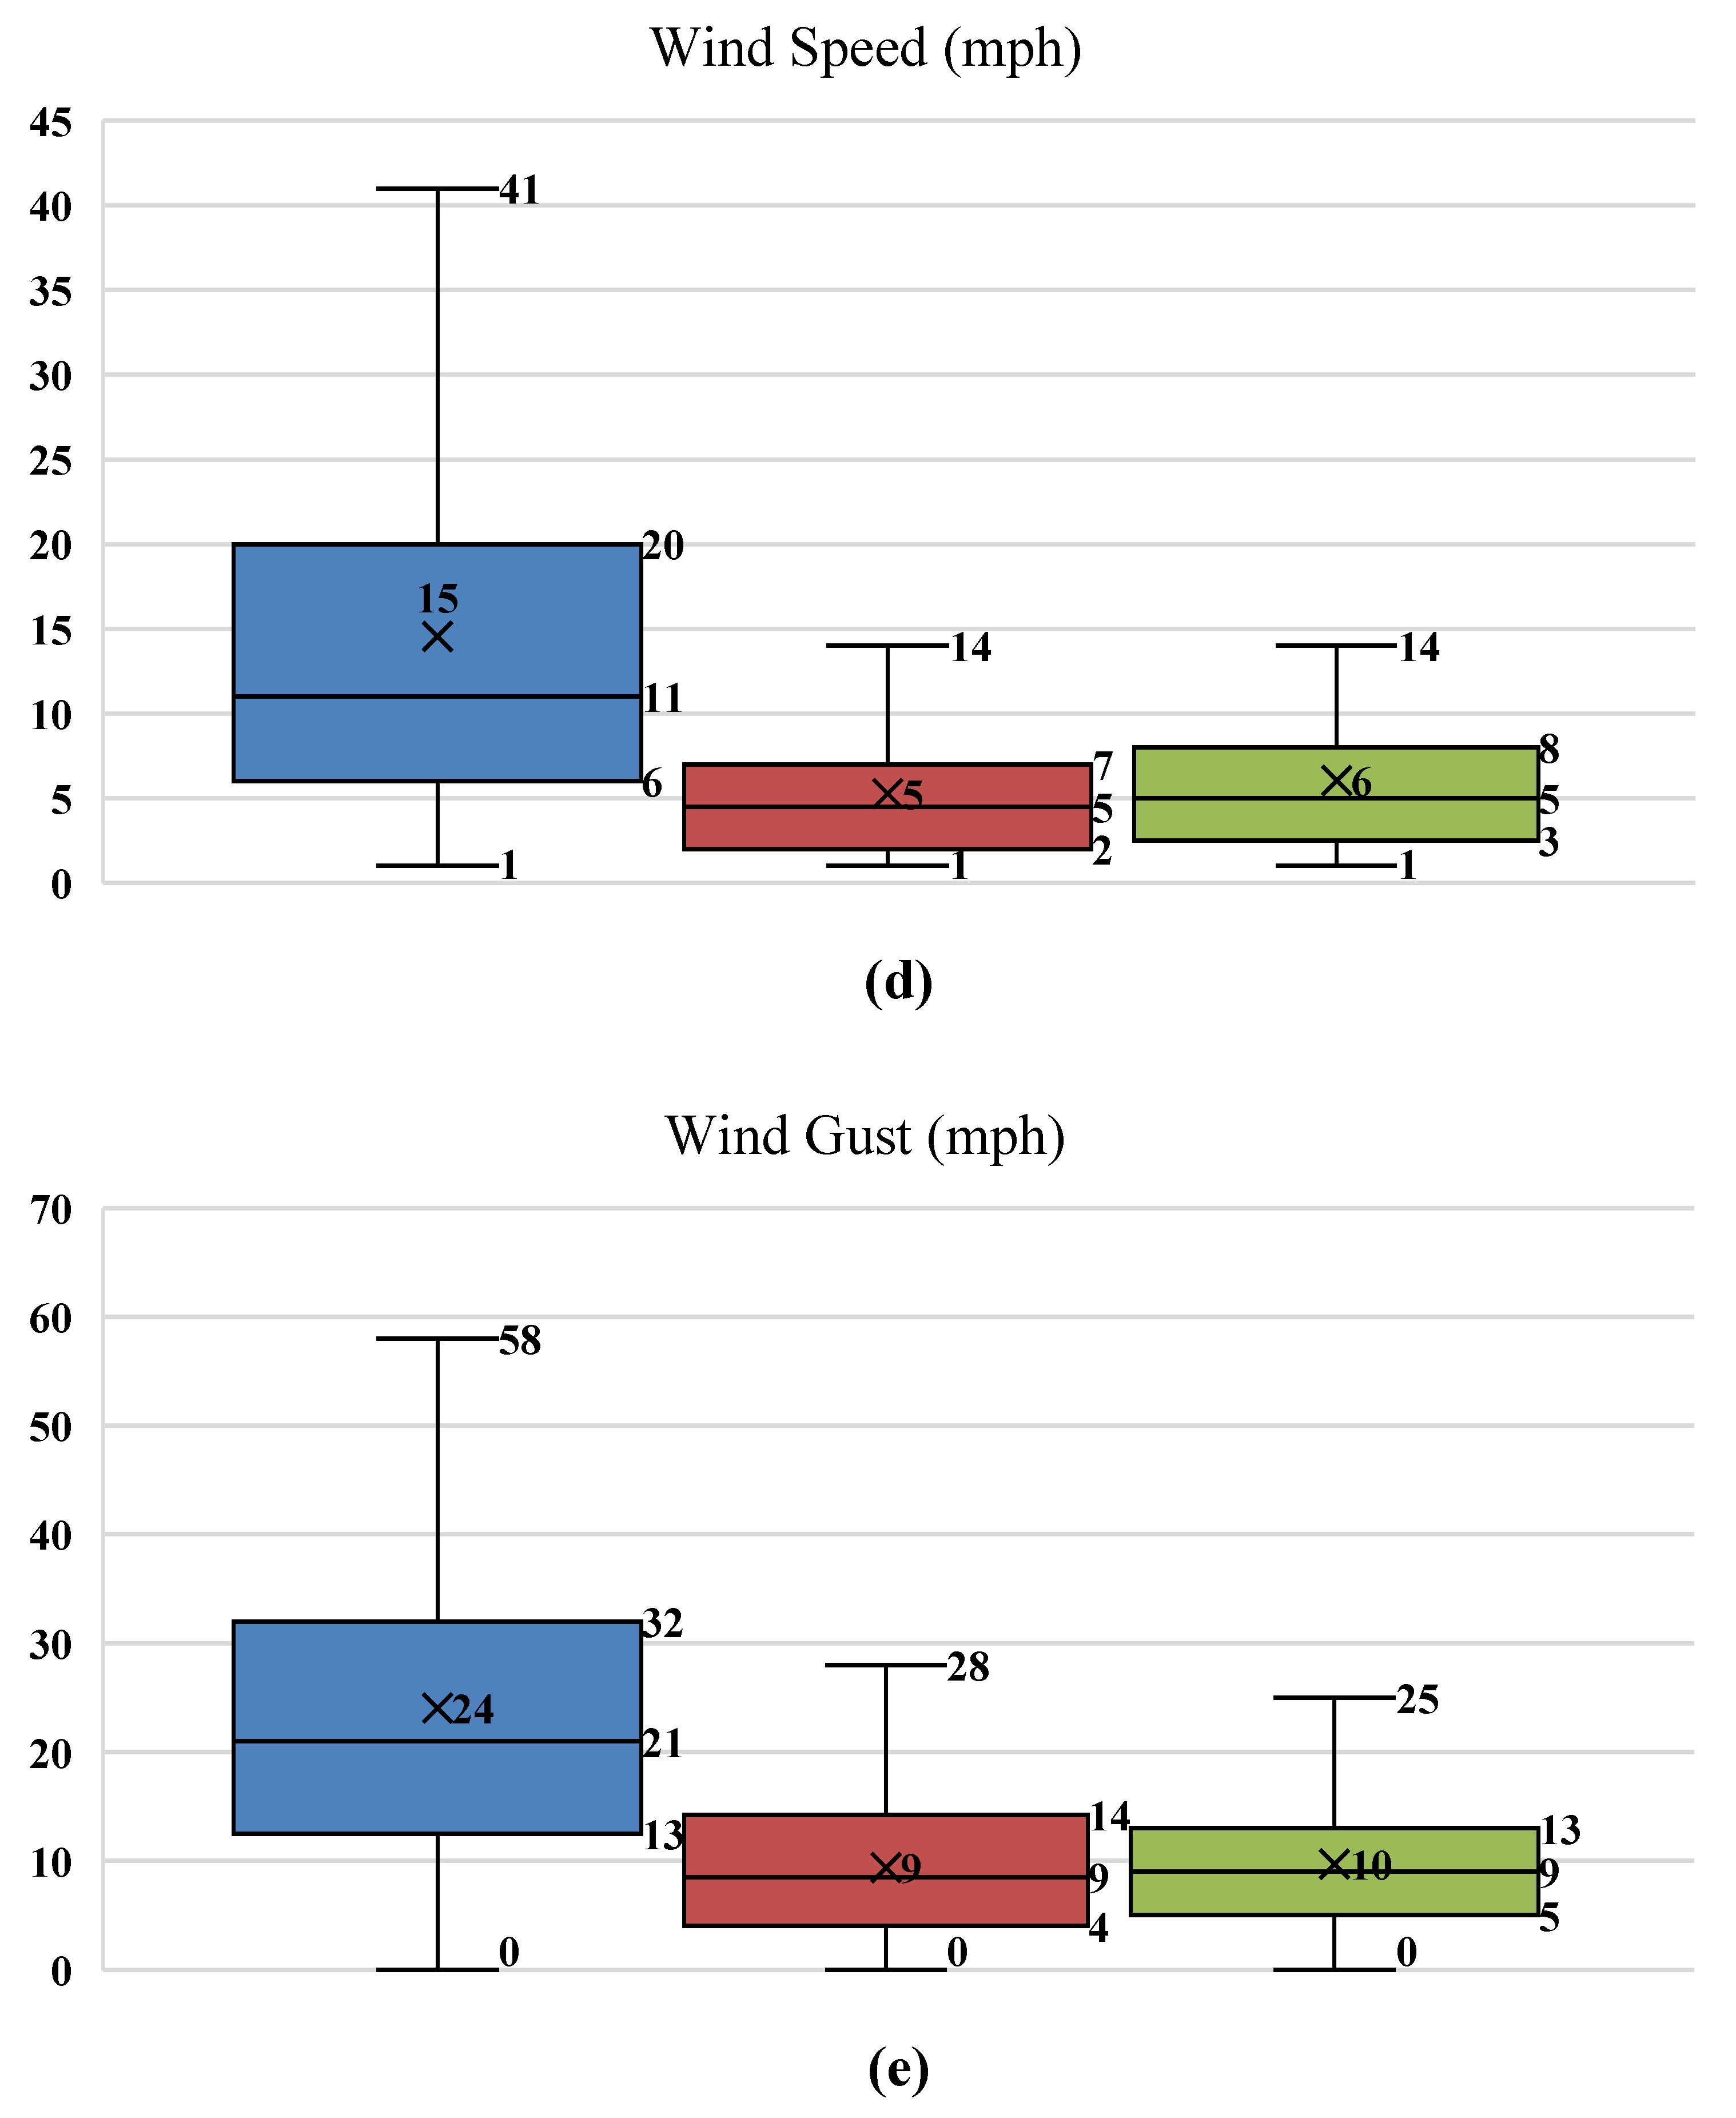
Figure 3.
GOES ABI satellite imagery from the cloud seeding event on November 11, 2024, at 20:00 UTC, over the Tahoe region, highlighting multiple spectral bands used for cloud microphysical and thermodynamic analysis. The top row presents visible and near-infrared bands (0.64 µm, 0.86 µm, and 1.61 µm), the middle row displays infrared window bands (10.3 µm, 11.2 µm, and 12.3 µm), and the bottom row features water vapor bands (6.2 µm, 6.9 µm, and 7.3 µm). Satellite imagery from NOAA STAR GOES-West, Pacific Southwest sector.
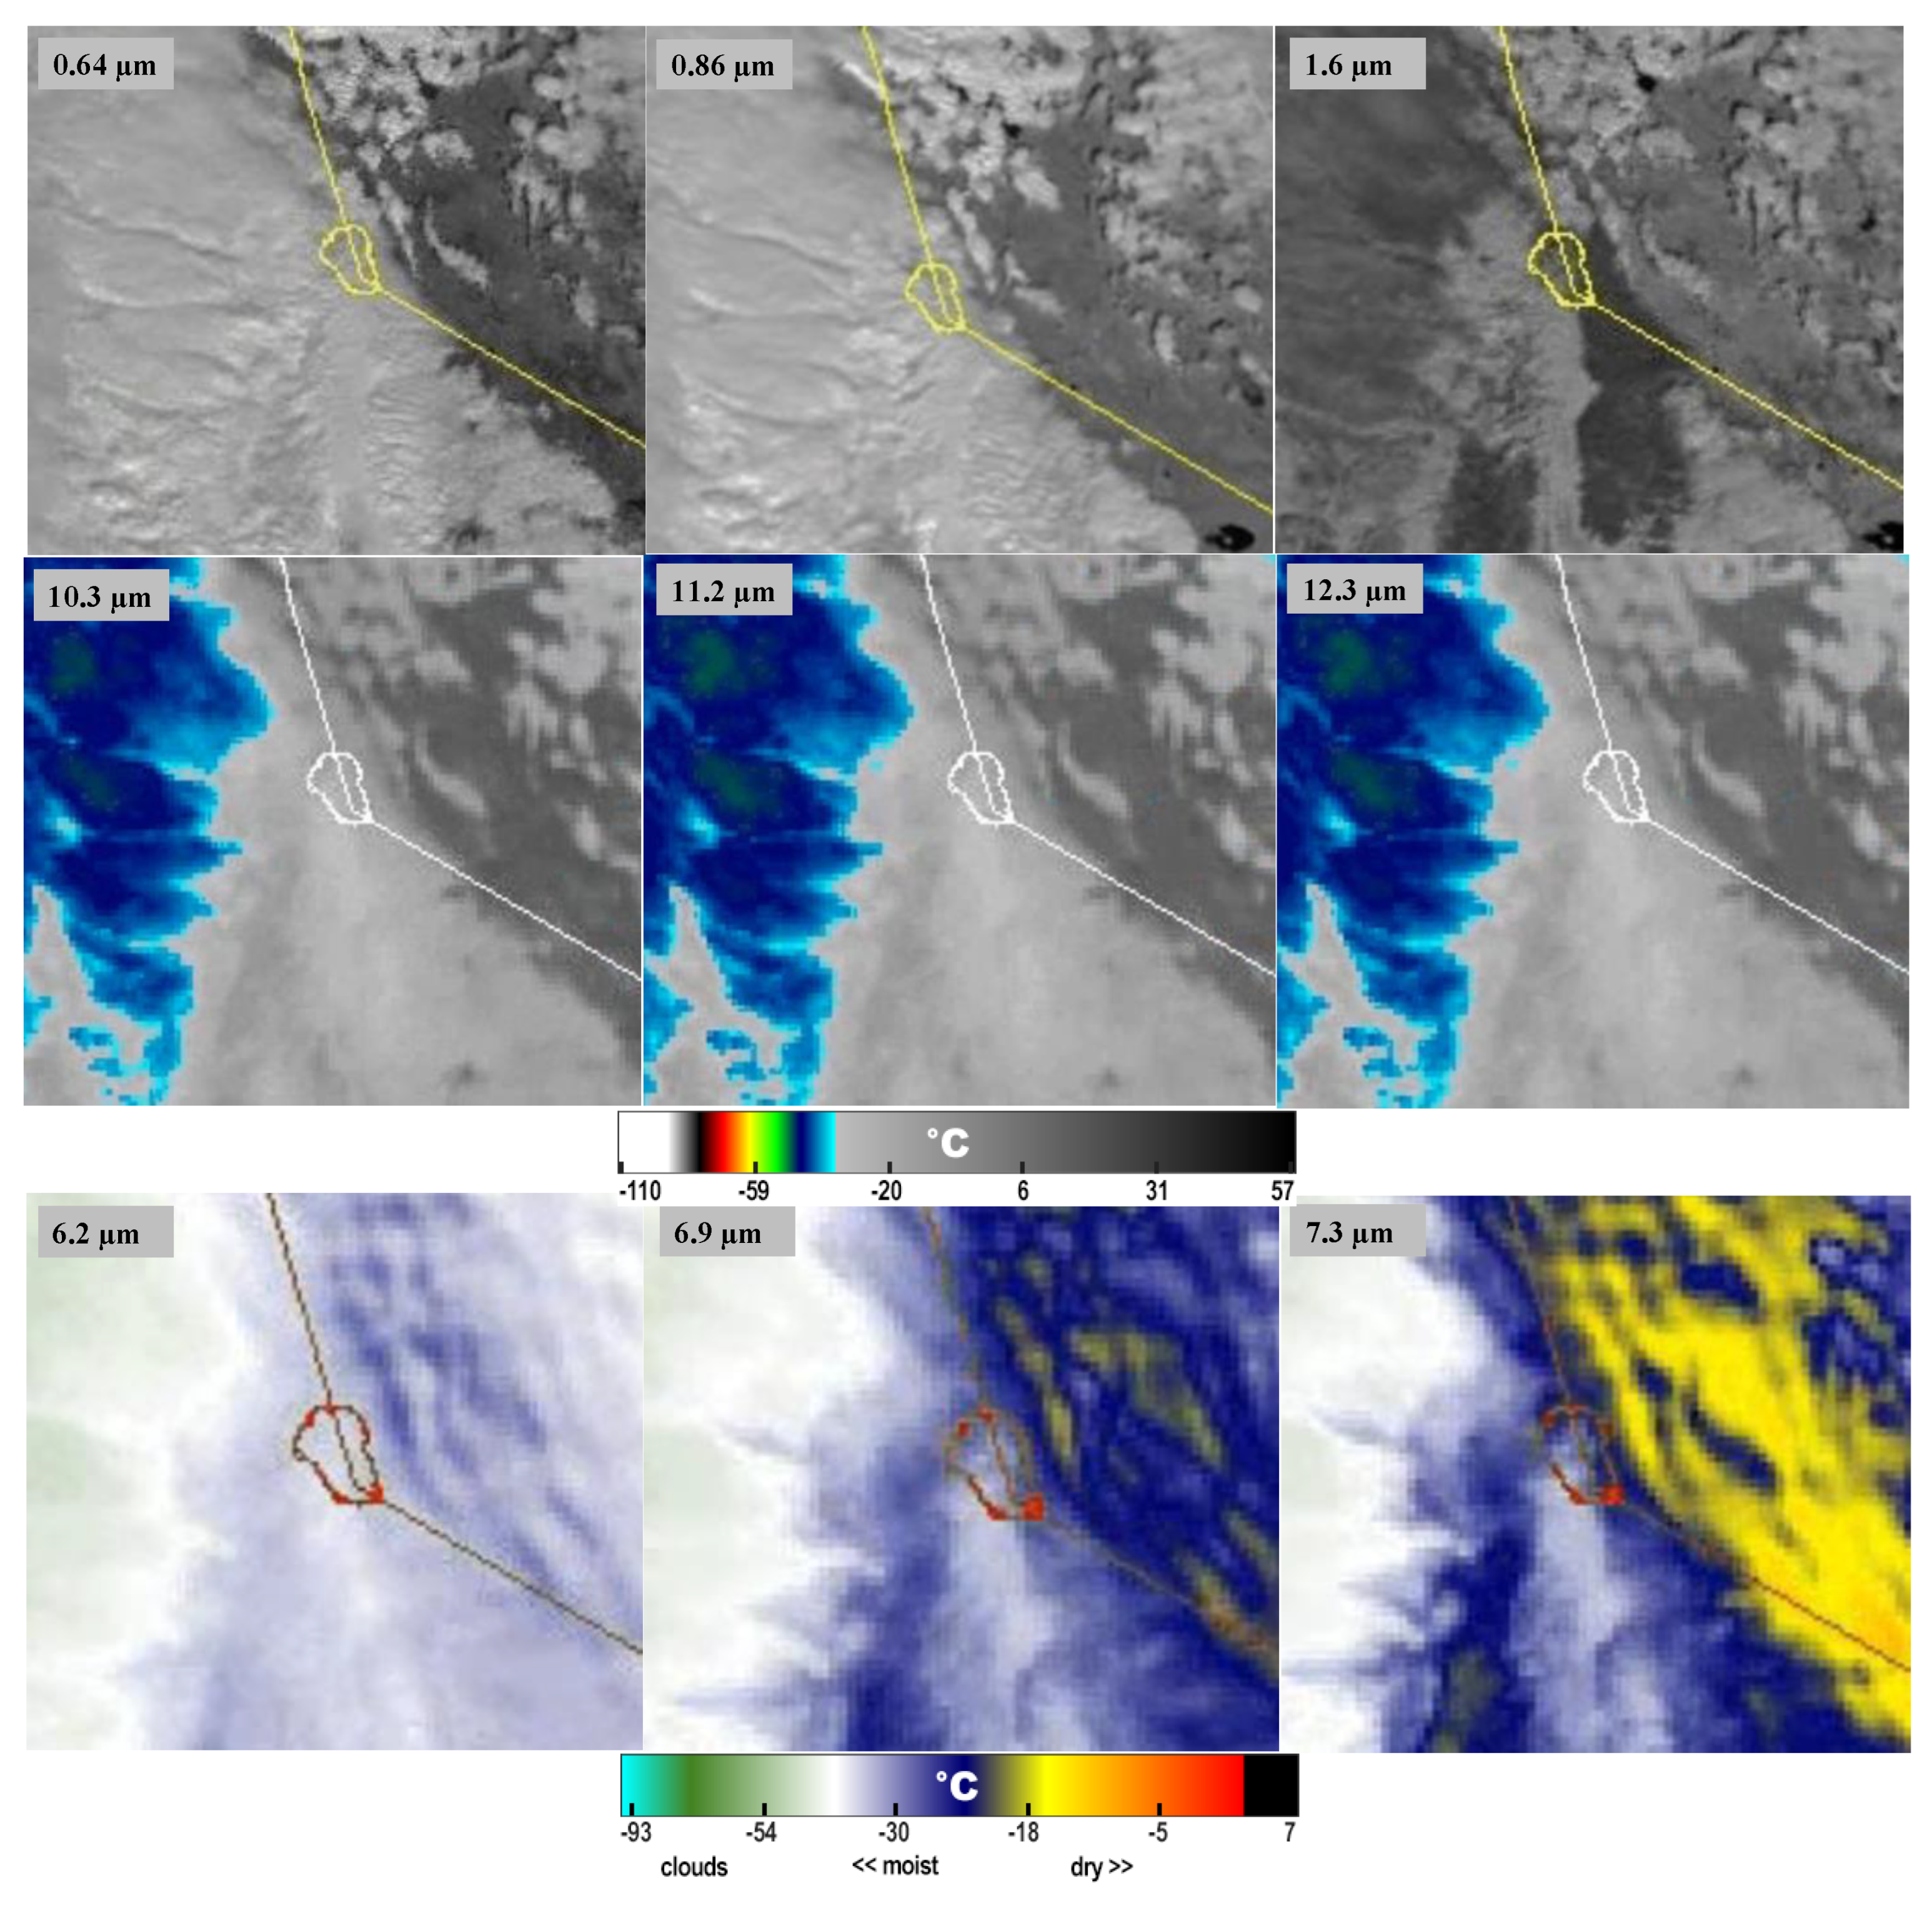
Figure 4.
Radar reflectivity images on November 11, 2024. Sequence begins prior to seeding and illustrates the evolution of reflectivity following the initiation of cloud seeding. The images are from the National reflectivity mosaic derived from the NEXRAD (Next Generation Weather Radar) system and correspond to 19:00, 20:00, 20:20, and 20:40 UTC. The area shown is centered over the Lake Tahoe region, spanning parts of northeastern California and western Nevada. Radar images retrieved from the NOAA NCEI Radar Viewer.
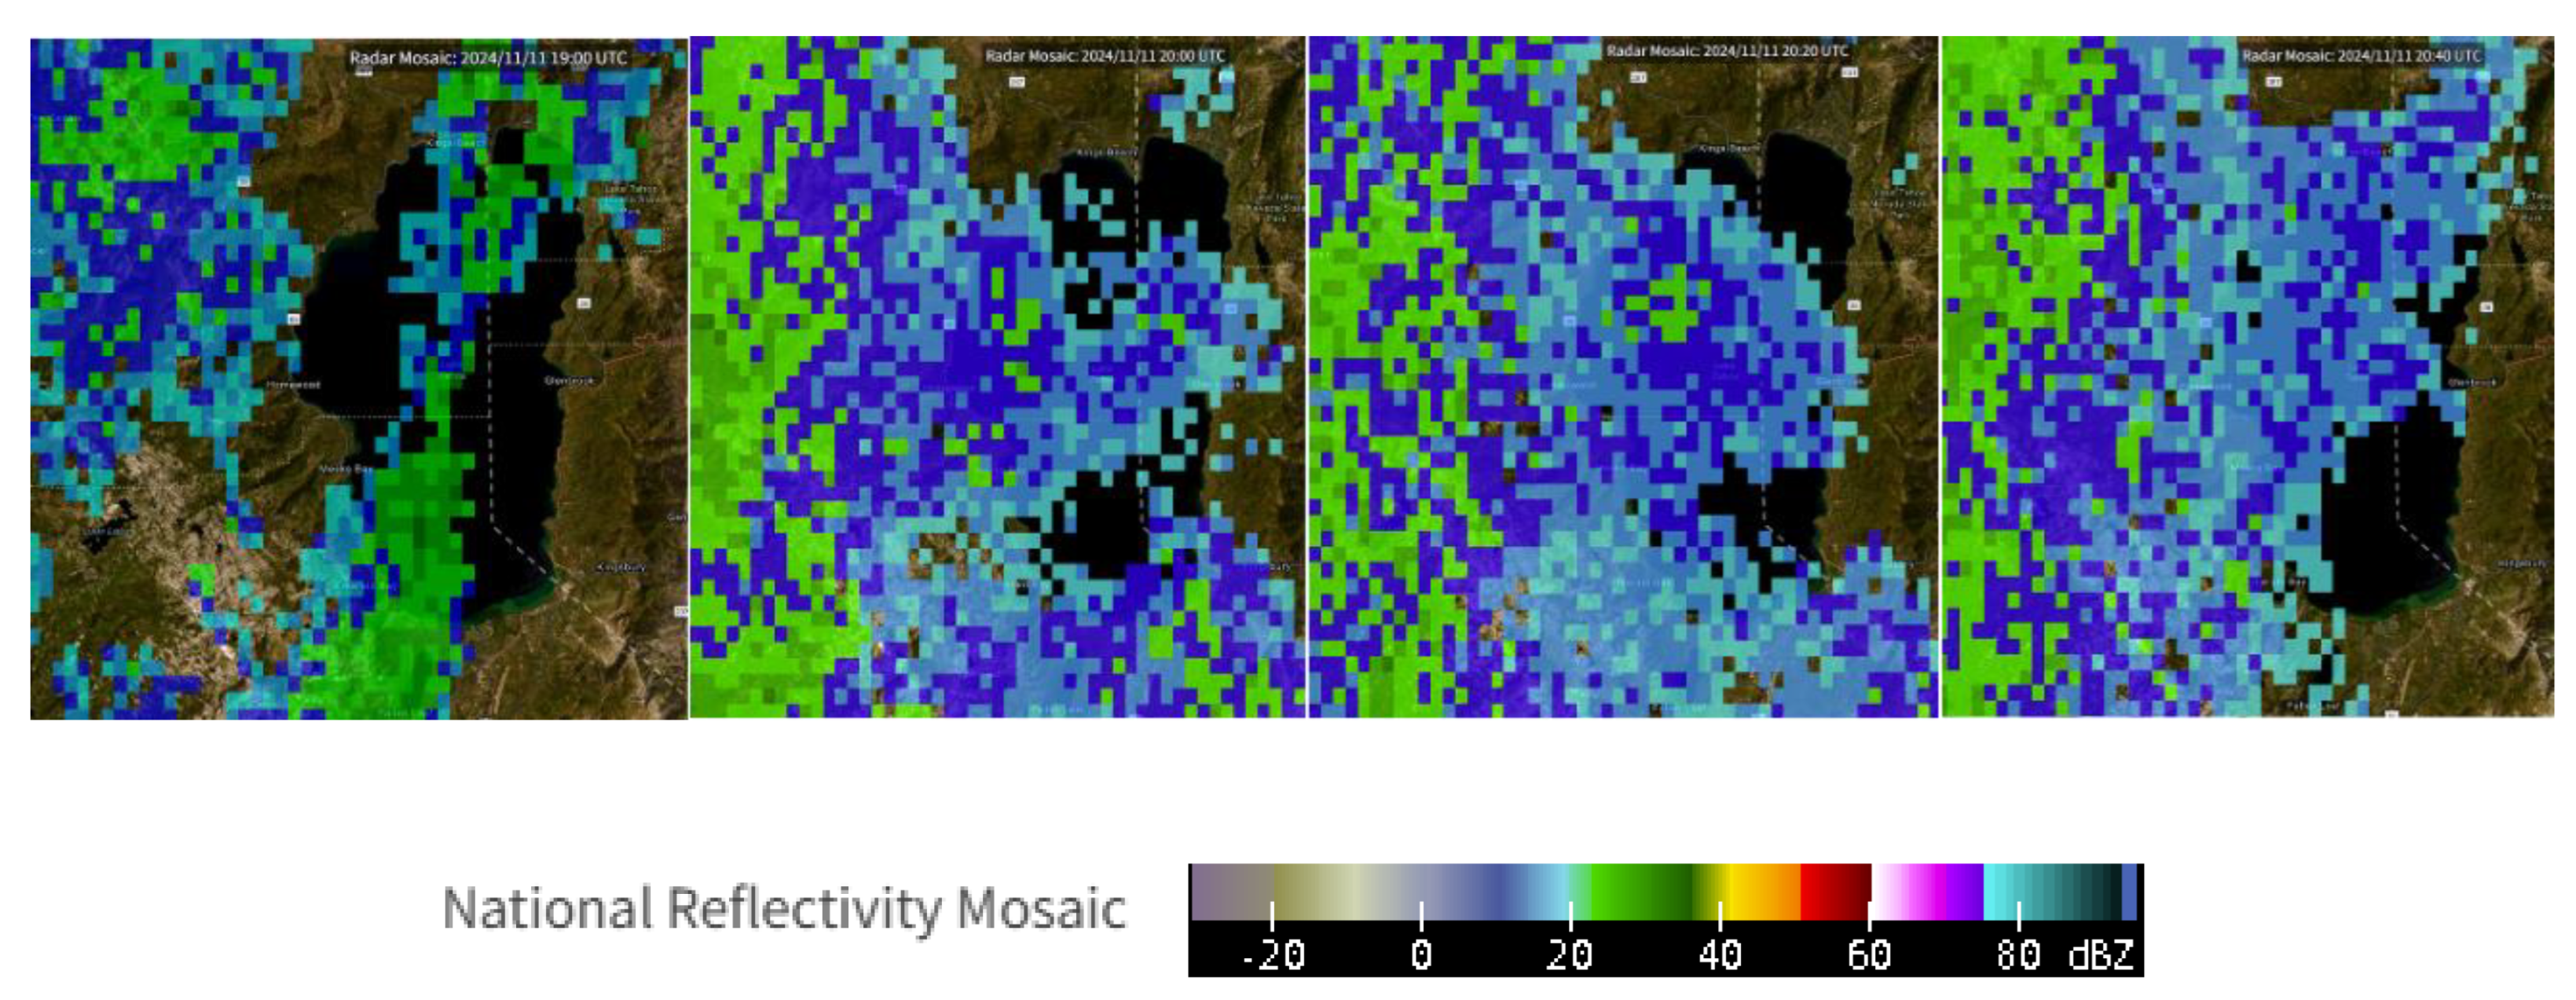
Figure 5.
Same as Figure 3, but for February 20, 2024, at 21:51 UTC.
Figure 5.
Same as Figure 3, but for February 20, 2024, at 21:51 UTC.
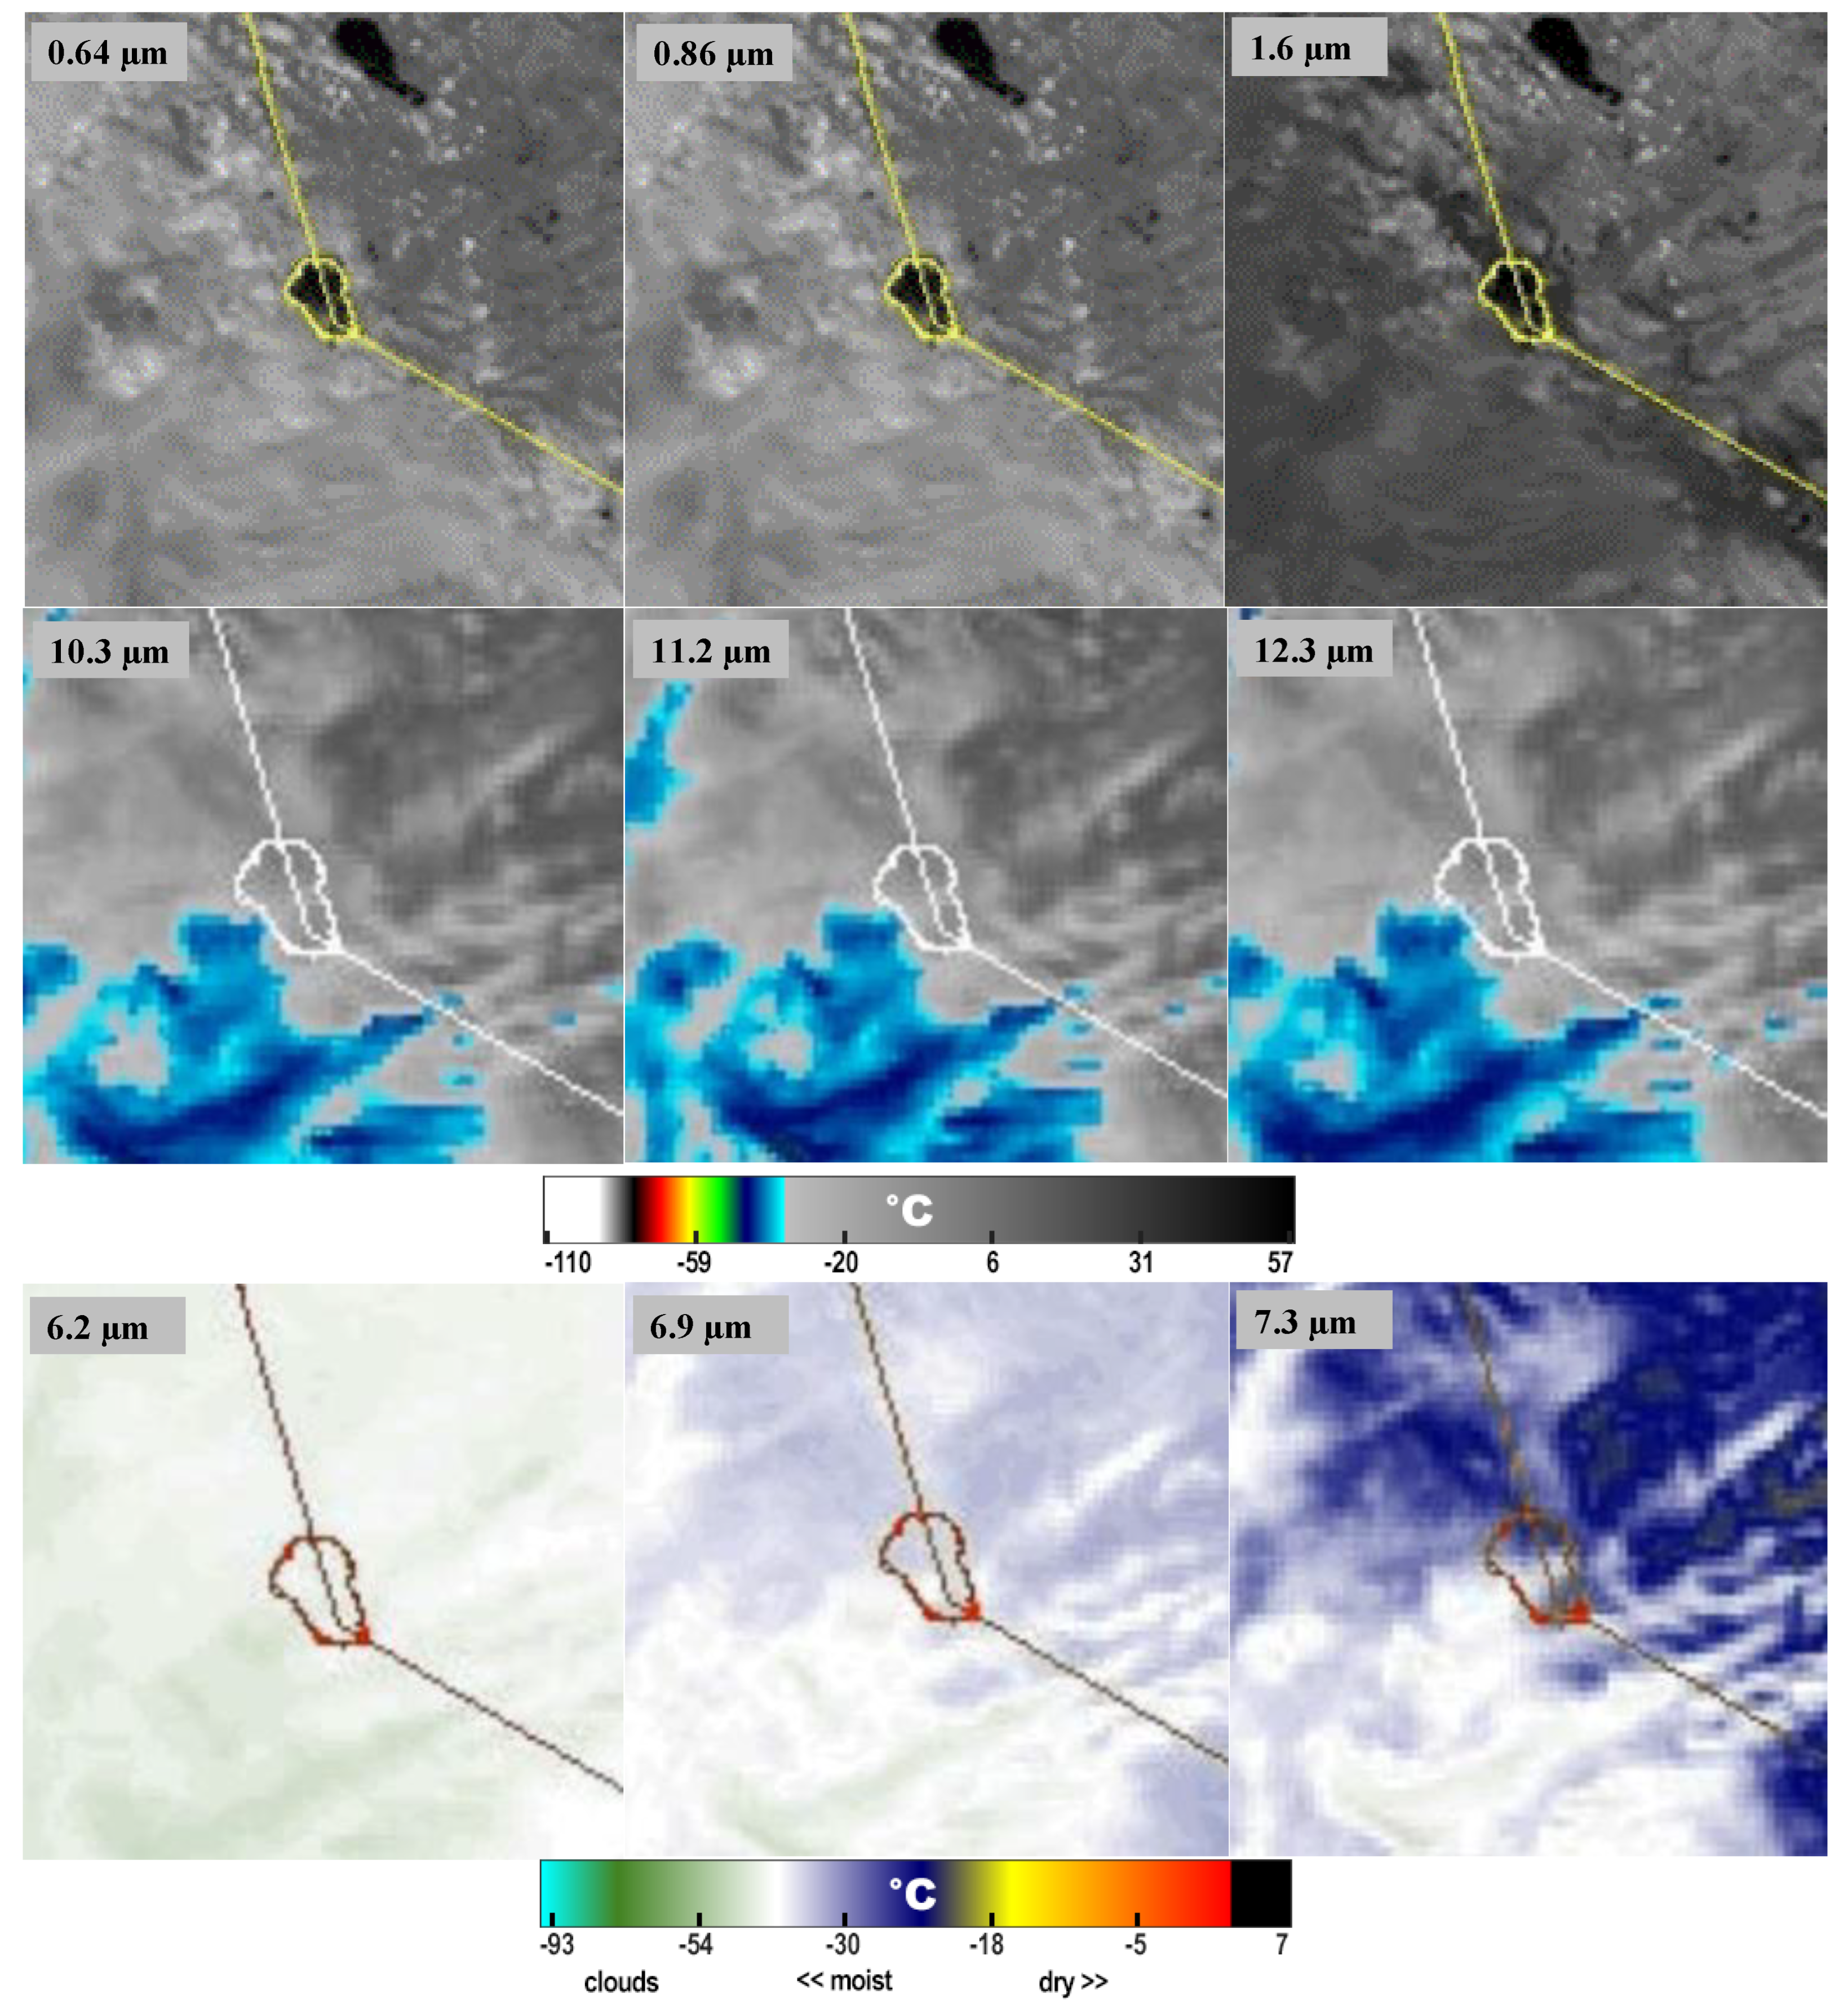
Figure 6.
Same as Figure 4, but for February 20, 2024, showing data at 21:25, 21:50, 22:10, and 22:30 UTC.
Figure 6.
Same as Figure 4, but for February 20, 2024, showing data at 21:25, 21:50, 22:10, and 22:30 UTC.
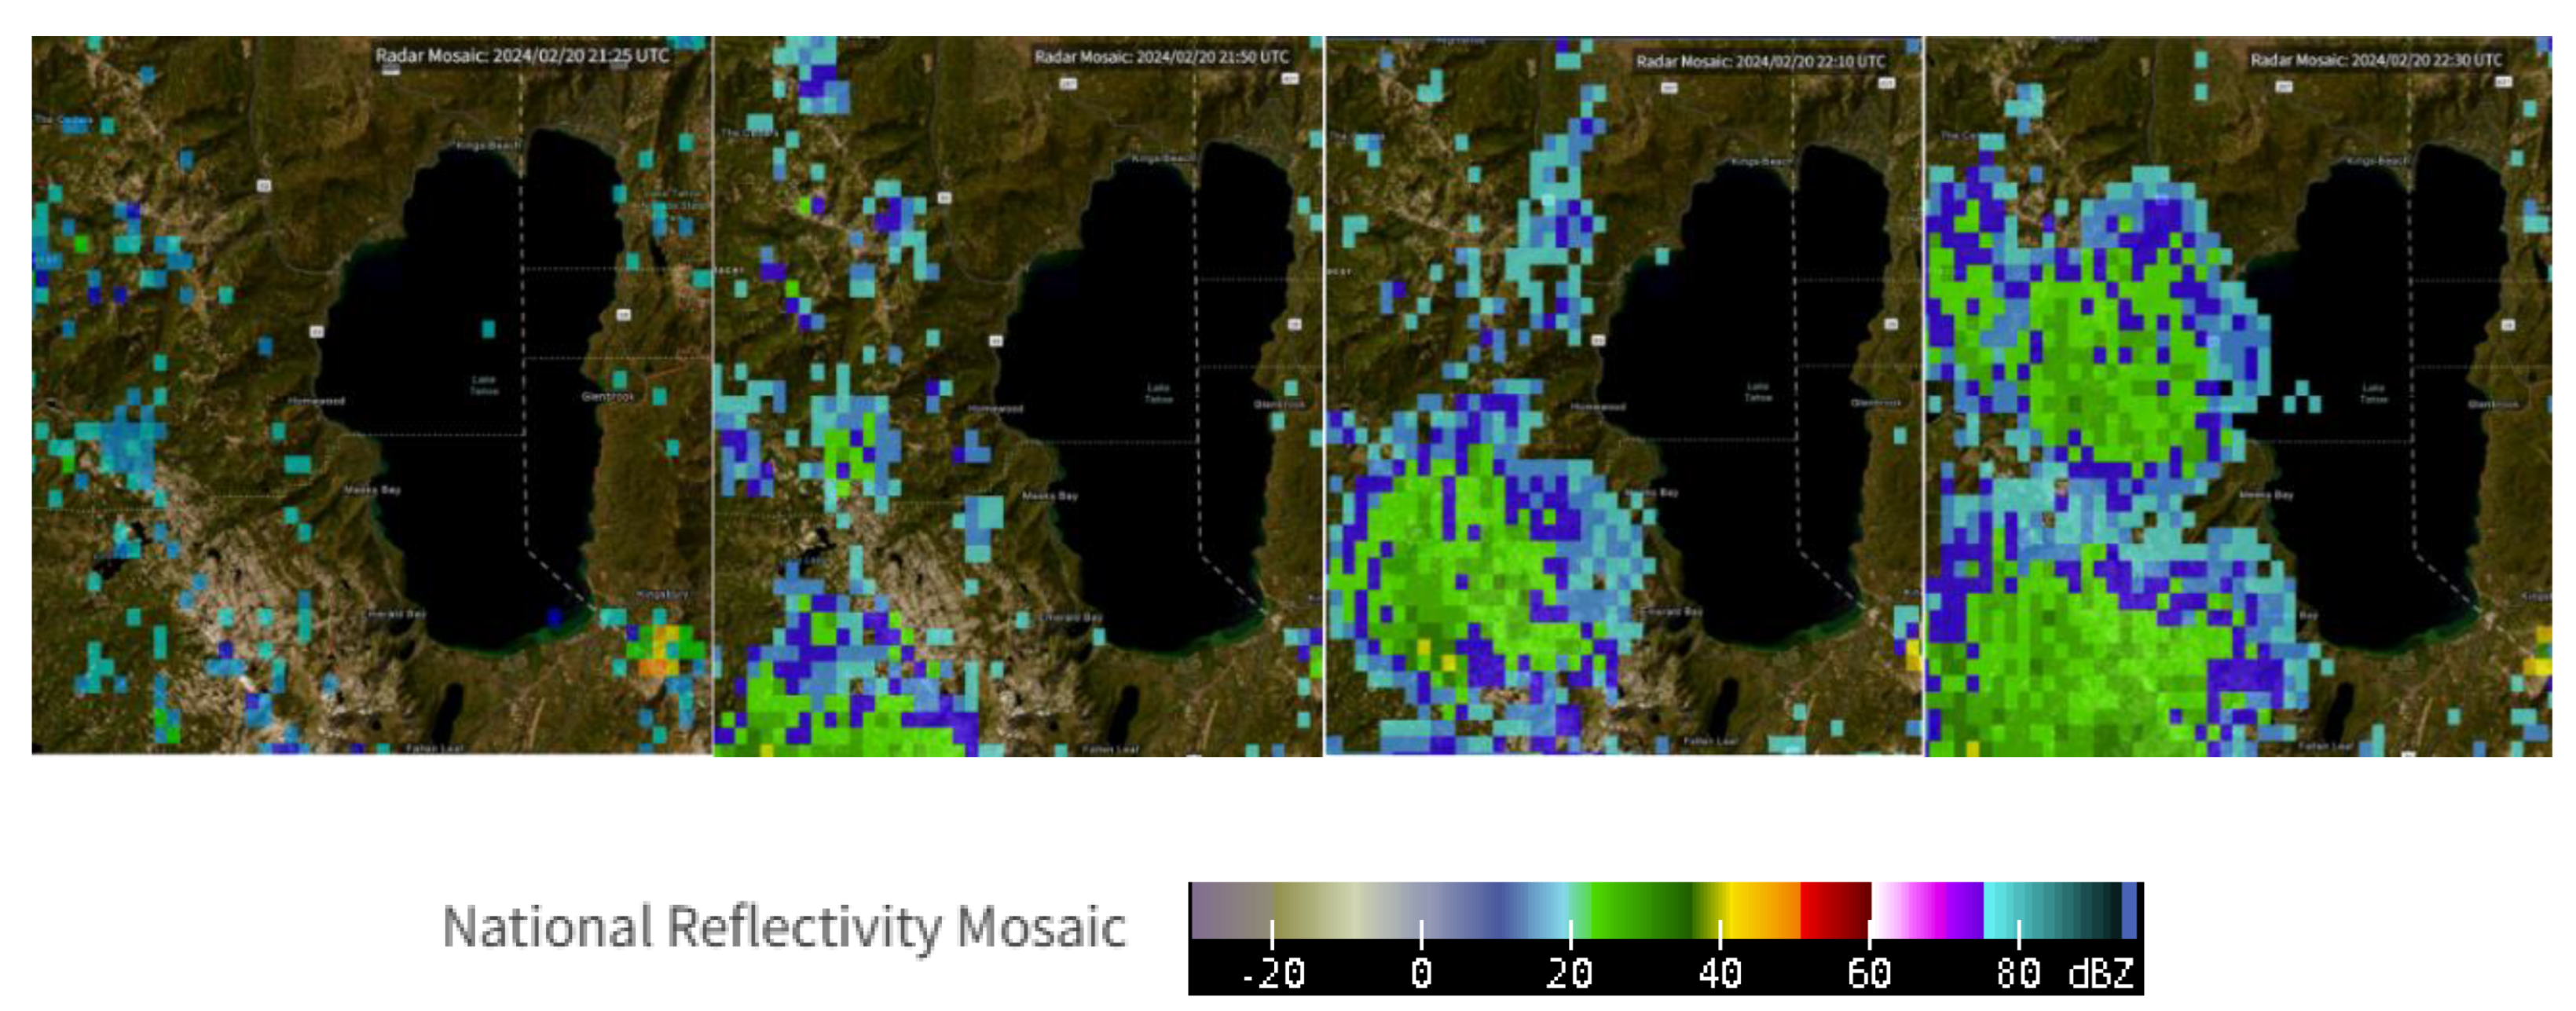
Figure 7.
Same as Figure 3, but for February 1, 2024, at 18:16 UTC.
Figure 7.
Same as Figure 3, but for February 1, 2024, at 18:16 UTC.
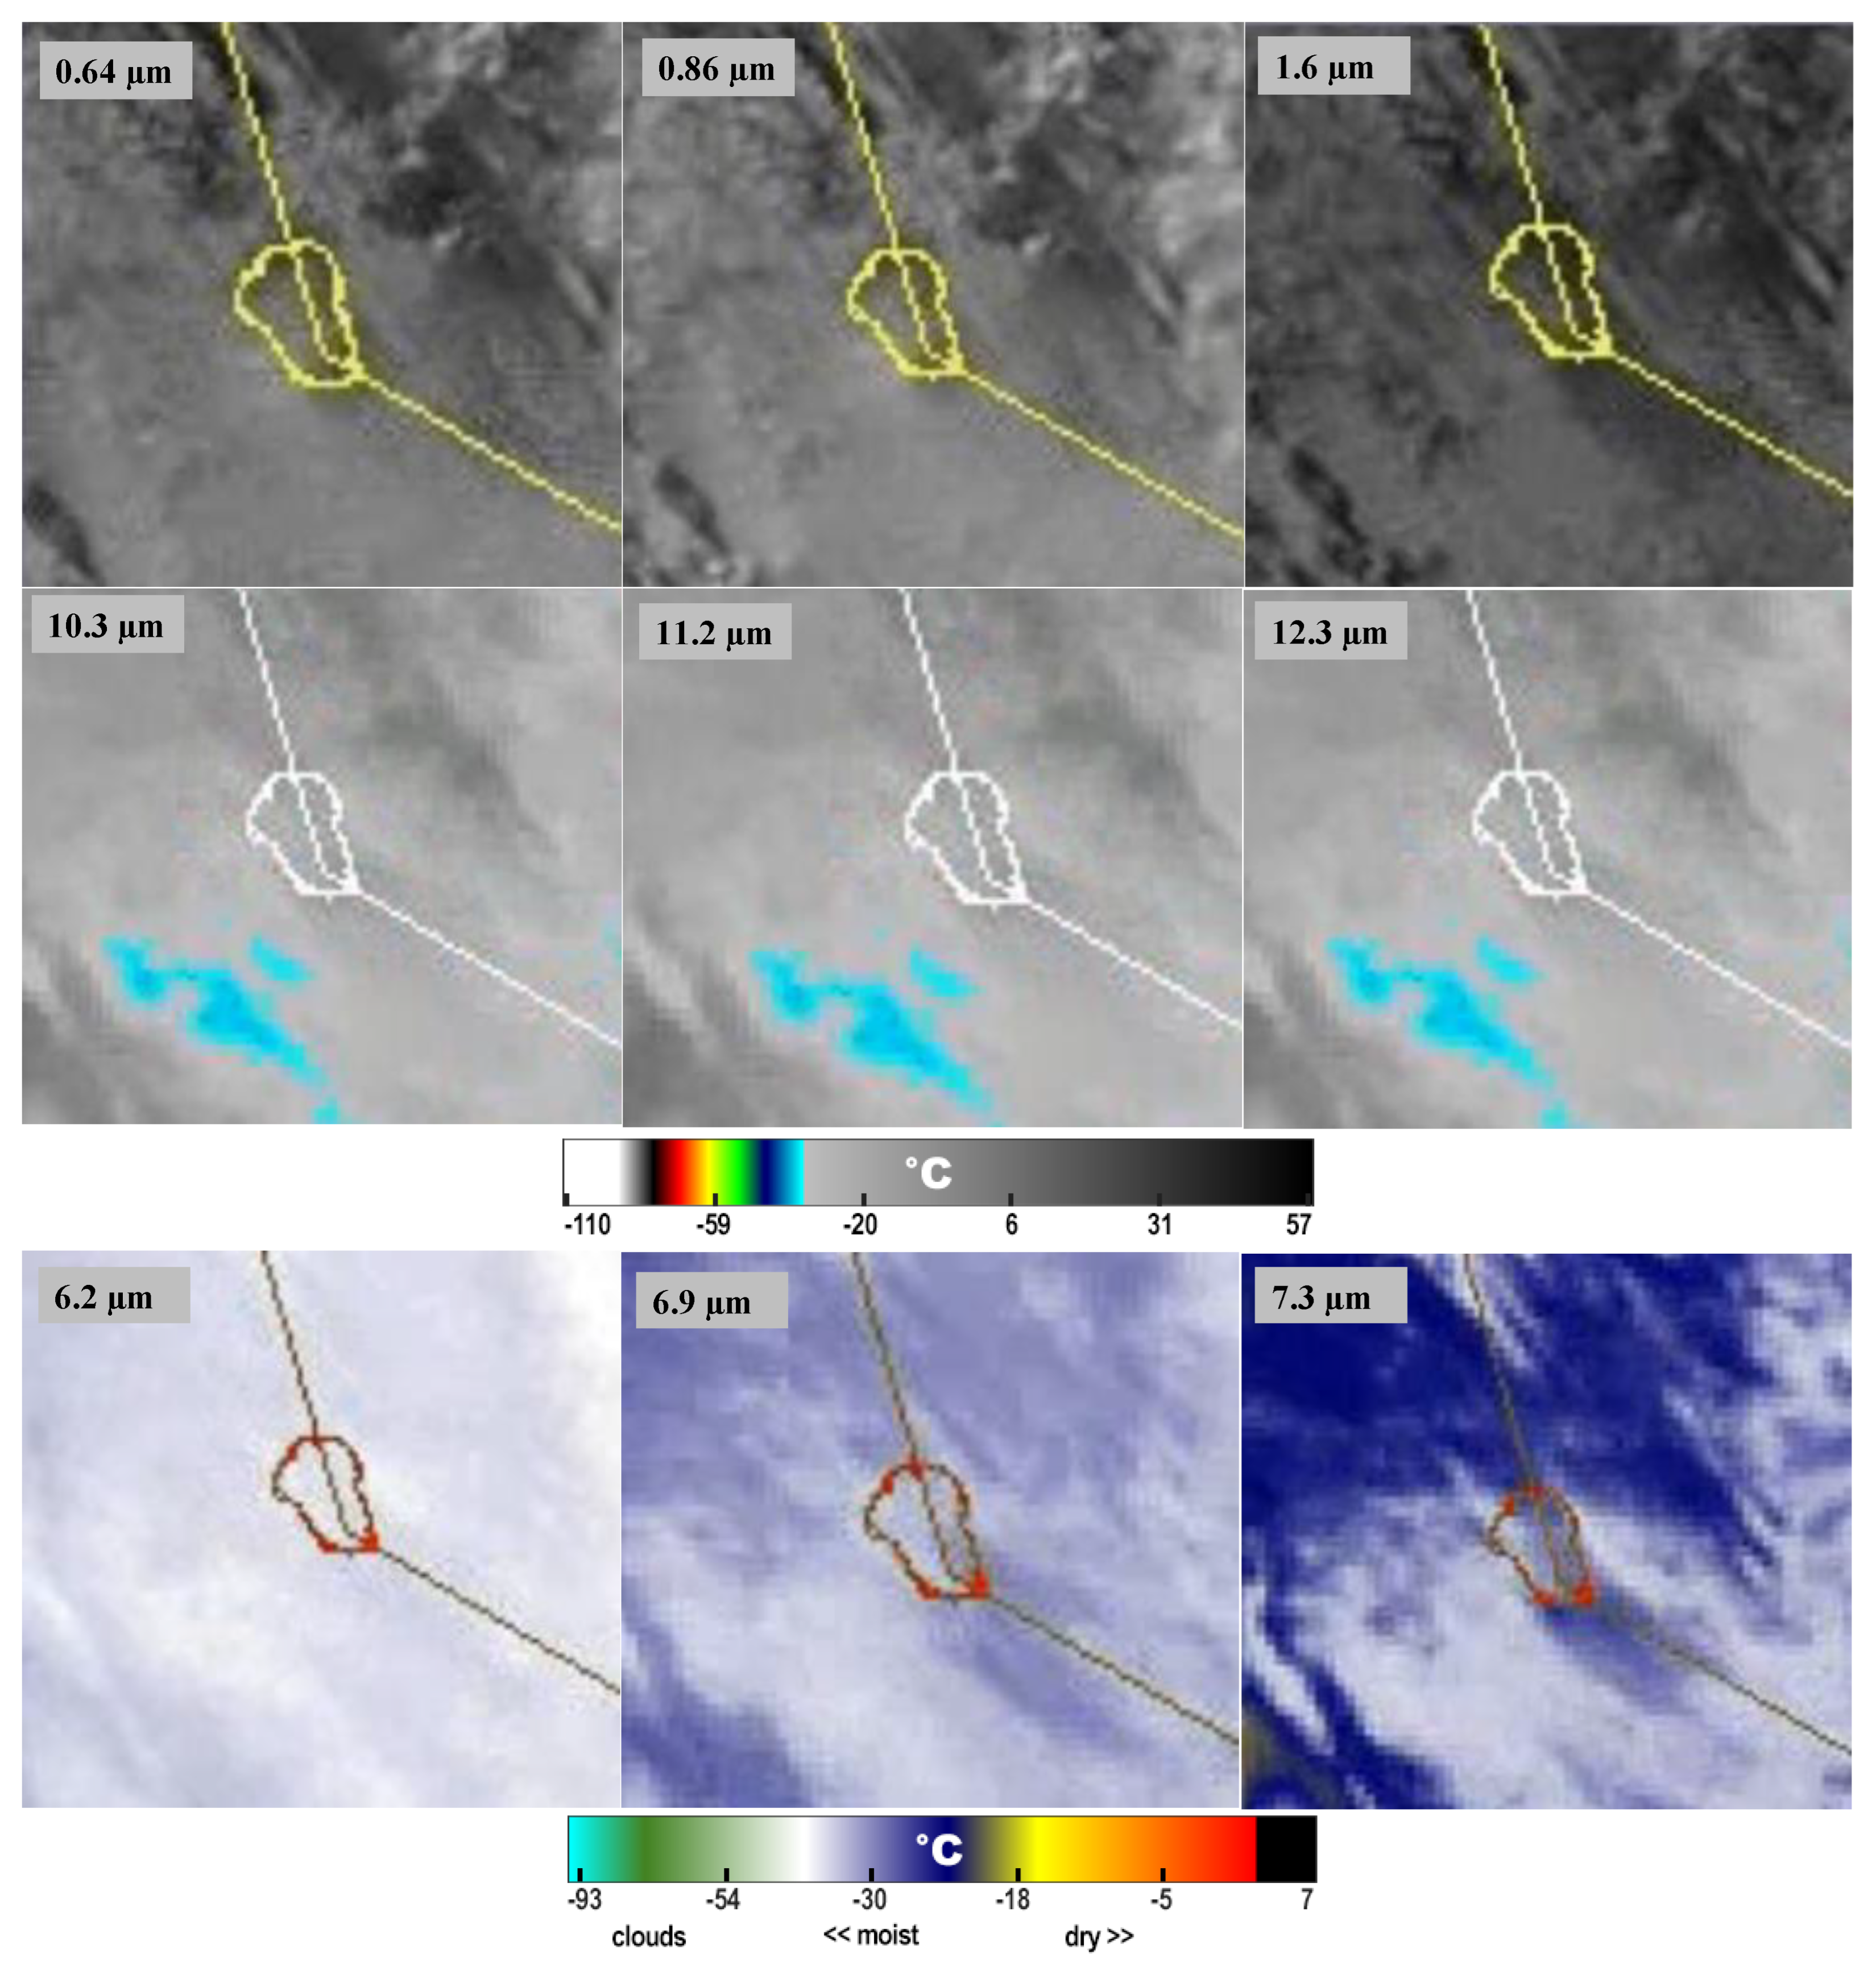
Figure 8.
Same as Figure 4, but for February 1, 2024, showing data at 17:25, 18:15, 18:35, and 18:55 UTC.
Figure 8.
Same as Figure 4, but for February 1, 2024, showing data at 17:25, 18:15, 18:35, and 18:55 UTC.
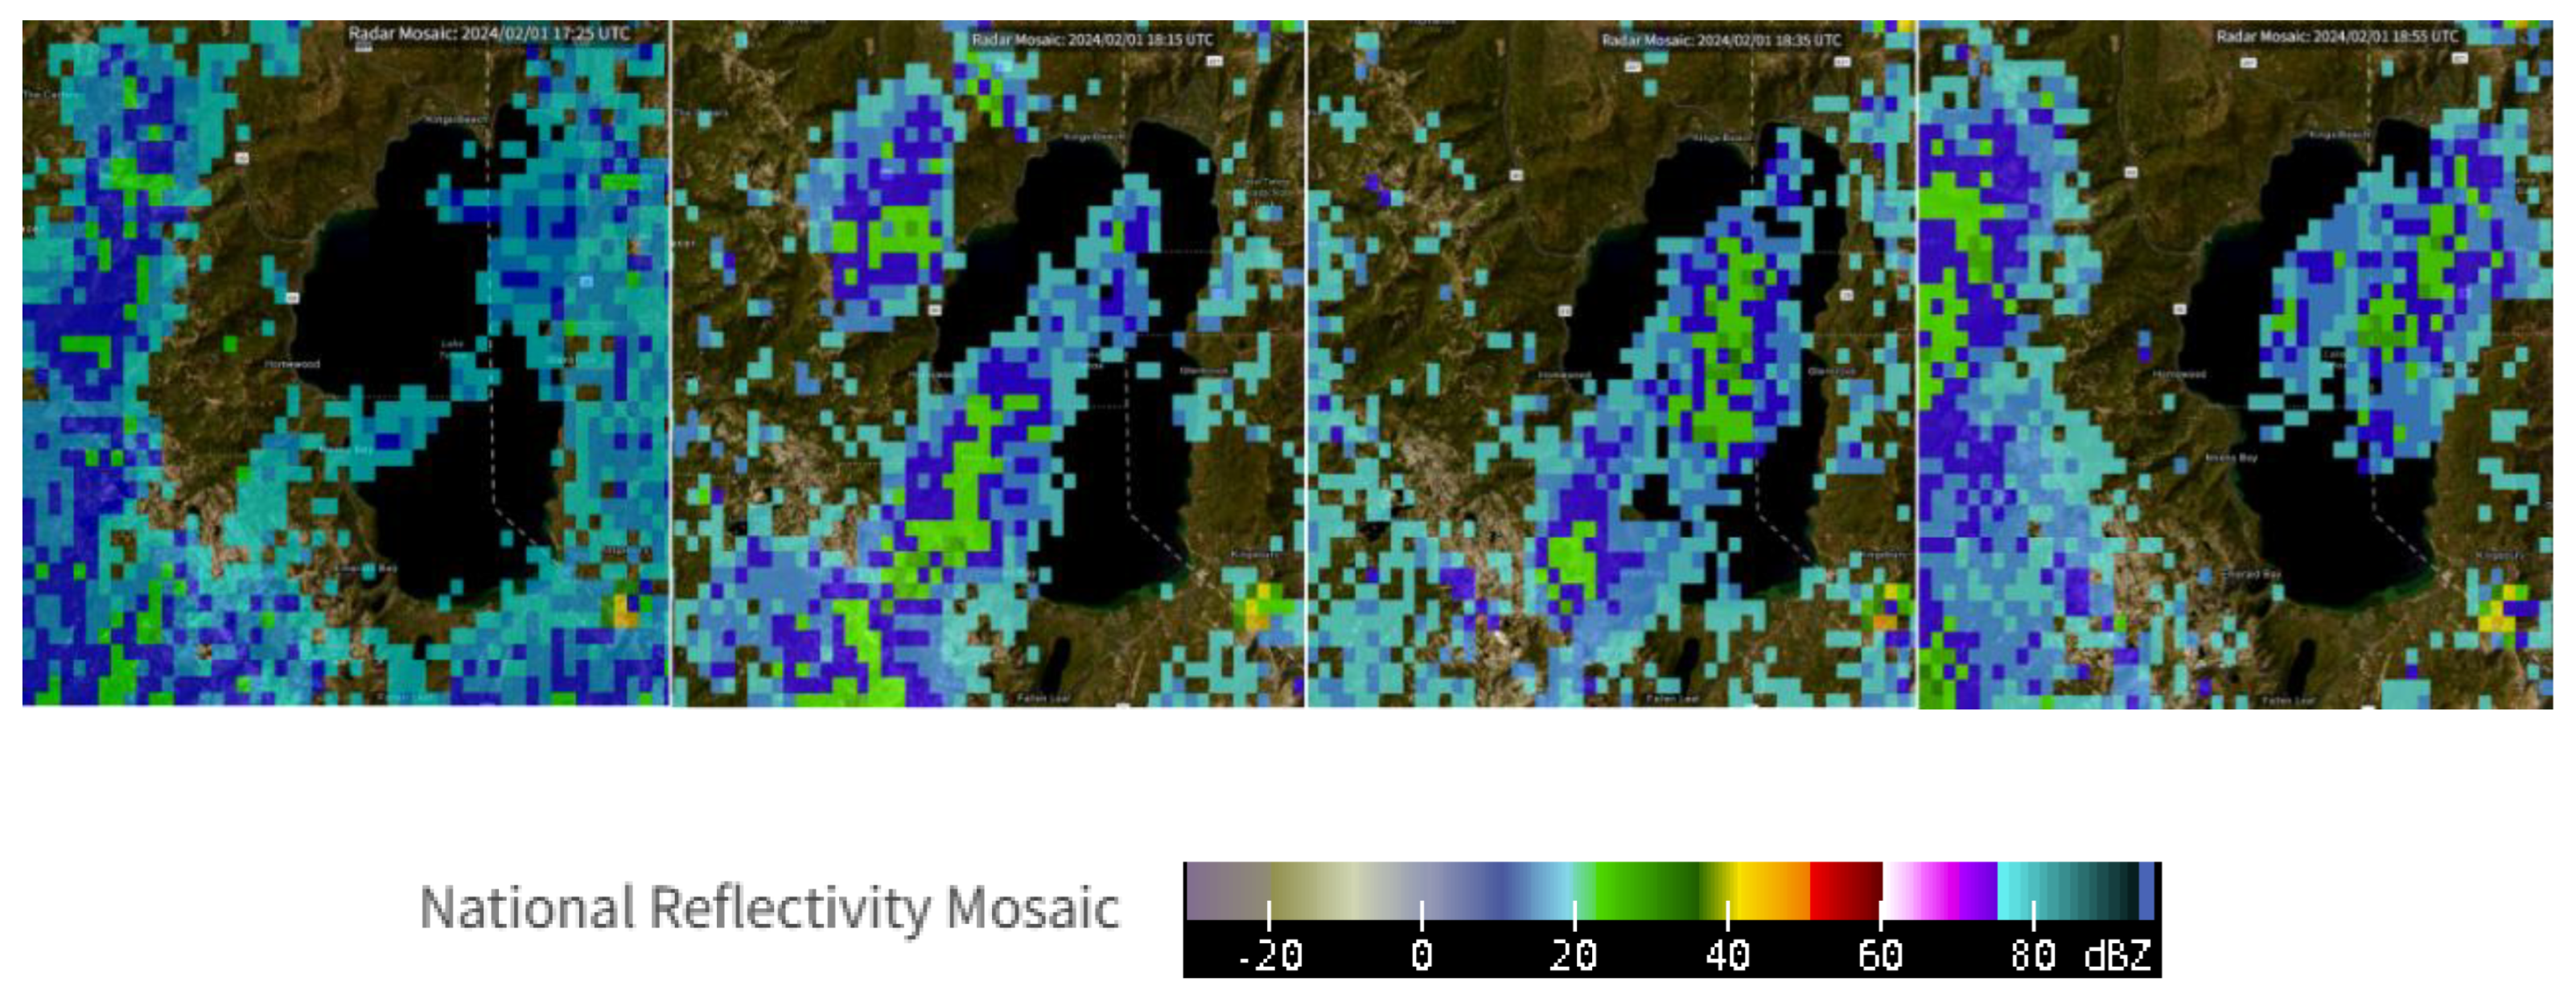
Figure 9.
Same as Figure 3, but for April 4, 2024, at 23:21 UTC.
Figure 9.
Same as Figure 3, but for April 4, 2024, at 23:21 UTC.
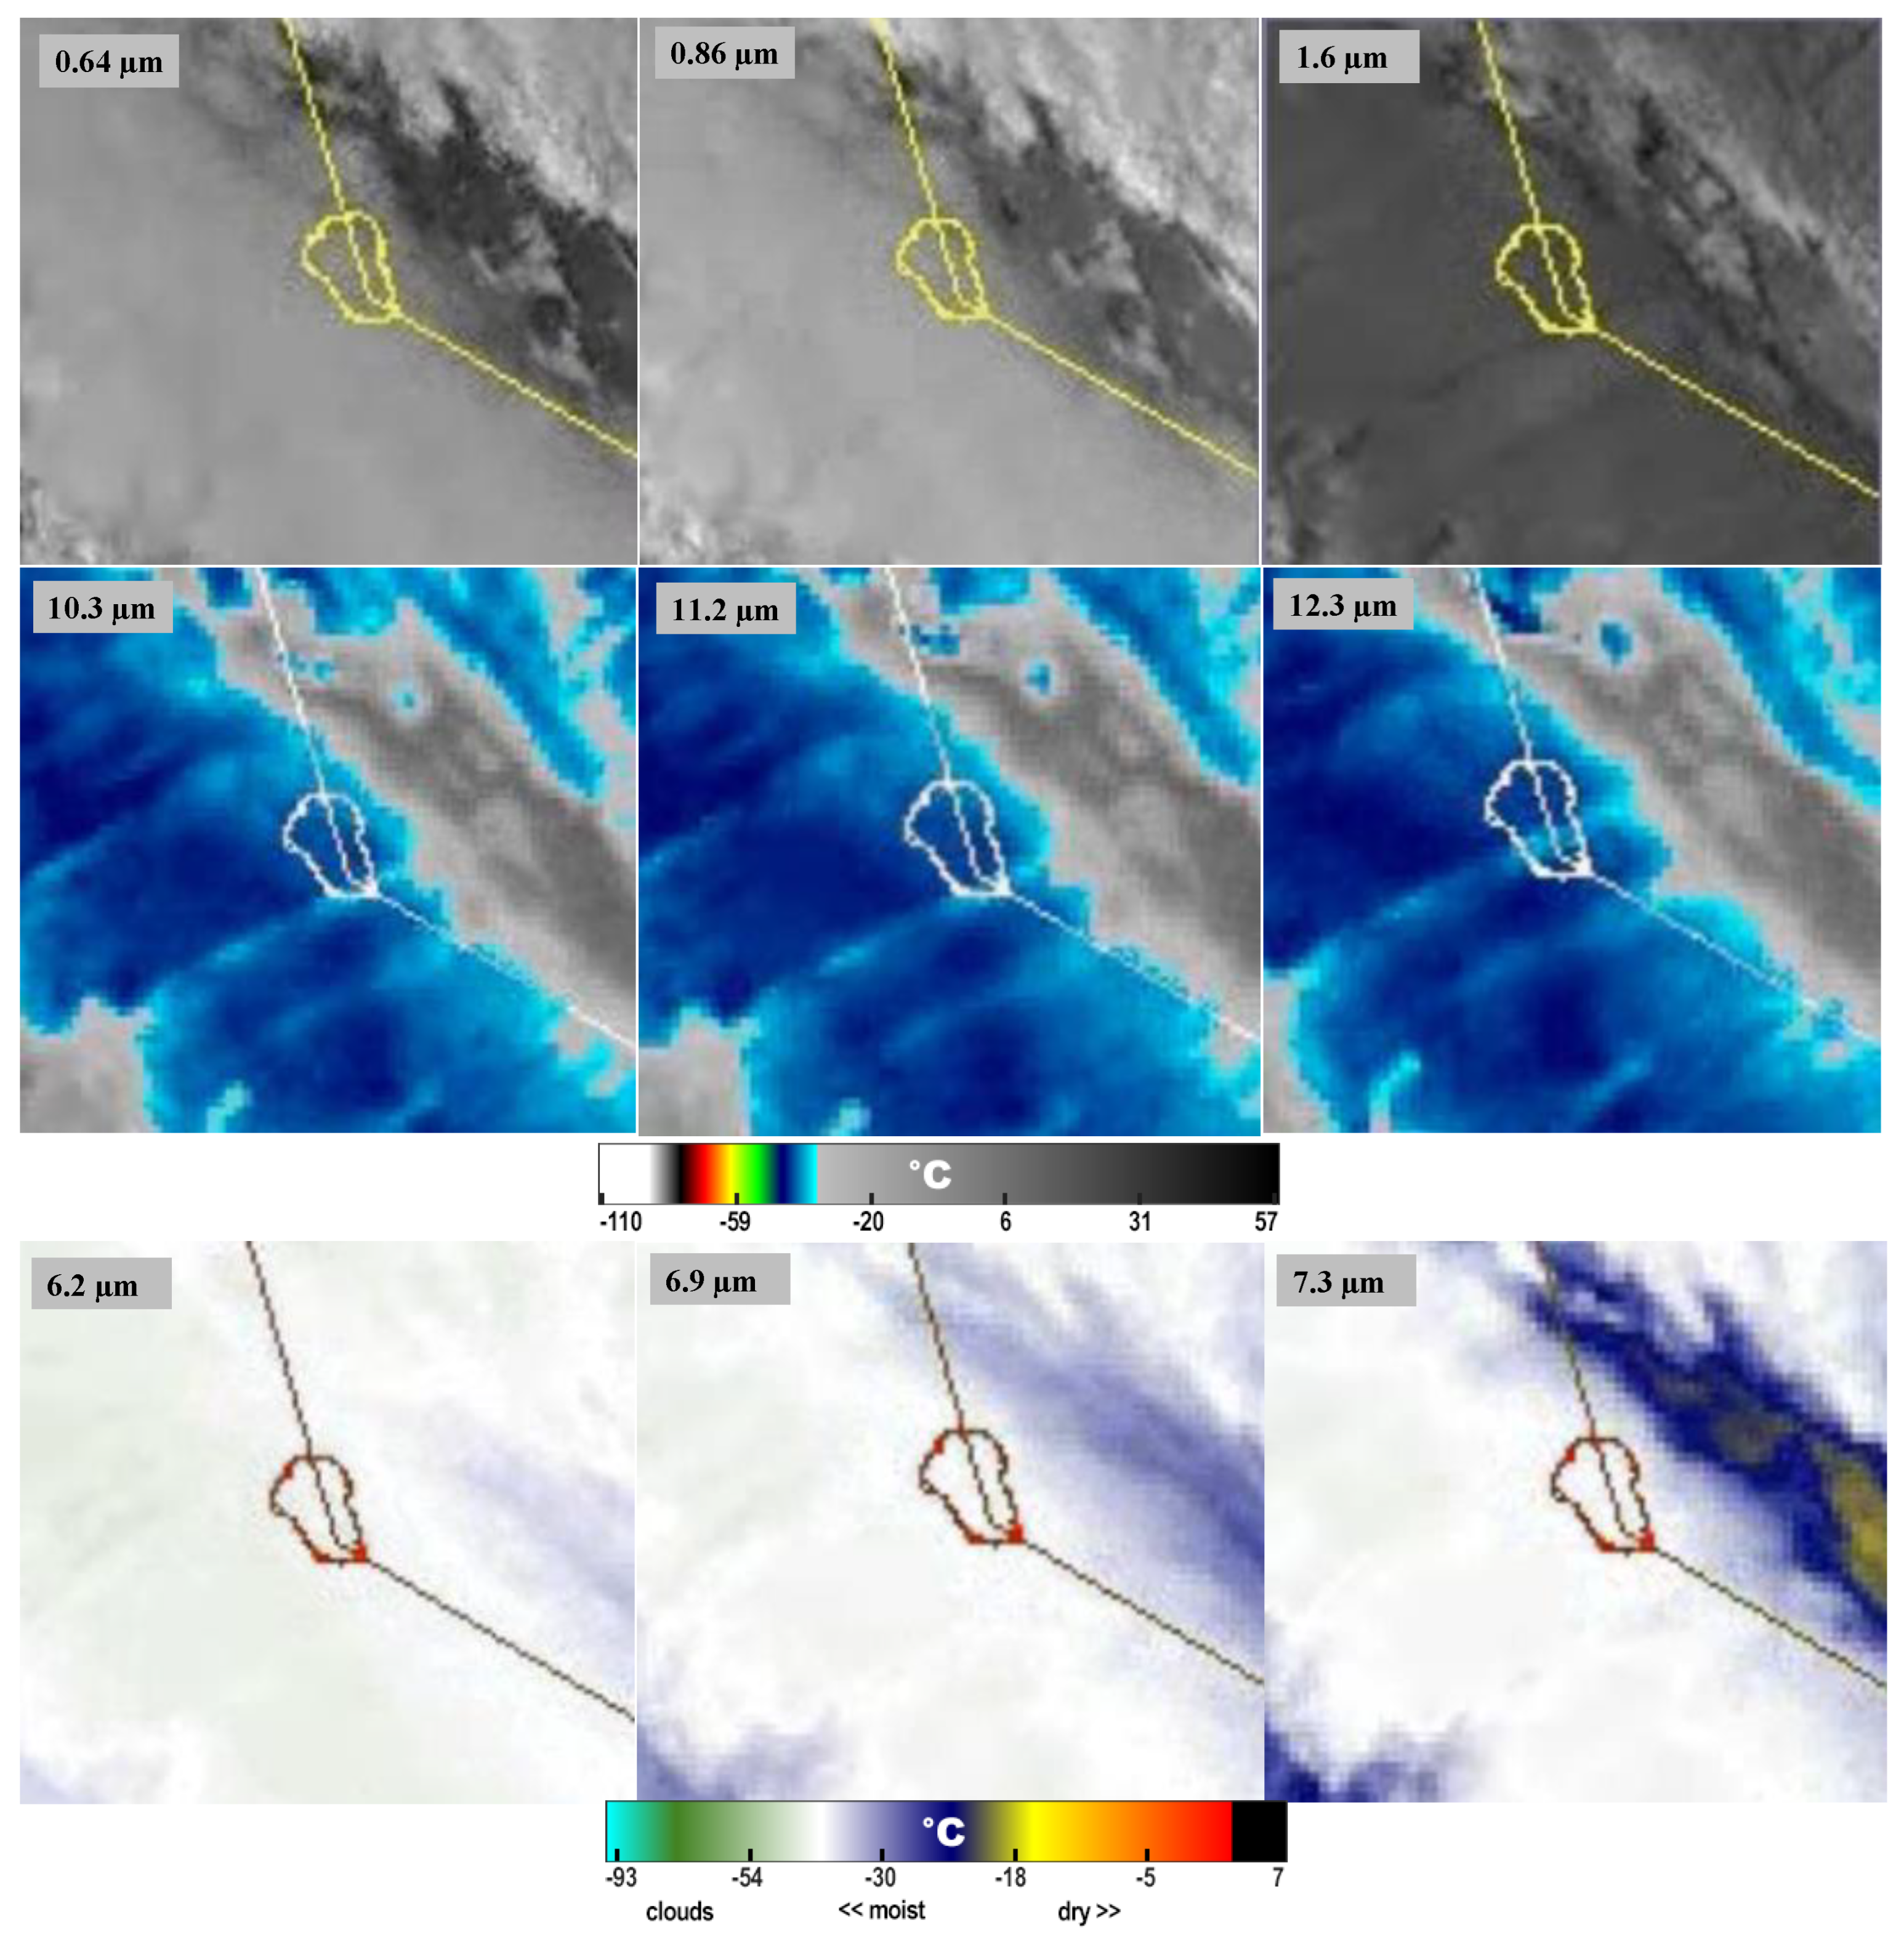
Figure 10.
Same as Figure 4, but for April 4, 2024, showing data at 18:00, 23:00, 23:20, and 23:40 UTC.
Figure 10.
Same as Figure 4, but for April 4, 2024, showing data at 18:00, 23:00, 23:20, and 23:40 UTC.
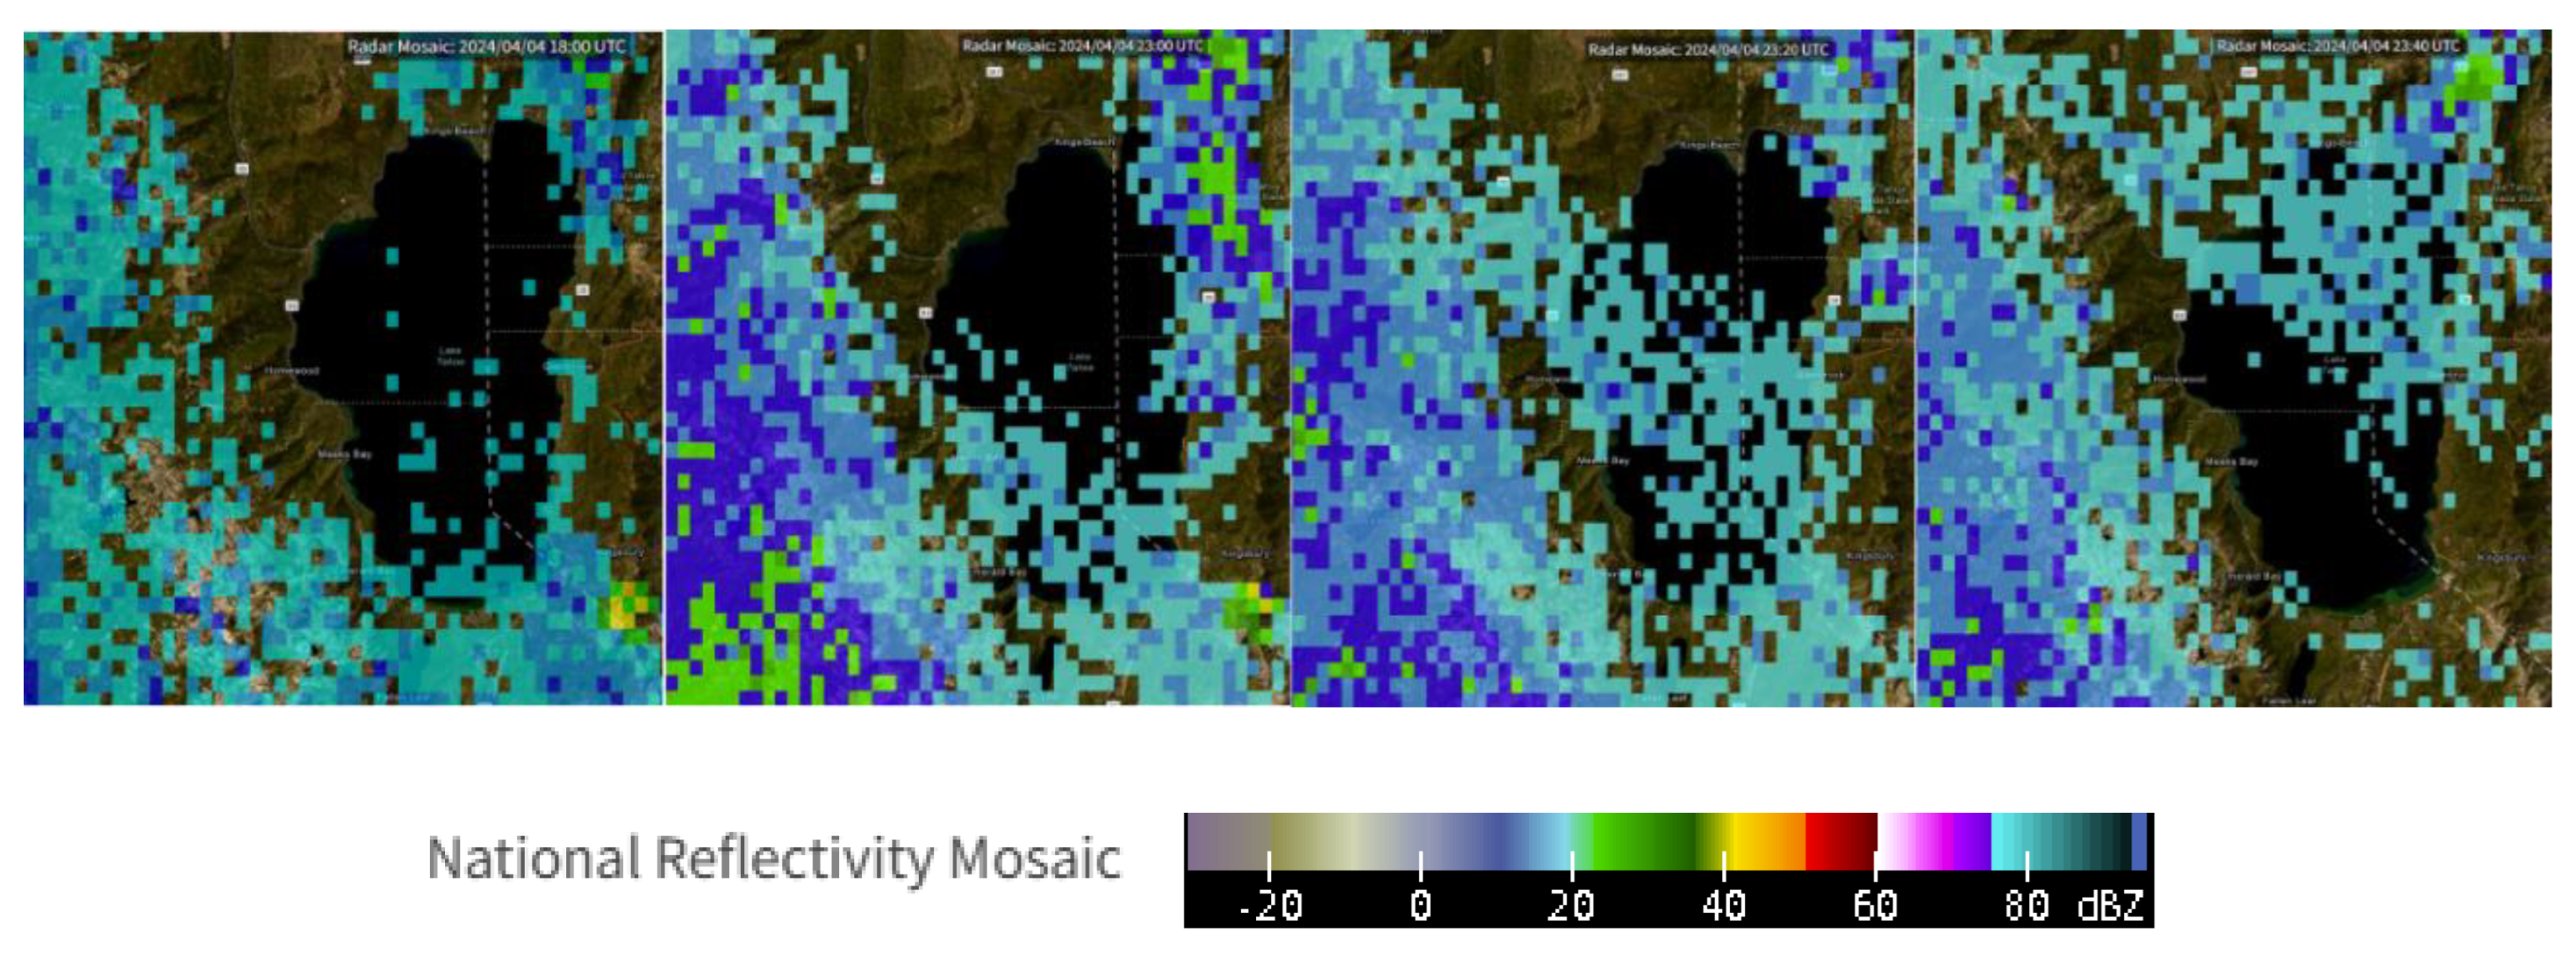

Table 1.
GOES Advanced Baseline Imager (ABI) Channels used in this study, including their approximate central wavelength (μm), respective maximum spatial resolution (km), and the cloud properties analyzed.
Table 1.
GOES Advanced Baseline Imager (ABI) Channels used in this study, including their approximate central wavelength (μm), respective maximum spatial resolution (km), and the cloud properties analyzed.
| Channel Number | Central Wavelength (µm) | Type | Highest Spatial Resolution (km) | Cloud Property to Detect |
|---|---|---|---|---|
| 2 | 0.64 | Visible (Red Band) | 0.5 | Cloud optical depth and thickness, Ice and liquid water path |
| 3 | 0.86 | Near-Infrared | 1 | Cloud particle size, Cloud optical depth and thickness |
| 5 | 1.6 | Near-Infrared | 1 | Cloud phase, Cloud particle size |
| 8 | 6.2 | Infrared (Water Vapor) | 2 | Water vapor content |
| 9 | 6.9 | Infrared (Water Vapor) | 2 | Water vapor content |
| 10 | 7.3 | Infrared (Water Vapor) | 2 | Water vapor content |
| 13 | 10.3 | Infrared (Window) | 2 | Cloud phase, Cloud top temperature, Ice and liquid water path |
| 14 | 11.2 | Infrared (Window) | 2 | Cloud top temperature, Precipitation potential |
| 15 | 12.3 | Infrared (Window) | 2 | Ice and liquid water path, Precipitation potential |
Table 2.
Summary of Meteorological Conditions During Cloud Seeding Operations.
| Location | Date | Air Temperature | RH | Wind Direction | Wind Speed | Wind Gust |
|---|---|---|---|---|---|---|
| (ºC) | (%) | (deg) | (mph) | (mph) | ||
| Ruby | 16-Feb-25 | -1 | 94 | 224 | 5 | 11 |
| 13-Jan-24 | -1 | 79 | 190 | 13 | 18 | |
| 3-Jan-24 | -1 | 94 | 268 | 4 | 7 | |
| 2-Jan-24 | 0 | 56 | 198 | 2 | 7 | |
| Santa Rosa | 1-Mar-24 | -2 | 57 | 195 | 5 | 13 |
| 13-Jan-24 | -1 | 88 | 213 | 7 | 16 | |
| 3-Jan-24 | 4 | 73 | 230 | 2 | 8 | |
| 2-Jan-24 | 2 | 65 | 337 | 2 | 5 | |
| Tahoe | 16-Feb-25 | -1 | 96 | 208 | 12 | 21 |
| 11-Nov-24 | -2 | 96 | 235 | 14 | 24 | |
| 20-Feb-24 | -3 | 96 | 195 | 13 | 17 | |
| 4-Apr-24 | -6 | 91 | 223 | 14 | 29 | |
| 1-Feb-24 | -3 | 96 | 195 | 10 | 21 |
Disclaimer/Publisher’s Note: The statements, opinions and data contained in all publications are solely those of the individual author(s) and contributor(s) and not of MDPI and/or the editor(s). MDPI and/or the editor(s) disclaim responsibility for any injury to people or property resulting from any ideas, methods, instructions or products referred to in the content. |
© 2025 by the authors. Licensee MDPI, Basel, Switzerland. This article is an open access article distributed under the terms and conditions of the Creative Commons Attribution (CC BY) license (http://creativecommons.org/licenses/by/4.0/).
Copyright: This open access article is published under a Creative Commons CC BY 4.0 license, which permit the free download, distribution, and reuse, provided that the author and preprint are cited in any reuse.


