
Submitted:
14 July 2025
Posted:
15 July 2025
You are already at the latest version
Abstract
Background and Objective: Pediatric obesity negatively impact metabolic and musculoskeletal health, particularly muscle quality and function. Ultrasound-derived measures like muscle thickness and echo intensity, combined with body composition data, provide a more comprehensive assessment of muscle status in this population. The purpose of our study was to examine the relationship between anthropometric measurements, muscle strength, bioelectrical impedance estimations, with ultrasound-derived indicators such as subcutaneous fat and quadriceps femoris thickness, and muscle quality through EI. Methods: This cross-sectional study included Hispanic children aged 6 to under 18 years with overweight or obesity (BMI ≥ 85th percentile per CDC standards). Participants were recruited consecutively from outpatient visits. All eligible children were invited for a standardized nutritional assessment, and those who consented were included. Results: The study included 294 children and adolescents (153 boys, 141 girls) with overweight or obesity, showing significant sex differences in anthropometric and body composition variables. Girls had higher intramuscular adipose tissue (IMAT), while boys had more lean and musculoskeletal mass. Body fat percentage strongly correlated with muscle echo intensity (EI) and IMAT across sexes, with girls showing stronger associations; linear models identified body fat and BMI percentile as key predictors of muscle quality indicators. Conclusions: This study found that higher body fat in children and adolescents with overweight or obesity is linked to poorer muscle quality, especially increased echo intensity and intramuscular fat. Ultrasound proves useful for early, non-invasive detection of musculoskeletal changes, emphasizing the need to assess both muscle size and quality.
Keywords:
ultrasound
; POCUS
; echo intensity
; body composition
; childhood overweight
; obesity
1. Introduction
The global surge in pediatric obesity represents one of the most pressing public health concerns of the 21st century. The implications of excess adiposity extend beyond metabolic disturbances, increasingly implicating musculoskeletal health, particularly muscle quality and function.(1, 2, 3) Body composition alterations assessed via bioelectrical impedance analysis (BIA) or dual energy X-ray absorptiometry (DXA) – particularly excess fat mass and changes in fat-free mass – have profound effects on the development, architecture, and functionality of skeletal muscle in children and adolescents with obesity.(1, 4, 5, 6) Recent advances in imaging technologies, particularly ultrasound, have facilitated non-invasive, radiation-free assessments of muscle morphology and quality through parameters such as muscle thickness (MT) and echo intensity (EI).(1, 3, 7) These ultrasound-derived indicators are gaining recognition as valuable tools for investigating obesity-related musculoskeletal alterations and for evaluating early risk factors for sarcopenic obesity.(2)
Muscle thickness, as assessed by B-mode ultrasound, correlates strongly with muscle cross-sectional area and volume, making it a reliable surrogate of muscle mass in both adult and pediatric populations.(8, 9, 10) Likewise, echo intensity – a grayscale measure of tissue composition – has emerged as a proxy for muscle quality, with higher EI values typically reflecting increased intramuscular fat and fibrotic infiltration.(5, 11, 12, 13) This qualitative degeneration has been linked to diminished strength, impaired function, and poor metabolic outcomes.(4, 6, 14) Importantly, in children and adolescents with obesity, the interpretation of EI is confounded by factors such as subcutaneous adipose tissue (SAT) thickness, signal attenuation, muscle hydration, and operator-dependent variability, raising important methodological and clinical questions.(15, 16, 17, 18). Several studies have established that pediatric obesity is associated with increased visceral and intramuscular fat depots, contributing to metabolic derangements and muscle dysfunction.(19, 20, 21) Studies using cross-sectional and longitudinal designs have consistently demonstrated that increased EI is associated with poorer muscle performance, reduced cardiorespiratory fitness, and higher cardiometabolic risk factors.(19, 22, 23, 24, 25) Ultrasound has also shown promise in detecting early structural muscle impairments in obese children even before over functional declines become evident.(26, 27, 28, 29) Research in diverse pediatric cohorts – including those with metabolic syndrome, non-alcoholic fatty liver disease (NAFLD), and insulin resistance – has further corroborated the link between EI and systemic metabolic disturbances.(30, 31, 32, 33). The predictive validity of EI is supported by intervention studies showing that weight loss and resistance training can lead to measurable reductions in EI and improvements in strength and insulin sensitivity.(34, 35, 36) Despite this, methodological heterogeneity persists. Factors such as image acquisition technique, probe frequency, region of interest selection, and tissue hydration status can all influence EI values. Therefore, interpretation should be made in the context of standardized imaging protocols.(37, 38, 39)
While muscle thickness has a more intuitive relationship with muscle volume and physical development, its utility in pediatric obesity is nuanced. Increased MT in children with obesity does not necessarily equate to greater function or metabolic benefit, as the presence of fat infiltration can obscure the relationship between size and quality.(40, 41, 42) The combined interpretation of MT and EI offers a more comprehensive approach for assessing muscle status; however, its role in association with body composition measurements in this population is scarce. The purpose of our study was to examine the relationship between anthropometric measurements, muscle strength, bioelectrical impedance estimations, with ultrasound-derived indicators such as subcutaneous fat and quadriceps femoris thickness, and muscle quality through EI.
2. Materials and Methods
Study Design and Participants
This cross-sectional study was conducted at the Instituto Nacional de Pediatría in Mexico City. Eligible participants were Hispanic children, both male and female, aged 6 < 18 years, with overweight or obesity, defined as a body mass index-for-age and sex at or above the 85th percentile according with CDC standards. Participants were selected using a non-probabilistic, consecutive sampling approach. Recruitment took place between July 11, 2024, and April 15, 2025, among patients with scheduled outpatient visits to the institute. All eligible individuals attending during this period were invited to participate in a standardized nutritional assessment, and those who consented were included in the study. Exclusion criteria included a diagnosis of metabolic disorders other than overweight and obesity, recent trauma or surgery involving the lower limbs, short stature for age, or current medical or pharmacological treatment of any kind.
Anthropometric Measurements
All participants underwent a standardized anthropometric evaluation during a single outpatient visit. Twelve kinanthropometric variables, as defined by the International Society for the Advancement of Kinanthropometry (ISAK)(43), , were measured on the right side of the body. All measurements were conducted by two ISAK-certified Level I kinanthropometrists. The assessed variables included body weight, height, neck circumference, wrist circumference, relaxed and flexed mid-upper arm circumference, waist circumference, hip circumference, mid-thigh circumference, and mid-calf circumference. Body weight was measured in fasting participants wearing minimal clothing using a calibrated digital scale (SECA, Hamburg, Germany) to the nearest 0.1 kg. Height was measured with a stadiometer to the nearest 0.1 cm. Circumferences were measured in a plane orthogonal to the long axis of each body segment using a non-elastic fiberglass measuring tape, following standardized anatomical landmarks, and recorded to the nearest 0.1 cm. Neck circumference was measured immediately superior to the thyroid cartilage and perpendicular to the long axis of the neck, wrist circumference was measured with the participant holding the anterior surface of the right wrist upward, placing the tape distal to the prominences of the ulnar and radial bones without applying pressure, relaxed mid-upper arm circumference was measured at the level of the marked mid-acromiale–radiale site, thight mid-upper arm circumference was measured as the maximum girth of the right upper arm with the arm raised anteriorly to the horizontal and the forearm flexed at 90° to the upper arm, waist circumference was measured midway between the lowest rib and the top of the iliac crest at the end of a normal expiration, hip circumference was measured at the level of the greatest posterior prominence of the buttocks, perpendicular to the trunk’s long axis, mid-thigh circumference was measured perpendicular to the long axis of the thigh at the marked mid-trochanterion–tibiale laterale site, mid-calf circumference was measured at the level of the greatest circumference of the calf.
Body mass index (BMI) was calculated as weight in kilograms divided by height in meters squared (kg/m²), and BMI-for-age percentiles were determined using age- and sex-specific reference data from the Centers for Disease Control and Prevention (CDC) growth charts.(44) Skinfold thickness was measured at marked anatomical sites using a Harpenden skinfold caliper, recorded to the nearest 0.1 mm. The triceps skinfold was measured at the midline of the posterior upper arm at the mid-acromiale–radiale landmark, while the subscapular skinfold was measured 2 cm along a line running laterally and obliquely downward at a 45° angle from the subscapulare landmark.(43) Each site was measured in triplicate, and the mean value was used for analysis. The sum of skinfolds was calculated by adding the triceps and subscapular values. Muscle strength was assessed using a Jamar hydraulic hand dynamometer (Jamar model J00105, Lafayette Instrument Company, USA; capacity 90 kg; weight 727 g) for the upper limbs and a back and leg dynamometer for the lower limbs (Takei 5002 Analogue, Takei Company, Japan; capacity 0–300 kg; weight 3.7 kg). Each participant performed two maximal voluntary contractions in a standardized position, and the highest value was recorded.
Body Composition
Body composition was measured using multifrequency bioelectrical impedance analysis (BIA) with a tetrapolar InBody S10 device (Model JMW140, Biospace Co., Ltd., Seoul, Korea), according to the manufacturer’s instructions. Measurements were conducted with participants in a fasted state and under standardized hydration conditions and in supine position.
Ultrasonographic Assessment
Ultrasound images of the assessment of the quadriceps femoris muscle (Figure 1, panel A) were acquired using a portable B-mode imaging device (GE Healthcare, Ultrasound Venue System) equipped with a 40-mm linear array probe, set to a frequency of 7.5 MHz, 80 mm scanning depth (adjusted in cases of greater subcutaneous fat), 70 dB gain, and maximum brightness and contrast. The scanning depth was only increased when testing participants with greater subcutaneous fat to allow for capturing enough muscle area. A high-frequency linear-array transducer was utilized for most of the assessments. In cases where full visualization of the muscle boundaries was not achievable due to excessive subcutaneous adiposity, a low-frequency convex transducer was employed to improve tissue penetration and ensure adequate delineation of muscle architecture. All acquisitions were performed with the participant in a supine position, with the right thigh exposed and the transducer placed transversely over the distal third of the thigh (midway between the anterior superior iliac spine and the superior margin of the patella). A clinical-grade water-based gel was applied to ensure adequate acoustic coupling. Triplicate static images were acquired from each subject under standardized conditions
Echo-intensity analysis (Figure 1, panel B) was performed using ImageJ software (version 1.54g, National Institutes of Health, USA). The largest visible cross-sectional area of the rectus femoris was manually defined using the oval selection tool. Within the defined region of interest (ROI), the echo-intensity (EI) was computed as the mean gray-scale value from a histogram ranging from 0 (black) to 255 (white). To improve the reproducibility and efficiency of image processing, a custom macro script was developed and executed within the software platform. This macro automated the standardized application of a reference ROI to all images, extraction of grayscale histogram parameters (mean, standard deviation, area, minimum, maximum), and batch exportation of results into a structured .csv file. Additionally, the macro generated visual representations of histograms for each image, allowing consistent placement of ROIs and minimizing inter-operator variability. All images and measurements were independently reviewed by two trained evaluators. To control for potential confounding effect of the subcutaneous fat on muscle EI, a corrected echo-intensity variable was derived using a previously validated formula, adjusting EI values according to SAT thickness.(45) All measurements were performed by trained personnel using calibrated instruments and standardized protocols to ensure consistency and reliability.
Statistical Analysis
Quantitative data were described as mean ± SD or mean (95% confidence interval). Categorical data were expressed as frequency (percentage). Kolmogorov-Smirnov test was used to determine the normality of the distribution. To compare whether there were differences between males and females Anthropometric, body composition and ultrasonographic measurements were compared using t-test for parametric variables, or Mann-Whitney U-test for non-parametric variables. Correlation analyses were performed using Pearson correlation coefficient. Linear regression analysis was performed to evaluate the associations of anthropometrics and body composition variables with intramuscular adipose tissue and echo intensity. To adjust the analyses and minimize bias the covariates age and sex were added to the model. All statistical analysis was performed using IBM SPSS Statistics for Macintosh (version 31.0.0.0, Armonk, NY: IBM Corp), and the level of significance was set at α ≤ 0.05.
3. Results
The study included 294 participants (153 boys and 141 girls). Mean age was 11.2 ± 2.69 years without differences by sex (p = 0.351) 83.7% of the participants undergo obesity and 16.3% had overweight (Table 1). There were differences in anthropometric variables by sex group, with higher height and weight in the boys’ group. Obesity was more frequent among boys (83.7%), while girls had a higher prevalence of overweight (25.9%; p = 0.012). Among circumferential measurements, boys presented higher values in wrist, neck, tight mid-upper arm, mid-calf, and waist measurements (all p < 0.05), whereas hip circumference did not differ significantly between sexes. Skinfold measurements were largely similar, except for tight mid-upper arm skinfolds, which were higher in boys (p = 0.043).
In body composition estimations, boys showed greater soft lean mass, fat-free mass, musculoskeletal mass, bone mineral content, body cell mass, and total body water compared with girls (p < 0.05) (Table 1). Body fat percentage, visceral fat area, and phase angle did not differ significantly between sexes.
Muscle ultrasound assessments indicated comparable quadriceps muscle thickness and subcutaneous adipose tissue thickness between boys and girls. However, girls exhibited significantly higher values of intramuscular adipose tissue (IMAT) percentage compared to boys (91.7 [108.6] % vs. 80.3 [79.9] %; p = 0.007) as shown in Table 1 and Figure 2, Panel A.
Correlation analyses (Table 2) identified significant associations between body composition parameters and muscle ultrasound outcomes. In both sexes, body fat percentage correlated positively with EI corrected (boys: ρ = 0.49, p < 0.01; girls: ρ = 0.52, p < 0.01), EI uncorrected (boys: ρ = 0.47, p < 0.01; girls: ρ = 0.51, p < 0.01), and IMAT (boys: ρ = 0.50, p < 0.01; girls: ρ = 0.52, p < 0.01). In girls, BMI percentile demonstrated positive correlations with EI corrected (ρ = 0.38, p < 0.01), EI uncorrected (ρ = 0.36, p < 0.01), and IMAT (ρ = 0.38, p < 0.01). Associations between circumferential measurements and muscle ultrasound parameters were limited, although waist circumference correlated positively with EI corrected and IMAT in girls. Both tricipital and subscapular skinfolds were positively correlated with EI measures and IMAT across sexes. Conversely, soft lean mass, fat-free mass, and musculoskeletal mass were inversely correlated with EI and IMAT in both groups.
A positive relationship between body fat percentage and EI, was found in the linear analysis corrected (R² = 0.264) and uncorrected (R² = 0.242), as was shown in Figure 2, Panels A and B respectively, indicating that increased EI is associated with higher body fat, regardless of sex. Panel D shows a similar positive association between body fat percentage and IMAT (R² = 0.268). Girls contributed more data points at higher IMAT and body fat levels, consistent with the overall higher IMAT observed in this group. These findings reinforce the link between higher adiposity and elevated muscle ultrasound fat infiltration parameters.
Linear regression analyses (Table 3) identified body fat percentage as the principal predictor of EI corrected in boys (β = 0.57, 95% CI: 0.67 to 1.60, p < 0.001), explaining 31% of the variance (R² = 0.31). Among girls, BMI percentile (β = 0.56, 95% CI: 1.34 to 3.95, p < 0.001), subcutaneous adipose tissue thickness (β = 0.26, 95% CI: 0.09 to 1.02, p = 0.021), neck circumference (β = –0.67, 95% CI: –4.04 to –1.11, p < 0.001), and relaxed mid-upper arm circumference (β = 0.55, 95% CI: 0.40 to 3.10, p = 0.012) collectively explained 59% of the variance in EI corrected (R² = 0.59).
Comparable predictors emerged for EI uncorrected and IMAT. In boys, body fat percentage remained the primary determinant for EI uncorrected (β = 0.70, 95% CI: 0.94 to 1.77, p < 0.001) and IMAT (β = 0.57, 95% CI: 0.66 to 1.60, p < 0.001). In girls, BMI percentile and subcutaneous adipose thickness continued to be significant predictors of both EI uncorrected and IMAT, with R² values ranging from 0.51 to 0.59.
Analyses stratified by age group (Supplementary Table 1) revealed significant differences in anthropometric, body composition, and muscle ultrasound parameters between children and adolescents in both sexes. Adolescents presented higher values in height, weight, BMI, circumferential measures, indices of muscle mass, and strength assessments compared to children (p < 0.001 for all comparisons). Among girls, IMAT percentage and echo-intensity measures were significantly lower in adolescents compared to children (IMAT: 82.1 [108.6] % vs. 105.1 [85.4] %, p < 0.001). No significant differences in IMAT were observed between age groups in boys.
4. Discussion
This study evaluates the association between different anthropometric measurements, muscle strength and body composition estimations with ultrasound-derived indicators such as muscle thickness, proportion of IMAT and EI in a sample of Mexican children and adolescents with overweight or obesity. The reviewed literature confirms a consistent relationship between obesity-related alterations in body composition and muscle ultrasound parameters in children and adolescents. Muscle thickness (MT), a surrogate of muscle mass, has shown moderate to strong correlations with functional measures such as strength and physical performance across a variety of pediatric cohorts.(1, 2, 8, 10, 25, 28) Studies have demonstrated that increased adiposity—particularly VAT and SAT—is associated with changes in MT and, more prominently, with elevated EI, indicative of compromised muscle quality.(11, 13, 19, 27, 46)
One of the central insights from Akima et al.(46) is the role of VAT and age in predicting increased intramuscular adiposity, reflected by higher EI in abdominal and thigh musculature. This aligns with findings from Abe et al.(1), which highlight MT as a valid indicator of muscle cross-sectional area and strength capacity. These associations are echoed in both pediatric and adult populations but hold critical relevance in children due to the early onset of musculoskeletal decline linked to obesity and sedentary lifestyles.(14, 20, 26). Echo-intensity, while promising as a biomarker for muscle quality, presents interpretation challenges. EI values are influenced by several confounders including SAT thickness, probe pressure, gain settings, tissue hydration, and operator technique.(15, 18, 38, 39) Acuña-Pardo et al. and other groups(5, 7, 16) noted moderate predictive power of EI for muscle weakness and poor functional status in pediatric cohorts, emphasizing the need for combined assessments using MT, physical performance tests, and metabolic parameters. The reliability of ultrasound measurements across studies varied. While MT generally exhibited high intra- and inter-rater reliability(9, 10, 22), EI showed more variability, underscoring the importance of standardized imaging protocols and calibration.(12, 37, 38) Advances in ultrasound software and artificial intelligence may further improve measurement accuracy and reduce operator dependence.
Clinically, elevated EI in children with obesity has been linked to increased markers of systemic inflammation, insulin resistance, and hepatic steatosis, making it a useful surrogate for broader metabolic risk.(30, 31, 32, 33, 36) This is particularly critical in children exhibiting poor dietary habits, low physical activity, or established comorbidities. Integrating EI with body composition profiling may help identify children at risk for sarcopenic obesity, a condition defined by high fat mass and poor muscle quality.(13, 24, 42). Several intervention studies support the responsiveness of EI to treatment. Reductions in EI following structured exercise or nutritional interventions have been associated with improvements in muscle strength and metabolic outcomes.(34, 35, 36, 41) However, most of these findings are from small-scale or short-term studies, and larger longitudinal studies are needed to validate the prognostic utility of EI and MT. Despite these promising findings, several knowledge gaps persist. Normative values for EI in pediatric populations are limited, particularly across diverse ethnicities, pubertal stages, and disease phenotypes.(21, 30, 47) Few studies have systematically tracked ultrasound muscle parameters across time in relation to growth trajectories or chronic disease development. Moreover, while MT reflects structural adaptations, its functional implications are context-dependent and should not be interpreted in isolation.
Ultrasound-derived measurements of muscle thickness and echo-intensity provide valuable, non-invasive insights into the musculoskeletal and metabolic health of children and adolescents with obesity. Muscle thickness effectively represents muscle size, while echo-intensity serves as an indicator of muscle quality and functional potential, though interpretation requires caution due to influencing factors. Combined, these modalities hold promise for enhancing early detection, risk stratification, and personalized interventions in pediatric obesity. To fully leverage their utility, efforts toward standardization, expansion of normative reference data, and integration into clinical practice pathways remain crucial. Future research should focus on longitudinal analyses and integration of functional outcomes to establish the prognostic value of these ultrasound parameters and their role in guiding personalized interventions.
Several limitations should be considered when interpreting our findings. First, the cross-sectional design precludes any causal inference regarding the relationship between body composition and muscle ultrasound parameters. Longitudinal studies are necessary to determine temporal changes and causality. Second, our study was conducted in a single tertiary-care center among Hispanic children and adolescents, which may limit the generalizability of our results to other ethnicities or broader pediatric populations. Third, although standardized protocols were implemented, ultrasound-derived echo-intensity measurements remain susceptible to operator-dependent variability and technical factors such as probe pressure and gain settings. Fourth, while we adjusted echo-intensity for subcutaneous adipose tissue thickness, residual confounding from other factors influencing ultrasound attenuation, such as tissue hydration or pubertal status, cannot be fully excluded. Lastly, the absence of functional performance testing limits the ability to relate the imaging findings directly to muscle function or physical capacity.
5. Conclusions
This study demonstrates significant associations between body composition measurements and muscle ultrasound-derived indicators ultrasound parameters, particularly echo-intensity and intramuscular adipose tissue, in children and adolescents with overweight and obesity. Higher adiposity metrics were linked to poorer muscle quality indicators, suggesting early alterations in muscle architecture in pediatric obesity. Muscle thickness, while reflecting size, did not fully capture muscle quality, highlighting the importance of integrating both morphological and qualitative ultrasound parameters for comprehensive assessment. These findings underscore the potential utility of ultrasound as a non-invasive tool for early detection of musculoskeletal alterations in pediatric obesity.
Supplementary Materials
The following supporting information can be downloaded at the website of this paper posted on Preprints.org, Table S1: Supplementary 1. Descriptive statistics of children and adolescents analyzed by sex.
Author Contributions
Conceptualization: D-B A, L-G D, S-Z AE, G-C M, M-V I; Methodology: D-B A,G-C M, M-V I; Formal Analysis: D-B A, R-R DP, S-Q M, G-C M, M-V I; Investigation: D-B A, R-R DP, S-Q M, B-M SN, L-G D, S-Z AE, G-C M, M-V I; Data Curation: D-B A, R-R DP, S-Q M, B-M SN, M-V I; Writing: D-B A, R-R DP, S-Q M, G-C M, M-V I; Visualization: D-B A, R-R DP, S-Q M, B-M SN, M-V I; Supervision: G-C M, M-V I; Project Administration: D-B A,G-C M, M-V I. All authors have read and agreed to the published version of the manuscript.
Funding
This work was supported by a grant from the Secretaría de Educación, Ciencia, Tecnología e Innovación de la Ciudad de México SECTEI-2023 (2173c23) to M-V I and G-C M.
Institutional Review Board Statement
This protocol was approved by Instituto Nacional de Pediatría Research and Ethics Committees with number 2023/031, officially registered at the Office for Human Research Protections of the NIH (http://ohrp.cit.nih.gov/search/search.aspx) with numbers IRB00013674 and IRB00013675. All the subjects’ information was handled confidentially. Each participant and parents, or primary caregivers, signed a written informed assent and consent respectively, before enrollment.
Informed Consent Statement
Informed consent was obtained from all subjects involved in the study, and children over 6 years of age also provided their written informed assent.
Data Availability Statement
The original contributions presented in this study are included in the article. Further information can be available after inquiries to the corresponding author.
Acknowledgments
We are very grateful with all the children and their parents for participating in this study, as well as with the Consejo Nacional de Humanidades Ciencias y Tecnologías (CONAHCYT) for the scholarship awarded to the doctorate student Andrea Domínguez Barbosa (CVU 1310384), and to the Universidad Nacional Autónoma de México Doctorate Program in Clinical Epidemiology.
Conflicts of Interest
The authors have no conflicts of interest to declare.
Abbreviations
The following abbreviations are used in this manuscript:
| IMAT | Intramuscular Adipose Tissue |
| au | Arbitrary Units |
| BIA | Bioelectrical Impedance Analysis |
| BMI | Body Mass Index |
| CDC | Centers for Disease Control and Prevention |
| cm. | Centimeter (s) |
| cm² | Square Centimeter |
| Co. | Company |
| Corp | Corporation |
| dB | Decibel (s) |
| DXA | Dual-energy X-ray Absorptiometry |
| EI | Echo intensity |
| GE | General Electric |
| IBM | International Business Machines |
| IC | Confidence Interval. |
| ISAK | International Society for the Advancement of Kinanthropometry |
| Kg. | Kilogram (s) |
| kg/m² | Kilograms per Square Meter |
| L | Liter (s) |
| Ltd. | Limited |
| m² | Square Meter (s) |
| MHz | Megahertz |
| mm. | Millimeter (s) |
| MT | Muscle Thickness |
| NAFLD | Non-Alcoholic Fatty Liver Disease |
| NIH | National Institutes of Health |
| NY | Nueva York |
| ROI | Region of Interest |
| SAT | Subcutaneous Adipose Tissue |
| SD | Standard Deviation |
| SPSS | Statistical Package for the Social Sciences |
| USA | United States of America |
| VAT | Visceral Adipose Tissue |
References
- Abe, T.; Loenneke, J.P.; Thiebaud, R.S. Morphological and functional relationships with ultrasound measured muscle thickness of the lower extremity: a brief review. Ultrasound. 2015, 23, 166–73. [Google Scholar] [CrossRef]
- Andersson, J.; Roswall, J.; Kjellberg, E.; Ahlström, H.; Dahlgren, J.; Kullberg, J. MRI estimates of brown adipose tissue in children - Associations to adiposity, osteocalcin, and thigh muscle volume. Magn Reson Imaging. 2019, 58, 135–42. [Google Scholar] [CrossRef]
- Avar-Aydin, P.O.; Koyuncu, E.G.; Dogan, D.; Ates, N.K.; Gurel, E.; Arda, N.; et al. Sonographic and Anthropometric Measurements for Body Composition and Their Relationship with Functioning in Adolescent Obesity. Klin Padiatr. 2025. [CrossRef]
- Maruyama, M.; Kagaya, Y.; Kajiwara, S.; Oikawa, T.; Horikawa, M.; Fujimoto, M.; et al. The relationship between sarcopenic obesity and changes in quadriceps muscle thickness and echo intensity in patients with stroke. Top Stroke Rehabil. 2024, 31, 828–37. [Google Scholar] [CrossRef]
- Neagu, M.; Neagu, A. A Decade of Progress in Ultrasound Assessments of Subcutaneous and Total Body Fat: A Scoping Review. Life (Basel). 2025, 15. [Google Scholar] [CrossRef]
- Semiz, S.; Ozgören, E.; Sabir, N. Comparison of ultrasonographic and anthropometric methods to assess body fat in childhood obesity. Int J Obes (Lond). 2007, 31, 53–8. [Google Scholar] [CrossRef] [PubMed]
- Acuna-Pardo, C.; Munoz-Redondo, E.; Delcros-Forestier, L.; Curbelo, Y.G.; Rodriguez-Hernandez, C.; Meza-Valderrama, D.; et al. Association between muscle strength and echogenicity using greyscale ultrasound software: a diagnostic accuracy study in kidney transplant candidates. Eur J Phys Rehabil Med. 2025, 61, 119–29. [Google Scholar] [CrossRef] [PubMed]
- Di Ludovico, A.; La Bella, S.; Ciarelli, F.; Chiarelli, F.; Breda, L.; Mohn, A. Skeletal muscle as a pro- and anti-inflammatory tissue: insights from children to adults and ultrasound findings. J Ultrasound. 2024, 27, 769–79. [Google Scholar] [CrossRef] [PubMed]
- Kitagawa, T.; Nakamura, M.; Fukumoto, Y. Usefulness of muscle echo intensity for evaluating functional performance in the older population: A scoping review. Exp Gerontol. 2023, 182, 112301. [Google Scholar] [CrossRef]
- Lim, K.I.; Yang, S.J.; Kim, T.N.; Yoo, H.J.; Kang, H.J.; Song, W.; et al. The association between the ratio of visceral fat to thigh muscle area and metabolic syndrome: the Korean Sarcopenic Obesity Study (KSOS). Clin Endocrinol (Oxf). 2010, 73, 588–94. [Google Scholar] [CrossRef]
- Ishida, H.; Suehiro, T.; Suzuki, K.; Watanabe, S. Muscle thickness and echo intensity measurements of the rectus femoris muscle of healthy subjects: Intra and interrater reliability of transducer tilt during ultrasound. J Bodyw Mov Ther. 2018, 22, 657–60. [Google Scholar] [CrossRef]
- Kara, M.; Kaymak, B.; Ata, A.M.; Özkal, Ö.; Kara, Ö.; Baki, A.; et al. STAR-Sonographic Thigh Adjustment Ratio: A Golden Formula for the Diagnosis of Sarcopenia. Am J Phys Med Rehabil. 2020, 99, 902–8. [Google Scholar] [CrossRef]
- Ozdemir, H.; S K, O. K, C. A, B. O, A. A, et al. <Quadriceps_Muscle_Thickness_and_Subcutan.pdf>. Gazi Medical Journal. 1995, 6, 141. [Google Scholar]
- Fisse, A.L.; Fiegert, S.; Stoykova, Z.; Brunger, J.; Athanasopoulos, D.; Gruter, T.; et al. Increased muscle echointensity correlates with clinical disability and muscle strength in chronic inflammatory demyelinating polyneuropathy. Eur J Neurol. 2021, 28, 1698–705. [Google Scholar] [CrossRef] [PubMed]
- Fukumoto, Y.; Taniguchi, M.; Hirono, T.; Yagi, M.; Yamagata, M.; Nakai, R.; et al. Influence of ultrasound focus depth on the association between echo intensity and intramuscular adipose tissue. Muscle Nerve. 2022, 66, 568–75. [Google Scholar] [CrossRef] [PubMed]
- Kantor, D.B.; Mehta, N.M. Ultrasound Measurement of Muscle Thickness: A Novel Biomarker for the PICU? Pediatr Crit Care Med. 2017, 18, 817–9. [Google Scholar] [CrossRef] [PubMed]
- Kim, E.J.; Wai, K.; Pedoeim, L.; Basu, S. Assessing Clinical Variables Associated With Femoral Muscle Decay as Measured by Point-of-Care Ultrasound in Critically Ill Children. J Ultrasound Med. 2025, 44, 69–76. [Google Scholar] [CrossRef]
- Park, Y.; Han, J.; Leikin, S.; Díaz-Gómez, J.L. Essential Point-of-Care Ultrasound Insights for 2024. Semin Ultrasound CT MR. 2024, 45, 22–8. [Google Scholar] [CrossRef]
- Duong, M.; Botchway, A.; Dela Cruz, J.; Austin, R.; McDaniel, K.; Jaeger, C. Skin to Intramuscular Compartment Thigh Measurement by Ultrasound in Pediatric Population. West J Emerg Med. 2017, 18, 479–86. [Google Scholar] [CrossRef]
- Sobolewski, E.; Topham, W.; Hosey, R.; Waheeba, N.; Rett, T. Acute Effects of Soft Tissue Modalities on Muscular Ultrasound Characteristics and Isometric Performance. Applied Sciences. 2024, 14. [Google Scholar] [CrossRef]
- Uchiyama, T.; Nakayama, T.; Kuru, S. Muscle development in healthy children evaluated by bioelectrical impedance analysis. Brain Dev. 2017, 39, 122–9. [Google Scholar] [CrossRef]
- Casey, P.; Alasmar, M.; McLaughlin, J.; Ang, Y.; McPhee, J.; Heire, P.; et al. The current use of ultrasound to measure skeletal muscle and its ability to predict clinical outcomes: a systematic review. J Cachexia Sarcopenia Muscle. 2022, 13, 2298–309. [Google Scholar] [CrossRef] [PubMed]
- Shpoliansky, M.; Chavhan, G.B.; Zhou, A.; Ng, V.L.; Kamath, B.M. A pilot feasibility study of an ultrasound-based tool to assess muscle mass in children with liver disease. Hepatol Commun. 2023, 7. [Google Scholar] [CrossRef] [PubMed]
- Simó-Servat, A.; Ibarra, M.; Libran, M.; Rodríguez, S.; Perea, V.; Quirós, C.; et al. Usefulness of Muscle Ultrasound to Study Sarcopenic Obesity: A Pilot Case-Control Study. J Clin Med. 2022, 11. [Google Scholar] [CrossRef] [PubMed]
- Stock, M.S.; Thompson, B.J. Echo intensity as an indicator of skeletal muscle quality: applications, methodology, and future directions. Eur J Appl Physiol. 2021, 121, 369–80. [Google Scholar] [CrossRef]
- Díaz-Gómez, J.L.; Mayo, P.H.; Koenig, S.J. Point-of-Care Ultrasonography. N Engl J Med. 2021, 385, 1593–602. [Google Scholar] [CrossRef]
- García-Alonso, Y.; García-Hermoso, A.; Alonso-Martínez, A.M.; Legarra-Gorgoñon, G.; Izquierdo, M.; Ramírez-Vélez, R. Associations between physical fitness components with muscle ultrasound parameters in prepuberal children. Int J Obes (Lond). 2022, 46, 960–8. [Google Scholar] [CrossRef]
- Neto Muller, J.; Lanferdini, F.J.; Passos Karam, J.Y.; de Brito Fontana, H. Examination of the confounding effect of subcutaneous fat on muscle echo intensity utilizing exogenous fat. Appl Physiol Nutr Metab. 2021, 46, 473–8. [Google Scholar] [CrossRef]
- Primo, D.; Izaola, O.; Gómez, J.J.L.; de Luis, D. Correlation of the Phase Angle with Muscle Ultrasound and Quality of Life in Obese Females. Dis Markers. 2022, 2022, 7165126. [Google Scholar] [CrossRef]
- Kokura, Y. Association between quadriceps muscle thickness or echo intensity, malnutrition, and activities of daily living in an integrated medical and long-term care facility: A cross-sectional study. Clin Nutr ESPEN. 2024, 63, 929–35. [Google Scholar] [CrossRef]
- Lateef, S.; Addison, O.; Zhang, L.Q.; Gray, V.; Lanza, M.B. Exploring discrepancies in muscle analysis with ImageJ: understanding the impact of tool selection on echo intensity and muscle area measurements. J Ultrasound. 2024, 27, 973–7. [Google Scholar] [CrossRef]
- Marín Baselga, R.; Teigell-Muñoz, F.J.; Porcel, J.M.; Ramos Lázaro, J.; García Rubio, S. Ultrasound for body composition assessment: a narrative review. Intern Emerg Med. 2025, 20, 23–34. [Google Scholar] [CrossRef]
- Valverde Montoro, D.; Rosa Camacho, V.; Artacho González, L.; Camacho Alonso, J.M. Thigh ultrasound monitoring identifies muscle atrophy in mechanically ventilated pediatric patients. Eur J Pediatr. 2023, 182, 5543–51. [Google Scholar] [CrossRef]
- Grozier, C.; Keen, M.; Collins, K.; Tolzman, J.; Fajardo, R.; Slade, J.M.; et al. Rectus Femoris Ultrasound Echo Intensity Is a Valid Estimate of Percent Intramuscular Fat in Patients Following Anterior Cruciate Ligament Reconstruction. Ultrasound Med Biol. 2023, 49, 2590–5. [Google Scholar] [CrossRef] [PubMed]
- Terzis, G.; Vekaki, E.; Papadopoulos, C.; Papadimas, G.; Stasinaki, A.N. Muscle Ultrasound Echo Intensity and Fiber Type Composition in Young Females. J Funct Morphol Kinesiol. 2024, 9. [Google Scholar] [CrossRef] [PubMed]
- Tomlinson, O.W.; Barker, A.R.; Fulford, J.; Wilson, P.; Oades, P.J.; Williams, C.A. Quantification of thigh muscle volume in children and adolescents using magnetic resonance imaging. Eur J Sport Sci. 2020, 20, 1215–24. [Google Scholar] [CrossRef] [PubMed]
- Burton, A.M.; Stock, M.S. Consistency of novel ultrasound equations for estimating percent intramuscular fat. Clin Physiol Funct Imaging. 2018. [CrossRef]
- Heckmatt, J.Z.; Pier, N.; Dubowitz, V. Measurement of quadriceps muscle thickness and subcutaneous tissue thickness in normal children by real-time ultrasound imaging. J Clin Ultrasound. 1988, 16, 171–6. [Google Scholar] [CrossRef]
- Tada, M.; Yamada, Y.; Mandai, K.; Hidaka, N. Screening for sarcopenia and obesity by measuring thigh muscle and fat thickness by ultrasound in patients with rheumatoid arthritis. Osteoporos Sarcopenia. 2021, 7, 81–7. [Google Scholar] [CrossRef]
- Perkisas, S.; Bastijns, S.; Baudry, S.; Bauer, J.; Beaudart, C.; Beckwée, D.; et al. Application of ultrasound for muscle assessment in sarcopenia: 2020 SARCUS update. Eur Geriatr Med. 2021, 12, 45–59. [Google Scholar] [CrossRef]
- Ranger, B.J.; Lombardi, A.; Kwon, S.; Loeb, M.; Cho, H.; He, K.; et al. Ultrasound for assessing paediatric body composition and nutritional status: Scoping review and future directions. Acta Paediatr. 2025, 114, 14–23. [Google Scholar] [CrossRef]
- Zaidman, C.M.; Hobson-Webb, L.D. Quantitative muscle echointensity: A practical approach using ultrasound to evaluate children with suspected neuromuscular disorders. Muscle Nerve. 2021, 64, 6–7. [Google Scholar] [CrossRef]
- Esparza-Ros, F.; Vaquero-Cristóbal, R.; Marfell-Jones, M. . International standards for anthropometric assessment. International Society for Advancement in Kinanthropometry, Murcia, Spain. 2019.
- Hales CMF, David S.;Akinbami, Lara;Wei, Rong;Ogden, Cynthia L.;. Evaluation of alternative body mass index (BMI) metrics to monitor weight status in children and adolescents with extremely high BMI using CDC BMI-for-age growth charts. NCHS National Vital Statistics Reports. 2022.
- Lanferdini, F.J.; Sonda, F.C.; Sgarioni, A.; da Silva Gomes, D.C.; Molinari, T.; de Oliveira, L.Z.; et al. Confounding effect of equations corrected by subcutaneous adipose thickness on quadriceps muscle echo intensity intra-rater, inter-rater and inter-analyzer reliability. J Bodyw Mov Ther. 2025, 43, 424–9. [Google Scholar] [CrossRef]
- Akima, H.; Kainuma, K.; Togashi, K. Abdominal and Thigh Muscle Attenuation Is Associated With Visceral Fat and Age in Children and Adolescents With Obesity. Glob Pediatr Health. 2018, 5, 2333794x18817121. [Google Scholar] [CrossRef]
- Van den Broeck, J.; Hereus, S.; Cattrysse, E.; Raeymaekers, H.; Scafoglieri, A. Ultrasound cut-off values for muscle thickness, cross-sectional area, and echo intensity in Caucasian adults: a narrative review. Quant Imaging Med Surg. 2025, 15, 3665–86. [Google Scholar] [CrossRef]
Figure 1.
Representative ultrasound assessment of the quadriceps femoris muscle in an 11.7-year-old male participant with a BMI of 22.2 kg/m². Panel A displays the transverse B-mode ultrasound image, identifying subcutaneous adipose tissue (SAT), rectus femoris, and vastus intermedius muscles. The muscle thickness (MT) was measured at 33 mm, and SAT thickness at 13.7 mm. The yellow ellipse indicates the region of interest (ROI) used for echo-intensity analysis. Panel B shows the corresponding echo-intensity histogram derived from the ROI, with a mean grayscale value of 93.053 (SD: 35.762), and intensity values ranging from 16 to 255. These images exemplify the methodology for quantifying muscle morphology and quality in the study participants.
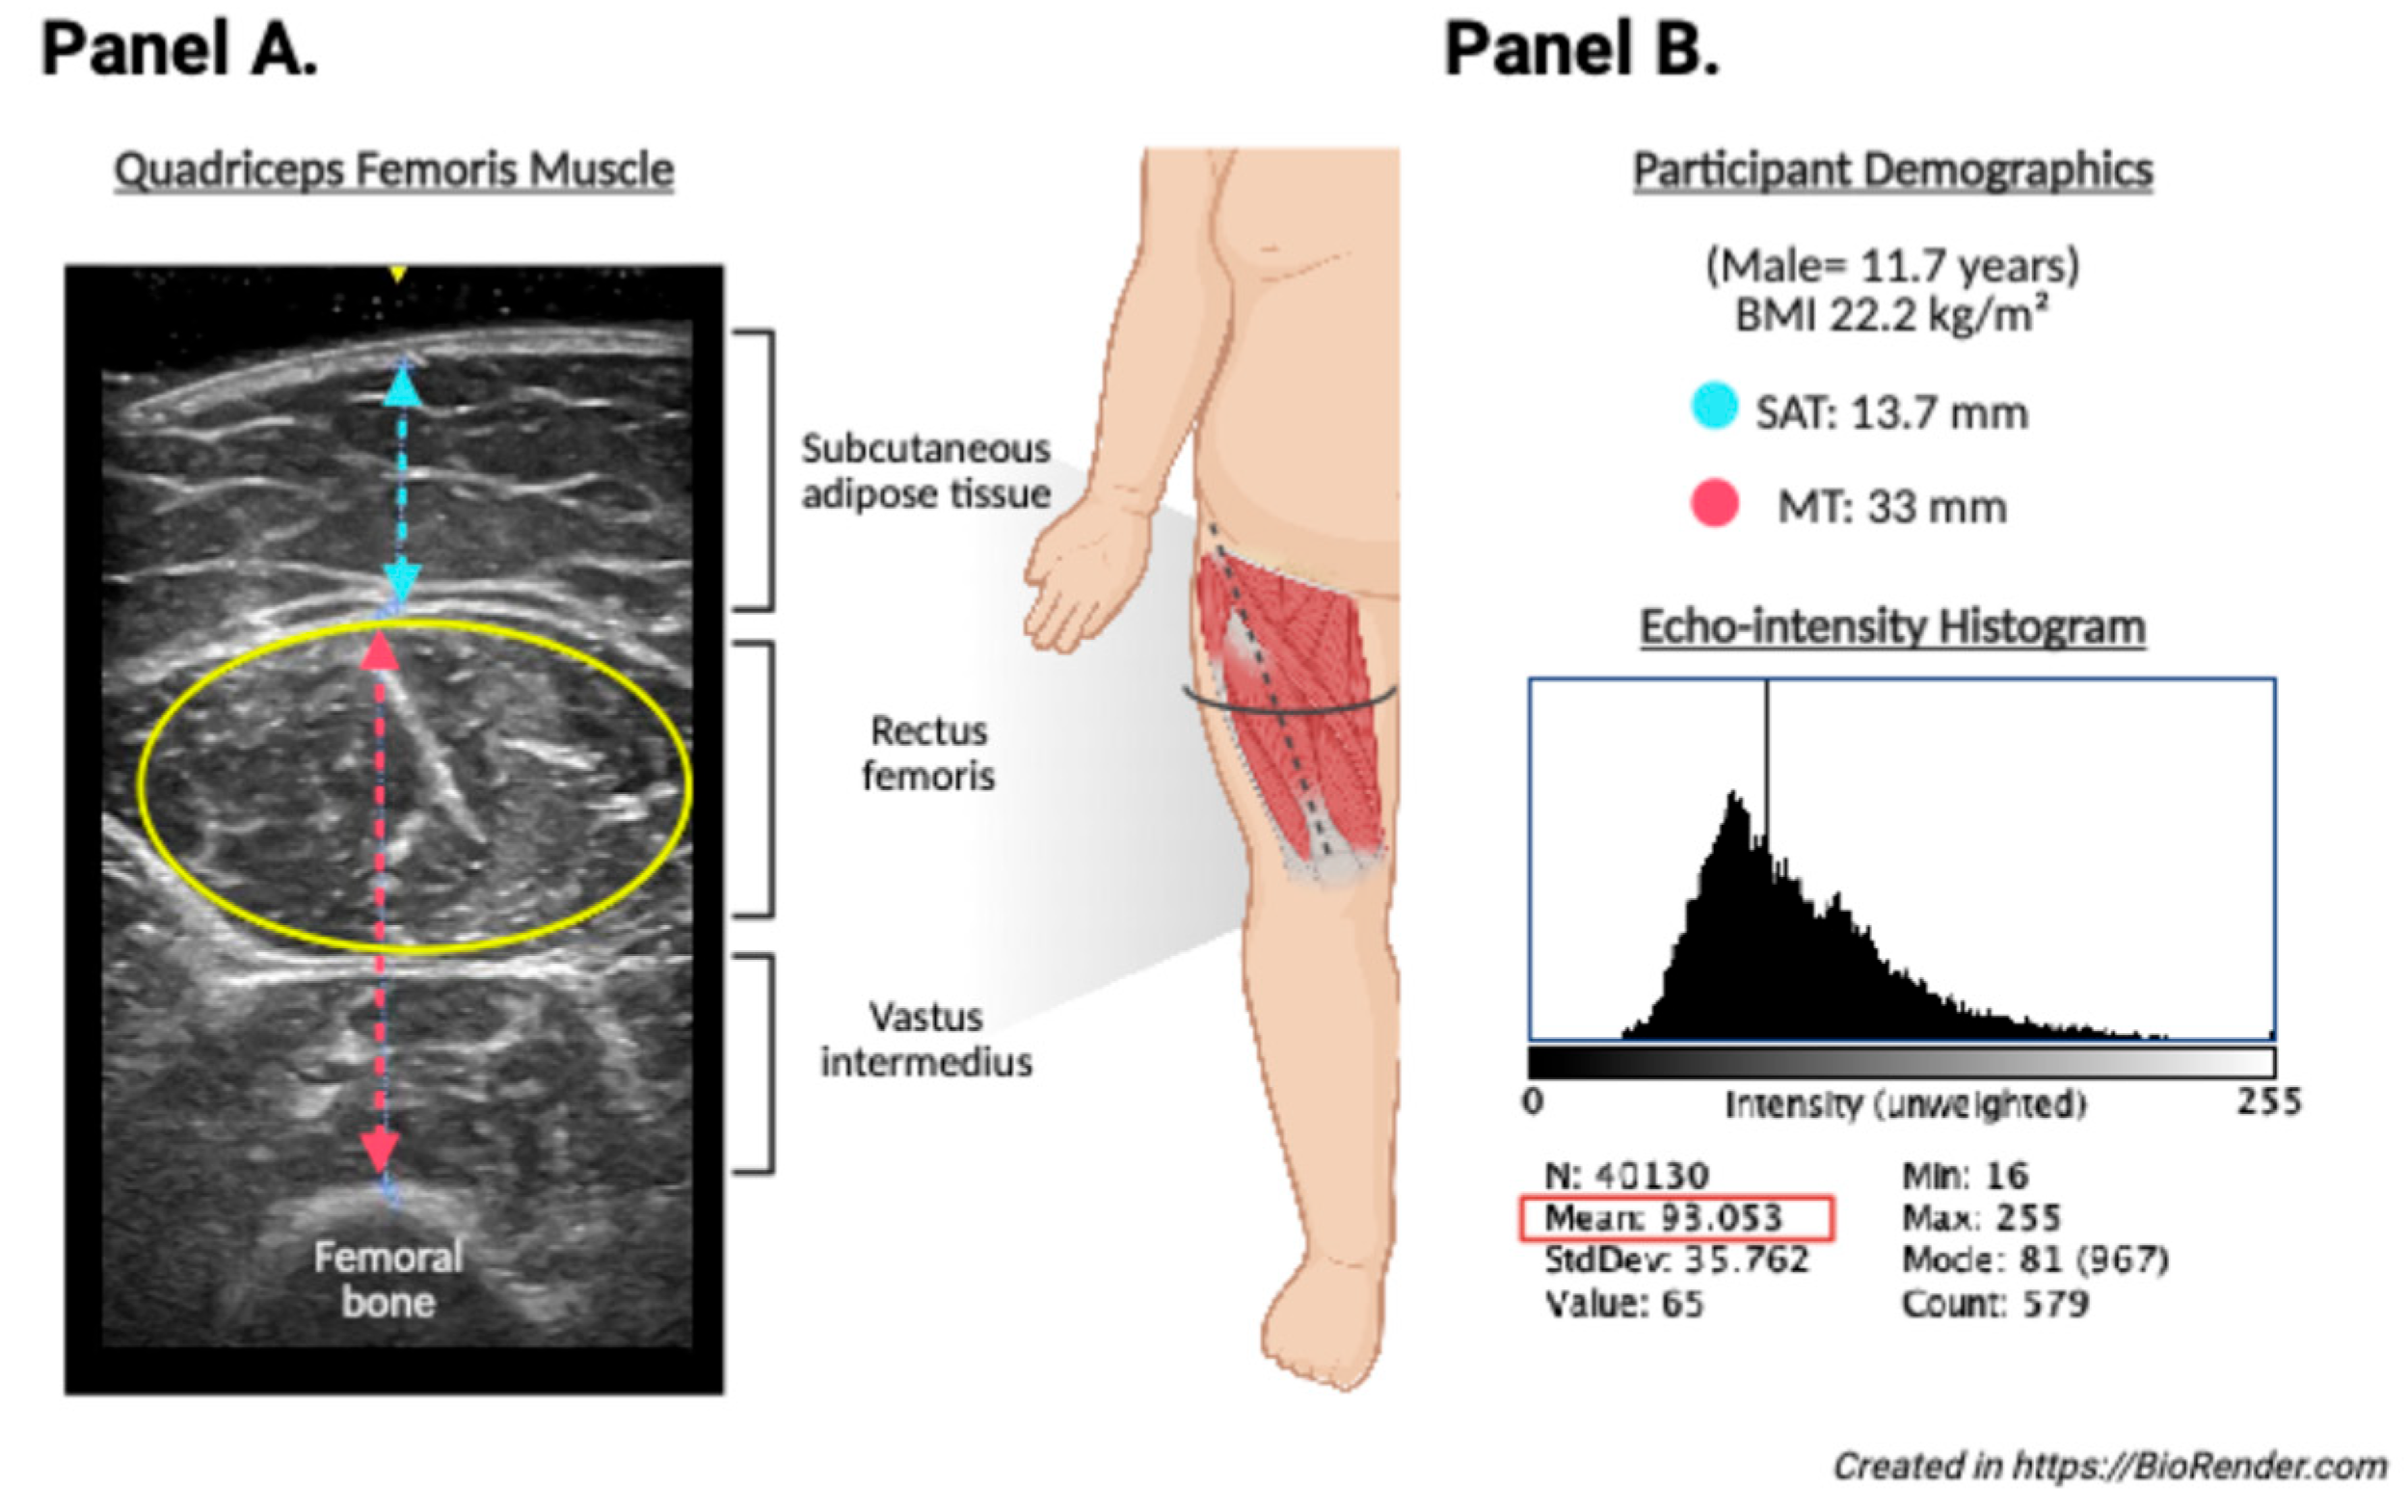
Figure 2.
IMAT between boys and girls (Panel A). Association of fat percent with EI corrected (Panel B), with EI uncorrected (Panel C), and with IMAT (Panel D) Strength parameters showed few significant correlations with EI or IMAT, except in girls, where IMAT was positively associated with right hand grip (ρ = 0.30, p < 0.01), left hand grip (ρ = 0.39, p < 0.01), and back and leg grip strength (ρ = 0.39, p < 0.01). IMAT: Intramuscular adipose tissue; EI: Echo-intensity.
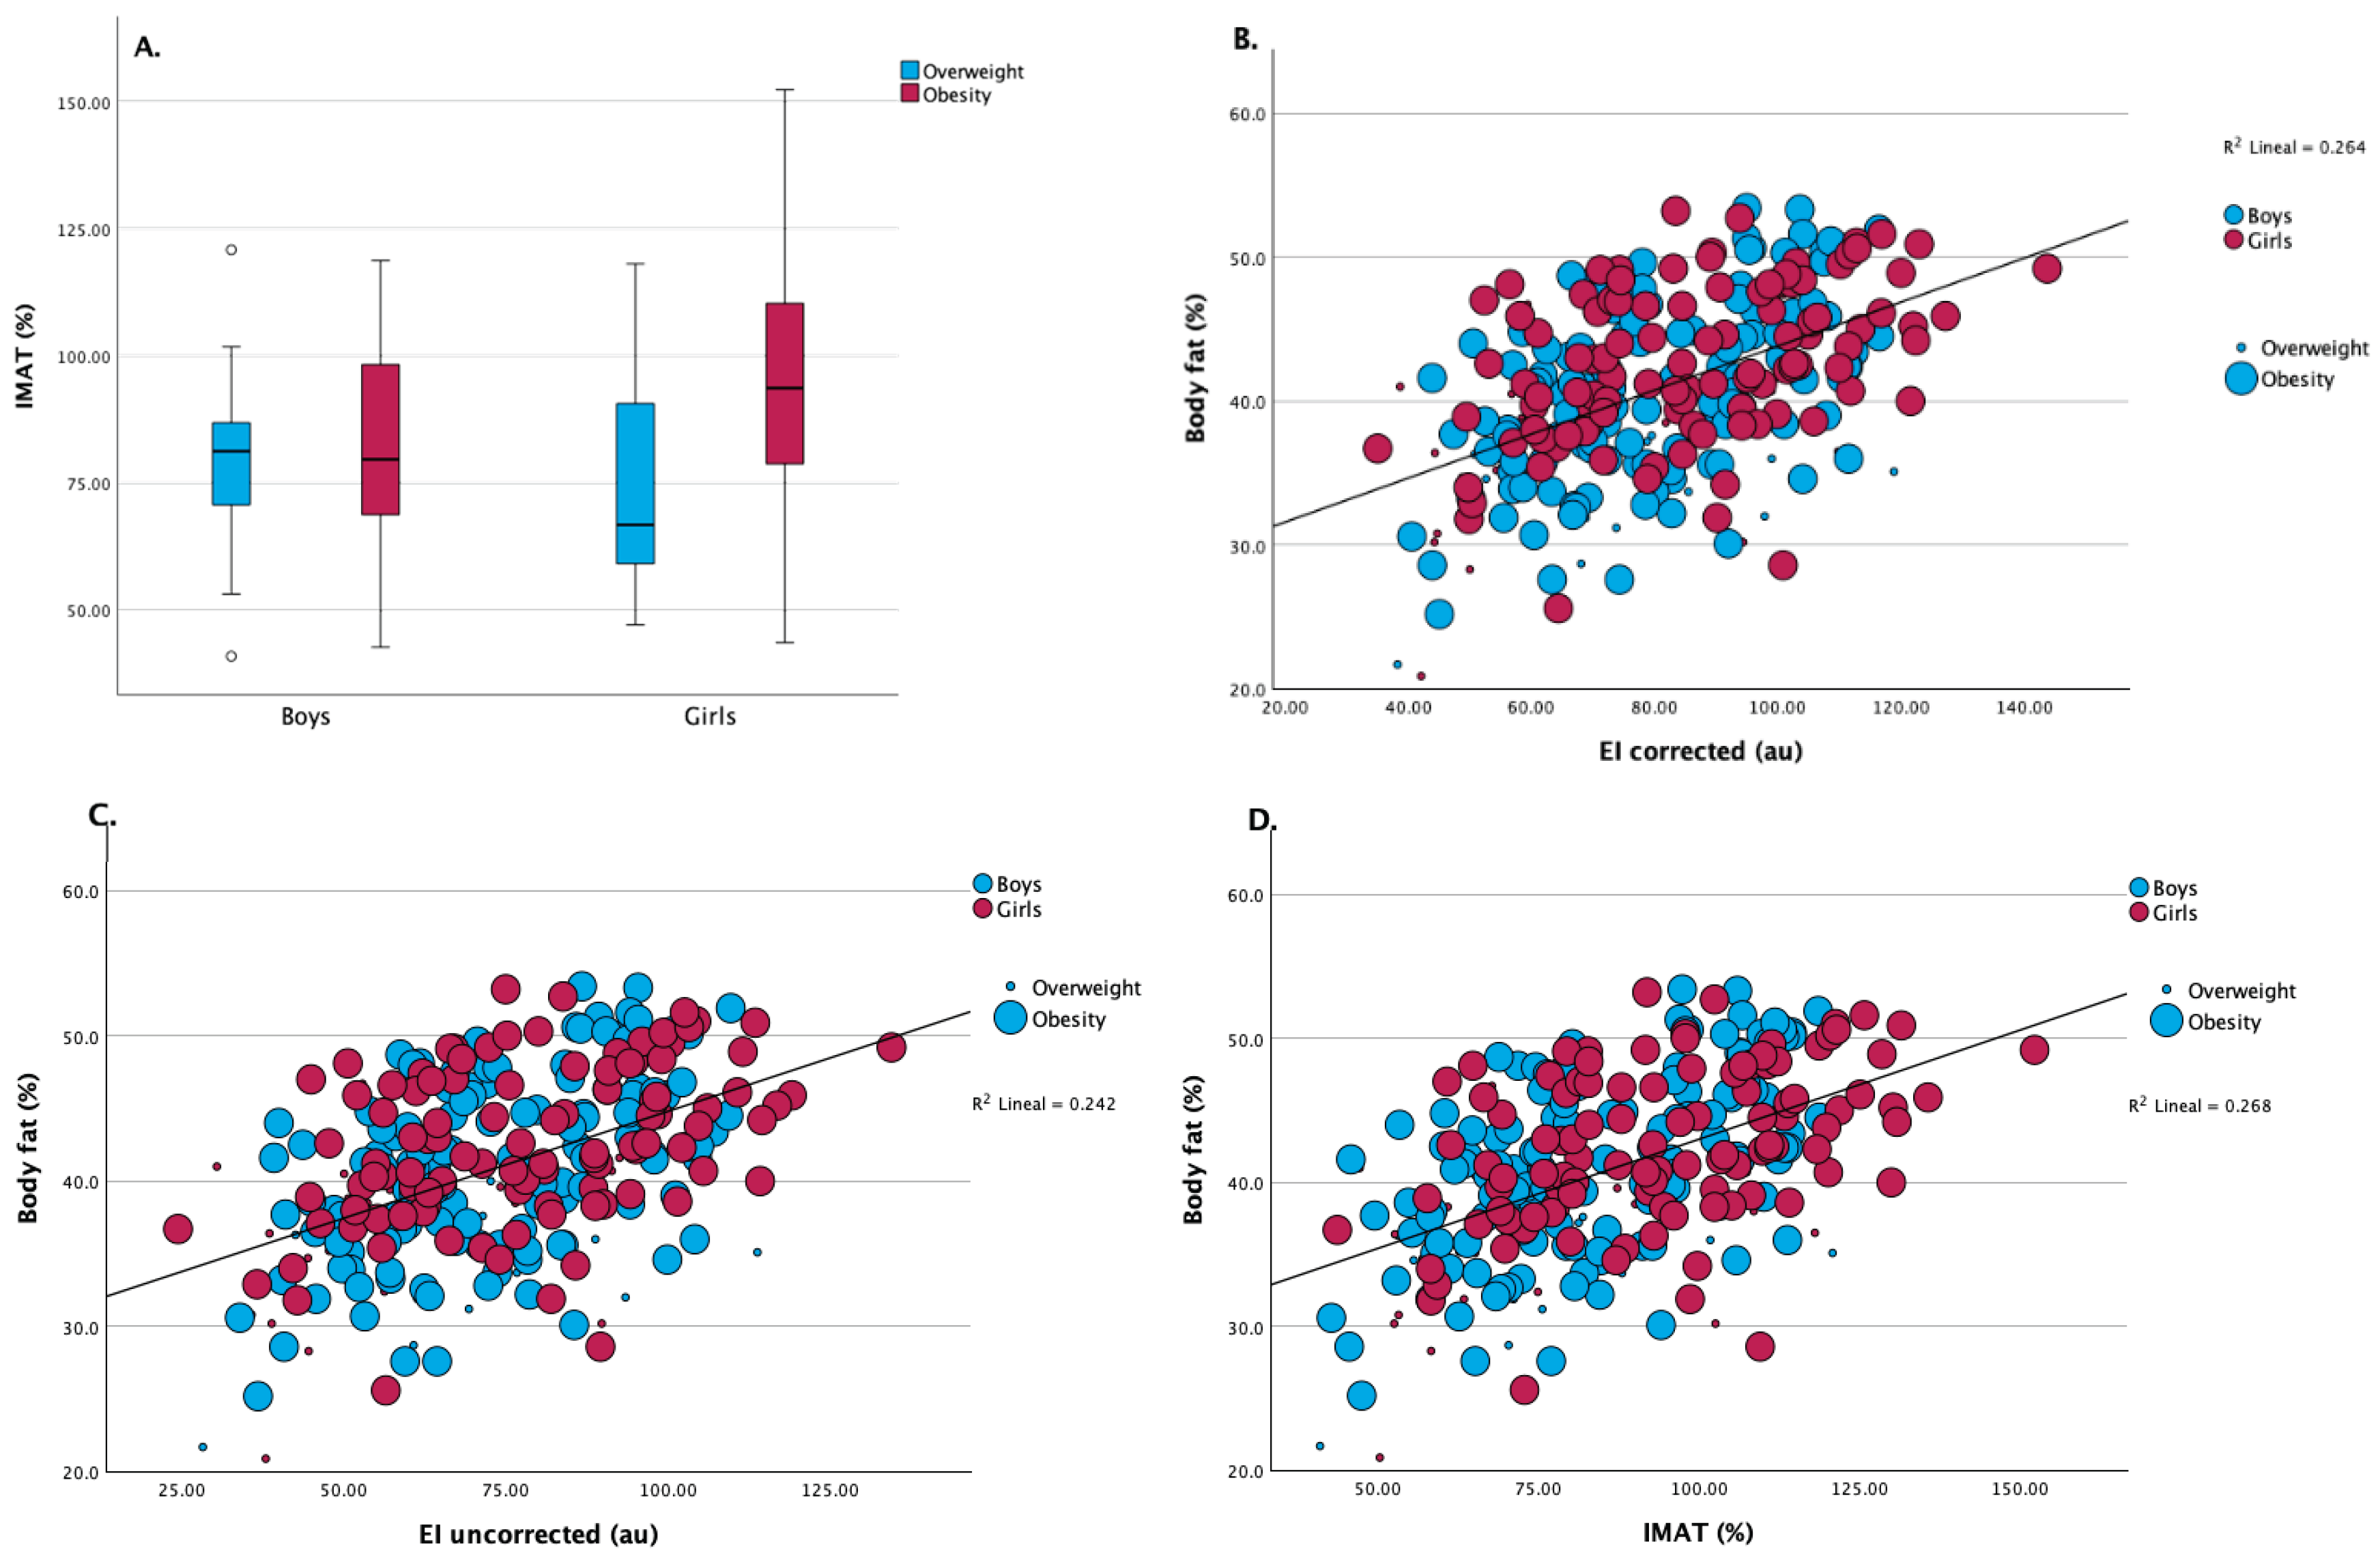

Table 1.
Descriptive characteristics of full sample, boy and girls in the study.
| Full sampleϦ(n = 294) | BoysϦ(n = 153) | GirlsϦ(n = 141) | P value | |
| Anthropometric parameters | ||||
| Age (years) | 11.2 ± 2.6 | 11.3 ± 2.6 | 11.2 ± 2.8 | 0.351 |
| Height (cm) | 147.7 ± 14.1 | 150.0 ± 14.4 | 145.4 ± 13.3 | 0.002* |
| Weight (kg) | 60.8 ± 19.3 | 63.4 ± 20.0 | 58.0 ± 18.2 | 0.008* |
| Body mass index (kg/m2) | 27.0 ± 4.6 | 27.4 ± 4.7 | 26.7 ± 4.5 | 0.095 |
| Body mass index (percentile) | 96.9 ± 2.7 | 97.5 ± 2.3 | 96.4 ± 3.0 | <0.001* |
| Overweight (%)† | 16.3 | 5.8 | 10.5 | 0.012 b* |
| Obesity (%)† | 83.7 | 46.3 | 37.4 | |
| Height for age b | ||||
| Normal (%)† | 83.7 | 43.2 | 40.5 | 0.016 b* |
| Tall (%)† | 8.8 | 6.5 | 2.4 | |
| Marginally stunted (%)† | 7.5 | 2.4 | 5.1 | |
| Circumferences (cm) | ||||
| Wrist | 15.5 ± 1.4 | 15.9 ± 1.4 | 15.2 ± 1.3 | <0.001* |
| Neck | 35.0 ± 19.1 | 37.1 ± 26.1 | 32.8 ± 3.0 | 0.026* |
| Relaxed mid-upper arm | 30.7 ± 4.5 | 31.0 ± 4.5 | 30.4 ± 4.5 | 0.108 |
| Tight mid-upper arm | 30.6 ± 4.5 | 31.0 ± 4.6 | 30.1 ± 4.4 | 0.043* |
| Mid-thigh | 56.0 ± 8.1 | 56.3 ± 7.8 | 55.8 ± 8.5 | 0.286 |
| Mid-calf | 34.8 ± 4.6 | 35.4 ± 4.4 | 34.2 ± 4.7 | 0.017* |
| Waist | 86.2 ± 11.7 | 89.5 ± 11.8 | 82.8 ± 10.5 | <0.001* |
| Hip | 95.1 ± 13.8 | 95.6 ± 14.2 | 94.6 ± 13.3 | 0.277 |
| Skinfold measurements | ||||
| Tricipital | 23.4 ± 6.5 | 23.3 ± 6.3 | 23.4 ± 6.8 | 0.449 |
| Subscapular | 26.3 ± 9.3 | 25.8 ± 8.8 | 26.8 ± 9.8 | 0.183 |
| Sum of skinfolds | 49.7 ± 14.5 | 49.2 ± 13.3 | 50.3 ± 15.8 | 0.262 |
| Strength measurements§ | ||||
| Right hand grip | 11.0 (41.5) | 12.0 (38.0) | 11.0 (41.5) | 0.187 a |
| Left hand grip | 10.0 (35.5) | 10.0 (35.0) | 9.0 (31.5) | 0.304 a |
| Back and leg | 36.0 (96.0) | 38.0 (96.0) | 35.0 (61.0) | 0.257 a |
| BIA parameters§ | ||||
| Body fat (%) | 41.1 (34.6) | 40.9 (31.7) | 41.2 (34.6) | 0.218 a |
| Body fat (kg) | 23.7 (57.3) | 23.9 (50.1) | 23.6 (57.3) | 0.200 a |
| Visceral fat area (cm2) | 119.1 (237.9) | 120.3 (220.1) | 118.8 (237.9) | 0.411 a |
| Soft lean mass (kg) | 32.3 (49.6) | 32.7 (49.2) | 31.2 (41.7) | 0.016 a* |
| Fat-free mass (kg) | 34.2 (53.0) | 34.7 (52.5) | 33.0 (44.4) | 0.015 a* |
| Musculoskeletal mass (kg) | 18.3 (32.2) | 18.5 (32.0) | 17.7 (28.3) | 0.025 a* |
| Bone mineral content (kg) | 1.9 (3.6) | 2.0 (3.6) | 1.9 (2.9) | 0.020 a* |
| Body cell mass (kg) | 22.3 (35.3) | 22.6 (35.2) | 21.7 (31.0) | 0.025 a |
| Total body water (L) | 25.2 (38.3) | 25.5 (37.9) | 24.3(31.8) | 0.013 a* |
| Extracellular water (L) | 9.6 (14.1) | 9.8 (13.8) | 9.2 (11.7) | 0.008 a* |
| Intracellular water (L) | 15.6 (24.6) | 15.8 (24.5) | 15.1 (21.6) | 0.019 a* |
| Body phase angle (º) | 5.4 (4.4) | 5.4 (3.6) | 5.5 (4.4) | 0.110 a |
| Muscle ultrasound parameters§ | ||||
| Quadriceps muscle thickness (mm) | 40.5 (37.2) | 40.6 (35.0) | 40.5 (37.2) | 0.643 a |
| Subcutaneous adipose thickness (mm) | 18.8 (51.3) | 18.5 (38.9) | 19.1 (49.0) | 0.511 a |
| IMAT (%) | 82.8 (111.3) | 80.3 (79.9) | 91.7 (108.6) | 0.007 a* |
| EI uncorrected (au) | 72.5 (110.1) | 71.4 (85.6) | 75.2 (110.1) | 0.679 a |
| EI corrected (au) | 78.9 (108.7) | 78.0 (80.6) | 83.0 (108.7) | 0.679 a |
§Medians (Interquartile range, IQR); † Proportions; BIA: bioelectrical impedance analysis; IMAT: proportion of intramuscular adipose tissue; EI: echo intensity expressed in arbitrary units; a Mann-Whitney U test; b Chi-square test.
Table 2.
Correlations between anthropometry measurements, body composition estimations and ultrasonographic parameters by sex group.
Table 2.
Correlations between anthropometry measurements, body composition estimations and ultrasonographic parameters by sex group.
| Variables | Echo-intensity corrected (au) | Echo-intensity uncorrected (au) | IMAT (%) | |||
| Boys | Girls | Boys | Girls | Boys | Girls | |
| Age (years) | -0.22** | -0.21* | -0.21** | -0.23** | -0.22** | -0.21* |
| Height (cm) | -0.21* | -0.16 | -0.21* | -0.17* | -0.21* | -0.16 |
| Weight (kg) | -0.09 | -0.03 | -0.10 | -0.06 | -0.09 | -0.02 |
| Body mass index (kg/m2) | 0.13 | 0.12 | 0.10 | 0.09 | 0.13 | 0.13 |
| Body mass index (percentile) | 0.16 | -038** | 0.15 | 0.36** | 0.16* | 0.38** |
| Circumferences (cm) | ||||||
| Wrist | -0.06 | 0.00 | -0.07 | -0.02 | -0.06 | 0.00 |
| Neck | 0.11 | 0.01 | 0.11 | -0.02 | 0.10 | 0.01 |
| Relaxed mid-upper arm | 0.02 | -0.00 | 0.01 | -0.03 | 0.02 | -0.00 |
| Tight mid-upper arm | 0.13 | 0.12 | 0.11 | 0.09 | 0.13 | 0.12 |
| Mid-thigh | 0.02 | -0.03 | 0.00 | -0.06 | 0.02 | -0.02 |
| Mid-calf | -0.02 | -0.03 | -0.03 | -0.06 | -0.02 | -0.03 |
| Waist | 0.14 | 0.21* | 0.13 | 0.18* | 0.14 | 0.21* |
| Hip | -0.01 | 0.05 | -0.02 | 0.02 | -0.01 | 0.05 |
| Skinfold measurements | ||||||
| Tricipital | 0.28** | 0.24** | 0.27** | 0.23** | 0.28** | 0.24** |
| Subscapular | 0.19* | 0.35** | 0.18* | 0.33** | 0.20* | 0.35** |
| Sum of skinfolds | 0.26** | 0.32** | 0.25** | 0.30** | 0.26** | 0.32** |
| Strength measurements§ | ||||||
| Right hand grip | 0.03 | 0.05 | 0.04 | 0.05 | 0.02 | 0.30** |
| Left hand grip | 0.07 | 0.10 | 0.09 | 0.09 | 0.06 | 0.39** |
| Back and leg grip | -0.00 | 0.10 | 0.02 | 0.13 | -0.01 | 0.39** |
| BIA parameters§ | ||||||
| Body fat (%) | 0.49** | 0.52** | 0.47** | 0.51** | 0.50** | 0.52** |
| Body fat (kg) | 0.16* | 0.12 | 0.16 | 0.10 | 0.17* | 0.12 |
| Visceral fat area (cm2) | 0.31** | 0.31** | 0.30** | 0.29** | 0.31** | 0.31** |
| Soft lean mass (kg) | -0.17* | -0.23** | -0.17* | -0.25** | -0.18* | -0.23** |
| Fat-free mass (kg) | -0.17* | -0.23** | -0.17* | -0.25** | -0.17* | -0.23** |
| Musculoskeletal mass (kg) | -0.17* | -0.24** | -0.16 | -0.25** | -0.17* | -0.23** |
| Bone mineral content (kg) | -0.22** | -0.28** | -0.22** | -0.29** | -0.23** | 0.27** |
| Body cell mass (kg) | -0.17* | -0.24** | -0.16 | -0.26** | -0.17* | -0.23** |
| Total body water (L) | -0.17* | -0.23** | -0.16 | -0.25** | -0.17* | 0.223** |
| Extracellular water (L) | -0.17* | -0.22* | -0.16 | -0.24** | -0.17* | -0.21* |
| Intracellular water (L) | -0.16* | -0.23** | -0.16 | -0.25** | -0.17* | -0.23** |
| Body phase angle (º) | -0.22** | -0.26** | -0.21** | -0.26** | -0.23** | -0.26** |
| Muscle ultrasound parameters§ | ||||||
| Quadriceps muscle thickness (mm) | -.017* | -0.08 | -0.16 | -0.09 | -0.17* | -0.08 |
| Subcutaneous adipose thickness (mm) | -0.16 | -0.04 | -0.10 | -0.08 | 0.17* | -0.04 |
P value: *p = 0.05; **p = 0.01. §Spearman correlations. Au: arbitrary units; IMAT: Intramuscular adipose tissue.
Table 3.
Linear regression models predicting EIcorrected, EIuncorrected, and IMAT.
| Boys | Girls | |||||
| β (95% CI) | P value | Variable | β (95% CI) | P value | ||
| EIcorrected | ||||||
| Intercept | 48.7 (17.4, 80.0) | 0.003 | Intercept | -189.3 (315.1, -63.5) | 0.004 | |
| Body fat (%) | 0.57 (0.67, 1.6) | <0.001 | BMI (percentile) | 0.56 (1.3 , 3.9) | <0.001 | |
| Subcutaneous adipose thickness (mm) | 0.26 (0.09, 1.02) | 0.021 | R = 0.56, R2 = 0.31 | |||
| Neck circumference | -0.67 (-4.04, -1.1) | <0.001 | ||||
| Relaxed mid-upper arm circumference | 0.55 (0.40, 3.10) | 0.012 | ||||
| R = 0.77, R2 = 0.59 | ||||||
| EIuncorrected | ||||||
| Intercept | -2.45 (-22.5, 17.5) | 0.806 | Intercept | -2.7 (-33.2, 27.6) | 0.855 | |
| Body fat (%) | 0.7 (0.9, 1.7) | <0.001 | Body fat (%) | 0.55 (0.73, 2.2) | <0.001 | |
| Subcutaneous adipose thickness (mm) | 0.25 (0.08, 0.97) | 0.021 | R = 0.55, R2 = 0.31 | |||
| R = 0.71, R2 = 0.51 | ||||||
| IMAT | ||||||
| Intercept | 52.16 (20.48, 83.84) | 0.002 | Intercept | -181.7 (-307.3, -56.1) | 0.006 | |
| Body fat (%) | 0.57 (0.66, 1.60) | <0.001 | BMI (percentile) | 0.56 (1.35, 3.96) | <0.001 | |
| Subcutaneous adipose thickness (mm) | 0.26 (0.09, 1.03) | 0.020 | R = 0.56, R2 = 0.31 | |||
| Neck circumference | -0.67 (-4.10, -1.12) | <0.001 | ||||
| Relaxed mid-upper arm circumference | 0.55 (0.39, 3.12) | 0.013 | ||||
| R = 0.76, R2 = 0.59 | ||||||
Values are expressed as standardized coefficients (β). BMI: Body mass index; IMAT: Intramuscular adipose tissue.
Disclaimer/Publisher’s Note: The statements, opinions and data contained in all publications are solely those of the individual author(s) and contributor(s) and not of MDPI and/or the editor(s). MDPI and/or the editor(s) disclaim responsibility for any injury to people or property resulting from any ideas, methods, instructions or products referred to in the content. |
© 2025 by the authors. Licensee MDPI, Basel, Switzerland. This article is an open access article distributed under the terms and conditions of the Creative Commons Attribution (CC BY) license (http://creativecommons.org/licenses/by/4.0/).
Copyright: This open access article is published under a Creative Commons CC BY 4.0 license, which permit the free download, distribution, and reuse, provided that the author and preprint are cited in any reuse.


