
Submitted:
07 December 2023
Posted:
07 December 2023
You are already at the latest version
Abstract
We aimed to determine whether A-mode ultrasound (US) can provide accurate and reliable measurements comparable to those obtained through B-mode US, under diverse conditions. Thirty healthy participants (15 female, 15 male) underwent measurements of subcutaneous fat thickness (SFT), muscle thickness (MT), and muscle quality (MQ) in the trapezius and biceps brachii muscle with both US modes after and before exercises designed to stimulate the respec-tive muscles. In three key indices, the results demonstrated high validity of A-mode, with min-imal mean differences between the two devices less than 0.91mm and intraclass correlation coef-ficients exceeding 0.95 at all measures. Also, Correlation coefficients between error scores and average scores for the trapezius and biceps brachii muscles suggested no evidence of systematic error. The trapezius MT and MQ significantly increased, and biceps brachii MT significantly in-creased after exercise (p<0.05). Notably, both A-mode and B-mode exhibited the same tendency in these post-exercise changes in muscle. This study suggests that low-cost and low-resolution A-mode US provides measurements of SFT, MT, and MQ similar to more expensive, high-resolution B-mode imaging. A-mode US can serve as an affordable and portable alternative for muscle assessment.
Keywords:
amplitude modulation
; subcutaneous fat thickness
; muscle thickness
; muscle quality
1. Introduction
Muscles, as a key representative of body composition, play a crucial role in both physical performance and metabolic health [1]. Low muscle mass and strength are associated with worsening activities of daily living, which predicts clinically relevant adverse events in older populations [2]. The changes in muscle distribution reflect the risk of musculoskeletal, metabolic, cardiovascular and cerebrovascular disorders [1,2,3]. Therefore, continuous observation of muscle changes is crucial for monitoring health, underscoring the need to develop accurate and reliable tools for muscle evaluation.
While magnetic resonance imaging (MRI) and computed tomography (CT) stand as gold standards for minimally invasive muscle mass measurement, the assessment of muscle quality (MQ) remains a point of controversy [4,5]. Ultrasound (US) is rapidly emerging as a muscle evaluation method on account of the improvement of portability and technology due to recent software development. Offering a non-invasive, radiation-free alternative, US proves to be highly versatile, swiftly scanning soft tissues and excelling in soft tissue imaging [5,6]. In contrast to MRI, which offers a resolution of 1.3 to 2.0 mm for a whole-body scan, the latest US can provide a resolution of 0.1 mm (18MHz probe), to give the highest measurement accuracy [7,8]. The US allows sonographers to check muscle changes promptly, even in curved sites, performing quick and dynamic tests [6]. Lately, echo intensity (EI), derived from US images, has emerged as an indicator of skeletal MQ and composition [5,9]. Symposium reports have recently highlighted the efficacy of skeletal muscle EI as an index of MQ [10].
However, US may be limited to obese patients, requiring several probes to measure various depths or resolutions, and posing diagnostic challenges as the interpretation of the image is user-dependent [6]. Nevertheless, many studies have reported the validity and reliability of US as a muscle evaluation method and have suggested it as a practical diagnostic tool for viable muscle assessment in the community and in hospitals [4,5,6,7].
Among several methods of representing the reflected signal in ultrasonic measurement, the primary techniques are A-mode (amplitude modulation), revealing changes in amplitude in one dimension, and B-mode (brightness modulation), presenting the A-mode signal as the brightness of dots in 2-D images [11]. Considering the value of images, B-mode is commonly utilized, but it is costlier than A-mode and demands expertise, training, and time for result interpretation [11]. This presents a barrier for many independent sonographers aiming to assess muscle in the field or within fitness establishments. Therefore, if A-mode US is sufficiently validated as a suitable method for muscle evaluation through a non-inferiority comparison with measurements obtained by B-mode, A-mode US could be considered as a cost-effective alternative evaluation across diverse healthcare settings, particularly those with limited resources.
While some studies have compared A-mode and B-mode for measurement of subcutaneous fat, research on means to assess MQ remains unpublished [11,12,13]. Therefore, the objective of this study is to establish the validity of A-mode US as a clinically viable tool for measuring muscle mass and quality. Our focus was on the trapezius and biceps brachii muscles, given their crucial roles in basic muscle US protocols, myopathy screening, and motor neuron disease examinations [4]. Moreover, these muscles are primary targets in upper body exercises.
Additionally, we integrated exercise variables into our US measurements, aiming to determine whether A-mode US can provide accurate and reliable measurements comparable to those obtained through B-mode US under diverse conditions. Ultimately, the study seeks to compare and analyze the trapezius and biceps brachii muscles before and after exercise, employing both A-mode and B-mode US, therefore proving the appropriateness of A-mode US as a method for assessing muscle.
2. Materials and Methods
2.1. Study population
Thirty healthy subjects between the ages of 19 and 50 were enrolled in this study as first-come, first-served applicant, with no distinction made between sexes in the order of application. Exclusion criteria included subjects with musculoskeletal injuries, those who did not agree to participate in the research, and individuals in vulnerable environments (such as Korean medical students, medical students, nursing students, hospital staff, pregnant women, mentally retarded individuals who cannot express their will, and people with disabilities). The Institutional Review Board (IRB) of Dongguk University Ilsan Oriental Hospital approved this study (Protocol no. DUIOH 2022-07-006-003). All participants provided written informed consent to participate in the study.
2.2. US scanning
This study was conducted at the Korean Medicine Ophthalmology, Otolaryngology, and Dermatology outpatient clinic of Dongguk University Ilsan Oriental Medicine Hospital in Ilsan. We maintained the clinic's temperature and humidity in accordance with the US manufacturer’s guidelines. US measurements were conducted before and after exercise in a single session.
The process of US scanning is illustrated in Figure 1. The US measurement sites were chosen based on previous studies: the midpoint of the upper trapezius and the biceps brachii muscle on the participant's dominant arm [4]. Anatomical marks and US sites were indicated using a hypoallergenic surgical marking pen: the upper trapezius measurement site (midpoint between the acromion process of the scapula and the 7th cervical vertebrae), and the biceps brachii measurement site (midpoint between the acromion process and the elbow crease).
An experienced sonographer with more than 10 years of experience conducted all US measurements on the 30 participants. The upper trapezius was measured with participants instructed to sit and relax with 0˚ of shoulder abduction. Subsequently, the biceps brachii muscle was measured with participants lying comfortably on a bed in the supine position and with the arm in supination.
A sufficient amount of water-soluble gel was applied to the marked sites and the US transducer head. Each subject then underwent B-mode US evaluation using a Healcerion sonon 300L device with a linear probe (5MHz for central frequency). The US transducer was positioned perpendicular to each muscle at the marked sites. After completing the B-mode US measurement, the center of the B-mode US measurement sites was designated as the A-mode US measurement sites and marked with a marking pen. Gel was reapplied, and A-mode evaluations were conducted with the XTR-2020 Square/Spike Ultrasonic Pulser/Receiver, with a set frequency of 5MHz. Since the A-mode single probe uses one piezoelectric element, the signal waveform changes with minute movements, ensuring that ultrasonic waves were irradiated as vertically as possible.
Following the completion of B-mode and A-mode US measurements for the sites, subjects performed exercises to stimulate the related muscles: dumbbell shrugs and dumbbell curls. Immediately after each exercise, the stimulated muscle was measured with B-mode and A-mode US devices at the same sites as the previous test, following the same procedure.
2.3. Data analysis
As shown in Figure 2, B-mode US images were analyzed by clinical experts to establish three reference datasets, which included data related to muscle and fat thickness as well as MQ. These categorized B-mode US images served as the foundation for analyzing the A-mode US signals. Figure 3a outlines the complete signal processing for A-mode US. The analysis of A-mode US signals involved the removal of unwanted signals, such as noise, beyond the pulse wave signals emitted from the US probe and the output frequency. Signal variations for each signal within the pre-processed US signals were analyzed, and sparkle noise generated within the US signals was eliminated. Distinctive features of signals originating from the starting point of the skin and subcutaneous fat layer, signals at the ending point of the subcutaneous fat layer, and signals at the beginning and ending points of the muscle layer were identified. As illustrated in Figure 3b, this differentiation allowed for the classification of subcutaneous fat and muscle layers, enabling measurements of subcutaneous fat thickness (SFT) and muscle thickness (MT). For the portion classified as the muscle layer, the fascia surrounding the muscle was removed to facilitate MQ assessment, which was subsequently conducted. Signal enhancement techniques, including filtering, normalization, and noise reduction algorithms, were applied to enhance signal quality. The variation analysis method was employed to capture unique features within each signal and contributed to the accurate identification of tissue boundaries. Furthermore, a specific algorithm was used for sparkle noise removal to ensure precise measurements. The MQ assessment involved quantifying the quality of muscle tissue within the identified regions.
2.4. Exercise
The participants exercised using 3kg dumbbells during one session, performing at least 3 sets of 10 repetitions, with additional sets as needed to stimulate muscles.
2.4.1. Dumbbell shrugs targeting upper trapezius muscle
Participants were instructed to stand shoulder-width apart, grab a pair of dumbbells, and hold them by their sides. While engaging their core and maintaining a neutral head and neck position, they slowly raised their shoulders straight up toward their ears. Afterward, slowly lowering their shoulders back to the starting position, they repeated this movement.
2.4.2. Dumbbell curl targeting biceps brachii muscle
Subjects were instructed to stand shoulder-width apart and hold the dumbbells by their sides with their palms facing forward. While engaging their core and keeping their arms at length with a slight bend in their elbows, they slowly bent their elbows until their lower arms contacted their upper arms. They then slowly straightened their elbows to return to the starting position.
2.5. Statistical analysis
The data analyst refrained from conducting US measurements proceeded with statistical analysis. SPSS 21.0 (SPSS Inc., Chicago, IL, USA) was used for statistical analysis. For all tests, P < 0.05 was considered statistically significant. Initially, demographic characteristics of the sample were outlined based on gender. The statistical significance of the differences in measurements between men and women was assessed using Student’s t-test. Validity analyses of the A-mode device were performed against B-mode measurements. Equivalence tests of means showed that a difference of 1 mm as delta, indicated no significant mean difference (MD) between A-mode and B-mode measurements. An Intra-class Correlation Coefficients (ICCs) value 0.50 was considered as low, values of 0.50 to 0.75 were considered moderate, 0.75 was considered as good and 0.90 was considered as excellent. Bland-Altman analysis was employed, including the average of A-mode and B-mode plotted against each participant’s error score, along with the 95% limits of agreement (LOA). Finally, paired t-tests were applied to examine before-and-after exercise measurements.
3. Results
3.1. Study population
A total of 30 volunteers (15 males, 15 females) completed the study. Upon examining the sample’s characteristics, Table 1 shows significant differences in height and weight between men and women. The male group exhibited an age range of 24-31 years (27.5 ± 2.6 years), height ranging from 169.8 to 191.4 cm (175.4 ± 5.9 cm), weight ranging from 54.0 to 94.0 kg (74.5 ± 11.0 kg), and a body mass index ranging from 17.8 to 32.6 kg/m2 (24.2 ± 3.2 kg/m2). The female group showed an age range of 22-44 years (30.5 ± 6.1 years), height ranging from 150.0 to 173.3 cm (163.3 ± 6.9 cm), weight ranging from 48.0 to 68.0 kg (56.2 ± 6.9 kg), and a body mass index ranging from 17.4 to 26.2 kg/m2 (21.1 ± 2.4 kg/m2).
3.2. Changes in SFT before and after exercise
The Table 2 summarizes the analysis of MD and ICCs. MD between the two devices consistently remained below 0.15 mm across all measurements. Equivalence tests of means indicated no significant differences between the two modes (p > 0.05). The ICCs surpassed the excellent threshold of 0.90 at all measures. Bland and Altman plots illustrating residual scores for the trapezius and biceps brachii are depicted in Figure 4. The MD at the trapezius and biceps brachii was 0.1, with 95% LOA ranging from -0.2 to 0.3 and -0.2 to 0.4, respectively. These values did not change pre and post exercise in both muscles. Correlation coefficients between error scores and average scores at the trapezius were .379 at pre-exercise and .284 at post-exercise (p > 0.05), indicating no evidence of systematic bias. Similarly, correlation coefficients at the biceps brachii were .472 at pre-exercise and .421 at post-exercise (p > 0.05), suggesting that errors were evenly distributed.
3.3. Changes in MT before and after exercise
Concerning MD and ICCs of MT, MD were below 0.22 mm across all measurements, indicating no significant differences between the A-mode and B-mode (p > 0.05). The ICCs surpassed 0.99 at all measures, as shown in Table 3. Figure 5 depicts Bland and Altman plots illustrating residual scores for the trapezius and biceps brachii. The MD at the pre- and post-exercise trapezius was the same at 0.1, with 95% LOA ranging from -0.2 to 0.4 and -0.3 to 0.4, respectively. The MD at the pre- and post-exercise biceps brachii was the same at 0.1, with 95% LOA ranging from -0.3 to 0.5 and -0.4 to 0.6, respectively. Correlation coefficients between error scores and average scores at the trapezius and biceps brachii ranged from -0.103 to 0.087 (p > 0.05), indicating no evidence of systematic bias.
3.4. Changes in MQ before and after exercise
The Table 4 provides a summary of the analysis of MQ. MD remained below 1 mm across all measurements, with ICCs consistently surpassing 0.95. In MQ between the two modes, equivalence tests of means indicated no significant differences (p > 0.05), and ICCs were considered excellent. Examining Figure 6, Bland and Altman plots revealed that the 95% LOA at the pre- and post-exercise trapezius were -1.7 to 3.2 and -1.8 to 2.8, respectively. Additionally, the 95% LOA at the pre- and post-exercise biceps brachii were -1.5 to 3.1 and -1.4 to 2.7, respectively. Correlation coefficients between error scores and average scores at the trapezius and biceps brachii ranged from -0.207 to 0.268 (p > 0.05), suggesting no evidence of systematic error.
3.5. MT and MQ change before and after exercise in the A-mode and B-mode
As shown in Table 5, the study results statistically confirmed a significant increase in the MT and MQ of the trapezius for all participants after exercise (p<0.05). Biceps brachii MT significantly increased after exercise (p<0.05), while this enhancement was not apparent in the MQ of biceps brachii after exercise. Examining the male and female groups, there was no notable increase in the MT and MQ of the trapezius in the females and the biceps brachii in males. These findings were consistent in both A-mode and B-mode.
4. Discussion
In this study, we evaluated the accuracy of A-mode US for measuring SFT, MT and MQ, comparing it to B-mode US measures. We introduced exercise to induce various changes in the muscles and confirmed that both US modes were capable of detecting these post-exercise muscle changes. The comprehensive distribution of muscles throughout the body can provide important diagnostic insights for various myopathies [3,4]. Therefore, we examined specific muscles at different sites. To the best of our knowledge, this is the first research to validate A-mode US as a clinically viable means for assessing MQ, which refers to the degree of adipose and/or connective tissue infiltration into the muscle [14].
We observed excellent accuracy between A-mode and B-mode assessments of SFT and MT, with MD between devices of less than 0.22mm, and correlation coefficients exceeding 0.996 in all measures. These findings align with previous studies that evaluated the accuracy of A-mode in measuring SFT [11,12]. Notably, past research has highlighted challenges in specific areas, such as the abdominal region, where interpreting the B-mode scan can be difficult, potentially leading to errors in A-mode US measurements [15]. Wagner et al.'s study reported the highest correlation coefficients at the triceps site among various locations (chest, midaxilla, triceps, subscapula, abdomen, anterior suprailiac, and thigh) [11]. In our study, we measured the upper trapezius and biceps brachii, demonstrating high validity with the A-mode device.
To evaluate the composition of skeletal muscle, Hounsfield units (HU) in CT images (CT value) or MRI signal intensity can be utilized [5,16]. However, obtaining these values poses challenges due to the need for specialized equipment and measurement burdens such as time, cost, and radiation exposure [5]. Recent studies have shown the validity of muscular EI as a marker of MQ [5,9,17]. EI reflects the presence of intramuscular adipose tissue and muscle density [5,9]. EI is determined by the pixel density in US images and was initially quantified by visual scoring (arbitrarily depicting if an image is darker or lighter) from US images [17]. Nowadays, many researchers use image-processing software to assess EI by quantifying the pixel intensity in US images [17]. EI is recognized as a non-invasive, readily available, and cost-effective technique compared to other imaging systems [5,9,17,18].
MQ data from the present study demonstrate the high validity of A-mode, with MD of less than 0.91mm and correlation coefficients exceeding 0.95 both before and after exercise. To quantify muscle composition from US images, we defined the EI value as the mean pixel intensity within a region of interest in the muscle using grayscale analysis. It is crucial to establish a critical point for the EI value to differentiate between muscle and fat. We set the threshold as the average value observed both before and after exercise to ensure consistency in assessing MQ before and after exercise.
The results of this study have statistically confirmed a significant increase in the MT of the trapezius and biceps brachii muscles of all participants after exercise (p<0.05). However, there was no significant increase in the MT of the trapezius muscle in females and the biceps brachii in males after exercise. These findings were consistent in both A-mode and B-mode. The exercise-induced transient hypertrophy of muscles, primarily attributed to the accumulation of fluids such as water and blood, is a well-established phenomenon [19]. However, the absence of temporary hypertrophy in certain cases may be due to insufficient exercise intensity or variations in individual physiological responses to muscle stimulation [19,20]. Especially, the trapezius muscle, being less frequently used in daily activities compared to other muscles, may face challenges in responding to high-intensity exercise.
When examining MQ, we observed enhanced MQ in the trapezius muscles of all participants and in men after exercise, while this improvement was not evident in the biceps brachii muscles. Both A-mode and B-mode US reflected these changes in MQ post-exercise. Neither MT nor MQ showed significant improvements in the trapezius muscles of females and the biceps brachii muscles in males after exercise, suggesting that the intensity of the dumbbell exercises performed on the trapezius muscles in women and the biceps muscles in men might not have been sufficient.
An increase in EI is associated with changes resulting from elevated fibrous and adipose tissue [5,9]. Some studies suggest that substituting contractile tissue with fibrous and adipose tissue may reduce muscle strength or power per unit of muscle mass, proposing that a darker EI corresponds to strong muscle strength [21,22]. The prediction of changes in MQ is based on alterations in EI, but recent research indicates changes in EI are not consistent following resistance training [17].
According to Wong et al., in more than half of the 16 studies, changes in EI used as a marker of MQ after exercise have been reported to increase or remain unchanged following repeated bouts of resistance [17]. It is conceivable that a change in EI represents a range of physiological effects at different time points [17]. Physical activity can cause a relative expansion of extracellular water and trigger an acute inflammatory response, releasing inflammatory markers and causing an influx of immune cells, resulting in changes in tissue properties such as an increase in EI [23,24]. In contrast, the acute exercise heightened the hydrophilic nature of glycogen, leading to increased water attraction. This phenomenon can result in hypoechoic (black) US images, contributing to lower EI [17,25]. Therefore, these findings lead to conclusions that appear inconsistent with the expected physiological effects of exercise [17].
This study has several limitations. Firstly, the sample exclusively comprised the triceps and biceps brachii muscles of young and healthy individuals. This suggests that the results might not be universally applicable across diverse demographic groups or other measurement sites, such as abdominal areas. Secondly, in A-mode measurements, inherent limitations of ultrasonic signals, such as signal attenuation and absorption, can result in signal distortion. This distortion is influenced by the strength and angle of pressing the probe. Additionally, errors in B-mode ultrasonic measurements may occur depending on the projection angle of the probe. While muscle size measurements appear to be minimally affected by the tilt of the US probe (tilted within a range of 6° perpendicular to the muscle), there are significant changes in EI [26]. Lastly, the study did not investigate inter-examiner reliability. While the investigator in this study possessed extensive experience in conducting these measurements, it is conceivable that examiners with varying levels of experience might generate different results.
Despite these limitations, data from the present study suggest that low-resolution A-mode US provides valid measurements of SFT, MT, and MQ comparable to those obtained through high-resolution B-mode imaging. Furthermore, it notably detects exercise-induced muscle compositions and quality, similar to B-mode. A-mode US can be an affordable and portable alternative for muscle assessment. It could serve as an acceptable and practical option for individuals lacking access to pricier B-mode devices.
Finally, future work should focus on additional experiments incorporating biological signals from various body parts to refine the evaluation method and estimation equation for MQ. The accurate assessment of muscles necessitates the identification of complex structures, such as fascia. Subsequent research demonstrating the precision of A-mode US in measuring structures surrounding muscle could establish A-mode as a more reliable tool for future muscle evaluation. Furthermore, given that the experimental data in this study exclusively focused on normal subjects, it is imperative to complement it with additional experiments involving patient groups, particularly those with musculoskeletal disorders. Comprehensive data analysis through these extensive studies will aid in the development of useful tools for muscle evaluation.
5. Conclusions
We assessed the precision of A-mode US for measuring SFT, MT, and MQ, comparing it with B-mode US measurements. By introducing exercise to induce diverse muscle changes, we validated that A-mode US effectively detected post-exercise alterations in the muscles. A-mode US can be an affordable and portable alternative for assessing muscles, especially in situations with constrained resources, where B-mode US is not available.
Author Contributions
Conceptualization, S.-Y.P.; methodology, software, validation, formal analysis, investigation, resources, data curation, S.-Y.P. and J.-W.L.; writing—original draft preparation, J.-W.L.; writing—review and editing, S.-Y.P. and J.-W.L.; visualization, J.-W.L and S.-Y.P.; supervision, S.-Y.P., S.-U.H. and J.-H.L.; project administration S.-Y.P., S.-U.H. and J.-H.L.; funding acquisition, S.-Y.P. All authors have read and agreed to the published version of the manuscript.
Funding
This research received no external funding.
Institutional Review Board Statement
The study was conducted in accordance with the Declaration of Helsinki, and approved by the Institutional Review Board of Dongguk University Ilsan Oriental Hospital (protocol code DUIOH 2022-07-006-003 and 22/09/2022).
Informed Consent Statement
Informed consent was obtained from all subjects involved in the study.
Data Availability Statement
The raw data supporting the conclusion of this article will be made available by the authors, without undue reservation.
Acknowledgments
This work was supported by Institute of Information & communications Technology Planning & Evaluation (IITP) grant funded by the Korea government (MSIT) (No.2022-0-00922, Development of customized personal low-frequency stimulator using ultrasound-based artificial intelligence). This work was supported by Institute of Information & communications Technology Planning & Evaluation (IITP) grant funded by the Korea government (MSIT) (No.2022-0-00922, Development of customized personal low-frequency stimulator using ultrasound-based artificial intelligence).
Conflicts of Interest
The authors declare no conflict of interest.
References
- Artero, E. G.; Lee, D. C.; Lavie, C. J.; Espana-Romero, V.; Sui, X.; Church, T. S.; Blair, S. N. Effects of muscular strength on cardiovascular risk factors and prognosis. J Cardiopulm Rehabil Prev 2012, 32, 351–358. [Google Scholar] [CrossRef]
- Farsijani, S.; Santanasto, A. J.; Miljkovic, I.; Boudreau, R. M.; Goodpaster, B. H.; Kritchevsky, S. B.; Newman, A. B. The Relationship Between Intermuscular Fat and Physical Performance Is Moderated by Muscle Area in Older Adults. J Gerontol A Biol Sci Med Sci 2021, 76, 115–122. [Google Scholar] [CrossRef]
- Addison, O.; Marcus, R. L.; Lastayo, P. C.; Ryan, A. S. Intermuscular fat: a review of the consequences and causes. Int J Endocrinol 2014, 2014, 309570. [Google Scholar] [CrossRef]
- Mah, J. K.; van Alfen, N. Neuromuscular Ultrasound: Clinical Applications and Diagnostic Values. Can J Neurol Sci 2018, 45, 605–619. [Google Scholar] [CrossRef]
- Watanabe, Y.; Ikenaga, M.; Yoshimura, E.; Yamada, Y.; Kimura, M. Association between echo intensity and attenuation of skeletal muscle in young and older adults: a comparison between ultrasonography and computed tomography. Clin Interv Aging 2018, 13, 1871–1878. [Google Scholar] [CrossRef]
- Stringer, H. J.; Wilson, D. The Role of Ultrasound as a Diagnostic Tool for Sarcopenia. J Frailty Aging 2018, 7, 258–261. [Google Scholar] [CrossRef]
- Storchle, P.; Muller, W.; Sengeis, M.; Lackner, S.; Holasek, S.; Furhapter-Rieger, A. Measurement of mean subcutaneous fat thickness: eight standardised ultrasound sites compared to 216 randomly selected sites. Sci Rep 2018, 8, 16268. [Google Scholar] [CrossRef]
- Ackland, T. R.; Lohman, T. G.; Sundgot-Borgen, J.; Maughan, R. J.; Meyer, N. L.; Stewart, A. D.; Müller, W. Current status of body composition assessment in sport: review and position statement on behalf of the ad hoc research working group on body composition health and performance, under the auspices of the I.O.C. Medical Commission. Sports Med 2012, 42, 227–249. [Google Scholar] [CrossRef]
- Sahinis, C.; Kellis, E. Hamstring Muscle Quality Properties Using Texture Analysis of Ultrasound Images. Ultrasound Med Biol 2023, 49, 431–440. [Google Scholar] [CrossRef]
- Correa-de-Araujo, R.; Harris-Love, M. O.; Miljkovic, I.; Fragala, M. S.; Anthony, B. W.; Manini, T. M. The Need for Standardized Assessment of Muscle Quality in Skeletal Muscle Function Deficit and Other Aging-Related Muscle Dysfunctions: A Symposium Report. Front Physiol 2017, 8, 87. [Google Scholar] [CrossRef]
- Wagner, D. R.; Teramoto, M.; Judd, T.; Gordon, J.; McPherson, C.; Robison, A. Comparison of A-mode and B-mode Ultrasound for Measurement of Subcutaneous Fat. Ultrasound Med Biol 2020, 46, 944–951. [Google Scholar] [CrossRef]
- Wagner, D. R.; Thompson, B. J.; Anderson, D. A.; Schwartz, S. A-mode and B-mode ultrasound measurement of fat thickness: a cadaver validation study. Eur J Clin Nutr 2019, 73, 518–523. [Google Scholar] [CrossRef]
- Bielemann, R. M.; Gonzalez, M. C.; Barbosa-Silva, T. G.; Orlandi, S. P.; Xavier, M. O.; Bergmann, R. B.; Assuncao, M. C.; Grupo de Estudos em Composicao Corporal e, N.-C. Estimation of body fat in adults using a portable A-mode ultrasound. Nutrition 2016, 32, 441–446. [Google Scholar] [CrossRef]
- Cho, Y. K.; Jung, H. N.; Kim, E. H.; Lee, M. J.; Park, J. Y.; Lee, W. J.; Kim, H. K.; Jung, C. H. Association between sarcopenic obesity and poor muscle quality based on muscle quality map and abdominal computed tomography. Obesity (Silver Spring) 2023, 31, 1547–1557. [Google Scholar] [CrossRef]
- Muller, W.; Horn, M.; Furhapter-Rieger, A.; Kainz, P.; Kropfl, J. M.; Maughan, R. J.; Ahammer, H. Body composition in sport: a comparison of a novel ultrasound imaging technique to measure subcutaneous fat tissue compared with skinfold measurement. Br J Sports Med 2013, 47, 1028–1035. [Google Scholar] [CrossRef]
- Kent-Braun, J. A.; Ng, A. V.; Young, K. Skeletal muscle contractile and noncontractile components in young and older women and men. J Appl Physiol (1985) 2000, 88, 662–668. [Google Scholar] [CrossRef]
- Wong, V.; Spitz, R. W.; Bell, Z. W.; Viana, R. B.; Chatakondi, R. N.; Abe, T.; Loenneke, J. P. Exercise induced changes in echo intensity within the muscle: a brief review. J Ultrasound 2020, 23, 457–472. [Google Scholar] [CrossRef]
- Van den Broeck, J.; Héréus, S.; Cattrysse, E.; Raeymaekers, H.; De Maeseneer, M.; Scafoglieri, A. Reliability of Muscle Quantity and Quality Measured With Extended-Field-of-View Ultrasound at Nine Body Sites. Ultrasound in Medicine & Biology 2023, 49, 1544–1549. [Google Scholar] [CrossRef]
- Taber, C. B.; Vigotsky, A.; Nuckols, G.; Haun, C. T. Exercise-Induced Myofibrillar Hypertrophy is a Contributory Cause of Gains in Muscle Strength. Sports Med 2019, 49, 993–997. [Google Scholar] [CrossRef]
- Wackerhage, H.; Schoenfeld, B. J.; Hamilton, D. L.; Lehti, M.; Hulmi, J. J. Stimuli and sensors that initiate skeletal muscle hypertrophy following resistance exercise. J Appl Physiol (1985) 2019, 126, 30–43. [Google Scholar] [CrossRef]
- Fukumoto, Y.; Ikezoe, T.; Yamada, Y.; Tsukagoshi, R.; Nakamura, M.; Mori, N.; Kimura, M.; Ichihashi, N. Skeletal muscle quality assessed from echo intensity is associated with muscle strength of middle-aged and elderly persons. Eur J Appl Physiol 2012, 112, 1519–1525. [Google Scholar] [CrossRef]
- Goodpaster, B. H.; Carlson, C. L.; Visser, M.; Kelley, D. E.; Scherzinger, A.; Harris, T. B.; Stamm, E.; Newman, A. B. Attenuation of skeletal muscle and strength in the elderly: The Health ABC Study. J Appl Physiol (1985) 2001, 90, 2157–2165. [Google Scholar] [CrossRef]
- Yitzchaki, N.; Kuehne, T. E.; Mouser, J. G.; Buckner, S. L. Can changes in echo intensity be used to detect the presence of acute muscle swelling? Physiol Meas 2019, 40, 045002. [Google Scholar] [CrossRef]
- Wong, V.; Abe, T.; Chatakondi, R. N.; Bell, Z. W.; Spitz, R. W.; Dankel, S. J.; Loenneke, J. P. The influence of biological sex and cuff width on muscle swelling, echo intensity, and the fatigue response to blood flow restricted exercise. J Sports Sci 2019, 37, 1865–1873. [Google Scholar] [CrossRef]
- Hill, J. C.; Millán, I. S. Validation of musculoskeletal ultrasound to assess and quantify muscle glycogen content. A novel approach. Phys Sportsmed 2014, 42, 45–52. [Google Scholar] [CrossRef]
- Dankel, S. J.; Abe, T.; Bell, Z. W.; Jessee, M. B.; Buckner, S. L.; Mattocks, K. T.; Mouser, J. G.; Loenneke, J. P. The Impact of Ultrasound Probe Tilt on Muscle Thickness and Echo-Intensity: A Cross-Sectional Study. J Clin Densitom 2020, 23, 630–638. [Google Scholar] [CrossRef]
Figure 1.
Ultrasound (US) scanning procedures.
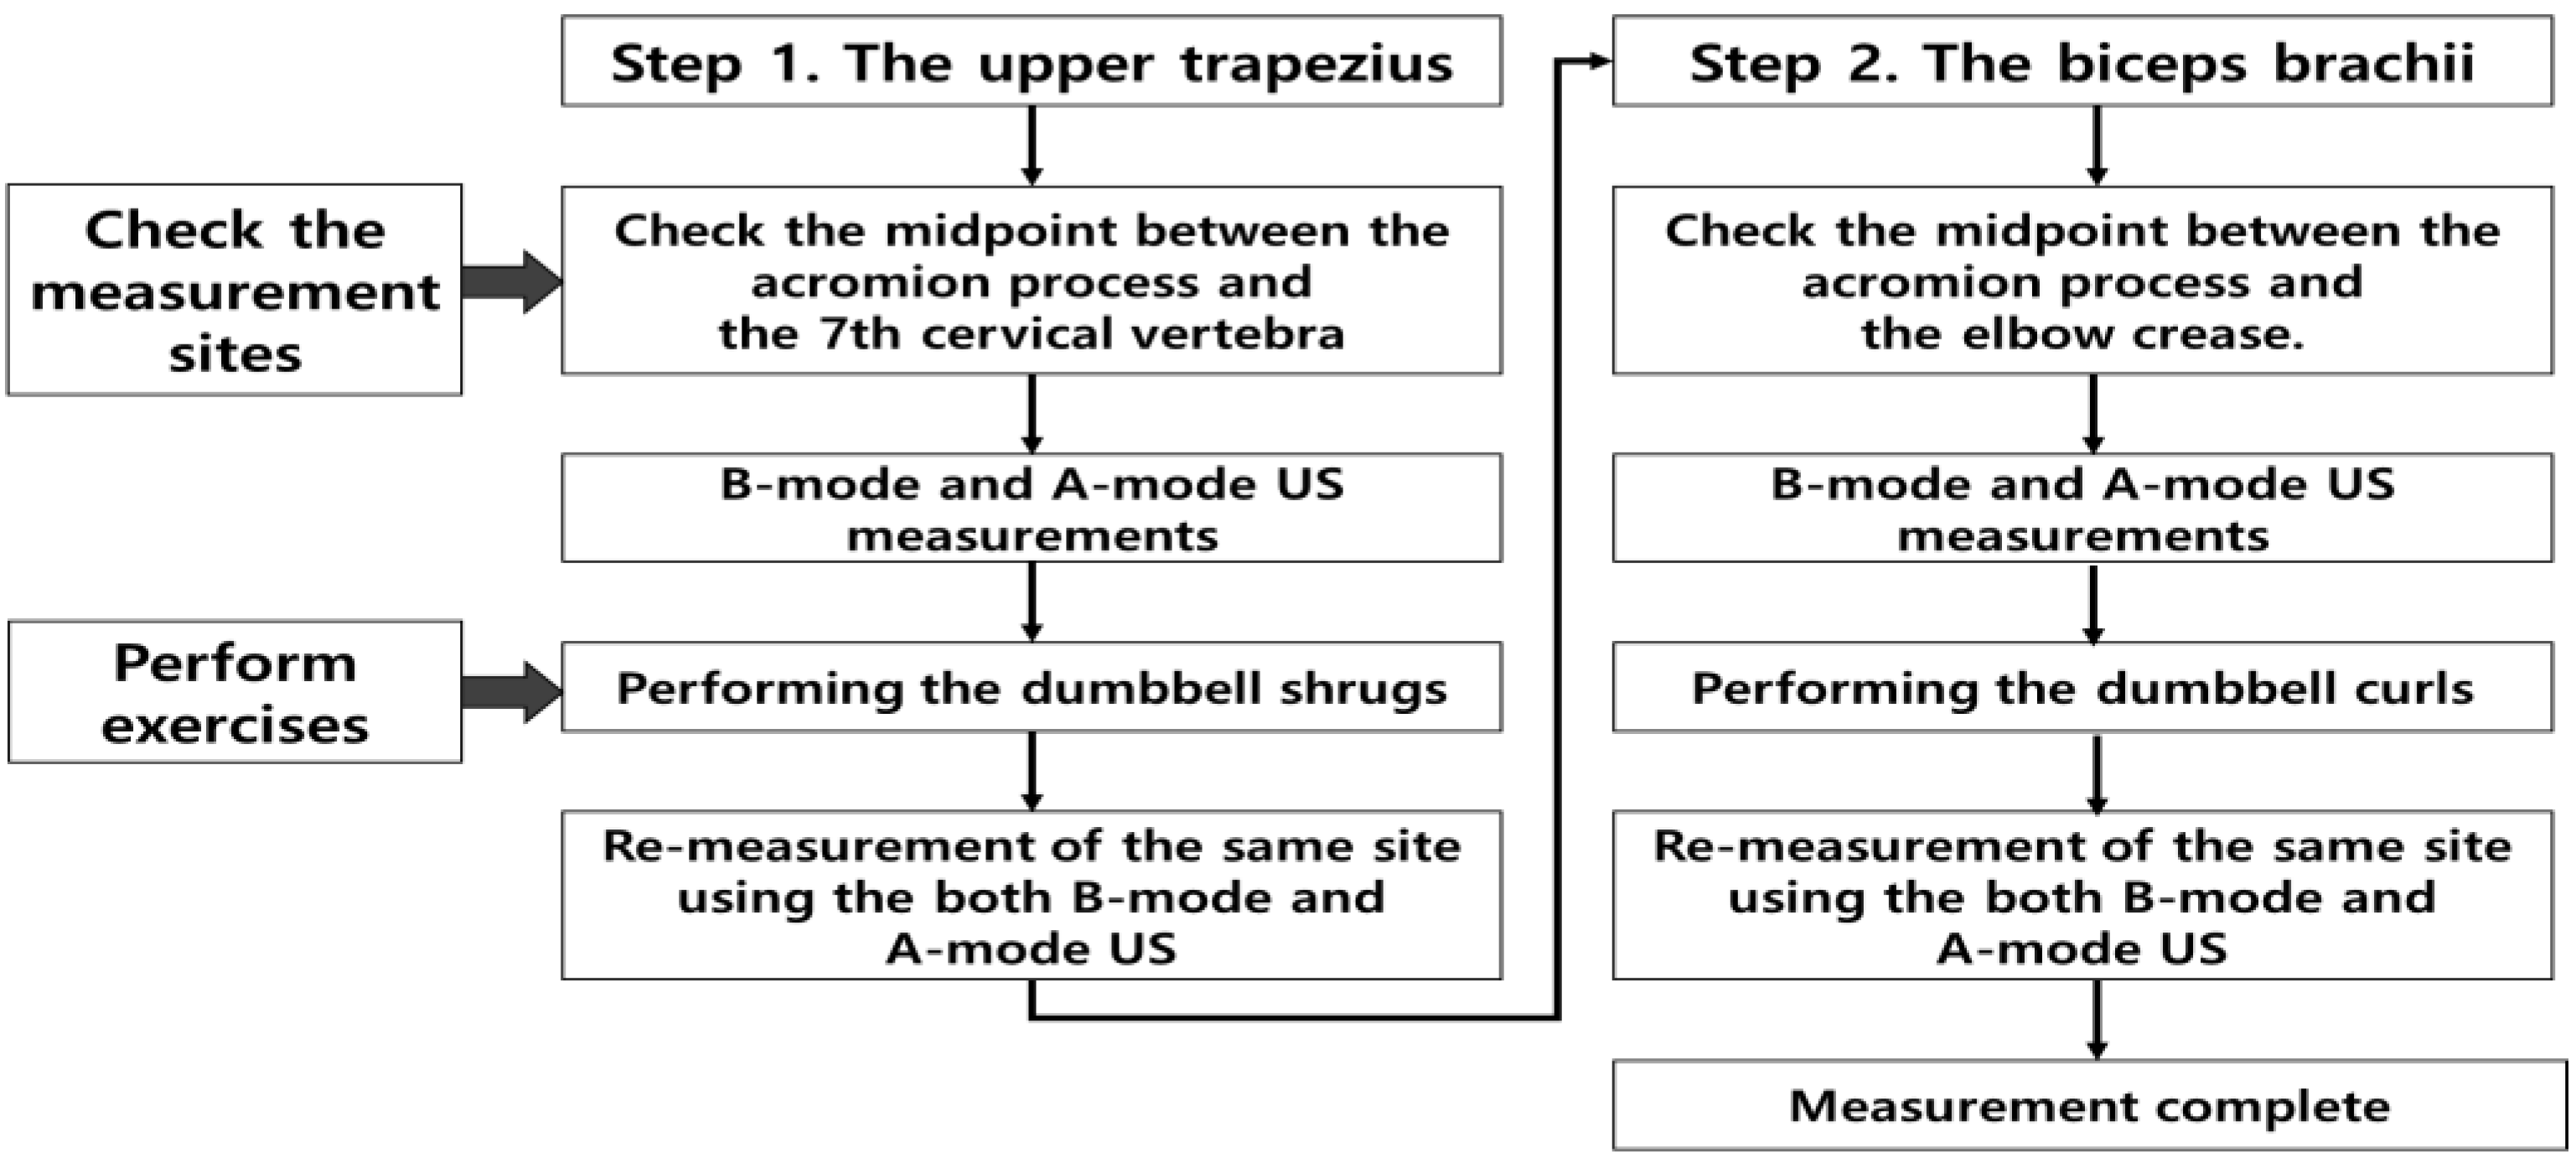
Figure 2.
(a) B-mode measurement and (b) B-mode image analyzed by clinical expert (fat layer for straight line, muscle layer for dash line).
Figure 2.
(a) B-mode measurement and (b) B-mode image analyzed by clinical expert (fat layer for straight line, muscle layer for dash line).
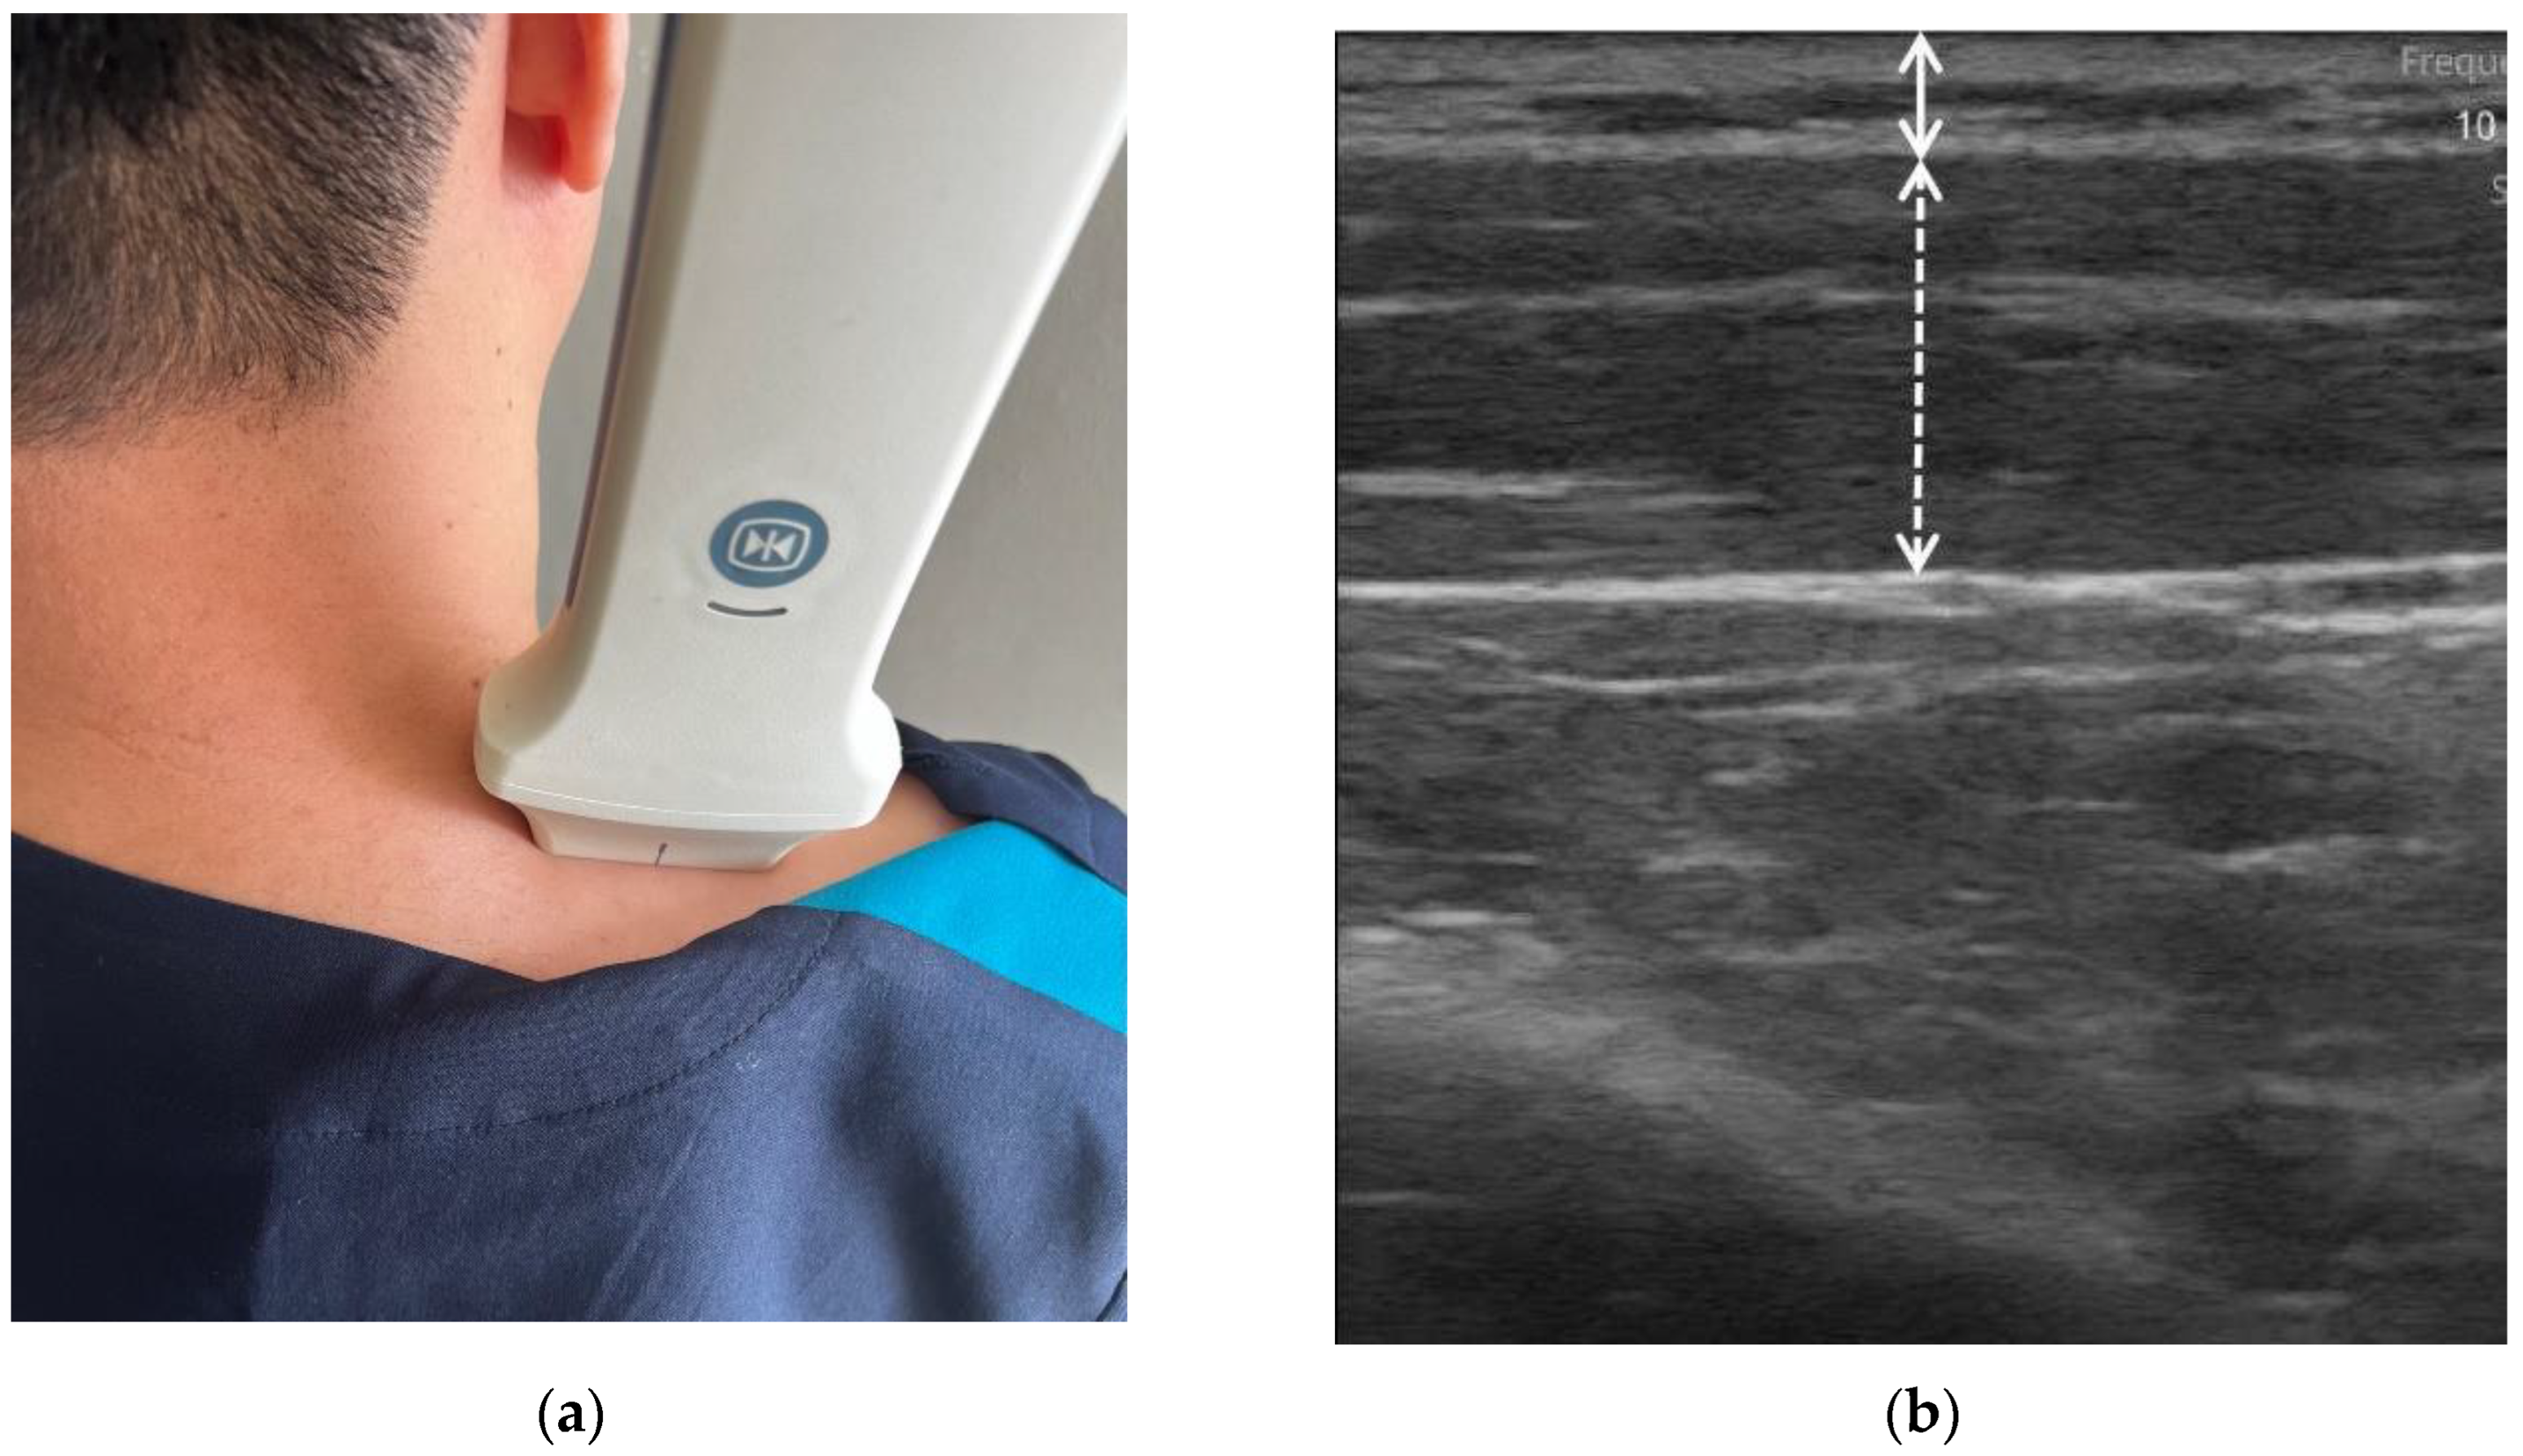
Figure 3.
(a) A-mode US signal processing flowchart; (b) A-mode analyzed signal (fat layer for diamond mark section, and muscle layer for star mark section).
Figure 3.
(a) A-mode US signal processing flowchart; (b) A-mode analyzed signal (fat layer for diamond mark section, and muscle layer for star mark section).
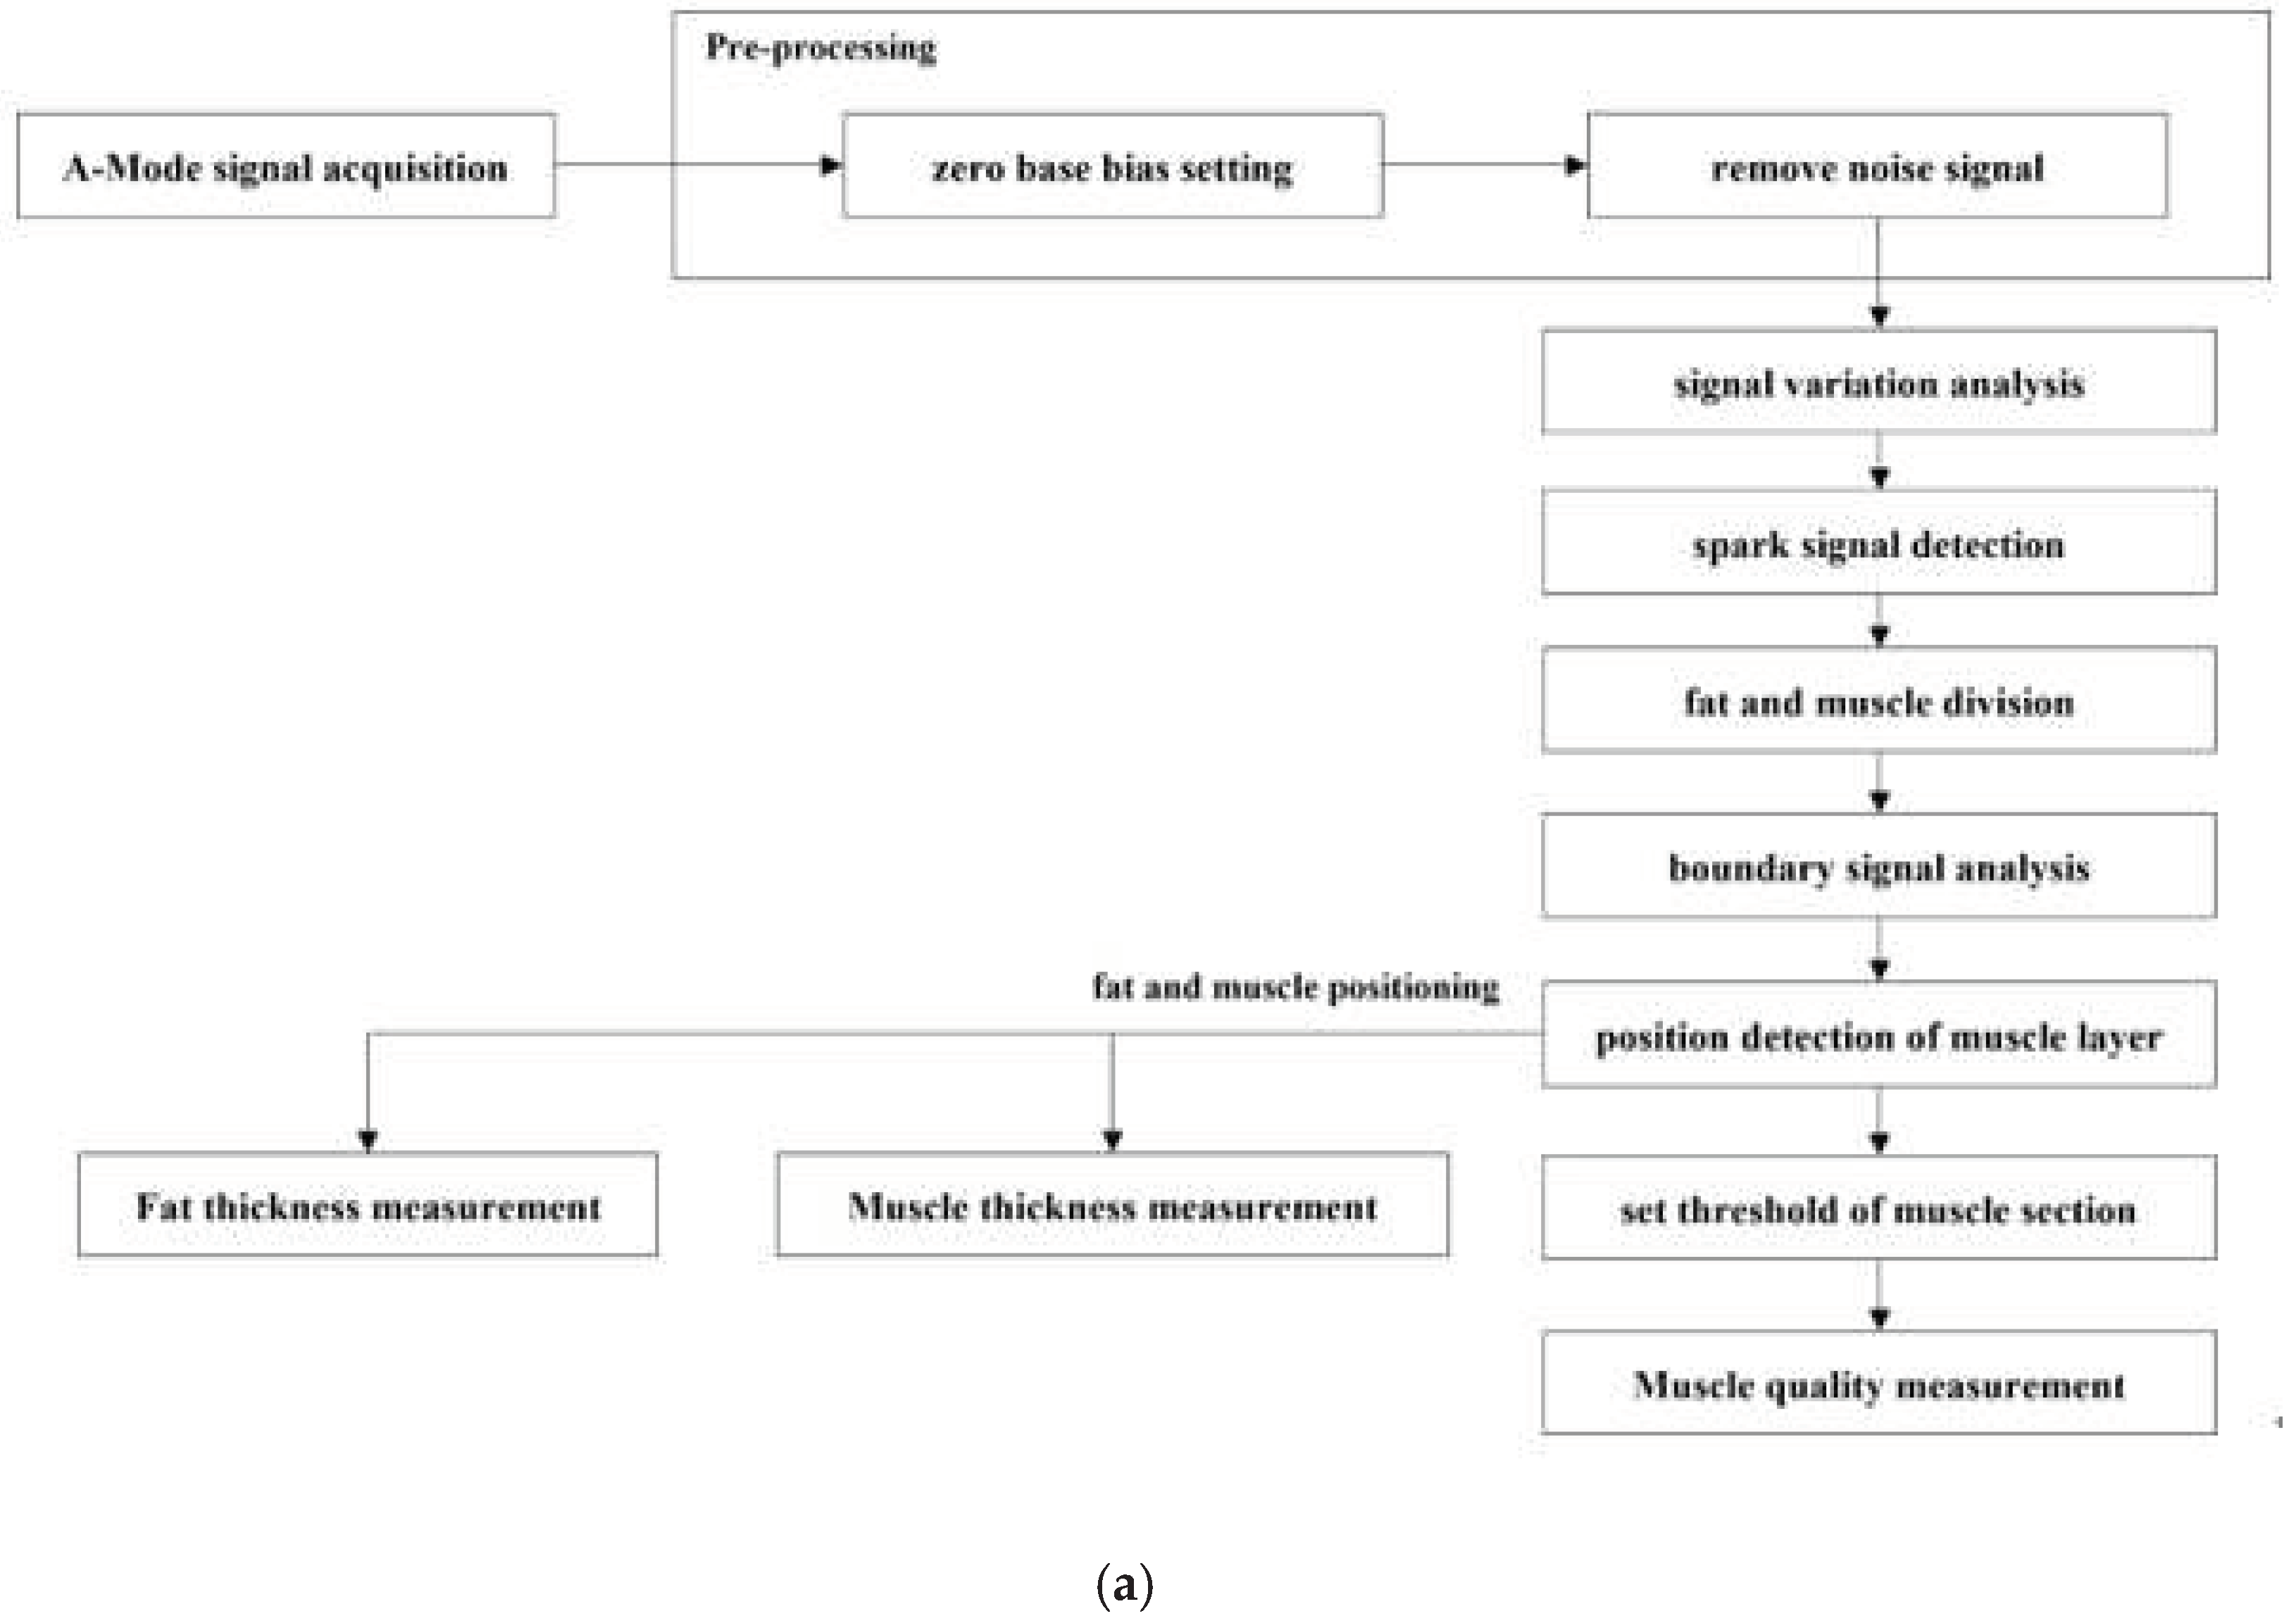
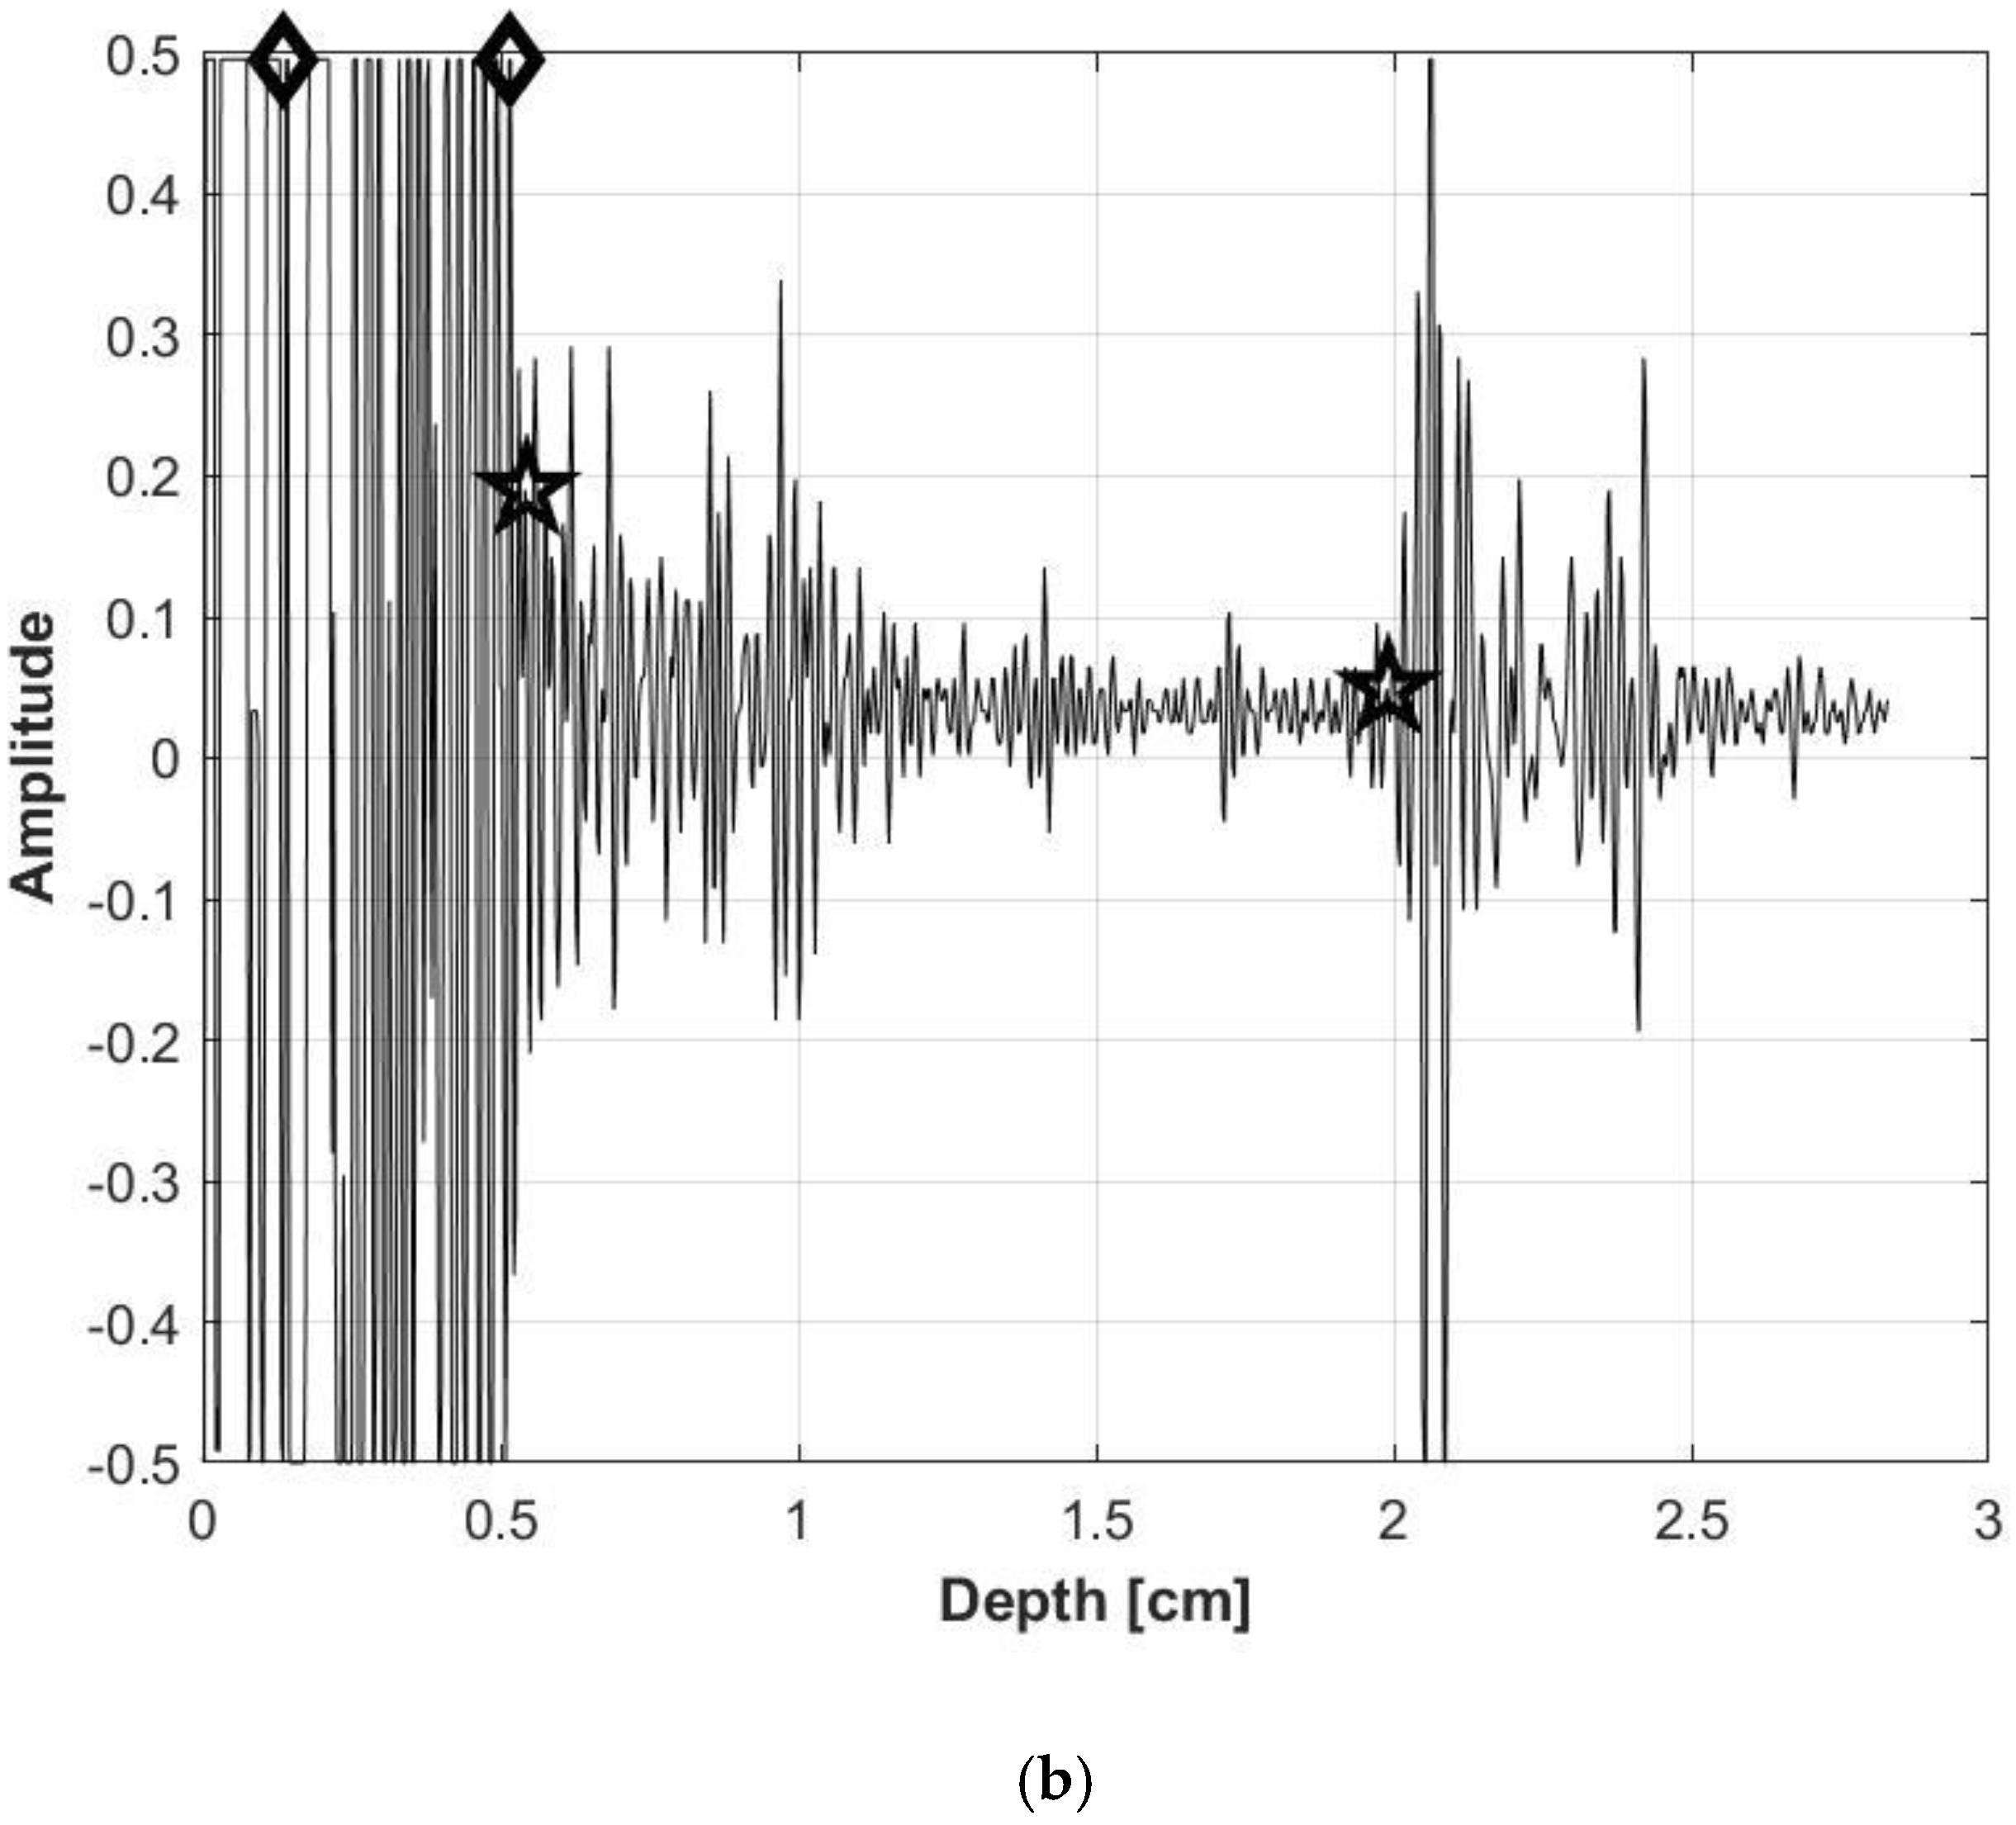
Figure 4.
Bland and Altman plots illustrating residual scores for the trapezius and biceps brachii. (a) Trapezius, pre-exercise; (b) Trapezius, post-exercise; (c) Biceps brachii, pre-exercise; (d) Biceps brachii, post-exercise.
Figure 4.
Bland and Altman plots illustrating residual scores for the trapezius and biceps brachii. (a) Trapezius, pre-exercise; (b) Trapezius, post-exercise; (c) Biceps brachii, pre-exercise; (d) Biceps brachii, post-exercise.
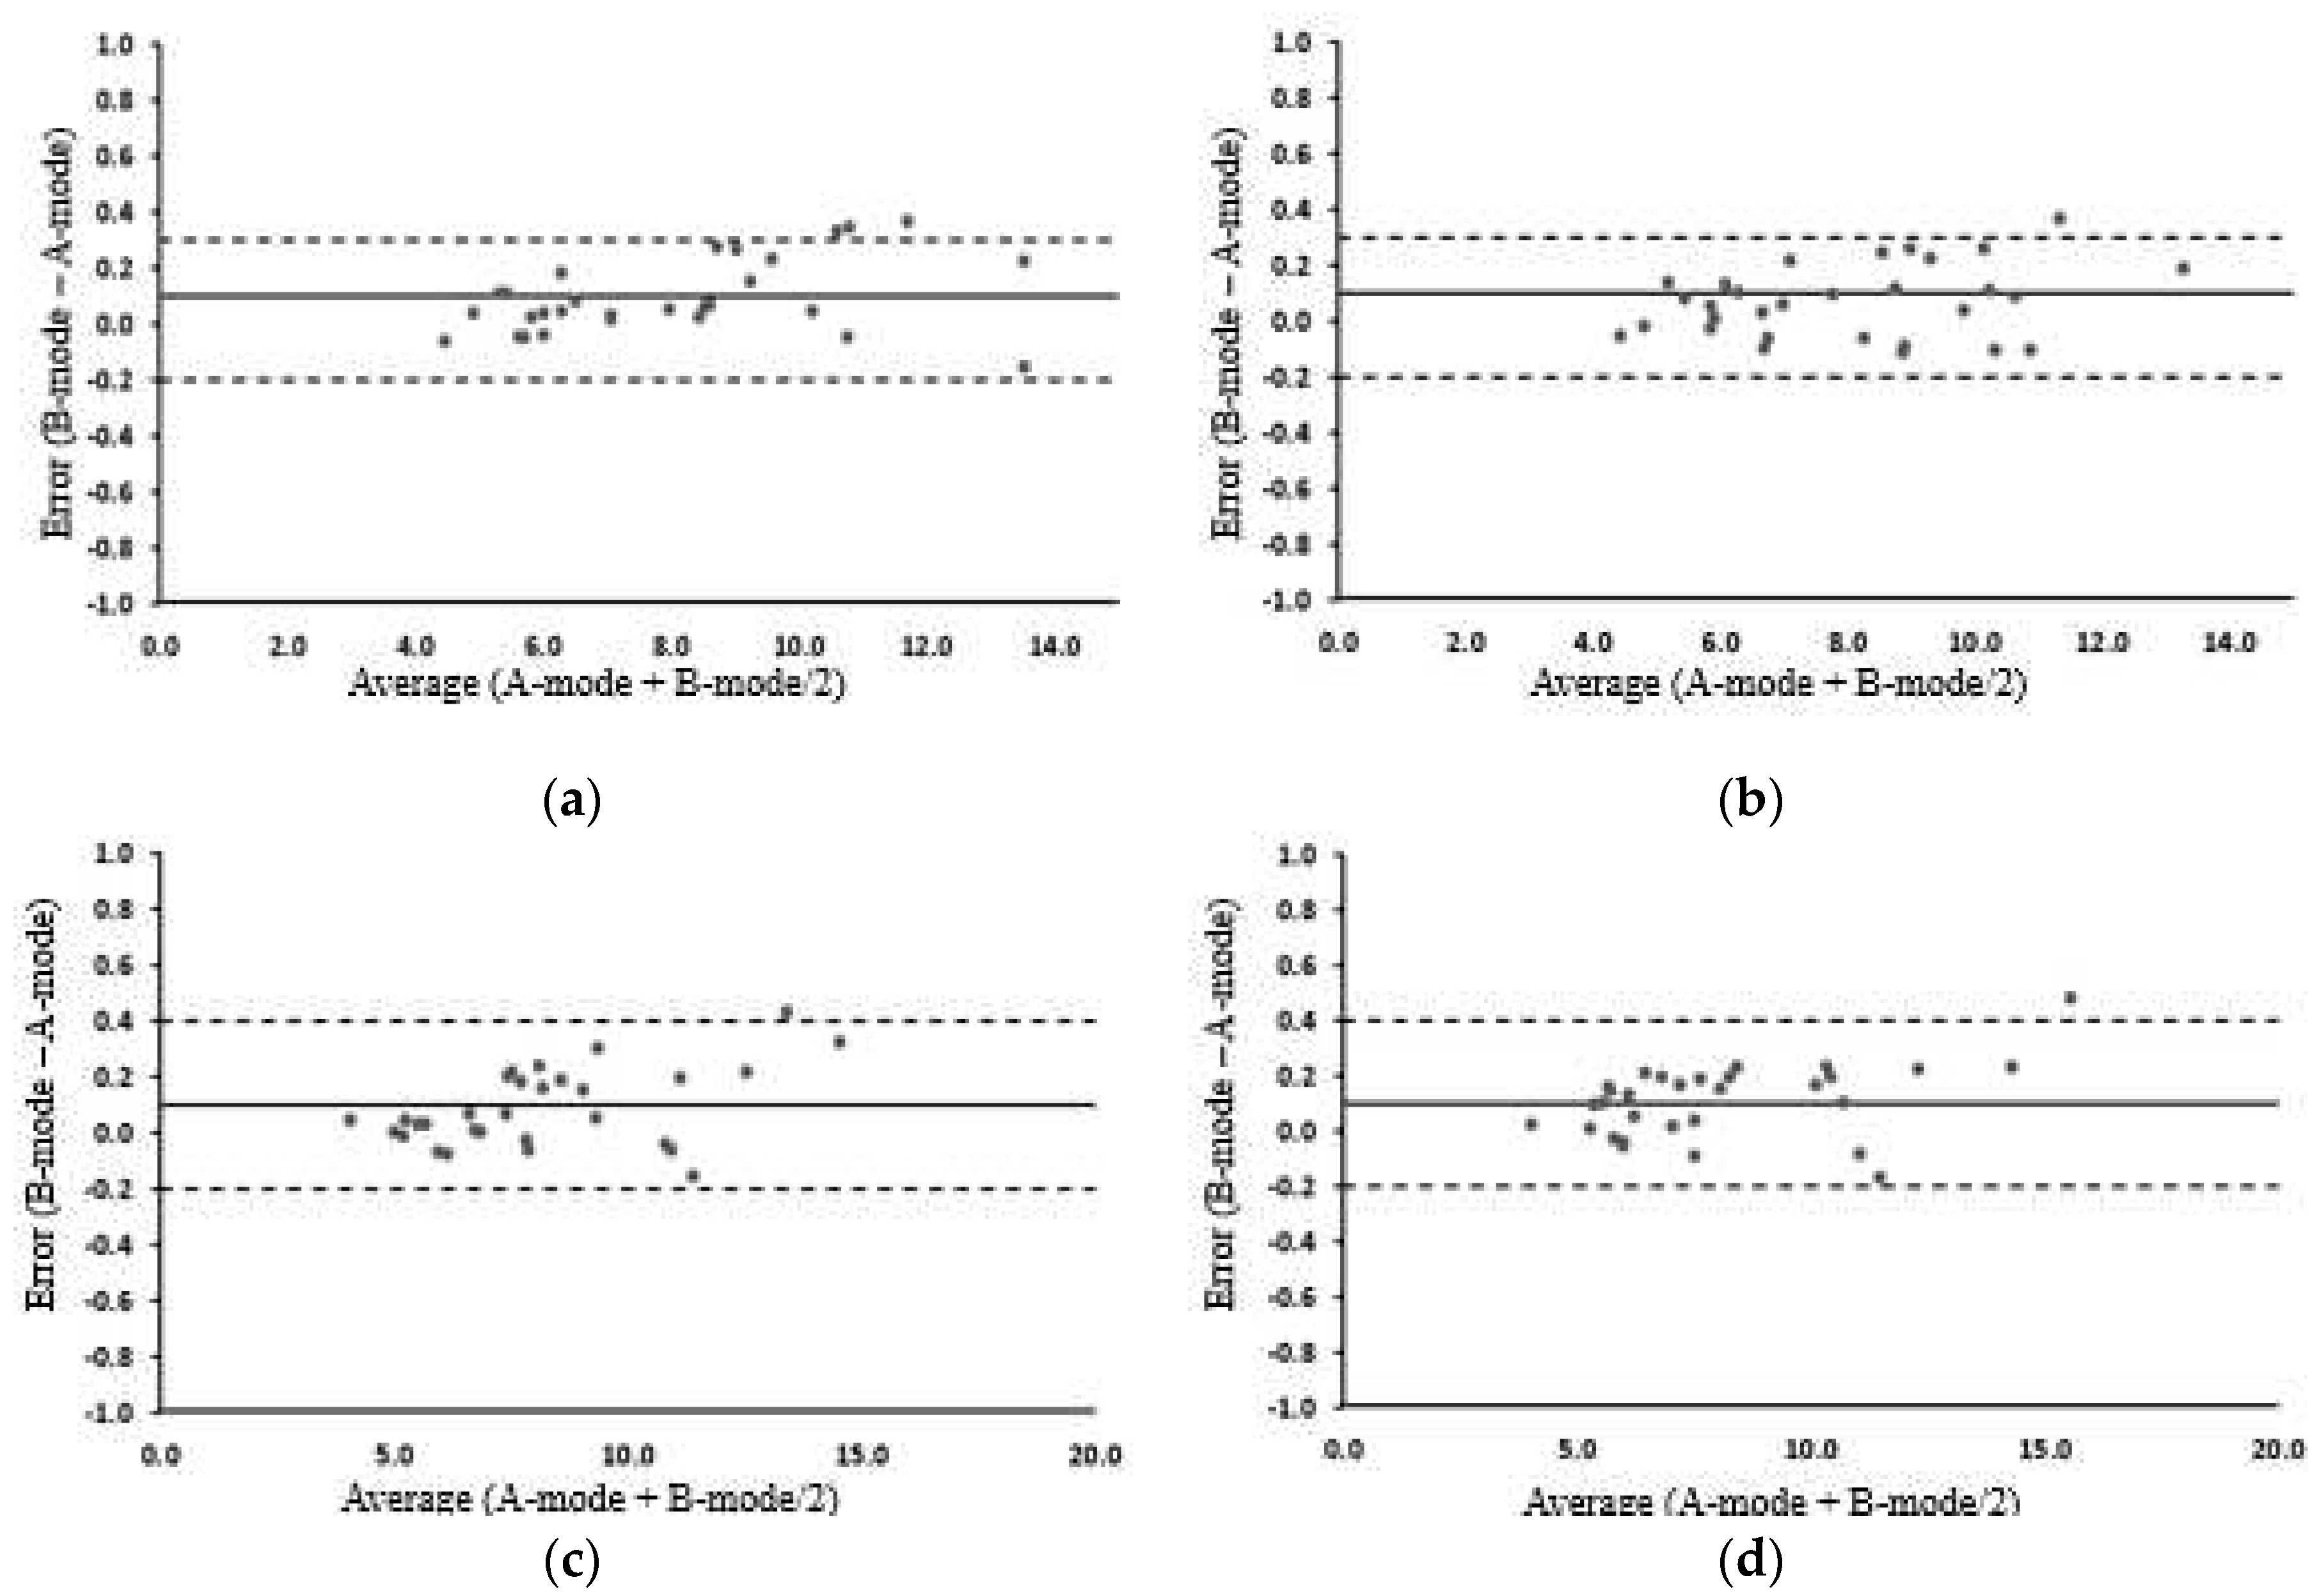
Figure 5.
Bland and Altman plots illustrating residual scores for the trapezius and biceps brachii. (a) Trapezius, pre-exercise; (b) Trapezius, post-exercise; (c) Biceps brachii, pre-exercise; (d) Biceps brachii, post-exercise.
Figure 5.
Bland and Altman plots illustrating residual scores for the trapezius and biceps brachii. (a) Trapezius, pre-exercise; (b) Trapezius, post-exercise; (c) Biceps brachii, pre-exercise; (d) Biceps brachii, post-exercise.
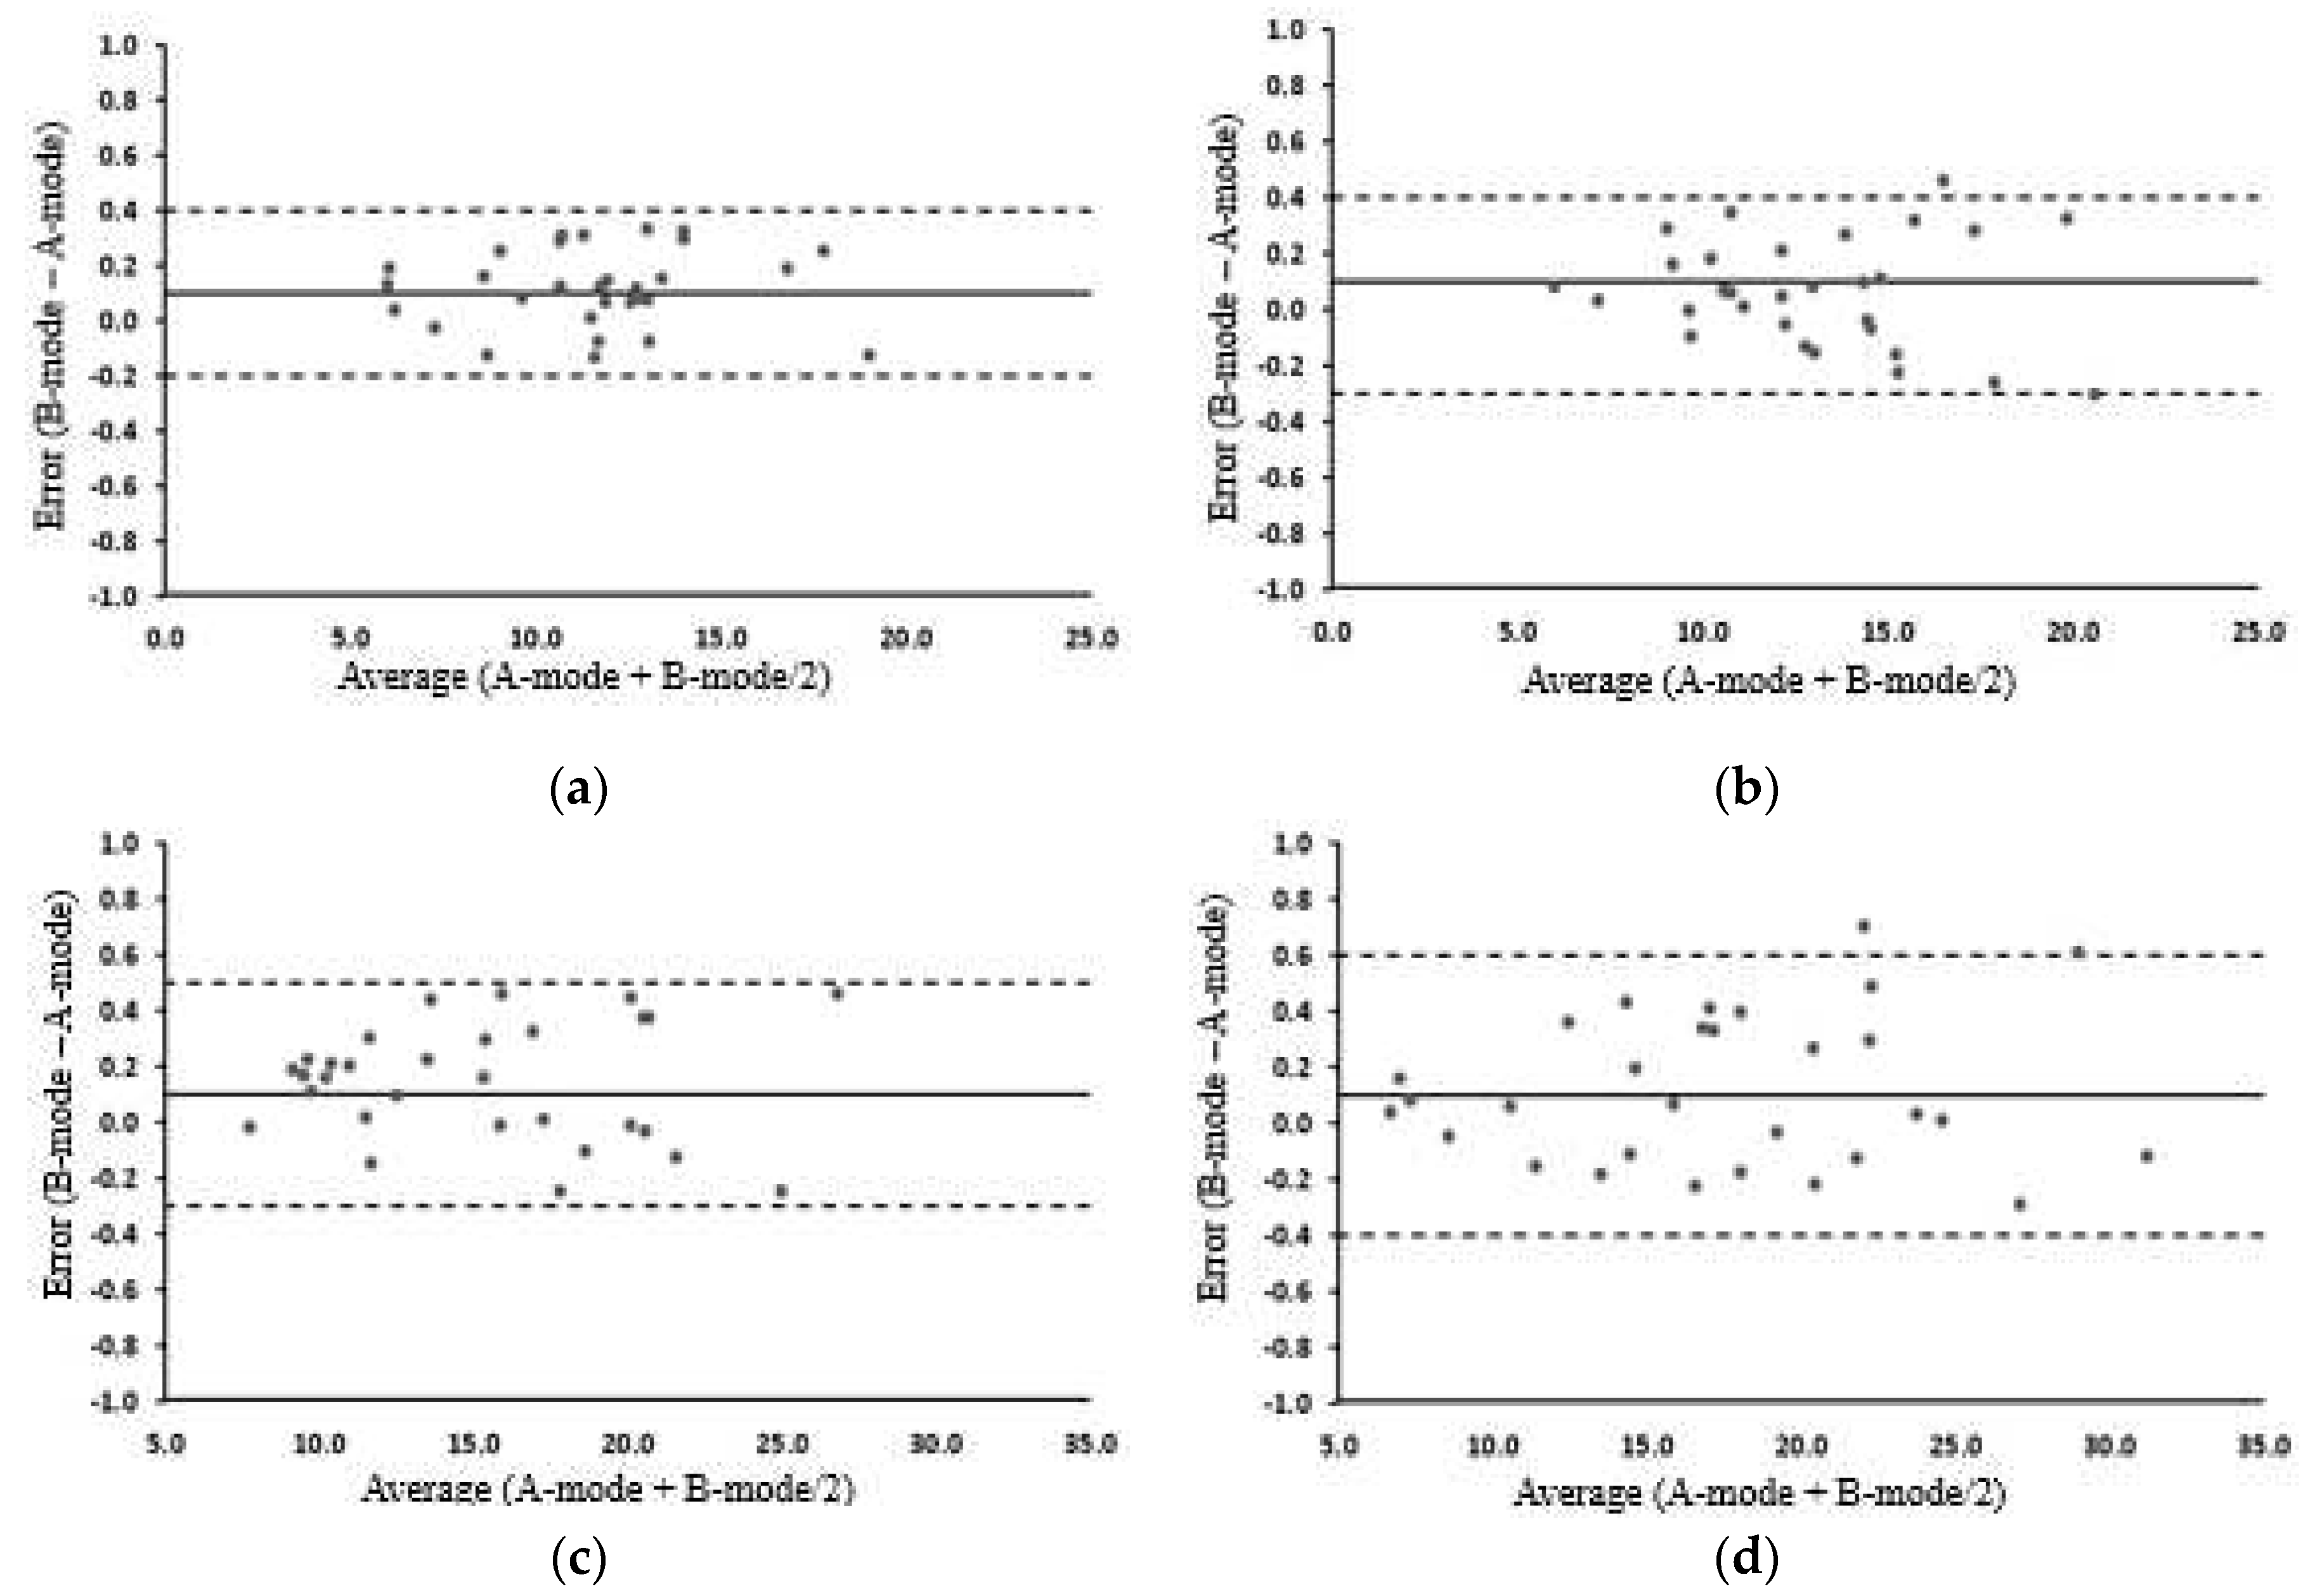
Figure 6.
Bland and Altman plots illustrating residual scores for the trapezius and biceps brachii. (a) Trapezius, pre-exercise; (b) Trapezius, post-exercise; (c) Biceps brachii, pre-exercise; (d) Biceps brachii, post-exercise.
Figure 6.
Bland and Altman plots illustrating residual scores for the trapezius and biceps brachii. (a) Trapezius, pre-exercise; (b) Trapezius, post-exercise; (c) Biceps brachii, pre-exercise; (d) Biceps brachii, post-exercise.
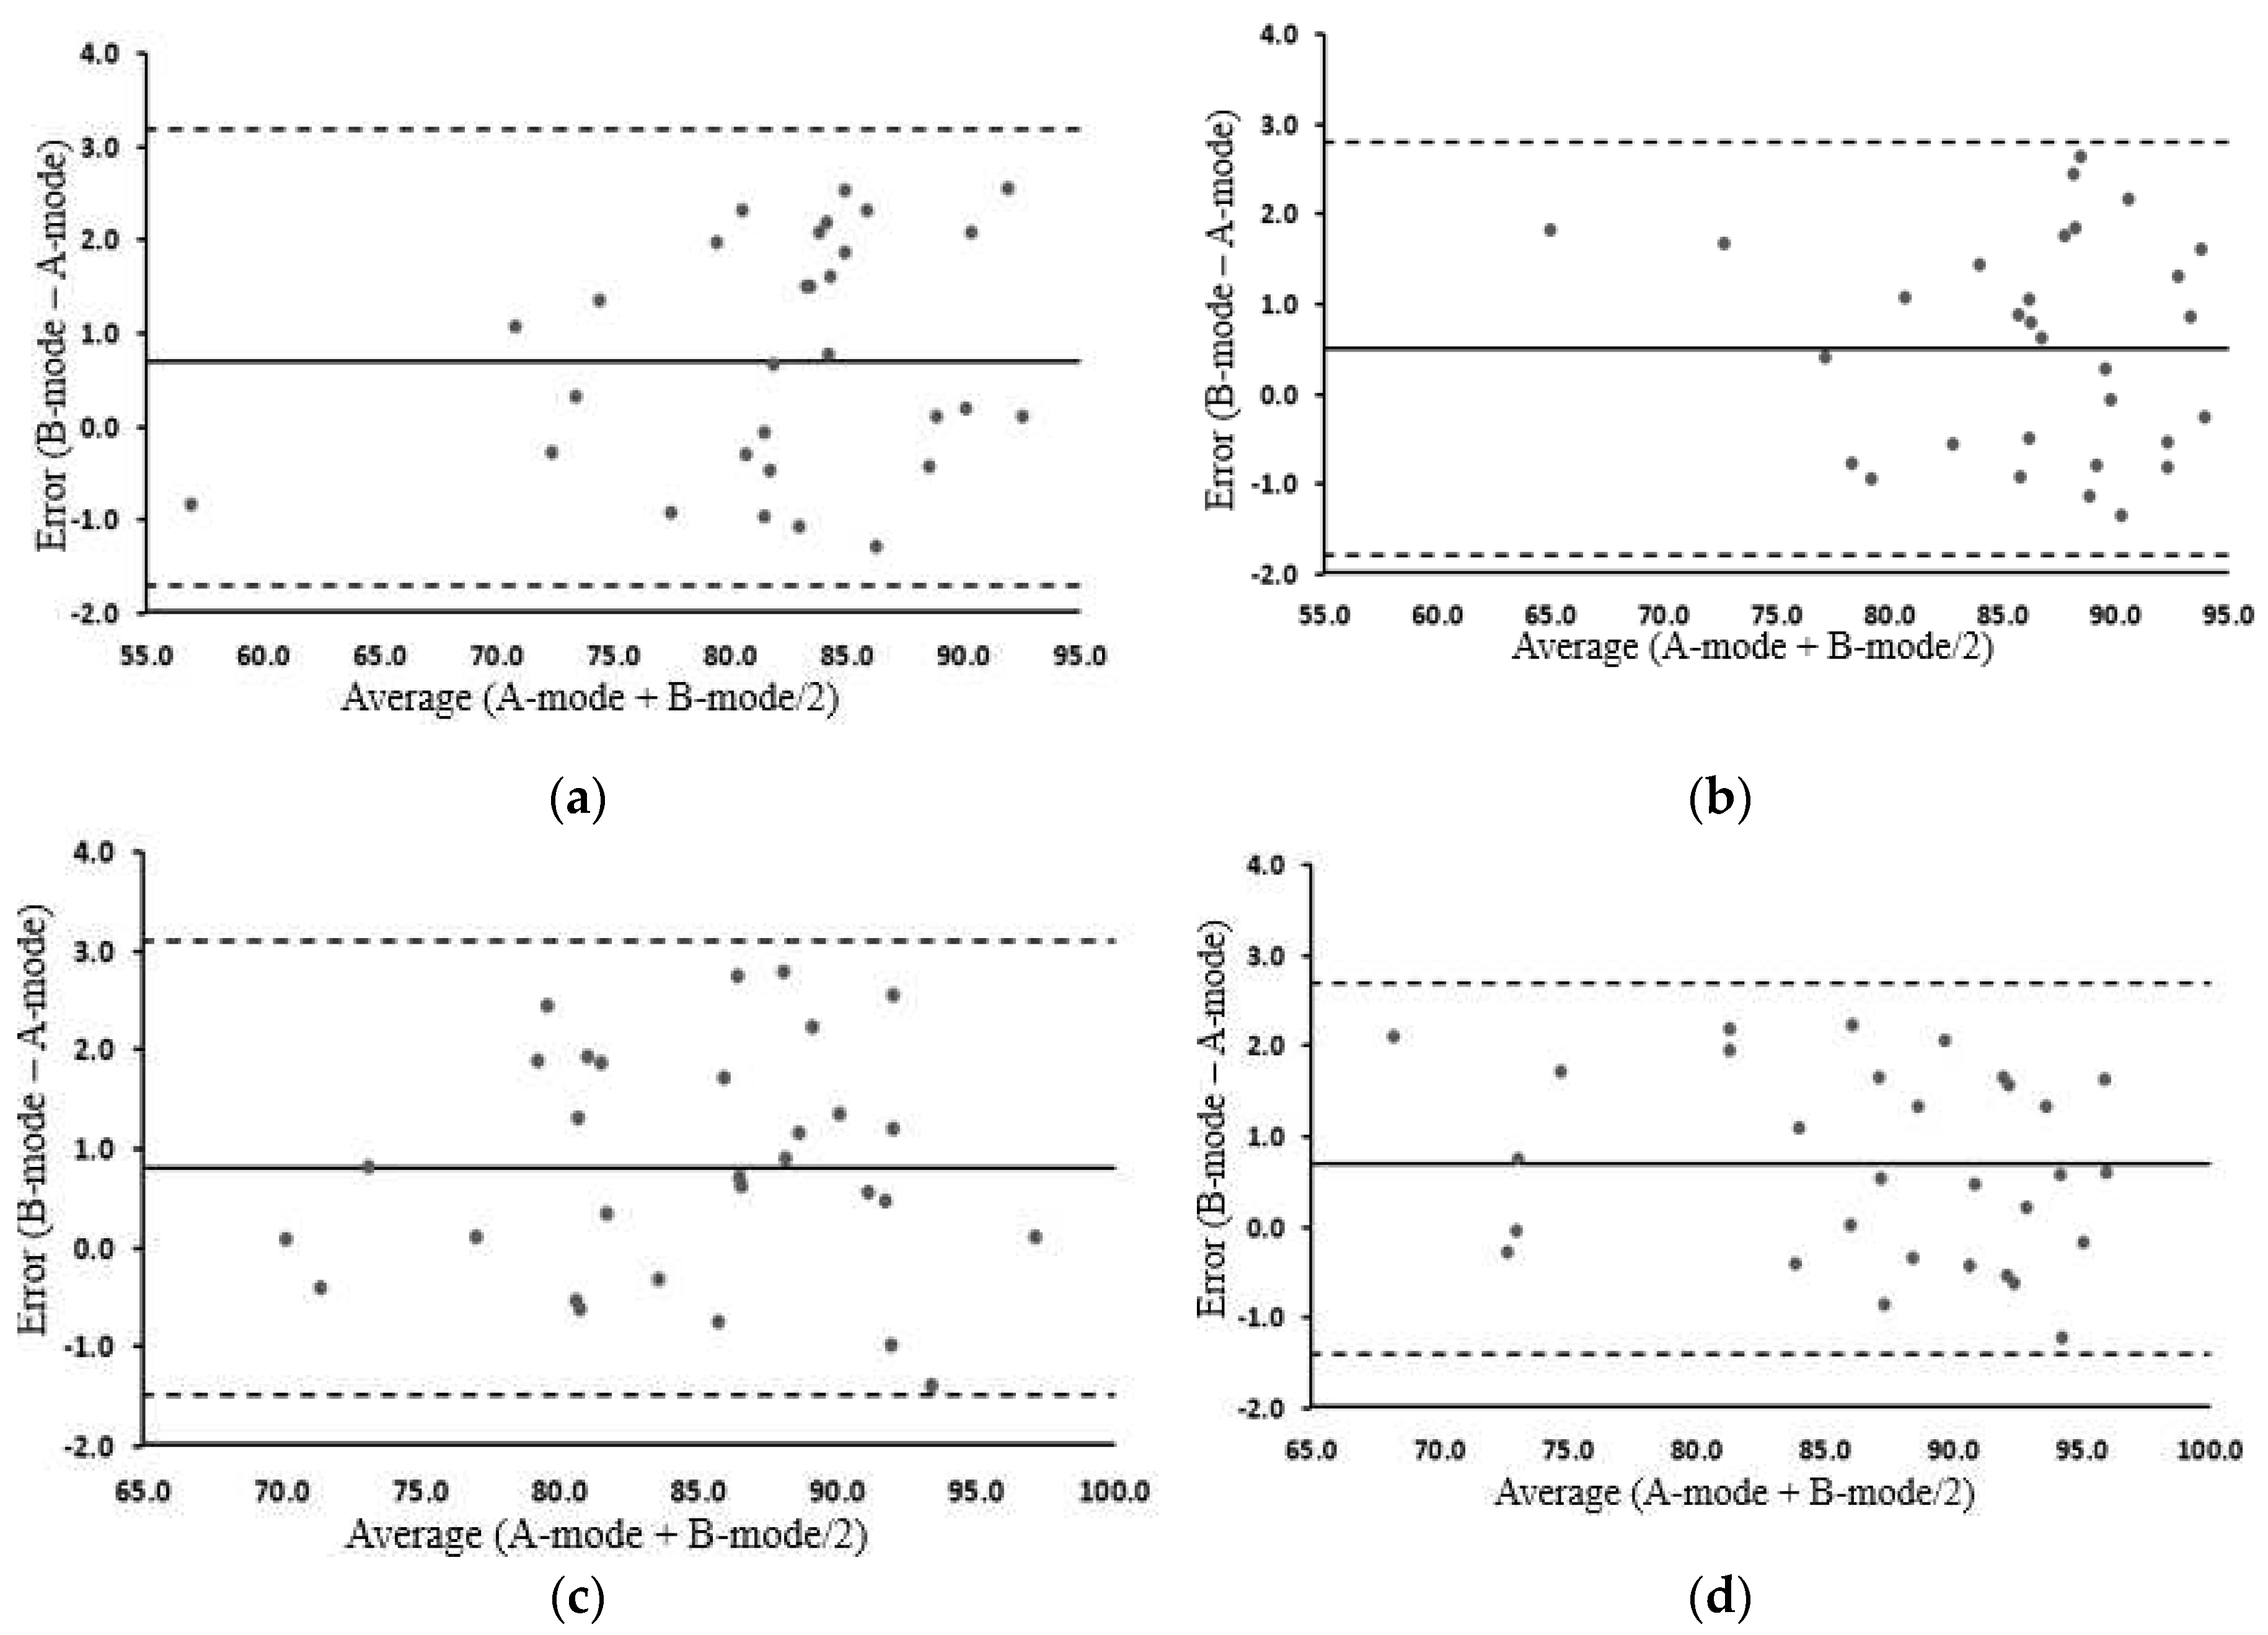

Table 1.
Study population.
| Parameter | Male group (n=15, mean ± SD1) |
Female group (n=15, mean ± SD) |
P-value |
|---|---|---|---|
| Age (years) | 27.5 ± 2.6 | 30.5 ± 6.1 | 0.092 |
| Height (cm) | 175.4 ± 5.9 | 163.3 ± 6.9 | < 0.001 |
| Weight (kg) | 74.5 ± 11.0 | 56.2 ± 6.9 | < 0.001 |
| BMI (kg/m2) | 24.2 ± 3.2 | 21.1 ± 2.4 | 0.006 |
1 SD; Standard Deviation .
Table 2.
Changes in SFT before and after exercise.
| Pre-exercise | Post-exercise | |||||||
|---|---|---|---|---|---|---|---|---|
| Biomarker | A-mode | B-mode | MD | ICCs | A-mode | B-mode | MD | ICCs |
| Trapezius | 8.06 ±2.45 | 8.14±2.50 | -0.09 | 0.998 | 7.99±2.20 | 8.06±2.24 | -0.06 | 0.998 |
| Male | 7.38±2.08 | 7.44±2.14 | -0.06 | 0.998 | 7.40±2.08 | 7.44±2.11 | -0.04 | 0.998 |
| Female | 8.73±2.67 | 8.84±2.71 | -0.11 | 0.998 | 8.59±2.23 | 8.67±2.26 | -0.08 | 0.998 |
| Biceps brachii | 8.19 ±2.58 | 8.27±2.65 | -0.08 | 0.998 | 8.07±2.80 | 8.18±2.86 | -0.10 | 0.998 |
| Male | 7.00±1.37 | 7.05±1.44 | -0.05 | 0.998 | 6.49±1.03 | 6.58±1.06 | -0.09 | 0.997 |
| Female | 9.31±2.78 | 9.41±2.85 | -0.10 | 0.998 | 9.39±3.08 | 9.53±3.17 | -0.14 | 0.998 |
Table 3.
Changes in MT before and after exercise.
| Pre-exercise | Post-exercise | |||||||
|---|---|---|---|---|---|---|---|---|
| Biomarker | A-mode | B-mode | MD | ICCs | A-mode | B-mode | MD | ICCs |
| Trapezius | 11.56±3.13 | 11.68±3.14 | -0.11 | 0.998 | 13.00±3.49 | 13.06±3.47 | -0.06 | 0.998 |
| Male | 12.70±3.29 | 12.80±3.28 | -0.10 | 0.998 | 14.82±3.01 | 14.80±3.01 | 0.02 | 0.998 |
| Female | 10.43±2.59 | 10.56±2.64 | -0.12 | 0.998 | 11.18±3.00 | 11.31±3.06 | -0.14 | 0.998 |
| Biceps brachii | 15.31±5.04 | 15.45±5.03 | -0.14 | 0.999 | 17.46±6.36 | 17.58±6.39 | -0.11 | 0.999 |
| Male | 17.52±5.83 | 17.57±5.79 | -0.06 | 0.999 | 20.11±7.62 | 20.19±7.62 | -0.08 | 0.999 |
| Female | 14.28±3.40 | 14.50±3.49 | -0.22 | 0.997 | 16.52±3.51 | 16.64±3.64 | -0.12 | 0.996 |
Table 4.
Changes in MQ before and after exercise.
| Pre-exercise | Post-exercise | |||||||
|---|---|---|---|---|---|---|---|---|
| Biomarker | A-mode | B-mode | MD | ICCs | A-mode | B-mode | MD | ICCs |
| Trapezius | 81.80±7.10 | 82.53±7.43 | -0.73 | 0.981 | 86.01±6.65 | 86.53±6.51 | -0.51 | 0.981 |
| Male | 80.37±8.48 | 81.01±8.73 | -0.64 | 0.987 | 87.06±4.57 | 87.67±4.74 | -0.61 | 0.951 |
| Female | 83.23±5.29 | 84.05±5.75 | -0.83 | 0.966 | 84.97±8.27 | 85.39±7.91 | -0.42 | 0.992 |
| Biceps brachii | 84.49±6.70 | 85.30±6.76 | -0.81 | 0.978 | 86.53±7.87 | 87.21±7.65 | -0.67 | 0.988 |
| Male | 87.60±6.80 | 88.41±6.33 | -0.81 | 0.981 | 88.38±9.14 | 88.99±8.49 | -0.61 | 0.993 |
| Female | 82.61±5.37 | 83.37±5.74 | -0.77 | 0.971 | 86.79±5.39 | 87.70±5.33 | -0.91 | 0.971 |
Table 5.
MT and MQ change before and after exercise in the A-mode and B-mode.
| MT change | MQ change | |||
|---|---|---|---|---|
| p-value in A-mode | p-value in B-mode | p-value in A-mode | p-value in B-mode | |
| Trapezius muscle | 0.0012 | 0.0019 | 0.0056 | 0.0102 |
| Male | 0.0000 | 0.0002 | 0.0001 | 0.0003 |
| Female | 0.2885 * | 0.2867 * | 0.4834 * | 0.5868 * |
| Biceps brachii | 0.0231 | 0.0244 | 0.1866 * | 0.1887 * |
| Male | 0.2675 * | 0.2572 * | 0.9872 * | 0.8795 * |
| Female | 0.0003 | 0.0008 | 0.0013 | 0.0006 |
Disclaimer/Publisher’s Note: The statements, opinions and data contained in all publications are solely those of the individual author(s) and contributor(s) and not of MDPI and/or the editor(s). MDPI and/or the editor(s) disclaim responsibility for any injury to people or property resulting from any ideas, methods, instructions or products referred to in the content. |
© 2023 by the authors. Licensee MDPI, Basel, Switzerland. This article is an open access article distributed under the terms and conditions of the Creative Commons Attribution (CC BY) license (http://creativecommons.org/licenses/by/4.0/).
Copyright: This open access article is published under a Creative Commons CC BY 4.0 license, which permit the free download, distribution, and reuse, provided that the author and preprint are cited in any reuse.


