
Submitted:
06 March 2025
Posted:
07 March 2025
You are already at the latest version
Abstract
Improving and maintaining an ideal body composition is important for sporting achievement and good health. Body composition assessment is therefore a tool used to monitor training and to evaluate the objectives of a training plan for health purposes. Ultrasound (US) emerges as an alternative to evaluate the thickness of subcutaneous cellular tissue as well as muscle thickness: (1) Background: To evaluate and compare the anthropometric and ultrasound measurements used to quantify the effects of strength training; (2) Methods: 31 students (22.3±4.14 years of age), 25 men and 6 women from the professional programme in Sport, enrolled in the Physical Preparation course at the Institución Universitaria Politécnico Colombiano Jaime Isaza Cadavid. Protocol: a pre- and post-intervention ultrasound and anthropometric evaluation of a strength training programme with a predominance of the eccentric component 3 times a week for 4 weeks. For the pre- and post-intervention relationship of the quantitative anthropometric and ultrasound variables, the Wilcoxon signed-rank test was used; the effect size of a Wilcoxon test was also calculated using the Rank correlation; the correlation of the anthropometric and ultrasound variables was determined using Spearman's correlation coefficient; a p-value < 0.05 was considered statistically significant; (3) Results: there were no statistically significant differences in the anthropometric variables assessed but there were significant differences in measures of quadriceps muscle size and in the control parameter echo-intensity (EI) of subcutaneous fat in the variables; (4) Conclusions: the US of the quadriceps can measure changes in muscle thickness even without changes in muscle mass assessed by anthropometry, making it an excellent tool for evaluation and monitoring of strength training.
Keywords:
Anthropometry
; muscle ultrasound
; strength training
; muscle mass
; eco-intensity
; muscle thickness
1. Introduction
Improving and maintaining an ideal body composition is important for sporting achievement and good health. The assessment of body composition is therefore a tool used for training control and to evaluate the goals set in a training plan for health purposes. Different methods have been used to assess body composition. The first is the hydrostatic weight, which is considered the ‘gold standard’, but is limited by the time and cost of the equipment needed to perform it [1]. Dual x-ray absorptiometry is a highly accurate method that measures fat percentage as well as bone mineral density [1]. he cost of the equipment and ionising radiation are limitations to its regular use. Bioelectrical impedance allows measurement of body composition from a small electrical current sent through electrodes. It is easy and quick to apply but has the disadvantage of being highly variable in its results due to the multiple factors that can alter its measurement [1]. Anthropometry through fat folds, diameters and perimeters allows the evaluation of the different components such as fat tissue, bone mass, lean mass and residual mass from equations that yield percentage values of the different components. It is the most widely used due to its low cost, but its main limitations are that it requires good training, high inter-evaluator error and the difficulty of isolating adipose tissue from muscle tissue by palpation [1]. Muscle thickness is the simplest method to assess muscle size [2]. Ultrasound (US) has emerged as an alternative for assessing subcutaneous cellular tissue thickness as well as muscle thickness. It is a low-cost method and, when compared to other imaging methods, does not emit ionising radiation. For these reasons, several studies consider US to be a valid method for assessing muscle size [3]. In addition, US provides information on muscle quality in terms of fat content by evaluating the intramuscular fat component on a grey scale, with the eco-intensity (EI) of subcutaneous fat as a control parameter. Low EI values are associated with higher muscle quality [2], being a useful, economical and practical way to assess it [4]. Its validity has been corroborated by comparison with CT [5], muscle biopsy [6] and MRI. Ageing and sedentary lifestyle are factors that can increase IE, resulting from an increase in muscle fat content [7] and a decrease in contractile proteins. Therefore, EI can be a useful tool to assess the results of the application of training methods.
Based on all the previous elements, the aim of the study is to evaluate and compare anthropometric and ultrasound measurements used in the quantification of the effects of strength training.
2. Results
Thirty-one students of the Physical Preparation course, level VI of the Professional Programme in Sport of the Politécnico Colombiano Jaime Isaza Cadavid, were evaluated, corresponding to 6 women (19.35%) and 25 men (80.65%) who did not perform strength work in their daily training. The mean for age was 22.3±4. 14 years; height 1.73 mt; weight 70.46 kg; BMI 23.13 kg/m2 corresponding to a normal classification according to the World Health Organization (WHO), where 20 (64.5%) users are in this range, 9 (29%) in pre-obese and 2 (6.5%) in obese; the waist-hip index (WFI) recorded an average of 0.83 for the male gender and 0.76 for the female, both classified in low cardiovascular risk according to the adaptation of Berral (2011) [8] (Table 1).
Statistically significant changes were found in fat mass (p<0.05), decreasing the number of students in the medium category by 22.58% and increasing the good category by 19.4%, according to the formula differentiated for men and women by Jackson and Pollock (American College of Sports Medicine, 2000) (Table 2).
There were no statistically significant differences in the anthropometric variables evaluated. In the quadriceps cross-sectional area ratio (AMQ) there is a variance and although it does not reach the reference value to be significant, it could be related to an anthropometric improvement due to a decrease in the skin fold of the thigh by the strength work performed. There were statistically significant changes in measures of quadriceps muscle size such as ERF (p<0.01, t.e: moderate), EAT (p<0.01, t.e: moderate), EVL (p<0.05, t.e: moderate) and ELT (p<0.01, t.e: large). On the other hand, there were significant changes in IE basically in the variables with internal control of fat IE, Dif1 (p<0.0001, t.e: large), Dif3 (p<0.01, t.e: large) and Dif4 (p<0.0001, t.e: large) (Table 3).
EGA as well as EGL had an excellent correlation with PG (R2 =0.9, p<0.01) and endomorphy (R2 =0.774-0.787, p<0.01), at both time points (pre and post intervention). ERF correlated with MC (R2 =0.495-0.569, p<0.01) and mesomorphy (R2 =0.437-0.558, p<0.05). EAT correlated with MC (R2 =0.591-0.709, p<0.01) and mesomorphy (R2 =0.524-0.633, p<0.01) (Figure 1).
3. Discussion
In the study conducted by Atencia et al. (2021) [9], they evaluated 56 university students of the Sports Science and Physical Activity programme of the Corporación Universitaria del Caribe, finding values similar to the present study in terms of mean age 19.43 ± 2.23 years, weight 65.55 kg, height 1.70 mt, IMC 22.53, fat weight 11.65, muscle mass 31.55, fat percentage 17.37%, muscle percentage 48.24, ICC 0.84; differing in the level, they belong to the first entry and they belong to the first year of the programme, IMC 22.53, fat weight 11.65, muscle mass 31.55, fat percentage 17.37%, muscle percentage 48.24, ICC 0.84; differing in the level, they belong to the first entry and in the IPAQ where 50% are in moderate physical activity practice and 23% and 26% in low and high respectively; it could be directly related to the progress in professional training, having a greater practice of physical activity at a higher level [9].
Cardozo et al. (2016) [10] carried out a characterisation of the body composition of 82 university students from a sports faculty, from the second semester of the aca-demic sports performance programme in Bogotá, finding sociodemographic results similar to the current research, the mean age in men was 20.7 ± 2.3 years vs. 21.9 ± 1.3 years in women; the height in men 1.72 vs. women 1.59; the mean BMI is in a normal range, where 20% is in pre-obese and 3.5% lean and obese; in the percentage of body fat in men 16.4 vs. women 25.0, both correspond to a medium categorisation [10]. In contrast to the present study, they report that in the stratification of fat percentage there were statistically significant differences, reflected in a higher prevalence of overweight and obesity in women compared to the data found in men (46.67% vs. 20.9%).
The study presented by Rodríguez et al. (2020) [11], was carried out at the Santo Tomás University, Tunja section, with 12 first-semester male students aged between 18 and 22 years, the intervention was performed for 10 weeks, 3 times a week, 60 minutes per session: 5 minutes of warm-up, 25 minutes of strength exercises, 25 minutes of aerobic exercise and ending with 5 minutes of muscle stretching; a classification of overweight grade II IMC (75%) and Type I obesity (25%) was found for IMC. In the post-intervention assessment the findings of these 2 variables are similar to the present investigation, there were no significant changes in IMC despite decreasing the value, and there was a significant difference for fat % [11].
Multiple studies that evaluated the effects of strength training, including plyometric training, used ultrasound as a method of assessing muscle mass by measuring muscle thickness. They demonstrated increased thickness of quadriceps components as a result of training. The duration of these stimuli ranged from 8 to 16 weeks [12,13,14]. We found significant changes in only 4 weeks of training which corresponds to those found in these studies. No changes were found as a result of eccentric dominated strength training on anthropometric variables.
A study conducted in obese patients who underwent bariatric surgery used rectus femoris thickness as a post-surgical control strategy, demonstrating benefits with respect to the use of Dexa and electrical bioimpedance, with which they showed an excellent correlation [15]. An excellent correlation has been demonstrated between ultrasound-measured anterior thigh muscle thickness and quality of life [16] and has therefore been proposed as a measure that should be included in the diagnosis of sarcopenia [17].
Near-perfect correlations have been demonstrated between the assessment of anterior thigh muscle thickness by ultrasound compared to MRI [18]. Therefore, US is an excellent method to assess muscle size through muscle thickness [19]. The results of different studies showed a strong correlation between ultrasound and anthropometric measurements to assess body composition [20,21]. It also provides higher measurement accuracy when compared to anthropometry [22]. n our study, we found significant differences in thickness when there were no significant changes in anthropometric measurements, suggesting a greater sensitivity of ultrasound to assess changes in both muscle and subcutaneous cellular tissue thickness as a measure of strength training control, particularly when assessing the effects of exercise on muscle size or fat reduction.
In addition to muscle size, EI appears to be a strong predictor of functional outcome from training or disuse in both healthy and diseased individuals [23]. EI can serve as an important clinical tool to assess the functional status of the musculoskeletal system, independent of age [24]. However, increased EI may be related to a decrease in muscle quality, muscle oedema as a sign of inflammation or a decrease in muscle glycogen [25]. The study by Vasenina et al. (2022) in young adults assessed the effects on EI of a strength session immediately and at 24 and 48 hours post-stimulus [26]. EI increased immediately but decreased significantly at 48 hours. In our study we observed a decrease in EI as a result of strength training with emphasis on the eccentric component in a period of only 4 weeks of intervention. These significant differences reflect changes that are quantified by EI, recognising that there are no concrete explanations for the physiological reasons for these changes.
4. Materials and Methods
Participants
31 students (22.3±4.14 years of age), 25 males and 6 females of the professional programme in Sport, enrolled in the subject Physical Preparation of the Institución Universitaria Politécnico Colombiano Jaime Isaza Cadavid, participated in the study after signing the informed consent and filling in the international physical activity questionnaire IPAQ. Each subject must preserve their daily nutritional habits and not ingest liquor in the two days prior to the measurements. The following were the exclusion criteria: musculoskeletal injuries, cardiovascular disease, pharmacological and/or nutritional treatment, having started a training programme in the last 3 months, not having signed and given informed consent. This study complies with the Declaration of Helsinki for research involving human subjects and was approved by the Ethics Committee of the Politécnico Colombiano Jaime Isaza Cadavid, with the file #201801007381.
Procedure
The protocol consisted of a pre- and post-intervention ultrasound and anthropometric assessment of a strength training programme with a predominance of the eccentric component 3 times a week for 6 weeks. Due to a cessation of activities by the students, the intervention was carried out for only 4 weeks, in order to guarantee their attendance at the post-intervention assessment. The pre-intervention ultrasound and anthropometric assessment was performed 4 days before starting the training programme and the post-intervention assessment was performed 4 days after the last stimulus to avoid the acute effects of exercise. During the intervention the students performed their usual academic activities excluding the strength stimuli.
Strength Training
The training programme was designed for 6 weeks, planning the load based on references such as Schoenfeld (2010), who indicates that with constant training for 6-10 weeks there will be hypertrophy with eccentric training [27], and in some cases changes can be noticed after 4 weeks, but the most significant results are usually seen after 8-12 weeks [28]. The number of weekly sessions recommended for muscle fibre hypertrophy by Schoenfeld (2016) [29] are 2-3, with 4-6 sets, 4-8 repetitions with 80-100% of the eccentric 1RM (with a higher load than would be used in the concentric phase) [30], a time under tension of 3-6 seconds in the eccentric phase and the recovery time after an intense eccentric stimulus according to Franchi et al. (2017) [31] is 48-72 hours and Proske and Morgan (2001) mention that the effects of muscle damage induced by eccentric exercise can persist for up to 48 hours, recommending an interval of at least that long to favour optimal muscle regeneration [32].
In this study we had to opt for eccentric training for 4 weeks given the novelty of the cessation of activities by the university students. A mesocycle was developed, in which each microcycle contained three weekly sessions of eccentric training of the lower body and the central zone, and one of active recovery with regular sport, for a total of 12 sessions, Monday, Wednesday and Friday, at 10 am, for approximately 45 minutes. Each training session included a 10-minute warm-up with fundamental low-intensity exercises involving the core zone, with the aim of warming up and providing control of the core zone. The load structure in terms of % of RM, sets and repetitions are described in Table 1, validating the protocol with the respective author. There were some basic exercises such as eccentric squats (lowering in 4-6 seconds), eccentric Romanian deadlift (slow and controlled lowering), bench press with eccentric emphasis (lowering in 5 seconds) and eccentric pull-ups (lowering in 6-8 seconds), planks and box jumps (lowering in 6-8 seconds).
Each microcycle represented a week of work, starting with phase 1 of Neuromuscular Adaptation and improvement of technique [33], phase 2 of Hypertrophy and Progressive Load, with increased volume and mechanical tension [27], phase 3 Muscle Hypertrophy and phase 4 Maximum Intensity and Strength, with the objective in these two phases of recluting high-threshold motor units [34]. Table 1 details the characteristics of the work carried out on the different days (Table 4).
Anthropometric Measurements
ISAK anthropometry is a standardised methodology for measuring body composition, including muscle, fat and bone mass. It requires plicometers, tape measures and bone calipers. The ISAK is an indispensable tool for planning sports training programmes. By identifying and analysing these measurements, the trainer can adjust routines to achieve goals, improve performance and prevent injury.
Basic measurements of body composition were taken, such as weight by means of a Tanita Hd-314 electronic scale expressed in kilograms and height with a Height portable wall height measuring device with a range of 0 to 200 cm and a precision of 1 mm, recorded in metres; with these two data the body mass index (IMC) was obtained and interpreted according to the WHO classification. For the assessment of skin folds, a calibrated Slim Guide adipometer was used; perimeters were measured with a tape measure and diameters with a Tacklife digital Vernier or King’s foot. Obtaining the different components such as fat tissue, bone mass, lean mass, residual mass and somatotype under the methodology of the ISAK and to identify cardiovascular risk, the waist-hip circumference was evaluated, interpreted by the parameters given by the WHO (2008) [35].
Description of the Taking of the Main Anthropometric Measurements
Weight: mass of the body expressed in kilograms; taken on a scale. Subjects were assessed in a standard upright position, with their backs to the measurement, in the centre of the scale and wearing the minimum amount of clothing, such as shorts and a T-shirt.
Size: distance between the vertex and the heels, recorded in centimetres by means of a tape measure in the vertical plane of the measuring rod. The measurement was taken from each subject in a vertical position, looking straight ahead and after a deep breath.
IMC: is the ratio of weight in kilograms divided by the square of height in metres, by means of which the subject is categorised as underweight, healthy weight, overweight and obese. It is an indirect measure that is used as a screening measure to indicate body fat and health risk.
CCI (Waist-hip index): is the correlation between the waist circumference located in the area of the smallest circumference of the abdomen, midway between the costal border and the iliac crest, and the hip located in the widest area of the pelvis, approximately at the level of the greater trochanter. This measurement is associated with risk of cardiovascular disease and disorder [36,37].
Skinfolds: These refer to the amount of subcutaneous adipose tissue without including the muscle. They are measured using a calliper and expressed in millimetres (mm). The eight skinfolds of the right side of the body were assessed according to the ISAK protocol, namely: subscapular, triceps, biceps, iliac crest, suprailiac, abdominal, thigh, and medial calf.
Perimeters: These are the circumferences of specific areas, expressed in centimetres (cm), and measured using a measuring tape. According to the ISAK manual, the recorded measurements included the relaxed and contracted arm, minimum and maximum waist, and maximum thigh circumference.
Diameters: This refers to the distance between two established anatomical points at the level of bony prominences. The instrument used is a caliper, and measurements are recorded in centimetres (cm). The ISAK protocol specifies measuring the biepicondylar diameter of the humerus and femur and the bistyloid diameter of the wrist.
Ultrasound Measurements
Transverse and longitudinal images were obtained from the quadriceps femoris in the right limb using a B-mode ultrasound system (B-Ultrasonic Diagnostic System, Contec, CMS600P2, Republic of China). A linear transducer (gain: 58, frequency: 7.5 MHz; depth: 6 centimetres), covered with a sufficient amount of water-soluble transmission gel to prevent compression of the skin surface, was placed perpendicular to the longitudinal and transverse axes of the quadriceps femoris. The transducer was positioned at the midpoint between the anterior superior iliac spine and the superior pole, and between this point and the superolateral angle of the patella for anterior and lateral images, respectively. Subjects were evaluated in the supine position, having rested for at least five minutes and without engaging in vigorous physical exercise on the same day. Two longitudinal-section images and two transverse-section images were taken at each midpoint. The frozen image was digitised and subsequently analysed using the open-source software ImageJ (National Institute of Health, USA, version IJ 1.46). The anterior transverse-section images were used to measure rectus femoris muscle thickness (inferior margin of the anterior fascia of the rectus femoris to the superior margin of the posterior fascia of the rectus femoris), vastus intermedius thickness (inferior margin of the intermuscular fascia to the femoral periosteum), and total anterior quadriceps thickness (inferior margin of the rectus femoris to the femoral periosteum). The lateral transverse-section images were used to measure vastus lateralis muscle thickness (inferior margin of the anterior fascia of the vastus lateralis to the superior margin of the posterior fascia of the vastus lateralis), vastus intermedius thickness (lateral view) (inferior margin of the intermuscular fascia to the femoral periosteum), and total lateral quadriceps thickness (inferior margin of the vastus lateralis to the femoral periosteum). The transverse-section images were also used to determine the Echointensity (EI) of the evaluated muscles using the histogram function in ImageJ. The region of interest was selected as the largest rectangular area of each muscle, excluding fascia. The mean value of the two images was expressed as a value between 0 (black) and 255 (white). EI correction was performed based on the thickness of the subcutaneous tissue, as proposed by Young, and the fat percentage was measured using the method proposed by the same author for all muscles [38]. Additionally, as a control strategy, the difference in EI of the fat relative to each evaluated portion of the quadriceps was calculated, corresponding to Dif1 to Dif6 [39]. The longitudinal-section images were used to determine the pennation angle of the rectus femoris and vastus lateralis. The values used for statistical analysis for muscle thickness and pennation angle were the averages of the two measurements from each image.
Statistical Analysis
For the descriptive analysis of anthropometric and ultrasound aspects, absolute distributions, relative distributions, and summary indicators such as the median and the median absolute deviation were used. The normality criterion was established using the Shapiro-Wilk test.
For the comparison of quantitative anthropometric and ultrasound variables before and after the intervention, the Wilcoxon signed-rank test was used. Additionally, the effect size of the Wilcoxon test was calculated using rank correlation. A small effect was considered for values between 0.1 and 0.3, a moderate effect between 0.3 and 0.5, and a large effect for values greater than 0.5.
The correlation between anthropometric and ultrasound variables was determined using Spearman’s correlation coefficient. A p-value < 0.05 was considered statistically significant.
5. Conclusions
Our results suggest that quadriceps ultrasound can measure changes in muscle thickness even in the absence of changes in muscle mass assessed through anthropometry, making it an excellent tool for evaluating and monitoring strength training. Additionally, EI may serve as an important clinical tool for assessing the functional state of the musculoskeletal system and, in particular, muscle adaptations to strength training. Therefore, ultrasound becomes an easily accessible, non-invasive, cost-effective, and more sensitive method than anthropometry, which could provide valuable information on changes in body composition (fat and muscle components) for training monitoring.
Funding
This research received no external funding.
Institutional Review Board Statement
The study was conducted in accordance with the Declaration of Helsinki and approved by the Ethics Committee of Politécnico Colombiano Jaime Isaza Cadavid, (protocol code #201801007381 and date of approval 12 October 2018).
Informed Consent Statement
Informed consent was obtained from all subjects involved in the study.
Acknowledgments
To all participants in the study.
Conflicts of Interest
The authors declare no conflicts of interest.
Abbreviations
| AMQ | Cross-sectional section of the quadriceps |
| APRF | Pennation angle of the RF |
| APVL | Pennation angle of the VL |
| CT | Tomography |
| DAM | Median Absolute Deviation |
| DS | Standard deviation |
| Dif1 | Anterior fat EI minus RF EI |
| Dif2 | Anterior fat EI minus anterior VI EI |
| Dif3 | Anterior fat EI minus the average of RF EI + anterior VI EI |
| Dif4 | Lateral fat EI minus VL EI |
| Dif5 | Anterior fat EI minus lateral VI EI |
| Dif6 | Lateral fat EI minus the average of VL EI + lateral VI EI |
| DS | Standard Deviation |
| EAT | Total anterior thickness |
| EGA | Subcutaneous fat tissue thickness in the anterior region |
| EGL | Fat thickness in the lateral region |
| EI | Echo-intensity |
| EIGA | EI of subcutaneous fat tissue in the anterior region |
| EIGL | EI of subcutaneous fat tissue in the lateral region |
| EIRF | EI of the RF |
| EIVIA | EI of the VI in the anterior region |
| EIVIL | EI of the VI in the lateral region |
| EIVL | EI of the VL |
| ELT | Total lateral thickness |
| ERF | Thickness of the RF |
| EVIA | Thickness of the VI in the anterior region |
| EVIL | Thickness of the VI in the lateral region |
| EVL | Thickness of the VL |
| ICC | Waist-to-hip ratio |
| IMC | Body mass index |
| M | Mean |
| MRI | Magnetic resonance imaging |
| n | Sample size |
| US | Ultrasound |
| WHO | World Health Organization |
| 1RM | One-repetition maximum |
References
- Hyde, P.N.; Kendall, K.L.; Fairman, C.M.; Coker, N.A.; Yarbrough, M.E.; Rossi, S.J. Use of B-Mode Ultrasound as a Body Fat Estimate in Collegiate Football Players. J Strength Cond Res 2016, 30, 3525–3530. [Google Scholar] [CrossRef]
- Sarto, F.; Spörri, J.; Fitze, D.P.; Quinlan, J.I.; Narici, M.V.; Franchi, M.V. Implementing Ultrasound Imaging for the Assessment of Muscle and Tendon Properties in Elite Sports: Practical Aspects, Methodological Considerations and Future Directions. Sports Medicine 2021, 51, 1151–1170. [Google Scholar] [CrossRef]
- Budzynski-Seymour, E.; Fisher, J.; Giessing, J.; Gentil, P.; Steele, J. Relationships and comparative reliability of ultrasound derived measures of upper and lower limb muscle thickness and estimates of muscle area from anthropometric measures. 2019. [Google Scholar] [CrossRef]
- Sizoo, D.; de Heide, L.J.M.; Emous, M.; van Zutphen, T.; Navis, G.; van Beek, A.P. Measuring Muscle Mass and Strength in Obesity: a Review of Various Methods. Obes Surg 2021, 31, 384–393. [Google Scholar] [CrossRef]
- Harris-Love, M.O.; Seamon, B.A.; Teixeira, C.; Ismail, C. Ultrasound estimates of muscle quality in older adults: reliability and comparison of Photoshop and ImageJ for the grayscale analysis of muscle echogenicity. PeerJ 2016, 4, e1721. [Google Scholar] [CrossRef]
- Hill, J.C.; San Millán, I. Validation of Musculoskeletal Ultrasound to Assess and Quantify Muscle Glycogen Content. A Novel Approach. Phys Sportsmed 2014, 42, 45–52. [Google Scholar] [CrossRef]
- Bazzocchi, A.; Filonzi, G.; Ponti, F.; Albisinni, U.; Guglielmi, G.; Battista, G. Ultrasound: Which role in body composition? Eur J Radiol 2016, 85, 1469–1480. [Google Scholar] [CrossRef]
- Moreno Pascual, C.; Manonelles Marqueta, P.; Federación Española de Medicina del Deporte. Manual de cineantropometría; Nexus Médica, 2011. [Google Scholar]
- Atencia Pérez, E.A.; Ricardo Paternina, D.A.; Vergara Villa, J.D. Relación del nivel de actividad física con variables asociadas a la composición corporal en estudiantes de primer ingreso del programa ciencias del deporte y la actividad física; CECAR. Corporación Universitaria del Caribe, 2021. [Google Scholar]
- Cardozo, L.C. Body fat percentage and prevalence of overweight - obesity in college students of sports performance in Bogotá, Colombia. Nutrición Clínica y Dietética Hospitalaria 2016, 68–75. [Google Scholar] [CrossRef]
- Pirazán Rodríguez, M.J.; Pirazán Rodríguez, M.J.; Rivera Santisteban, M.E.; Anzola Martínez, F. Efectos de un programa de entrenamiento concurrente sobre el perfil antropométrico y la fuerza muscular en un grupo de jóvenes universitarios. Revista Digital: Actividad Física y Deporte 2020, 6, 14–31. [Google Scholar] [CrossRef]
- Coratella, G.; Beato, M.; Milanese, C.; Longo, S.; Limonta, E.; Rampichini, S. Specific Adaptations in Performance and Muscle Architecture After Weighted Jump-Squat vs. Body Mass Squat Jump Training in Recreational Soccer Players. J Strength Cond Res 2018, 32, 921–929. [Google Scholar] [CrossRef]
- Correa C, LaRoche D, Cadore E, Reischak-Oliveira A, Bottaro M, Kruel LF. 3 Different Types of Strength Training in Older Women. Int J Sports Med 2012, 33, 962–969. [CrossRef]
- Franchi, M.V.; Monti, E.; Carter, A.; Quinlan, J.I.; Herrod, P.J.J.; Reeves, N.D. Bouncing Back! Counteracting Muscle Aging With Plyometric Muscle Loading. Front Physiol 2019, 10. [Google Scholar] [CrossRef]
- Simó-Servat, A.; Ibarra, M.; Libran, M.; Escobar, L.; Perea, V.; Quirós, C. Prospective Study to Evaluate Rectus Femoris Muscle Ultrasound for Body Composition Analysis in Patients Undergoing Bariatric Surgery. J Clin Med 2024, 13, 3763. [Google Scholar] [CrossRef]
- Simó-Servat, A.; Ibarra, M.; Libran, M.; Quirós, C.; Puértolas, N.; Alonso, N. Usefulness of Ultrasound in Assessing the Impact of Bariatric Surgery on Body Composition: a Pilot Study. Obes Surg 2023, 33, 1211–1217. [Google Scholar] [CrossRef]
- Rustani, K.; Kundisova, L.; Capecchi, P.L.; Nante, N.; Bicchi, M. Ultrasound measurement of rectus femoris muscle thickness as a quick screening test for sarcopenia assessment. Arch Gerontol Geriatr 2019, 83, 151–154. [Google Scholar] [CrossRef]
- Mechelli, F.; Arendt-Nielsen, L.; Stokes, M.; Agyapong-Badu, S. Validity of Ultrasound Imaging Versus Magnetic Resonance Imaging for Measuring Anterior Thigh Muscle, Subcutaneous Fat, and Fascia Thickness. Methods Protoc 2019, 2, 58. [Google Scholar] [CrossRef]
- Prado, C.M.M.; Heymsfield, S.B. Lean Tissue Imaging. Journal of Parenteral and Enteral Nutrition 2014, 38, 940–953. [Google Scholar] [CrossRef]
- Pineau, J.C.; Bouslah, M. Prediction of body fat in male athletes from ultrasound and anthropometric measurements versus DXA. J Sports Med Phys Fitness 2020, 60. [Google Scholar] [CrossRef]
- Miclos-Balica, M.; Muntean, P.; Schick, F.; Haragus, H.G.; Glisici, B.; Pupazan, V. Reliability of body composition assessment using A-mode ultrasound in a heterogeneous sample. Eur J Clin Nutr 2021, 75, 438–445. [Google Scholar] [CrossRef]
- Fischer, A.; Anwar, M.; Hertwig, A.; Hahn, R.; Pesta, M.; Timmermann, I. Ultrasound method of the USVALID study to measure subcutaneous adipose tissue and muscle thickness on the thigh and upper arm: An illustrated step-by-step guide. Clin Nutr Exp 2020, 32, 38–73. [Google Scholar] [CrossRef]
- Stock, M.S.; Thompson, B.J. Echo intensity as an indicator of skeletal muscle quality: applications, methodology, and future directions. Eur J Appl Physiol 2021, 121, 369–380. [Google Scholar] [CrossRef]
- Bali, A.U.; Harmon, K.K.; Burton, A.M.; Phan, D.C.; Mercer, N.E.; Lawless, N.W. Muscle strength, not age, explains unique variance in echo intensity. Exp Gerontol 2020, 139, 111047. [Google Scholar] [CrossRef]
- Wong, V.; Spitz, R.W.; Bell, Z.W.; Viana, R.B.; Chatakondi, R.N.; Abe, T. Exercise induced changes in echo intensity within the muscle: a brief review. J Ultrasound 2020, 23, 457–472. [Google Scholar] [CrossRef]
- Vasenina, C.; Kataoka, R.; Hammert, W.B.; Ibrahim, A.H.; Dankel, S.J.; Buckner, S.L. Examination of Changes in Echo Intensity Following Resistance Exercise among Various Regions of Interest. Clin Physiol Funct Imaging 2022, 42, 23–28. [Google Scholar] [CrossRef]
- Schoenfeld, B.J. The Mechanisms of Muscle Hypertrophy and Their Application to Resistance Training. J Strength Cond Res 2010, 24, 2857–2872. [Google Scholar] [CrossRef]
- Wernbom, M.; Augustsson, J.; Thomeé, R. The Influence of Frequency, Intensity, Volume and Mode of Strength Training on Whole Muscle Cross-Sectional Area in Humans. Sports Medicine 2007, 37, 225–264. [Google Scholar] [CrossRef]
- Schoenfeld, B.J. Science and development of muscle hypertrophy; Human Kinetics, 2020. [Google Scholar]
- Suchomel, T.J.; Nimphius, S.; Stone, M.H. The Importance of Muscular Strength in Athletic Performance. Sports Medicine 2016, 46, 1419–1449. [Google Scholar] [CrossRef]
- Franchi, M.V.; Reeves, N.D.; Narici, M.V. Skeletal Muscle Remodeling in Response to Eccentric vs. Concentric Loading: Morphological, Molecular, and Metabolic Adaptations. Front Physiol 2017, 8. [Google Scholar] [CrossRef]
- Proske, U.; Morgan, D.L. Muscle damage from eccentric exercise: mechanism, mechanical signs, adaptation and clinical applications. J Physiol. 2001, 537, 333–345. [Google Scholar] [CrossRef] [PubMed]
- Kraemer, W.J.; Ratamess, N.A. Fundamentals of Resistance Training: Progression and Exercise Prescription. Med Sci Sports Exerc 2004, 36, 674–688. [Google Scholar] [CrossRef] [PubMed]
- Zatsiorsky, V.M.; Kraemer, W.J.; Fry, A.C. Science and practice of strength training; Human kinetics, 2020. [Google Scholar]
- World Health Organization. Waist circumference and waist-hip ratio: report of a WHO expert consultation; Geneva, 2011. [Google Scholar]
- Zermeño-Ugalde, P.; Gallegos-García, V.; Ramírez, R.A.C.; Gaytán-Hernández, D. Relación del índice cintura-estatura (ICE) con circunferencia cintura e índice de cintura cadera como predictor para obesidad y riesgo metabólico en adolescentes de secundaria. Rev Salud Pública Nutr 2020, 19, 19–27. [Google Scholar]
- Obesity: preventing and managing the global epidemic. Report of a WHO consultation. World Health Organ Tech Rep Ser 2000, 894, i253.
- Young, H.; Jenkins, N.T.; Zhao, Q.; Mccully, K.K. Measurement of intramuscular fat by muscle echo intensity. Muscle Nerve 2015, 52, 963–971. [Google Scholar] [CrossRef]
- Wu, J.S.; Darras, B.T.; Rutkove, S.B. Assessing spinal muscular atrophy with quantitative ultrasound. Neurology 2010, 75, 526–531. [Google Scholar] [CrossRef]
Figure 1.
Analysis of correlations between anthropometric and ultrasound variables.
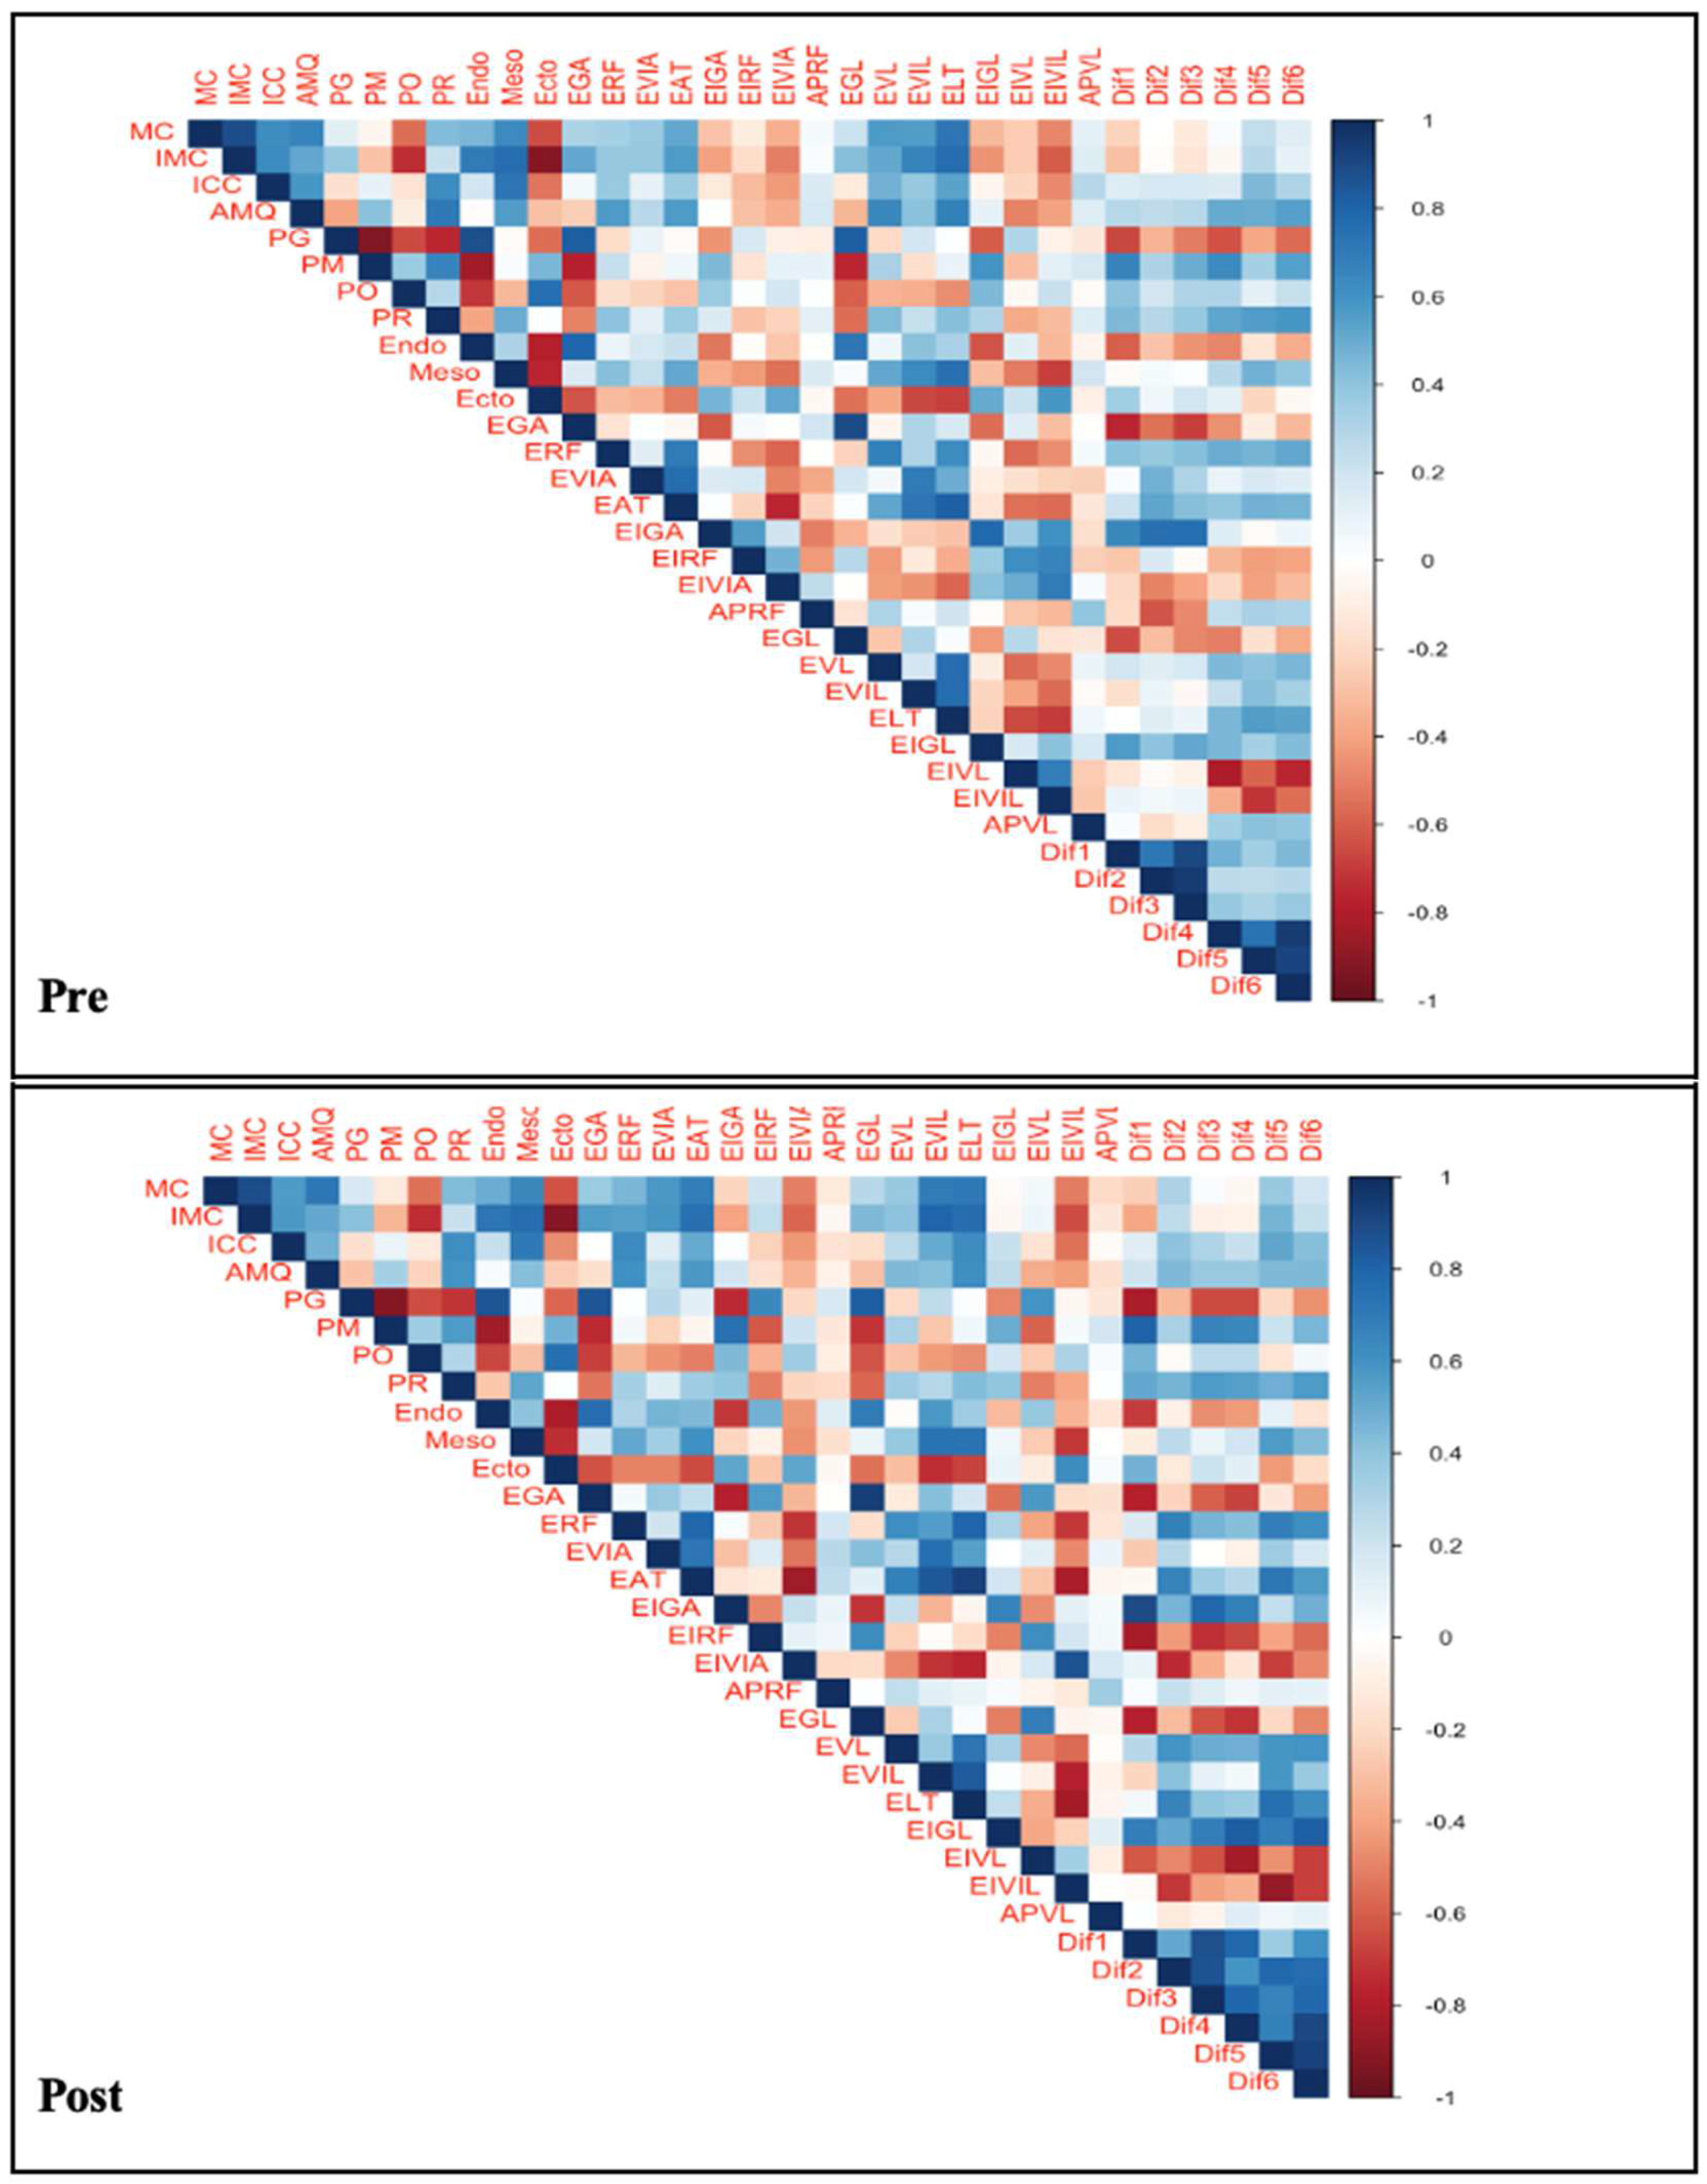

Table 1.
Descriptive statistics.
| Descriptive statistics | Data |
|---|---|
| n 1 | 31 |
| Age (years) (M±DS) 1 | 22.3±4.14 |
| Height (meters) (M±DS) 1 | 1.73±0.08 |
| Body Mass (Kg)(Mediana±DAM) 1 | 69±13.64 |
| IMC (Kg/m2) (Mediana±DAM) 1 | 23.54±3.34 |
1 M: Mean. SD: Standard Deviation. DAM: Absolute Deviation from the Median. n: sample size. IMC: Body Mass Index.
Table 2.
Distribution of fat percentage interpretation.
| Anthropometry (% fat) | Pre - n (%) | Post- n (%) | p-value |
|---|---|---|---|
| Media | 21 (67.74) | 14 (45.16) | 0.0302 1 |
| Good | 1 (3.2) | 7 (22.6) | |
| Excellent | 9 (29.03) | 10 (32.25) | |
| Total | 31 (100) | 31 (100) |
1 Chi-square test of marginal homogeneity: Stuart and Maxwell’s extension to McNe-mar’s test.
Table 3.
This is a table. Tables should be placed in the main text near to the first time they are cited.
Table 3.
This is a table. Tables should be placed in the main text near to the first time they are cited.
| Ultrasound | Medium | DAM | Medium | DAM | p value* | Size of the effect |
|---|---|---|---|---|---|---|
| Pre | Post | |||||
| EGA | 5.120 | 3.050 | 5.690 | 3.560 | 0.827 | 0.041 |
| ERF | 25.930 | 4.050 | 27.370 | 5.460 | 0.004 | 0.500 |
| EVIA | 20.450 | 2.940 | 21.000 | 3.460 | 0.158 | 0.255 |
| EAT | 48.060 | 6.910 | 49.080 | 7.410 | 0.005 | 0.484 |
| EIGA | 155.220 | 17.010 | 157.160 | 11.970 | 0.111 | 0.289 |
| EIRF | 116.290 | 18.160 | 112.050 | 9.610 | 0.182 | 0.243 |
| EIVIA | 90.050 | 15.880 | 90.380 | 13.670 | 0.999 | 0.000 |
| APRF | 15.120 | 4.560 | 17.000 | 2.620 | 0.055 | 0.345 |
| EGL | 5.060 | 3.230 | 5.600 | 3.290 | 0.812 | 0.044 |
| EVL | 24.320 | 4.180 | 25.120 | 4.040 | 0.035 | 0.377 |
| EVIL | 20.400 | 4.630 | 19.510 | 4.370 | 0.820 | 0.042 |
| ELT | 47.590 | 7.990 | 48.580 | 6.520 | 0.003 | 0.516 |
| EIGL | 151.590 | 10.900 | 155.480 | 9.980 | 0.135 | 0.271 |
| EIVL | 119.740 | 18.020 | 117.390 | 10.780 | 0.157 | 0.257 |
| EIVIL | 78.470 | 14.620 | 80.030 | 19.120 | 0.399 | 0.155 |
| APVL | 16.130 | 3.590 | 15.650 | 3.190 | 0.961 | 0.011 |
| Dif1 | 33.000 | 15.540 | 41.170 | 18.320 | <0.0001 | 0.686 |
| Dif2 | 67.170 | 15.400 | 71.730 | 21.280 | 0.224 | 0.222 |
| Dif3 | 49.110 | 14.060 | 55.630 | 13.730 | 0.002 | 0.524 |
| Dif4 | 30.780 | 24.940 | 37.920 | 19.890 | 0.001 | 0.560 |
| Dif5 | 79.520 | 13.800 | 84.100 | 23.020 | 0.854 | 0.035 |
| Dif6 | 56.650 | 19.270 | 59.770 | 21.540 | 0.157 | 0.257 |
Note. Wilcoxon signed-rank test. DAM: Absolute deviation from the median. EGA: anterior region subcutaneous fatty tissue thickness. ERF: RF thickness. EVIA: LV thickness in the anterior region. EAT: Total anterior thickness. EIGA: EI anterior subcutaneous fatty tissue. EIRF: RF EF: RF EF. EI-VIA: EI of the VL in the anterior region. APRF: RF pennation angle. EGL: lateral region fat thickness. EVL: VL thickness. EVIL: VL thickness in lateral region. ELT: lateral total thickness. EIGL: EI of subcutaneous fatty tissue in lateral region. EIVL: VL IE: VL IE. EIVIL: EI of the VL in the lateral region. APVL: VL pennation angle. Diff1: Anterior fatty IE minus RF IE. Diff2: EI Anterior fat minus EI of the anterior LV. Diff3: EI Anterior fat minus average EI of RF + EI of anterior VL. Diff4: EI Lateral fat minus EI of VL. Diff5: Anterior IE fat minus lateral VL IE. Diff6: Lateral IE Lateral fat minus average VL IE + lateral VI IE.
Table 4.
Load progression.
| Stage | Days | % 1RM | Series | Repetitions | Reference |
|---|---|---|---|---|---|
| 1 | 1-3 | 60-70 | 4-5 | 10-12 | Bompa & Carrera (2015) [15] |
| 2 | 4-6 | 70-80% | 4-5 | 8-10 | Schoenfeld (201) [8] |
| 3 | 7-9 | 80-90% | 5-6 | 4-6 | Zatsiorsky & Kraemer (2020) [14] |
| 4 | 10-12 | 85-95% | 4-5 | 3-5 | Verkhoshansky (2009) [16] |
Note. 1RM: one maximum repetition.
Disclaimer/Publisher’s Note: The statements, opinions and data contained in all publications are solely those of the individual author(s) and contributor(s) and not of MDPI and/or the editor(s). MDPI and/or the editor(s) disclaim responsibility for any injury to people or property resulting from any ideas, methods, instructions or products referred to in the content. |
© 2025 by the authors. Licensee MDPI, Basel, Switzerland. This article is an open access article distributed under the terms and conditions of the Creative Commons Attribution (CC BY) license (http://creativecommons.org/licenses/by/4.0/).
Copyright: This open access article is published under a Creative Commons CC BY 4.0 license, which permit the free download, distribution, and reuse, provided that the author and preprint are cited in any reuse.


