
Submitted:
14 July 2025
Posted:
15 July 2025
You are already at the latest version
Abstract
Phenolic compounds are the main components of green propolis, including its chemical marker Artepellin C, and several studies have been carried out to elucidate both its composition and biological activities. In this study, ultrasound-assisted extraction (UAE) and response surface methodology (RSM) were applied to optimize the extraction process of phenolic compounds in Brazilian green propolis using methanol and ethanol as extraction solvents. The results showed that the ideal conditions for extracting simple phenolics with ethanol were 50% ethanol/water, 20 °C, 20% amplitude, and 0.6 s cycle; for complex phenolics, the conditions were 80% ethanol, 60 °C, 43% amplitude, and 0.8 s cycle. Using methanol, the ideal conditions were 100% solvent, 37 °C, 38% amplitude, and 0.2 s cycles.
Keywords:
propolis
; ultrasound-assisted extraction
; Box-Behnken
; phenolics
; antioxidant activity
1. Introduction
Green propolis, a resin collected by bees of the Apis mellifera species from plants of the Asteraceae family, such as Baccharis dracunculifolia DC., has garnered increasing interest due to its medicinal properties and potential therapeutic applications [1]. Its phenolic composition has been the subject of intense research due to benefits related to human health, such as antioxidant [2,3], anti-inflammatory [4], antitumor [5], and antiviral [4].
However, efficiently obtaining compounds from propolis is often challenging due to the complexity of its matrix and the need to preserve its integrity and therapeutic potential during the extraction process. Recent research has focused on innovative and practical extraction methods. One technique that has gained prominence over the past two decades is ultrasound-assisted extraction (UAE) [6,7]. Based on the use of high-frequency sound waves, UAE promotes the disintegration of propolis cells and the release of bioactive compounds.
Due to its simplicity, low cost, minimal solvent usage, speed, and high extraction quality, UAE is considered an effective and more environmentally friendly method for quality control [7]. This technique has been successfully used to extract bioactive compounds from peppers [8], blackberries, onions and mushrooms [7], and other natural sources [9,10,11].
The UAE is influenced by various factors, such as solvent type, temperature, amplitude, cycle, pH, and the sample-to-solvent ratio; therefore, it cannot be universally applied to all matrices. Therefore, it is crucial to determine the optimal extraction conditions for each specific application [7]. Response Surface Methodology (RSM) is a powerful statistical tool well-suited for this purpose, as it allows for the optimization of multiple variables and their interactions while minimizing the number of required experiments [6,12]. Additionally, RSM can predict the optimal conditions to maximize or minimize one or more response variables, either individually or simultaneously [6,13].
In this study, Response Surface Methodology (RSM) was employed to determine the optimal operational parameters for ultrasound-assisted extraction (UAE) of phenolic compounds. The optimization process was carried out using a Box-Behnken Design (BBD), which offers several advantages over other statistical designs, including reduced reagent consumption, fewer experimental runs, and the avoidance of extreme treatment combinations [10]. This approach enabled the careful determination of optimal conditions for both (i) phenolic compound extraction and (ii) antioxidant activity. To the best of our knowledge, this is the first study to optimize UAE parameters specifically for the extraction of phenolic compounds from Brazilian green propolis.
2. Materials and Methods
2.1. Materials
Methanol and ethanol HPLC grade were acquired from Fisher Scientific (Loughborough, UK) and ultrapure water from Milli–Q water purification system (Millipore, Bedford, MA, USA). HCl, formic acid and NaOH were purchased (Panreac, Barcelona, Spain). Reference standards: gallic acid (CAS 149-91-7), caffeic acid (CAS 331-39-5), chlorogenic acid (CAS 327-97-9), coumaric acid (CAS 501-98-4), Artepellin C (CAS 72944-19-5) and trans-ferulic acid (CAS 537-98-4) were acquired from Sigma-Aldrich (Saint Louis, MO, USA). Cellulose ester membrane filters of 0.45 μm (SLCR025NS, Millipore; Bedford, MA, USA). For the antioxidant analysis, DPPH (2,2-diphenyl-1-picrylhydrazyl) was purchased from Sigma-Aldrich (Saint Louis, MO, USA), and 6-hydroxy-2,5,7,8-tetramethylchroman-2-carboxylic acid (Trolox) was obtained from Sigma-Aldrich (Steinheim, Germany).
Green propolis was obtained from the company Apis Vida (Brazil) and the scientific study was authorized by the Brazilian Heritage System (SISGEN) under the number AAD964E.
2.2. Optimization of Ultrasound-Assisted Extraction (UAE)
Native green propolis from Minas Gerais/Brazil was pulverized using a knife mill. Ultrasound-assisted extraction was performed using a Sonopuls HD 4100 ultrasonic system (100 W, 20 kHz) equipped with a VS70T probe (volume capacity 20–900 mL, 13 mm diameter, 130 mm length, 97 µm amplitude), both from BANDELIN electronic GmbH (Berlin, Germany). A thermostatically controlled double-vessel bath (Frigiterm-10, Selecta, Barcelona, Spain) was used to maintain the samples at the desired temperature
To develop the optimized UAE method, a series of experiments were conducted. In each test, 0.25 g of green propolis was weighed in a Falcon tube and 20 mL of the solvent was added. A preliminary study was carried out to evaluate the influence of the percentage of solvent and temperature on the extraction of phenolic compounds. Different solutions of solvents - MeOH or EtOH in water - were evaluated (0, 20, 40, 60, 80, and 100%). The UAE conditions established for the extractions were: the percentage of solvent (20 to 100%), time (10 min), sample-solvent ratio (0.25 g:20 mL), temperature (25 °C), cycle (0.5) and amplitude (50%). To consider the best percentage of solvents, the extraction temperature was also investigated. The UAE conditions for these extractions include temperature (10, 20, 30, 40, 50, 60, and 70 °C), time (10 min), sample-solvent ratio (0.5 g:20 mL), cycle (0.5), amplitude (50%) and percentage of solvent (MeOH 80% and EtOH 60%). These parameters were selected based on the previous experience of the research team with similar matrices.
The extracts were centrifuged for 5 min, filtered through 0.20 μm nylon syringe filters, and analyzed under UHPLC–DAD conditions. The peak areas of the identified phenolic compounds were measured and normalized based on the sample weight. The sum of these normalized areas was used as the response variable.
2.3. Box-Behnken Experimental Design (BBD) and Response Surface Methodology (RSM)
The Box-Behnken experimental design (BBD), in conjunction with the Response Surface Methodology (RSM), was used to optimize several experimental parameters related to the extraction of bioactive compounds from green propolis.
Three levels were attributed to each of them: %MeOH/EtOH (50, 75, and 100%), temperature (20, 40, and 60 °C), amplitude (20, 40, and 60% maximum amplitude), and cycle (0.2, 0.6 and 1.0 s). The solvent volume and the extraction time were kept constant at 20 mL and 10 min. The selection of these intervals is based on the previous experience of the research team with similar matrices [14,15,16].
A total of 27 experiments were randomly performed with Design Expert software 11 (Trial Version, Stat-Ease Inc., Minneapolis, MN, USA). The extracts were centrifuged for 5 min, and the supernatants (25 mL) were filtered using 0.20 μm nylon syringe filters, followed by analysis under UHPLC–DAD conditions, and the sum of the normalized areas was calculated as previously explained and used as the response variable (Table 1).
2.4. UHPLC-DAD Analysis
Green propolis extracts were analyzed by UHPLC using a chromatographic system (Waters Corp., ACQUITYTM, UHPLCTM H-Class; Milford, MA, USA) to quantify and separate the main bioactive compounds. The UHPLC system was equipped with a quaternary pump, an automatic sampler, an oven column set at 40 °C for chromatographic separation, and a DAD (Waters Corp., PDA100; Milford, MA, USA). The software application Empower3™ (Waters Corp.; Milford, MA, USA) was used for equipment control and data acquisition. A Waters ACQUITY UPLC BEH C18 (100 mm x 2.1 mm, 1.7 µm particle size) was used as the analytical column. The DAD detector was set to a 210–600 nm wavelength range for 3D scanning. For the peak integrations and quantification of the compounds, the DAD detector was set to 320 nm. The chromatographic method used was previously described in works from the team [10]. Acidified water (0.1% acetic acid, solvent A) and acidified acetonitrile (0.1% acetic acid, solvent B) were used as the mobile phase, flow rate of 0.5 mL min−1 and a column temperature of 40 °C. The gradient used for the chromatographic separations was as follows (time, % solvent B): 0 min, 0%; 0.5 min, 10%; 2 min, 15%; 3.5 min, 20%; 5 min, 25%; 6.5 min, 40%; 8 min, 50%; 9 min, 75%; 10 min, 100%; 13 min, 100% and 15 min, 0%; followed by a 5 min column wash using 100% B. The extracts were filtered through 0.22 µm nylon filters. The volume of injection was 3 µL. The individual bioactive compounds were quantified based on the area of each chromatographic peak corresponding to the phenolic compounds.
2.5. Statistical Analysis
All experimental data from the extractions were analyzed using Design Expert Software version 11 (Trial Version, Stat-Ease Inc., Minneapolis, MN, USA). This software was employed to evaluate the effects of the variables on the response, perform analysis of variance (ANOVA), generate the second-order mathematical model, and determine the optimal levels of significant variables. Figures were created using Statgraphics Centurion XVIII (Trial Version, StatPoint Technologies, Inc., Warrenton, VA, USA), while bar graphs were generated with GraphPad Prism 8.
3. Results and Discussion
3.1. Identification of Compounds
Ten chemical compounds were identified and quantified in the samples based on their retention times and ultraviolet spectra. These compounds were also used to construct calibration curves for quantitative analysis (Figure 1).
3.2. Univariate Study of Optimal Range of Methanol/Ethanol Percentage in Water
To effectively apply a multivariate optimization strategy such as the Box-Behnken Design (BBD), it is essential to first establish appropriate operational ranges for each independent variable involved in the process. A univariate analysis allows the identification of the most promising ranges of solvent concentration and temperature by evaluating their influence on phenolic compound extraction. These defined intervals serve as a foundation for the subsequent multivariate approach, ensuring that the experimental design explores relevant regions of the parameter space where maximum extraction efficiency is likely to occur. This preliminary step is crucial to guarantee the success and accuracy of the optimization process. The percentage of ethanol in water increases, and the total amount of complex phenolics extracted also increases. This suggests that increasing the ethanol content in the aqueous solution makes the extraction solvent more similar in polarity to the target compounds, thereby enhancing their extraction efficiency [16]. However, 60% EtOH/H2O was more effective, as it exhibits high solubilization for polar phenolic compounds (23.987 mgYpcg-1).
For extractions using methanol, an intermediate concentration of 80% offers an ideal balance of polarity and solvation capacity for phenolic compounds, resulting in a yield of 24.517 mg YPCg⁻¹. This concentration is often effective because it optimizes the solubility of a broad range of phenolic compounds, some of which are more soluble in polar environments, while others dissolve better in less polar conditions. Based on these considerations, an ethanol or methanol concentration range of 50% to 100% in water was selected for the development of the extraction method.
3.3. Univariate Study of Optimal Range of Temperature
After determining the optimal solvent concentrations for phenolic compound extraction, the next step was to assess the impact of temperature. Since temperature is a critical parameter that influences both the solubility and stability of bioactive molecules, it is essential to define an appropriate temperature range before proceeding with multivariate optimization. A univariate temperature study was conducted to identify the range in which extraction efficiency is maximized while minimizing the risk of thermal degradation. This step ensures that the Box-Behnken Design (BBD) is constructed within meaningful and efficient operational conditions, thereby enhancing the robustness and relevance of the optimization model. Extraction temperature is a critical parameter that can significantly impact the yield of compounds, either by improving their recovery or by promoting the degradation of thermolabile constituents [8]. A univariate analysis was conducted over a temperature range of 10–70 °C, using methanol and ethanol at the previously established optimal solvent-to-water ratios. The objective was to define an appropriate temperature interval for subsequent optimization using the BBD approach. The experiment was realized in triplicate.
A significant change in the profile of the extracted compounds, especially at a temperature of 50 °C using ethanol (29.26 mgYpcg–1) and 40 °C - 27.31 mgYpcg–1) using methanol as solvent extractor, where the values are noticeably high compared to other temperatures, increasing about 4 mgYpcg–1 using ethanol and 6 mgYpcg–1 using methanol. In the case of both solvents, as the temperature increases, the extracted composition returns to values like those observed at lower temperatures. These alterations can be attributed to the degradation of thermolabile phenolic compounds or modifications in the chemical structure, leading to the formation of other compounds and compromising the integrity of the extraction result [17].
Due to the degradation of compounds above 60 °C, marked by a decrease in total phenolics, as well as the high energy consumption and extended cooling periods required at higher temperatures, the operational range was defined between 50 and 100 °C."
3.4. Optimizing the Ultrasound-Assisted Extraction (UAE)
After identifying the most influential variables, a BBD based on RSM was developed using the following independent variables: % MeOH/EtOH, extraction temperature, ultrasound amplitude, and cycle duration. A total of 27 extractions were carried out in randomized order for each solvent (methanol and ethanol), resulting in 54 experimental runs. The solvent volume was fixed at 20 mL, and the total extraction time was maintained at 10 min for all experiments (Table 1).
Given the highly complex chemical composition of green propolis, the optimization of extracts was conducted separately. When ethanol was employed as the extraction solvent, phenolic compounds were further classified into simple and complex phenolics to refine the analysis. As a result, three distinct extract profiles were identified outside the experimental design: (i) methanol-extracted phenolic-rich fraction (MeOHTP), characterized by higher concentrations of p-coumaric acid, ferulic acid, chlorogenic acid, and caffeic acid; (ii) ethanol-extracted simple phenolic fraction (EtOHSP), comprising mainly rosmarinic acid, kaempferide, drupamine, baccharin, Artepellin C, and chromene; and (iii) ethanol-extracted complex phenolic fraction (EtOHCP), enriched in more structurally elaborate phenolic compounds.
The total area was quantified by UHPLC analysis, and the measured and predicted values were correlated (Table 2). Before evaluating the individual contributions of each factor through the Pareto chart, the quality of the fitted models was assessed by examining the coefficient of determination (R²) and the prediction error for each extraction condition. The R² values obtained for the three extraction profiles—methanol-extracted (MeOHTP), ethanol-extracted simple phenolics (EtOHSP), and ethanol-extracted complex phenolics (EtOHCP)—were all above 0.90, indicating a good fit between the experimental and predicted responses. Furthermore, the residuals were evenly distributed, and no significant lack-of-fit was observed, supporting the adequacy of the quadratic models. The low prediction errors across the runs confirm the reliability of the response surface models for anticipating extraction outcomes under varying experimental conditions [6,14]. These analyses revealed the individual and combined effects of the extraction factors on the response variable (phenolic compounds). Specifically, the factors with p-values lower than 0.05 (95% significance level) had a relevant influence on the response. This information was visually complemented using a Pareto chart (Figure 2). In this chart, Significance to the response variable was attributed to factors whose horizontal bars exceeded the vertical reference line.
Based on the Pareto diagram analysis and ANOVA, it was evident that the percentage of ethanol was the factor with the greatest influence on the extraction of simple and complex phenolic compounds, followed by its interaction with temperature. Meanwhile, for complex phenolics, the interaction between the percentage of solvent and the amplitude of the equipment also demonstrates a significant impact on extraction efficiency. Although many phenolic compounds were successfully extracted using methanol, none of the tested factors were found to be statistically significant. However, the solvent concentration emerged as the variable with the greatest potential impact on extraction efficiency. These findings underscore the importance of carefully controlling ethanol concentration, temperature, and their interaction with ultrasound amplitude to optimize the extraction of both simple and complex phenolic compounds. This provides valuable insights for enhancing the efficiency and selectivity of bioactive compound extraction processes.
In this study, the extraction solvent was identified as one of the most influential factors for recovering this type of compound. To efficiently extract natural compounds, solvents or solvent mixtures with polarity similar to that of the target compounds must be used. Therefore, the concentration of the extraction solvent emerges as the key parameter in the extraction of phenolic compounds. Accordingly, solvents or solvent mixtures capable of effectively dissolving the target compounds should be selected. For phenolics, high concentrations of methanol (80%) or ethanol (60%) in water are commonly used, a finding that is supported by the results of this work [13].
The application of ultrasound enhances the penetration and availability of solvents within the propolis matrix, facilitating greater interaction between the solvent and the target compounds. This method improves extraction efficiency and significantly reduces the time required to achieve optimal yields. The enhancement occurs primarily due to the disruption of cell walls caused by ultrasonic cavitation, which increases the release of antioxidant compounds into the solution. Moreover, precise control of ultrasound parameters, such as cycle and amplitude, is essential to prevent the degradation of ultrasound-sensitive compounds, ensuring efficient extraction while minimizing damage to the sample matrix [8].
The coefficients of the second-order polynomial equation for calculating the area of extracted phenolic compounds were derived from the analysis of the BBD-RSM design, yielding the following equations:
Equation for EtOHSP:
Y = 5,75794 - 0,872368*A + 0,182342*B – 0,154304*C – 0,0622775*D – 0,867586*A^2 + 0,835627*AB + 0,145865*AC + 0,298932*AD + 0,0853767*B^2 + 0,223795*BC + 0,0548125*BD – 0,133105*C^2 – 0,110412*CD – 0,176655*D^2
Equation for EtOHCP:
Y = 16,6689 – 0,5727*A + 0,176908*B + 0,215208*C + 0,0616167*D – 1,36903*A^2 + 0,900375*AB + 0,754325*AC + 0,5327*AD + 0,0510083*B^2 + 0,205125*BC – 0,387025*BD – 0,412967*C^2 – 0,307325*CD –0,513704*D^2
Equation MeOHTP:
where A represents the %MeOH/EtOH in the solvent, B the extraction temperature, C the cycle, and D the amplitude.
Y = 22,4436 + 0,987421*A – 0,34717*B – 0,47497*C – 0,187154*D – 0,560655*A^2 + 0,309943*AB – 0,530667*AC + 0,567187*AD – 0,29868*B^2 – 0,0337332*BC – 0,325636*BD – 0,0611652*C^2 + 0,206203*CD – 0,700847*D^2
Additionally, RSM makes it easier to determine the optimal values for the independent factors, which would lead to the attainment of the most favorable results for the response variable. Table 3 shows the optimum values that would yield the highest phenolic compounds from the ethanolic and methanolic extracts obtained from green propolis.
3.5. Optimizing the Extraction Time
The relative peak areas of phenolic compounds extracted at different times. The maximum recovery using ethanol was observed at an extraction time of 20 minutes, yielding 26.316 mg TP/g extract. This result showed a statistically significant difference compared to other time intervals, indicating that 20 minutes is the optimal extraction time under the tested conditions.
Shorter extraction times, ranging from 2 to 20 minutes, resulted in lower relative peak areas, suggesting that a longer duration is necessary for effective extraction with the given equipment settings. In contrast, when using methanol, the optimal extraction time was 10 min, with a yield of 24.730 mg TP/g extract. Longer durations led to decreased phenolic content, likely due to degradation of phenolic compounds caused by prolonged mechanical or chemical exposure during ultrasonic treatment [8].
3.6. Precision Evaluation of the Optimized UAE Method
The repeatability and intermediate precision of the developed method remain to be determined to assess its accuracy and reliability in detecting and quantifying phenolic compounds in the extracts. To evaluate repeatability, nine extractions were performed on the same day under the established optimal conditions. For intermediate precision assessment, a total of 27 extractions were conducted over three consecutive days, with nine extractions carried out each day (n = 9 + 9 + 9).
Repeatability was assessed by calculating the coefficient of variation (CV) from experiments performed on the same day. At the same time, intermediate precision was evaluated by determining the CV from experiments conducted on different days. The repeatability CV values obtained were 1.95% for methanol and 1.45% for ethanol, whereas the CV values for intermediate precision were 2.47% for methanol and 1.80% for ethanol. As all these values were below 5%, the optimized extraction method was confirmed to possess high precision.
To complement the global extraction yield analysis, the individual concentrations of phenolic compounds were calculated using their respective calibration curves. These results, shown in Table 4, provide a more detailed understanding of the phenolic profiles of each extract.
4. Conclusions
In this study, an optimization strategy combining Box-Behnken Design (BBD) and Response Surface Methodology (RSM) was employed to refine a two-step ultrasound-assisted extraction (UAE) method for phenolic compounds from Brazilian green propolis, as well as to enhance its antioxidant activity.
The developed UAE method was promptly validated, demonstrating repeatability and intermediate precision with coefficients of variation below 5%. This approach enables the efficient extraction of a broad range of phenolic compounds, offering advantages such as time savings, improved reproducibility, and reduced environmental impact. These advancements present significant benefits for the pharmaceutical, chemical, and industrial sectors by facilitating faster extraction processes, increasing the concentration of target compounds, and ensuring greater standardization of bioactive ingredients. Enhanced extraction efficiency supports the large-scale production of extracts enriched in specific bioactive compounds, thereby expanding their use in formulations with antioxidant, anti-inflammatory, antibacterial, and antiviral properties. Furthermore, the shortened extraction time and high performance contribute to the optimization of quality control procedures, ensuring consistency and efficacy in pharmaceutical and chemical products derived from Brazilian green propolis.
Supplementary Materials
The following supporting information can be downloaded at the website of this paper posted on Preprints.org. Table S1: Parameters evaluated by UHPLC-DAD for the standard of phenolic compounds in green propolis. Table S2: Values obtained for total phenolic (mg TP/g of extract) compounds in samples with variation of methanol/water ratio (mg TP/g of extract). Table S3: Values obtained from total phenolic (mg TP/g of extract) compounds in samples with variation of ethanol/water ratio (mg TP/g of extract). Table S4: Values obtained from total phenolic (mg TP/g of extract) compounds in samples with temperature variation using methanol/water. Table S5: Values obtained from total phenolic (mg TP/g of extract) compounds in samples with temperature variation using ethanol/water. Table S6: ANOVA results obtained (quadratic model) for simple phenolic compounds extracted with ethanol by UAE using a BBD. Table S7: ANOVA results obtained (quadratic model) for complex phenolic compounds extracted with ethanol by UAE using a BBD. Table S8: ANOVA results obtained (quadratic model) for phenolic compounds extracted with methanol by UAE using a BBD. Table S9: Values obtained for total phenolics (mg TP/g extract) based on the optimal extraction conditions with methanol and varying only the time. Table S10: Values obtained for total phenolics (mg TP/g extract) based on the optimal extraction conditions with ethanol and varying only the time.
Author Contributions
Conceptualization, D.P., G.F.B., C.C.F. and D.S.A.C.; Methodology, D.P. N.M.M.E., T.CK., G.F.B. and C.C.F.; Validation, C.C.F. and G.F.B.; Investigation, D.P. N.M.M.E. T.C.K.; Writing – Original Draft Preparation, D.P., D.S.A.C., G.F.B. and C.C.F.; Writing – Review & Editing, D.S.A.C., G.F.B., C.C.F.; M.P. and V.V.J.; Supervision, D.S.A.C.; Project Administration, D.S.A.C.; Funding Acquisition, D.S.A.C.
Funding
This research was funded by Fundação de Amparo a Pesquisa Científica do Estado do Rio de Janeiro, FAPERJ - E-26/211.285/2021.
Acknowledgments
Fundação de Amparo a Pesquisa Científica do Estado do Rio de Janeiro, UFRRJ, and Cadiz University/ES.
Conflicts of Interest
The authors declare no conflicts of interest.
References
- Sforcin, J.M.; Bankova, V. Propolis: Is there a potential for the development of new drugs? J Ethnopharmacol. 2011, 133, 253–260. [Google Scholar] [CrossRef] [PubMed]
- Andrade, J. K. S.; Denadai, M.; de Oliveira, C. S.; Nunes, M. L.; Narain, N. Evaluation of bioactive compounds potential and antioxidant activity of brown, green and red propolis from Brazilian northeast region. Food Research International. 2017, 101, 129–138. [Google Scholar] [CrossRef] [PubMed]
- Salgueiro, F.B.; Castro, R.N. Comparação entre a composição química e capacidade antioxidante de diferentes extratos de própolis verde. Quim Nova. 2016, 39, 1192–1199. [Google Scholar] [CrossRef]
- Silva-Beltrán, N.P. , Balderrama-Carmona, A.P., Umsza-Guez, M.A.; Aparecida, B. Antiviral effects of Brazilian green and red propolis extracts on Enterovirus surrogates. Environmental Science and Pollution Research. 2020, 27, 28510–28517. [Google Scholar] [CrossRef] [PubMed]
- Rodrigues, D.M.; Portapilla, G.B.; Silva, G.M.; Duarte, A.; Rotta, C.G.; Henrique, C.; Albuquerque, S.; Bastos, J.K.; Campo, V.L. Synthesis, antitumor activity and in silico analyses of amino acid derivatives of artepillin C, drupanin and baccharin from green propolis. Bioorg Med Chem. 2021, 47, 116372. [Google Scholar] [CrossRef] [PubMed]
- Tomasi, I.T.; Santos, S.C.R.; Boaventura, R.A.R.; Botelho, C.M.S. S. Optimization of microwave-assisted extraction of phenolic compounds from chestnut processing waste using response surface methodology. J Clean Prod. 2023, 395, 136452. [Google Scholar] [CrossRef]
- Shen, L.; Pang, S.; Zhong, M.; Sun, Y.; Qayum, A.; Liu, Y.; Rashid, A.; Xu, B.; Liang, Q.; Ma, H.; Ren, X. A comprehensive review of ultrasonic assisted extraction (UAE) for bioactive components: Principles, advantages, equipment, and combined technologies. Ultrason Sonochem. 2023, 101, 106646. [Google Scholar] [CrossRef] [PubMed]
- Espada-Bellido, E.; Ferreiro-González, M.; Carrera, C.; <monospace> </monospace>Palma, M.; Álvarez, J.A.; Barbero, G.F.; Ayuso, J. Extraction of Antioxidants from Blackberry (Rubus ulmifolius L.): Comparison between ultrasound- And microwave-assisted extraction techniques. Agronomy. 2019, 9, 745. [Google Scholar] [CrossRef]
- Linares, G.; Rojas, M.L. Ultrasound-Assisted Extraction of Natural Pigments From Food Processing By-Products: A Review. Front. Nutr. 2022, 9, 891462. [Google Scholar] [CrossRef] [PubMed]
- Teixeira, B.V.; Vidigal, M.C.T.R.; Stringheta, P.C. Optimization of ultrasound-assisted extraction of anthocyanins from purple tomatoes. Cienc Rur. 2024, 54, e20220604. [Google Scholar] [CrossRef]
- Zhou, T.; Xu, D.-P.; Lin, S.-J.; Li, Y.; Zheng, J.; Zhou, Y.; Zhang, J.-J.; Li, H.-B. Ultrasound-Assisted Extraction and Identification of Natural Antioxidants from the Fruit of Melastoma sanguineum Sims. Molecules 2017, 22, 306. [Google Scholar] [CrossRef] [PubMed]
- Sai-Ut, S.; Kingwascharapong, P.; Mazumder, A.R.; Rawdkuen, S. . Optimization of extraction of phenolic compounds and antioxidants from passion fruit and rambutan seeds using response surface methodology. J. Agric and Food Res. 2023, 14, 100888. [Google Scholar] [CrossRef]
- Aliaño-González, M.J.; Barea-Sepúlveda, M.; Espada-Bellido, E.; Ferreiro-González, M.; López-Castillo, J.G.; Palma, M.; Barbero, G.F.; Carrera, C. Ultrasound-Assisted Extraction of Total Phenolic Compounds and Antioxidant Activity in Mushrooms. Agronomy. 2022, 12, 1812. [Google Scholar] [CrossRef]
- Gunalan, S.; Thangaiah, A.; Rathnasamy, V.K.; <monospace> </monospace>Janaki, J.G.; Thiyagarajan, A.; Kuppusamy, S.; Arunachalam, L. Microwave-assisted extraction of biomolecules from moringa (Moringa oleifera Lam.) leaves var. PKM 1: An optimization study by response surface methodology (RSM). Kuwait Journal of Science. 2023, 50, 339–344. [Google Scholar] [CrossRef]
- Setyaningsih, W.; Saputro, I.E.; Carrera, C.A.; Palma, M.; Barroso, C.G. Multiresponse optimization of a UPLC method for the simultaneous determination of tryptophan and 15 tryptophan-derived compounds using a Box-Behnken design with a desirability function. Food Chem. 2017, 225, 1–9. [Google Scholar] [CrossRef] [PubMed]
- Polo-Castellano, C.; Álvarez, J.; Palma, M.; Barbero, G.F.; Ayuso, J.; Ferreiro-González, M. Optimization through a Box–Behnken Experimental Design of the Microwave-Assisted Extraction of the Psychoactive Compounds in Hallucinogenic Fungi (Psylocibe cubensis). Journal of Fungi. 2022, 8, 598. [Google Scholar] [CrossRef] [PubMed]
- Salgueiro, F.B.; Castro, R.N. ; Comparação entre a composição química e capacidade antioxidante de diferentes extratos de própolis verde. Quim Nova. 2016, 39, 1192–1199. [Google Scholar] [CrossRef]
Figure 1.
Phenolic compounds identified in Brazilian green propolis extract by analyses of UPLC-DAD.
Figure 1.
Phenolic compounds identified in Brazilian green propolis extract by analyses of UPLC-DAD.
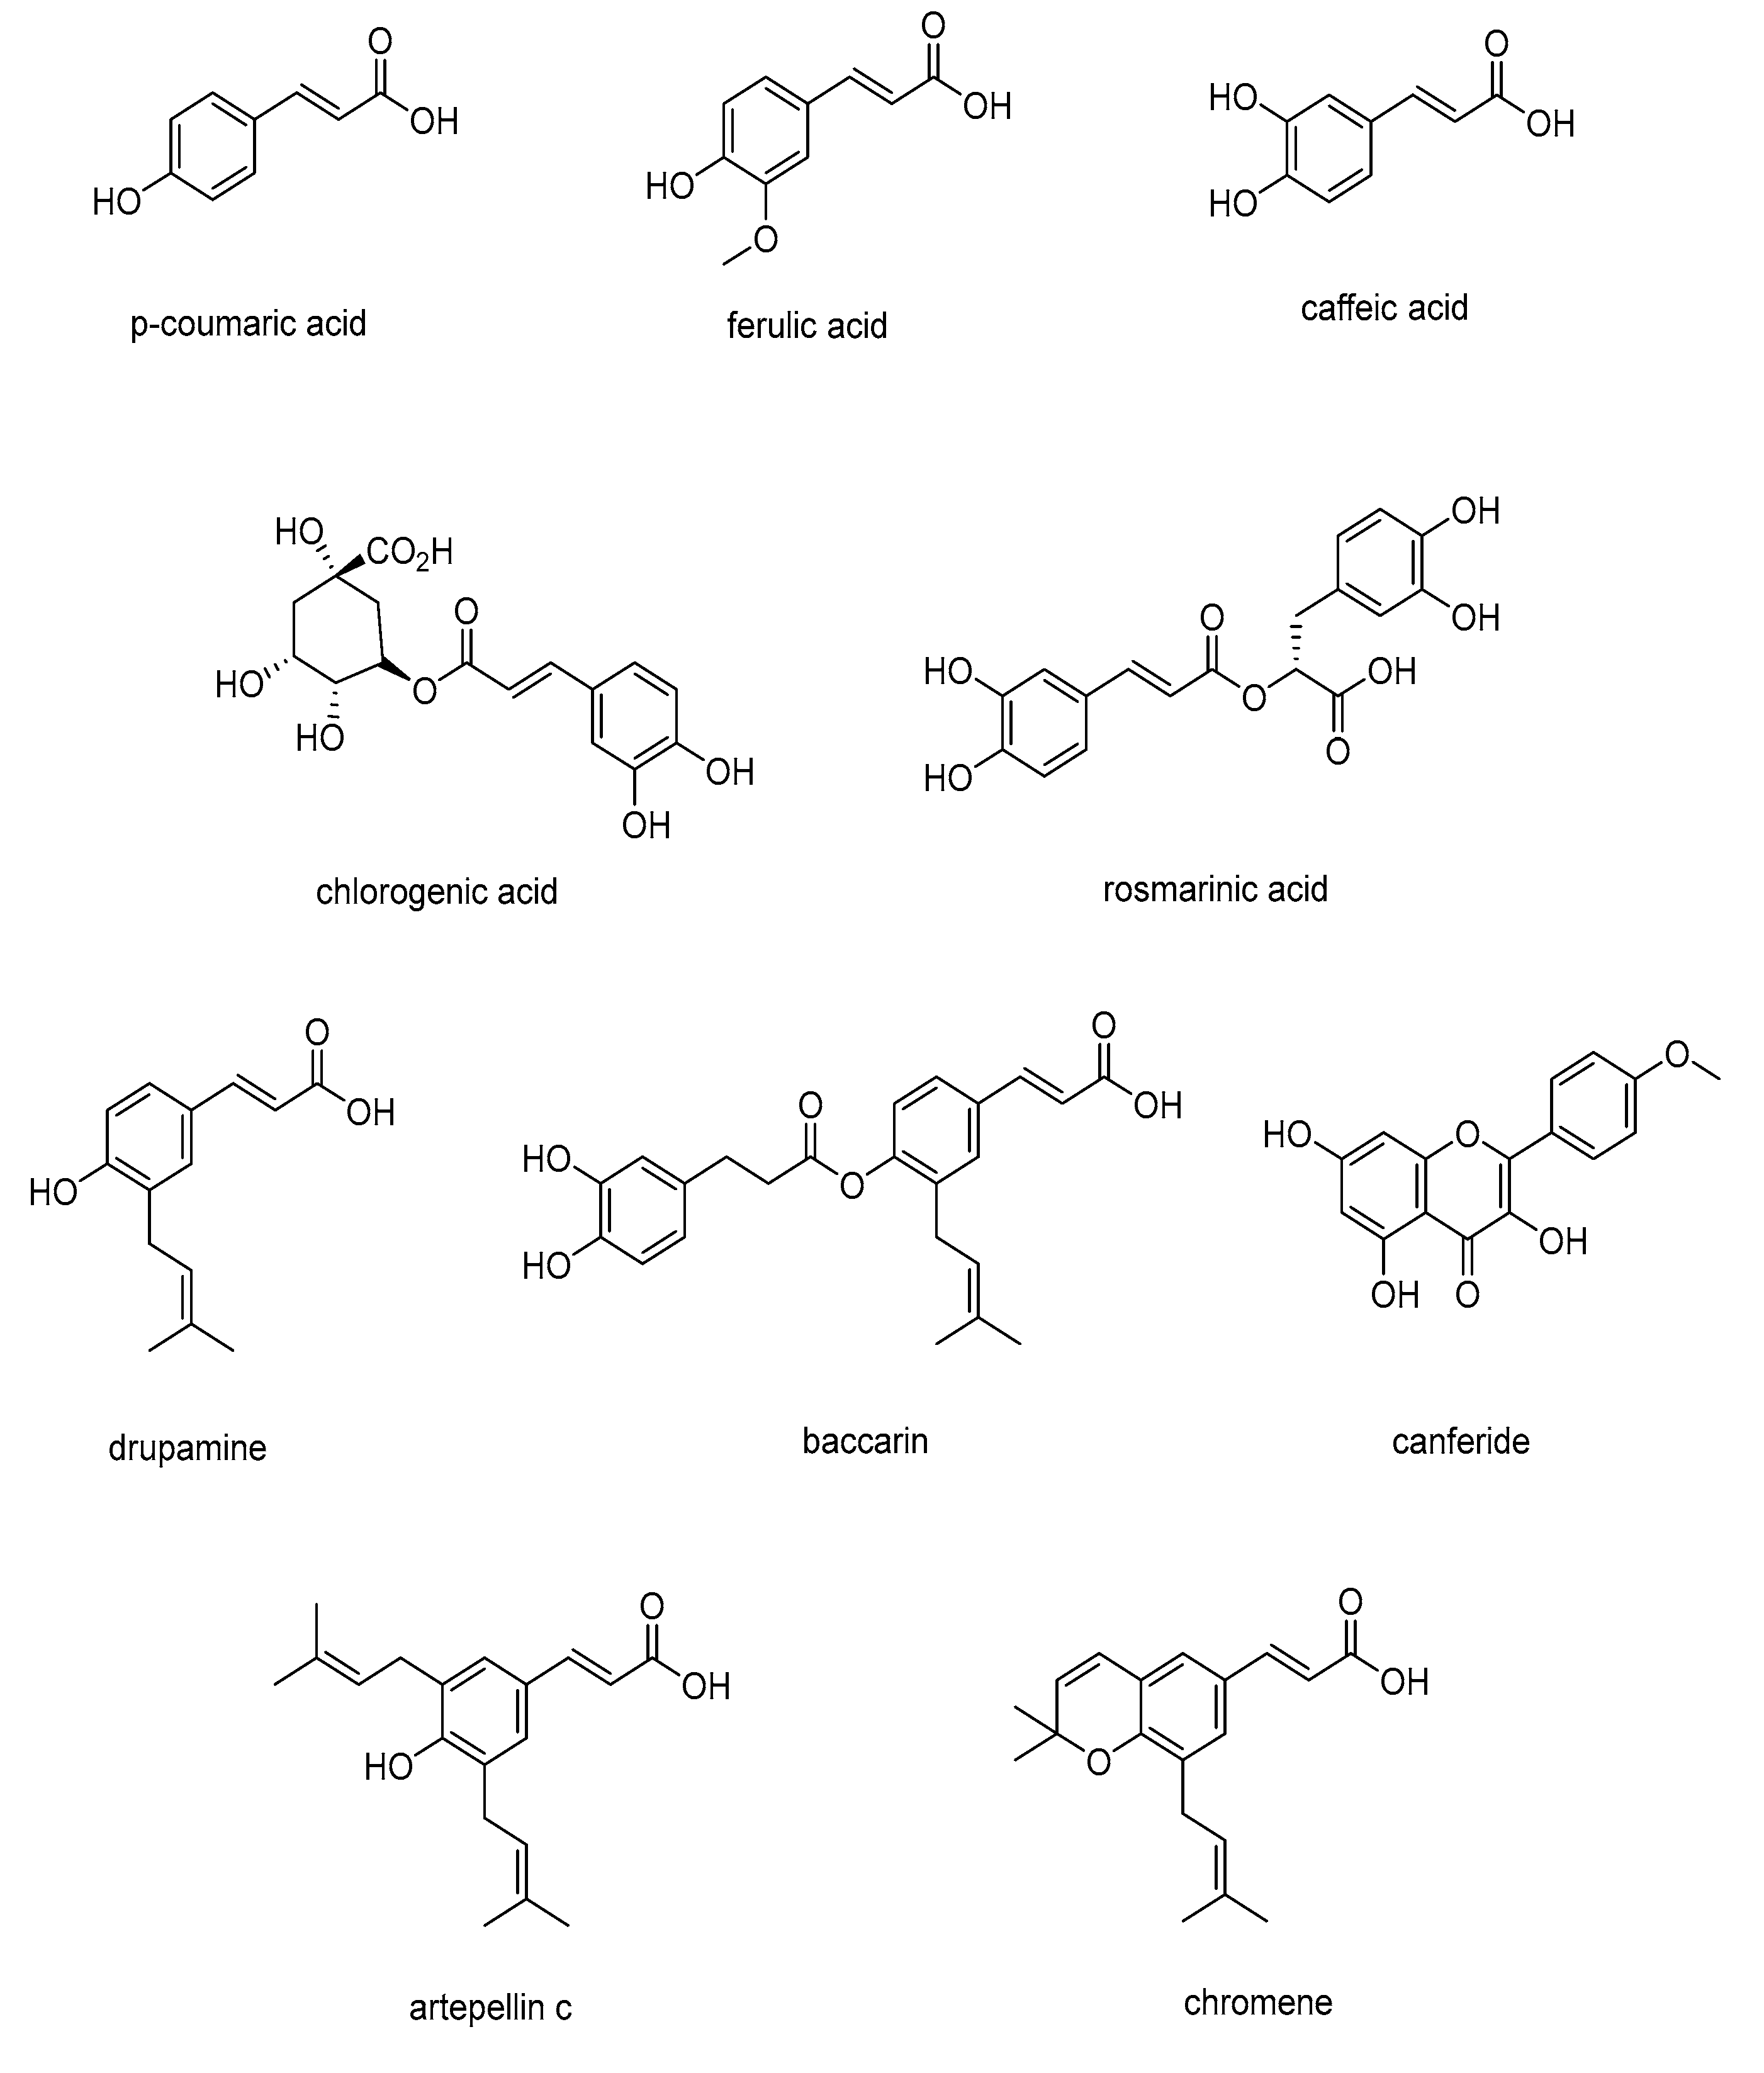
Figure 2.
Pareto chart of the standardized effects on the amount of phenolic compounds of green propolis extracted by UAE. A: % Solvent in water; B: Extraction temperature; C: Cycle; D: Amplitude: (I) EtOHSP, (II) EtOHCP and (III) MeOHTP.
Figure 2.
Pareto chart of the standardized effects on the amount of phenolic compounds of green propolis extracted by UAE. A: % Solvent in water; B: Extraction temperature; C: Cycle; D: Amplitude: (I) EtOHSP, (II) EtOHCP and (III) MeOHTP.
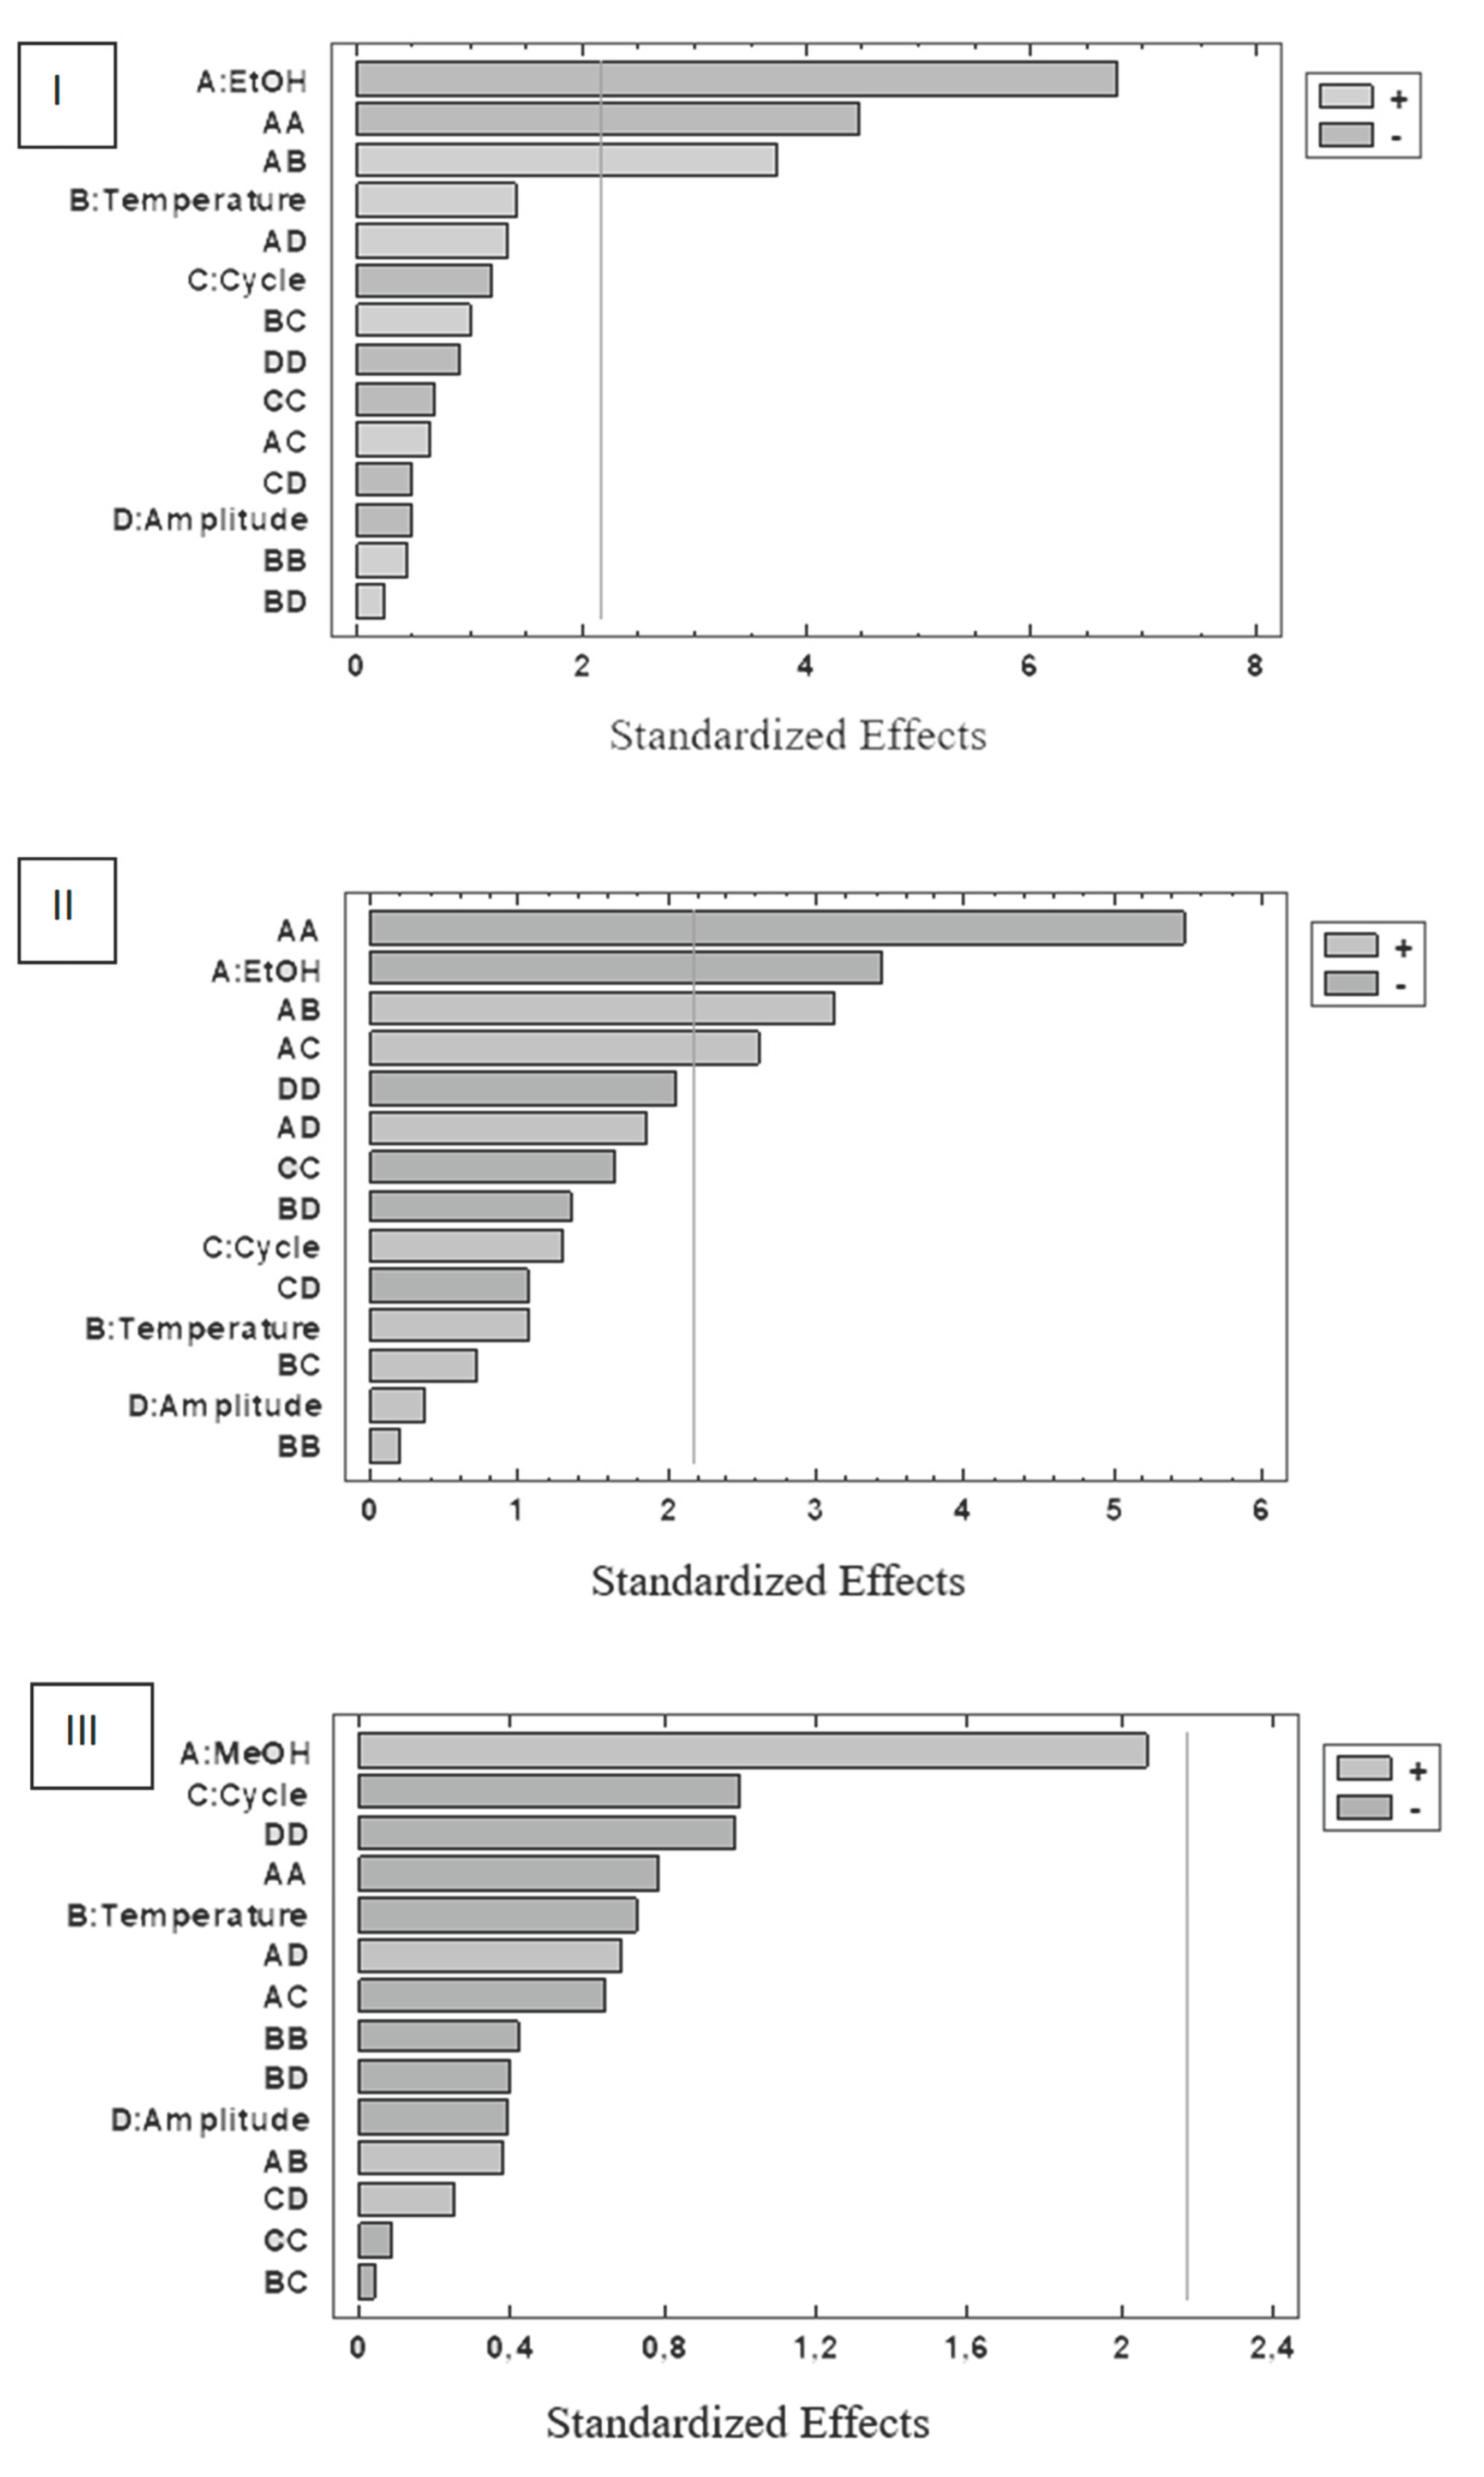

Table 1.
Range of values for each independent variable used for the Box–Behnken experimental design for the extraction of total phenolic compounds by UAE.
Table 1.
Range of values for each independent variable used for the Box–Behnken experimental design for the extraction of total phenolic compounds by UAE.
| Factor | –1 | 0 | +1 | Units |
|---|---|---|---|---|
| A: % Ethanol or Methanol/water | 50 | 75 | 100 | % |
| B: Temperature | 20 | 40 | 60 | °C |
| C: Cycle (s-1) | 0.2 | 0.6 | 1.0 | s–1 |
| D: Amplitude (W) | 20 | 40 | 60 | % |
% = percentage; °C = Celsius degree; s-1 = seconds.
Table 2.
Box–Behnken experimental design for total phenolic (mg TP/g of extract) compounds extracted by UAE. Experimental results are included.
Table 2.
Box–Behnken experimental design for total phenolic (mg TP/g of extract) compounds extracted by UAE. Experimental results are included.
| Experiment | A | B | C | D | MeOHTP | EtOHSP | EtOHCP |
|---|---|---|---|---|---|---|---|
| 1 | 0 | –1 | 1 | 0 | 21.65256 | 4.99174 | 16.19095 |
| 2 | 0 | 1 | 0 | –1 | 22.25092 | 5.440138 | 16.22195 |
| 3 | –1 | –1 | 0 | 0 | 21.56264 | 5.861097 | 15.79017 |
| 4 | 1 | 0 | 0 | 1 | 22.31309 | 3.881741 | 14.91879 |
| 5 | 0 | –1 | 0 | –1 | 22.38833 | 5.845995 | 15.56567 |
| 6 | 0 | 1 | 1 | 0 | 22.23826 | 5.836797 | 16.79641 |
| 7 | 0 | 0 | 1 | 1 | 22.26396 | 5.135097 | 15.58027 |
| 8 | 1 | 1 | 0 | 0 | 21.33221 | 5.996648 | 16.73835 |
| 9 | –1 | 0 | 0 | –1 | 21.11001 | 5.935628 | 15.88911 |
| 10 | –1 | 0 | –1 | 0 | 22.5913 | 6.198647 | 16.37602 |
| 11 | 1 | 0 | 0 | –1 | 21.12638 | 3.312067 | 13.84599 |
| 12 | 0 | 1 | 0 | 1 | 20.81775 | 5.569797 | 15.87647 |
| 13 | –1 | 1 | 0 | 0 | 18.99526 | 5.182651 | 14.97337 |
| 14 | 0 | –1 | –1 | 0 | 21.78631 | 5.823319 | 16.39789 |
| 15 | 0 | 0 | –1 | 1 | 19.81227 | 5.630787 | 15.86387 |
| 16 | 1 | 0 | –1 | 0 | 26.70935 | 3.555662 | 12.44473 |
| 17 | –1 | 0 | 0 | 1 | 20.02797 | 5.309568 | 14.83106 |
| 18 | 1 | –1 | 0 | 0 | 22.65981 | 3.332588 | 13.95362 |
| 19 | 0 | 1 | –1 | 0 | 22.50694 | 5.773196 | 16.18294 |
| 20 | 1 | 0 | 1 | 0 | 20.96014 | 3.580424 | 14.71031 |
| 21 | 0 | 0 | 1 | –1 | 22.24492 | 5.721426 | 16.26117 |
| 22 | 0 | –1 | 0 | 1 | 22.25771 | 5.756403 | 16.76834 |
| 23 | 0 | 0 | –1 | –1 | 20.61805 | 5.775466 | 15.31551 |
| 24 | –1 | 0 | 1 | 0 | 18.96475 | 5.639947 | 15.62428 |
| 25 | 0 | 0 | 0 | 0 | 22.39149 | 5.695128 | 16.56336 |
| 26 | 0 | 0 | 0 | 0 | 22.37404 | 5.913284 | 16.68065 |
| 27 | 0 | 0 | 0 | 0 | 22.56536 | 5.665397 | 16.76263 |
MeOHTP: higher composition of phenolics with methanol; EtOHSP: higher composition of simple phenolics with ethanol; EtOHCP: higher composition of complex phenolics with ethanol.
Table 3.
Optimal conditions to extract phenolic compounds.
| Samples | Solvent (%) | Temperature (°C) | Amplitude (W) | Cycle (s–1) |
|---|---|---|---|---|
| EtOHSP | 50 | 20 | 20 | 0.6 |
| EtOHCP | 80 | 60 | 43 | 0.8 |
| MeOHTP | 100 | 37 | 38 | 0.2 |
MeOHTP: higher composition of phenolics with methanol; EtOHSP: higher composition of simple phenolics with ethanol; EtOHCP: higher composition of complex phenolics with ethanol.
Table 4.
Quantification of phenolic compounds in propolis extracts.
| Compound | EtOHSP (mg/g) | EtOHCP (mg/g) | MeOHTP (mg/g) |
|---|---|---|---|
| Chlorogenic acid | 1.24 | 0.91 | 3.31 |
| Coumaric acid | 0.88 | 0.62 | 2.45 |
| Caffeic acid | 1.12 | 0.76 | 3.01 |
| Ferulic acid | 0.79 | 0.55 | 2.65 |
| Artepellin C | 3.18 | 4.52 | 1.01 |
Disclaimer/Publisher’s Note: The statements, opinions and data contained in all publications are solely those of the individual author(s) and contributor(s) and not of MDPI and/or the editor(s). MDPI and/or the editor(s) disclaim responsibility for any injury to people or property resulting from any ideas, methods, instructions or products referred to in the content. |
© 2025 by the authors. Licensee MDPI, Basel, Switzerland. This article is an open access article distributed under the terms and conditions of the Creative Commons Attribution (CC BY) license (http://creativecommons.org/licenses/by/4.0/).
Copyright: This open access article is published under a Creative Commons CC BY 4.0 license, which permit the free download, distribution, and reuse, provided that the author and preprint are cited in any reuse.


