Submitted:
12 July 2025
Posted:
15 July 2025
You are already at the latest version
Abstract
Surface defects such as scratches and impacts on high-speed train axles are often conservatively treated in fatigue design and maintenance standards. This study investigates the fatigue behavior of full-scale axles with circumferential V-shaped notches introduced to simulate such surface damage. Three rounds of fatigue testing were conducted up to 2 × 10⁷ cycles, with notch depths ranging from 0.538 mm to 1.760 mm and corresponding stress concentration factors (SCFs) up to 5.49. Despite the sharp geometries and elevated local stresses (up to 1082.8 MPa), no fatigue cracks were observed at any of the notched sites. Statistical analyses of in-service defects further revealed that real scratches and impacts typically exhibit lower depths and curvatures than the prefabricated notches. These findings highlight the exceptional fatigue resistance of the axle material and suggest that current overhaul limits for allowable surface defect depths may be overly conservative. The results provide an experimental foundation for refining defect tolerance criteria and support future adoption of geometry- and curvature-based inspection strategies.
Keywords:
high-speed train axles
; prefabricated surface notches
; circumferential V-shaped notches
; fatigue characteristics
; stress concentration factor (SCF)
; fatigue testing
1. Introduction
High-speed train axles play a critical role in ensuring the safety and reliability of modern rail transportation systems [1,2,3,4,5,6], as they are subjected to complex cyclic loading conditions that include bending, torsion [7], and dynamic impacts during operation. The fatigue performance of these axles, particularly when featuring prefabricated surface notches [8,9,10,11,12,13] that simulate real-world defects such as fretting damage [14,15,16,17] or impact-induced flaws [18,19,20], has become a focal point of research due to the increasing demands of higher operational speeds and heavier loads. Specimen surface or surface notches are known to act as primary initiation sites for fatigue cracks [21,22,23], potentially leading to catastrophic failures if not properly understood and managed. Despite the importance of this issue, existing industry standards such as EN 13261 [24] provide limited guidance on the specific relationship between notch geometry (e.g., depth, tip radius, angle) and the fatigue life of full-scale axles, while maintenance specifications often adopt conservative limits for allowable damage (e.g., maximum impact depth of 0.3 mm) that may not fully reflect the actual fatigue resistance of axle materials [8,9,10,11,12,13,25].
Numerous studies [8,9,10,11,12,13,26,27,28,29,30,31,32,33,34,35,36] have investigated the fatigue behavior of notched components, but most have focused on small-scale specimens or simplified notch configurations, failing to fully capture the complex three-dimensional stress states and boundary conditions present in full-size train axles. For instance, research on the fatigue properties of axle materials like S38C steel has typically relied on standard test specimens under rotating bending, overlooking the influence of wheel-seat interactions and dynamic loading scenarios that characterize real-world axle operation [11,37,38,39,40]. Additionally, circumferential V-shaped notches, which more accurately mimic the sharp defects caused by fretting or impact in service, have received limited attention in prior studies, with most investigations focusing on U-shaped or other notch geometries. This gap in knowledge is further compounded by the lack of specific fatigue limit testing protocols for full-scale axles in standards such as JIS E4501, leading to uncertainties in engineering assessments of axle integrity and service life [41].
The relationship between very high cycle fatigue (VHCF [42,43,44,45,46,47,48,49,50,51,52,53,54,55,56,57,58,59]) and railway axles is critical for ensuring long-term reliability, as axles endure billions of cyclic loads during service, often exceeding 107 cycles in the VHCF regime. In this context, VHCF failures typically stem from internal defects like non-metallic inclusions or micro-voids within the axle material, which act as stress concentrators and trigger crack initiation beneath the surface. Characteristic „fish-eye” fracture patterns emerge, with inclusions at the core surrounded by a granular bright facet zone, highlighting the role of microstructural inhomogeneities in crack propagation. Key influencing factors include material purity, inclusion size/distribution, and surface treatments—such as shot peening or induction hardening—that mitigate stress concentrations and suppress crack growth. Understanding this VHCF-axle relationship is essential for refining design standards (e.g., EN 13261) and inspection protocols to prevent unexpected failures and enhance the service life of railway components. Additive manufacturing [60,61,62,63,64,65,66] enables the fabrication of railway axles with optimized microstructures and tailored notch reinforcements, enhancing fatigue resistance and enabling complex geometries unattainable via traditional methods.
The primary objective of this study is to address a critical question in railway axle fatigue assessment: Can surface defects with geometries more severe than current maintenance thresholds truly initiate fatigue failure in full-scale axles under service-representative loading? To this end, a series of controlled fatigue tests were performed on actual high-speed train axles with prefabricated circumferential V-shaped notches that exceed existing defect limits in both depth and curvature.
In parallel, statistical characterization of in-service surface defects—including scratches and impacts—was conducted based on replica measurements from 44 retired axles. This dual approach enables a direct comparison between real-world damage features and their conservative laboratory representations. Fatigue tests, conducted up to 2 × 10⁷ cycles at nominal bending stress levels of 240 MPa, revealed that even deep, sharp notches (up to 1.76 mm depth and SCF >5.0) did not result in crack initiation.
These results challenge the conventional assumption that local stress concentration alone governs fatigue strength and demonstrate that axle materials possess far greater damage tolerance than currently assumed in maintenance standards. By bridging the gap between empirical fatigue testing and field-observed defect statistics, this work provides an experimental basis for re-evaluating existing defect acceptance criteria. The findings support a shift toward more evidence-based, geometry-aware inspection and life prediction strategies for high-speed train axles.
2. Materials and Methods
In this research, scratch defects and impact damage defects were approximately modeled as circumferential V-shaped notches encircling the axle body, respectively. To intensify stress concentration, the notch depth and sharpness were increased, and the distance between the notch and the wheel seat was reduced. These modifications were introduced to further investigate, through fatigue testing, the fatigue performance of actual high-speed train axles with various prefabricated surface notches.
Each axle was subjected to both replica powder molding and acetate (AC) film replication. For multiple powder replicas on the same axle, defects were labeled sequentially using the format „Axle ID–Defect No.,” such as H11-4211-1 and H11-4211-2. Similarly, multiple AC film replicas from the same axle were labeled using the format „AC Axle ID–Defect No.,” such as AC H11-4211-1 and AC H11-4211-2. In total, 44 retired axles exhibiting scratch and/or impact damage were inspected in this study.
2.1. Replication Methods
Two replication methods were employed: replication using powder (polymethyl methacrylate, PMMA) and replication using AC films. For the dimensional measurement of axle defects, the procedure involved first creating a replica using PMMA powder, followed by measurement on the replicated sample. Prior to replicating actual defects on decommissioned axles, the accuracy of PMMA powder replication was evaluated using artificial defect specimens as shown in Figure 1. The results showed that the dimensional ratios between the original defects and their replicas were as follows: width ratio of 1.03, depth ratio of 1.02, and radius of curvature ratio of 1.02. The deviation between the replicated features and the original defects was within approximately 3%. In Figure 1a, the upper part shows the original defect specimen, while the lower part presents the replicated morphology.
Based on the characteristics of the PMMA powder and AC film replication processes, and considering the large number of axles involved, an effective operating procedure was developed and refined. A total of 69 powder replications and 74 AC film replications were performed on 44 decommissioned damaged axles. Contour line measurements were conducted on the powder replicas, while selected AC film replicas were examined and documented using optical microscopy.
2.2. Replica Measurements
The AC film was mounted onto a metal plate and placed under an optical microscope, as shown in Figure 2a, for observation. Image-Pro Plus 5.0 software was used to assign scale bars and label the captured images. Each AC film specimen was examined to analyze the two-dimensional morphology of the axle defects.
The PMMA powder replicas were placed under a profilometer, as shown in Figure 2b, for defect scanning and measurement. The procedure for contour line measurement of the defects was as follows: First, the replica sample was fixed on the specimen stage, with the orientation adjusted such that the defect direction on the replica was perpendicular to the scanning direction of the profilometer probe. A leveling tool was used to ensure the sample surface remained horizontal. The profilometer probe was then lowered until it contacted the surface of the replica. After that, scans were performed at the center and both sides of the defect area.
2.3. Fatigue Tests and Prefabrication of V-Shaped Surface Notches
The axle fatigue tests were conducted on the wheel-axle test bench as shown in Figure 3a. The tests were carried out at a loading frequency of 19.8 Hz, with a stress ratio of R = -1, and the total number of loading cycles was set to no less than 2 × 10⁷ cycles. After each 10⁷-cycle interval, magnetic particle inspection was performed to examine whether cracks had initiated at the artificially introduced notch on the axle body. Since the JIS E4501-1995 standard does not specify the fatigue limit or testing method for actual axles, the maximum load in the present fatigue experiments was determined according to the EN 13261 standard, setting the maximum applied stress at 240 MPa.
Based on the observed data of impact and fretting damage on axle surfaces, as well as the fatigue test results which investigated actual axles with circumferential V-shaped notches and the fatigue strength tests of notched three-point bending specimens directly extracted from the axle surface material, two actual axles were selected for testing (Axle Nos.: H31-6201 and H82-6217). The following circumferential V-shaped notches were designed and introduced on these axles: distance from the notch to the wheel seat 130 mm, notch angle α = 90°, notch depth t = 0.6 mm, notch tip radius of curvature ρ = 0.4 mm, stress concentration factor kt0 = 2.49. Based on the measured stress at the patch locations on cross-sections of the axles, and elastic beam theory, the maximum nominal bending stress at the V-shaped notch is calculated to be 220.2 MPa. The machined notch produced by lathe processing is shown in Figure 3b–c.
The replica technique using PMMA powder was employed to replicate the morphology of the V-shaped notch, and the optical microscope was used to measure the profile of the replica sample, allowing for the determination of the actual geometric dimensions of the prefabricated notch.
The geometric parameters of the V-shaped notch are illustrated in Figure 4, and the notch angle α and dimension x were calculated using Eqs. (1) and (2).
The radius of curvature at the notch tip ρ was determined by performing a quadratic curve fitting using several measurement points selected from the tip region of the V-shaped notch. The corresponding calculation is based on the following Eq. (3):
3. Results
3.1. Measurement Results of In-Service Surface Defects
All measurement results include on-site photographs of axle defects, optical micro-scope images of AC film replicas, and contour line profiles obtained from profilometer scans of the PMMA powder replicas. As an example, Figure 5 presents the defect measurement results for Axle H11-4211. The contour line image shown corresponds to the highest peak among the three scanned profiles, with the value in parentheses indicating the maximum peak height of the selected contour.
3.2. Data Analysis of In-Service Surface Defects
Through replication and measurement of the damaged axles, an overall understanding of the severity, types, and locations of defects can be obtained. These data provide a basis for the design of artificial defects in subsequent full-scale axle tests and small specimen experiments. In addition, they serve as critical input for damage tolerance analysis and safety assessment of railway axles.
The data reveal that trailer axles exhibited only impact damage, whereas motor axles showed evidence of both scratch damage and, in some cases, impact damage. Among the 44 axles examined, a total of 43 scratch marks and 23 impact sites were identified. Several axles contained two scratch marks; except for Axle H28-2213, where the two scratches were located on different circumferential positions, all other dual-scratch cases were measured at two points along the same circumferential scratch. For statistical analysis, the dimensions of the two scratches on the same circumference were selected, resulting in 25 scratch data points. Additionally, Axles H34-4107, H13-2417, and H27-2110 each exhibited two distinct impact sites. All scratch defects were located within a range of 71.5 cm to 118.5 cm from the axle end, with the majority (22 out of 25) distributed relatively uniformly between 80 cm and 101 cm. Impact defects were all found within a range of 70 cm to 116 cm from the axle end. Given the relatively uniform distribution of scratch defects and the higher randomness of impact damage, the distribution of impact defect frequency versus distance from the axle end is shown in Figure 6a, while the cumulative probability of impact defect distance is presented in Figure 6b. As illustrated in the figures, approximately 80% of the impact damage defects occurred between 98 cm and 116 cm from the axle end. Figure 7 shows schematic diagrams of the distribution of scratch and impact damage defects, respectively. In Figure 7b, the red-shaded area indicates the region with a higher probability of impact occurrence, which accounts for 80% of the observed impact damage defects.
3.3. Prefabricated V-Shaped Notches
3.3.1. First-Round Fatigue with Initial V-Shaped Notches
Figure 8 presents the measurement results for Axle H31-6201 with prefabricated notches, including replica profile photographs of the notches (Figure 8a), measured geometric dimensions of the notches and quadratic curve fitting used to evaluate the notch tip curvature (Figure 8b).
Since all the two axles had previously undergone a baseline wheel seat fatigue test at 94 MPa for 10⁷ cycles, the current tests were conducted in a stepwise manner. For Axle H82-6217, a 136 MPa shaft fatigue test was first carried out. Upon confirming the absence of abnormalities, a 240 MPa fatigue test was subsequently performed. Based on the results and experience gained from the first axles, Axle H31-6201 was subjected directly to the 240 MPa fatigue test.
3.3.2. Second-Round Fatigue Test with Moderately Deepened Notches
Based on the results of the first round of testing, one of the axles, Axle H82-6217, was selected for further modification. Specifically, the original V-shaped notch was deepened at eight circumferentially symmetric positions using a riffler file, aiming for a maximum notch depth of approximately 1.0 mm. The maximum nominal bending stress at the notch location was determined to be 220.2 MPa.
The replica technique was employed to reproduce the actual morphology of the notches at eight locations around the circumference. The profiles of the replica samples were then examined using an optical microscope, enabling the measurement of the actual geometric dimensions of the artificially prefabricated notches. The notch opening angle α was calculated using Eq. (1), while the notch tip radius of curvature was determined by selecting several measurement points near the notch tip, applying quadratic curve fitting, and using Eq. (3).
Figure 9 presents the results of one of the eight notches on Axle H82-6217, including: side-view images of the replica profiles captured via optical microscopy, cross-sectional images at the deepest point of each notch, measured notch depths, and quadratic curve fitting results of the deepest cross-sections. The depth values are obtained from the height measurements of the replica profile side views, calibrated accordingly.
The notch opening angles, notch tip radii of curvature, and stress concentration factors at the deepest points of the eight V-shaped notch locations were obtained through measurements of the replica sample profiles. For the notch shown in Figure 9, the notch opening angle is 77.2°. The notch depth comes to 1.053 mm, and the notch root radius of curvature is 0.393 mm. Then the stress concentration factor can be calculated as 4.19.
After 1.02 × 10⁷ fatigue loading cycles, Axle H82-6217 experienced wheel hub disengagement, leading to the termination of the experiment. Magnetic particle inspection revealed that no cracks were observed in any of the eight artificially notched arc segments.
3.3.3. Third-Round Fatigue Test with Largely Deepened Notches
The existing eight notches on Axle H31-6201 were further deepened using a riffler file, with a target maximum notch depth of 1.5 mm. The maximum nominal bending stress at the notch location was calculated to be 238.5 MPa.
Figure 10 presents the analysis results for one of the eight notches on Axle H31-6201. Following the same ways as above, the depth values for all eight notch locations (based on the 10 mm arc segments centered at the deepest points) were derived from the height measurements of the side-view replica profiles, calibrated accordingly. For the notch shown in Figure 6, the notch opening angle is 59.5°. The notch depth measures 1.760 mm, and the notch root radius of curvature is obtained as 0.310 mm. The stress concentration factor is therefore 5.49 as calculated.
After 1.96 × 10⁶ fatigue loading cycles, Axle H31-6201 experienced axle disengagement. Magnetic particle inspection confirmed that no cracks were observed in any of the eight artificially notched arc segments.
4. Discussion
4.1. Statistical Analysis of Axle Surface Defects
4.1.1. Scratch Defects
Based on the profilometer measurements of the PMMA powder replicas, the depth and width of the defects were obtained, allowing for the calculation of the width-to-depth ratio of each damage feature. It should be noted that most of the axle defects had been partially repaired prior to replication; therefore, the measured profiles represent the post-grinding morphology of the defects.
Since the radius of curvature at the damage tip has a significant influence on defect criticality, measurements of the tip curvature radius were conducted. It was observed that the point of maximum depth on the contour profile does not necessarily correspond to the location with the minimum curvature radius. In some cases, defects that are not the deepest may still represent the most critical locations. Therefore, multiple relatively deep defects on each replica were selected for curvature radius measurement. For each selected defect, nine points were extracted along the measured contour profile, and a second-order polynomial fitting was performed to calculate the radius of curvature at the valley. In cases where small sharp notches appeared within the valley of the contour line, both the local tip curvature radius and the overall equivalent curvature radius were measured.
In the statistical analysis of curvature at the valley regions, the tip curvature was used as the primary evaluation metric, as a smaller radius of curvature typically indicates a higher risk of crack initiation. When the range of curvature radii is large, large bin intervals are needed for probability density analysis. This causes data points with small radii—those of greatest concern—to become overly concentrated in the initial bins. In the probability density analysis, curvature was used as the horizontal axis. This approach spreads out the high-risk data over a wider range of intervals, making it easier to visualize and interpret the distribution of potentially critical defect sites.
Based on the statistical analysis of axle damage, it was observed that not every axle exhibited only a single defect; some axles contained multiple scratch defects, while others had multiple impact defects. Therefore, each defect was treated as an independent data point during analysis—separated from the specific axle it originated from. This approach enables a clearer understanding of the distribution characteristics associated with different levels or types of damage. Since scratch and impact defects represent two distinct damage mechanisms, they were analyzed separately in both the statistical evaluation and the distribution analysis.
The statistical analysis of scratch defect distribution, as presented in Figure 11, reveals key morphological characteristics that are critical for assessing damage severity and fatigue risk in retired railway axles. The results indicate that most scratches exhibit shallow depths (predominantly 40–100 μm) and relatively large widths (<3000 μm), resulting in low depth-to-width ratios for most cases (typically below 0.10). This suggests that most scratch defects originate from surface-level interactions such as fretting, abrasion, or minor contact, with limited penetration into the material substrate.
However, a small number of scratches display significantly higher depth-to-width ratios and sharper tip curvatures. These outliers, although less frequent, represent critical stress concentration sites. Tip curvature plays a crucial role in the initiation of fatigue cracks. The curvature distribution (Figure 11g–h) shows that while most scratches are relatively blunt (curvature <0.009 μm⁻¹), a few exhibits sharper profiles (up to 0.027 μm⁻¹), indicating a substantially higher potential for crack nucleation.
From a damage tolerance perspective, the presence of such high-curvature, high-depth-ratio defects justifies their classification as high-risk zones. These defects are more likely to act as initiators under cyclic loading, particularly in VHCF regimes where microstructural barriers become increasingly important. Therefore, even if these defects are fewer in number, their contribution to overall fatigue behavior may be disproportionately large.
4.1.1. Impact Damage Defects
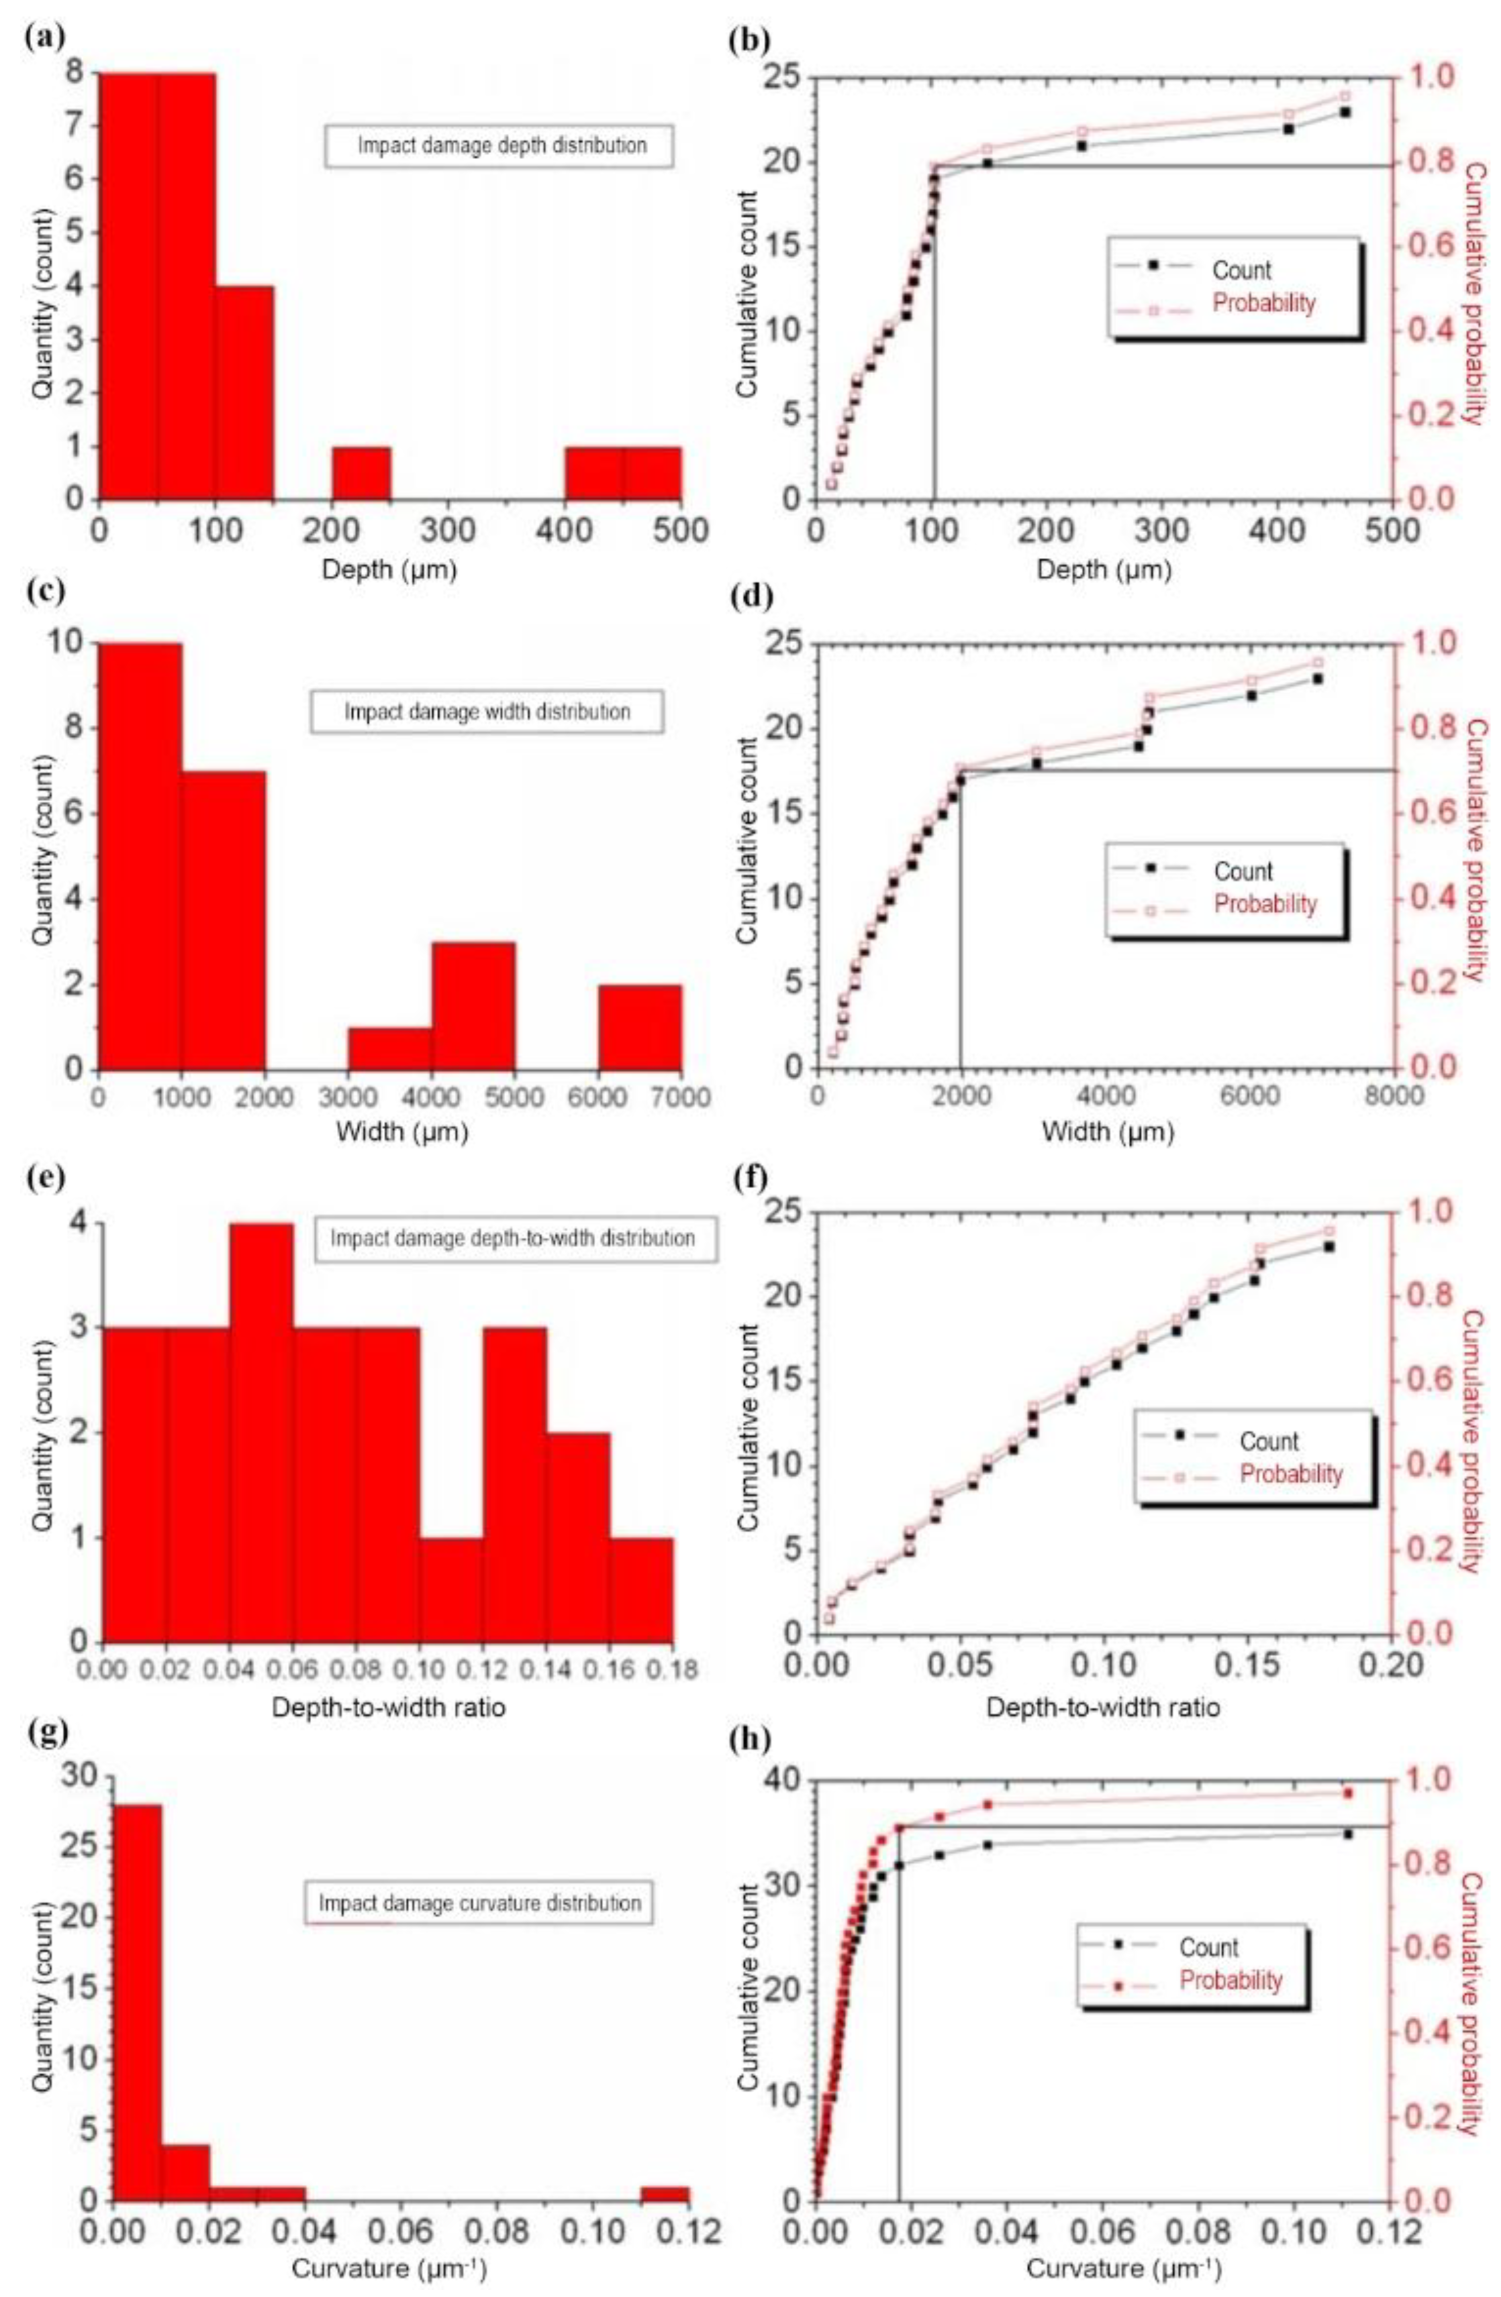
Figure 12 presents the distribution and cumulative probability (by quantity) of various geometric parameters for impact damage defects. The depth distribution of impact damage reveals that most defects are relatively shallow: over 80% exhibit depths below 100 μm (Figure 12a–b). This suggests that typical impact events—such as ballast strikes or operational collisions—tend to cause surface indentation without significant subsurface penetration. In contrast to scratches, the width distribution is broader, with several defects extending up to 7000 μm as shown in Figure 12c–d), indicating that impact forces are often distributed over a wider area.
The depth-to-width ratio exhibits a relatively uniform spread across the range of 0.02 to 0.16 (Figure 12e–f), with no pronounced central tendency. This variability reflects the inherently random nature of impact events and implies that some shallow but narrow defects, as well as moderately deep and wide ones, may pose structural concerns depending on local stress conditions.
Tip curvature, a critical geometric parameter influencing local stress concentration, shows a highly skewed distribution (Figure 12g–h). While most impact defects have blunt curvature profiles (<0.02 μm⁻¹), a small number of defects exceed 0.05 μm⁻¹, with outliers reaching up to 0.12 μm⁻¹. These sharp-tipped impact sites are of particular interest in fatigue analysis, as they may serve as preferential crack initiation zones under cyclic loading conditions.
Despite their low frequency, such severe curvature features must not be overlooked, especially in regions subjected to high bending or contact stresses. The presence of these critical defects supports the need for quantitative acceptance criteria in inspection protocols, based not solely on depth or width but also on curvature-based metrics. These findings reinforce the necessity for defect-specific characterization in structural integrity assessments and demonstrate that small but sharply curved impact defects may dominate fatigue crack initiation behavior in railway axles.
From a fatigue perspective, scratch defects represent a more consistent and predictable risk due to their sharper profiles and higher stress concentration potential. Impact damage, on the other hand, is less geometrically severe on average but exhibits greater dispersion and stochasticity, meaning even low-depth impacts may pose critical risks if the curvature is high or if located in stress-intensive regions.
These distinctions underscore the importance of multi-parameter defect evaluation in fatigue life modeling. The findings support the implementation of curvature- and shape-based screening metrics in maintenance inspection, rather than relying solely on depth thresholds. Furthermore, these statistical results provide a realistic basis for defining artificial defect geometries in both small-specimen and full-scale fatigue experiments, ensuring accurate replication of in-service failure mechanisms.
4.2. Influence of V-Shaped Notches on Axle Fatigue Performance
Despite the introduction of sharp, circumferential V-shaped notches with SCFs exceeding 5.0 and maximum local stresses reaching up to 1082.8 MPa, no fatigue cracks were observed in any of the tested axle segments after up to 2 × 10⁷ cycles. This finding directly challenges the conventional assumption that local stress concentration alone governs fatigue crack initiation. In contrast to small-scale specimen behavior, where crack nucleation often initiates at stress concentrators under comparable stress levels, the full-size axles in this study demonstrated remarkable fatigue resistance, suggesting the presence of scale effects, constraint conditions, and possible microstructural toughening mechanisms that mitigate local damage accumulation.
Additionally, the comparison between nominal and local stress levels underscores the non-conservativeness of evaluating notched fatigue strength solely based on the local peak stress. The fatigue strength of S38C small specimens (647 MPa at 1% failure probability) is substantially lower than the estimated local stress in the notched axles, yet the absence of cracking indicates that the fatigue limit of full-scale components is not strictly controlled by local stress maxima. These insights advocate for a shift toward more holistic fatigue assessment methodologies that integrate notch geometry, material microstructure, and component-scale behavior.
From a practical perspective, the results strongly support the possibility of revising existing maintenance standards that currently impose conservative notch depth limits (e.g., 0.3 mm for impact damage). The tested notches, with depths up to 1.76 mm, remained intact under high-cycle loading conditions, suggesting that a curvature- or SCF-based criterion may offer a more rational basis for defect tolerance evaluations in high-speed train axles.
4.3. In-Service Surface Defects vs. Artificially Prefabricated Notches
A critical comparison between in-service surface defects and artificially prefabricated notches is essential for evaluating the representativeness of laboratory fatigue tests and their relevance to real-world axle damage scenarios. This section compares their geometric characteristics, stress concentration potentials, and fatigue implications of both defect types.
The in-service surface defects—including both scratch and impact damage—exhibited relatively shallow depths, typically in the range of 40–100 μm, with only a few exceeding 150 μm. In contrast, the prefabricated circumferential V-shaped notches introduced in this study were intentionally deepened to a maximum of 1.76 mm, representing an order of magnitude greater penetration. Similarly, the radius of curvature at the defect tips differed significantly: while real defects showed curvature values mostly below 0.01 μm⁻¹, the prefabricated notches had sharper tips with tip radii down to 0.31 mm, corresponding to higher curvature and increased theoretical stress concentration. Despite this, the calculated SCFs for real-world defects, based on profilometric data, were generally lower than those for artificial notches. For example, the SCFs of real defects were estimated to range between 1.5 and 3.0 (depending on curvature and depth), whereas those of prefabricated notches reached values up to 5.49. This deliberate exaggeration in notch severity serves to establish a conservative experimental boundary for assessing material fatigue resistance.
Interestingly, even under more severe geometric conditions and elevated SCFs, the prefabricated notches did not lead to crack initiation after up to 2 × 10⁷ fatigue cycles at a maximum nominal stress of 240 MPa. This outcome implies that actual in-service surface defects—being geometrically less severe—are unlikely to initiate fatigue failure under similar loading conditions, provided they occur in comparable material zones with similar surface conditions. However, while prefabricated notches simplify geometry and allow controlled testing, they do not fully replicate the randomness, asymmetry, or multi-axial stress states often present in real-world defects, particularly those caused by impact. For instance, real impact damage often presents with irregular boundaries, asymmetrical penetration, and potential microstructural damage at the tip, factors that may enhance crack nucleation under service loading. Therefore, although the prefabricated notches offer a conservative fatigue threshold, they may underestimate localized effects associated with actual damage morphologies.
The results from the artificially notched axle tests provide strong evidence that the current maintenance thresholds (e.g., 0.1 mm for scratches and 0.3 mm for impacts) are likely to be overly conservative. Given that notches up to 1.76 mm in depth did not trigger cracking under standard fatigue loading, in-service defects—most of which are shallower than 0.5 mm—may not require immediate intervention. Nonetheless, localized defects with exceptionally small radii of curvature (as observed in a few sharp impact defects) could represent higher-risk features despite their shallow depth, highlighting the importance of curvature-based screening metrics.
In summary, while artificially prefabricated notches are geometrically simplified and deliberately severe, their fatigue performance provides a safety envelope within which in-service defects can be assessed. This comparison supports the potential relaxation of current defect size criteria in overhaul standards, provided curvature and location-specific factors are adequately considered in fatigue life evaluations.
4.4. Limitations and Outlook
This study is limited by the relatively small number of full-scale axle specimens and the use of idealized, axisymmetric notches that may not fully capture the irregularity of real in-service defects. Additionally, the analysis was based on simplified two-dimensional geometric measurements and nominal stress assumptions, without accounting for three-dimensional stress fields or multiaxial service loading.
Future work should explore more representative defect geometries and incorporate 3D finite element analysis to better resolve local stress states. The integration of digital twin frameworks—combining high-fidelity simulations with real-time inspection data—offers a promising avenue for defect-specific fatigue life prediction. Moreover, expanding to different material systems, residual stress conditions, and environmental factors will enhance the robustness and applicability of fatigue assessment methodologies for high-speed train axles.
5. Conclusions
This study experimentally investigated the fatigue behavior of full-scale high-speed train axles containing circumferential V-shaped notches designed to simulate and exceed the severity of in-service surface defects. Fatigue tests up to 2 × 10⁷ cycles under a nominal stress of 240 MPa revealed that even sharply profiled notches—with depths up to 1.76 mm and stress concentration factors exceeding 5.0—did not trigger fatigue crack initiation. These findings demonstrate a remarkably high level of damage tolerance in axle materials, far surpassing conservative assumptions embedded in current maintenance standards.
In contrast, replica-based measurements of 44 retired axles showed that actual surface defects, including scratches and impacts, were significantly shallower and geometrically less severe than the prefabricated notches. This direct comparison highlights the potential over conservatism of existing defect acceptance limits (e.g., 0.1 mm for scratches, 0.3 mm for impacts).
The results challenge the prevailing reliance on local stress-based criteria for fatigue assessment and suggest that curvature, notch geometry, and full-scale material behavior must be integrated into more realistic defect evaluation frameworks. This work provides a scientific foundation for refining defect tolerance criteria and advancing toward geometry-informed, evidence-based fatigue management strategies for railway axle systems.
Conflicts of Interest
The authors declare no conflicts of interest.
References
- Glossary: High-speed rail. Available online: https://ec.europa.eu/eurostat/statistics-explained/index.php?title=Glossary:High-speed_rail (accessed on 6 April 2025).
- High-speed rail. Available online: https://en.wikipedia.org/wiki/High-speed_rail (accessed on 6 April 2025).
- Ollivier, G.; Bullock, R.; Jin, Y.; Zhou, N. High-Speed Railways in China: A Look at Traffic; World bank: Washington, DC, USA, 2014. [Google Scholar]
- Zerbst, U.; Klinger, C.; Klingbeil, D. Structural assessment of railway axles - A critical review. Eng. Fail. Anal. 2013, 35, 54–65. [Google Scholar] [CrossRef]
- Cong, T.; Qian, G.; Zhang, G.; Wu, S.; Pan, X.; Du, L.; Liu, X. Effects of inclusion size and stress ratio on the very-high-cycle fatigue behavior of pearlitic steel. Int. J. Fatigue 2021, 142, 105958. [Google Scholar]
- Tong, Y.Y.; Liu, G.X.; Yousefian, K.; Jing, G.Q. Track Vertical Stiffness -Value, Measurement Methods, Effective Parameters and Challenges: A review. Transp. Geotech. 2022, 37, 100833. [Google Scholar] [CrossRef]
- Pan, X.; Qian, G.; Wu, S.; Fu, Y.; Hong, Y. Internal crack characteristics in very-high-cycle fatigue of a gradient structured titanium alloy. Sci. Rep. 2020, 10, 4742. [Google Scholar]
- Yu, M.; Duquesnay, D.; Topper, T. Notch fatigue behavior of SAE1045 steel. Int. J. Fatigue 1988, 10, 109–116. [Google Scholar] [CrossRef]
- Chapetti, M.D.; Tagawa, T.; Miyata, T. Fatigue notch sensitivity of steel blunt-notched specimens. Fatigue Fract. Eng. Mater. Struct. 2002, 25, 629–634. [Google Scholar] [CrossRef]
- Verreman, Y.; Limodin, N. Fatigue notch factor and short crack propagation. Eng. Fract. Mech. 2008, 75, 1320–1335. [Google Scholar] [CrossRef]
- Jiang, Q.; Sun, C.; Liu, X.; Hong, Y. Very-high-cycle fatigue behavior of a structural steel with and without induced surface defects. Int. J. Fatigue 2016, 93, 352–362. [Google Scholar]
- Lagoda, T.; Bilous, P.; Blacha, L. Investigation on the effect of geometric and structural notch on the fatigue notch factor in steel welded joints. Int. J. Fatigue 2017, 101, 224–231. [Google Scholar] [CrossRef]
- Zhang, C.; Yang, S.; Dong, Y.; Mu, S.; Li, H.; Zhang, J. Fatigue limit prediction of cracked and notched specimens related to grain size. Int. J. Fatigue 2023, 177, 107905. [Google Scholar] [CrossRef]
- Hwang, D.; Cho, S.S. Correlation between fretting and plain fatigue using fatigue damage gradient. J. Mech. Sci. Technol. 2014, 28, 2153–2159. [Google Scholar] [CrossRef]
- Li, X.; Zuo, Z.; Qin, W. A fretting related damage parameter for fretting fatigue life prediction. Int. J. Fatigue 2015, 73, 110–118. [Google Scholar] [CrossRef]
- Huang, Z.; Zhang, Z.; Teng, Z.; Khan, M.K.; Wang, Q.; Wang, J. Effect of fretting damage on characteristics of high strength bearing steel up to very high cycle fatigue. Eng. Fract. Mech. 2019, 217, 106526. [Google Scholar] [CrossRef]
- Wang, X.; Ping, X.; Zeng, X.; Wang, R.; Zhao, Q.; Ying, S.; Hu, T. Fretting fatigue experiment and simulation of WC-12Co coating taking into account the wear effects. Surf. Coat. Technol. 2022, 441, 128555. [Google Scholar] [CrossRef]
- Cavuto, A.; Martarelli, M.; Pandarese, G.; Revel, G.M.; Tomasini, E.P. Experimental investigation by Laser Ultrasonics for train wheelset flaw detection. J. Phys. Conf. Ser. 2018, 1149, 012015. [Google Scholar]
- Pathak, M.; Alahakoon, S.; Spiryagin, M.; Cole, C. Rail foot flaw detection based on a laser induced ultrasonic guided wave method. Measurement 2019, 148, 106922. [Google Scholar] [CrossRef]
- Wang, Y.W.; Ni, Y.Q.; Wang, X. Real-time defect detection of high-speed train wheels by using Bayesian forecasting and dynamic model. Mech. Syst. Signal Process. 2020, 139, 106654. [Google Scholar]
- Pan, X.; Su, H.; Sun, C.; Hong, Y. The behavior of crack initiation and early growth in high-cycle and very-high-cycle fatigue regimes for a titanium alloy. Int. J. Fatigue 2018, 115, 67–78. [Google Scholar] [CrossRef]
- Pan, X.; Hong, Y. High-cycle and very-high-cycle fatigue behaviour of a titanium alloy with equiaxed microstructure under different mean stresses. Fatigue Fract. Eng. Mater. Struct. 2019, 42, 1950–1964. [Google Scholar]
- Pan, X.; Su, H.; Liu, X.; Hong, Y. Multi-scale fatigue failure features of titanium alloys with equiaxed or bimodal microstructures from low-cycle to very-high-cycle loading numbers. Mater. Sci. Eng. A 2024, 890, 145906. [Google Scholar] [CrossRef]
- EN 13261. Railway applications - Wheelsets and bogies - Axles - Product requirements; European Committee for Standardization: Brussels, Belgium, 2023. [Google Scholar]
- Schijve, J. Fatigue of Structures and Materials, 2nd ed.; Springer: Dordrecht, Germany, 2009. [Google Scholar]
- Sun, J.Y.; Zhao, X.; Illeperuma, W.R.K.; Chaudhuri, O.; Oh, K.H.; Mooney, D.J.; Vlassak, J.J.; Suo, Z. Highly stretchable and tough hydrogels. Nature 2012, 489, 133–136. [Google Scholar] [CrossRef]
- Jiang, Z.; Ji, Z.; Zhu, M.; Ma, W.; Gao, S.; Xu, M. Notch-insensitive, tough and self-healing conductive bacterial cellulose nanocomposite hydrogel for flexible wearable strain sensor. Int. J. Biol. Macromol. 2024, 280, 135947. [Google Scholar] [CrossRef]
- Zhao, C.; Wu, W.; Deng, J.; Yu, M.; Peng, Y.; Wang, X.; Gong, J. Hydrogen-induced delayed fracture behavior of notched 316L austenitic stainless steel: Role of grain refinement. Eng. Fail. Anal. 2024, 166, 108880. [Google Scholar] [CrossRef]
- Cicero, S. Assessment of structural materials containing notch-type defects: A comprehensive validation of the FAD-TCD methodology on metallic and non-metallic materials. Theor. Appl. Fract. Mech. 2024, 133, 104612. [Google Scholar] [CrossRef]
- Medina, L.; Díaz, A.; Rodriguez-Aparicio, R.; Mayoral, N.; Cuesta, I.I.; Alegre, J.M. Notch sensitivity analysis of a 2205 duplex stainless steel in a gaseous hydrogen environment. Theor. Appl. Fract. Mech. 2024, 134, 104655. [Google Scholar] [CrossRef]
- Wan, R.; Long, Z.; Cui, Y.; You, L. Strengthening effects of indentation notches on metallic glasses and their sensitivity to stress triaxiality. J. Non-Cryst. Solids 2024, 645, 123187. [Google Scholar] [CrossRef]
- Minerva, G.; Awd, M.; Koch, A.; Walther, F.; Beretta, S. Transferability of anomaly data to fatigue properties of PBF-LB AlSi10Mg parts with different volumes. Int. J. Fatigue 2025, 195, 108852. [Google Scholar] [CrossRef]
- Ahmad, N.; Irfan, S.; Maleki, E.; Lee, S.; Liu, J.P.; Shao, S.; Shamsaei, N. Determining critical surface features affecting fatigue behavior of additively manufactured Ti-6Al-4V. Int. J. Fatigue 2025, 197, 108956. [Google Scholar] [CrossRef]
- Kwon, O.; Lim, H.J.; Sohn, H. Reference-free remaining fatigue life prediction for notched aluminum 6061-T6 plates without preliminary fatigue tests. Mech. Syst. Signal Process. 2025, 229, 112569. [Google Scholar] [CrossRef]
- Kumar, A.; Jha, J.S.; Mishra, S.K.; Tandaiya, P. Effect of notch root radius on apparent fracture toughness of Ti6Al4V alloy: experiments and simulations. Int. J. Fract. 2025, 249, 7. [Google Scholar] [CrossRef]
- Boussahra, M.S.N.; Madani, K.; Benyettou, M.; Harmel, M.W.; Aminallah, S.; Zouggar, K.; Campilho, R.D.S.G. Novel patch shape for the repair of inclined cracks in DH 36 steel structures: Numerical analysis. Mech. Adv. Mater. Struct 2025, in press. [Google Scholar] [CrossRef]
- Zhang, S.; Xie, J.; Jiang, Q.; Zhang, X.; Sun, C.; Hong, Y. Fatigue crack growth behavior in gradient microstructure of hardened surface layer for an axle steel. Mater. Sci. Eng. A 2017, 700, 66–74. [Google Scholar] [CrossRef]
- Qin, T.; Hu, F.; Xu, P.; Zhang, H.; Zhou, L.; Ao, N.; Su, Y.; Shobu, T.; Wu, S. Gradient residual stress and fatigue life prediction of induction hardened carbon steel S38C axles: Experiment and simulation. Int. J. Fatigue 2024, 185, 108336. [Google Scholar] [CrossRef]
- Hu, F.; Qin, T.; Ao, N.; Su, Y.; Zhou, L.; Xu, P.; Parker, J.D.; Shinohara, T.; Chen, J.; Wu, S. Gradient residual strain determination of surface impacted railway S38C axles by neutron Bragg-edge transmission imaging. Eng. Fract. Mech. 2024, 306, 110267. [Google Scholar] [CrossRef]
- Hu, F.; Qin, T.; Su, Y.; He, L.; Ao, N.; Parker, J.D.; Shinohara, T.; Wu, S. Residual stress relaxation of railway gradient S38C steel during fatigue crack growth by neutron imaging and diffraction. Int. J. Fatigue 2025, 193, 108826. [Google Scholar] [CrossRef]
- Huang, M. Analysis and research of fretting damage on wheel/rd2 axle interface; Dissertation/Thesis. Chengdu, China, Southwest Jiaotong University, 2010.
- Murakami, Y. Metal Fatigue: Effect of Small Defects and Nonmetallic Inclusions; Elsevier: Oxford, UK, 2002. [Google Scholar]
- Zerbst, U.; Beretta, S.; Köhler, G.; Lawton, A.; Vormwald, M.; Beier, H.T.; Klinger, C.; Cerny, I.; Rudlin, J.; Heckel, T.; Klingbeil, D. Safe life and damage tolerance aspects of railway axles - A review. Eng. Fract. Mech. 2013, 98, 214–271. [Google Scholar] [CrossRef]
- Sun, C.; Song, Q.; Zhou, L.; Pan, X. Characteristic of interior crack initiation and early growth for high cycle and very high cycle fatigue of a martensitic stainless steel. Mater. Sci. Eng. A 2019, 758, 112–120. [Google Scholar] [CrossRef]
- Chang, Y.; Zheng, L.; Pan, X.; Hong, Y. Further investigation on microstructure refinement of internal crack initiation region in VHCF regime of high-strength steels. Frattura ed Integrità Strutturale 2019, 13, 1–11. [Google Scholar] [CrossRef]
- Pan, X.; Xu, S.; Qian, G.; Nikitin, A.; Shanyavskiy, A.; Palin-Luc, T.; Hong, Y. The mechanism of internal fatigue-crack initiation and early growth in a titanium alloy with lamellar and equiaxed microstructure. Mater. Sci. Eng. A 2020, 798, 140110. [Google Scholar] [CrossRef]
- Chang, Y.; Pan, X.; Zheng, L.; Hong, Y. Microstructure refinement and grain size distribution in crack initiation region of very-high-cycle fatigue regime for high-strength alloys. Int. J. Fatigue 2020, 134, 105473. [Google Scholar] [CrossRef]
- Qian, G.; Jian, Z.; Qian, Y.; Pan, X.; Ma, X.; Hong, Y. Very-high-cycle fatigue behavior of AlSi10Mg manufactured by selective laser melting: Effect of build orientation and mean stress. Int. J. Fatigue 2020, 138, 105696. [Google Scholar] [CrossRef]
- Pan, X.; Qian, G.; Hong, Y. Nanograin formation in dimple ridges due to local severe-plastic-deformation during ductile fracture. Scr. Mater. 2021, 194, 11363. [Google Scholar] [CrossRef]
- Du, L.; Pan, X.; Qian, G.; Zheng, L.; Hong, Y. Crack initiation mechanisms under two stress ratios up to very-high-cycle fatigue regime for a selective laser melted Ti-6Al-4V. Int. J. Fatigue 2021, 149, 106294. [Google Scholar] [CrossRef]
- Liu, L.; Ma, Y.; Liu, S.; Wang, S. The fatigue behaviors of a medium-carbon pearlitic wheel-steel with elongated sulfides in high-cycle and very-high-cycle regimes. Materials 2021, 14(15), 4318. [Google Scholar] [CrossRef]
- Pan, X.; Du, L.; Qian, G.; Hong, Y. Microstructure features induced by fatigue crack initiation up to very-high-cycle regime for an additively manufactured aluminium alloy. J. Mater. Sci. Technol. 2024, 173, 247–260. [Google Scholar] [CrossRef]
- Pan, X.; Xu, S.; Nikitin, A.; Shanyavskiy, A.; Palin-Luc, T.; Hong, Y. Crack initiation induced nanograins and facets of a titanium alloy with lamellar and equiaxed microstructure in very-high-cycle fatigue. Mater. Lett. 2024, 357, 135769. [Google Scholar] [CrossRef]
- Du, L.; Pan, X.; Hong, Y. New insights into microstructure refinement in crack initiation region of very-high-cycle fatigue for SLM Ti-6Al-4V via precession electron diffraction. Materialia 2024, 33, 102008. [Google Scholar] [CrossRef]
- Tao, Z.; Wang, Z.; Pan, X.; Su, T.; Long, X.; Liu, B.; Tang, Q.; Ren, X.; Sun, C.; Qian, G.; et al. A new probabilistic control volume scheme to interpret specimen size effect on fatigue life of additively manufactured titanium alloys, Int. J. Fatigue 2024, 183, 108262. [Google Scholar] [CrossRef]
- Pan, X.; Hong, Y. High-cycle and very-high-cycle fatigue of an additively manufactured aluminium alloy under axial cycling at ultrasonic and conventional frequencies. Int. J. Fatigue 2024, 185, 108363. [Google Scholar] [CrossRef]
- Gao, C.; Zhang, Y.; Jiang, J.; Fu, R.; Du, L.; Pan, X. Research viewpoint on performance enhancement for very-high-cycle fatigue of Ti-6Al-4V alloys via laser-based powder bed fusion. Crystals 2024, 14(9), 749. [Google Scholar] [CrossRef]
- Tao, Z.; Chang, Y.; Pan, X.; Qian, G.; Hong, Y. Numerical simulation of crack surface contacting behavior with stress-induced martensitic phase transformation in very-high-cycle fatigue regime. Int. J. Fatigue 2025, 198, 109019. [Google Scholar] [CrossRef]
- Pan, X.; Tao, Z.; Long, X. Extraordinary specimen-size effect on long-life fatigue of additively manufactured AlSi10Mg. Int. J. Mech. Sci. 2025, 301, 110524. [Google Scholar] [CrossRef]
- Tan, X.; Kok, Y.; Tan, Y.J.; Descoins, M.; Mangelinck, D.; Tor, S.B.; Leong, K.F.; Chua, C.K. Graded microstructure and mechanical properties of additive manufactured Ti-6Al-4V via electron beam melting. Acta Mater. 2015, 97, 1–16. [Google Scholar] [CrossRef]
- Fu, Z.K.; Ding, H.H.; Wang, W.J.; Liu, Q.Y.; Guo, J.; Zhu, M.H. Investigation on microstructure and wear characteristic of laser cladding Fe-based alloy on wheel/rail materials. Wear 2015, 330, 592–599. [Google Scholar] [CrossRef]
- DebRoy, T.; Wei, H.L.; Zuback, J.S.; Mukherjee, T.; Elmer, J.W.; Milewski, J.O.; Beese, A.M.; Wilson-Heid, A.; De, A.; Zhang, W. Additive manufacturing of metallic components—Process, structure and properties. Prog. Mater. Sci. 2018, 92, 112–224. [Google Scholar] [CrossRef]
- Qian, G.; Jian, Z.; Pan, X.; Berto, F. In-situ investigation on fatigue behaviors of Ti-6Al-4V manufactured by selective laser melting. Int. J. Fatigue 2020, 133, 105424. [Google Scholar] [CrossRef]
- Long, X.; Jia, Q.; Li, J.; Chong, K.; Du, L.; Pan, X.; Chang, C. Mechanical properties and parameter optimization of TC4 alloy by additive manufacturing. China Surf. Eng. 2022, 35, 215–223. (in Chinese). [Google Scholar]
- Badoniya, P.; Srivastava, M.; Jain, P.K.; Rathee, S. A state-of-the-art review on metal additive manufacturing: Milestones, trends, challenges and perspectives. J. Braz. Soc. Mech. Sci. 2024, 46, 339. [Google Scholar] [CrossRef]
- Xu, S.; Pan, S.; Li, Z.; Li, S.; He, X.; Pan, X. Anisotropic tensile behavior and fracture characteristics of an additively manufactured nickel alloy without and with a heat treatment of solution aging. Mater. Sci. Eng. A 2025, 927, 148015. [Google Scholar] [CrossRef]
Figure 1.
Replication of defects on the axles: (a) microscopic comparison between the original defect and the replica, (b) powder replication and a defect specimen.
Figure 1.
Replication of defects on the axles: (a) microscopic comparison between the original defect and the replica, (b) powder replication and a defect specimen.
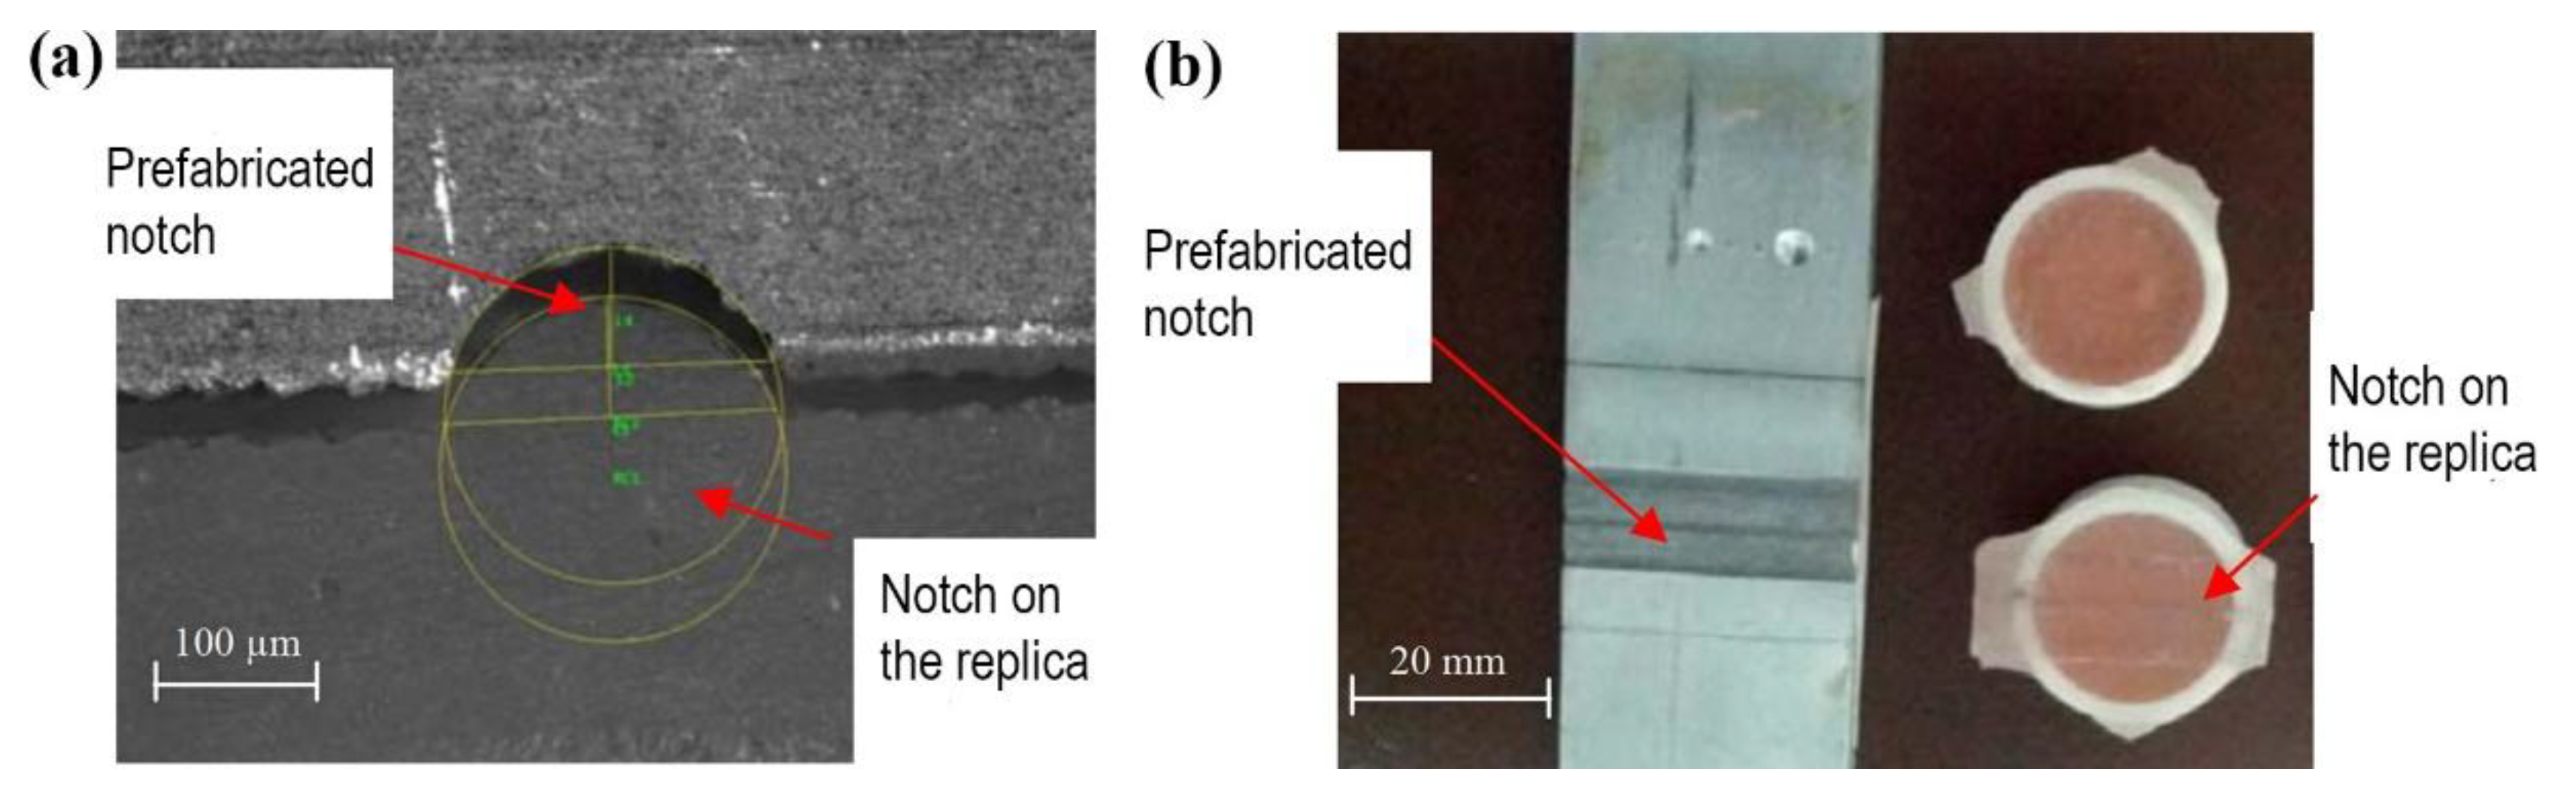
Figure 2.
Devices used in measurement of the replica specimens: (a) optical microscope, (b) AFO-L1 profilometer.
Figure 2.
Devices used in measurement of the replica specimens: (a) optical microscope, (b) AFO-L1 profilometer.
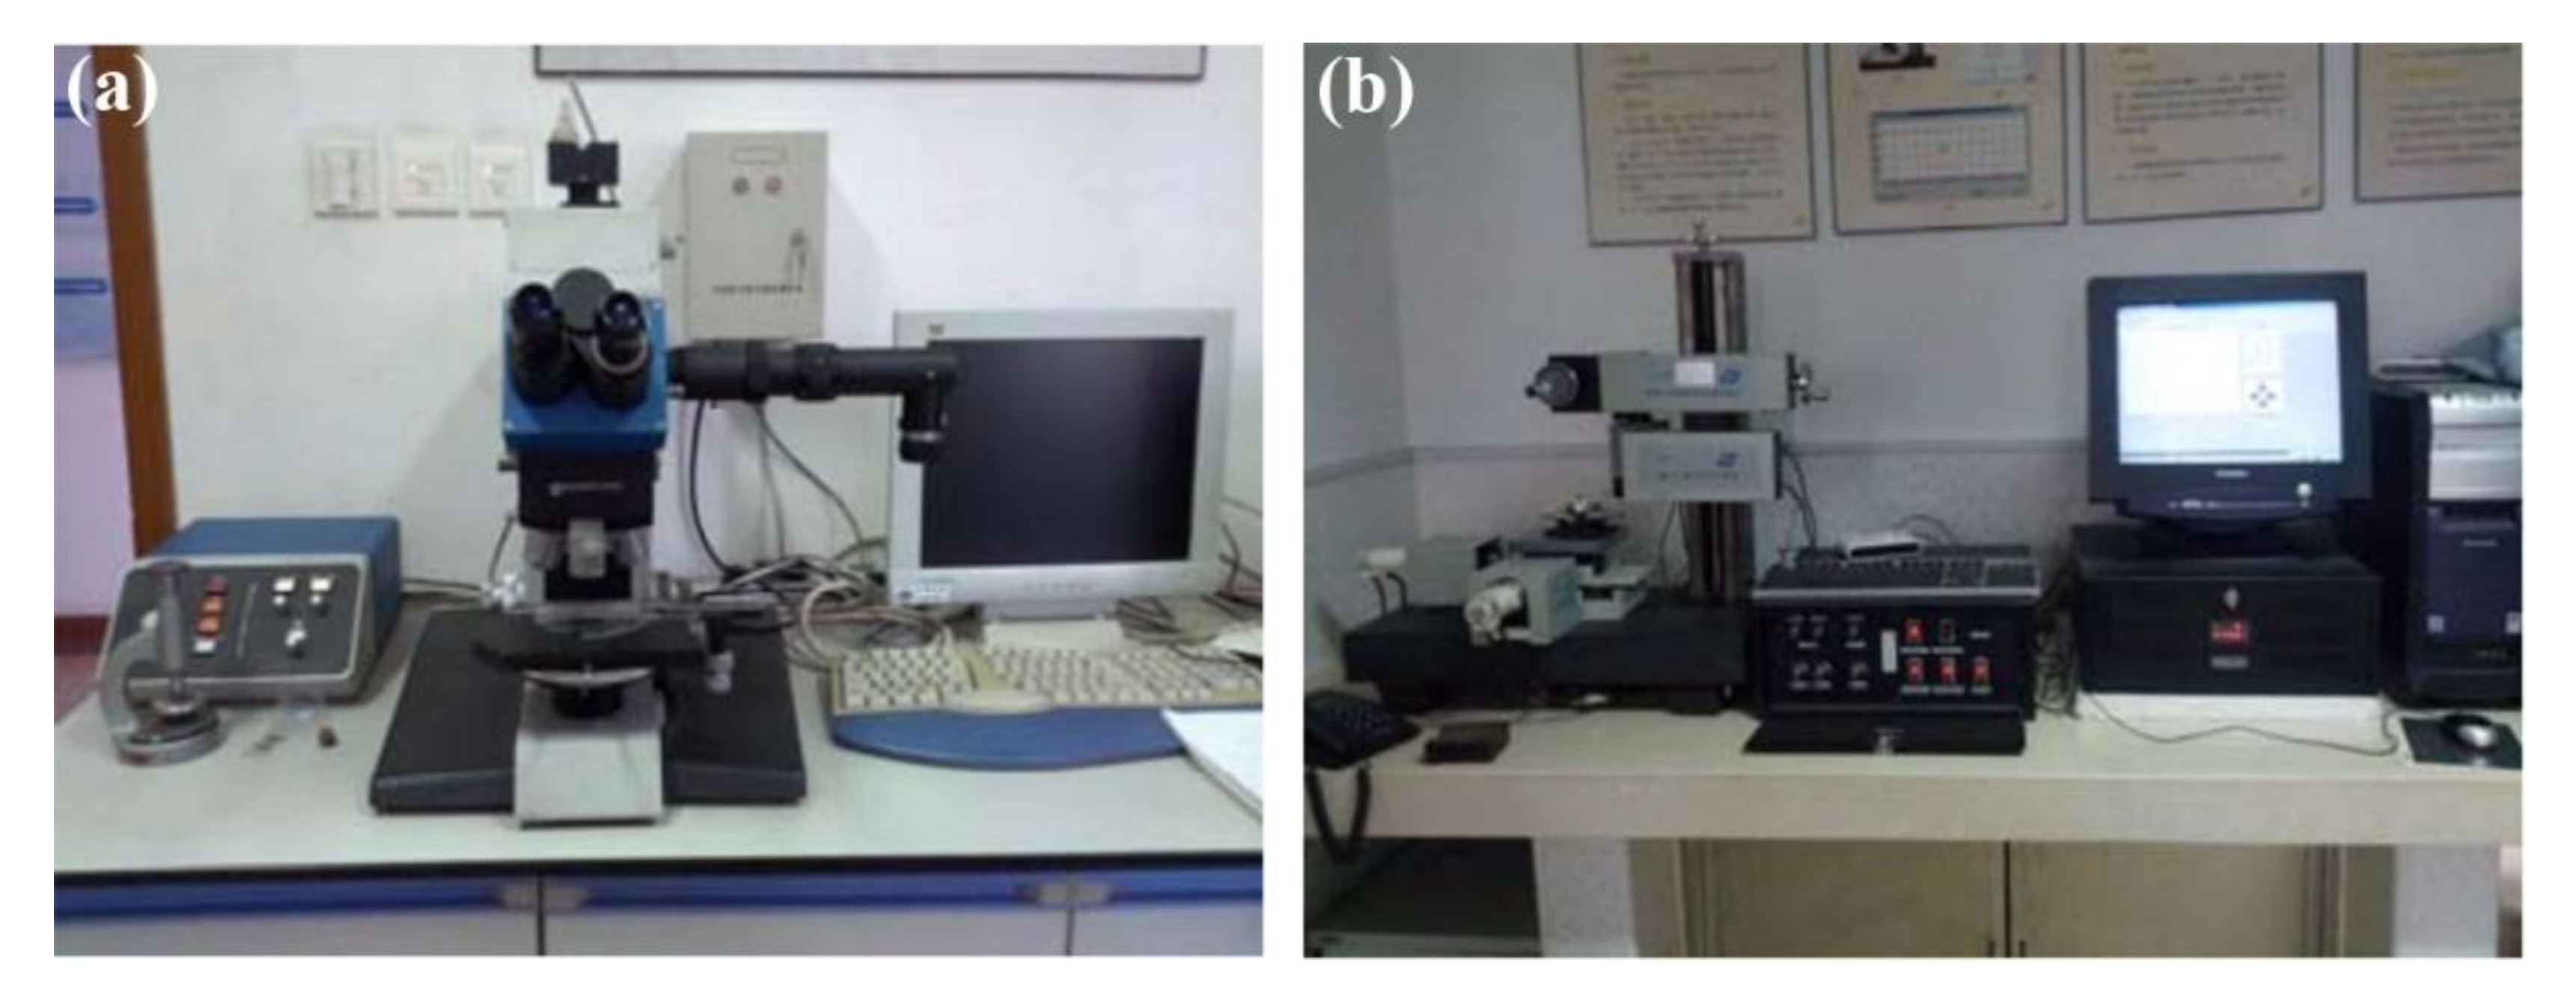
Figure 3.
Fatigue test setup and prefabrication of surface notches: (a) the test bench equipped with an experimental high-speed train axle, (b) V-shaped notch on the testing axle, (c) replica sampling of the notch.
Figure 3.
Fatigue test setup and prefabrication of surface notches: (a) the test bench equipped with an experimental high-speed train axle, (b) V-shaped notch on the testing axle, (c) replica sampling of the notch.
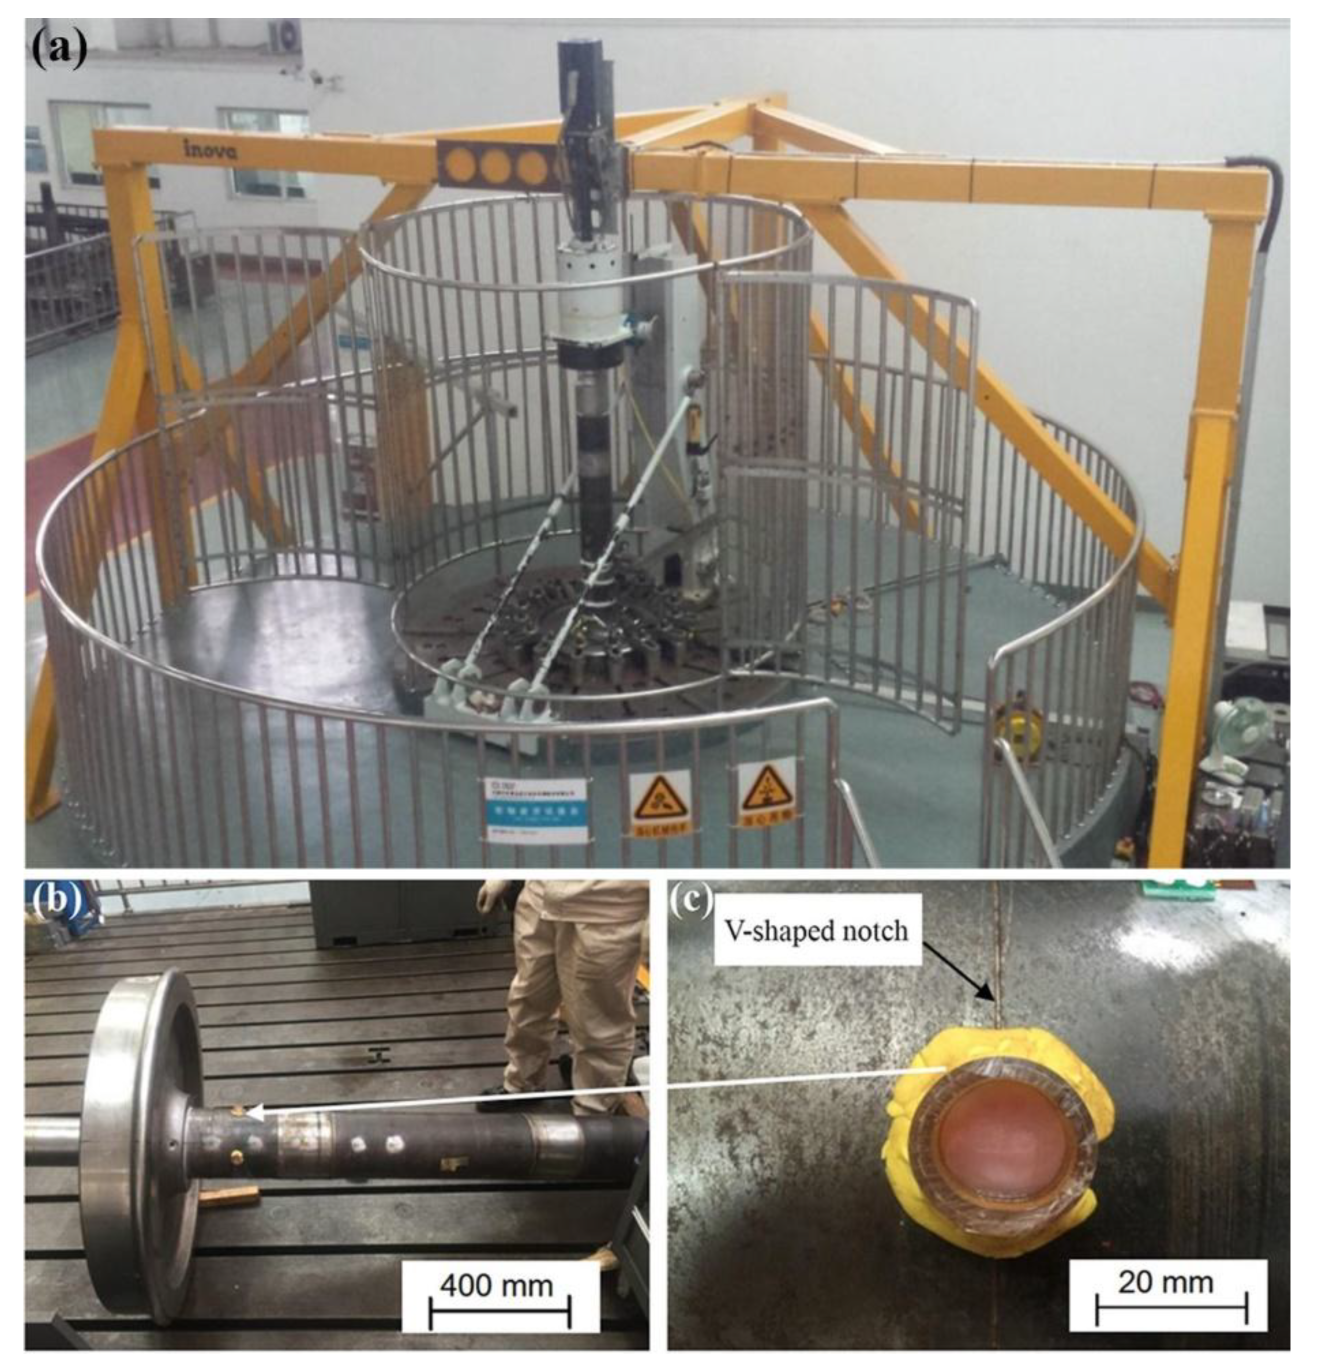
Figure 4.
Schematic of a V-shaped notch with the parameters r, c, t, and x.
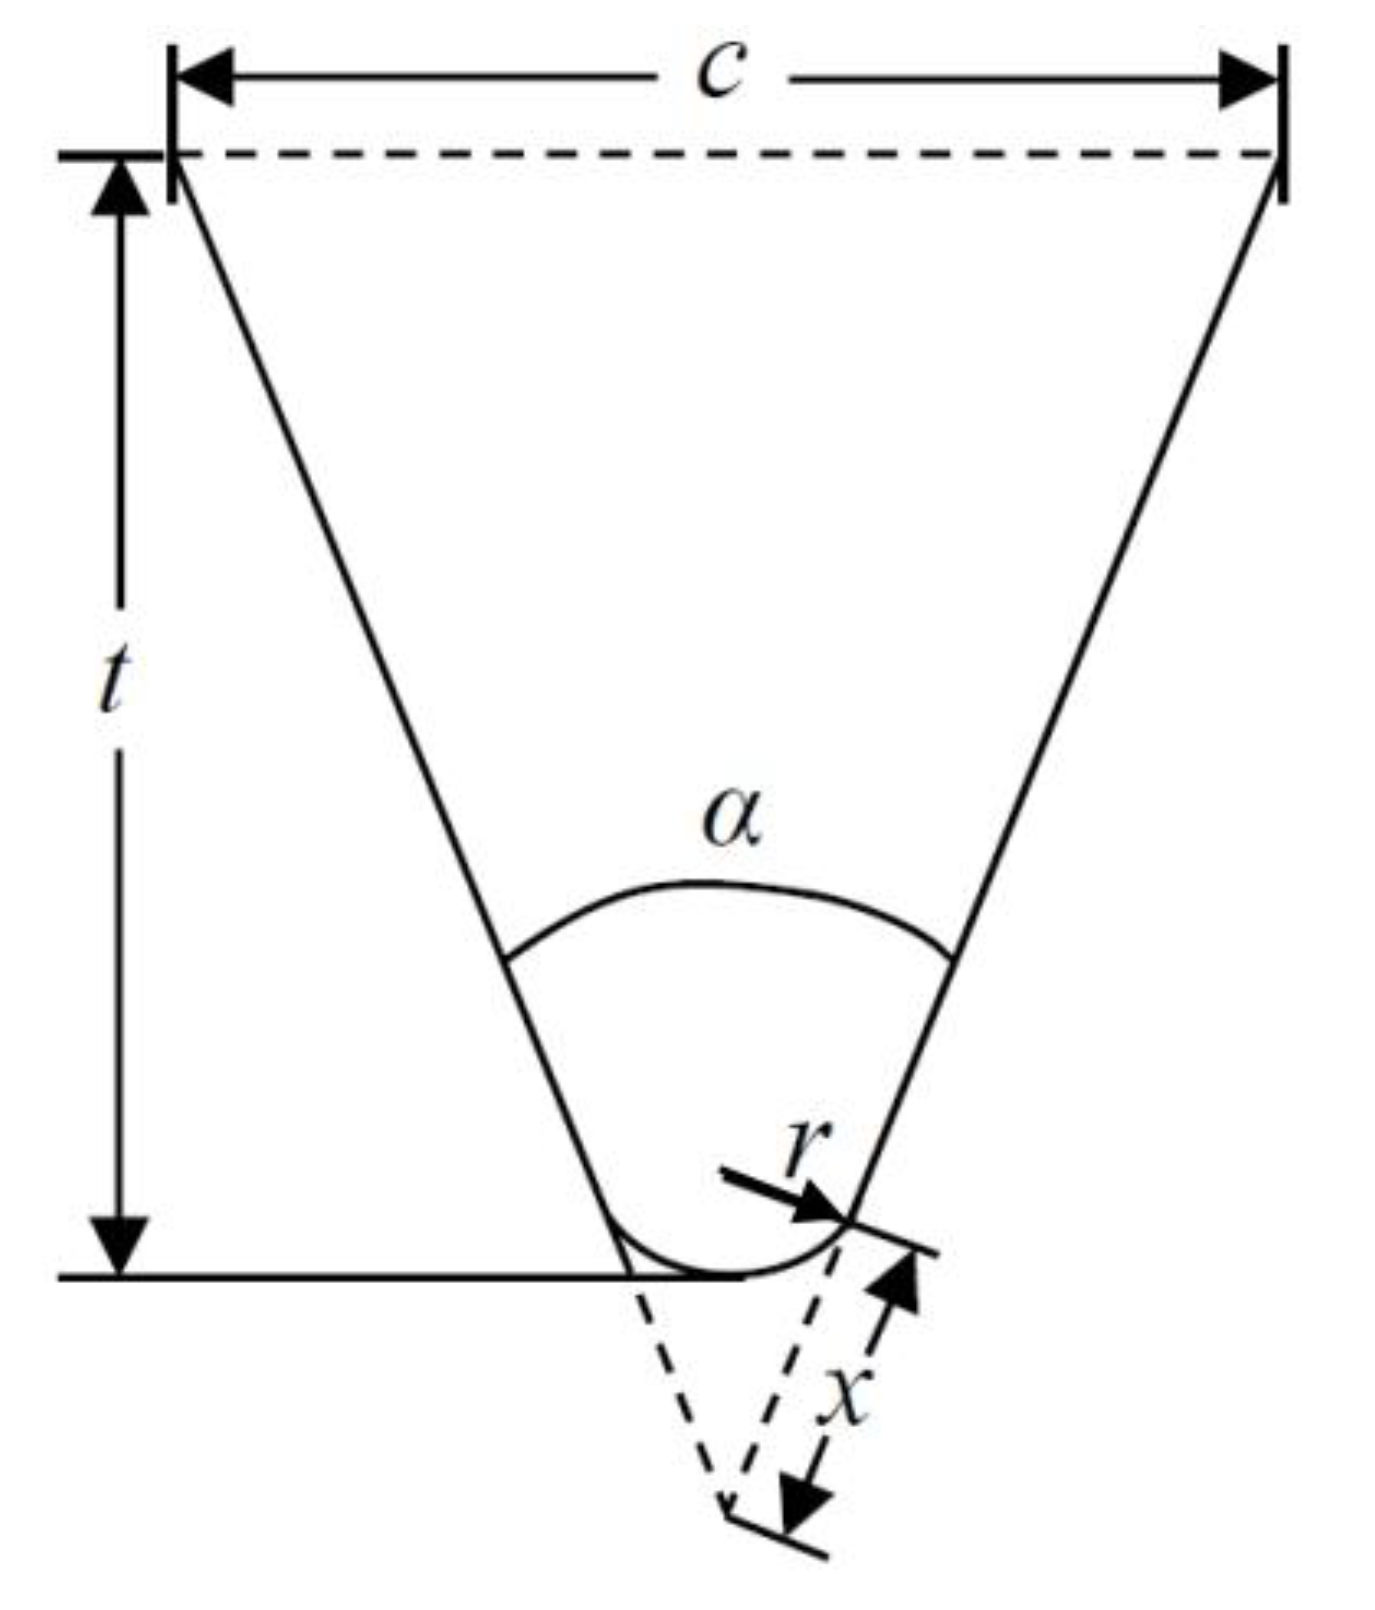
Figure 5.
Measurement results of Axle H11-4211: (a) on-site measurement, (b) optical microscopic morphology of the AC film replica, (c) contour profile of the PMMA powder replica H11-4211-1 (47 μm), and (d) contour profile of the PMMA powder replica H11-4211-2 (11 μm).
Figure 5.
Measurement results of Axle H11-4211: (a) on-site measurement, (b) optical microscopic morphology of the AC film replica, (c) contour profile of the PMMA powder replica H11-4211-1 (47 μm), and (d) contour profile of the PMMA powder replica H11-4211-2 (11 μm).
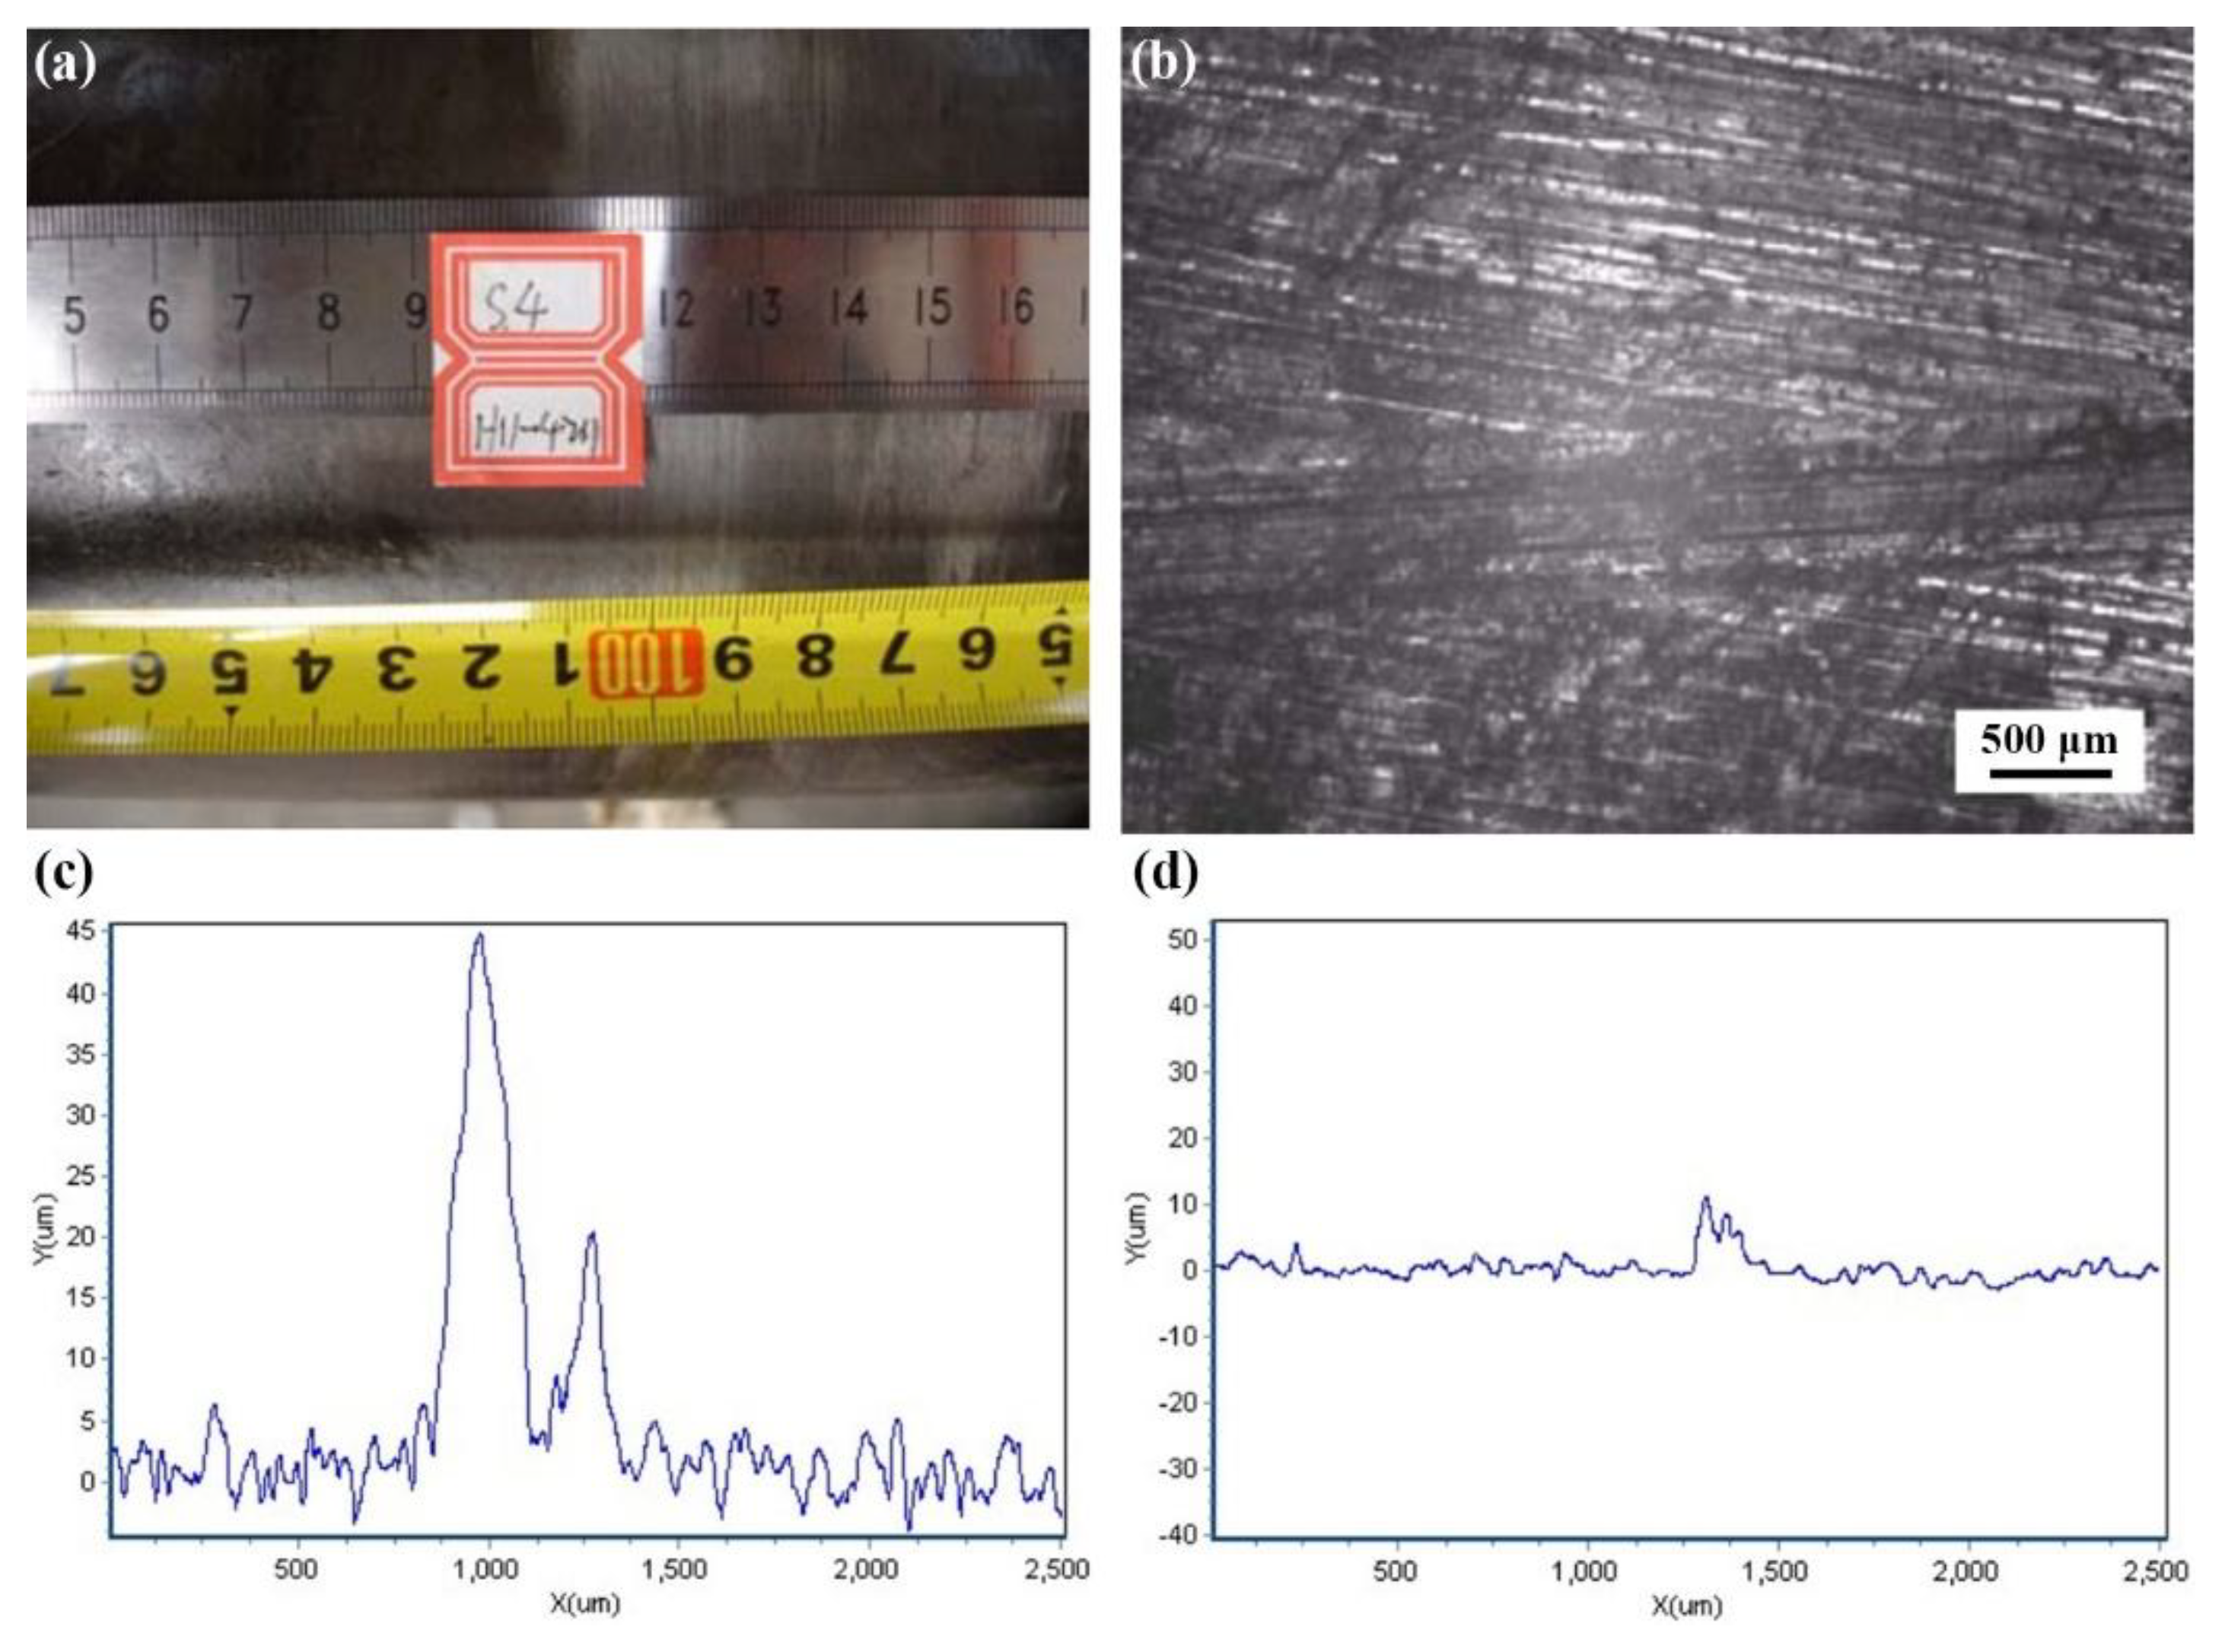
Figure 6.
Distribution of impact damage defects: (a) distribution of the number of impact damage defects with respect to the distance from the axle end, and (b) cumulative probability distribution of impact damage defect occurrence with respect to the distance from the axle end.
Figure 6.
Distribution of impact damage defects: (a) distribution of the number of impact damage defects with respect to the distance from the axle end, and (b) cumulative probability distribution of impact damage defect occurrence with respect to the distance from the axle end.
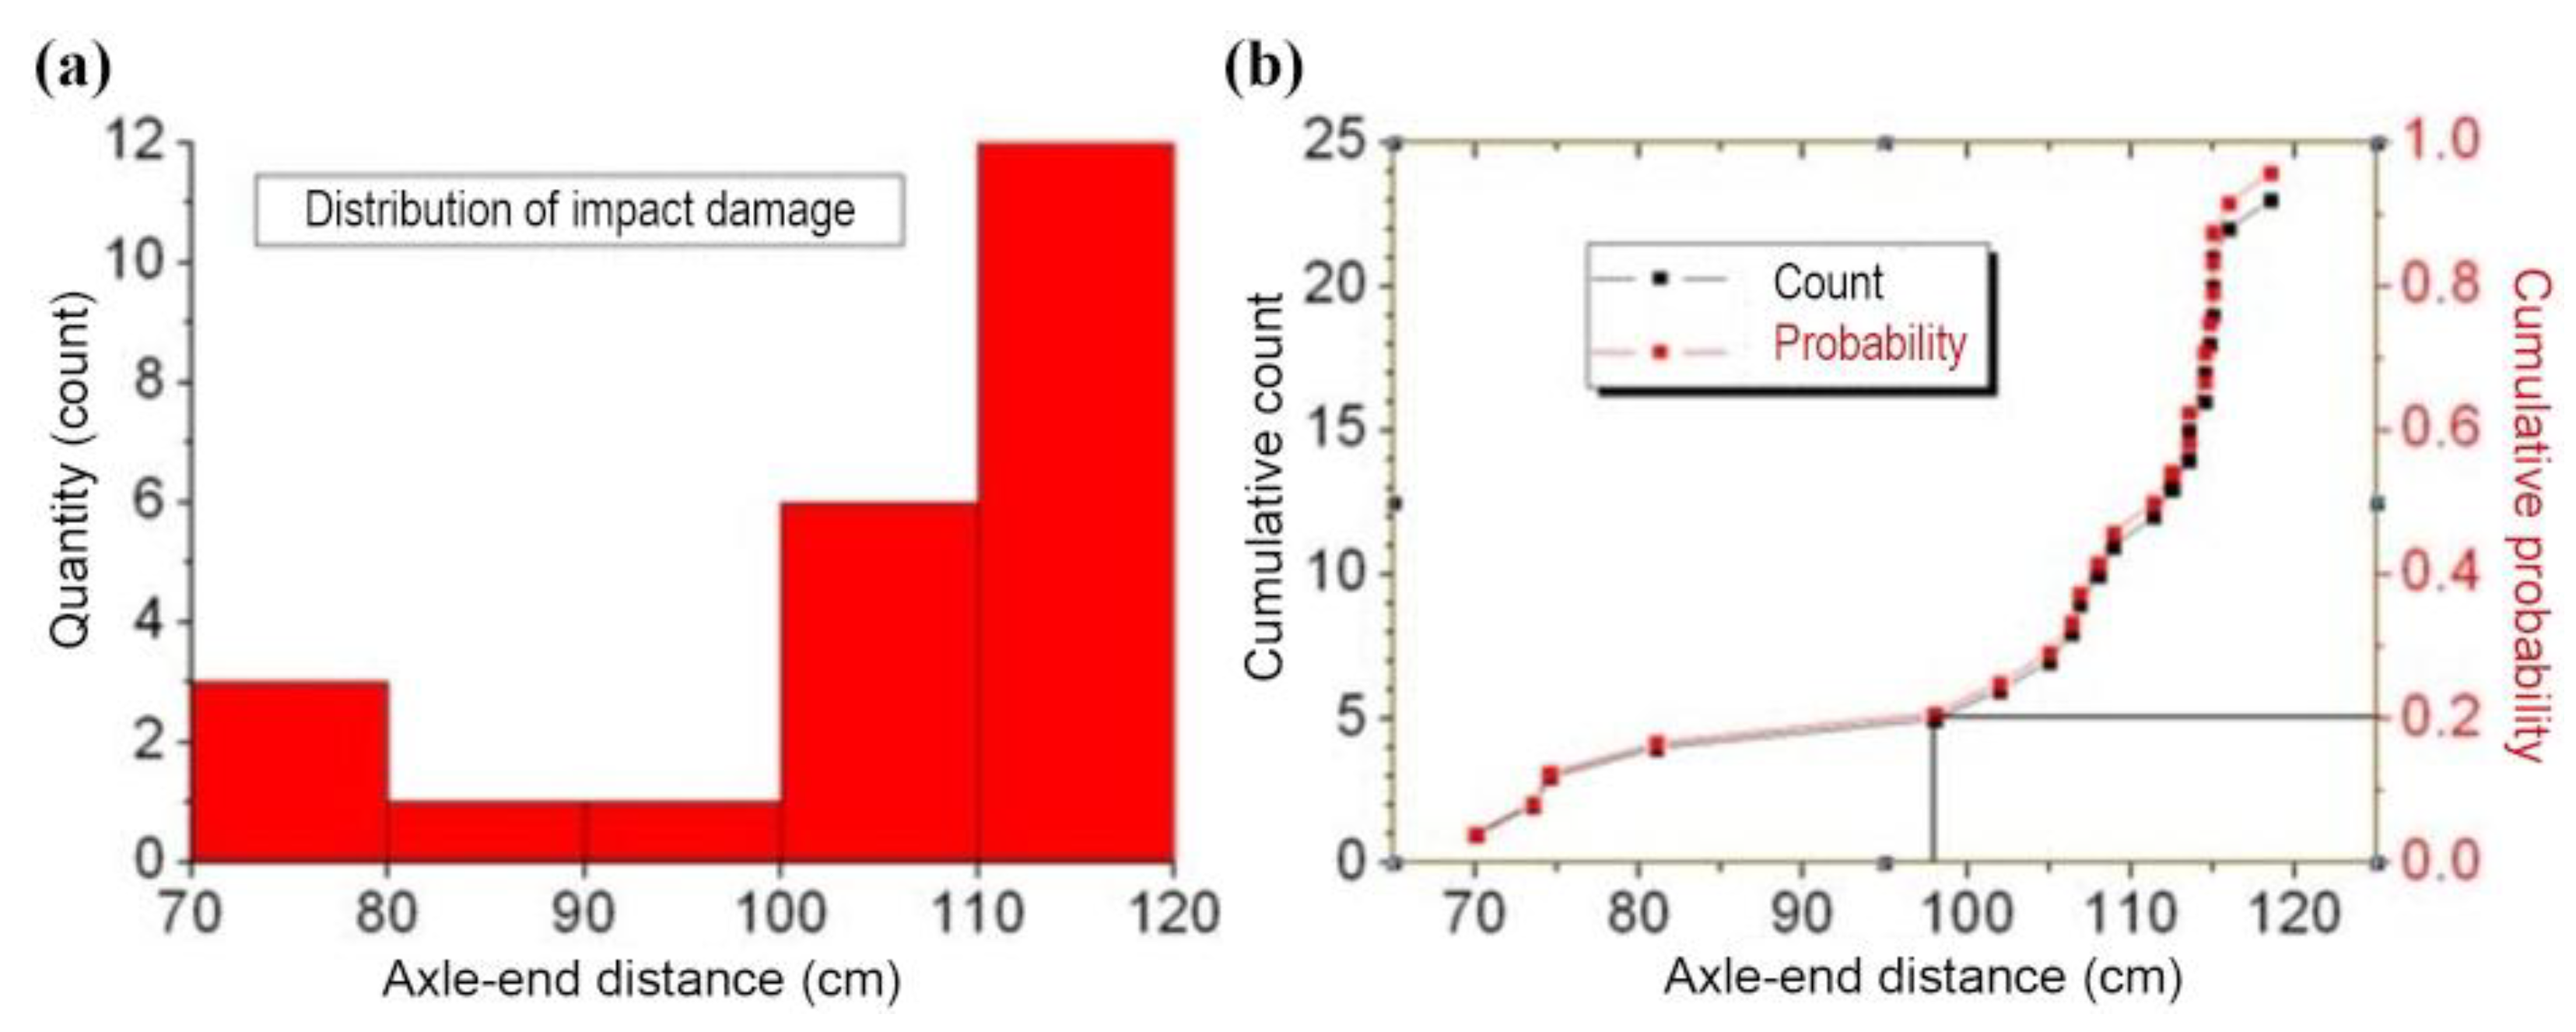
Figure 7.
Schematic diagrams illustrate: (a) the distribution of scratch defects along the axle (unit: mm), and (b) the distribution of impact damage defects along the axle (unit: mm).
Figure 7.
Schematic diagrams illustrate: (a) the distribution of scratch defects along the axle (unit: mm), and (b) the distribution of impact damage defects along the axle (unit: mm).
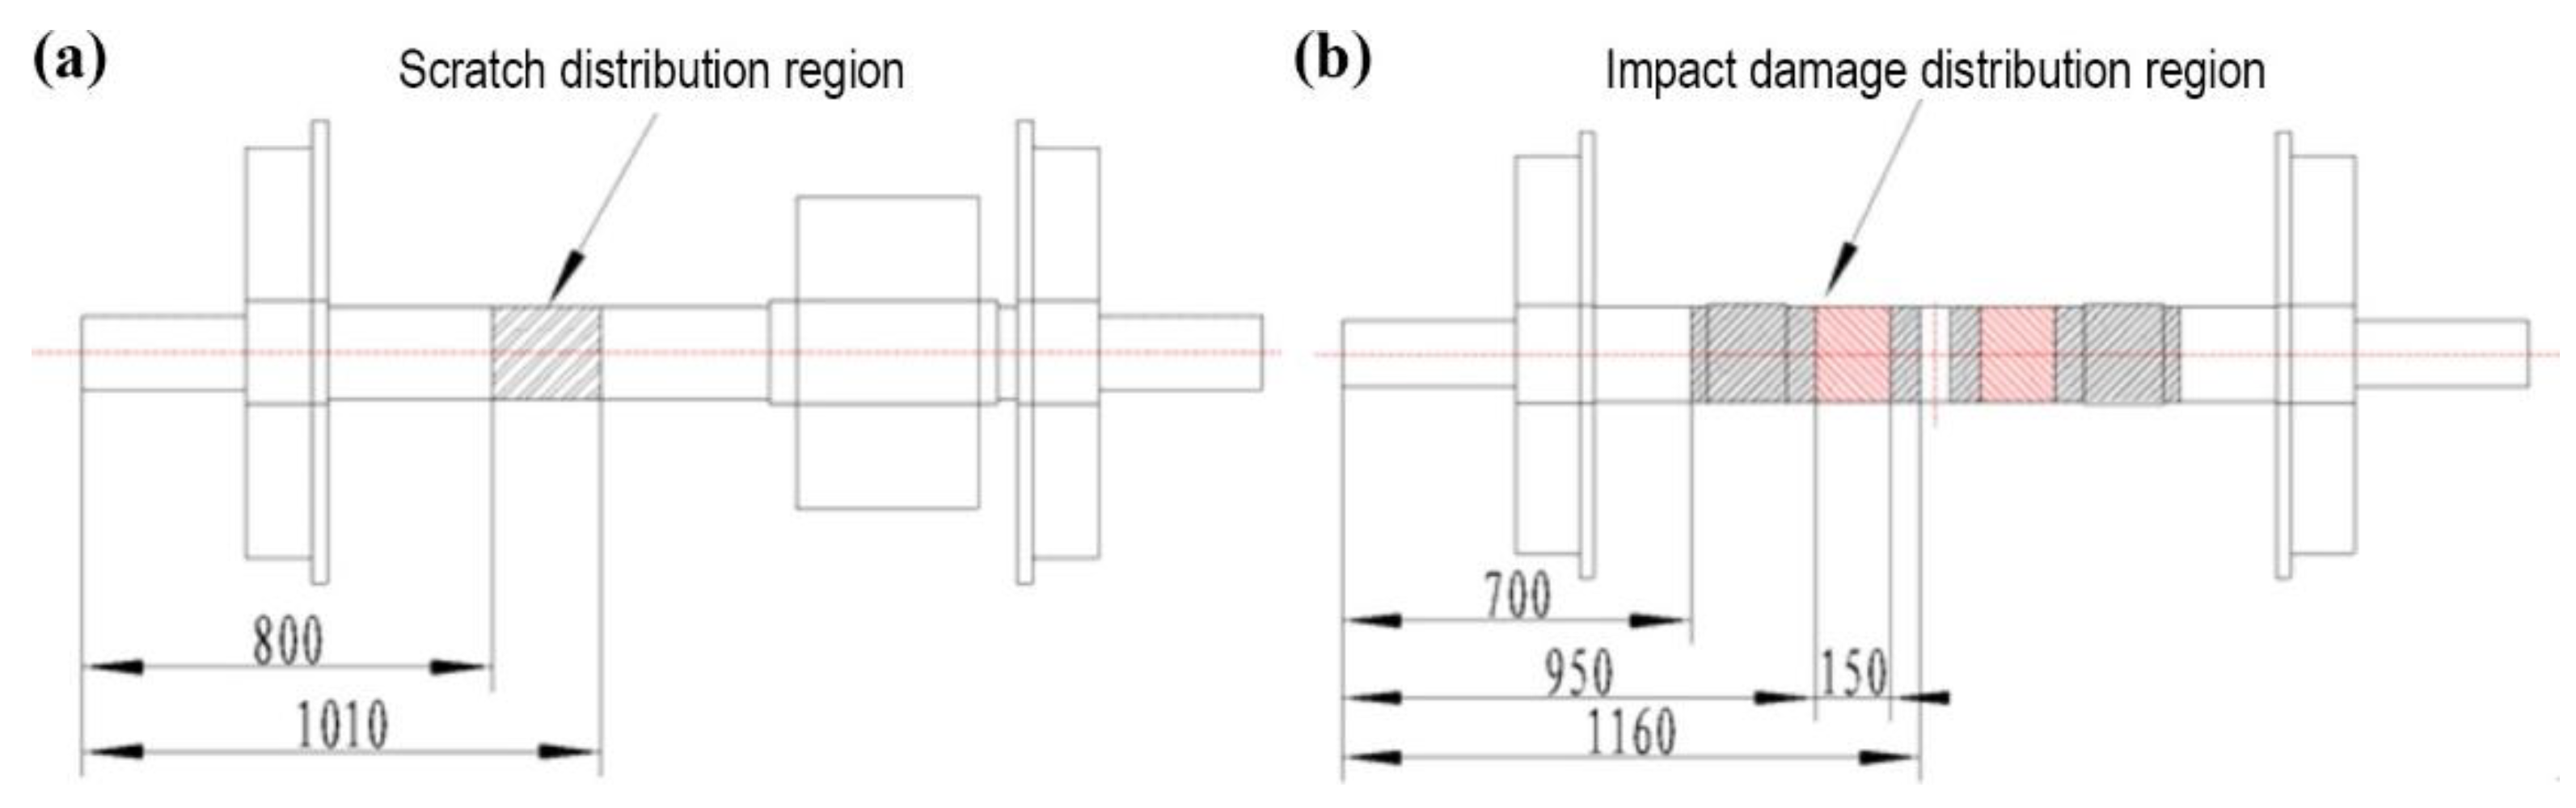
Figure 8.
V-shape notch on Axle H31-6201: (a) optical observation of the replica profile, (b) quadratic curve fitting.
Figure 8.
V-shape notch on Axle H31-6201: (a) optical observation of the replica profile, (b) quadratic curve fitting.
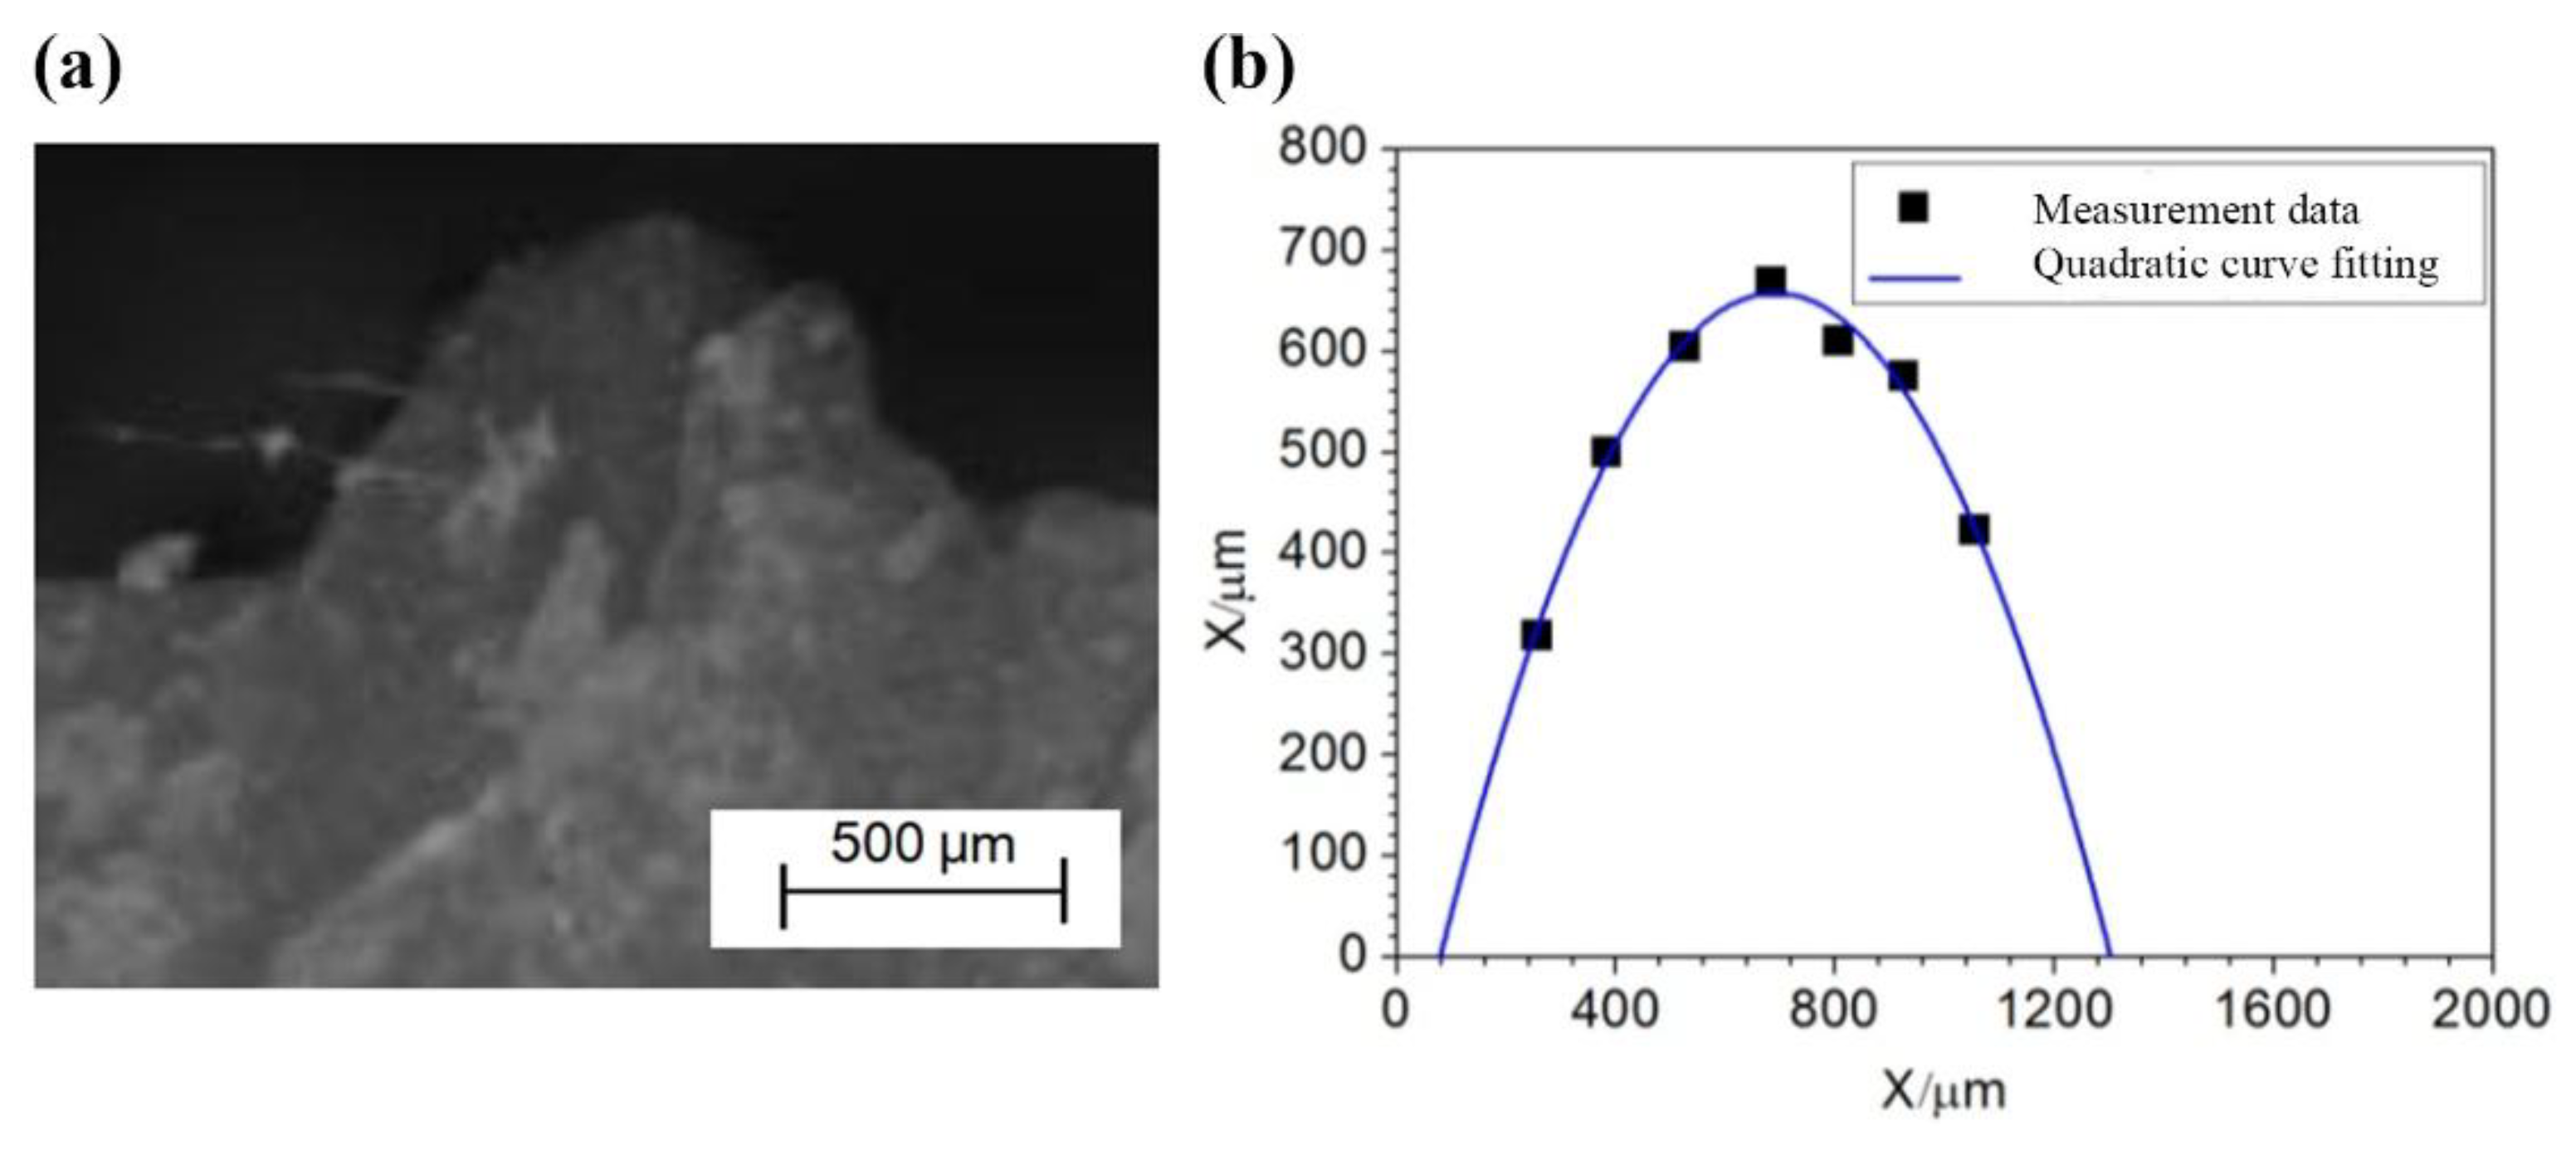
Figure 9.
2nd round deepened notch on Axle H82-6217: (a) side-view optical observation of the notch, (b) notch replica profile, (b) measurement of the notch depth, and (c) quadratic curve fitting.
Figure 9.
2nd round deepened notch on Axle H82-6217: (a) side-view optical observation of the notch, (b) notch replica profile, (b) measurement of the notch depth, and (c) quadratic curve fitting.
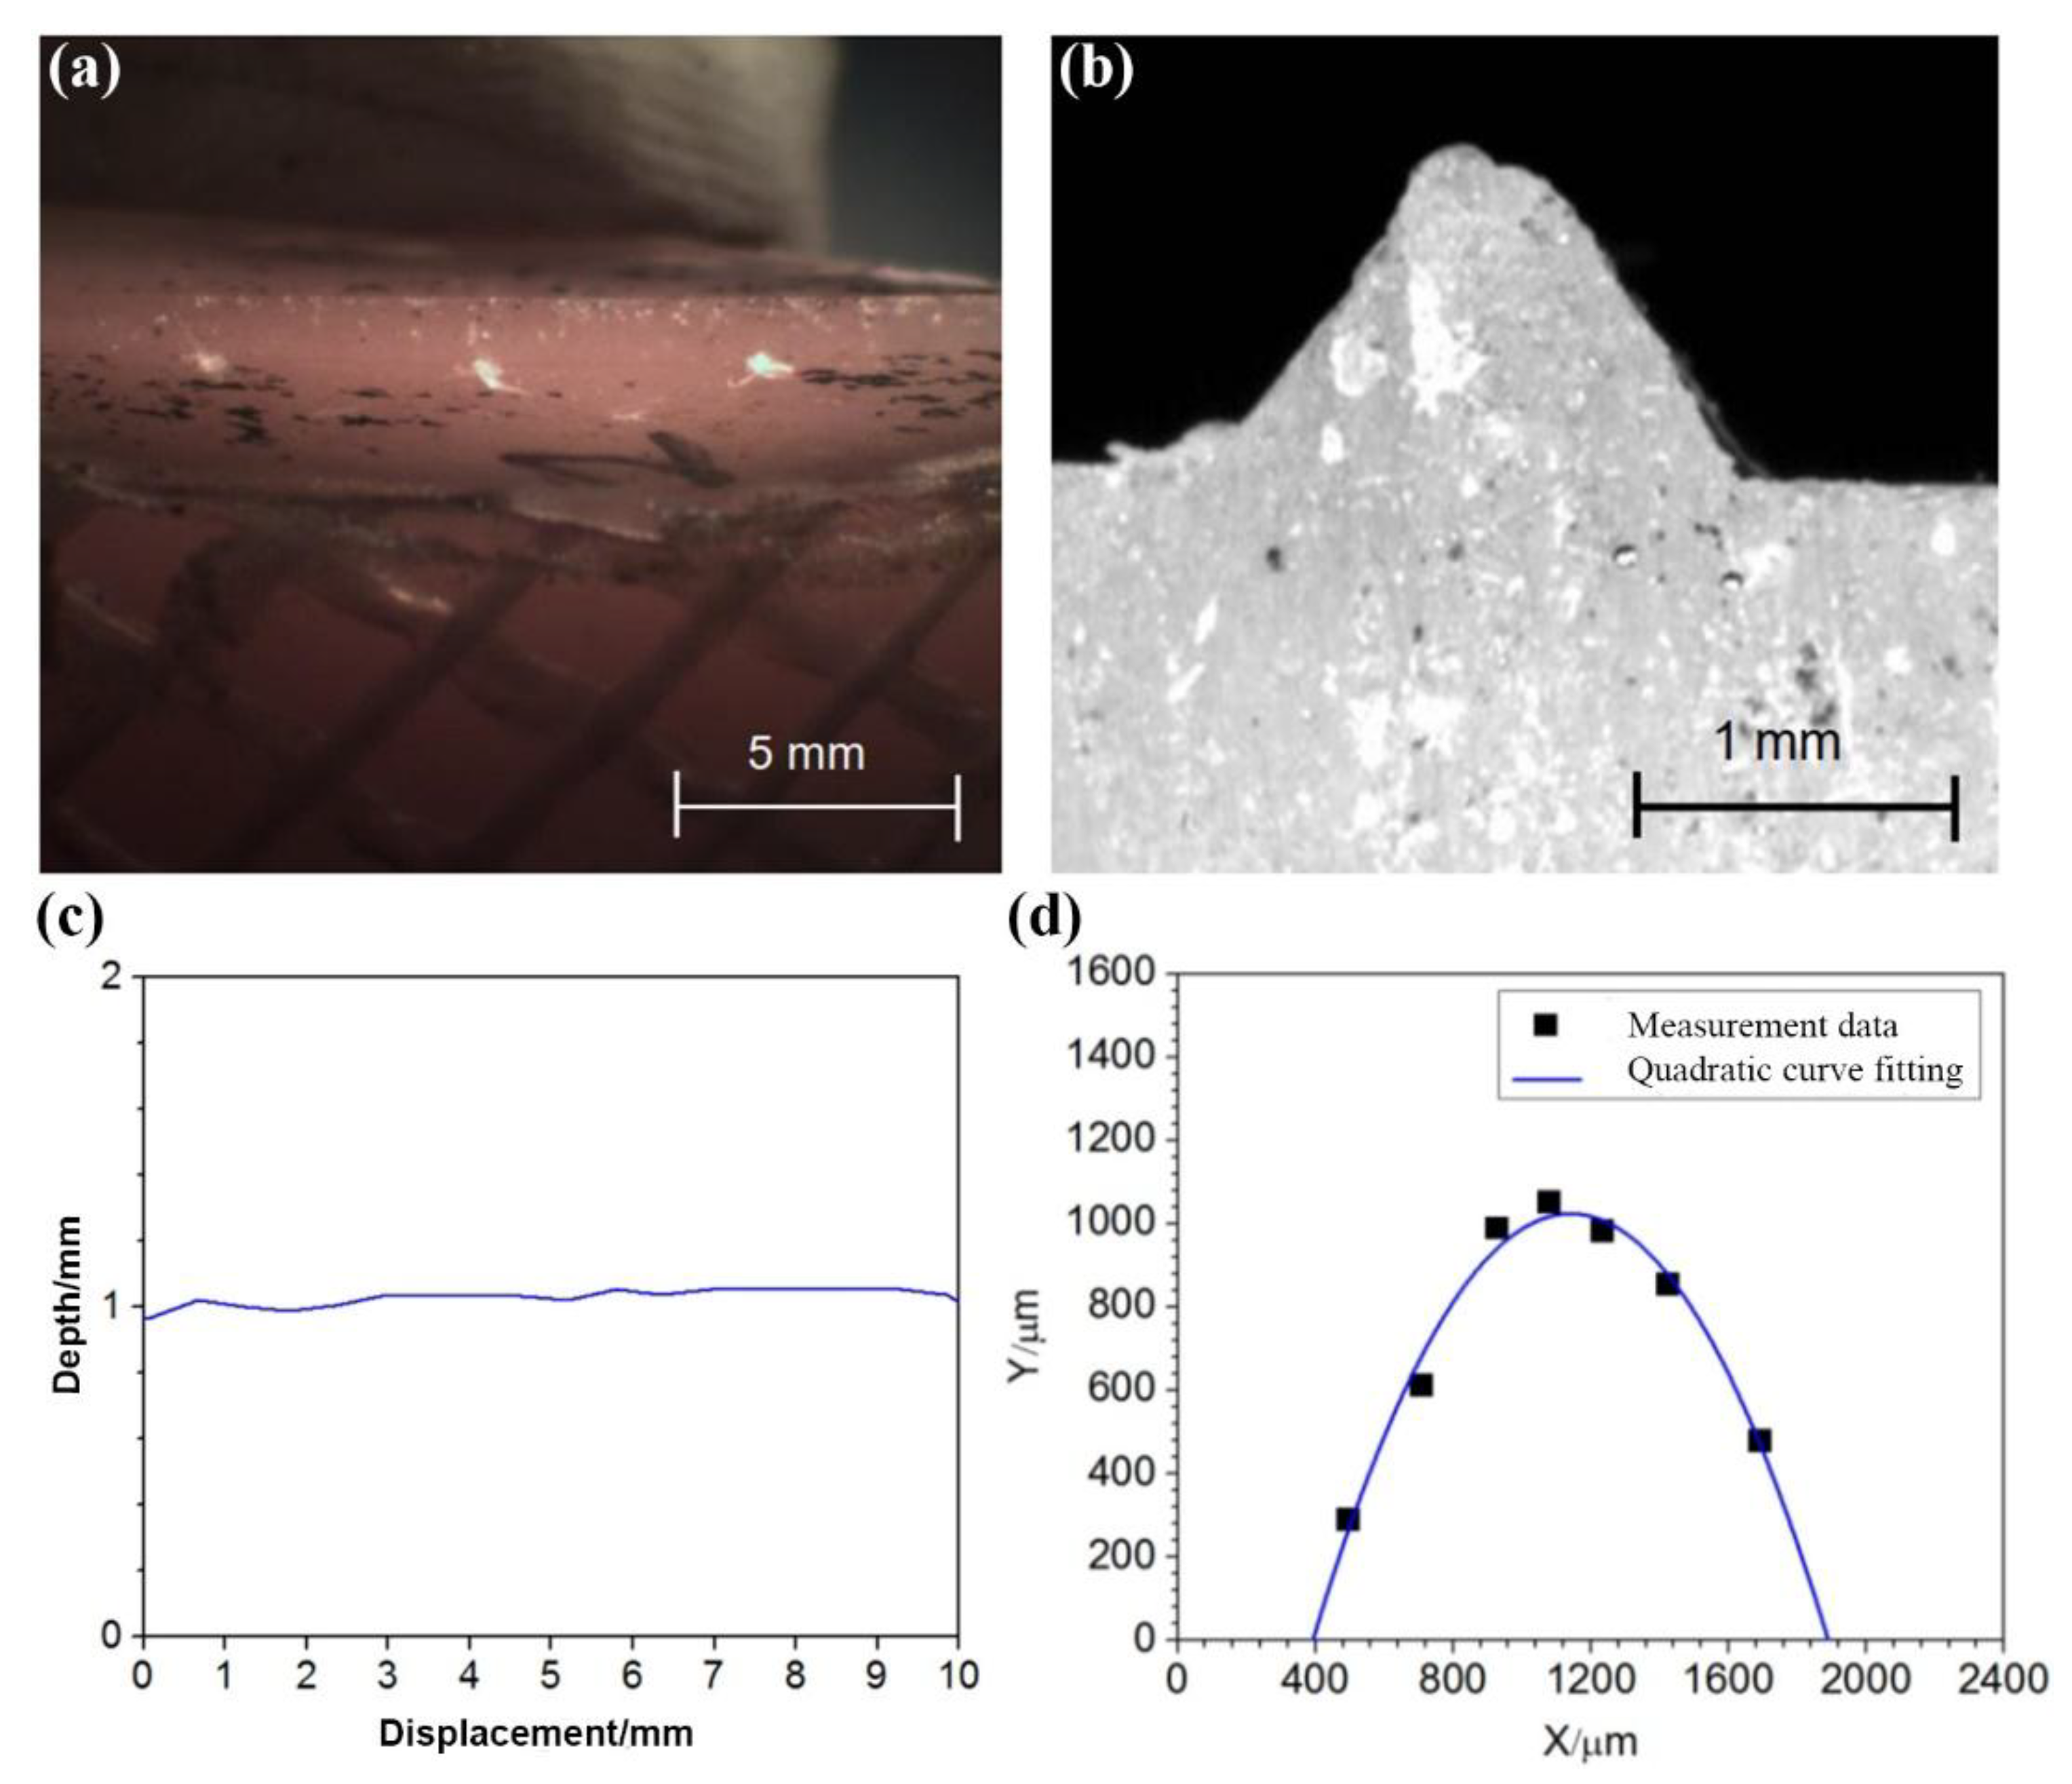
Figure 10.
3rd round deepened notch on Axle H31-6201: (a) side-view optical observation of the notch, (b) notch replica profile, (b) measurement of the notch depth, and (c) quadratic curve fitting.
Figure 10.
3rd round deepened notch on Axle H31-6201: (a) side-view optical observation of the notch, (b) notch replica profile, (b) measurement of the notch depth, and (c) quadratic curve fitting.
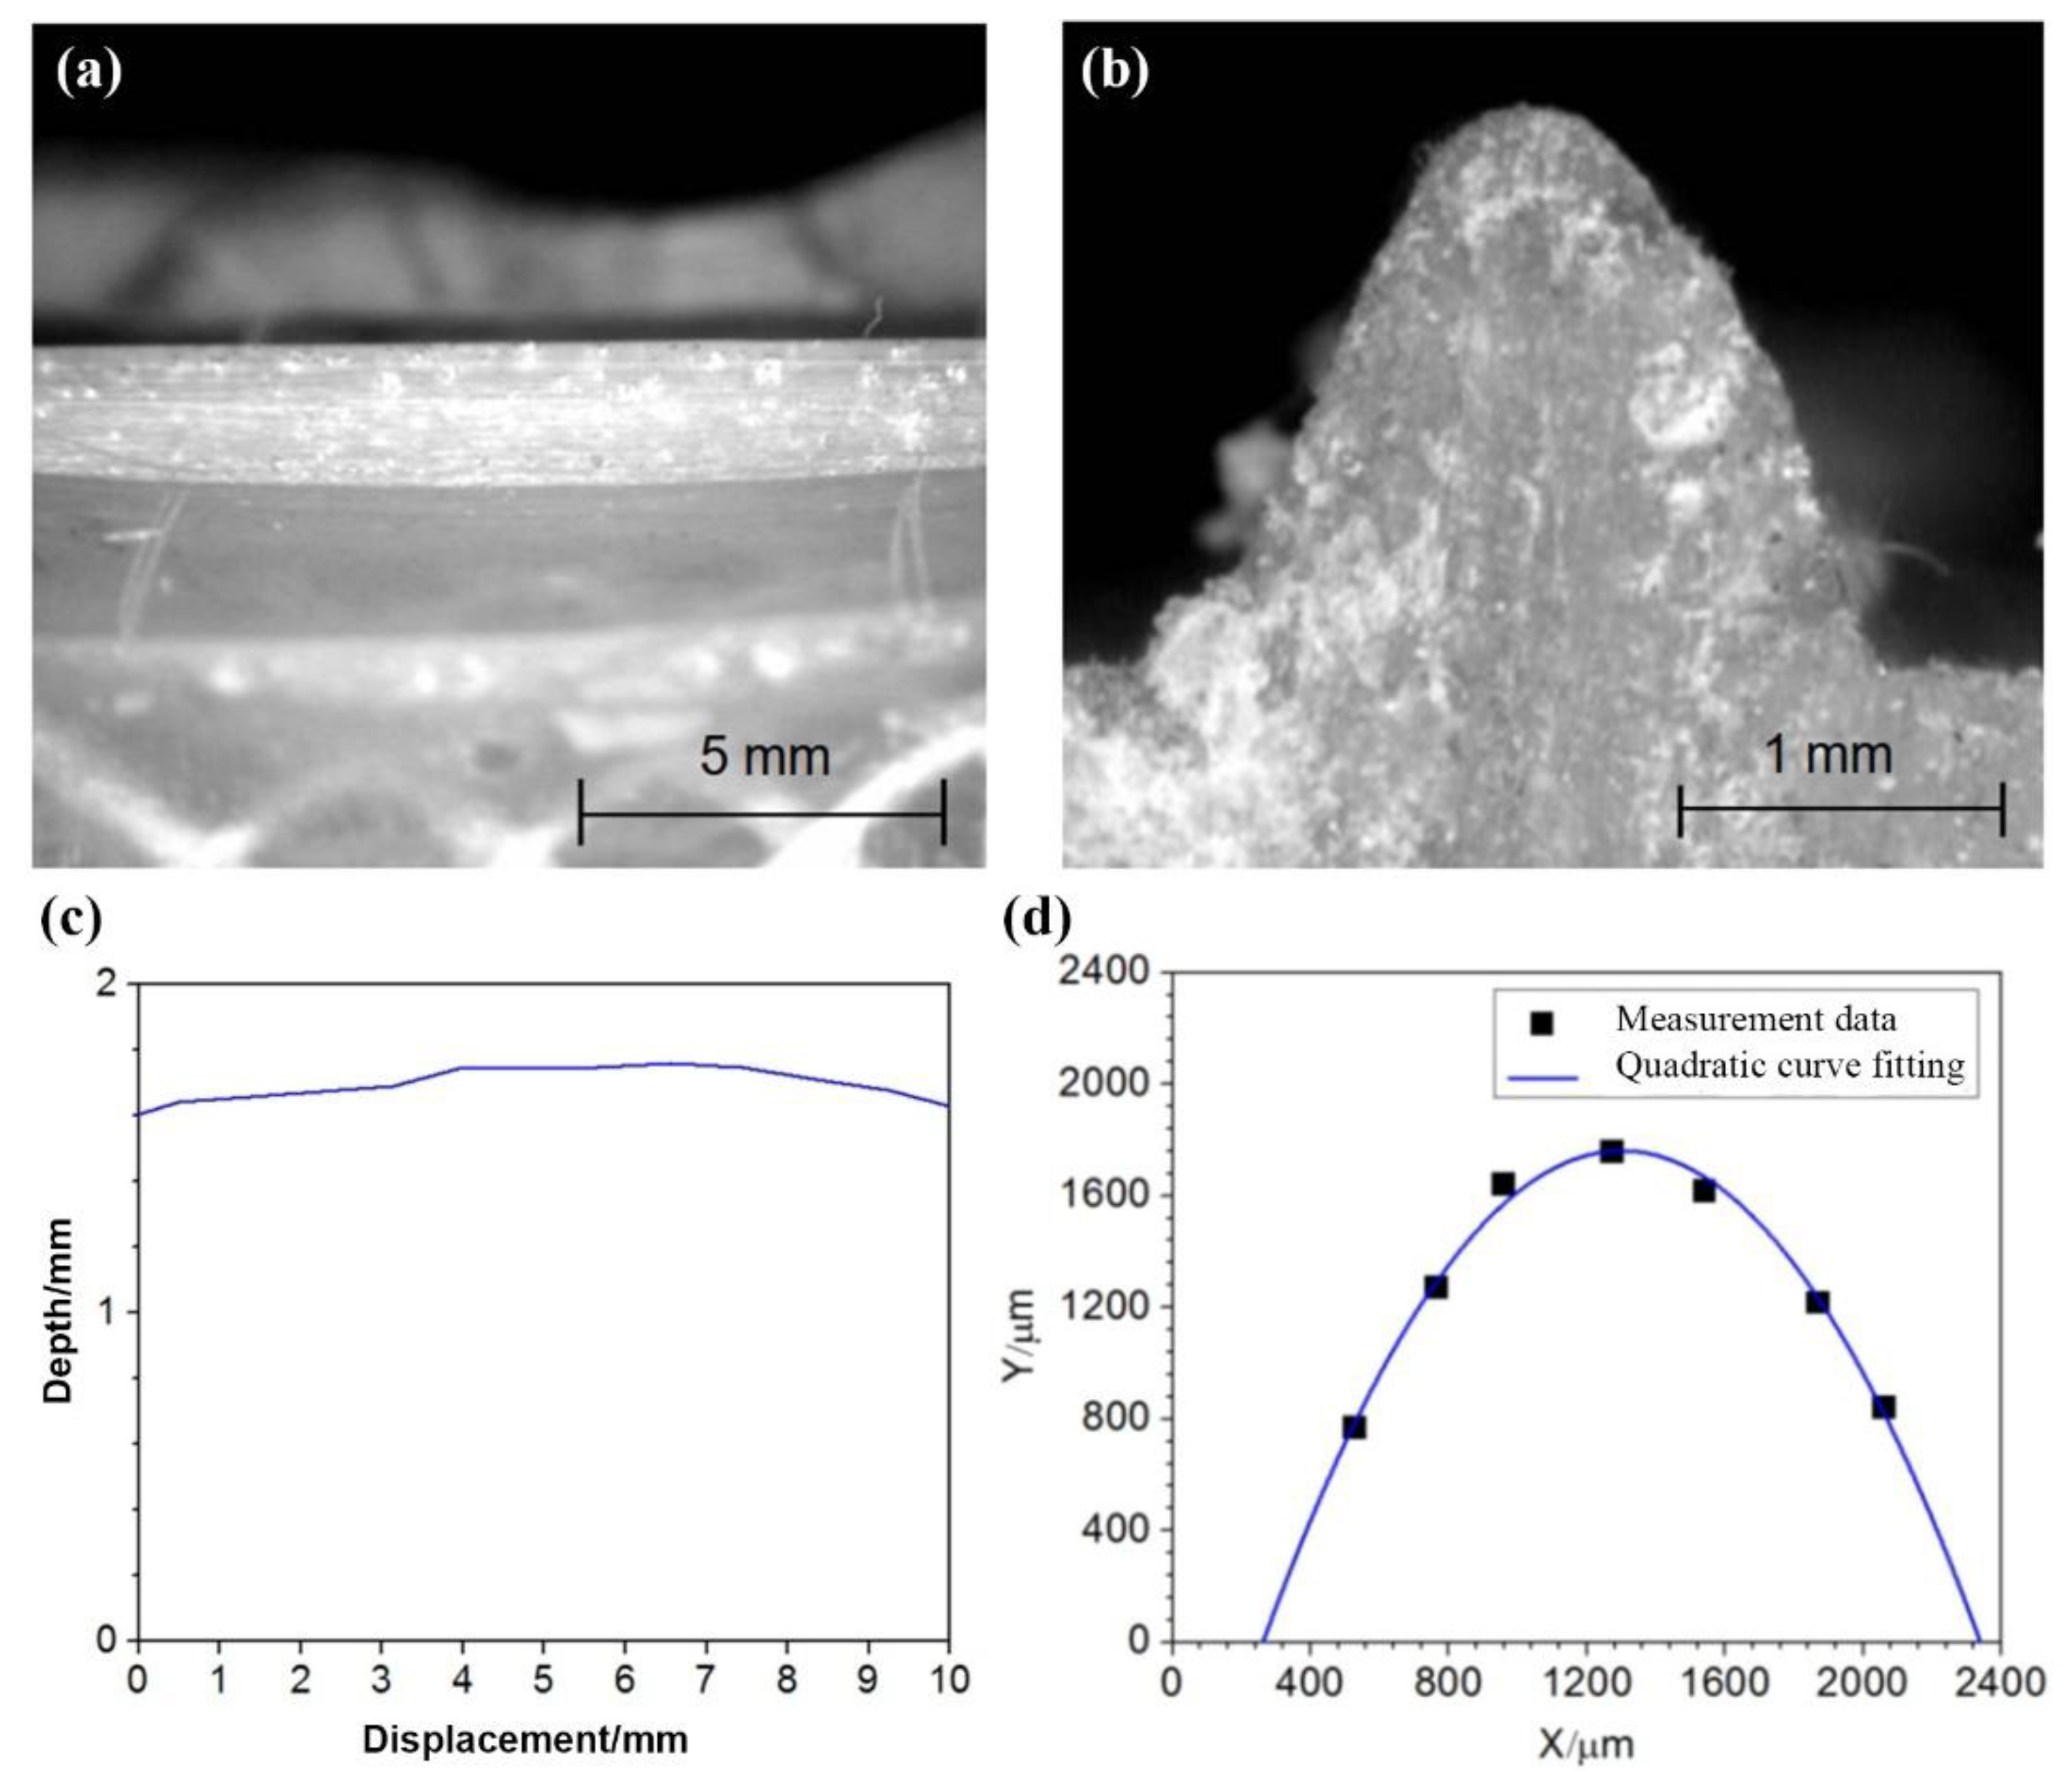
Figure 11.
Distribution and cumulative probability of various geometric parameters for scratch defects: (a) depth distribution, (b) depth cumulative probability distribution, (c) width distribution, (d) width cumulative probability distribution, (e) depth-to-width ratio distribution, (f) depth-to-width ratio cumulative probability distribution, (g) tip curvature distribution, and (h) tip curvature cumulative probability distribution.
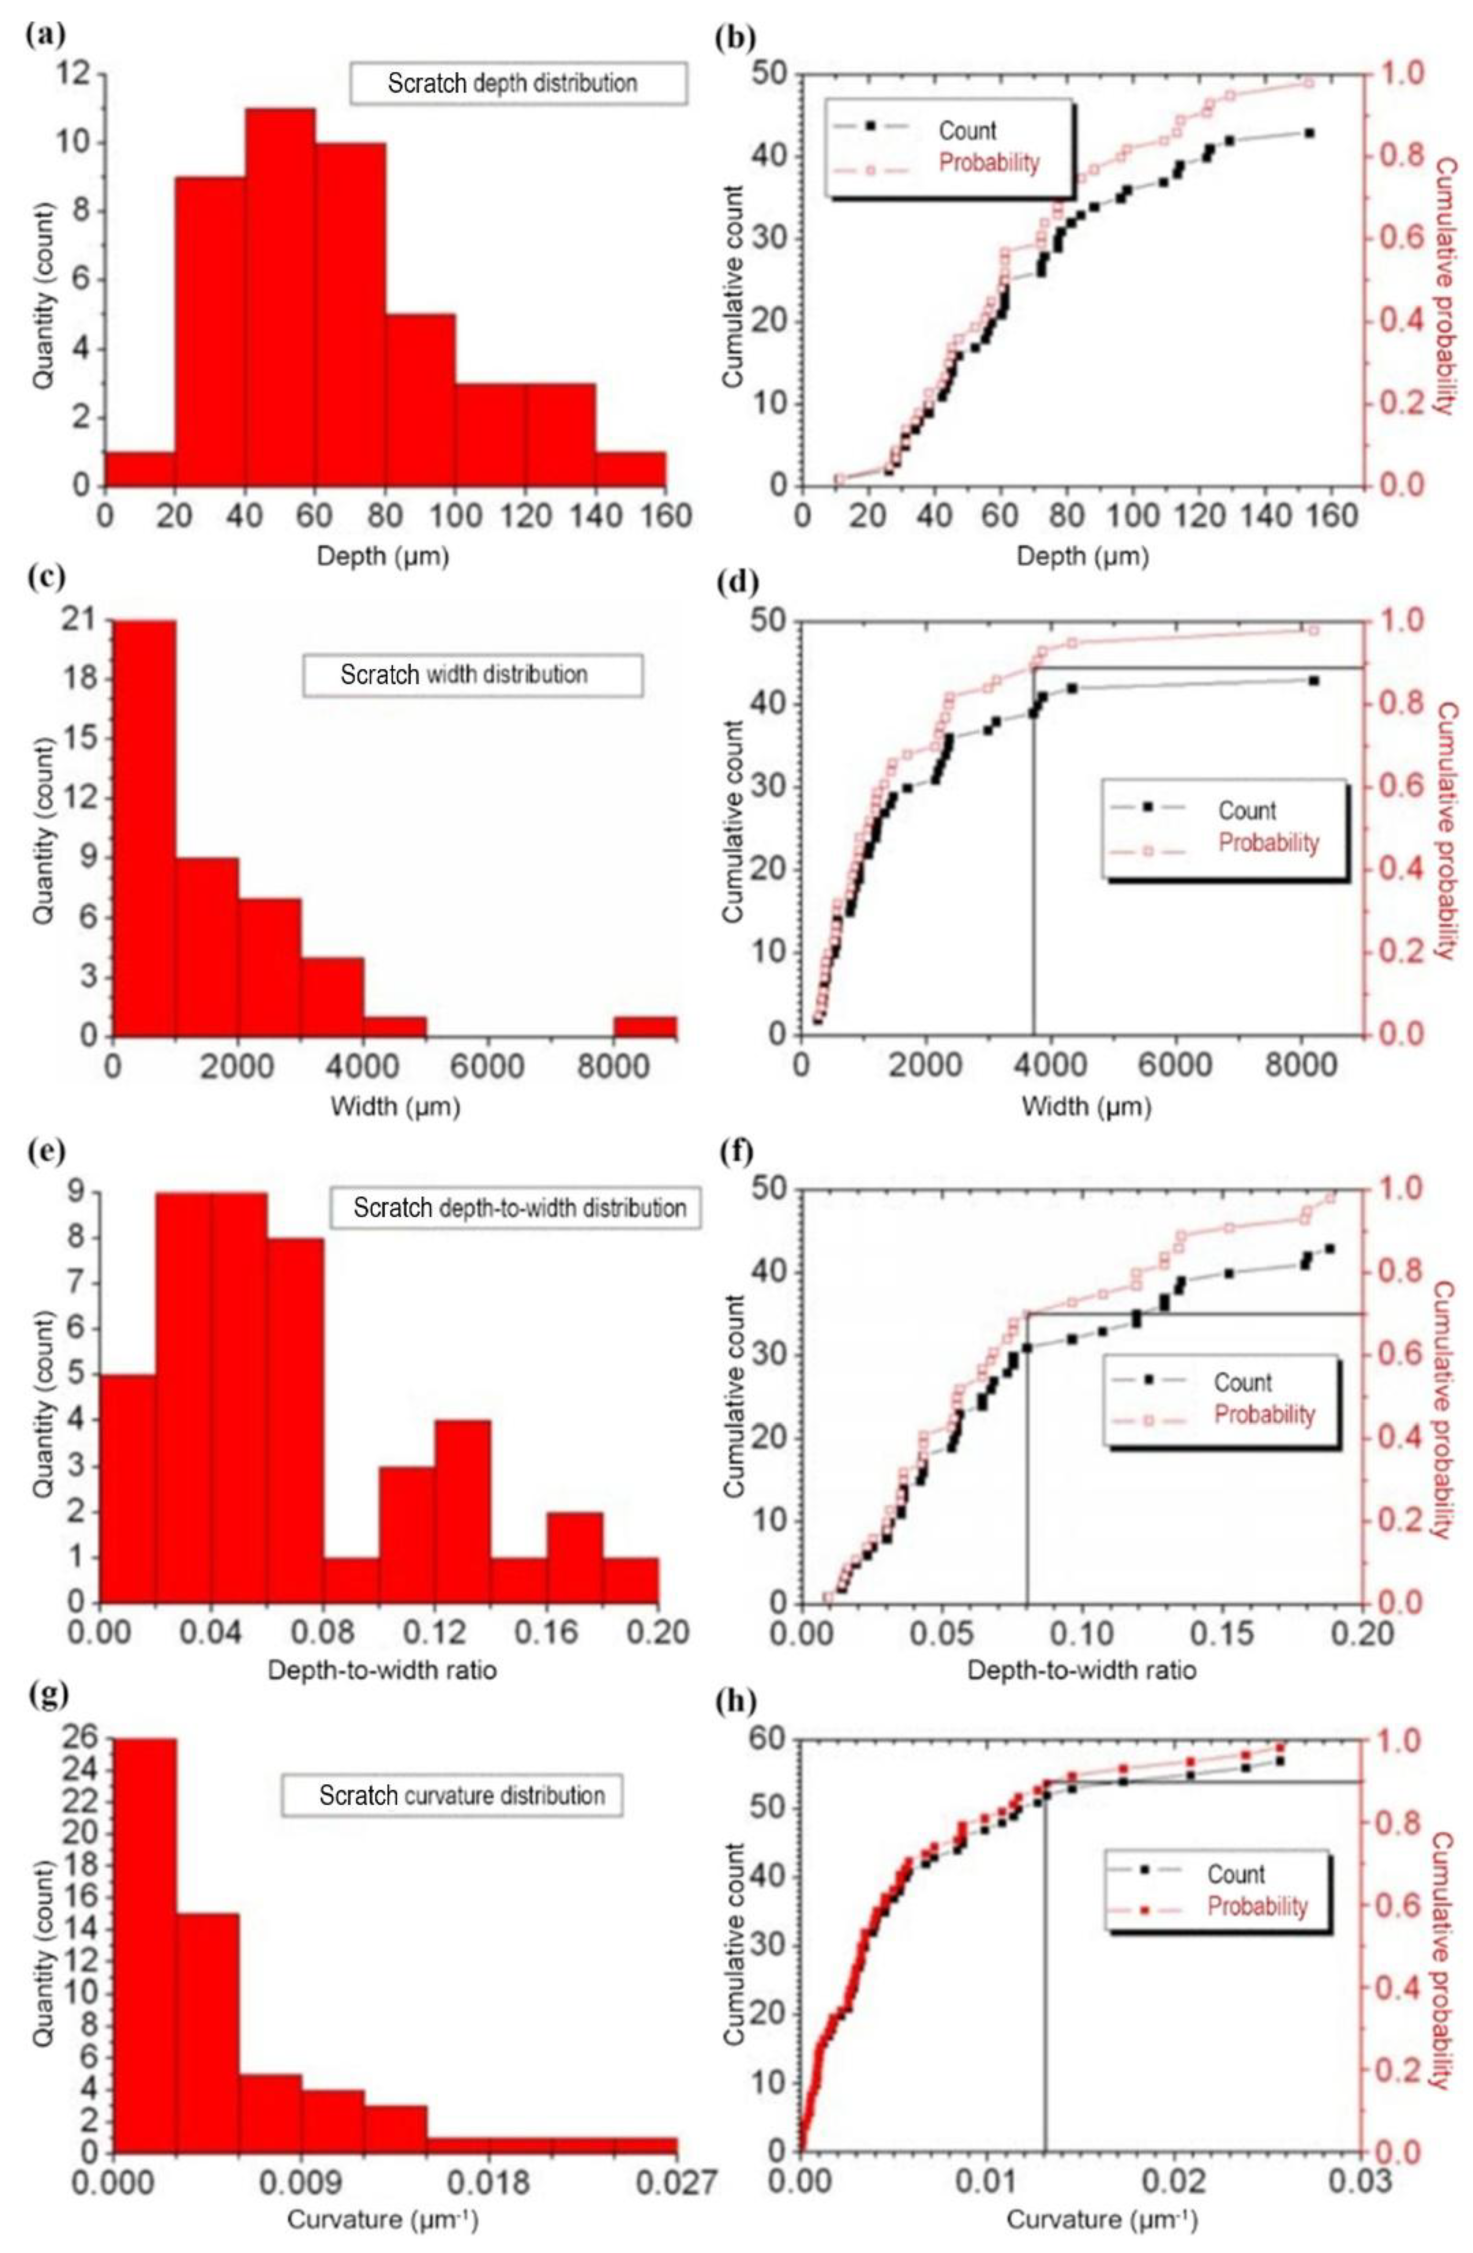
Figure 12.
Distribution and cumulative probability of various geometric parameters for impact damage defects: (a) depth distribution, (b) depth cumulative probability distribution, (c) width distribution, (d) width cumulative probability distribution, (e) depth-to-width ratio distribution, (f) depth-to-width ratio cumulative probability distribution, (g) tip curvature distribution, and (h) tip curvature cumulative probability distribution.
Disclaimer/Publisher’s Note: The statements, opinions and data contained in all publications are solely those of the individual author(s) and contributor(s) and not of MDPI and/or the editor(s). MDPI and/or the editor(s) disclaim responsibility for any injury to people or property resulting from any ideas, methods, instructions or products referred to in the content. |
© 2025 by the authors. Licensee MDPI, Basel, Switzerland. This article is an open access article distributed under the terms and conditions of the Creative Commons Attribution (CC BY) license (http://creativecommons.org/licenses/by/4.0/).
Copyright: This open access article is published under a Creative Commons CC BY 4.0 license, which permit the free download, distribution, and reuse, provided that the author and preprint are cited in any reuse.


