Submitted:
19 June 2025
Posted:
23 June 2025
You are already at the latest version
Abstract
This paper presents an experimental investigation on fatigue crack propagation in the surface hardened layer of high-speed train axles made of S38C steel. Three-point bending specimens were extracted from CRH2 EMU axles, with the hardened surface layer (0–2 mm depth) and core matrix (beyond 6 mm) characterized via microstructure and microhardness analysis. Fatigue tests were conducted using a PLG100 machine, monitoring crack growth under stress ratio R = 0.1. Results show that the hardened layer exhibits lower fatigue crack growth rate (da/dN) than the transition layer (2–6 mm) and core matrix. The da/dN-ΔK relationships were fitted following Paris Law, revealing the hardened layer’s higher resistance to crack propagation, attributed to its tempered martensite microstructure. This study provides insights into how gradient microstructures affect fatigue behavior in axle materials.
Keywords:
fatigue crack propagation
; three-point bending
; crack measurement
; fractography
; high-speed train axle
; surface hardening
1. Introduction
High-speed railways have emerged as a cornerstone of modern sustainable transportation, with over 80,000 km of high-speed tracks operational worldwide by 2025 [1,2]. The reliability of key components like axles is critical, as fatigue failure in their surface-hardened layers poses significant safety risks [3,4,5]. Axles endure cyclic loading exceeding 108 cycles during their service life, necessitating investigations into very high cycle fatigue (VHCF) behavior which is defined as fatigue failure beyond 107 cycles [6,7,8,9,10,11,12,13,14]. Traditional studies [15,16,17,18,19,20,21] on fatigue crack propagation (FCP) often focus on low-to-high cycle regimes, leaving a knowledge gap in VHCF mechanisms for gradient microstructures [22,23,24,25] in hardened layers.
The surface-hardened layer of axles [26,27,28,29,30,31], typically composed of tempered martensite (0–2 mm depth), transitions to pearlite-ferrite mixtures in the core region [23,32,33,34,35]. This gradient microstructure, induced by induction heating, enhances wear [36,37,38] and fatigue resistance [39,40,41,42,43]. However, in VHCF regimes, crack initiation from sub-surface inclusions or microstructural defects becomes prevalent, differing from high-cycle fatigue (HCF) failure modes [44,45,46,47]. For instance, Pan et al. [48,49] observed that in titanium alloys, VHCF cracks initiate from nanograin formations near inclusion-matrix interfaces, while core materials exhibit faster crack growth rates. Such findings highlight the need to link microstructural gradients with VHCF performance in axle steels.
Additive manufacturing (AM), particularly laser-based powder bed fusion, has revolutionized material design by enabling tailored gradient microstructures [50,51,52,53,54,55,56]. Unlike conventional induction hardening, AM allows precise control over hardness [57,58] and phase distributions, potentially optimizing fatigue resistance [59]. In axle steels, AM could mitigate stress concentrations by integrating gradient layers with tailored hardness profiles, though its application in large-scale components like axles remains underexplored.
Current research on axle fatigue primarily relies on conventional testing methods, overlooking the synergistic effects of microstructural gradients and VHCF. Studies by Zhang et al. [23] revealed that in S38C steel, the hardened layer’s tempered martensite delays crack propagation, but the transition layer (2–6 mm) exhibits scatter in fatigue crack growth rate (da/dN) due to mixed microstructures. Meanwhile, AM-induced gradients in AlSi10Mg show reduced da/dN in VHCF, attributed to nanograin formation at crack tips [45]. These insights suggest that combining surface hardening with AM could enhance axle durability, yet experimental data on such hybrid approaches remain scarce.
This study addresses these gaps by investigating FCP in induction-hardened S38C axle steel under VHCF conditions (up to 108 cycles). Three-point bending specimens with gradient microstructures (hardened layer, transition layer, core) were tested to characterize da/dN and stress intensity factor range (ΔK) relationships. By integrating findings from VHCF research on gradient materials [23,25,45] and AM’s potential for microstructure tailoring [60], this work aims to: (1) establish da/dN-ΔK models for different depth zones; (2) compare fatigue resistance between induction-hardened and conceptually AM-optimized microstructures; (3) provide guidelines for improving axle longevity via microstructure design. The results bridge the gap between conventional surface hardening and emerging AM technologies in VHCF-resistant component design.
2. Materials and Methods
2.1. Specimen Design and Fabrication
The axle involved in this research belongs to the CRH2 EMU series (Japanese type), with its base material being S38C steel, as illustrated in Figure 1. The surface of this axle undergoes induction heating, quenching, and low-temperature tempering (induction heating frequency of 3 kHz, heated to 880–900°C followed by water cooling and tempering at 200°C), resulting in a hardened surface layer while maintaining a normalized structure in the core. The surface layer of the axle consists of tempered martensite with a depth of approximately 2 mm. From 2 mm to around 6 mm beneath the surface, there exists a transition layer characterized by a mixture of quenched-tempered microstructure and pearlite-ferrite phases, with an increasing presence of pearlite and ferrite as the depth increases. Beyond 6 mm from the surface, the microstructure predominantly consists of a pearlite-ferrite mixture, indicating a normalized state. The Vickers microhardness within the first 2 mm of the surface layer is approximately 551 ± 36 HV Beyond 2 mm, the microhardness significantly decreases, reaching around 230 HV at a depth of 6 mm, which is close to the hardness of the core material. Beyond 8 mm, the hardness fluctuates slightly within a narrow range, averaging 200 HV representative of the normalized microstructure of the core.
To acquire the fatigue crack growth characteristics of the axle material containing a hardened surface layer, the specimens were designed as three-point bending samples, following the standard specimen dimensions outlined in GB/T4161-2007. The actual dimensions used for the specimens were: 150 mm in length (span of 120 mm), 15 mm in width, and 30 mm in height, as shown in Figure 2a. The tension side of the specimen represents the axle surface, i.e., the hardened surface layer, and a 0.5 mm deep notch was pre-machined at the center of the tension side using CNC wire cutting technology to facilitate crack initiation and growth. Based on the principles of three-point bending beams, the nominal stress on the tensile side surface of the specimen can be calculated as follows:
where σ represents the nominal stress at the notch, P is the applied load, w is the specimen width, h is the specimen height, and x is the half-span length.
Two axle segments were provided, each with a height of 170 mm, extracted from the middle section of the actual trailer axle. Based on the designed specimen shape and dimensions, the cutting scheme was established as shown in Figure 2b. A total of 24 three-point bending specimens were evenly distributed and cut from the surface layer along the circumferential direction of the axle segment. To ensure precision during specimen cutting, the axle’s central axis was meticulously measured, and the axle segments were mounted on the cutting machine to ensure that the wire cutting process was perfectly aligned with the axle’s axis.
The front and back surfaces (30 mm × 150 mm) of the extracted three-point bending specimens were ground using a surface grinder, with the surface roughness controlled to Ra = 0.4 μm. The two support points on the surface layer of the specimen (i.e., the support surface or the tensile surface) were also ground to ensure stable support during loading. The middle region of the side surface of the processed specimens was sequentially polished with 400 grit, 800 grit, 1000 grit, 1500 grit, and 2000 grit sandpapers, followed by further polishing with 1.0 μm diamond paste. The actual width and height of the processed and polished specimens were measured by digital calipers. The actual dimensions of the 6 specimens used in this research are listed in Table 1.
2.2. Testing Method and Devices
These specimens provide the opportunity to investigate and analyze the fatigue crack growth characteristics of the hardened surface layer of the axle, which exhibits variations in microstructure and mechanical properties across different depths. A PLG100 high-frequency fatigue testing machine, as shown in Figure 3a, was employed to perform three-point bending fatigue loading on the specimens, with a stress ratio R of 0.1. An optical imaging and data acquisition system, as shown in Figure 3b, was used to observe the notched region on the side surface of the three-point bending specimens. Once crack initiation occurred, the propagation of the crack was tracked continuously. The fatigue loading was paused at specific intervals to photograph the crack, and then loading was resumed. Subsequently, image processing software was used to measure the crack length corresponding to each loading cycle. By analysis and calculation, the relationships among crack length, fatigue crack growth rate, and stress intensity factor were established. For the specimens that reached the termination criteria of the experiment, low-temperature brittle fracture was induced, and the fracture surfaces were photographed using a stereomicroscope. Further analysis of the fracture surfaces was conducted with SEM. The stress intensity factor range ΔK for the crack body in the three-point bending specimens can be calculated using the following equation:
where Δσ is the nominal stress amplitude corresponding to the applied load, a is the crack length, and b is the specimen height.
The fatigue crack growth rate (da/dN) is calculated using the differential method, expressed as follows:
The testing was conducted in several steps. After installing the specimen and the optical observation equipment, the fatigue experiment is initiated. Once a fatigue crack appears and propagates to a certain length, the fatigue loading is paused to photograph the crack. If the crack does not propagate after 106 cycles at a given length, the applied stress is increased (minimum 5 MPa, maximum 20 MPa), and observations are continued. The process is repeated until the crack length exceeds 13 mm or the fatigue testing machine fails to maintain vibration. Then, the captured images are stitched together using image processing software. The crack length on the surface is measured using specialized software. After completing the fatigue experiment, the specimens are rapidly fractured in a liquid nitrogen environment. The fracture surfaces are photographed using a stereomicroscope. Five evenly spaced measurement points are selected perpendicular to the crack propagation direction to measure the distance from the specimen surface to the crack trace at different cycle numbers. The crack growth length is obtained through this measurement, and the crack length observed on the surface is corrected using linear interpolation, as illustrated in Figure 4. Finally, the relationships among crack length, fatigue crack growth rate, and stress intensity factor range are obtained through calculation.
3. Results
3.1. a–N Data and Fractography
Fatigue crack growth experiments were conducted on the six three-point bending specimens listed in Table 1. For each specimen, the crack length, along with the corresponding applied load and loading cycles, was recorded at various stages of crack propagation after initiation.
Figure 5 displays the results for Specimen 1, including six optical micrographs showing the crack initiation and its progression towards fracture at different stages. Figure 6 presents the observed results of crack growth length versus the number of loading cycles for the 6 specimens, namely the a–N data plots. Figure 7 shows the corresponding fractographic observations for the six specimens, each illustrating microstructure and morphology of the fracture surface optically.
3.2. da/dN and ΔK Data
The fatigue crack growth experiments yielded the crack growth rate da/dN and the stress intensity factor range ΔK at various stages of crack propagation for each specimen. Due to the gradient variation in the microstructure of the hardened surface layer, da/dN differs at various positions within the hardened layer and the transition layer. Therefore, this research presents experimental results correlating da/dN, ΔK, and the distance of the crack tip from the surface X. Figure 8 illustrates the relationship among da/dN, ΔK, and X for the 6 specimens.
4. Discussion
4.1. Summary and Analysis of da/dN and ΔK Data
The data for the six specimens are consolidated and comprehensively represented in Figure 9. Figure 9a shows the summarized relationship as a da/dN–X–ΔK surface plot and Figure 9b presents the summarized data in a da/dN–ΔK–X plot. From Figure 9, as well as the original data in Figure 8, it is evident that da/dN tends to increase with the rise of both ΔK and X.
4.2. da/dN and ΔK in Multiple Depth Ranges
Evidently, materials with different microstructures exhibit varying mechanical properties, which, in turn, influence their fatigue crack growth rates. The three-point bending specimens used in the experiment were directly extracted from the actual axle, with the tensile side representing the hardened surface layer of the axle. The surface layer can be divided into three distinct regions based on microstructural characteristics. The region in the depth range of 0–2 mm constitutes the quenched-tempered microstructure of the hardened surface layer. Between 2–6 mm, it’s the transition layer, which consists of a mixture of quenched-tempered structures and pearlite-ferrite phases. Beyond 6 mm, it corresponds to the core matrix, characterized by a normalized structure. Therefore, the experimental data of da/dN, ΔK, and X are grouped into three specific intervals: 0–2 mm, 2–6 mm, and 6–15 mm, as shown in Figure 10.
Figure 10a illustrates da/dN as a function of ΔK within the 0–2 mm depth range from the specimen surface. Based on the data points presented in Figure 10a, the relationship between da/dN and ΔK follows the Paris Law, which is expressed as:
A fitting procedure can be performed to establish the relationship between da/dN and ΔK, and the parameters C and m can be obtained as follows:
The corresponding linear correlation coefficient r is 0.691, and the standard deviation δ is 0.79. Thus, Equation (6) can be rewritten as:
where da/dN is in unit of m/cycle, and ΔK is in unit of MPa⋅m1/2.
Figure 10b illustrates the variation in da/dN with ΔK within the 2–6 mm depth range from the specimen surface, which corresponds to the transition layer of the actual axle surface. It can be observed that da/dN exhibits significant scatter. To better analyze the data, the results shown in Figure 10b are further divided into two subregions: 2–4 mm (marked in black) and 4–6 mm (marked in red). The data reveal that the region closer to the surface (2–4 mm) exhibits relatively higher fatigue crack growth resistance compared to the deeper region (4–6 mm).
Figure 10c shows da/dN versus ΔK within the 6–15 mm depth range, corresponding to the core matrix microstructure of the axle. Based on the data points from Figure 10c, a fitting process following the Paris Law yields the relationship as:
The corresponding linear correlation coefficient r is 0.696, and the standard deviation δ is 0.68, which turns Equation (8) into:
where da/dN is in unit of m/cycle, and ΔK is in unit of MPa⋅m1/2.
By comparing Figure 10a with Figure 10b,c, and correspondingly comparing Equation (7) with Equation (9), it is evident that within ΔK of 10–40 MPa·m1/2, da/dN in the hardened surface layer of the actual axle is relatively slower than that in the transition layer and the core matrix. This observation indicates that the hardened surface layer of the axle possesses a relatively higher resistance to fatigue crack growth, effectively impeding crack propagation under equivalent stress intensity factor conditions.
5. Conclusions
In this paper, an experimental investigation was performed on the fatigue crack growth behavior of an axle steel that contains a hardened surface layer with gradient microstructure. The main conclusions are summarized as follows:
- (1)
- Three-point bending specimens were extracted from the actual S38C axle, with the tensile side representing the hardened surface layer of the axle. Through three-point bending fatigue loading combined with crack length monitoring, the fatigue crack growth characteristics of the axle’s surface material, which features a gradient in hardness, were effectively captured. The experimental results reveal the relationship between the fatigue crack growth rate and the stress intensity factor range across three distinct microstructural regions of the axle material: the hardened surface layer (0–2 mm), the transition layer (2–6 mm), and the core matrix (beyond 6 mm). This stratification allows for a comprehensive understanding of how the material’s microstructural gradient influences fatigue crack propagation under cyclic loading conditions.
- (2)
- In the hardened surface layer of the axle, within the depth range of 0–2 mm from the surface, the relationship between da/dN and ΔK is represented by the following expression:where da/dN is in unit of m/cycle, and ΔK is in unit of MPa⋅m1/2.
- (3)
- In the core matrix of the axle, specifically within the depth range of 6–15 mm from the surface, the relationship between da/dN and ΔK is represented by the following expression:where da/dN is in unit of m/cycle, and ΔK is in unit of MPa⋅m1/2.
- (4)
- The comprehensive comparison indicates that the hardened surface layer of the axle exhibits significantly higher resistance to fatigue crack growth compared to both the transition layer and the core matrix.
Data Availability Statement
Data will be made available on reasonable request.
Conflicts of Interest
The authors declare no conflicts of interest.
References
- Glossary: High-speed rail. Available online: https://ec.europa.eu/eurostat/statistics-explained/index.php?title=Glossary:High-speed_rail (accessed on 6 April 2025).
- High-speed rail. Available online: https://en.wikipedia.org/wiki/High-speed_rail (accessed on 6 April 2025).
- Ollivier, G.; Bullock, R.; Jin, Y.; Zhou, N. High-Speed Railways in China: A Look at Traffic; World bank: Washington, DC, USA, 2014. [Google Scholar]
- Zerbst, U.; Klinger, C.; Klingbeil, D. Structural assessment of railway axles—A critical review. Eng. Fail. Anal. 2013, 35, 54–65. [Google Scholar] [CrossRef]
- Tong, Y.Y.; Liu, G.X.; Yousefian, K.; Jing, G.Q. Track Vertical Stiffness -Value, Measurement Methods, Effective Parameters and Challenges: A review. Transp. Geotech. 2022, 37, 100833. [Google Scholar] [CrossRef]
- Pan, X.; Su, H.; Sun, C.; Hong, Y. The behavior of crack initiation and early growth in high-cycle and very-high-cycle fatigue regimes for a titanium alloy. Int. J. Fatigue 2018, 115, 67–78. [Google Scholar] [CrossRef]
- Sun, C.; Song, Q.; Zhou, L.; Pan, X. Characteristic of interior crack initiation and early growth for high cycle and very high cycle fatigue of a martensitic stainless steel. Mater. Sci. Eng. A 2019, 758, 112–120. [Google Scholar] [CrossRef]
- Pan, X.; Hong, Y. High-cycle and very-high-cycle fatigue behaviour of a titanium alloy with equiaxed microstructure under different mean stresses. Fatigue Fract. Eng. Mater. Struct. 2019, 42, 1950–1964. [Google Scholar] [CrossRef]
- Chang, Y.; Zheng, L.; Pan, X.; Hong, Y. Further investigation on microstructure refinement of internal crack initiation region in VHCF regime of high-strength steels. Frattura ed Integrità Strutturale 2019, 13, 1–11. [Google Scholar] [CrossRef]
- Pan, X.; Xu, S.; Qian, G.; Nikitin, A.; Shanyavskiy, A.; Palin-Luc, T.; Hong, Y. The mechanism of internal fatigue-crack initiation and early growth in a titanium alloy with lamellar and equiaxed microstructure. Mater. Sci. Eng. A 2020, 798, 140110. [Google Scholar] [CrossRef]
- Chang, Y.; Pan, X.; Zheng, L.; Hong, Y. Microstructure refinement and grain size distribution in crack initiation region of very-high-cycle fatigue regime for high-strength alloys. Int. J. Fatigue 2020, 134, 105473. [Google Scholar] [CrossRef]
- Cong, T.; Qian, G.; Zhang, G.; Wu, S.; Pan, X.; Du, L.; Liu, X. Effects of inclusion size and stress ratio on the very-high-cycle fatigue behavior of pearlitic steel. Int. J. Fatigue 2021, 142, 105958. [Google Scholar] [CrossRef]
- Pan, X.; Su, H.; Liu, X.; Hong, Y. Multi-scale fatigue failure features of titanium alloys with equiaxed or bimodal microstructures from low-cycle to very-high-cycle loading numbers. Mater. Sci. Eng. A 2024, 890, 145906. [Google Scholar] [CrossRef]
- Pan, X.; Xu, S.; Nikitin, A.; Shanyavskiy, A.; Palin-Luc, T.; Hong, Y. Crack initiation induced nanograins and facets of a titanium alloy with lamellar and equiaxed microstructure in very-high-cycle fatigue. Mater. Lett. 2024, 357, 135769. [Google Scholar] [CrossRef]
- Weiss, V.; Lal, D.N. Threshold condition for fatigue crack-propagation. Metall. Trans. 1974, 5, 1946–1949. [Google Scholar] [CrossRef]
- Schijve, J. Fatigue of Structures and Materials, 2nd ed.; Springer: Dordrecht, Germany, 2009. [Google Scholar]
- Dowling, N.E. Mechanical Behavior of Materials: Engineering Methods for Deformation, Fracture, and Fatigue, 4th ed.; Pearson: Boston, MA, USA, 2013. [Google Scholar]
- Chen, Z.; Dai, Y.; Liu, Y. Crack propagation simulation and overload fatigue life prediction via enhanced physics-informed neural networks. Int. J. Fatigue 2024, 186, 108382. [Google Scholar] [CrossRef]
- Chen, Z.; Dai, Y.; Liu, Y. Structural fatigue crack propagation simulation and life prediction based on improved XFEM-VCCT. Eng. Fract. Mech. 2024, 310, 110519. [Google Scholar] [CrossRef]
- Mourad, A.H.I.; Sajith, S.; Shitole, S.; Almomani, A.; Khan, S.H.; Elsheikh, A.; Alzo’ubi, A.K. Fatigue life and crack growth prediction of metallic structures: A review. Structures 2025, 76, 109031. [Google Scholar] [CrossRef]
- Sangid, M.D. The physics of fatigue crack propagation. Int. J. Fatigue 2025, 197, 108928. [Google Scholar] [CrossRef]
- Meyers, M.A.; Mishra, A.; Benson, D.J. Mechanical properties of nanocrystalline materials. Prog. Mater. Sci. 2006, 51, 427–556. [Google Scholar] [CrossRef]
- Zhang, S.; Xie, J.; Jiang, Q.; Zhang, X.; Sun, C.; Hong, Y. Fatigue crack growth behavior in gradient microstructure of hardened surface layer for an axle steel. Mater. Sci. Eng. A 2017, 700, 66–74. [Google Scholar] [CrossRef]
- Lei, Y.B.; Wang, Z.B.; Xu, J.L.; Lu, K. Simultaneous enhancement of stress- and strain-controlled fatigue properties in 316L stainless steel with gradient nanostructure. Acta Mater. 2019, 168, 133–142. [Google Scholar] [CrossRef]
- Pan, X.; Qian, G.; Wu, S.; Fu, Y.; Hong, Y. Internal crack characteristics in very-high-cycle fatigue of a gradient structured titanium alloy. Sci. Rep. 2020, 10, 4742. [Google Scholar] [CrossRef]
- Garnham, J.E.; Davis, C.L. The role of deformed rail microstructure on rolling contact fatigue initiation. Wear 2008, 265, 1363–1372. [Google Scholar] [CrossRef]
- Klinger, C.; Bettge, D. Axle fracture of an ICE3 high speed train. Eng. Fail. Anal. 2013, 35, 66–81. [Google Scholar] [CrossRef]
- Fu, Z.K.; Ding, H.H.; Wang, W.J.; Liu, Q.Y.; Guo, J.; Zhu, M.H. Investigation on microstructure and wear characteristic of laser cladding Fe-based alloy on wheel/rail materials. Wear 2015, 330, 592–599. [Google Scholar] [CrossRef]
- Hassani-Gangaraj, S.M.; Carboni, M.; Guagliano, M. Finite element approach toward an advanced understanding of deep rolling induced residual stresses, and an application to railway axles. Mater. Design 2015, 83, 689–703. [Google Scholar] [CrossRef]
- Hu, Y.; Zhou, L.; Ding, H.H.; Lewis, R.; Liu, Q.Y.; Guo, J.; Wang, W.J. Microstructure evolution of railway pearlitic wheel steels under rolling-sliding contact loading. Tribol. Int. 2021, 154, 106685. [Google Scholar] [CrossRef]
- Unal, O.; Maleki, E.; Karademir, I.; Husem, F.; Efe, Y.; Das, T. Effects of conventional shot peening, severe shot peening, re-shot peening and precised grinding operations on fatigue performance of AISI 1050 railway axle steel. Int. J. Fatigue 2022, 155, 106613. [Google Scholar] [CrossRef]
- Du, S.; Wang, K.; Hu, F. Overview and prospect of axle technology for high speed trains at home and abroad. Mater. China 2019, 38, 641–650. (In Chinese) [Google Scholar]
- Liu, L.; Ma, Y.; Liu, S.; Wang, S. The fatigue behaviors of a medium-carbon pearlitic wheel-steel with elongated sulfides in high-cycle and very-high-cycle regimes. Materials 2021, 14, 4318. [Google Scholar] [CrossRef]
- Klenam, D.E.P.; Chown, L.H.; Papo, M.J.; Cornish, L.A. Steels for rail axles-an overview. Crit. Rev. Solid State Mater. Sci. 2024, 49, 163–193. [Google Scholar] [CrossRef]
- Zhang, R.; Zheng, C.; Lv, B.; Wang, X.; Li, X.; Li, Y.; Zhang, F. Research progress on rolling contact fatigue damage of bainitic rail steel. Eng. Fail. Anal. 2023, 143, 106875. [Google Scholar]
- Lewis, R.; Olofsson, U. Mapping rail wear regimes and transitions. Wear 2004, 257, 721–729. [Google Scholar] [CrossRef]
- Enblom, R.; Berg, M. Simulation of railway wheel profile development due to wear—Influence of disc braking and contact environment. Wear 2005, 258, 1055–1063. [Google Scholar] [CrossRef]
- Braghin, F.; Lewis, R.; Dwyer-Joyce, R.S.; Bruni, S. A mathematical model to predict railway wheel profile evolution due to wear. Wear 2006, 261, 1253–1264. [Google Scholar] [CrossRef]
- Hirakawa, K.; Toyama, K.; Kubota, M. The analysis and prevention of failure in railway axles. Int. J. Fatigue 1998, 20, 135–144. [Google Scholar] [CrossRef]
- Ekberg, A.; Kabo, E. Fatigue of railway wheels and rails under rolling contact and thermal loading—An overview. Wear 2005, 258, 1288–1300. [Google Scholar] [CrossRef]
- Zerbst, U.; Mädler, B.; Hintze, H. Fracture mechanics in railway applications: An overview. Eng. Fract. Mech. 2005, 72, 163–194. [Google Scholar] [CrossRef]
- Zerbst, U.; Beretta, S.; Köhler, G.; Lawton, A.; Vormwald, M.; Beier, H.T.; Klinger, C.; Cerny, I.; Rudlin, J.; Heckel, T.; et al. Safe life and damage tolerance aspects of railway axles—A review. Eng. Fract. Mech. 2013, 98, 214–271. [Google Scholar] [CrossRef]
- Ekberg, A.; Åkesson, B.; Kabo, E. Wheel/rail rolling contact fatigue—Probe, predict, prevent. Wear 2014, 314, 2–12. [Google Scholar] [CrossRef]
- Murakami, Y. Metal Fatigue: Effect of Small Defects and Nonmetallic Inclusions; Elsevier: Oxford, UK, 2002. [Google Scholar]
- Pan, X.; Du, L.; Qian, G.; Hong, Y. Microstructure features induced by fatigue crack initiation up to very-high-cycle regime for an additively manufactured aluminium alloy. J. Mater. Sci. Technol. 2024, 173, 247–260. [Google Scholar] [CrossRef]
- Pan, X.; Hong, Y. High-cycle and very-high-cycle fatigue of an additively manufactured aluminium alloy under axial cycling at ultrasonic and conventional frequencies. Int. J. Fatigue 2024, 185, 108363. [Google Scholar] [CrossRef]
- Du, L.; Pan, X.; Hong, Y. New insights into microstructure refinement in crack initiation region of very-high-cycle fatigue for SLM Ti-6Al-4V via precession electron diffraction. Materialia 2024, 33, 102008. [Google Scholar] [CrossRef]
- Pan, X.; Qian, G.; Hong, Y. Nanograin formation in dimple ridges due to local severe-plastic-deformation during ductile fracture. Scr. Mater. 2021, 194, 11363. [Google Scholar] [CrossRef]
- Du, L.; Pan, X.; Qian, G.; Zheng, L.; Hong, Y. Crack initiation mechanisms under two stress ratios up to very-high-cycle fatigue regime for a selective laser melted Ti-6Al-4V. Int. J. Fatigue 2021, 149, 106294. [Google Scholar] [CrossRef]
- Yap, C.Y.; Chua, C.K.; Dong, Z.L.; Liu, Z.H.; Zhang, D.Q.; Loh, L.E.; Sing, S.L. Review of selective laser melting: Materials and applications. Appl. Phys. Rev. 2015, 2, 041101. [Google Scholar] [CrossRef]
- DebRoy, T.; Wei, H.L.; Zuback, J.S.; Mukherjee, T.; Elmer, J.W.; Milewski, J.O.; Beese, A.M.; Wilson-Heid, A.; De, A.; Zhang, W. Additive manufacturing of metallic components—Process, structure and properties. Prog. Mater. Sci. 2018, 92, 112–224. [Google Scholar] [CrossRef]
- Qian, G.; Jian, Z.; Pan, X.; Berto, F. In-situ investigation on fatigue behaviors of Ti-6Al-4V manufactured by selective laser melting. Int. J. Fatigue 2020, 133, 105424. [Google Scholar] [CrossRef]
- Qian, G.; Jian, Z.; Qian, Y.; Pan, X.; Ma, X.; Hong, Y. Very-high-cycle fatigue behavior of AlSi10Mg manufactured by selective laser melting: Effect of build orientation and mean stress. Int. J. Fatigue 2020, 138, 105696. [Google Scholar] [CrossRef]
- Badoniya, P.; Srivastava, M.; Jain, P.K.; Rathee, S. A state-of-the-art review on metal additive manufacturing: Milestones, trends, challenges and perspectives. J. Braz. Soc. Mech. Sci. 2024, 46, 339. [Google Scholar] [CrossRef]
- Tao, Z.; Wang, Z.; Pan, X.; Su, T.; Long, X.; Liu, B.; Tang, Q.; Ren, X.; Sun, C.; Qian, G.; et al. A new probabilistic control volume scheme to interpret specimen size effect on fatigue life of additively manufactured titanium alloys. Int. J. Fatigue 2024, 183, 108262. [Google Scholar] [CrossRef]
- Xu, S.; Pan, S.; Li, Z.; Li, S.; He, X.; Pan, X. Anisotropic tensile behavior and fracture characteristics of an additively manufactured nickel alloy without and with a heat treatment of solution aging. Mater. Sci. Eng. A 2025, 927, 148015. [Google Scholar] [CrossRef]
- Tan, X.; Kok, Y.; Tan, Y.J.; Descoins, M.; Mangelinck, D.; Tor, S.B.; Leong, K.F.; Chua, C.K. Graded microstructure and mechanical properties of additive manufactured Ti-6Al-4V via electron beam melting. Acta Mater. 2015, 97, 1–16. [Google Scholar] [CrossRef]
- Long, X.; Jia, Q.; Li, J.; Chong, K.; Du, L.; Pan, X.; Chang, C. Mechanical properties and parameter optimization of TC4 alloy by additive manufacturing. China Surf. Eng. 2022, 35, 215–223. (In Chinese) [Google Scholar]
- Gao, C.; Zhang, Y.; Jiang, J.; Fu, R.; Du, L.; Pan, X. Research viewpoint on performance enhancement for very-high-cycle fatigue of Ti-6Al-4V alloys via laser-based powder bed fusion. Crystals 2024, 14, 749. [Google Scholar] [CrossRef]
- Xu, W.; Lui, E.W.; Pateras, A.; Qian, M.; Brandt, M. In situ tailoring microstructure in additively manufactured Ti-6Al-4V for superior mechanical performance. Acta Mater. 2017, 125, 390–400. [Google Scholar] [CrossRef]
Figure 1.
Schematics of (a) high-speed train locomotive axle, (b) high-speed train trailer axle. (unit: mm).
Figure 1.
Schematics of (a) high-speed train locomotive axle, (b) high-speed train trailer axle. (unit: mm).
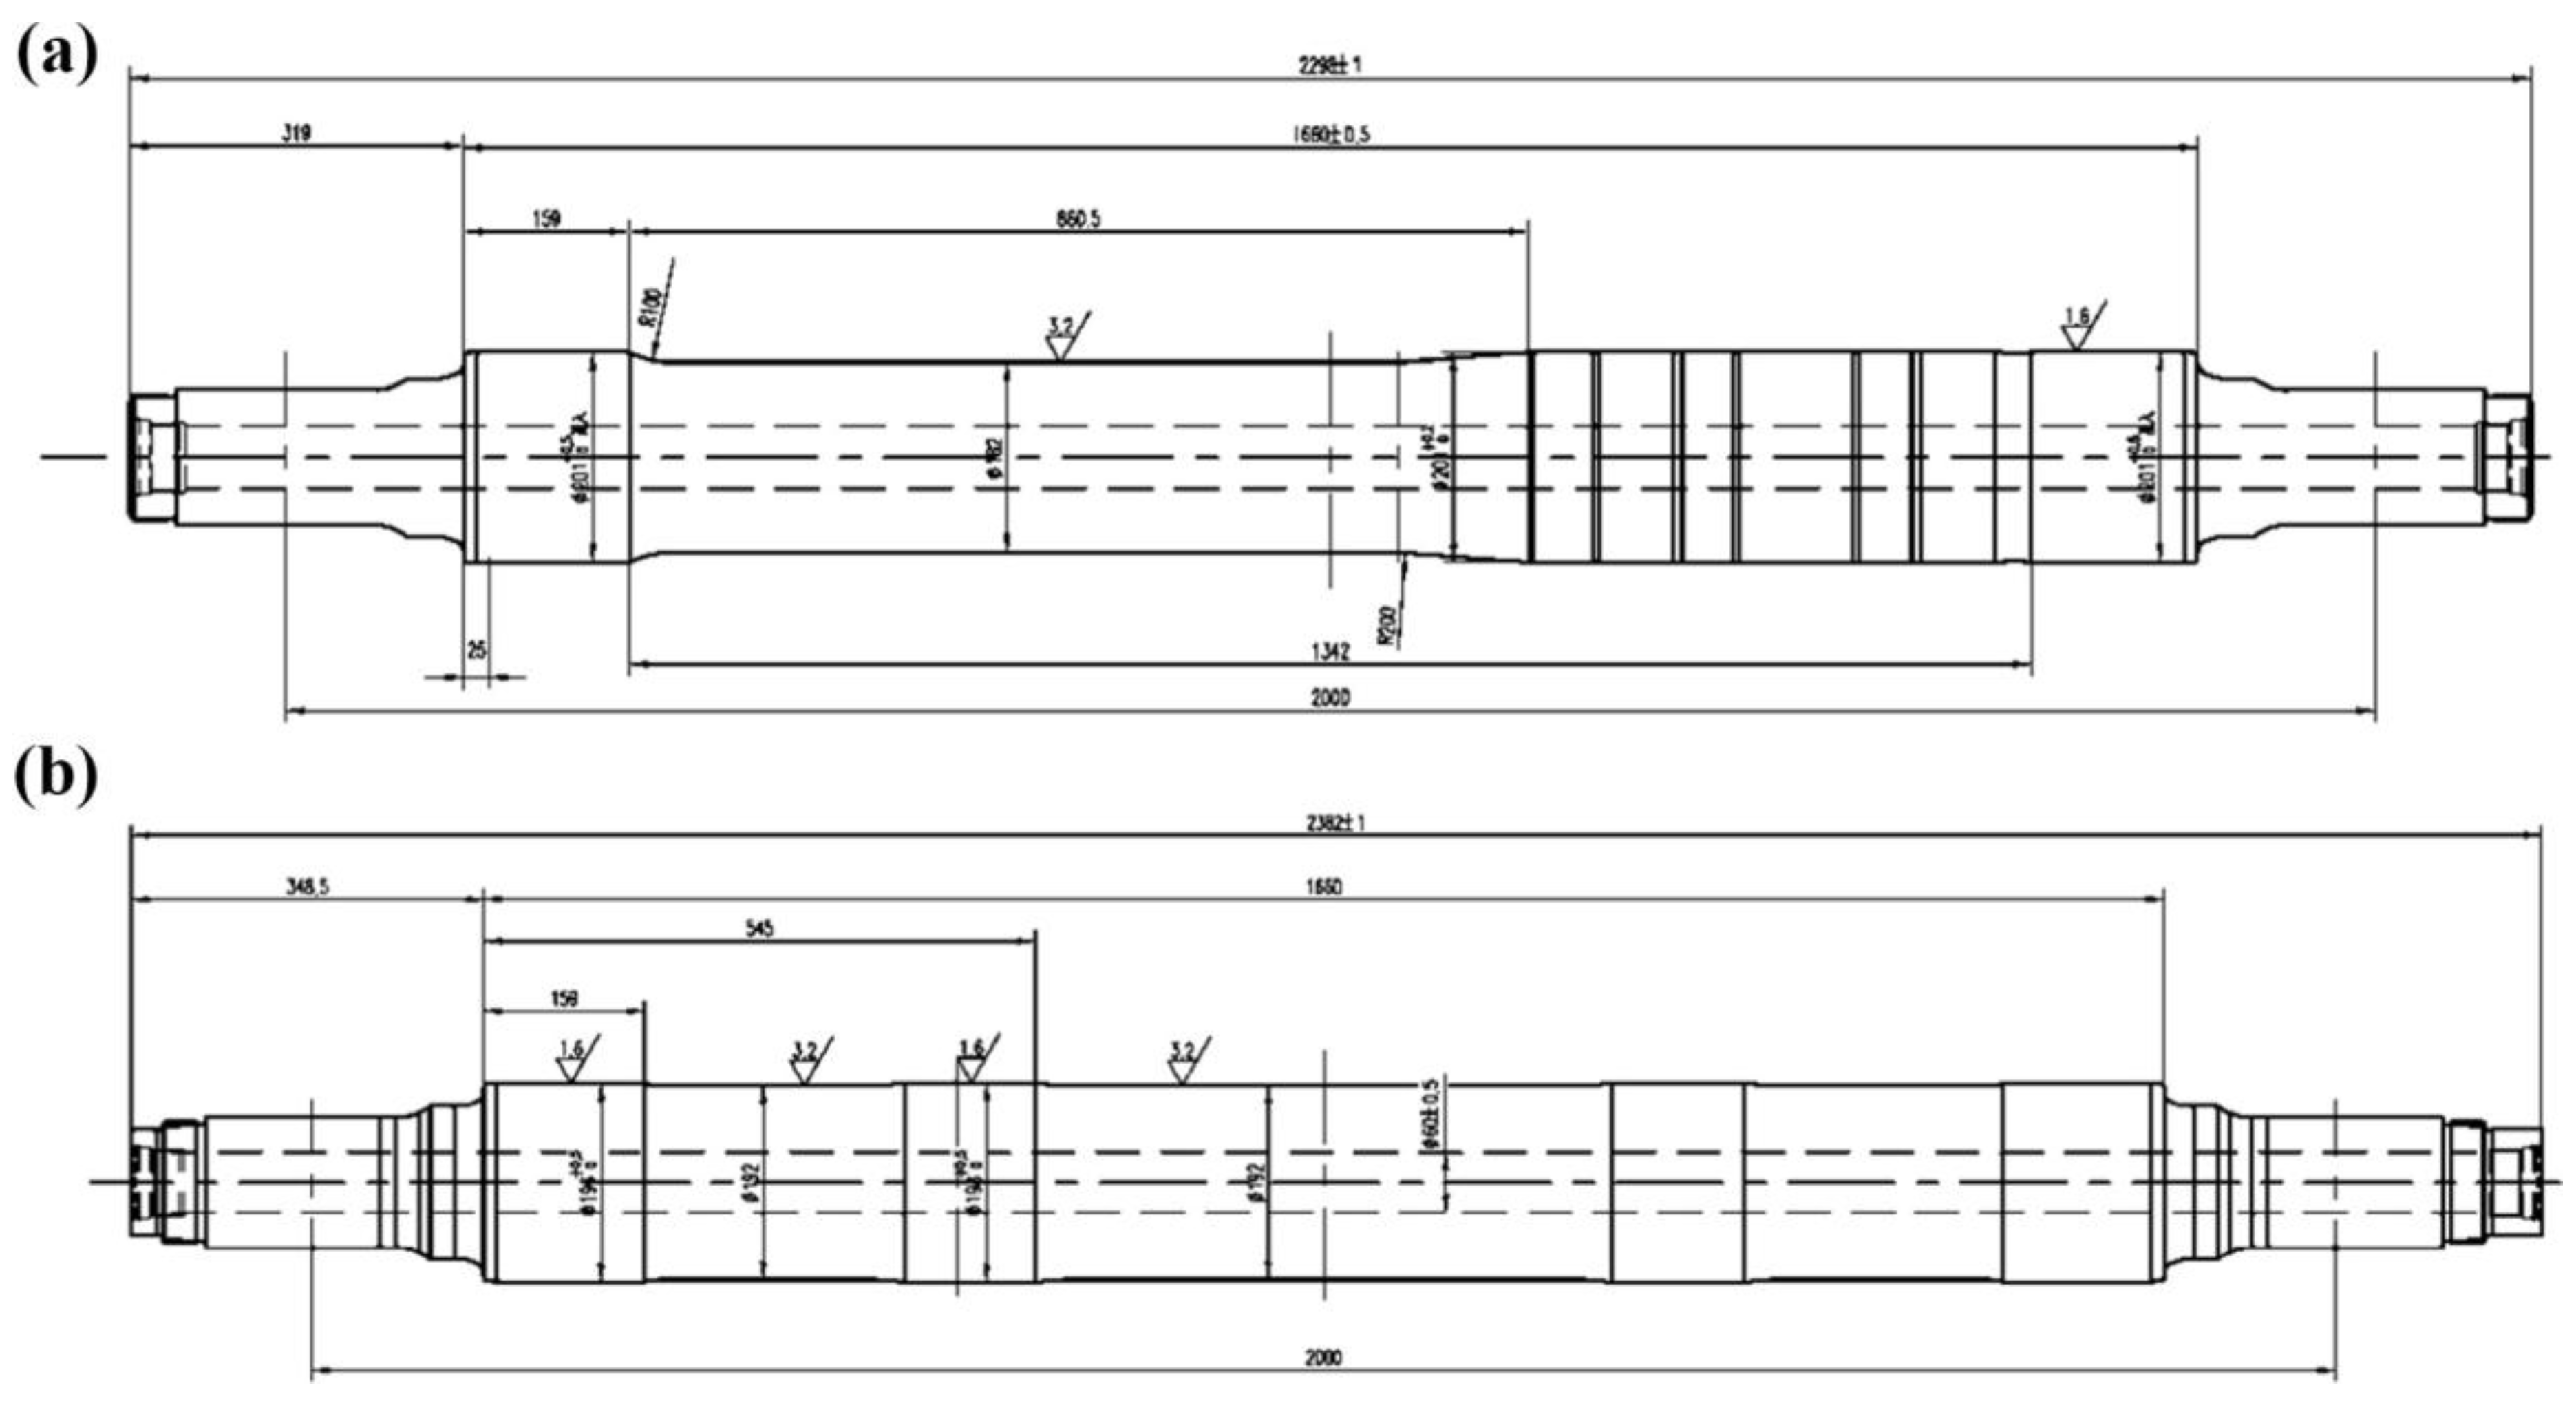
Figure 2.
Schematics of (a) three-point bending specimen, (b) axle cross-sectional sampling. (unit: mm).
Figure 2.
Schematics of (a) three-point bending specimen, (b) axle cross-sectional sampling. (unit: mm).
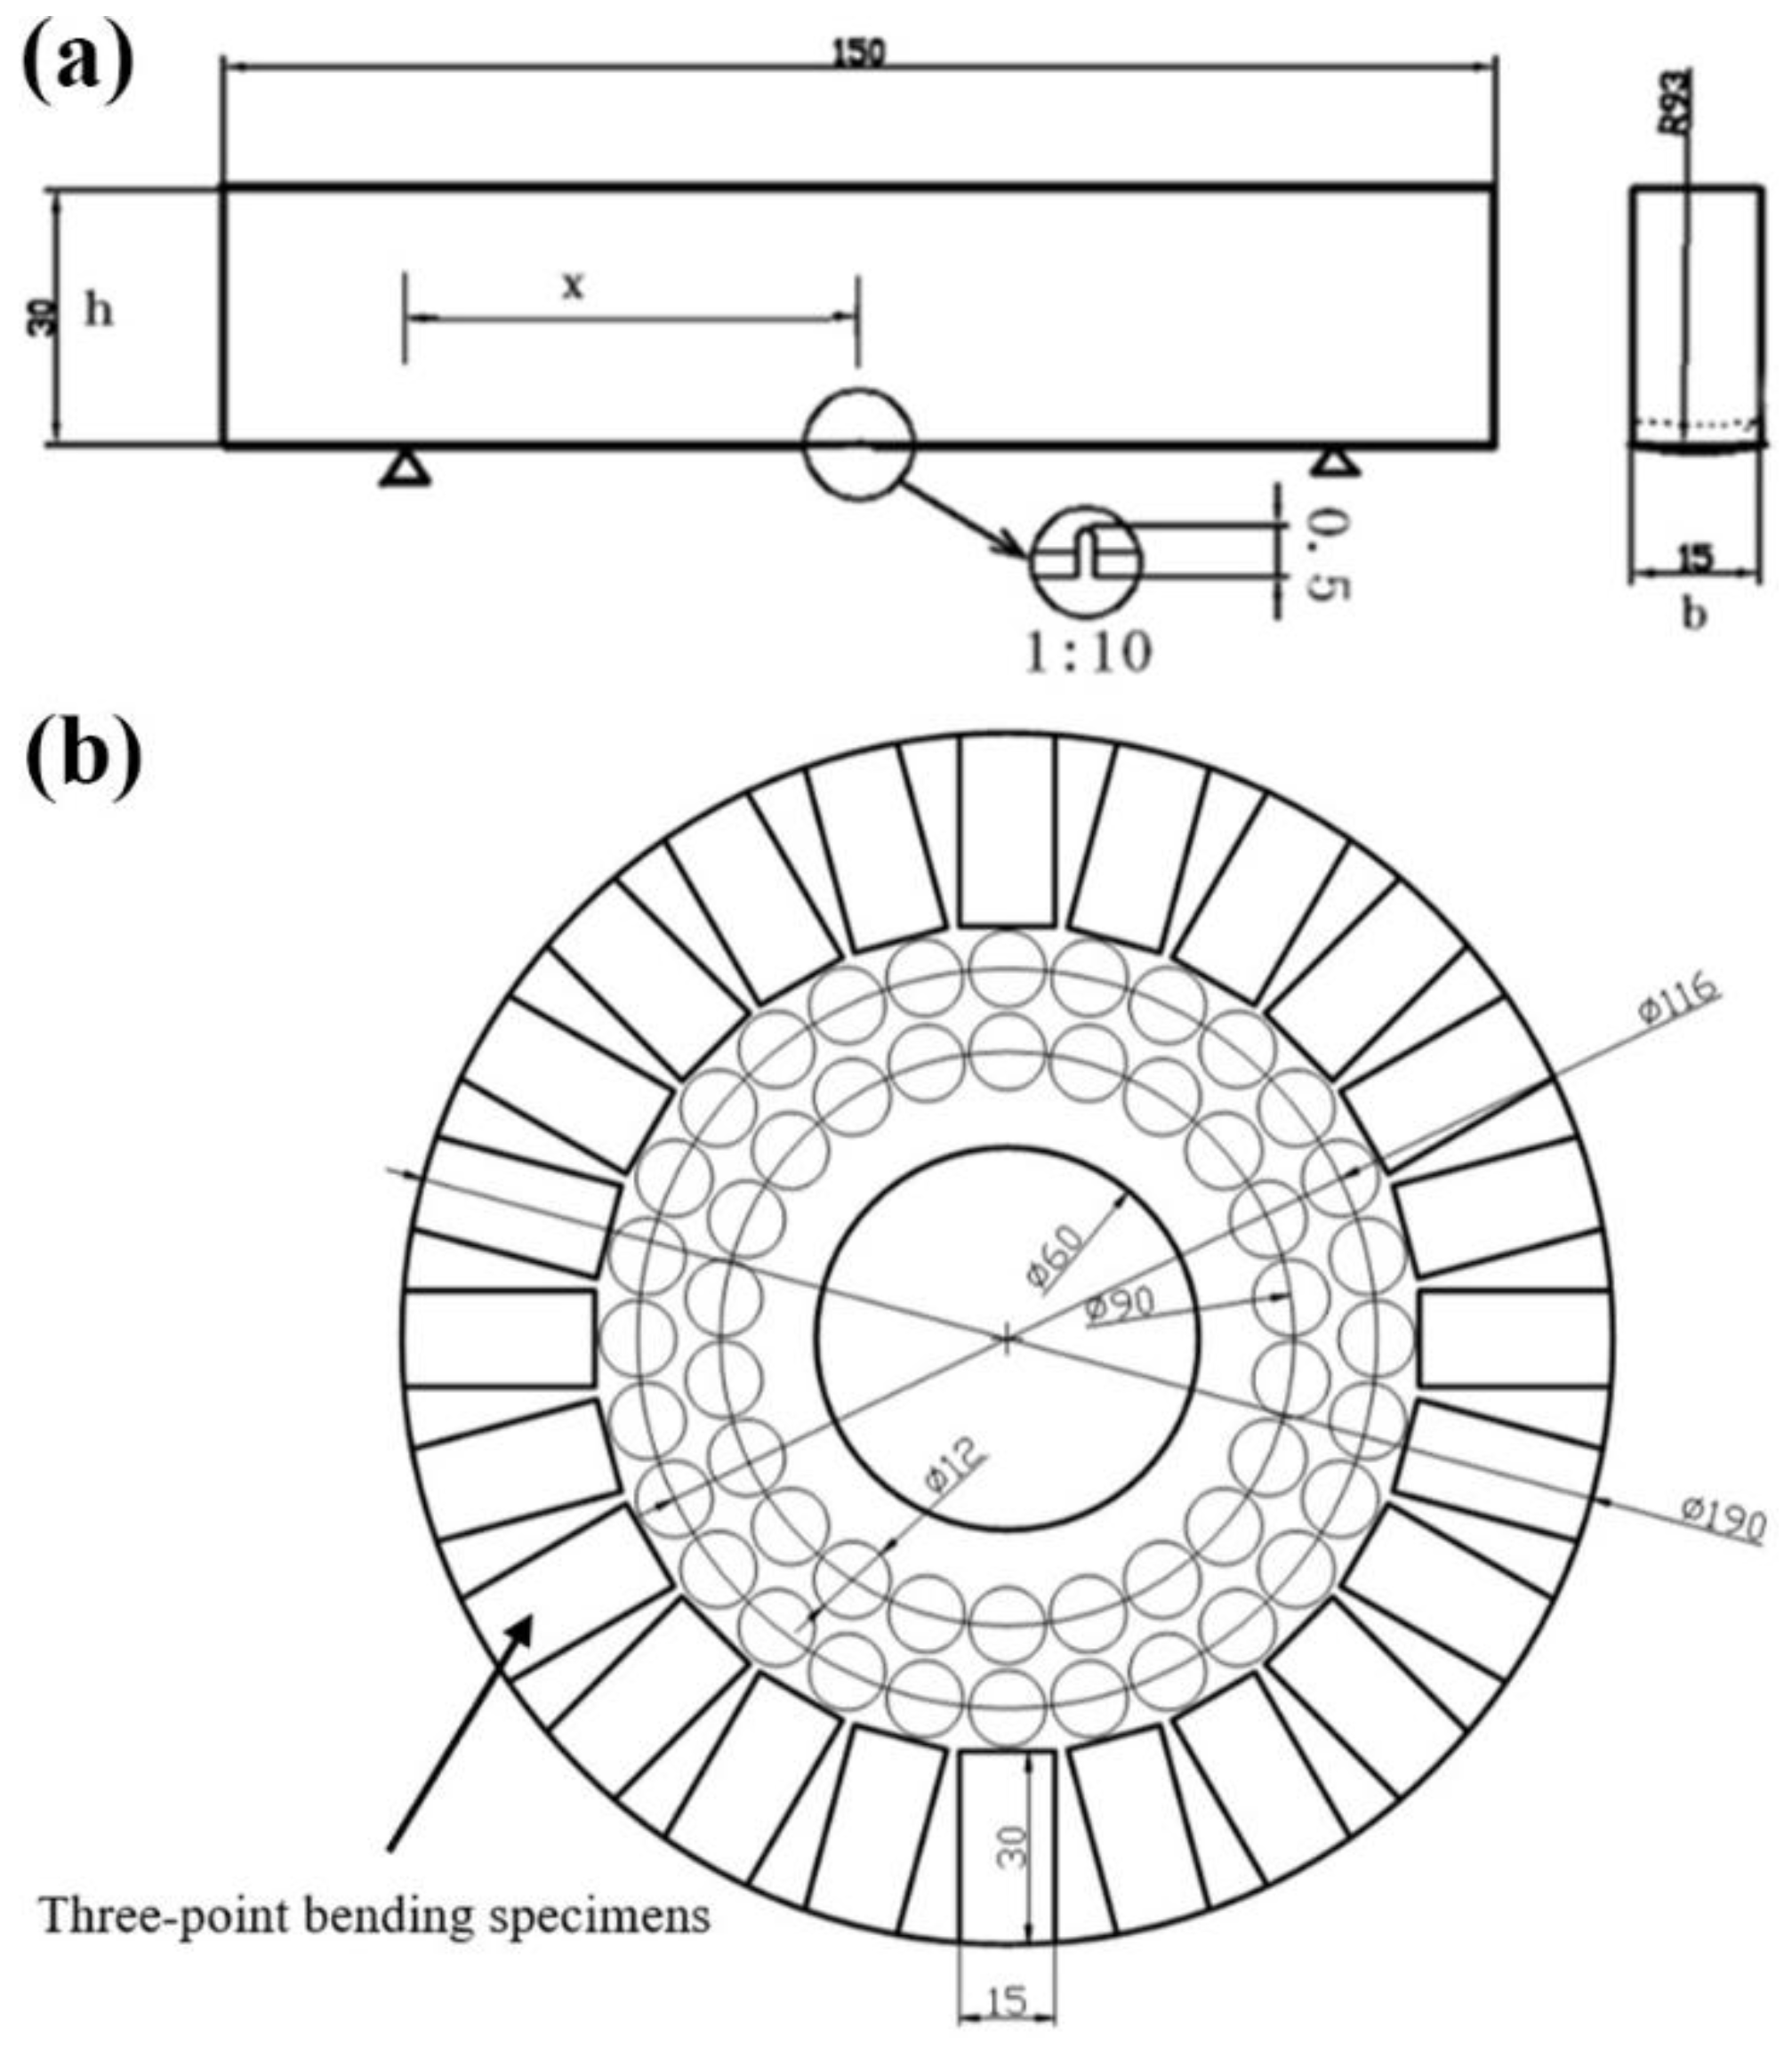
Figure 3.
Fatigue testing system: (a) PLG100 high-frequency fatigue testing machine (frequency range: 80–250 Hz, maximum loading: ±50 kN), (b) imaging and data acquisition system.
Figure 3.
Fatigue testing system: (a) PLG100 high-frequency fatigue testing machine (frequency range: 80–250 Hz, maximum loading: ±50 kN), (b) imaging and data acquisition system.
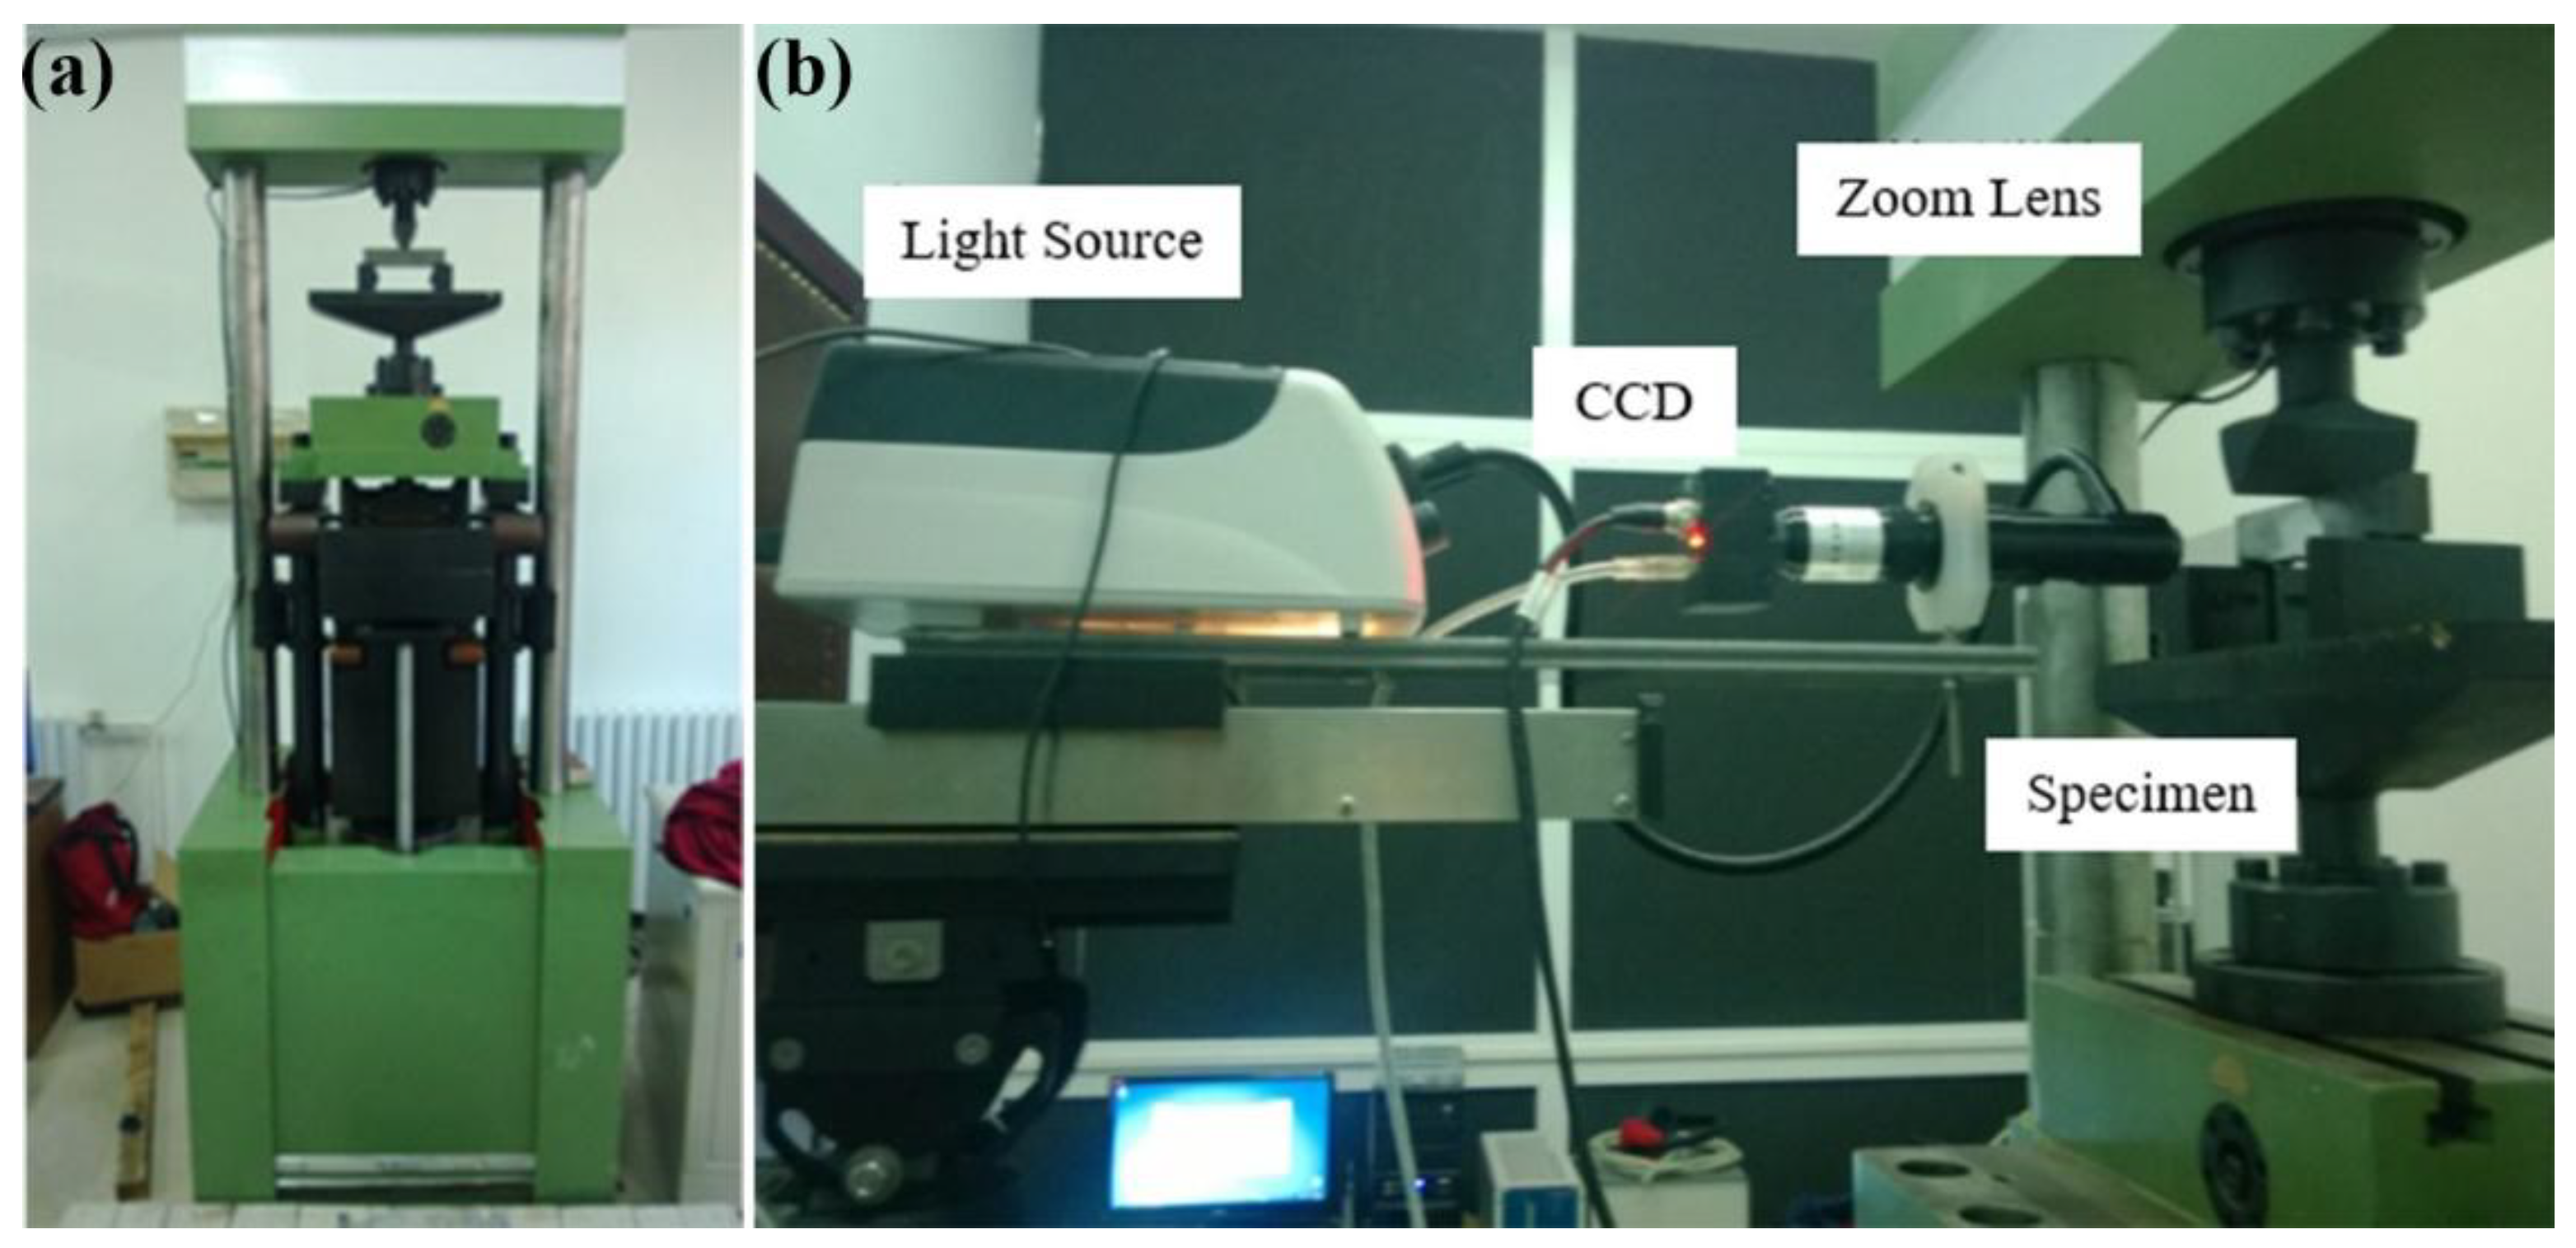
Figure 4.
Schematic of crack measurement.
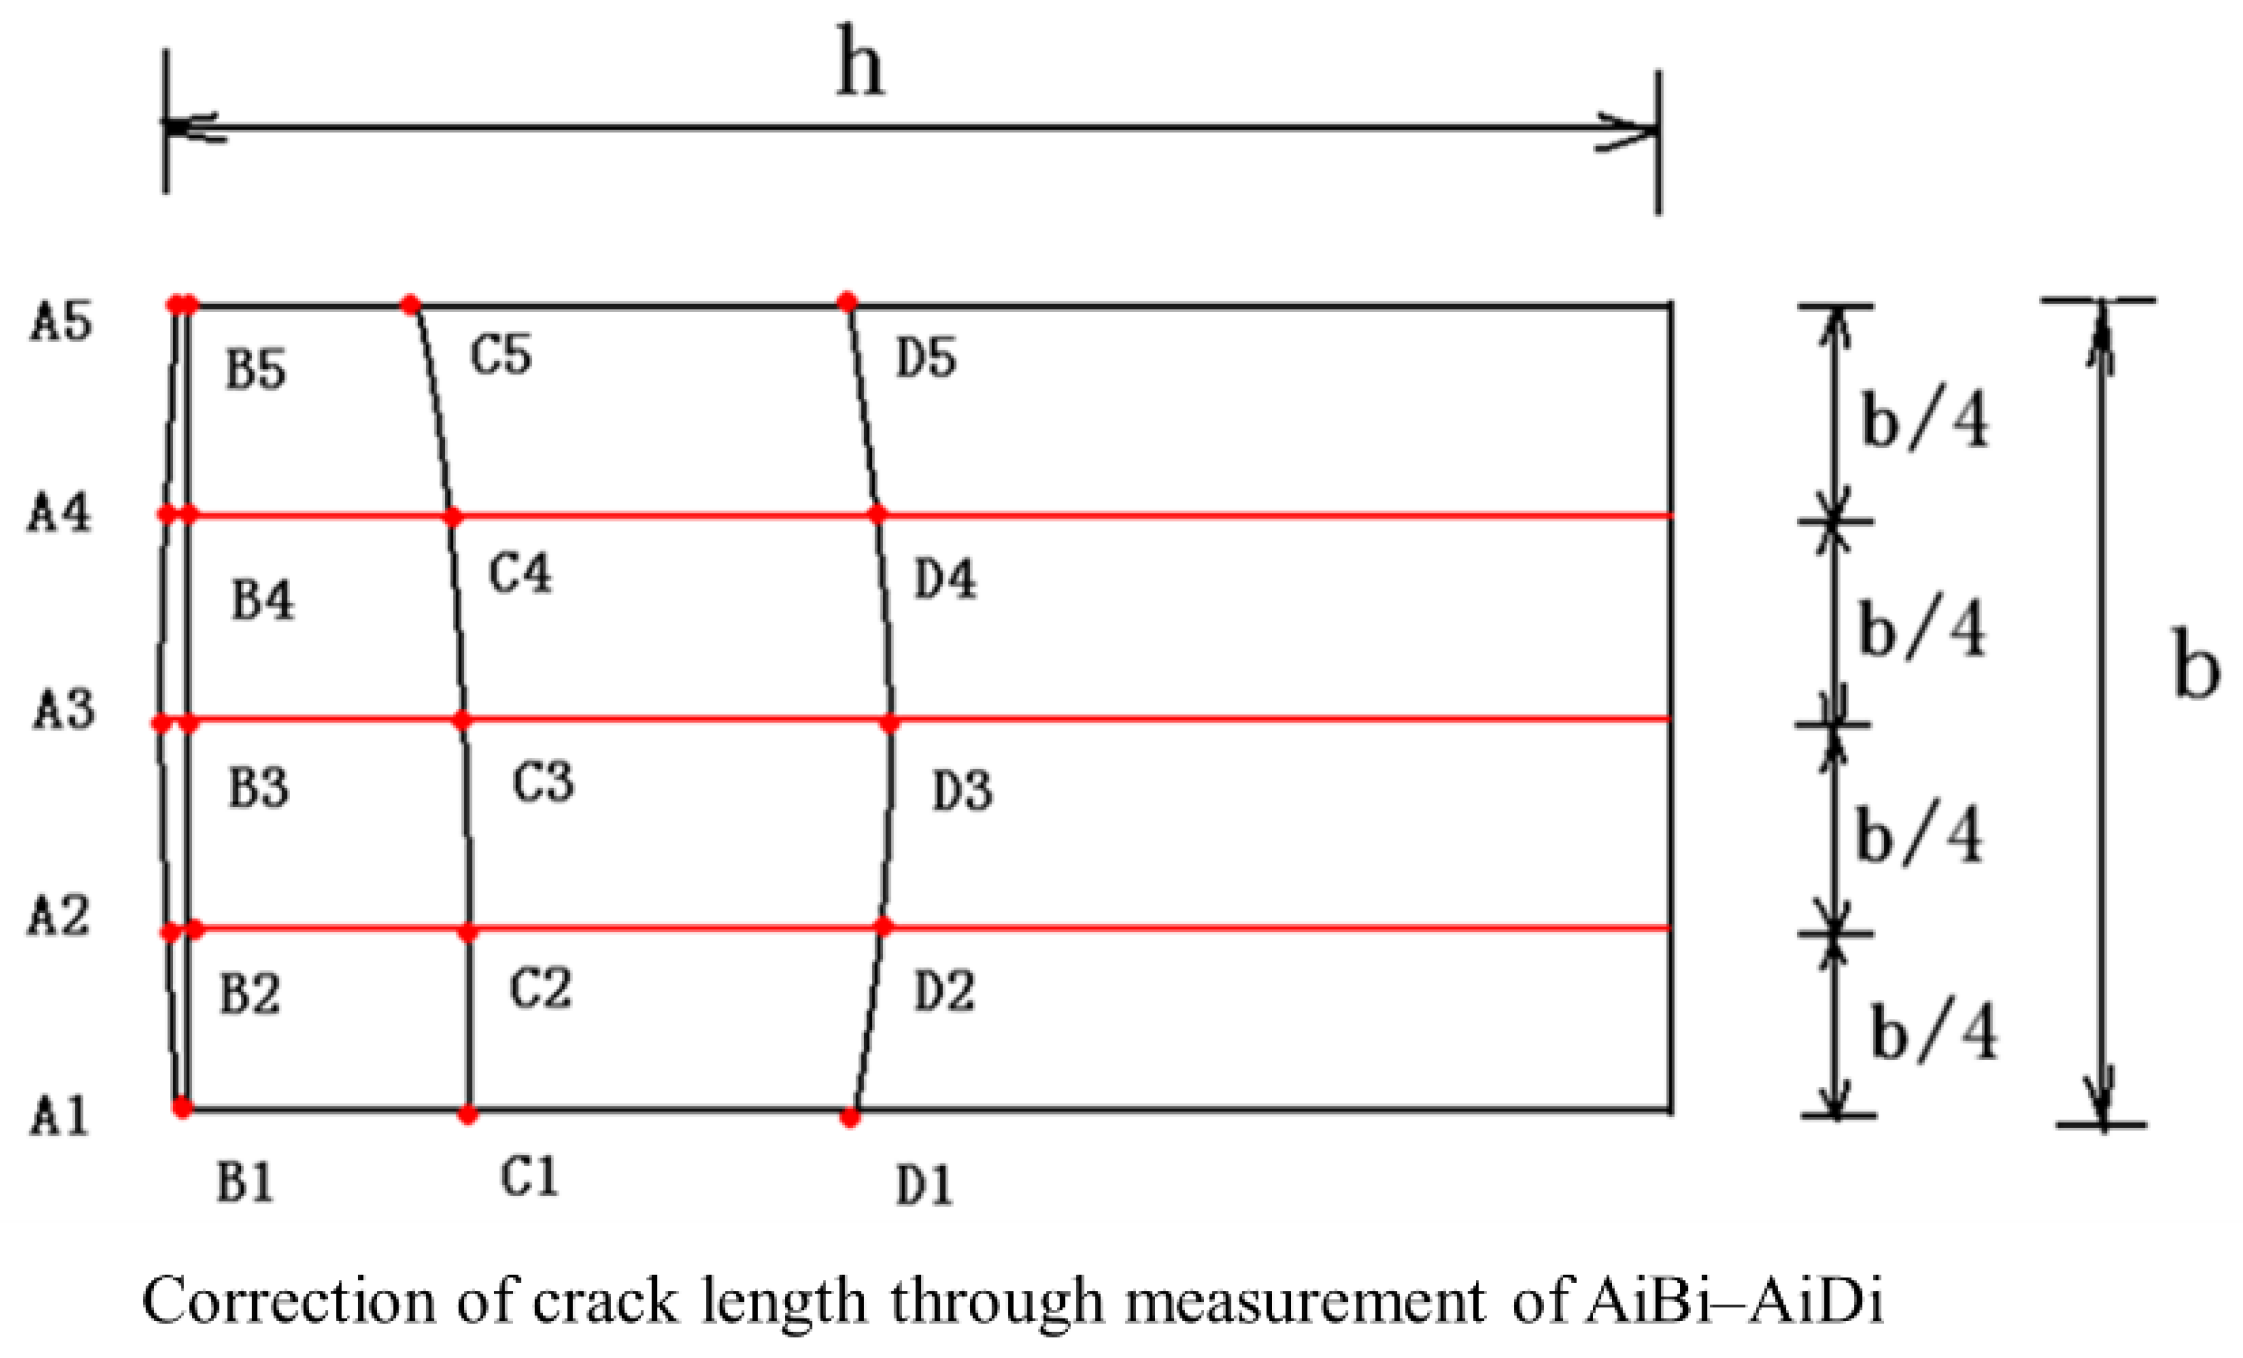
Figure 5.
Optical observations of fatigue crack propagation of Specimen 1: (a) original specimen, (b) crack length ~1.4 mm, (c) crack length ~4.6 mm, (d) crack length ~8.2 mm, and (e) crack length ~10.2 mm.
Figure 5.
Optical observations of fatigue crack propagation of Specimen 1: (a) original specimen, (b) crack length ~1.4 mm, (c) crack length ~4.6 mm, (d) crack length ~8.2 mm, and (e) crack length ~10.2 mm.
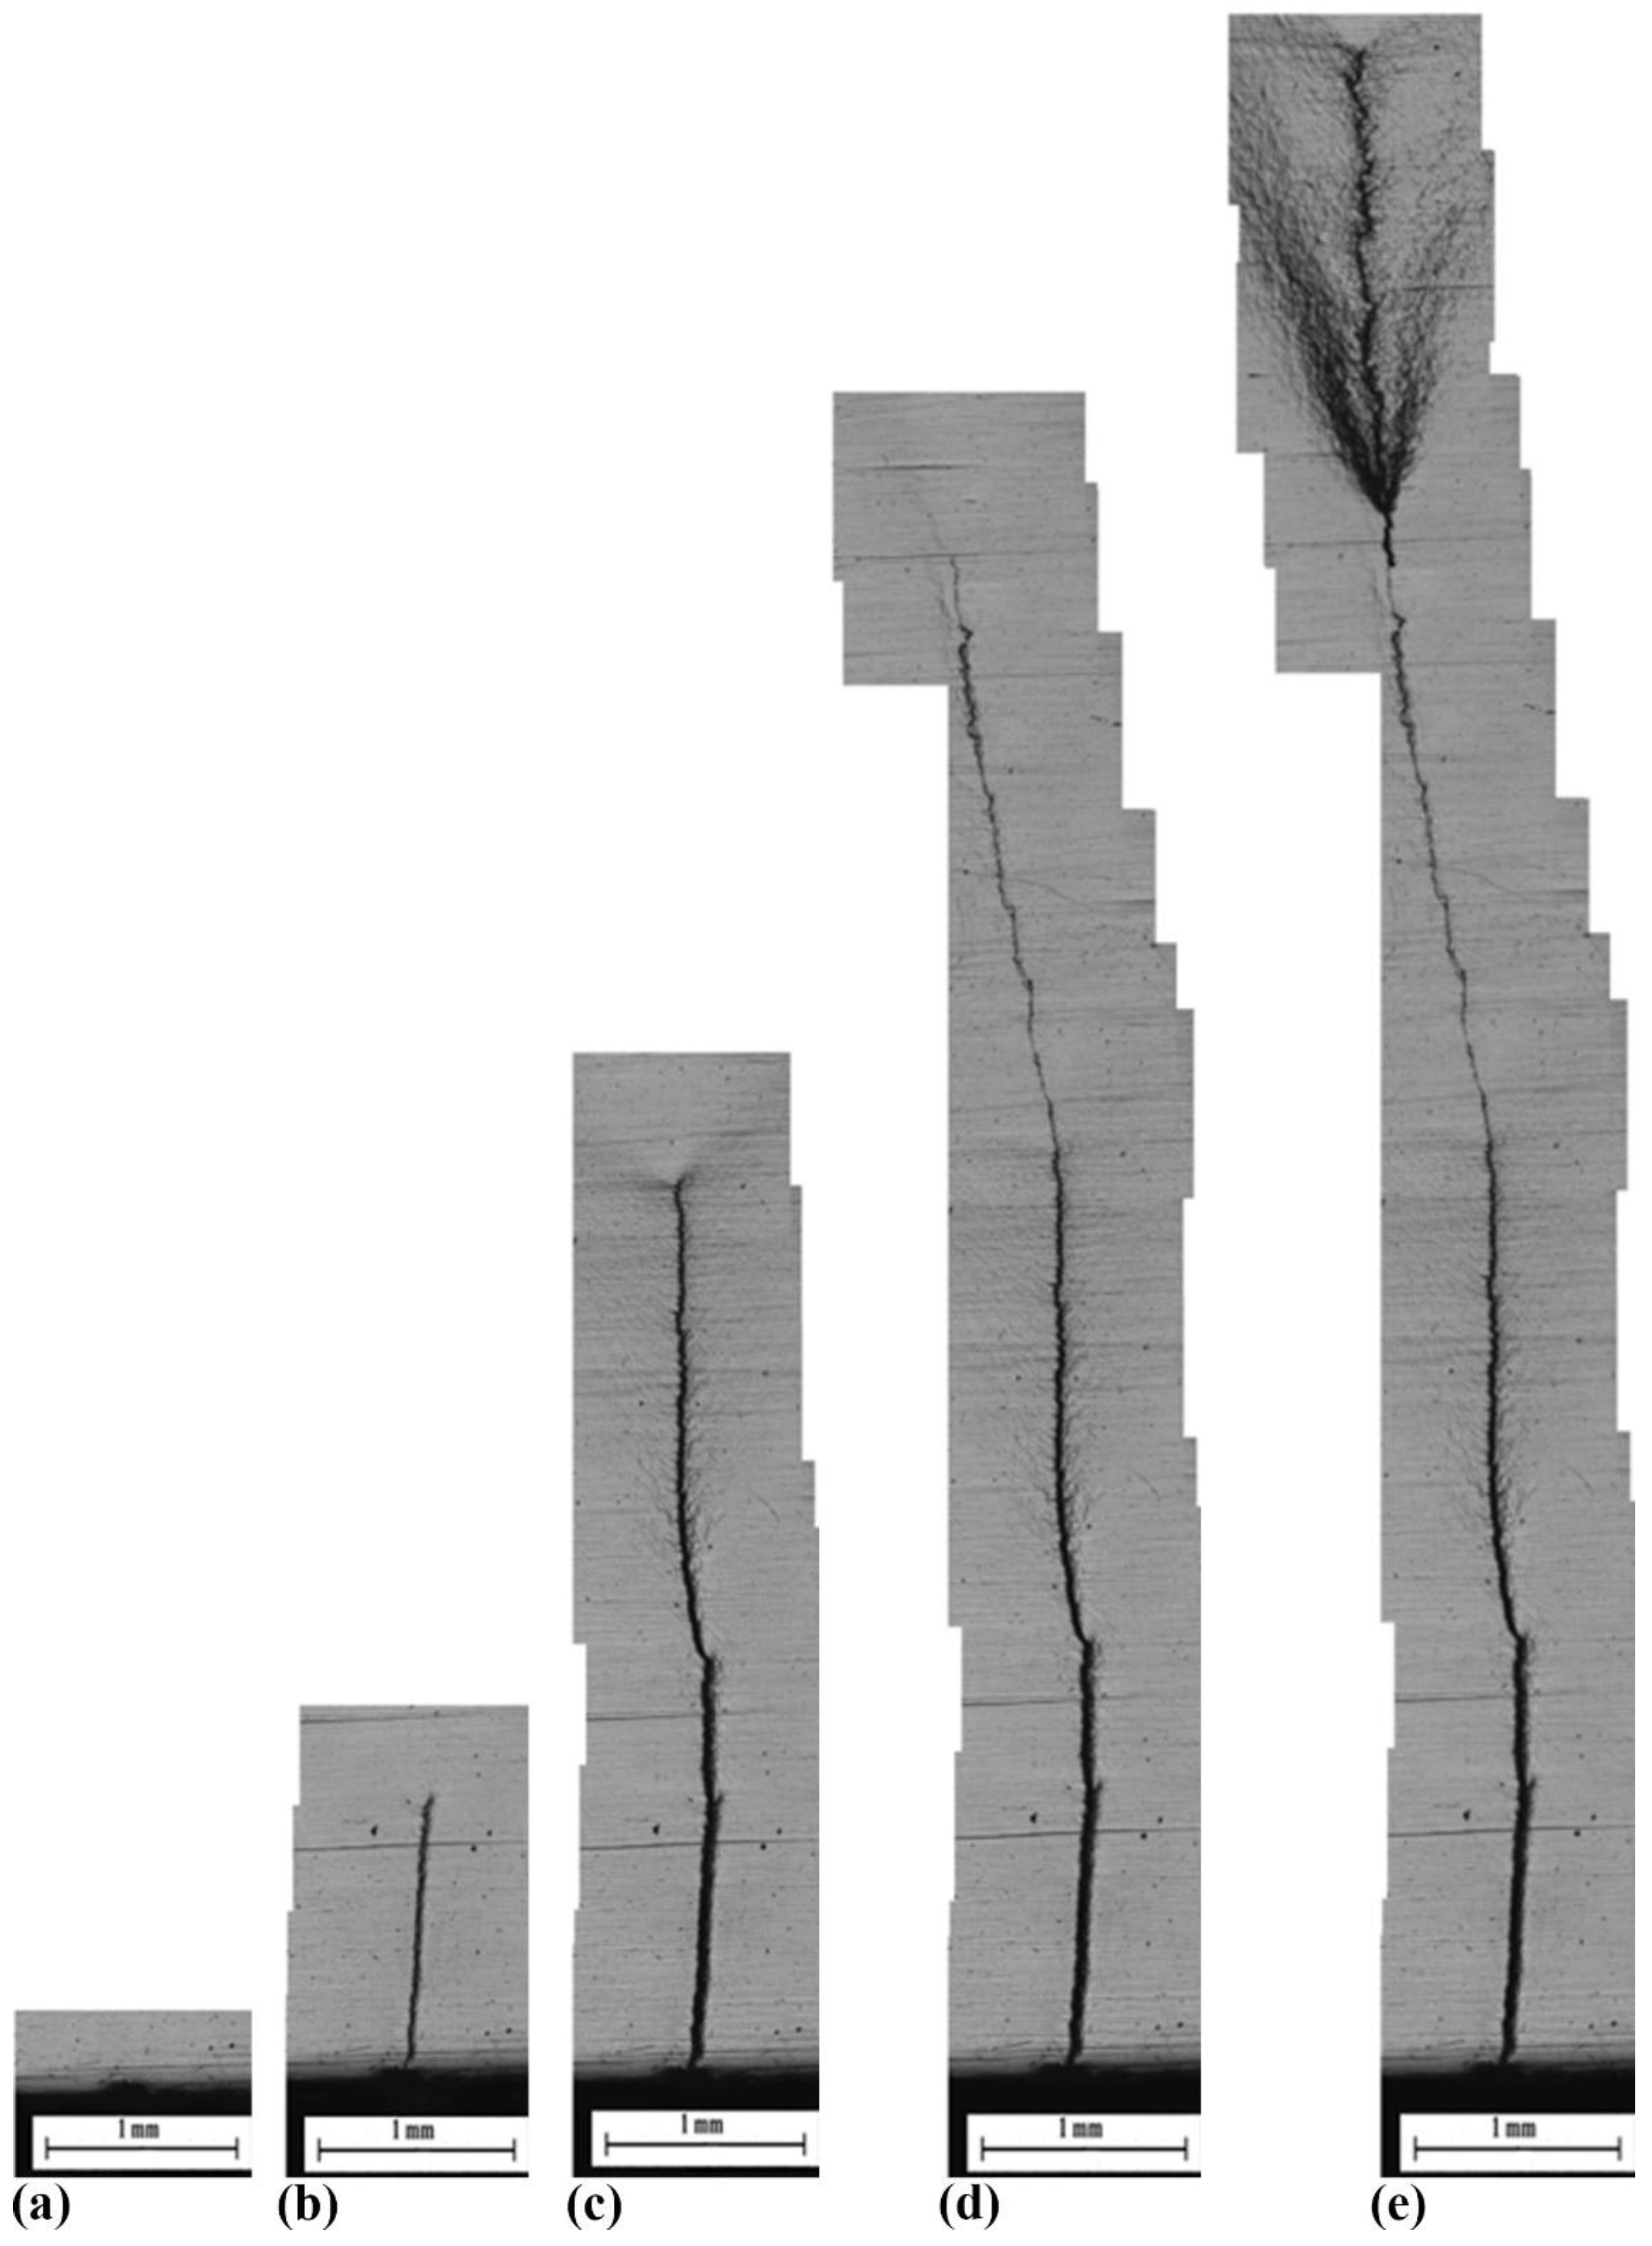
Figure 6.
a–N data: (a) Specimen 1, (b) Specimen 3, (c) Specimen 4, (d) Specimen 8, (e) Specimen 17, and (f) Specimen 21.
Figure 6.
a–N data: (a) Specimen 1, (b) Specimen 3, (c) Specimen 4, (d) Specimen 8, (e) Specimen 17, and (f) Specimen 21.
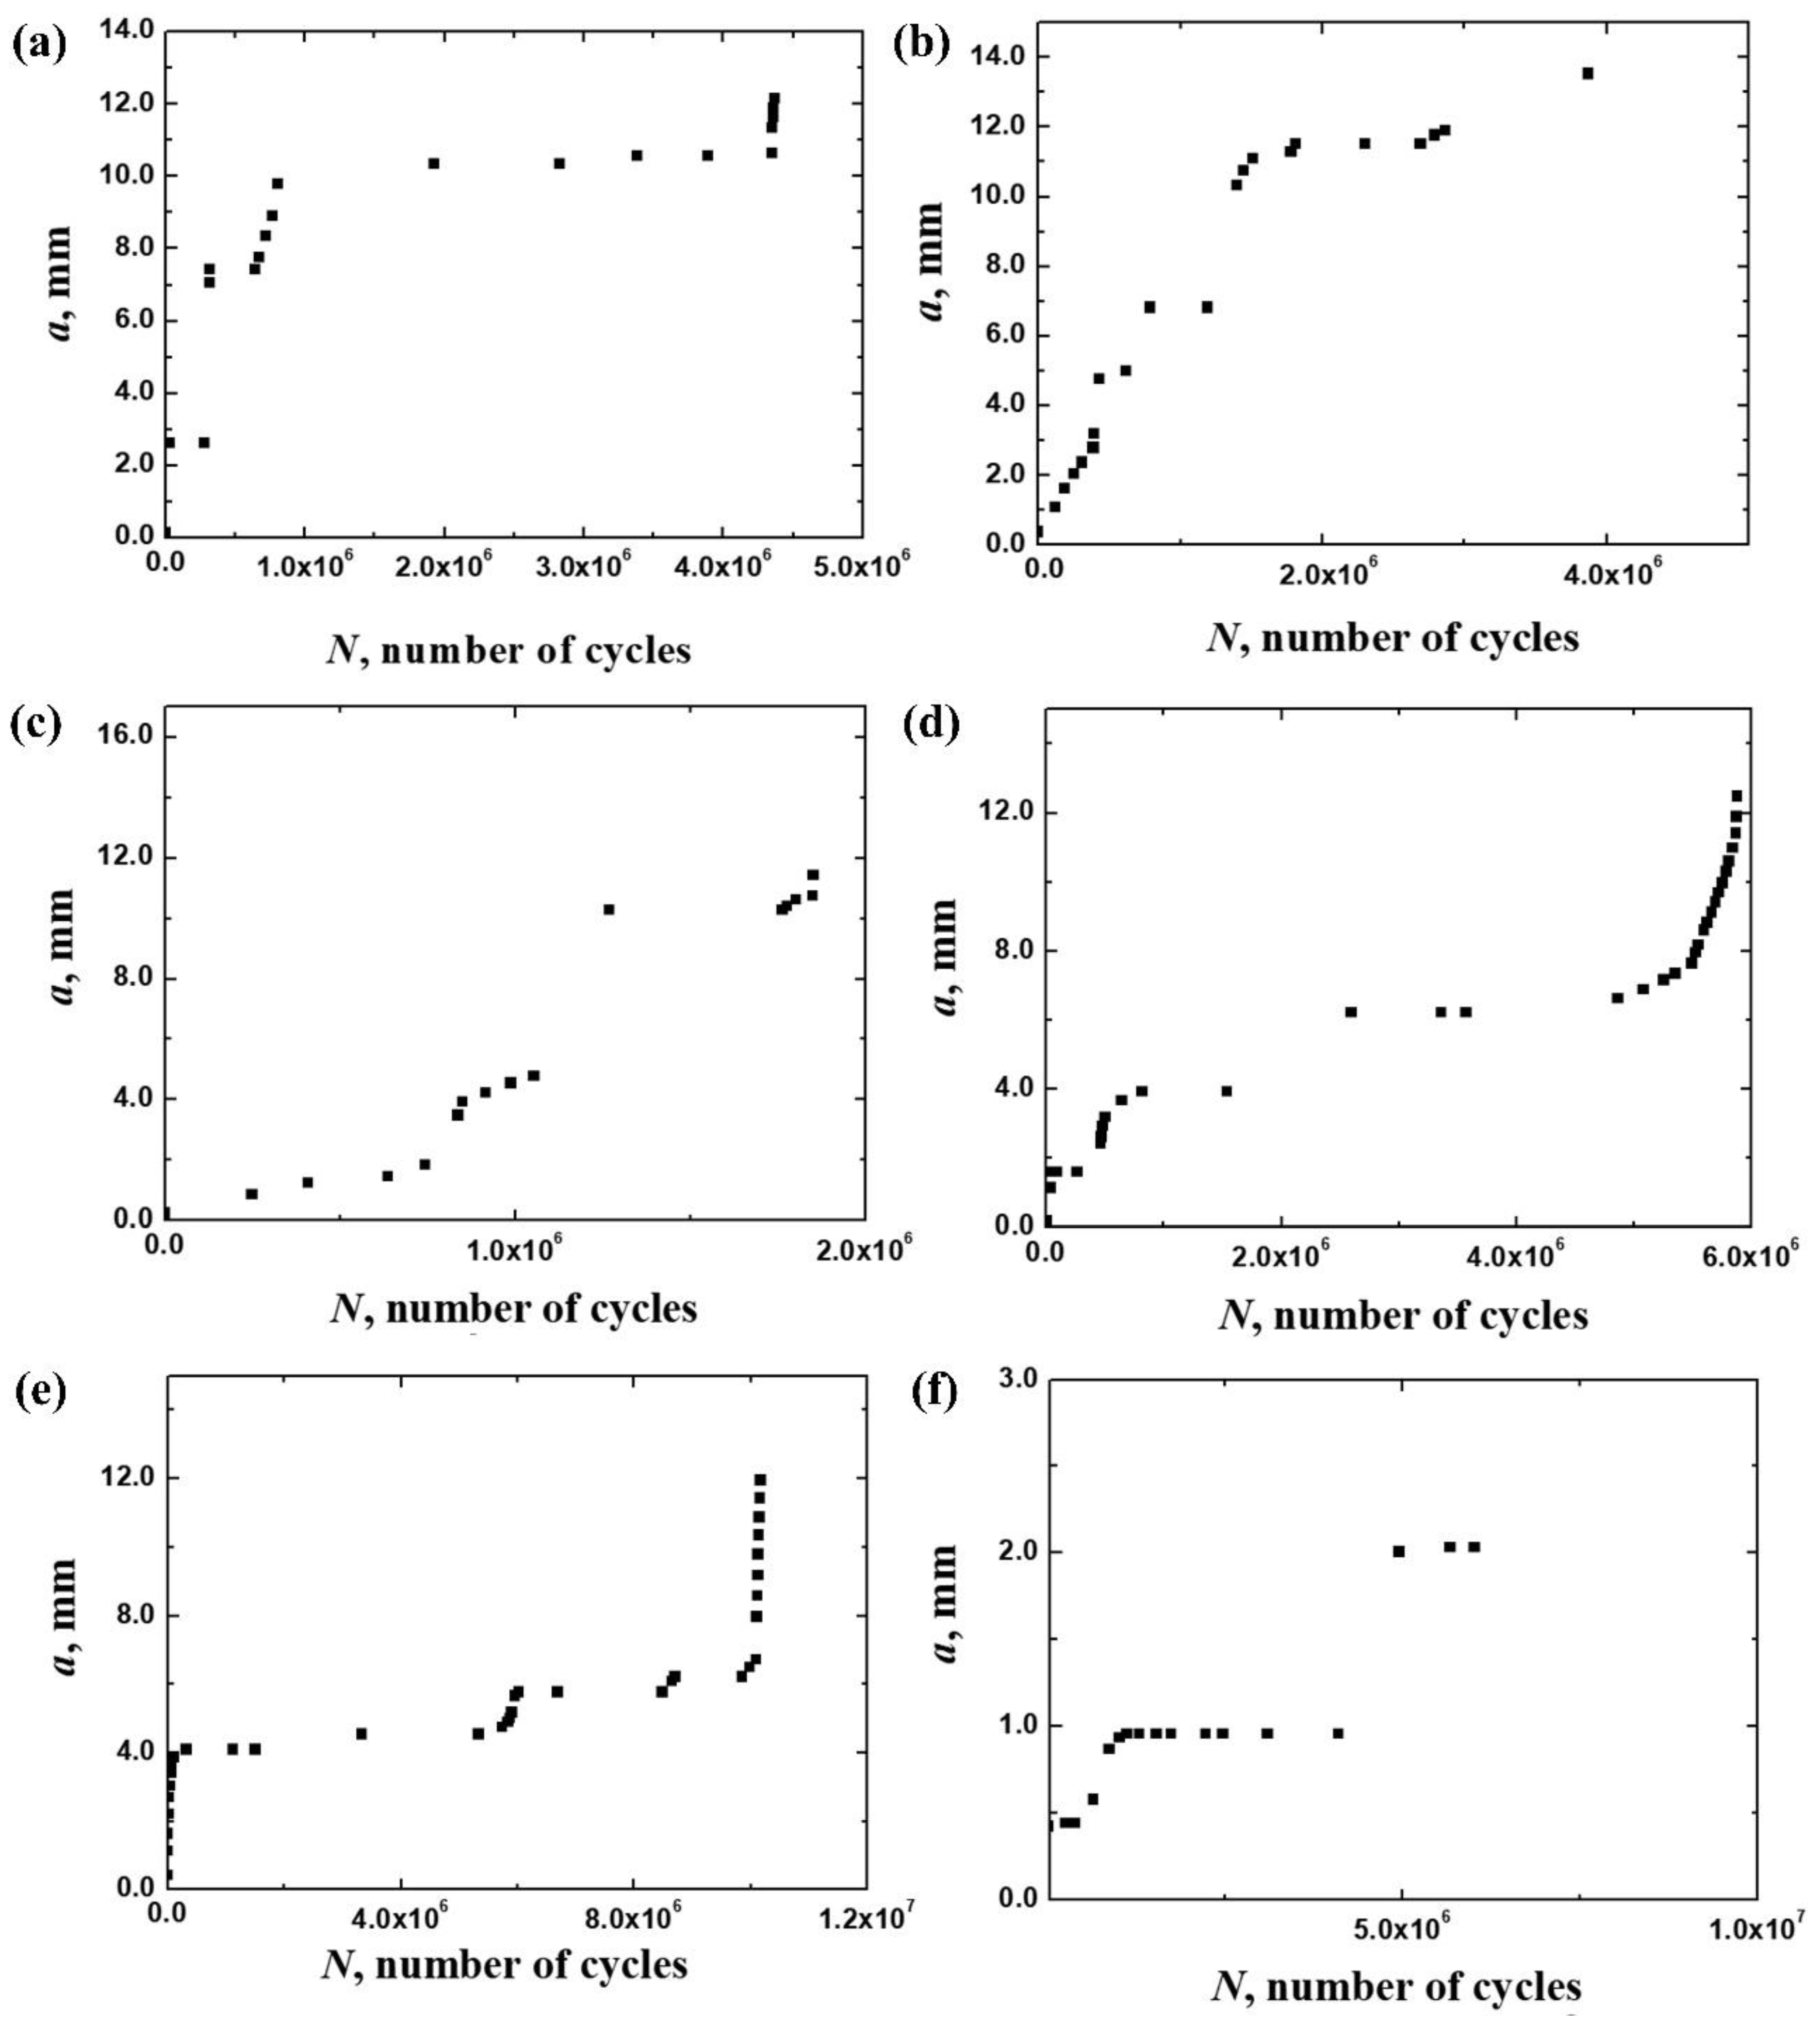
Figure 7.
Fractographic observations: (a) Specimen 1, (b) Specimen 3, (c) Specimen 4, (d) Specimen 8, (e) Specimen 17, and (f) Specimen 21.
Figure 7.
Fractographic observations: (a) Specimen 1, (b) Specimen 3, (c) Specimen 4, (d) Specimen 8, (e) Specimen 17, and (f) Specimen 21.
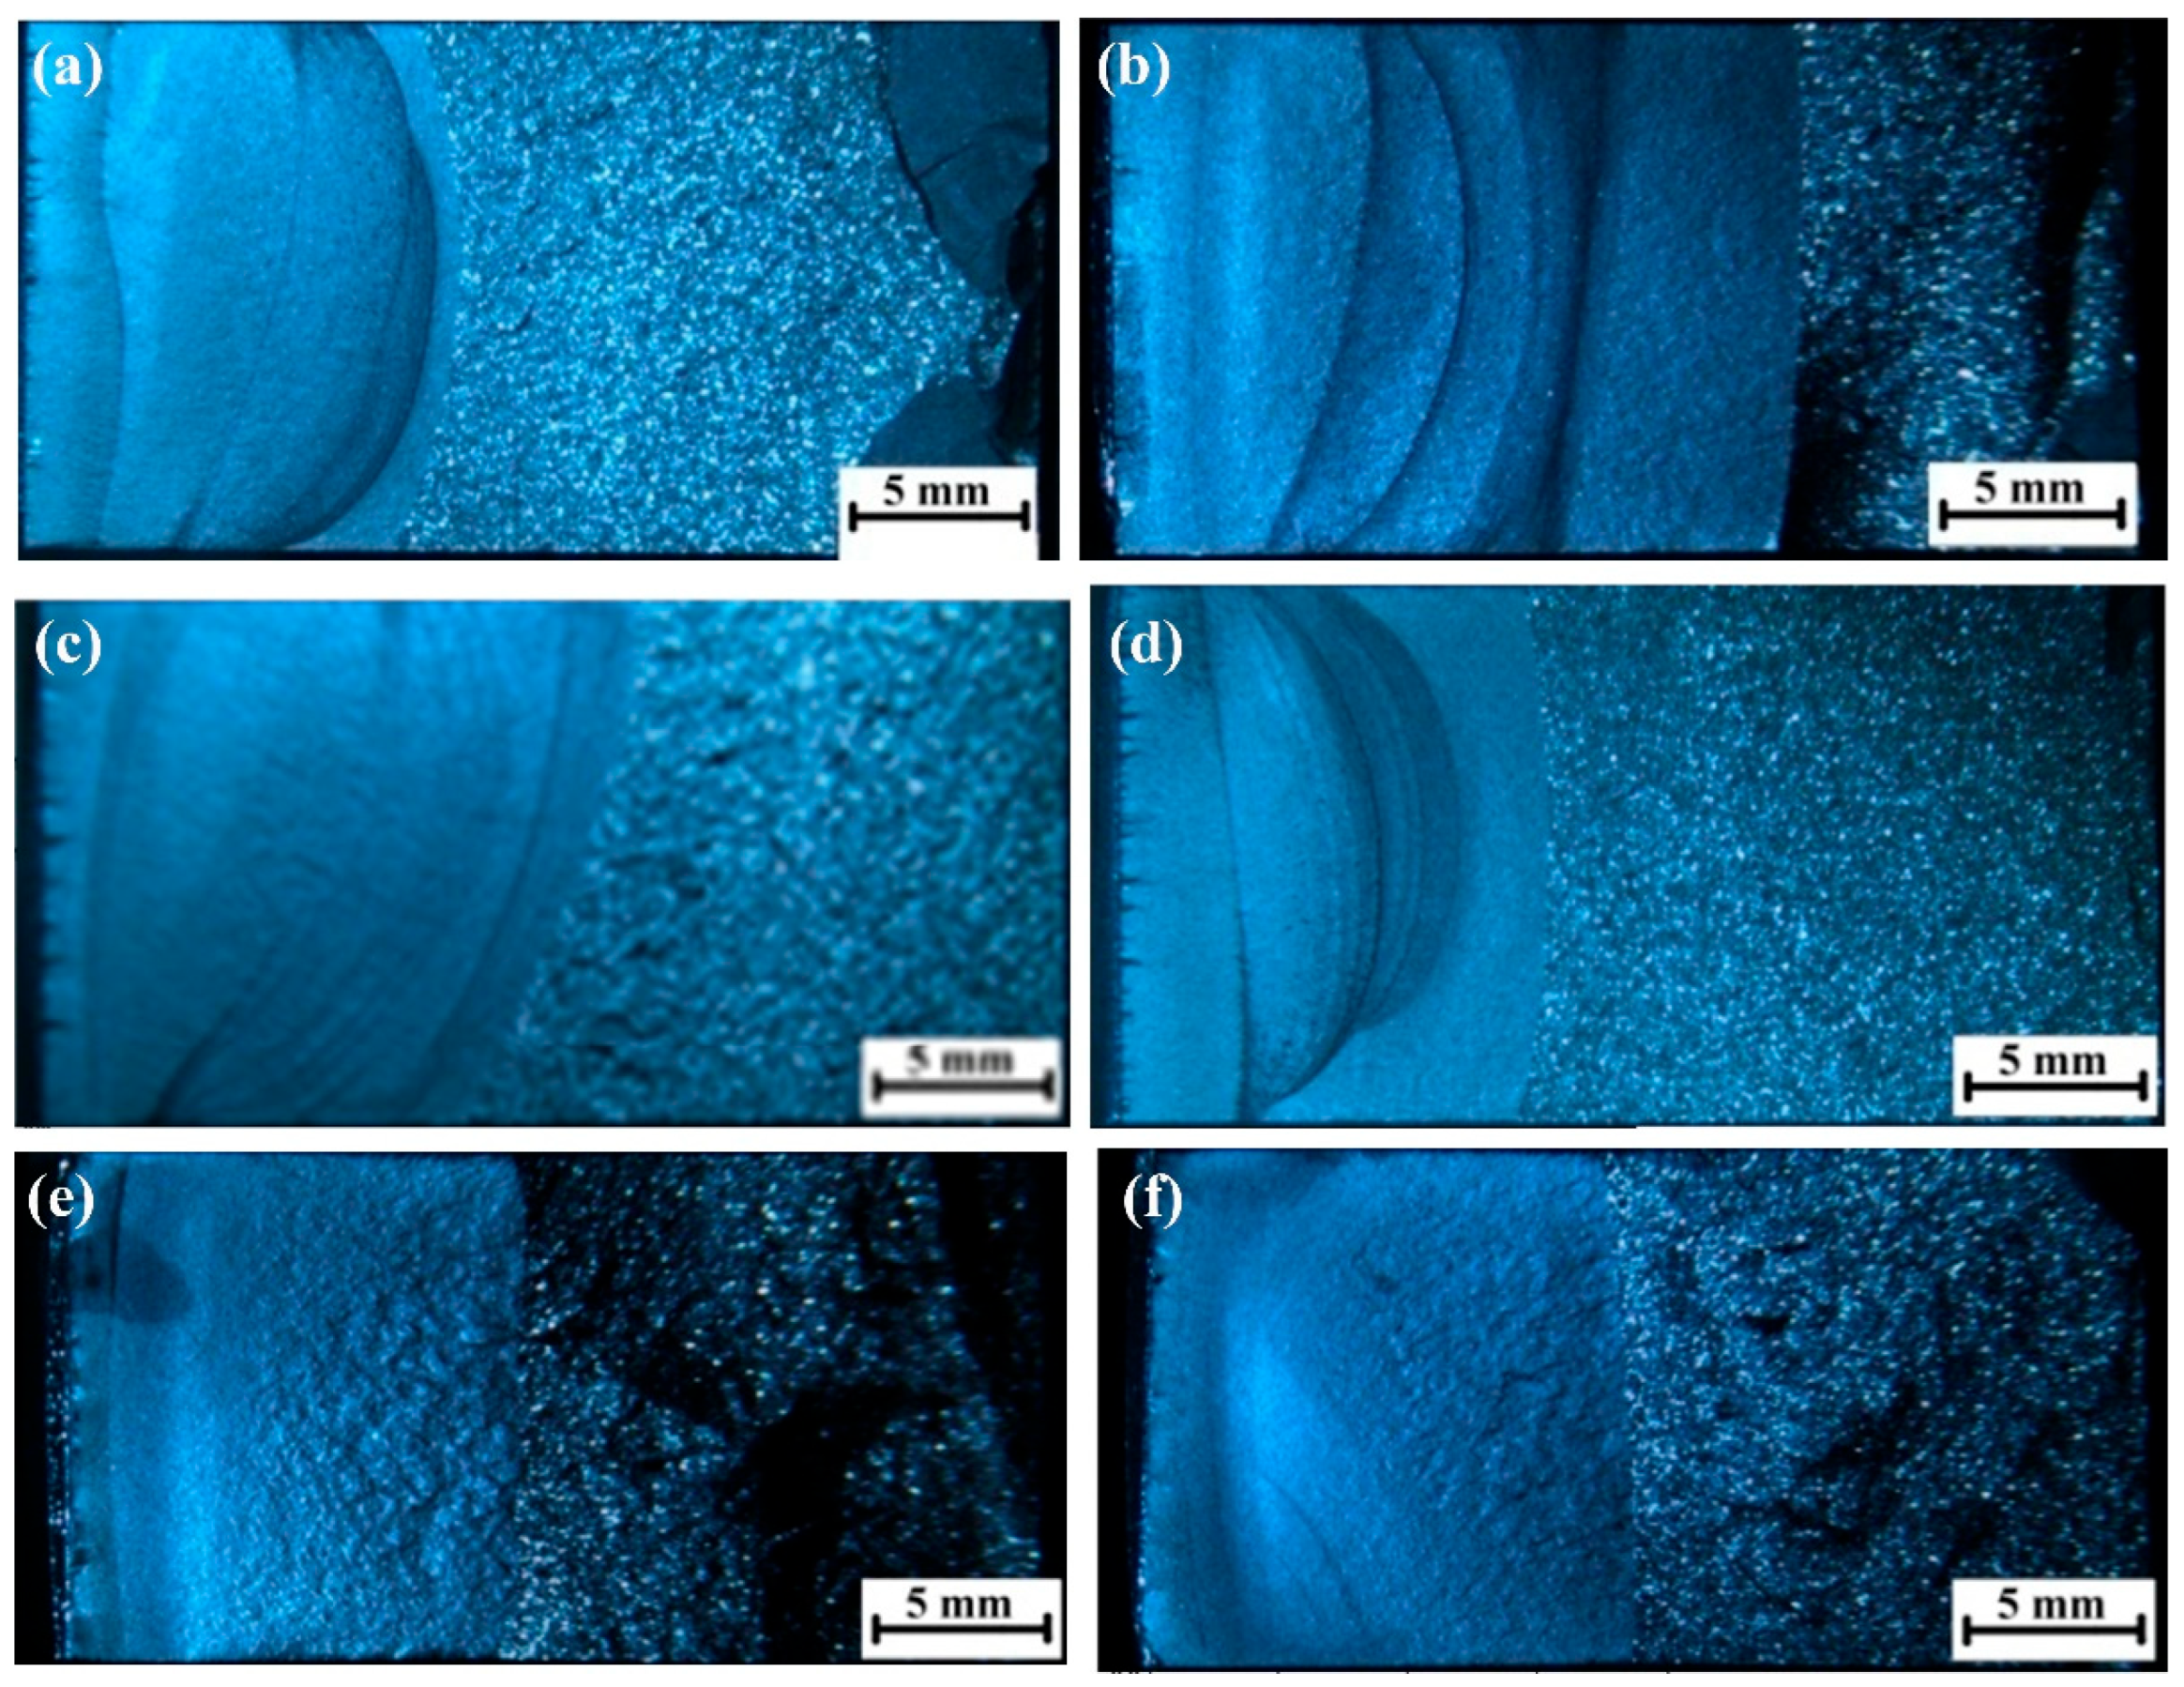
Figure 8.
The relationship among da/dN, ΔK, and X: (a) Specimen 1, (b) Specimen 3, (c) Specimen 4, (d) Specimen 8, (e) Specimen 17, and (f) Specimen 21.
Figure 8.
The relationship among da/dN, ΔK, and X: (a) Specimen 1, (b) Specimen 3, (c) Specimen 4, (d) Specimen 8, (e) Specimen 17, and (f) Specimen 21.
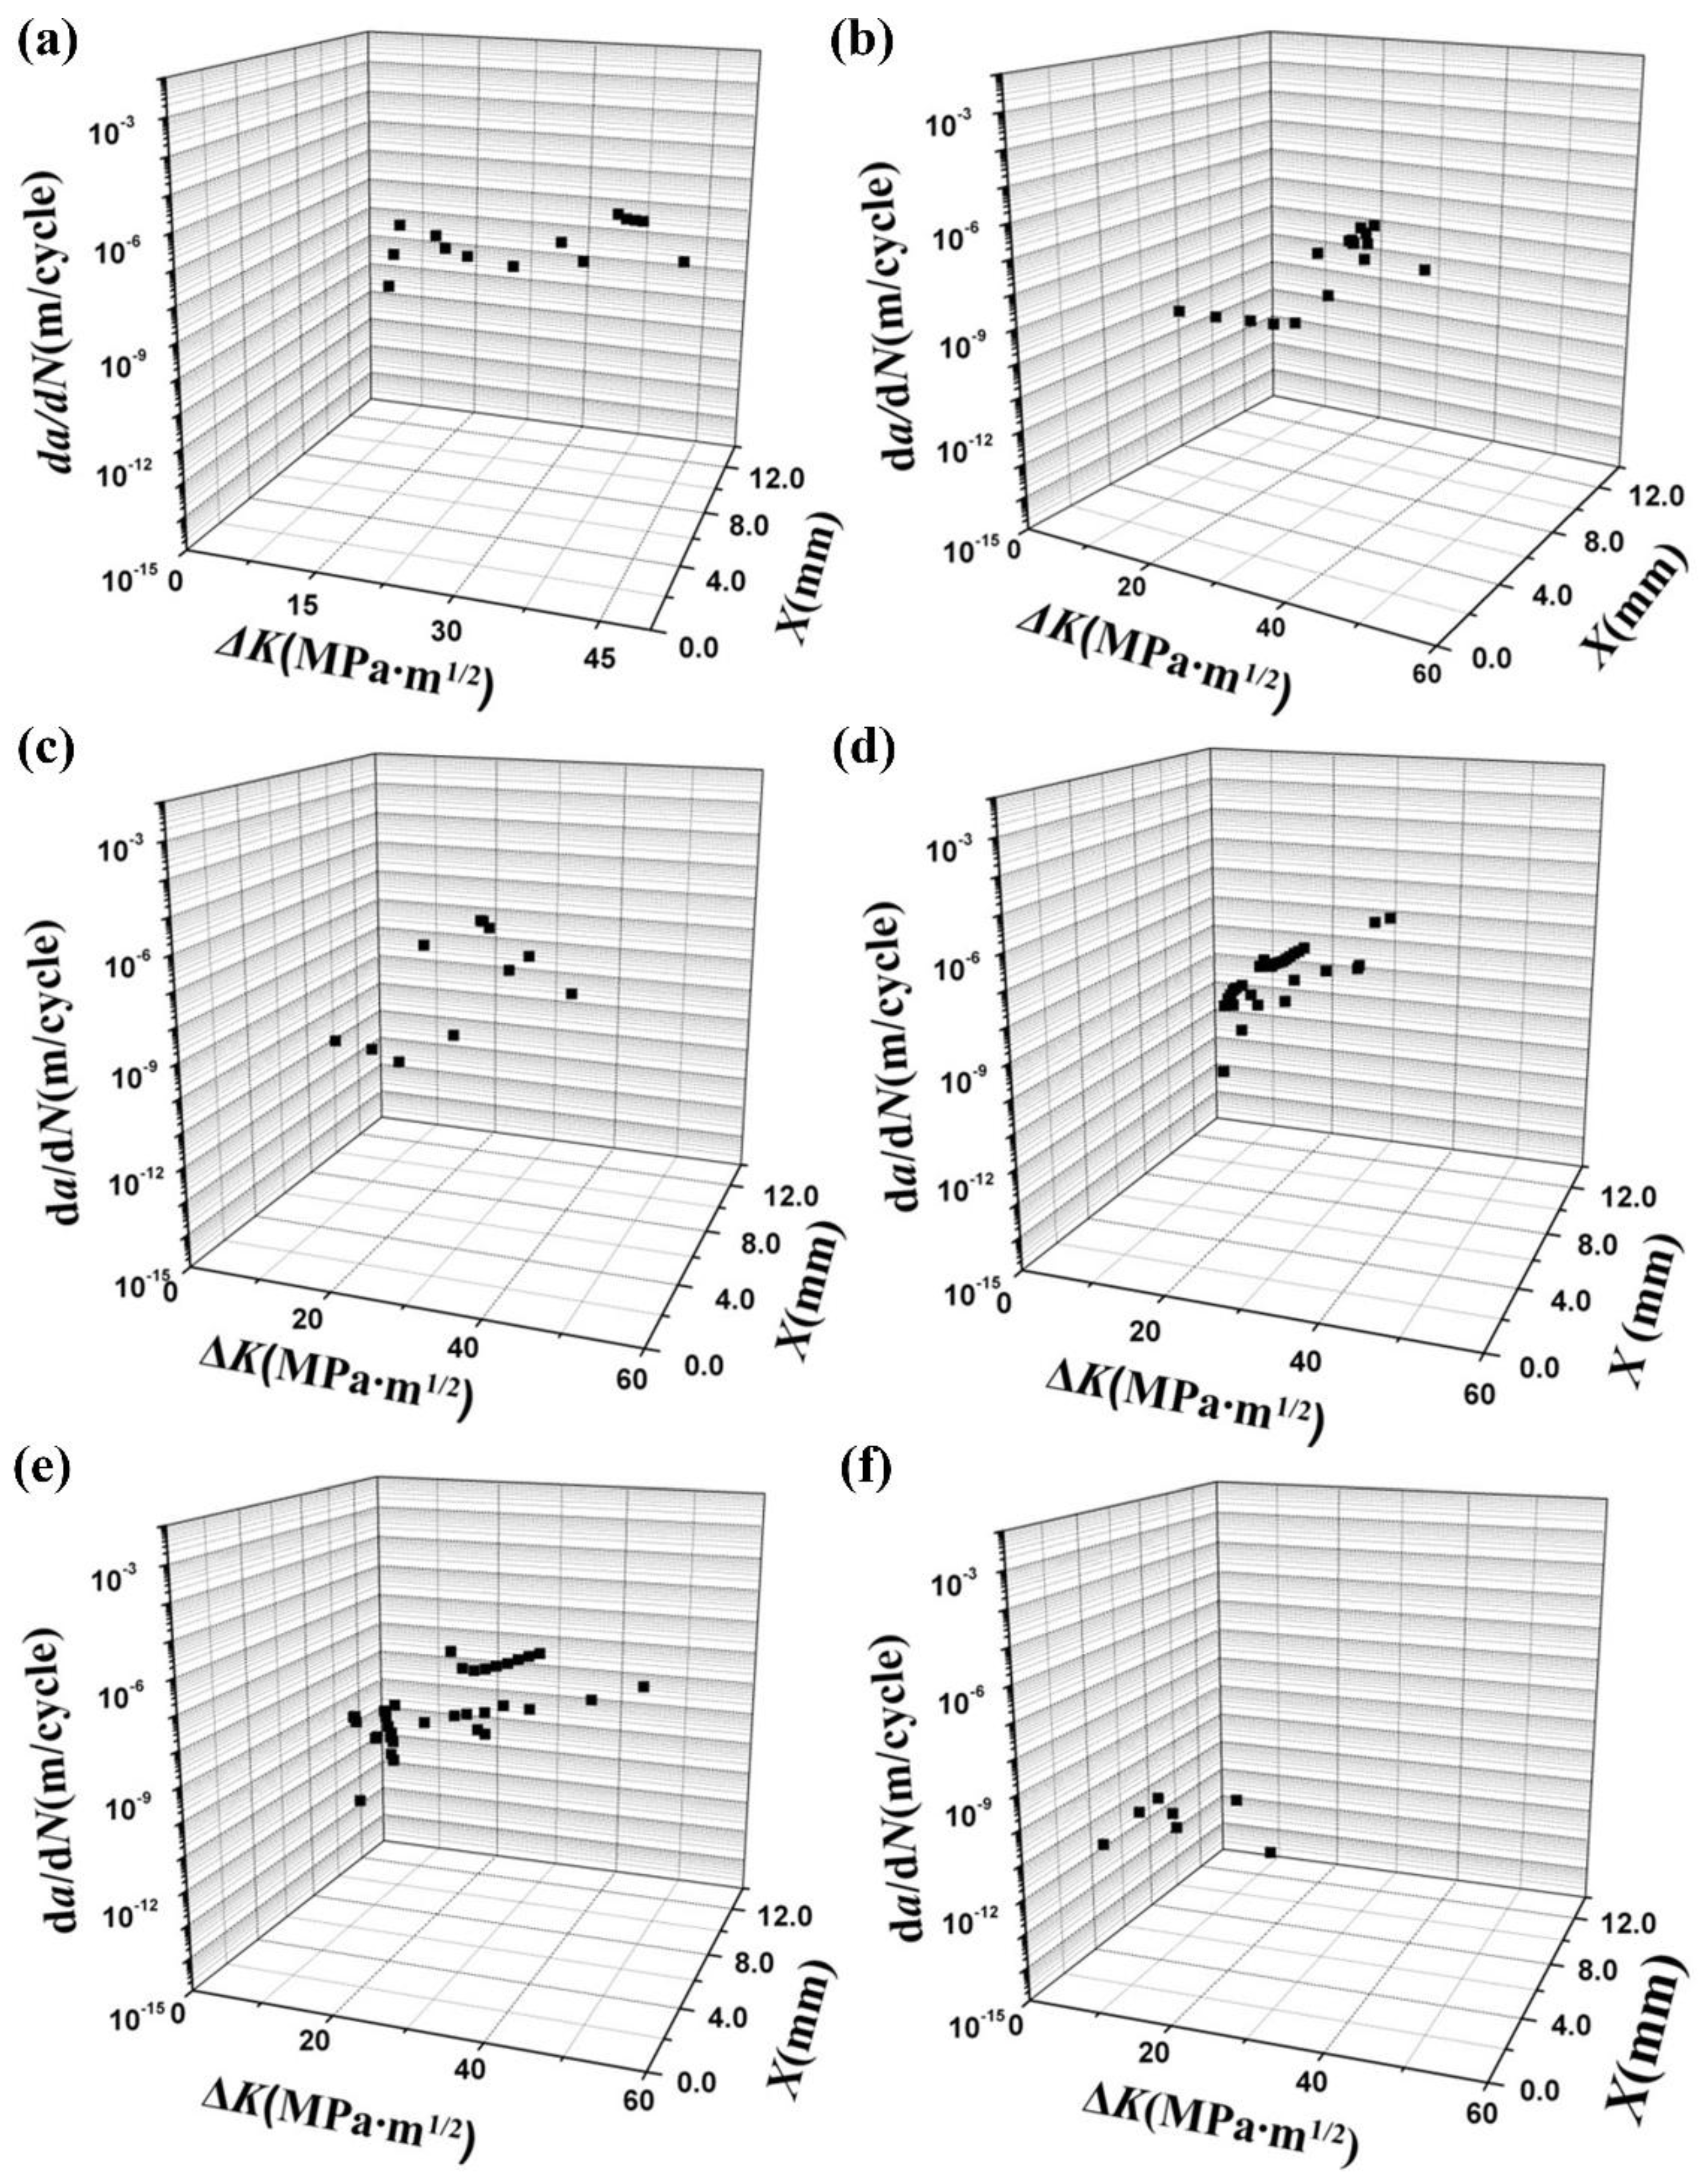
Figure 9.
Summary diagrams of da/dN and ΔK data: (a) da/dN–X–ΔK, and (b) da/dN–ΔK–X.
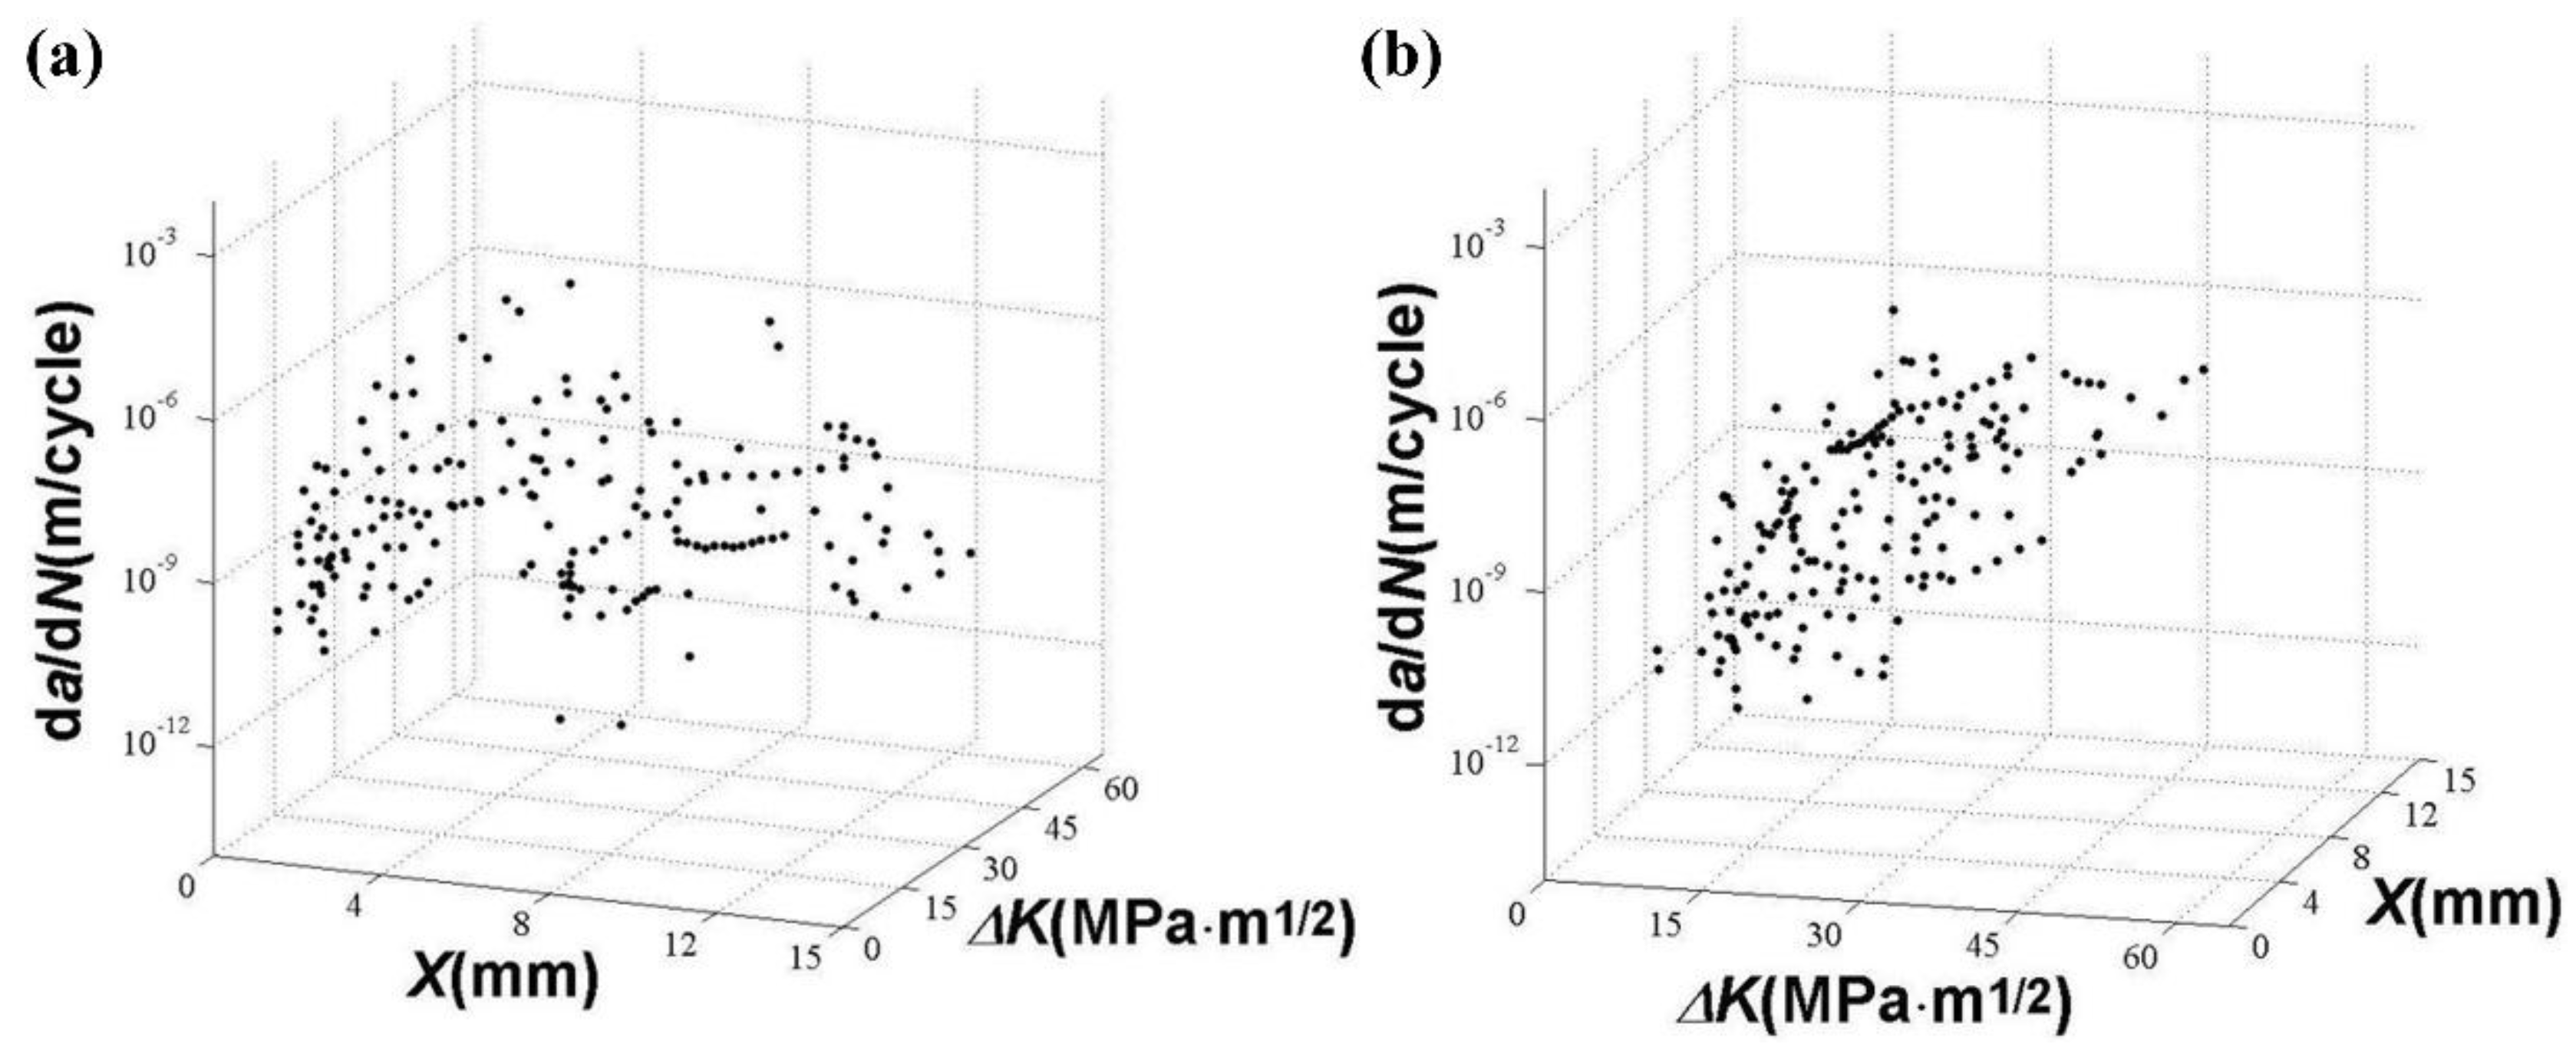
Figure 10.
Relationship between da/dN and ΔK within different depth ranges from the specimen surface: (a) 0–2 mm; (b) 2–6 mm; (c) 6–15 mm.
Figure 10.
Relationship between da/dN and ΔK within different depth ranges from the specimen surface: (a) 0–2 mm; (b) 2–6 mm; (c) 6–15 mm.
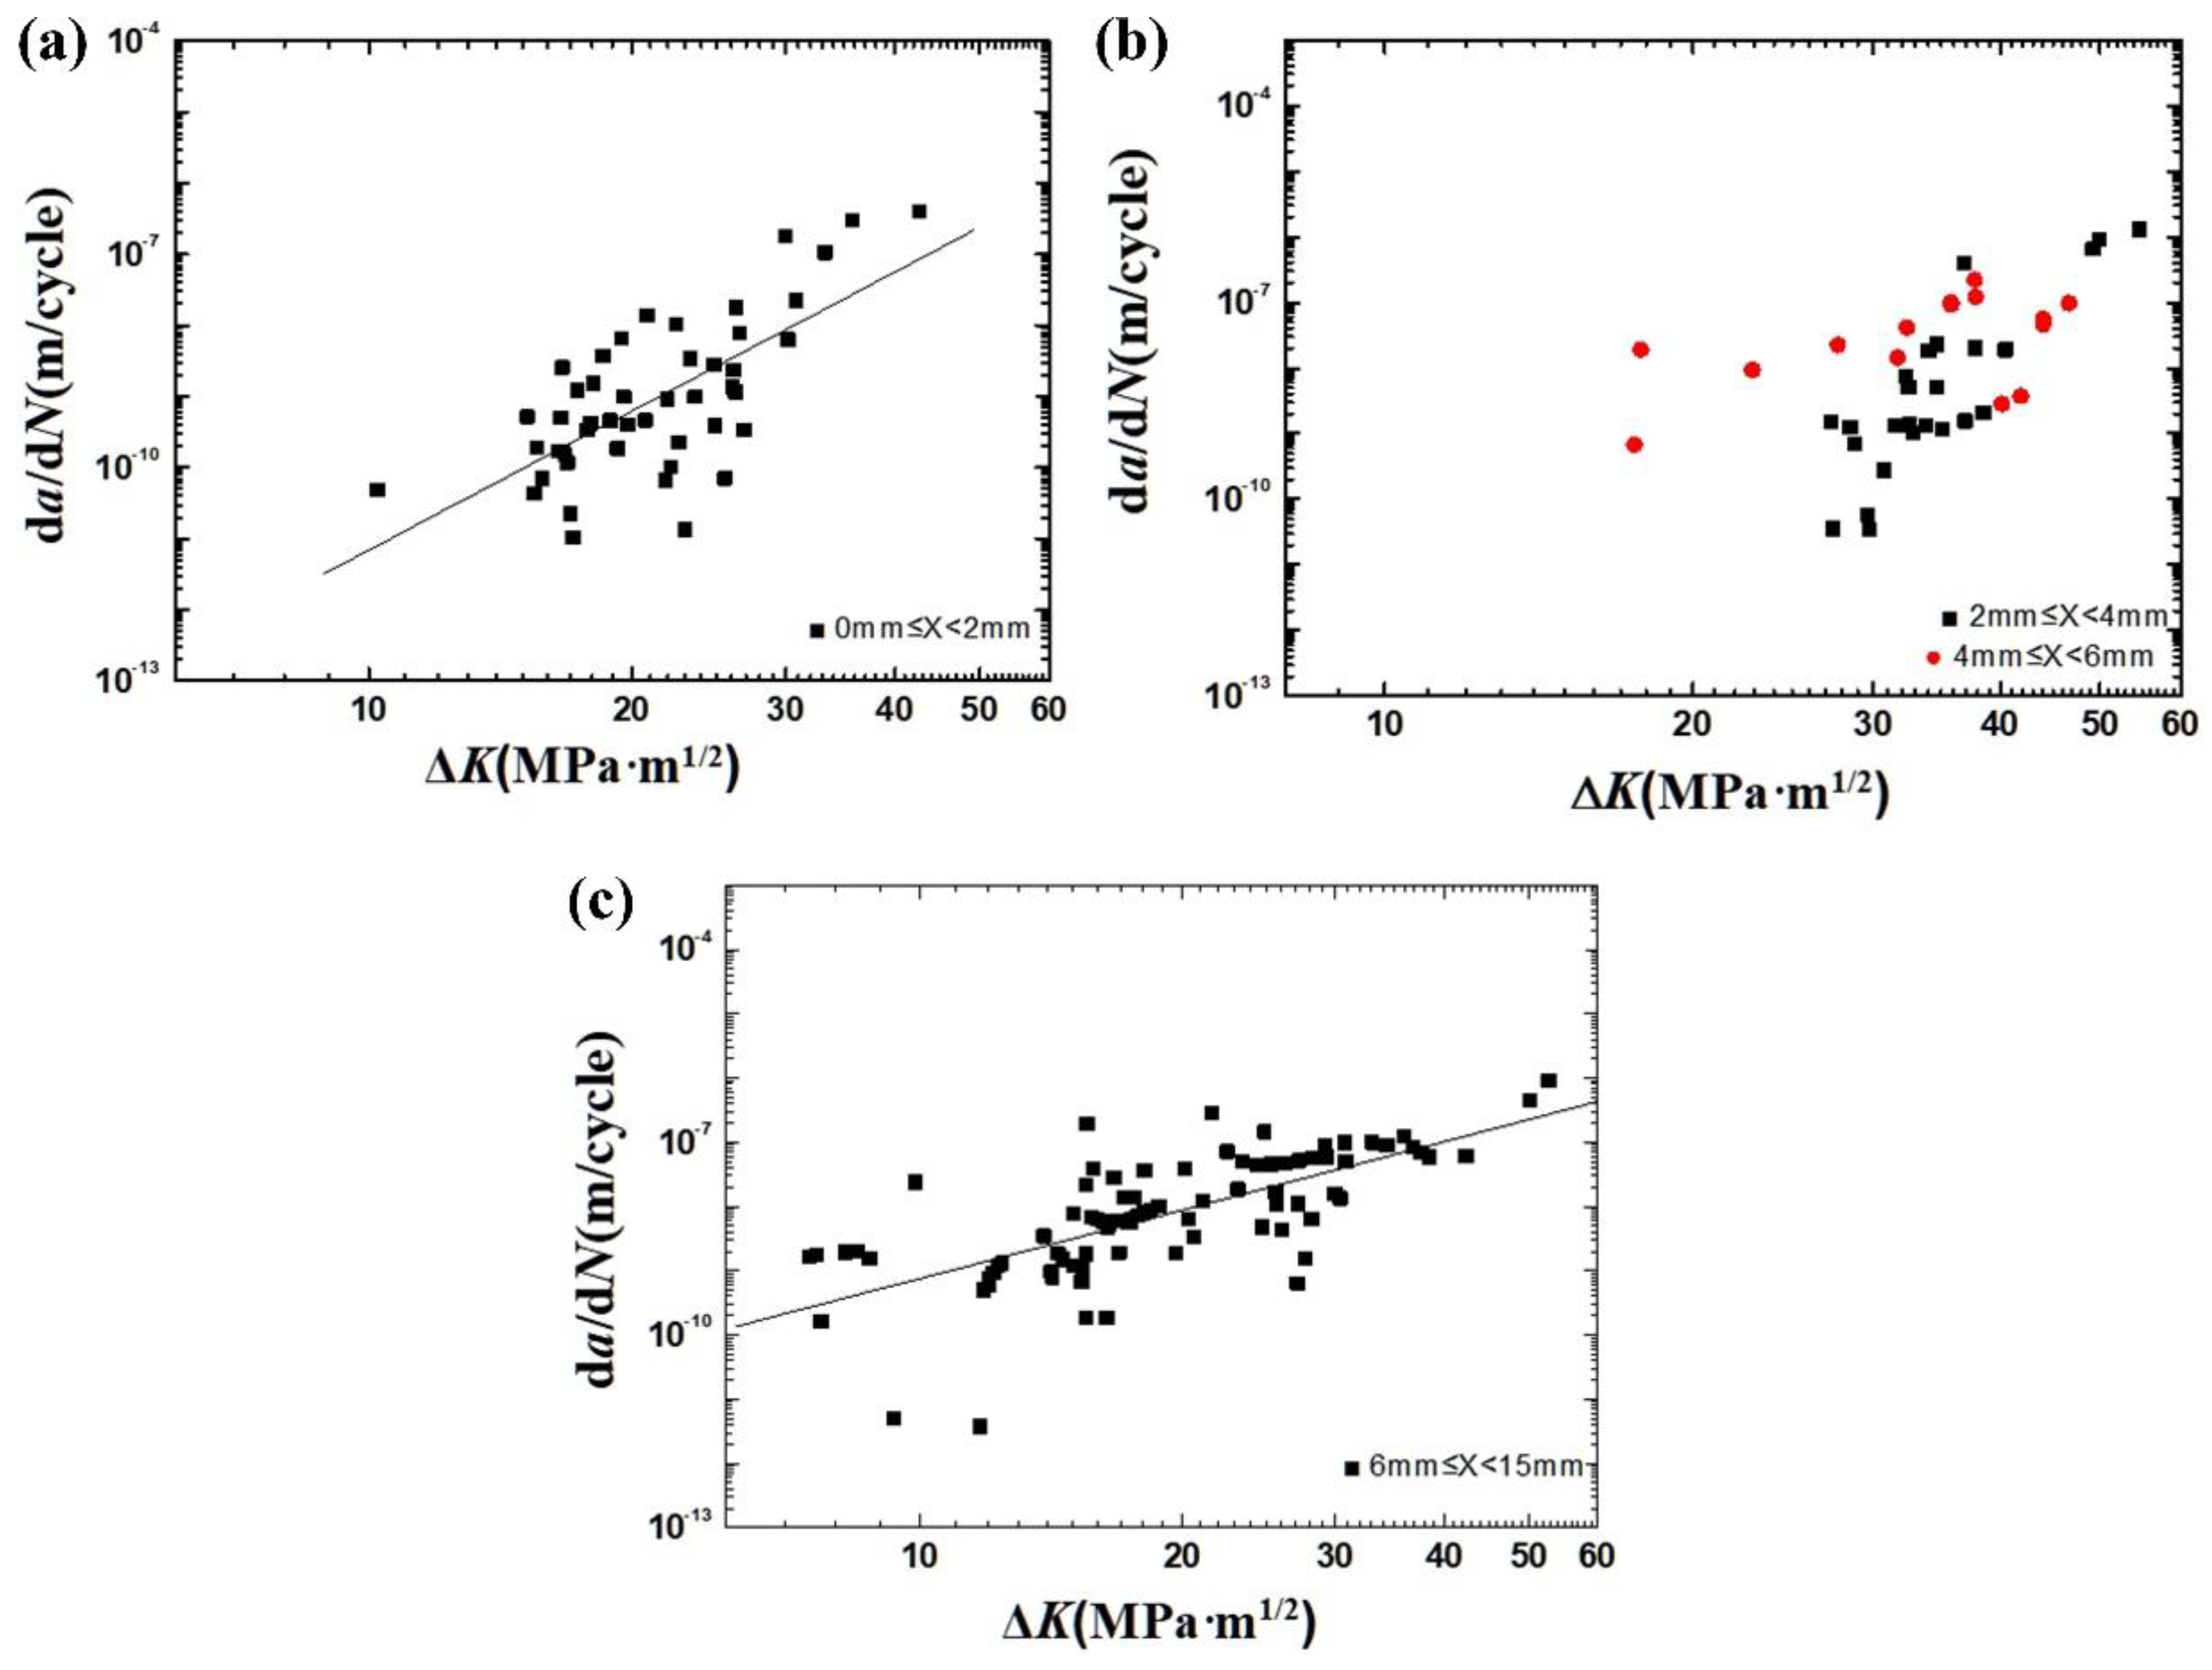

Table 1.
The actual sizes of the three-point bending specimens.
| Specimen Number | Width (mm) | Height (mm) |
|---|---|---|
| 1 | 15.60 | 30.90 |
| 3 | 16.00 | 31.00 |
| 4 | 16.00 | 30.70 |
| 8 | 15.98 | 31.20 |
| 17 | 15.88 | 30.80 |
| 21 | 15.70 | 31.00 |
Disclaimer/Publisher’s Note: The statements, opinions and data contained in all publications are solely those of the individual author(s) and contributor(s) and not of MDPI and/or the editor(s). MDPI and/or the editor(s) disclaim responsibility for any injury to people or property resulting from any ideas, methods, instructions or products referred to in the content. |
© 2025 by the authors. Licensee MDPI, Basel, Switzerland. This article is an open access article distributed under the terms and conditions of the Creative Commons Attribution (CC BY) license (http://creativecommons.org/licenses/by/4.0/).
Copyright: This open access article is published under a Creative Commons CC BY 4.0 license, which permit the free download, distribution, and reuse, provided that the author and preprint are cited in any reuse.


