
Submitted:
13 July 2025
Posted:
15 July 2025
You are already at the latest version
Abstract
Background/Objectives: Taste receptors are expressed in the oral cavity and numerous extra-oral tissues, where they use a universal chemical language. In this wide contest, taste receptors modulate feeding behavior, maintain metabolic balance and physiological homeostasis potentially contributing to exceptional longevity. Genetic variants of these receptors are associated with their sensitivity or expression. Methods: We evaluated differences in genotype and allele frequencies at the TAS1R2, TAS1R3, TAS2R38, and CD36 single gene polymorphism (SNPs) and their associations with BMI in two genetically and environmentally distinct Sardinian populations: a cohort of near-centenarian participants (LBZ) and a control cohort (CYME). The associations between the SNPs, BMI, and gender were also analyzed. Results: Significant differences were observed in the genotype and allele distributions of the TAS1R3, TAS2R38, and CD36 SNPs. In the LBZ cohort, specific genotypes such as TAS1R3 CC, TAS2R38 PAV/PAV, and CD36 GG were most frequent contributing to favorable phenotypes, whereas these genotypes showed no effect in the more heterogeneous urban CYME population. The TAS1R2, TAS1R3, TAS2R38, and CD36 variants modulated BMI in an environmental- and sex-dependent manner. Conclusions: These results underscore the importance of integrating genetic screening into nutritional and metabolic health assessments, considering sex and environmental context in gene–phenotype associations, suggesting that BMI may not be a universal health metric, especially in genetically unique or long-lived populations. These results contribute to the expanding understanding of taste receptors as multifunctional chemosensors, with roles extending beyond gustatory perception to influence systemic physiology, energy balance, and potentially contributing to longevity-associated phenotypes.
Keywords:
taste receptor genetic variants
; human longevity
; BMI
1. Introduction
The gustatory system is a sensory modality through which taste receptor cells transduce chemical stimuli into neural signals, thereby providing critical information not only about the palatability and nutritional content of ingested substances but also about broader physiological and homeostatic states [1,2]. Recent investigations have expanded this paradigm, revealing that taste receptors are expressed in a wide range of extra-oral tissues, including the respiratory and gastrointestinal systems, pancreas, liver, kidneys, testes, bladder, and central nervous system [3,4,5,6,7,8,9]. Within these locations, taste receptors are increasingly recognized as integral components of chemosensory networks that modulate diverse physiological processes. Although the precise mechanisms underlying their function in these tissues remain incompletely understood, current evidence suggests that they utilize transduction pathways and intracellular signaling cascades analogous to those in lingual taste cells [4,7]. Importantly, alterations in the expression, localization, or sensitivity of these extra-oral taste receptors, as well as their associated signaling pathways, have been implicated in the dysregulation of physiological homeostasis [4]. These findings underscore the relevance of taste receptors as multifunctional chemosensors with emerging roles in physiology and interoceptive signaling.
In humans, taste receptors were characterized by their canonical function within the taste buds of the tongue, where they mediate the detection of five fundamental taste modalities: sweet, sour, salty, umami, and bitter [10]. Fat perception has been described as a sixth potential taste quality [11]. Among the various taste receptors implicated in nutrition and systemic health, T1Rs, T2Rs, and CD36 have emerged as key molecular sensors. The T1R family, particularly the T1R2/T1R3 heterodimer, mediates sweet taste perception and plays a crucial role in detecting energy-dense carbohydrates, while T1R1/T1R3 is responsible for umami detection, signaling the presence of amino acids [12]. These receptors are not only expressed in the oral cavity but also in the gastrointestinal tract, where they influence nutrient sensing, insulin secretion, and satiety signaling. Genes encoding sweet (T1R2/T1R3) receptors exhibit genetic single nucleotide polymorphisms (SNPs), such as rs35874116 SNP in the TAS1R2 gene, and rs307355 SNP in the TAS1R3 gene, that affect taste sensitivity and food preferences. These variants may lead to increased consumption of sugary foods to achieve the same hedonic response, thereby contributing to higher caloric intake and greater risk of obesity [13].
T2Rs, traditionally associated with bitter taste, are now recognized for their broader physiological roles, including modulation of immune responses and gut motility, and are expressed in tissues such as the gut, airways, and brain [8]. Among them, TAS2R38 has been extensively investigated due to its role in mediating the perception of bitter taste of phenylthiocarbamide (PTC) and 6-n-propylthiouracil (PROP) thiourea. Variants of the TAS2R38 gene, particularly the common haplotypes PAV (taster) and AVI (non-taster), underlie significant interindividual variability in bitter taste perception. This variability influences not only the acceptance or rejection of bitter-tasting foods, such as cruciferous vegetables, but also broader dietary behaviors and nutritional choices [1,14,15,16,17]. Consequently, TAS2R38 SNPs have been linked to differences in body mass composition, nutrient intake, and even non-gustatory physiological mechanisms, including immune responses, metabolic regulation, and the biological process of aging [1,2,8,14,17,18,19,20].
In addition to these families, CD36, a transmembrane glycoprotein expressed on various cell types [21,22], facilitates the uptake and oxidation of fatty acid (FA), and is involved in the pathophysiological mechanisms associated with dysfunctional FA metabolism [23,24,25,26]. CD36 is a critical receptor for sensing of dietary lipids, particularly long-chain fatty acids (LCFAs) [27,28,29,30,31]. Expressed on the apical surface of taste bud cells, CD36 mediates the orosensory perception of fat and initiates cephalic phase responses that prepare the body for lipid digestion and absorption [32]. Genetic inactivation of CD36 in animal models abolishes preference for fatty foods, underscoring its essential role in fat taste perception and dietary fat intake regulation [32]. Beyond the oral cavity, CD36 and its genetic variant that reduce protein expression [33,34], are involved in lipid metabolism, changes in levels of circulating endocannabinoids, inflammation, and energy homeostasis, linking CD36 to metabolic disorders such as obesity, insulin resistance, cardiovascular disease, diabetes and cancer [35,36,37,38].
Together, these receptors form a complex chemosensory network that integrates peripheral chemosensory signals with central neural circuits to regulate feeding behavior, maintain metabolic balance, and regulate physiological homeostasis, which may influence exceptional longevity.
In this work, we analyzed the genotype distribution and allele frequency of polymorphisms in the TAS1R2, TAS1R3, TAS2R38, and CD36 genes in a cohort of near-centenarian subjects recruited from a genetically isolated area (Longevity Blue Zone, LBZ) of central-eastern Sardinia Island. This region, comprising six mountainous villages in Ogliastra and Barbagia, has a population of approximately 12,000 inhabitants distributed over 888 km² [39]. Prolonged geographic isolation has resulted in a highly homogeneous genetic profile⁷⁴ and the preservation of distinct sociocultural and anthropological traits [39,40]. The LBZ presents a compelling case study, exhibiting an Extreme Longevity Index (ELI) [41] for cohorts born between 1880 and 1900 that is more than twice the Sardinian average. Accordingly, data from this population were compared with those from an ancestrally diverse cohort of younger, middle-aged, and elderly participants from southern Sardinia. The associations between the gene polymorphisms related to taste and metabolism, body mass index (BMI), and gender were also analyzed.
2. Materials and Methods
2.1. Participants
A total of 274 participants were enrolled in the study and categorized into two groups based on age and geographic origin: Longevity Blue Zone (LBZ) cohort included 114 individuals aged between 90 and 103 years, recruited from the central-eastern region of Sardinia (Ogliastra/Barbagia), and the CYME cohort that included 160 young, middle-aged and elderly participants aged 18 to 67 years, recruited from the city area of Cagliari. Specifically, for the LBZ cohort, the recruitment was conducted through public advertisements of the Longevity Blue Zone Observatory. This research center systematically collects demographic and personal data from LBZ residents aged 65 and older. Only individuals born in this area and aged 90 years or older were eligible to participate in the study, and their blood samples were collected during home interviews. In all participants, body height was measured with a portable stadiometer and body weight with an electronic scale that had a precision of up to 0.1 kg. The BMI was calculated as weight/height2 (kg/m2). Table 1 shows demographic features of the two cohorts. All participants were fully informed about the study’s procedures and objectives and provided written informed consent. The study adhered to the principles outlined in the Declaration of Helsinki (1975, revised in 1983), and the local ethical committee (Comitato Etico ASL no. 1 di Sassari, Italy) approved the study protocol (2101/CE). Written informed consent was obtained from all participants or their caregivers in cases of severe cognitive impairment.
2.2. Molecular Analysis
DNA was isolated from blood samples using the QIAamp® DNA Mini Kit (QIAGEN, Hilden, Germany), following the manufacturer’s protocol. The concentration and purity of the extracted DNA were assessed by measuring absorbance at 260 nm with a NanoDrop One/One Spectrophotometer (Thermo Fisher Scientific).
Participants were genotyped for the rs35874116 (C/T) variant, which results in an isoleucine-to-valine substitution at position 191 (Ile191Val) in the TAS1R2 gene, and for the rs307355 (C/T) variant in the TAS1R3 gene, located -1572 base pairs upstream of the coding region. Additionally, genotyping was performed for three single-nucleotide polymorphisms (SNPs) in the TAS2R38 gene: rs713598, rs1726866, and rs10246939, which cause three amino acid substitutions Pro49Ala, Ala262Val, and Val296Ile, respectively. These SNPs define two main haplotypes, PAV (the dominant taster variant) and AVI (the non-taster recessive one), as well as three less common haplotypes: AAI, AAV, and PVI. Genotyping was also conducted for rs1761667 (G/A) SNP in the CD36 gene located at the −31,118 promoter region of exon 1A.
Molecular analyses were carried out using the TaqMan® SNP Genotyping Assay, following the manufacturer’s guidelines (Applied Biosystems, Life Technologies, Milan, Italy). Reactions were performed in 96-well plates under fast thermal cycling conditions. Each reaction contained 1X TaqMan® Genotyping Master Mix (code: 4371355), 1X TaqMan® Genotyping Assays (C_55646_20, C_188859166_10, C_8876467_10, C_9506827_10, C_9506826_10, and C_8314999_10), 10 ng of DNA, and nuclease-free water.
Amplification and detection were performed using the StepOne™ Real-Time PCR System, and genotypes were determined through allelic discrimination using the Sequence Detection Software (Genotyping—Applied Biosystems, version 2.3; Life Technologies Italia, Monza, Italy). All reactions included positive and negative controls, as well as replicates.
2.3. Statistical Analysis
The genotype distribution and allele or haplotype frequency of the TAS1R2, TAS1R3, TAS2R38 and CD36 SNPs of the two cohorts were compared using Fisher’s exact test (Genepop software version 4.2; http://genepop.curtin.edu.au/genepop_op3.html).
One-way ANOVA was used to compare the BMI differences between LBZ and CYME cohorts and those of the females with genotype CC of the TAS1R3 of the two cohorts. Two-way ANOVA was used to analyze the differences in BMI between the two cohorts, stratified by gender, and according to polymorphisms in the TAS1R2, TAS1R3, TAS2R38, and CD36 genes. The same analysis was carried out separately in males and females between the two cohorts. Post hoc comparisons were performed with the Fisher least significant difference (LSD) test, unless the assumption of homogeneity of variance was violated, in which case the Duncan’s test was used. Statistical analyses were conducted using STATISTICA for Windows (version 10; StatSoft Inc., Tulsa, OK). The significance level was set at p < 0.05.
3. Results
3.1. Genotype Distributions and Allele Frequencies of the TAS1R2, TAS1R3, TAS2R38, and CD36 SNPs in LBZ and CYME Cohorts
The genotype distributions and haplotype frequencies of polymorphisms of the TAS1R2, TAS1R3, TAS2R38, and CD36 genes in the LBZ and CYME cohorts are shown in Figure 1. The two cohorts differed statistically based on the genotype distributions (; Χ2 = 13.918; p = 0.0009 Fisher’s exact test) and allele frequencies of TAS1R3 SNPs (Χ2 = 13.776; p = 0.0010 Fisher’s exact test), the diplotype distributions (Χ2 = 8.248; p = 0.0181; Fisher’s exact test) and haplotype frequencies of TAS2R38 SNPs (Χ2 = 8.566; p= 0.0138; Fisher’s exact test), and the genotype distributions of CD36 SNP (Χ2 = 6.875; p = 0.032; Fisher’s exact test), while the allele frequencies for this locus was at the limit of significance (Χ2 = 5.887; p = 0.052; Fisher’s exact test). No difference on the genotype distributions (Χ2 = 1.402; p = 0.496; Fisher’s exact test) and allele frequencies of TAS1R2 SNP were found (Χ2 = 1.279; p = 0.527; Fisher’s exact test). Specifically, concerning the TAS1R3 locus, the LBZ cohort was characterized by a very high frequency of genotype CC (97.4%) and allele C (98.7%), a very low frequency of heterozygous CT (2.6%) and allele T (1.3%), and no one had genotype TT, while the CYME cohort showed 86.3% of participants with genotype CC, 13.1% of heterozygous and 0.6% of TT genotypes. Relatively to the TAS2R38 locus, the LBZ cohort was characterized by a higher frequency of the diplotype PAV/PAV (30.7%) and a lower frequency of diplotype AVI/AVI (21.9%) compared to the CYME cohort (PAV/PAV, 21.9% and AVI/AVI, 35%, respectively), and relatively to the CD36 locus, the LBZ cohort was characterized by a higher frequency of genotype AA (23.7%) and a lower frequency of genotype GG (21.9%) compared to the CYME cohort (13.8% and 30%, respectively).
Considering only females, the two cohorts differed statistically based on the genotype distributions (Χ2 = 13.215; p = 0.0013 Fisher’s exact test) and allele frequencies of TAS1R3 SNPs (Χ2 = 12.731; p = 0.0017 Fisher’s exact test). No other differences in the genotype distributions and haplotype frequencies between the two cohorts in females and males (Table S1).
3.2. Associations Between the TAS1R2, TAS1R3, TAS2R38, and CD36 SNPs, BMI, and Gender in LBZ and CYME Cohorts
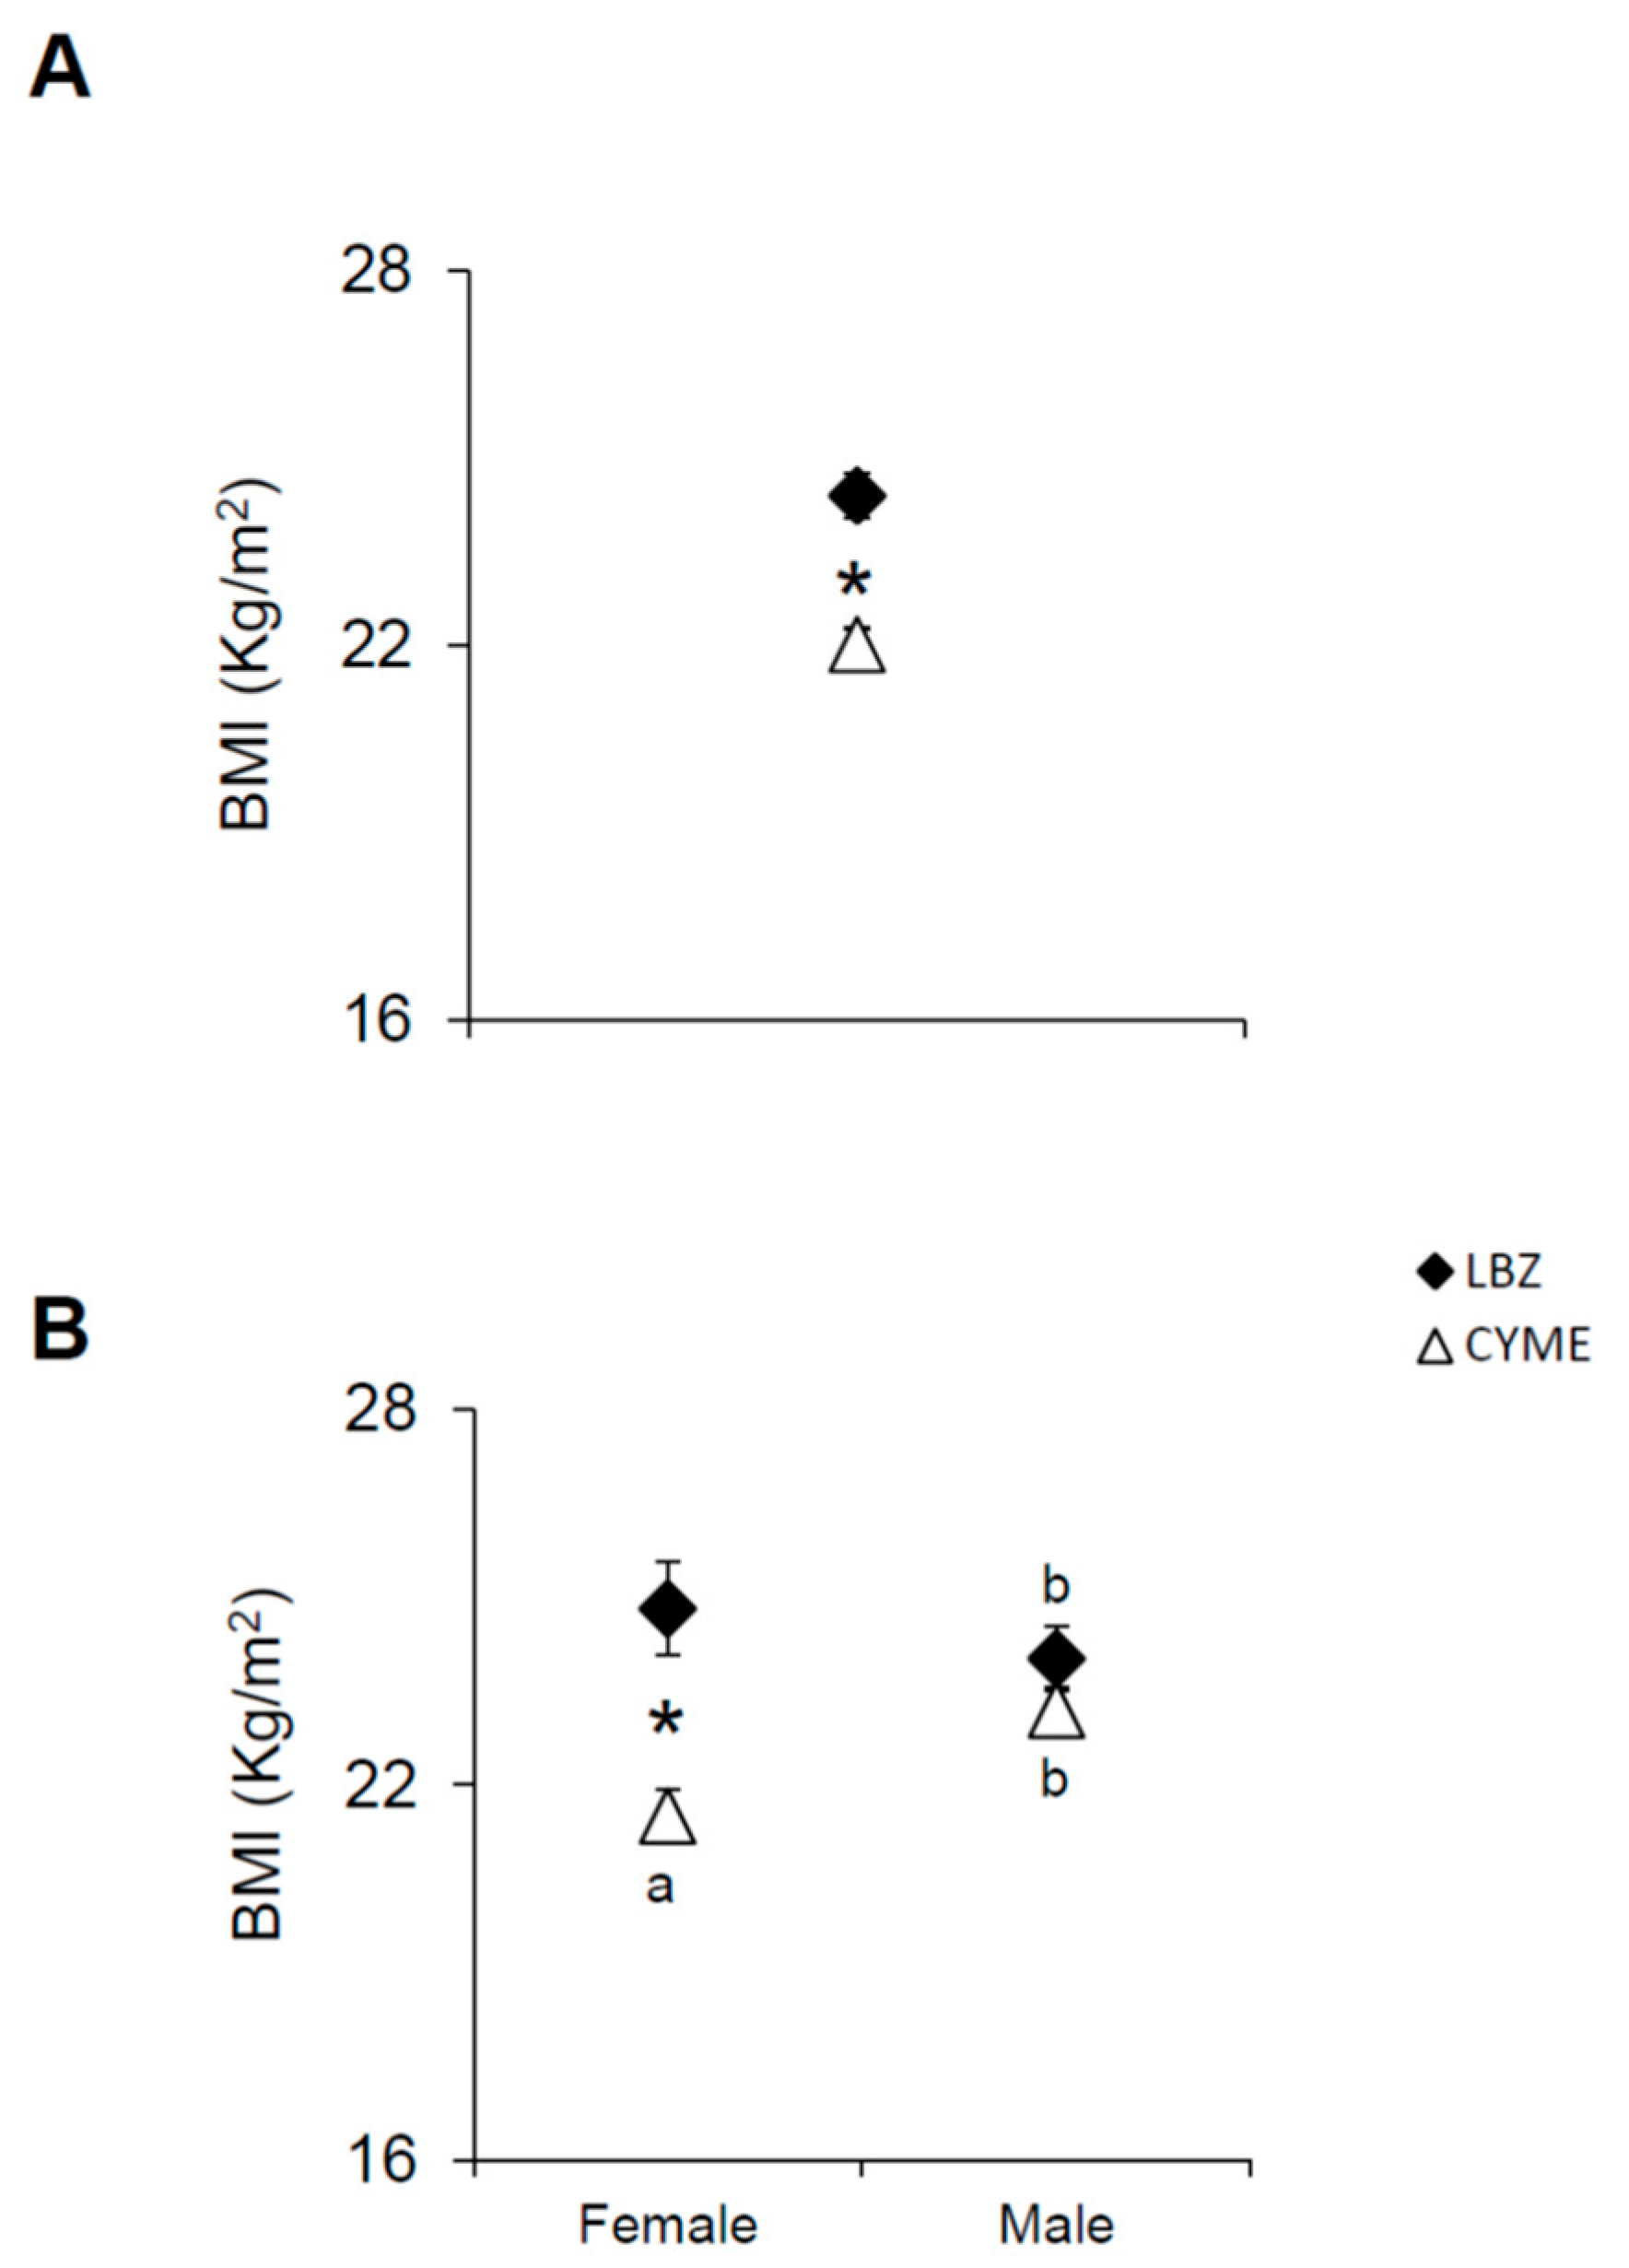
The Mean values ± SEM of body mass index (BMI) in the LBZ were significantly higher than those of CYME participants (F[1,274] = 30.434; p < 0.0001) (Figure 1 A). ANOVA revealed a significant two-way interaction of GENDER × LBZ/YCME cohort for the BMI values (F[1,272] = 8.2566; p = 0.00445) (Figure 1 B). Post hoc comparisons showed that the BMI of LBZ females was significantly higher than that of CYME females (p < 0.0001, Fisher LSD test), which showed BMI values lower than those of males of the two cohorts (p < 0.0012, Fisher LSD test).
Figure 2.
Mean values ± SEM of body mass index (BMI) in the Longevity Blue Zone cohort (LBZ) (n = 114) and Cagliari Young, Middle-aged, and Elderly participants (CYME) (n = 160) (A). Different letters indicate significant difference (p < 0.0012; Fisher LSD test, subsequent two-way ANOVA).
Figure 2.
Mean values ± SEM of body mass index (BMI) in the Longevity Blue Zone cohort (LBZ) (n = 114) and Cagliari Young, Middle-aged, and Elderly participants (CYME) (n = 160) (A). Different letters indicate significant difference (p < 0.0012; Fisher LSD test, subsequent two-way ANOVA).
The mean values ± SEM of BMI in the LBZ and CYME participants, according to polymorphisms in the TAS1R2, TAS1R3, TAS2R38, and CD36 loci, are shown in Figure 3. ANOVA revealed significant two-way interactions of the TAS1R2 SNP × LBZ/CYME cohort and the TAS2R38 SNP × LBZ/CYME cohort for the BMI values (F[2,270] = 5.0349; p = 0.0073 and F[2,270] = 5.874; p = 0.0036, respectively). Post hoc comparisons showed that the BMI of LBZ participants with the TT genotype of the TAS1R2 was significantly higher than that of participants with the CT and CC genotypes (p = 0.0008 and p = 0.0072, respectively, Fisher LSD test), the BMI of TT and CT genotypes was higher than that of the corresponding genotypes of the CYME cohort (p < 0.0001 and p = 0.0008; Fisher LSD test), while no difference related to the genotypes was found in the CYME cohort (p > 0.05) (Figure 2 A). No difference related to the genotype of TAS1R3 was found in the two cohorts (p > 0.05) (Figure 2 B). The BMI of LBZ participants who had the three diplotypes of the TAS2R38 locus was higher than that of the corresponding diplotypes of the CYME cohort (AVI/AVI, p = 0.013; PAV/AVI, p = 0.00002; PAV/PAV, p = 0.043, Fisher LSD test), while no difference related to diplotypes was found in the LBZ or CYME cohort (p > 0.05) (Figure 2 C). Post hoc comparison also showed that the BMI of LBZ participants who had the GG genotype of the CD36 locus was significantly lower than that of LBZ participants with GA and AA genotypes (p = 0.004 and p = 0.0007; Fisher LSD test), which showed higher BMI values than those of the corresponding genotypes of the CYME cohort (p < 0.0001 and p = 0.013; Fisher LSD test), while no difference in BMI was found between GG participants of the two cohorts (p > 0.05) (Figure 2 D). In the CYME cohort, the three genotypes of this locus exhibited BMI values that did not differ from each other (p > 0.05).
Figure 4 shows the mean values ± SEM of body mass index (BMI) according to polymorphisms in the TAS1R2, TAS1R3, TAS2R38, and CD36 genes in females of the LBZ and CYME cohorts. ANOVA revealed significant two-way interactions of the TAS1R2 SNP × LBZ/CYME cohort and the CD36 SNP × LBZ/CYME cohort for the BMI values (F[2,165] = 4.4652; p = 0.0133 and F[2,165] = 7.963; p = 0.00053, respectively). Post hoc comparisons showed that the BMI of LBZ females with the TT genotype of the TAS1R2 was significantly higher than that of females with the CT and CC genotypes (p = 0.0091 and p = 0.013, respectively, Fisher LSD test), the BMI of TT and CT genotypes was higher than that of the corresponding genotypes of the CYME cohort (p < 0.0001 and p = 0.0059; Fisher LSD test), while no difference related to the genotypes was found in the CYME cohort (p > 0.05) (Figure 4 A). No difference related to the genotype of TAS1R3 was found in the two cohorts (p > 0.05). BMI values in females with genotype CC of TAS1R3 in the LBZ cohort were significantly higher than those of CYME participants (F[1,129] = 29.351; p < 0.0001) (Figure 4 B). The BMI of LBZ females who had the PAV/PAV diplotype was significantly lower than that of LBZ females with AVI/AVI genotype (p = 0.0397; Fisher LSD test), while heterozygous showed intermediate values, the BMI of heterozygous and AVI/AVI diplotype of the LBZ females was higher than that of the corresponding diplotype of the CYME cohort (p = 0.00001 and p = 0.00076; Fisher LSD test), while no difference in BMI was found between PAV/PAV females of the two cohorts (p > 0.05) or related to diploypes in the CYME females (p > 0.05)(Figure 4 C). Post hoc comparison also showed that the BMI of LBZ females who had the GG genotype of the CD36 locus was significantly lower than that of LBZ females with GA and AA genotypes (p = 0.0007 and p = 0.0050; Fisher LSD test), which showed higher BMI values than those of the corresponding genotypes of the CYME cohort (p < 0.0001 and p = 0.009; Fisher LSD test), while no difference in BMI was found between GG females of the two cohorts ( p > 0.05) (Figure 4 D). In the CYME cohort, the three genotypes of this locus exhibited BMI values that did not differ from each other (p > 0.05).
Figure 5 shows the mean values ± SEM of body mass index (BMI) according to polymorphisms in the TAS1R2, TAS1R3, TAS2R38, and CD36 genes in males of the LBZ and YCME cohorts. The BMI of LBZ males with the TT genotype of the TAS1R2 was higher than that of participants with the CT genotype (p = 0.034, Fisher LSD test), the BMI of males with TT genotype was higher than that of the corresponding genotype of the CYME cohort (p = 0.010; Fisher LSD test), while no difference related to the genotypes was found in the CYME cohort (p > 0.05) (Figure 5 A). No difference related to the genotypes of TAS1R3 or TAS2R38 was found in the two cohorts (p > 0.05) (Figure 5 B, C). The BMI of LBZ males who had the GG genotype of the CD36 locus was significantly lower than that of LBZ males with AA genotype (p = 0.044; Fisher LSD test), while no difference related to CD36 genotypes was found in CYME males (Figure 5 D).
4. Discussion
This study investigated the distribution of polymorphisms in the TAS1R2, TAS1R3, TAS2R38, and CD36 genes and their associations with BMI in two genetically and environmentally distinct Sardinian populations: the Longevity Blue Zone (LBZ) and the Cagliari Young, Middle-aged, and Elderly (CYME) cohort. The findings provide novel insights into how taste receptor gene variants, traditionally associated with oral gustation, may impact systemic metabolic traits, with sex-specific implications for BMI.
The molecular analysis revealed significant differences in genotype distributions and allele frequencies of TAS1R3, TAS2R38, and CD36 between the LBZ and CYME cohorts, reflecting the genetic isolation and homogeneity of the LBZ population, which suggests potential genetic contributions to longevity and metabolic traits in the LBZ population. These findings align with previous studies showing that taste receptor gene variants can vary significantly across populations and may be subject to positive selection due to their roles in nutrient sensing and metabolic regulation [42,43,44,45,46]. Notably, the LBZ cohort exhibited a highly homogeneous profile in the TAS1R3 locus, with nearly all individuals carrying the CC genotype and C allele, and no TT genotypes. This contrasts with the CYME cohort, which showed greater genetic diversity. TAS1R3 encodes a subunit of the sweet and umami taste receptors and is known to be highly conserved across populations [47]. Variants in TAS1R3 have been associated with differences in sweet taste sensitivity and dietary sugar intake. Subjects carrying the heterozygous or homozygous genotype for the T allele had a lower sweet sensitivity than those with two C alleles [48,49,50]. Although TAS1R3 SNP did not correlate with BMI in this study, based on previous research that has associated the C allele with higher sweet taste sensitivity and lower sugar intake, the near-fixation of the CC genotype in the LBZ cohort may reflect a protective genetic trait against energy imbalance due to a high caloric intake [51]. However, fortuitous recruitment cannot be excluded in a cross-sectional study. In contrast, no significant differences were found in the TAS1R2 genotype distributions or allele frequencies, suggesting a lesser role for this gene in differentiating the two populations.
TAS2R38 receptor, and its genetic variants, have been extensively studied for their roles in the taste perception of the bitter compound 6-n-propylthiouracil (PROP), which has been considered as an oral marker for interindividual differences in general taste perception, general food preferences and dietary behaviour, variations in body mass composition and other non-tasting physio-pathological mechanisms, including longevity [1,2,8,14,17,18,19,20]. The molecular analysis of the TAS2R38 SNPs showed significant differences in diplotype distributions and haplotype frequencies between the two cohorts. Consistent with an our previous work [52], the LBZ cohort exhibited a significantly higher frequency of the PAV/PAV diplotype and PAV haplotype, both associated with physiological processes [53,54,55,56], an efficient immune response [8,57,58,59,60,61,62,63], and a favourable body composition [1,64,65,66]. In contrast, the CYME cohort had a higher frequency of the AVI/AVI diplotype and AVI haplotype, which have been associated with a higher risk of developing various dysfunctions and diseases [53,54,55,56,57,58,59,60,67,68,69,70]. These differences, which are not surprising in a cohort with exceptional longevity, also suggest that taste perception genetics may diverge between populations with distinct lifestyles and longevity profiles. The higher prevalence of the PAV variant in the LBZ cohort could reflect dietary adaptations or preferences that contribute to healthier aging.
The analysis at the CD36 locus (encoding a fatty acid translocase involved in fat perception and lipid metabolism [32,37]) showed significant genotype distribution differences between cohorts. The LBZ cohort had a higher frequency of the AA genotype, whereas the CYME cohort had a higher frequency of the GG genotype. These differences may indicate variations in fat taste sensitivity and lipid metabolism between cohorts, potentially influencing dietary habits and metabolic health. The higher frequency of the A allele in the LBZ cohort could be associated with more efficient fat metabolism or altered fat preference, which may contribute to the lower prevalence of obesity and metabolic disorders observed in longevity populations [71].
These results indicate that the genetic profiles of the LBZ and CYME cohorts differ significantly in loci associated with taste perception and fat metabolism, highlighting a near-fixation of the TAS1R3 CC genotype, a higher prevalence of the TAS2R38 PAV/PAV diplotype and CD36 AA genotype in the LBZ. These patterns may reflect adaptive genetic traits, long-standing dietary patterns, and environmental pressures that contribute to the exceptional longevity and metabolic health. Further studies integrating dietary data, metabolic markers, and longitudinal health outcomes would help clarify the functional implications of these genetic variations.
Interestingly, no significant differences in genotype or diplotype distributions were observed between males and females within each cohort, suggesting that the observed genetic differences are population-wide rather than sex-specific.
The BMI was significantly higher when measured in the LBZ cohort, specifically in females, than in the CYME cohort, despite LBZ being a longevity hotspot. Notwithstanding having higher BMI, LBZ individuals are known for their exceptional longevity. This result, which seems to be a paradox, suggests that BMI alone is not a sufficient predictor of health span, and that genetic resilience, metabolic flexibility, and lifestyle factors may buffer the effects of adiposity [71]. These findings challenge conventional BMI thresholds and support a more nuanced understanding of metabolic health, particularly in aging populations. In addition, the higher BMI that we found in the LBZ cohort agrees with data showing exceptional longevity associated with modest overweight, which suggests low-calorie diets should not be recommended for slightly overweight elderly patients [71].
The associations that we found between taste receptor gene SNPs and BMI were cohort-specific, suggesting that gene–environment interactions play a critical role in modulating metabolic outcomes. A significant interaction between TAS1R2 genotype and cohort (LBZ vs. CYME) was observed for BMI values, indicating that the effect of TAS1R2 variants on BMI differs depending on the population context. In the LBZ cohort, the TAS1R2 TT genotype was consistently associated with higher BMI. This supports the hypothesis that individuals with this genotype, particularly females, may have reduced sweet taste sensitivity, leading to increased sugar consumption to achieve the same hedonic response, as previously reported in other populations [13]. In contrast, no BMI differences related to TAS1R2 genotype in CYME were found.
Although the BMI of the females with the CC genotype (with 100% frequency in LBZ cohort and 88% in CYME cohort), was significantly higher than that of CC females of the CYME cohort, the very low variability in the TAS1R3 that we observed in both cohorts limits the possibility to detect a significant effect on BMI.
Interestingly, while TAS2R38 diplotypes did not show BMI differences within cohorts, LBZ individuals had higher BMI across all diplotypes compared to CYME participants. This may reflect broader population-level differences, potentially mediated by dietary preferences or extra-oral functions of the receptor, such as its role in gut motility and immune modulation [72,73]. Notably, LBZ females with PAV/PAV genotype had significantly lower BMI than AVI/AVI females, AVI/AVI and heterozygous LBZ females had higher BMI than the corresponding diplotypes in CYME, while no difference was observed for PAV/PAV females between cohorts. No BMI differences related to TAS2R38 genotype were found in both cohorts. These results suggest that TAS2R38 variations may influence BMI in a genotype- and environment-specific manner, specifically in females.
The CD36 gene emerged from our findings as a particularly important modulator of BMI in the LBZ cohort. A significant interaction between CD36 genotype and cohort (LBZ vs. CYME) was observed for BMI values, indicating that the effect of CD36 variants on BMI is context dependent. In the LBZ cohort, the GG genotype, which is associated with enhanced fat taste sensitivity, efficient lipid metabolism, and reduced fat intake [30,37,74,75], was associated with lower BMI compared to those with GA and AA genotypes in both genders. Only LBZ females with GA or AA genotypes had higher BMI than their CYME counterparts, suggesting that these genotypes may be more metabolically disadvantageous in the LBZ environment for females. Interestingly, no BMI differences were observed among CD36 genotypes in the CYME cohort, indicating that the GG genotype may confer a protective effect, possibly due to lifestyle or dietary factors unique to this population. These findings are consistent with the known roles of CD36 in fatty acid uptake, energy homeostasis, and inflammation, and suggest that genetic variation in fat-sensing pathways may contribute to the metabolic resilience observed in long-lived populations [71]. Moreover, the role of CD36 in cephalic phase responses and lipid sensing may explain the observed BMI differences, especially in a population like the LBZ, where traditional diets and metabolic adaptations may amplify genetic effects.
Our results also showed sex-specific genetic effects, which may reflect hormonal influences on taste receptor expression or inherent sex differences in energy storage and metabolism, consistent with prior findings in both human and animal models [76,77,78]. Notably, despite having higher BMI, LBZ individuals—particularly those with metabolically favorable genotypes—may benefit from protective genetic profiles that mitigate the adverse effects of adiposity, supporting the concept of “healthy obesity” in the context of exceptional longevity. These results emphasize the need to consider sex as a biological variable in genetic and nutritional research.
5. Conclusions
This work contributes to the understanding of taste receptors as complex and multifunctional chemosensors that integrate peripheral chemosensory signals with central neural circuits. Beyond mediating gustatory perception, taste receptors influence feeding behaviors, systemic metabolic regulation, and potentially longevity-associated phenotypes. By analyzing polymorphisms in TAS1R2, TAS1R3, TAS2R38, and CD36 genes and their associations with BMI and gender in two distinct Sardinian populations, our results revealed that specific genetic variants may interact with environmental and lifestyle factors to influence BMI in a longevity context, with notable sex-specific effects.
In the LBZ cohort, where longevity and metabolic health are prominent, specific genotypes, such as TAS1R3 CC, TAS2R38 PAV/PAV, and CD36 GG, may contribute to favorable phenotypes, whereas these genotypes have no effect in a more heterogeneous urban population like CYME. These insights could inform personalized nutrition and public health strategies tailored to genetic backgrounds and environmental contexts.
Supplementary Materials
The following supporting information can be downloaded at the website of this paper posted on Preprints.org, Table S1. Genotype distributions and allele or haplotype frequencies of polymorphisms of the TAS1R2, TAS1R3, TAS2R38, and CD36 genes in females and males of the LBZ and CYME cohorts.
Author Contributions
Conceptualization, I.T.B. and G.P.; methodology, M.M. and A.E..; formal analysis, M.M.; data curation, Me.Me. and I.T.B.; writing—original draft preparation, I.T.B.; writing—review and editing, M.M., A.E. and G.P.; funding acquisition, M.M. All authors have read and agreed to the published version of the manuscript.
Funding
research was funded by Fondazione di Sardegna (F73C22001230007 to Me.Me Convenzione triennale 2021-2023; UniCA - Progetti di Ricerca Start-Up D.M. 737/2021 (F25F21002720001 to Me.Me.. Annualità 2023).
Institutional Review Board Statement
The study was conducted in accordance with the Declaration of Helsinki, and approved by the local ethical committee (Comitato Etico ASL no. 1 di Sassari, Italy) approved the study protocol (2101/CE).
Informed Consent Statement
Informed consent was obtained from all subjects involved in the study.
Data Availability Statement
The data presented in this study are available on request from the. corresponding author.
Acknowledgments
The authors thank the volunteers without whose contribution this study would. not have been possible.
Conflicts of Interest
The authors declare no conflicts of interest.
References
- Tepper, B.J. Nutritional implications of genetic taste variation: the role of PROP sensitivity and other taste phenotypes. Annu. Rev. Nutr. 2008, 28, 367–388. [Google Scholar] [CrossRef] [PubMed]
- Tepper, B.J.; et al. Genetic sensitivity to the bitter taste of 6-n-propylthiouracil (PROP) and its association with physiological mechanisms controlling body mass index (BMI). Nutrients 2014, 6, 3363–3381. [Google Scholar] [CrossRef] [PubMed]
- Behrens, M.; Meyerhof, W. Oral and extraoral bitter taste receptors. In Sensory and Metabolic Control of Energy Balance. Results and Problems in Cell Differentiation, 2010/09/25 ed.; Meyerhof, W., Beisiegel, U., Joost, HG., Eds.; Springer: Berlin, Heidelberg, 2011; Volume 52, pp. 87–99. [Google Scholar]
- Depoortere, I. Taste receptors of the gut: emerging roles in health and disease. Gut 2014, 63, 179–190. [Google Scholar] [CrossRef] [PubMed]
- Clark, A.A.; et al. Extraoral bitter taste receptors as mediators of off-target drug effects. FASEB J. 2012, 26, 4827–4831. [Google Scholar] [CrossRef] [PubMed]
- Laffitte, A.; et al. Functional roles of the sweet taste receptor in oral and extraoral tissues. Curr. Opin. Clin. Nutr. Metab. Care 2014, 17, 379–385. [Google Scholar] [CrossRef] [PubMed]
- Yamamoto, K.; Ishimaru, Y. Oral and extra-oral taste perception. Semin. Cell Dev. Biol. 2013, 24, 240–246. [Google Scholar] [CrossRef] [PubMed]
- Lu, P.; et al. Extraoral bitter taste receptors in health and disease. J. Gen. Physiol. 2017, 149, 181–197. [Google Scholar] [CrossRef] [PubMed]
- Singh, N.; et al. Functional bitter taste receptors are expressed in brain cells. Biochem. Biophys. Res. Commun. 2011, 406, 146–151. [Google Scholar] [CrossRef] [PubMed]
- Chaudhari, N.; Roper, S.D. The cell biology of taste. J. Cell Biol. 2010, 190, 285–296. [Google Scholar] [CrossRef] [PubMed]
- Mattes, R.D. Is there a fatty acid taste? Annu. Rev. Nutr. 2009, 29, 305–327. [Google Scholar] [CrossRef] [PubMed]
- Nelson, G.; et al. An amino-acid taste receptor. Nature 2002, 416, 199–202. [Google Scholar] [CrossRef] [PubMed]
- Ponnusamy, V.; et al. T1R2/T1R3 polymorphism affects sweet and fat perception: Correlation between SNP and BMI in the context of obesity development. Human Genetics 2025, 144, 15–30. [Google Scholar] [CrossRef] [PubMed]
- Tepper, B.J.; et al. Factors Influencing the Phenotypic Characterization of the Oral Marker, PROP. Nutrients 2017, 9, 1275. [Google Scholar] [CrossRef] [PubMed]
- Goldstein, G.L.; et al. Influence of PROP taster status and maternal variables on energy intake and body weight of pre-adolescents. Physiol. Behav. 2007, 90, 809–817. [Google Scholar] [CrossRef] [PubMed]
- Gorovic, N.; et al. Genetic variation in the hTAS2R38 taste receptor and brassica vegetable intake. Scand. J. Clin. Lab. Invest. 2011, 71, 274–279. [Google Scholar] [CrossRef] [PubMed]
- Duffy, V.B.; Bartoshuk, L.M. Food acceptance and genetic variation in taste. J. Am. Diet Assoc. 2000, 100, 647–655. [Google Scholar] [CrossRef] [PubMed]
- Hayes, J.E.; Duffy, V.B. Revisiting sugar-fat mixtures: sweetness and creaminess vary with phenotypic markers of oral sensation. Chem. Senses 2007, 32, 225–236. [Google Scholar] [CrossRef] [PubMed]
- Tepper, B.J.; et al. Genetic variation in taste sensitivity to 6-n-propylthiouracil and its relationship to taste perception and food selection. Ann. N. Y. Acad. Sci. 2009, 1170, 126–139. [Google Scholar] [CrossRef] [PubMed]
- Tepper, B.J.; Nurse, R.J. PROP taster status is related to fat perception and preference. Ann. N. Y. Acad. Sci. 1998, 855, 802–804. [Google Scholar] [CrossRef] [PubMed]
- Silverstein, R.L.; Febbraio, M. CD36, a scavenger receptor involved in immunity, metabolism, angiogenesis, and behavior. Sci Signal 2009, 2, re3. [Google Scholar] [CrossRef] [PubMed]
- Su, X.; Abumrad, N.A. Cellular fatty acid uptake: a pathway under construction. Trends Endocrinol Metab 2009, 20, 72–77. [Google Scholar] [CrossRef] [PubMed]
- Ma, X.; et al. A common haplotype at the CD36 locus is associated with high free fatty acid levels and increased cardiovascular risk in Caucasians. Hum. Mol. Genet. 2004, 13, 2197–2205. [Google Scholar] [CrossRef] [PubMed]
- Love-Gregory, L.; et al. Variants in the CD36 gene associate with the metabolic syndrome and high-density lipoprotein cholesterol. Hum Mol Genet 2008, 17, 1695–1704. [Google Scholar] [CrossRef] [PubMed]
- Schwenk, R.W.; et al. Regulation of sarcolemmal glucose and fatty acid transporters in cardiac disease. Cardiovasc Res 2008, 79, 249–258. [Google Scholar] [CrossRef] [PubMed]
- Zhou, J.; et al. Hepatic fatty acid transporter Cd36 is a common target of LXR, PXR, and PPARgamma in promoting steatosis. Gastroenterology 2008, 134, 556–567. [Google Scholar] [CrossRef] [PubMed]
- Fukuwatari, T.; et al. Role of gustation in the recognition of oleate and triolein in anosmic rats. Physiol. Behav. 2003, 78, 579–583. [Google Scholar] [CrossRef] [PubMed]
- Martin, C.; et al. CD36 as a lipid sensor. Physiol. Behav. 2011, 105, 36–42. [Google Scholar] [CrossRef] [PubMed]
- Martin, C.; et al. The lipid-sensor candidates CD36 and GPR120 are differentially regulated by dietary lipids in mouse taste buds: impact on spontaneous fat preference. PLoS One 2011, 6, e24014. [Google Scholar] [CrossRef] [PubMed]
- Melis, M.; et al. Associations between orosensory perception of oleic acid, the common single nucleotide polymorphisms (rs1761667 and rs1527483) in the CD36 gene, and 6-n-propylthiouracil (PROP) tasting. Nutrients 2015, 7, 2068–2084. [Google Scholar] [CrossRef] [PubMed]
- Pepino, M.Y.; et al. The fatty acid translocase gene CD36 and lingual lipase influence oral sensitivity to fat in obese subjects. J. Lipid Res. 2012, 53, 561–566. [Google Scholar] [CrossRef] [PubMed]
- Laugerette, F.; et al. CD36 involvement in orosensory detection of dietary lipids, spontaneous fat preference, and digestive secretions. J. Clin. Invest. 2005, 115, 3177–3184. [Google Scholar] [CrossRef] [PubMed]
- Ghosh, A.; et al. Platelet CD36 surface expression levels affect functional responses to oxidized LDL and are associated with inheritance of specific genetic polymorphisms. Blood 2011, 117, 6355–6366. [Google Scholar] [CrossRef] [PubMed]
- Love-Gregory, L.; et al. Common CD36 SNPs reduce protein expression and may contribute to a protective atherogenic profile. Hum. Mol. Genet. 2011, 20, 193–201. [Google Scholar] [CrossRef] [PubMed]
- Hirano, K.; et al. Pathophysiology of human genetic CD36 deficiency. Trends Cardiovasc Med. 2003, 13, 136–141. [Google Scholar] [CrossRef] [PubMed]
- Pascual, G.; et al. Targeting metastasis-initiating cells through the fatty acid receptor CD36. Nature 2017, 541, 41–45. [Google Scholar] [CrossRef] [PubMed]
- Melis, M.; et al. Polymorphism rs1761667 in the CD36 Gene Is Associated to Changes in Fatty Acid Metabolism and Circulating Endocannabinoid Levels Distinctively in Normal Weight and Obese Subjects. Front. Physiol. 2017, 8, 1006. [Google Scholar] [CrossRef] [PubMed]
- Yasumatsu, K.; Tokita, K. Fat Taste Nerves and Their Function in Food Intake Regulation. Current Oral Health Reports 2022, 9, 75–80. [Google Scholar] [CrossRef]
- Pes, G.M.; et al. Sociodemographic, clinical and functional profile of nonagenarians from two areas of Sardinia characterised by distinct longevity levels. Rejuvenation Res. 2019, 0, null. [Google Scholar]
- Pes, G.M.; et al. Male longevity in Sardinia, a review of historical sources supporting a causal link with dietary factors. Eur. J. Clin. Nutr. 2015, 69, 411–418. [Google Scholar] [CrossRef] [PubMed]
- Poulain, M.; et al. Identification of a geographic area characterized by extreme longevity in the Sardinia island: the AKEA study. Exp. Gerontol. 2004, 39, 1423–1429. [Google Scholar] [CrossRef] [PubMed]
- Ruan, C.; et al. CD36: an emerging therapeutic target for cancer and its molecular mechanisms. Journal of Cancer Research and Clinical Oncology, 2022, 148, 1551–1558. [Google Scholar] [CrossRef] [PubMed]
- Diószegi, J.; et al. Genetic Background of Taste Perception, Taste Preferences, and Its Nutritional Implications: A Systematic Review. Front Genet 2019, 10, 1272. [Google Scholar] [CrossRef] [PubMed]
- Soranzo, N.; et al. Positive selection on a high-sensitivity allele of the human bitter-taste receptor TAS2R16. Curr Biol, 2005, 15, 1257–1265. [Google Scholar] [CrossRef] [PubMed]
- Wooding, S.; et al. Natural Selection and Molecular Evolution in PTC, a Bitter-Taste Receptor Gene. Am. J. Hum. Genet. 2004, 74, 637–646. [Google Scholar] [CrossRef] [PubMed]
- Wang, X.; et al. Relaxation of selective constraint and loss of function in the evolution of human bitter taste receptor genes. Hum Mol Genet 2004, 13, 2671–2678. [Google Scholar] [CrossRef] [PubMed]
- Kim, U.K.; et al. Variation in the human TAS1R taste receptor genes. Chem Senses 2006, 31, 599–611. [Google Scholar] [CrossRef] [PubMed]
- Fushan, A.A.; et al. Allelic polymorphism within the TAS1R3 promoter is associated with human taste sensitivity to sucrose. Curr Biol. 2009, 19, 1288–1293. [Google Scholar] [CrossRef] [PubMed]
- Cecati, M.; et al. TAS1R3 and TAS2R38 Polymorphisms Affect Sweet Taste Perception: An Observational Study on Healthy and Obese Subjects. Nutrients 2022, 14, 1711. [Google Scholar] [CrossRef] [PubMed]
- Melis, M.; et al. Associations between Sweet Taste Sensitivity and Polymorphisms (SNPs) in the TAS1R2 and TAS1R3 Genes, Gender, PROP Taster Status, and Density of Fungiform Papillae in a Genetically Homogeneous Sardinian Cohort. Nutrients 2022, 14. [Google Scholar] [CrossRef] [PubMed]
- Hwang, L.D.; et al. Sweet Taste Perception is Associated with Body Mass Index at the Phenotypic and Genotypic Level. Twin Res Hum Genet 2016, 19, 465–471. [Google Scholar] [CrossRef] [PubMed]
- Melis, M.; et al. TAS2R38 bitter taste receptor and attainment of exceptional longevity. Sci Rep. 2019, 9, 18047. [Google Scholar] [CrossRef] [PubMed]
- Adappa, N.D.; et al. TAS2R38 genotype predicts surgical outcome in nonpolypoid chronic rhinosinusitis. Int. Forum Allergy Rhinol. 2016, 6, 25–33. [Google Scholar] [CrossRef] [PubMed]
- Adappa, N.D.; et al. Correlation of T2R38 taste phenotype and in vitro biofilm formation from nonpolypoid chronic rhinosinusitis patients. Int. Forum Allergy Rhinol. 2016, 6, 783–791. [Google Scholar] [CrossRef] [PubMed]
- Adappa, N.D.; et al. T2R38 genotype is correlated with sinonasal quality of life in homozygous DeltaF508 cystic fibrosis patients. Int. Forum Allergy Rhinol. 2016, 6, 356–361. [Google Scholar] [CrossRef] [PubMed]
- Adappa, N.D.; et al. The bitter taste receptor T2R38 is an independent risk factor for chronic rhinosinusitis requiring sinus surgery. Int. Forum Allergy Rhinol. 2014, 4, 3–7. [Google Scholar] [CrossRef] [PubMed]
- Lee, R.J.; et al. T2R38 taste receptor polymorphisms underlie susceptibility to upper respiratory infection. J. Clin. Invest. 2012, 122, 4145–4159. [Google Scholar] [CrossRef] [PubMed]
- Lee, R.J.; Cohen, N.A. The emerging role of the bitter taste receptor T2R38 in upper respiratory infection and chronic rhinosinusitis. Am. J. Rhinol. Allergy 2013, 27, 283–286. [Google Scholar] [CrossRef] [PubMed]
- Lee, R.J.; Cohen, N.A. Role of the bitter taste receptor T2R38 in upper respiratory infection and chronic rhinosinusitis. Curr. Opin. Allergy Clin. Immunol. 2015, 15, 14–20. [Google Scholar] [CrossRef] [PubMed]
- Workman, A.D.; Cohen, N.A. Bitter taste receptors in innate immunity: T2R38 and chronic rhinosinusitis. J. Rhinol.-Otol. 2017, 5, 12–18. [Google Scholar]
- Wendell, S.; et al. Taste genes associated with dental caries. J. Dent. Res. 2010, 89, 1198–1202. [Google Scholar] [CrossRef] [PubMed]
- Gil, S.; et al. Genotype-specific regulation of oral innate immunity by T2R38 taste receptor. Mol. Immunol. 2015, 68, 663–670. [Google Scholar] [CrossRef] [PubMed]
- Latorre, R.; et al. Expression of the Bitter Taste Receptor, T2R38, in Enteroendocrine Cells of the Colonic Mucosa of Overweight/Obese vs. Lean Subjects. PLOS ONE 2016, 11, e0147468. [Google Scholar] [CrossRef] [PubMed]
- Carta, G.; et al. Participants with Normal Weight or with Obesity Show Different Relationships of 6-n-Propylthiouracil (PROP) Taster Status with BMI and Plasma Endocannabinoids. Sci. Rep. 2017, 7, 1361. [Google Scholar] [CrossRef] [PubMed]
- Bell, K.I.; Tepper, B.J. Short-term vegetable intake by young children classified by 6-n-propylthoiuracil bitter-taste phenotype. Am. J. Clin. Nutr. 2006, 84, 245–251. [Google Scholar] [CrossRef] [PubMed]
- Garcia-Bailo, B.; et al. Genetic variation in taste and its influence on food selection. Omics 2009, 13, 69–80. [Google Scholar] [CrossRef] [PubMed]
- Carrai, M.; et al. Association between TAS2R38 gene polymorphisms and colorectal cancer risk: a case-control study in two independent populations of Caucasian origin. PLoS One 2011, 6, e20464. [Google Scholar] [CrossRef] [PubMed]
- Cossu, G.; et al. 6-n-propylthiouracil taste disruption and TAS2R38 nontasting form in Parkinson's disease. Mov. Disord. 2018, 33, 1331–1339. [Google Scholar] [CrossRef] [PubMed]
- Melis, M.; et al. Taste disorders are partly genetically determined: Role of the TAS2R38 gene, a pilot study. Laryngoscope 2019. [Google Scholar] [CrossRef] [PubMed]
- Choi, J.H.; et al. Genetic Variation in the TAS2R38 Bitter Taste Receptor and Gastric Cancer Risk in Koreans. Sci. Rep. 2016, 6, 26904. [Google Scholar] [CrossRef] [PubMed]
- Pes, G.M.; et al. Association between Mild Overweight and Survival: A Study of an Exceptionally Long-Lived Population in the Sardinian Blue Zone. Journal of Clinical Medicine 2024, 13, 5322. [Google Scholar] [CrossRef] [PubMed]
- Camillo, L.; et al. Bitter Taste Receptors 38 and 46 Regulate Intestinal Peristalsis. International Journal of Molecular Sciences 2025, 26, 2092. [Google Scholar] [CrossRef] [PubMed]
- Lee, R.J.; Cohen, N.A. Taste receptors in innate immunity. Cell Mol Life Sci. 2015, 72, 217–236. [Google Scholar] [CrossRef] [PubMed]
- Franzago, M.; et al. Genetic Variants in CD36 Involved in Fat Taste Perception: Association with Anthropometric and Clinical Parameters in Overweight and Obese Subjects Affected by Type 2 Diabetes or Dysglycemia-A Pilot Study. Nutrients 2023, 15. [Google Scholar] [CrossRef] [PubMed]
- Pepino, M.Y.; et al. Structure-function of CD36 and importance of fatty acid signal transduction in fat metabolism. Annu Rev Nutr. 2014, 34, 281–303. [Google Scholar] [CrossRef] [PubMed]
- Mauvais-Jarvis, F. Sex differences in energy metabolism: natural selection, mechanisms and consequences. Nature Reviews Nephrology 2024, 20, 56–69. [Google Scholar] [CrossRef] [PubMed]
- Calvo, S.S.-C.; Egan, J.M. The endocrinology of taste receptors. Nature Reviews Endocrinology 2015, 11, 213–227. [Google Scholar] [CrossRef] [PubMed]
- Dahir, N.S.; et al. Sex differences in fat taste responsiveness are modulated by estradiol. American Journal of Physiology-Endocrinology and Metabolism 2021, 320, E566–E580. [Google Scholar] [CrossRef] [PubMed]
Figure 1.
Genotype distributions and allele or haplotype frequencies of polymorphisms of the TAS1R2 (A), TAS1R3 (B), TAS2R38 (C) and CD36 (D) genes in the Longevity Blue Zone cohort (LBZ) (n = 114) and Cagliari Young, Middle-aged, and Elderly participants (CYME) (n = 160). Different letters indicated significant differences (Χ2 > 6.38; p ≤ 0.041; Fisher’s exact test).
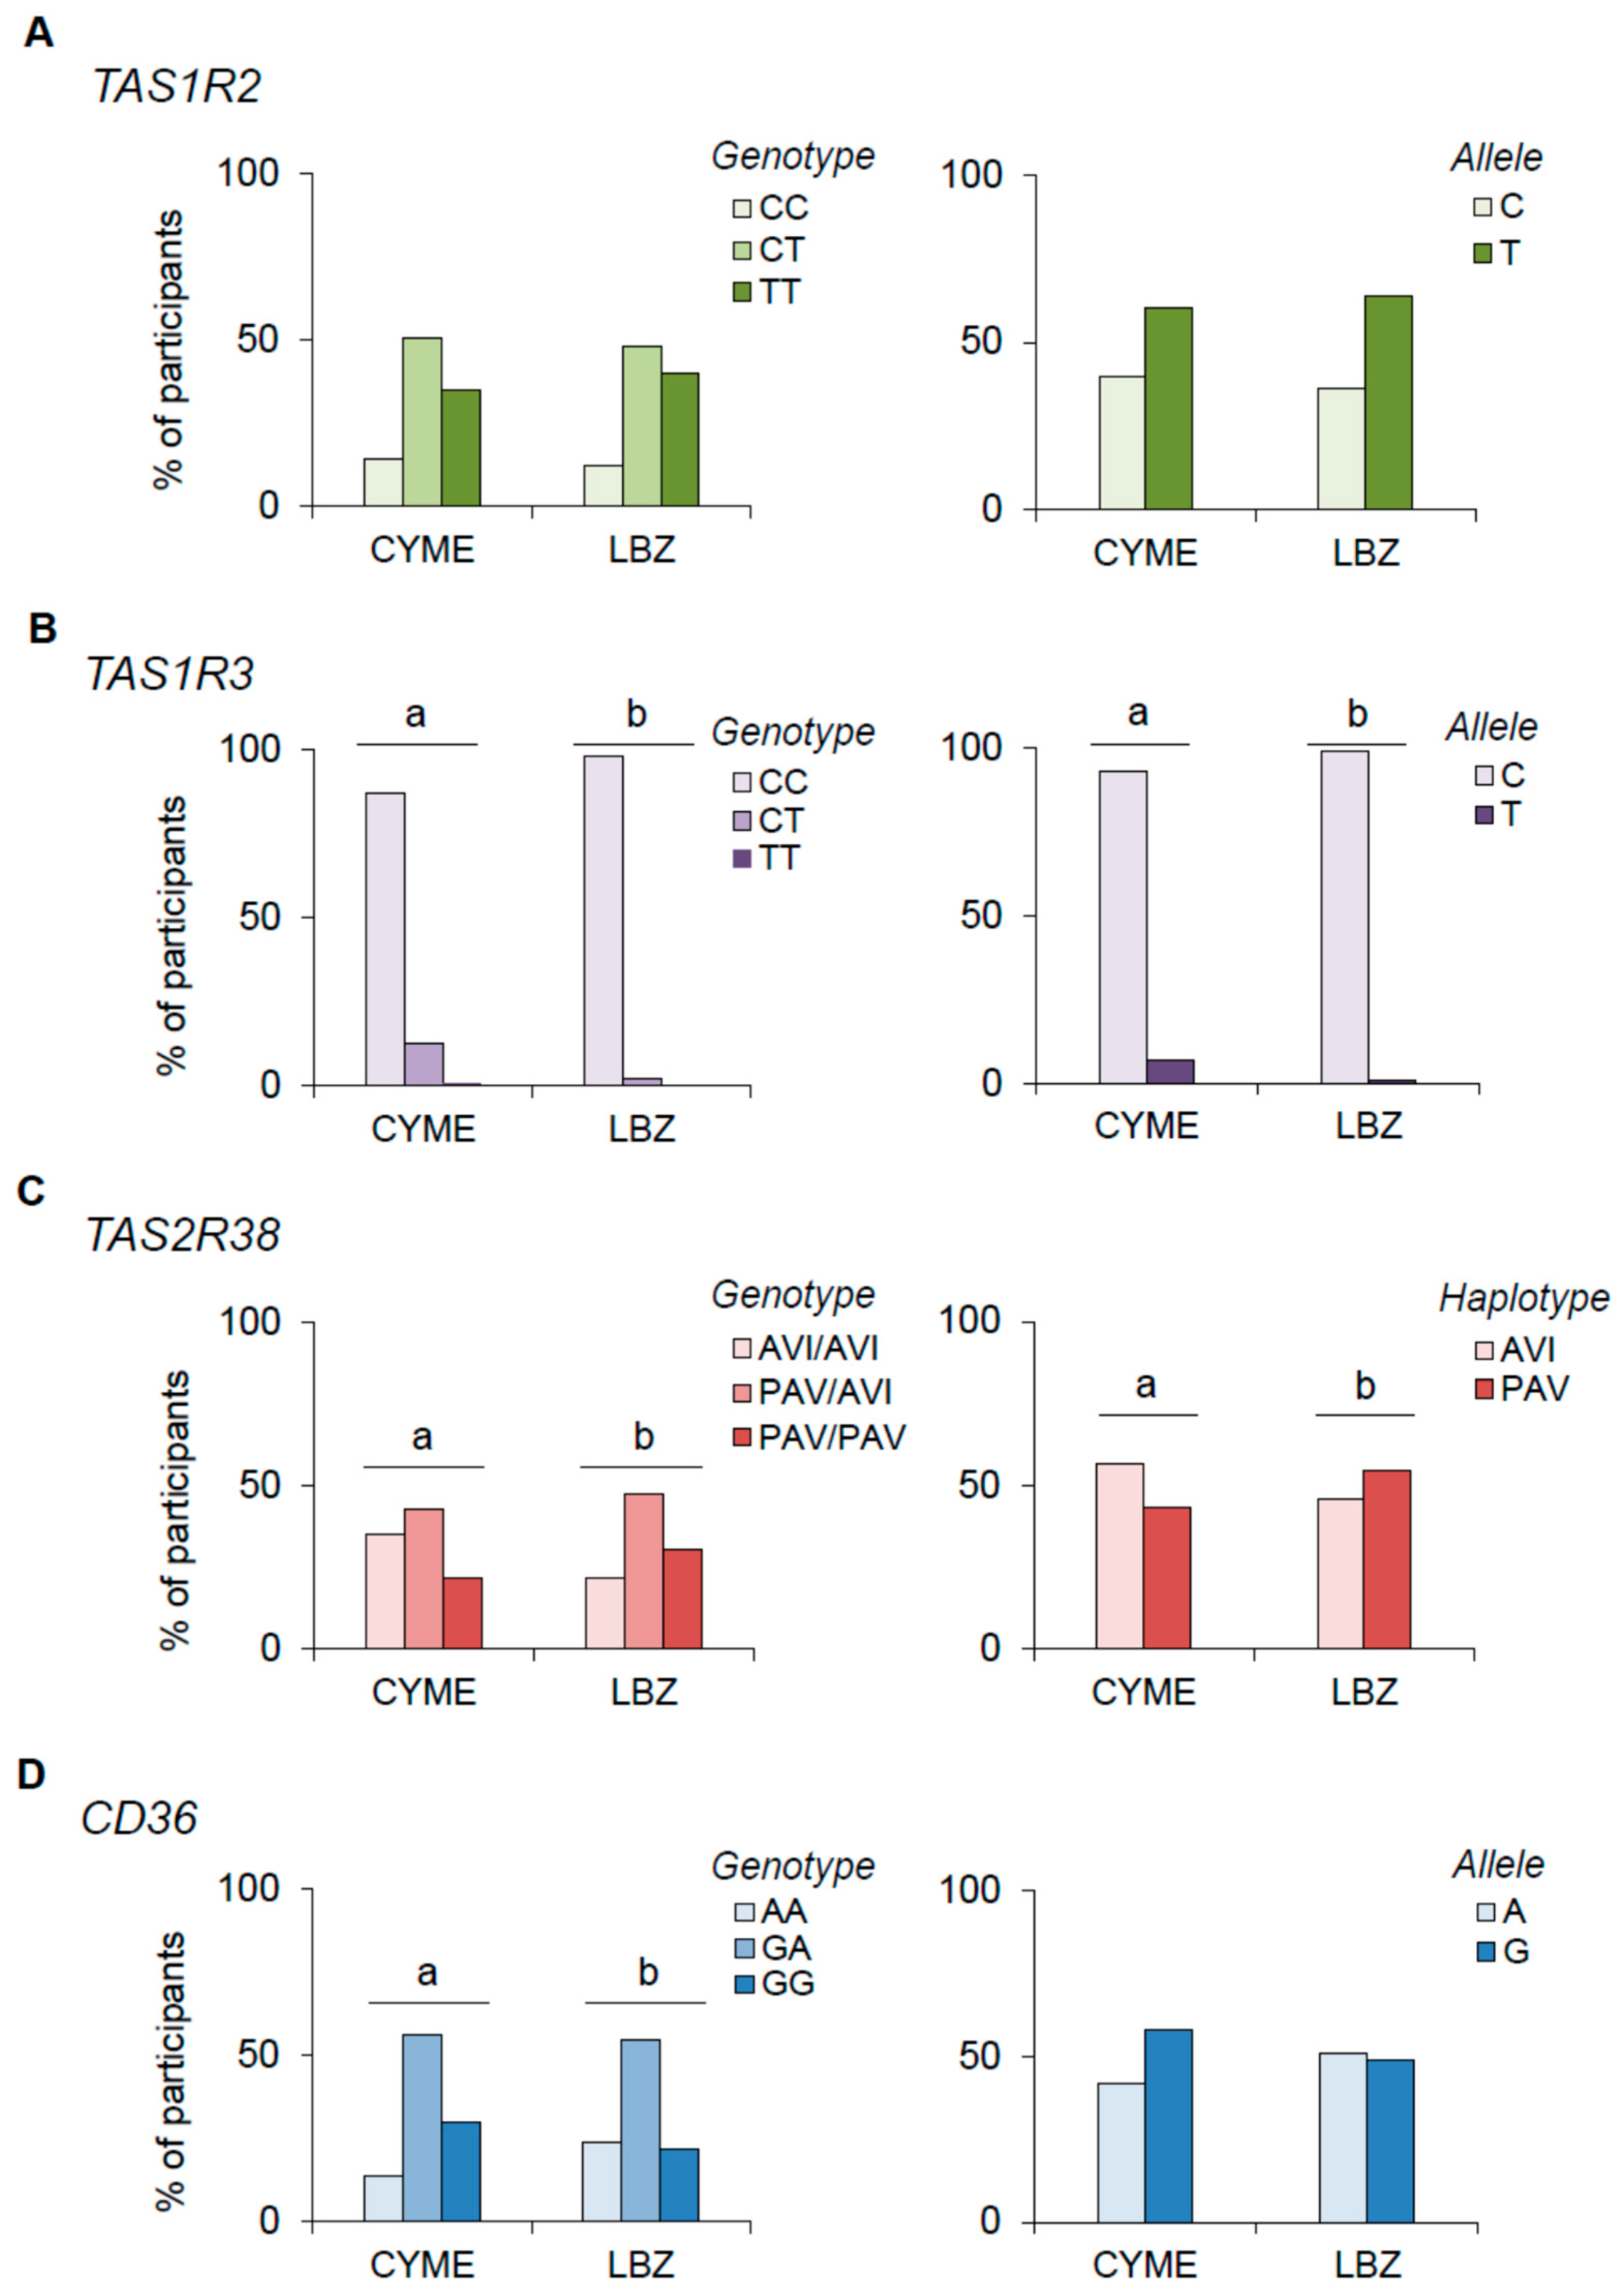
Figure 3.
Mean values ± SEM of body mass index (BMI) according to polymorphisms in the TAS1R2, TAS1R3, TAS2R38, and CD36 genes in the Longevity Blue Zone cohort (LBZ) (n = 114) and Cagliari young, middle-aged, and elderly participants (CYME) (n = 160). The different letters indicate significant difference (p < 0.004; Fisher LSD test, subsequent two-way ANOVA). * Indicates a significant difference between the corresponding genotypes of the two cohorts (p < 0.043; Fisher LSD test, subsequent two-way ANOVA).
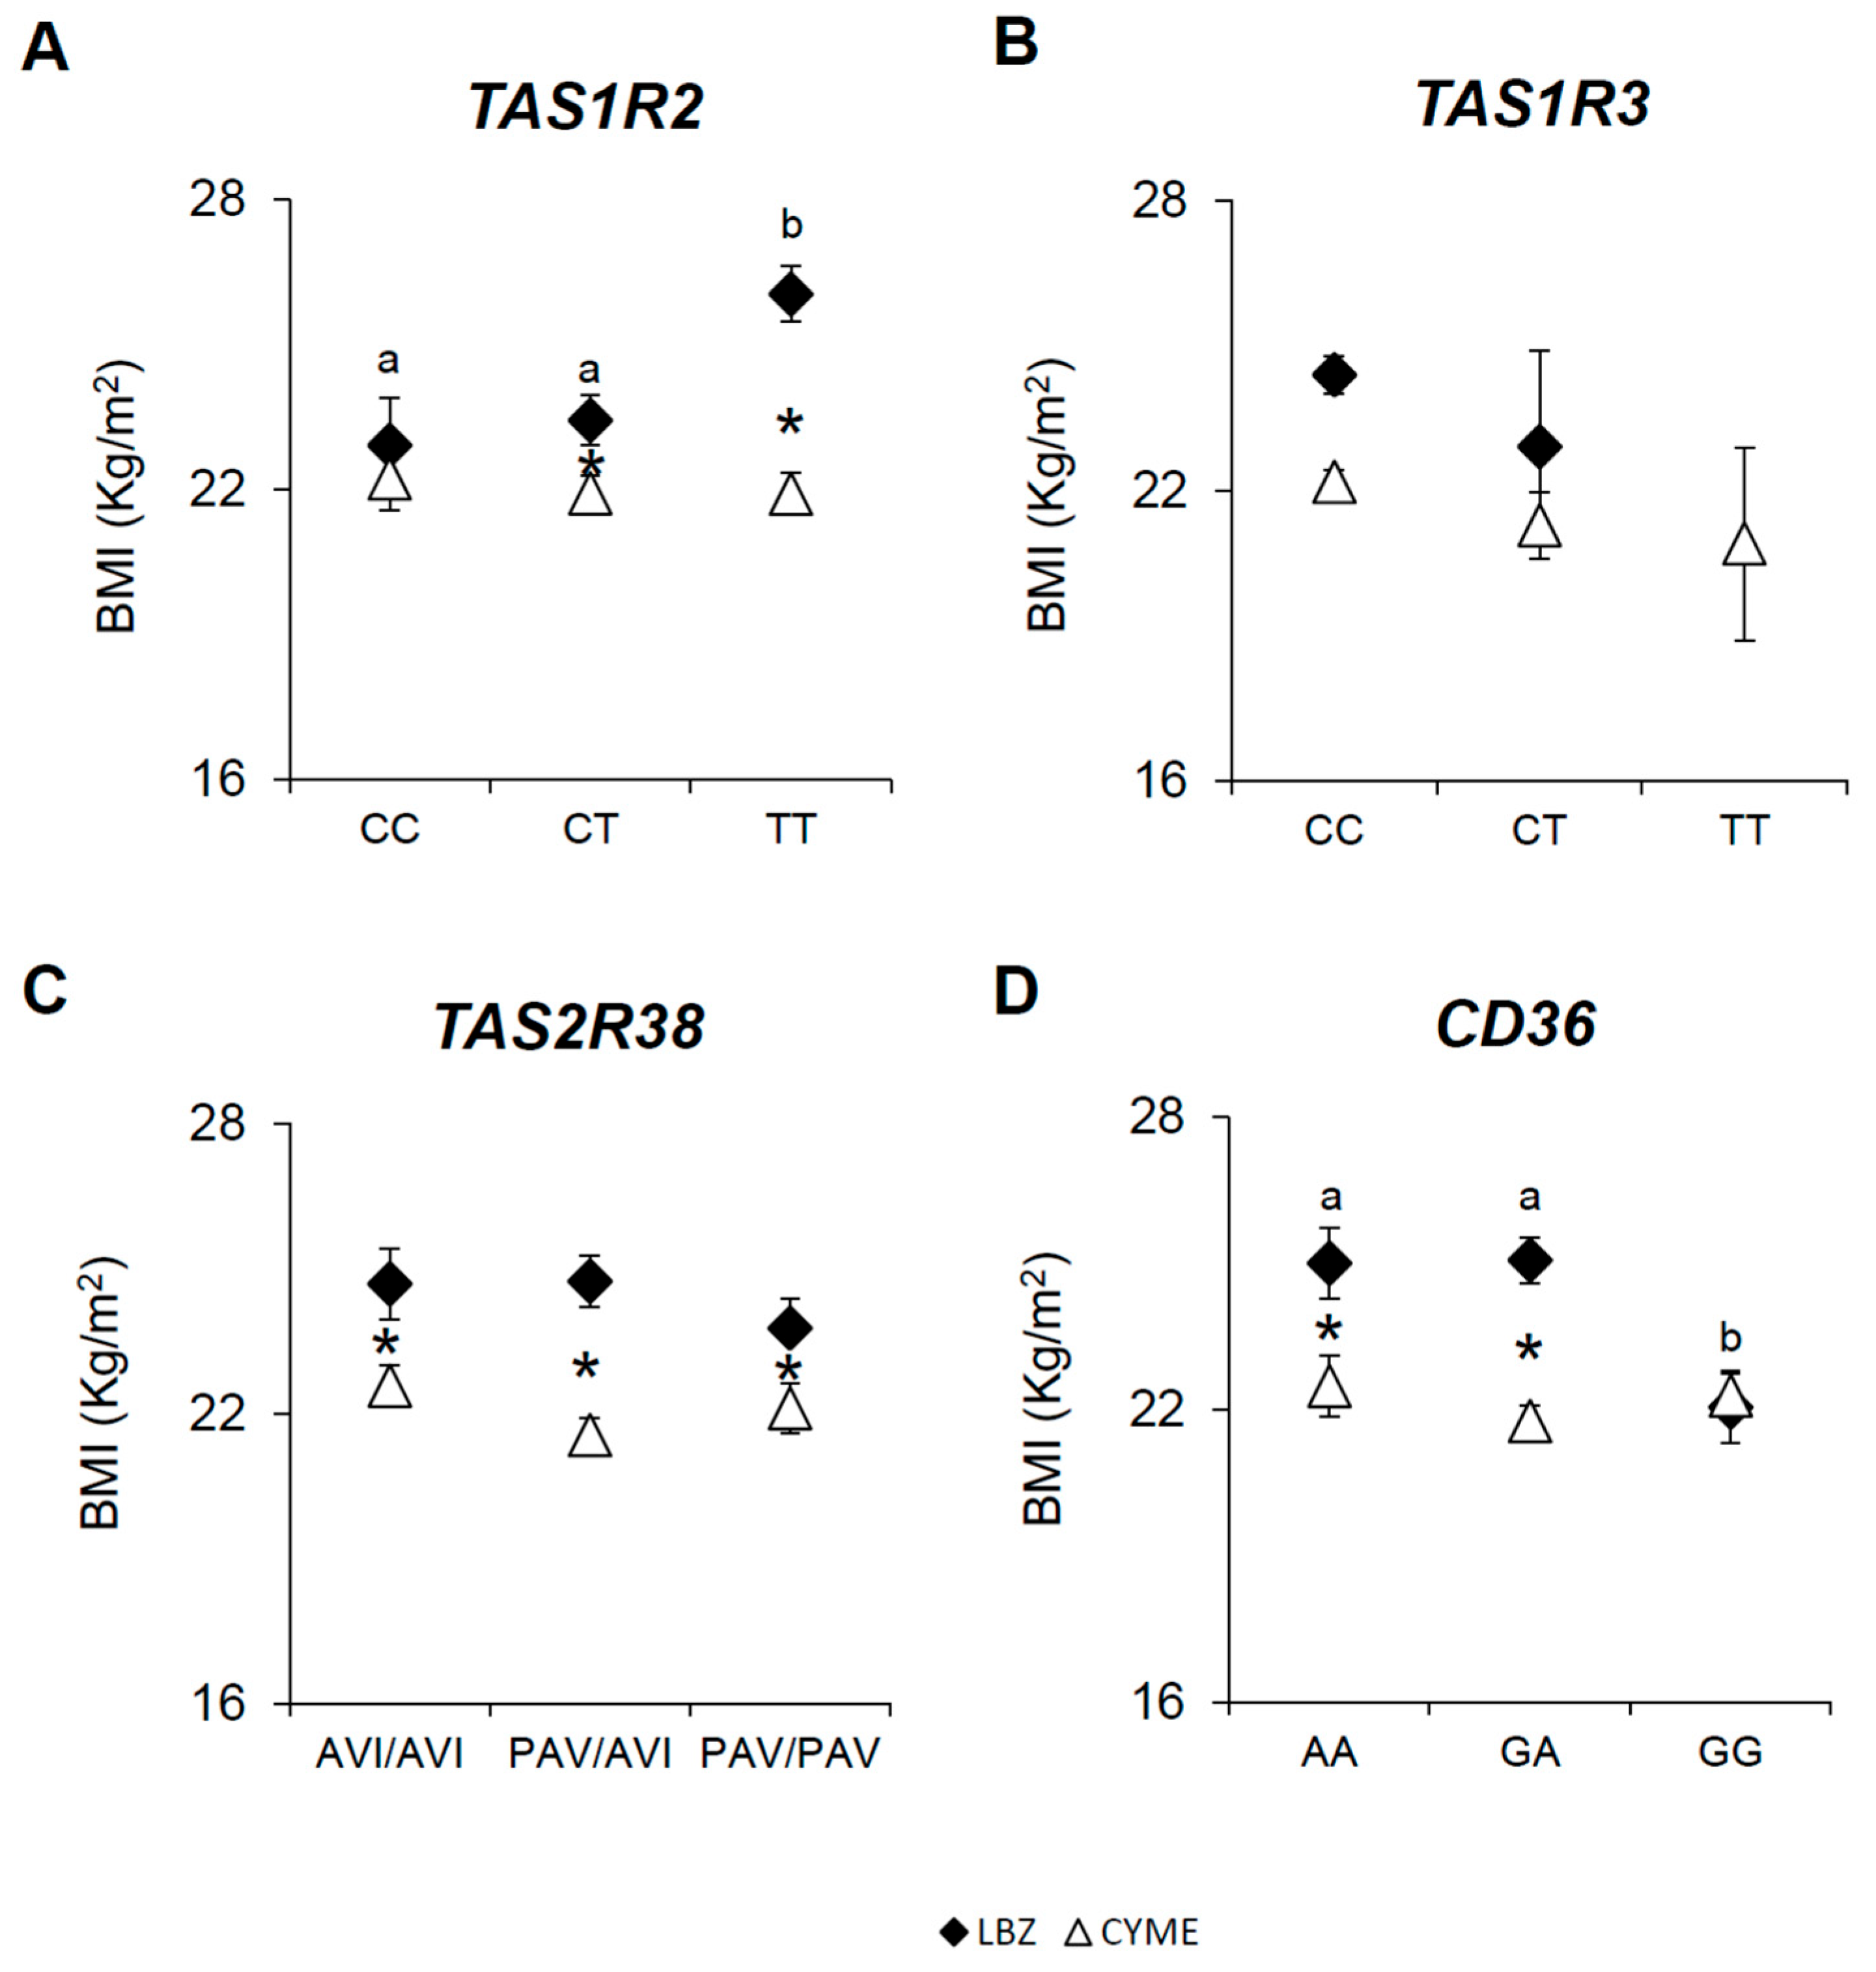
Figure 4.
Mean values ± SEM of body mass index (BMI) according to polymorphisms in the TAS1R2, TAS1R3, TAS2R38, and CD36 genes in females of the Longevity Blue Zone cohort (LBZ) (n = 60) and the Cagliari young, middle-aged, and elderly cohort (CYME) (n = 111). The different letters indicate significant differences (p < 0.044; Fisher LSD test, subsequent two-way ANOVA). * Indicates a significant difference between the corresponding genotypes of participants of the LBZ and CYME cohorts.
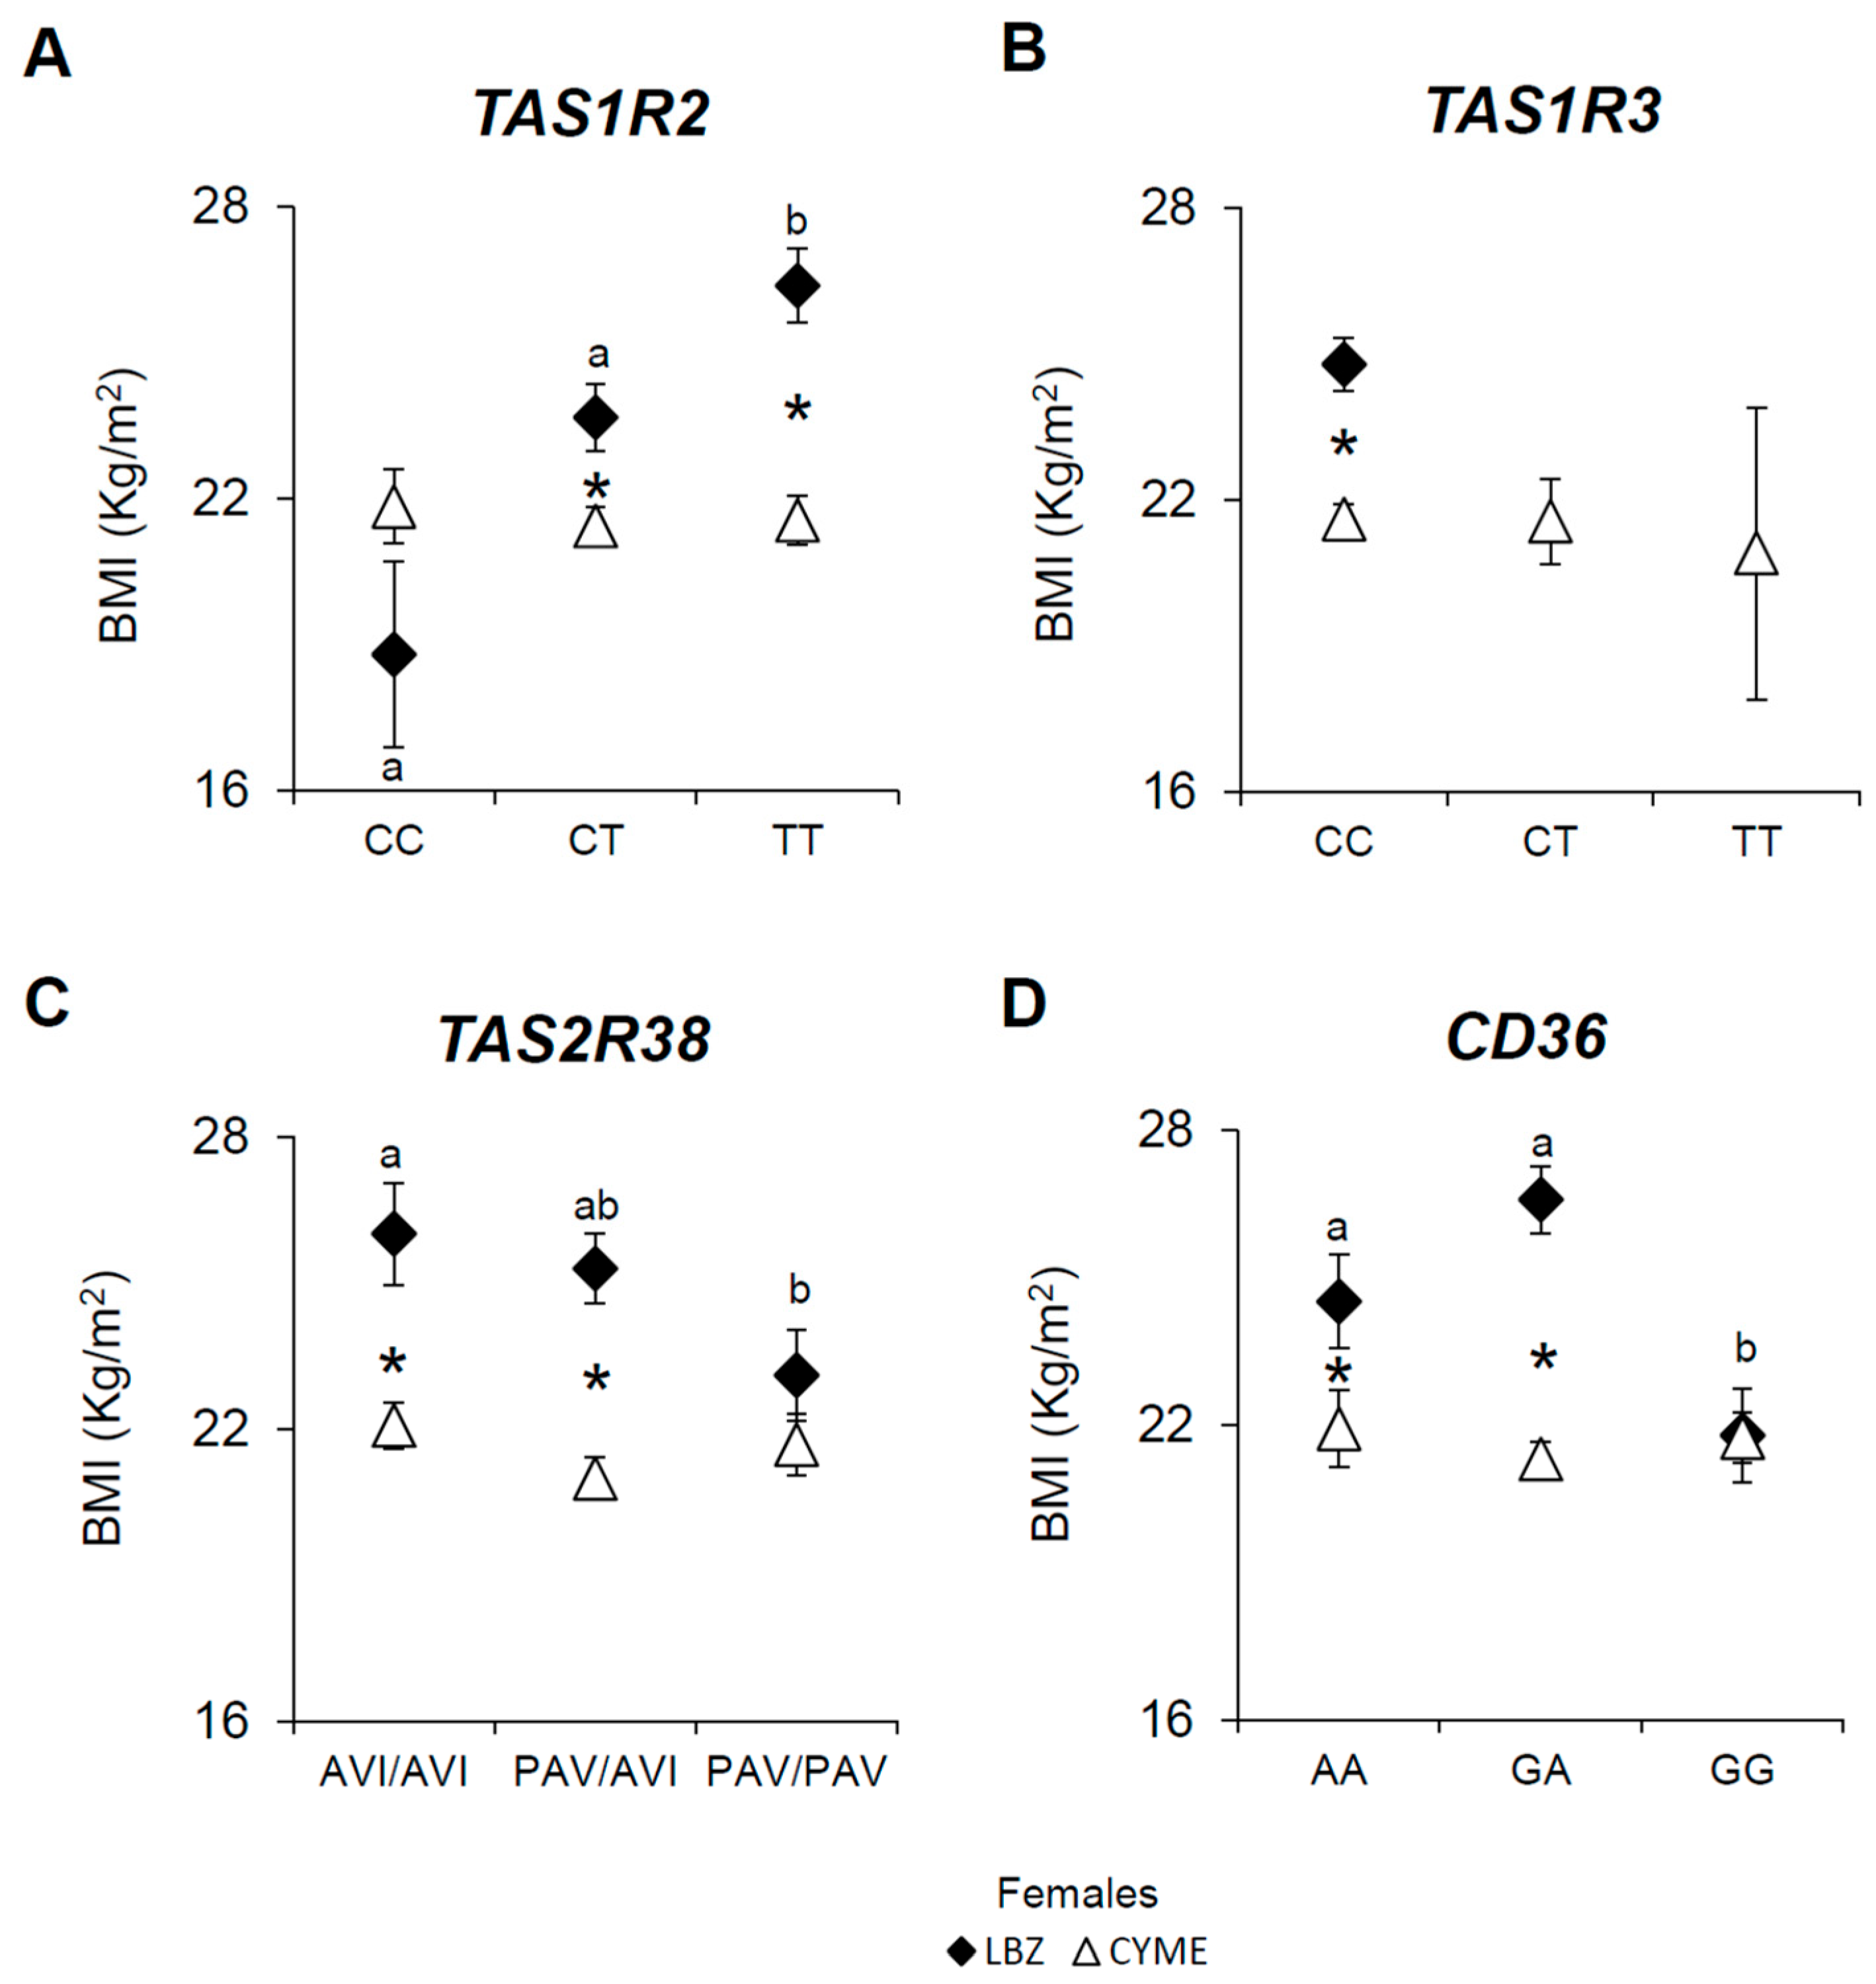
Figure 5.
Mean values ± SEM of body mass index (BMI) according to polymorphisms in the TAS1R2, TAS1R3, TAS2R38, and CD36 genes in male of the two cohorts (LBZ, n = 54; CYME, n = 49 The different letters indicate significant differences (p < 0.044; Fisher LSD test, subsequent two-way ANOVA). * Indicates a significant difference between the corresponding genotypes of participants of the LBZ and CYME cohorts.
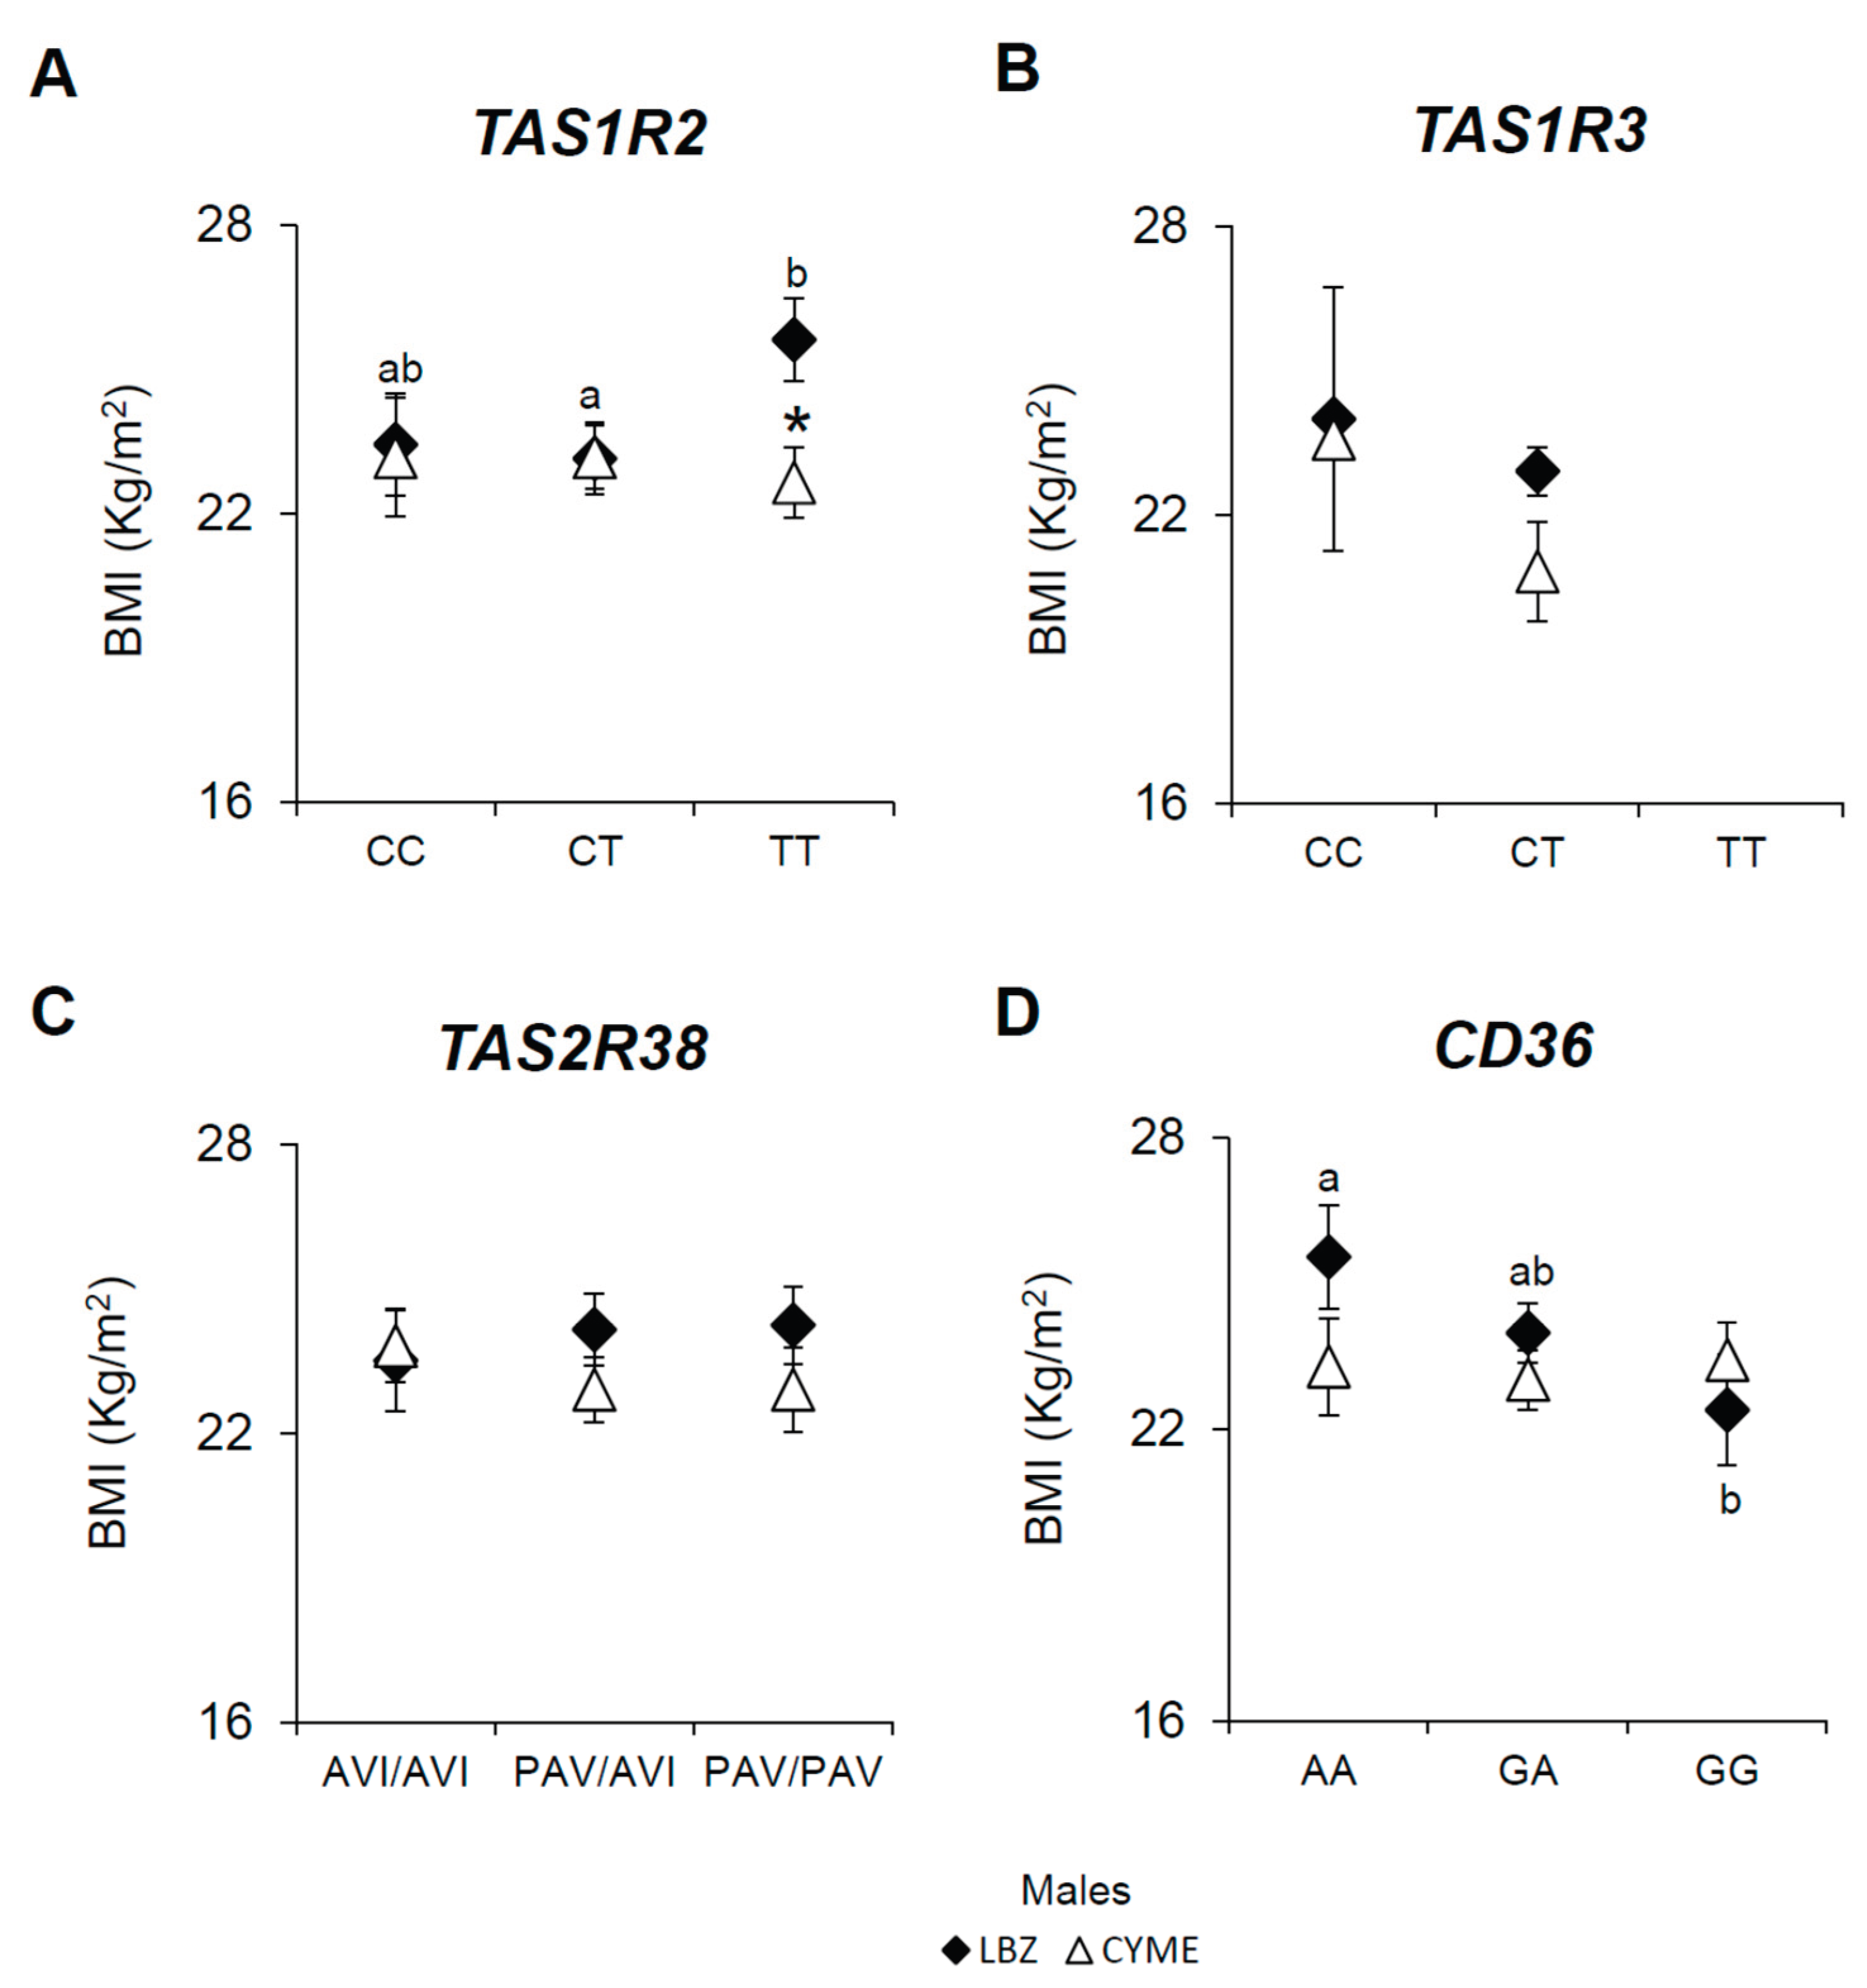

Table 1.
Demographic features of the LBZ cohort and CYME cohort.
| Participants | Age range | |||
|---|---|---|---|---|
| Total | Males | Females | ||
| (n) | (n) | (n) | (y) | |
| LBZ | 114 | 54 | 60 | 90 - 103 |
| CYME | 160 | 49 | 111 | 18 - 67 |
LBZ, Longevity Blue Zone cohort; CYME, Cagliari cohort including young, middle-aged, and elderly participants.
Disclaimer/Publisher’s Note: The statements, opinions and data contained in all publications are solely those of the individual author(s) and contributor(s) and not of MDPI and/or the editor(s). MDPI and/or the editor(s) disclaim responsibility for any injury to people or property resulting from any ideas, methods, instructions or products referred to in the content. |
© 2025 by the authors. Licensee MDPI, Basel, Switzerland. This article is an open access article distributed under the terms and conditions of the Creative Commons Attribution (CC BY) license (http://creativecommons.org/licenses/by/4.0/).
Copyright: This open access article is published under a Creative Commons CC BY 4.0 license, which permit the free download, distribution, and reuse, provided that the author and preprint are cited in any reuse.


