
Submitted:
11 July 2025
Posted:
14 July 2025
You are already at the latest version
Abstract
Amidst health-conscious consumption trends, functional foods rich in gamma-aminobutyric acid (GABA) and vitamin B9 are gaining prominence. Foxtail millet, naturally abundant in these compounds, plays vital roles in nervous system regulation, cellular metabolism, and fetal development. In this work, we introduced hyperspectral imaging for detecting these nutrients in millet, collecting spectral data from 190 samples across 19 varieties. Four "coarse-fine" wavelength screening strategies were innovatively proposed: interval spectral variables initially identified wavelengths with strong explanatory power, followed by model cluster analysis for precise optimization. A stacked BiLSTM-Adaboost model was built for efficient prediction. Results revealed significant variations in GABA and vitamin B9 content among varieties, offering crucial insights for breeding and quality assessment. The GABA prediction model achieved R2=0.5421, RMSE=13.9349, RPD=1.4778; the vitamin B9 model attained R2=0.8932, RMSE=4.6676, RPD=3.0600. This integration of technology and methodological innovation provides a novel pathway for rapid, non-destructive millet nutrient analysis, facilitating intelligent quality control, industry advancement, and functional food development.
Keywords:
foxtail millet
; hyperspectral imaging
; nutritional components prediction
; feature wavelength selection
; nondestructive detection
1. Introduction
In the context of the growing popularity of the “Healthy China” concept, the public’s dietary structure is gradually shifting from simply aiming to “fill up” to focusing on “eating well and eating healthily”, with nutritious coarse grains increasingly gaining recognition [1]. As an important coarse grain crop, foxtail millet occupies a central position in the dietary system of northern China [2]. Shanxi, as a major production area for small grains in China, ranks among the top in terms of foxtail millet cultivation area. Its high-quality produce is widely loved by the public [3]. foxtail millet is rich in carbohydrates, proteins, fats, vitamins, minerals, and various other nutrients, providing comprehensive and balanced nutritional support for the human body [4]. Notably, it is rich in essential amino acids that the human body cannot synthesize on its own, which gives it a unique advantage in the content and proportion of essential amino acids. Thus, it serves as a high-quality source of plant protein [5]. In addition, foxtail millet also contains some health-preserving components, such as gamma-aminobutyric acid (GABA) and vitamin B9, which further enhance its functionality and commercial value [6,7,8].
In the field of nutrition and health, the content and proportion of nutrients in foxtail millet have a significant impact on its nutritional value and health benefits [9]. The GABA and vitamin B9 it contains are closely related to the human nervous system and metabolic functions. Specifically, GABA, a non-protein amino acid widely distributed in microorganisms and plants and animals, has various health benefits, including anti-diabetes, anti-hypertension, liver and kidney protection, and sleep promotion [10]. The GABA content in foxtail millet can reach 20-50 mg/100g, which is significantly higher than that in ordinary grains [11]. Vitamin B9, an essential vitamin for the human body, participates in various biochemical reactions and plays a crucial role in preventing neural tube defects, megaloblastic anemia and other diseases [12]. The folic acid content in foxtail millet is 30-50 μg/100g, higher than that in staple crops such as corn and wheat [13]. Given the superior content of GABA and vitamin B9 in foxtail millet compared to other crops, achieving rapid and non-destructive detection of these two nutrients has high practical significance. However, traditional chemical detection methods have drawbacks such as long detection cycles, high costs, and sample destruction, which make it difficult to meet the demands of modern food nutrition analysis. Therefore, developing a rapid, accurate, and non-destructive analysis technology for GABA and vitamin B9 in foxtail millet is of great significance.
Hyperspectral imaging, as an emerging non-destructive testing technology, offers advantages such as high spectral resolution, continuous wavelength bands, and rich information, and has been widely applied in fields such as agricultural product quality inspection and food safety monitoring. Guo et al. [14] systematically reviewed the research progress of the past decade, conducting an in-depth investigation into the application of hyperspectral imaging technology in the detection of fungal and mycotoxin contamination in grains. They summarized detection cases for different types of grains and used machine learning algorithms such as support vector machines (SVM) and convolutional neural networks (CNN) for feature extraction and classification of hyperspectral images, enabling early identification of common pathogenic fungi such as Fusarium graminearum and Aspergillus flavus. Aviara et al. [15] reviewed the frontier applications of hyperspectral imaging technology in grain quality and safety detection, establishing a correlation model between spectral features and physical indicators of grains by analyzing differences in spectral absorption peaks. Medina-García et al. [16] focused on sensor technology, data processing algorithms, and machine learning in non-destructive testing of grain quality, aiming to address the challenges of the correlation between food production and dynamic environments. Zhang et al. [17] utilized NIR-HSI combined with machine learning algorithms to establish a correlation model between spectral features and the protein, starch, and water content of 77 wheat varieties. Chen et al. [18] constructed a backpropagation neural network model and a partial least squares model to predict the crude fat and water content in hickory seeds. Shi et al. [19] accurately predicted the vitamin content in wheat using stepwise linear regression (SLR).
Currently, with the development of computer science, deep learning algorithms combined with hyperspectral imaging have become a research hotspot for many scholars [20,21,22]. Ren et al. [23] used four deep learning models, adding coordinate attention mechanisms and label smoothing loss functions, to detect the seed vitality of soybeans. Yue et al. [24] designed LeafTraitNet by integrating deep and shallow network features based on the Visual Geometry Group architecture, aiming to estimate the physicochemical parameters of plant leaves. Among the various deep learning models, long short-term memory networks (LSTM) have shown excellent performance in modeling time-series data, effectively capturing the relationships and overall trends between data points [25]. This ability makes the LSTM model particularly suitable for predicting curves with continuous response characteristics [26]. The bidirectional long short-term memory network (BiLSTM), as an improved version of LSTM, has significant advantages in processing sequence data. It can fully extract deep temporal features from sequences, providing an important basis for feature extraction in complex spectral sequences in hyperspectral data [27]. It has been found through research that the generalization ability of deep learning models is often constrained by the scale of training data and noise interference [28]. However, the weighted combination of multiple weak classifiers via ensemble learning algorithms can effectively enhance the stability and robustness of models [29]. Among them, adaptive boosting (Adaboost) is a classic ensemble learning algorithm that significantly improves the prediction accuracy and generalization ability of a model by combining multiple weak learners into a strong one. During the iterative process, Adaboost dynamically adjusts the sample weights according to the prediction errors of the weak learners, making the model focus more on difficult-to-classify samples, thereby continuously optimizing model performance [30,31,32]. The BiLSTM-Adaboost collaborative model combines the dual advantages of bidirectional feature extraction and ensemble optimization, breaking through the performance bottleneck of single models. Currently, scholars both domestically and internationally have conducted research in different fields [33,34,35,36]. However, there is limited research on the application of the BiLSTM-Adaboost collaborative model in the field of agricultural science, particularly in the precise analysis of GABA and vitamin B9 content in foxtail millet, and no related studies have been reported so far.
In this work, we measured the GABA and vitamin B9 content in 190 foxtail millet samples from 19 varieties using traditional detection methods, obtained spectral data of the samples using hyperspectral imaging, selected four “coarse-fine” strategies with strong correlation between spectral features and the contents of GABA and vitamin B9, and constructed a BiLSTM-Adaboost collaborative model for precise prediction of GABA and vitamin B9 contents in foxtail millet. The technical route of this work is shown in Figure 1. The experimental results will enrich the theoretical application of hyperspectral imaging in the field of food science. By exploring the intrinsic relationship between hyperspectral data and food nutritional components, this work provides new theoretical foundations and methodological support for food ingredient detection.
2. Materials and Methods
2.1. Planting and Sample Collection
The 190 foxtail millet samples used in this work (including ‘Changnong No. 35’, ‘Changnong No. 36’, ‘Changenong 38-41’, ‘Changenong 44’, ‘Changenong 46-55’, ‘Jingu 21’, and ‘2021 Variety 56’, totaling 19 varieties) were all planted in the foxtail millet Research Institute of Shanxi Agricultural University, located in the eastern part of Changzhou District, Chizhou City, Shanxi Province (Latitude 36°12′, Longitude 113°08′, Elevation 977 m). The tested millet variety was bred by the Millet Cultivation Research Team of our institute, and its detailed information is shown in Table S1. This base serves as a core experimental field in the mid-late maturing dry farming area for spring sowing, with an annual average temperature of 10.2 °C, a frost-free period of 185 days, and annual precipitation of 550 mm, which highly matches the drought-resistant and barren-tolerant characteristics of the samples. It is particularly suitable for analyzing the adaptive mechanism of foxtail millet in the mid-late maturing dry farming areas of northwestern China. The foxtail millet was sown on May 12, 2024, in a typical brown soil area (0-20 cm soil layer: organic matter 1.65%, available phosphorus 12.3 mg/kg, pH 7.8). Manual sowing was adopted with a row spacing of 40 cm and a planting density of 450,000 plants per hectare. The base fertilizer consisted of 30,000 kg/hm² decomposed sheep manure and 600 kg/hm2 slow-release fertilizer (N-P2O5-K2O = 20-10-15). Urea was applied at 225 kg/hm² during the jointing stage combined with drip irrigation. Harvesting was performed on October 10, 2024. Ten samples were collected from each variety, with each sample weighing 200 g. The samples were sun-dried, hulled, and underwent further processing.
2.2. Hyperspectral Imaging Data Acquisition
The experiment on data acquisition of foxtail millet samples based on near-infrared hyperspectral imaging was conducted using the push-sweep hyperspectral imaging system manufactured by Headwall Photonics of the United States (Figure 1). The system consists of five core functional modules: ① A NIR hyperspectral imaging device with a spectral range of 900-1700 nm (172 bands, spectral resolution of 4.715 nm); ② An electric lifting scanning platform equipped with a precision stepper motor (positioning accuracy of ±0.01 mm); ③ A dual-channel halogen lamp array light source system (color temperature of 3200 K, illumination uniformity >95%); ④ An industrial-grade control computer with dedicated imaging control system and software; ⑤ A precision push-broom mechanism based on guide rails (stroke of 300 mm). Optimal acquisition parameters were determined through pre-experiments: object distance of 280 mm (determined by contrast experiments with five groups of different distances), and a push-broom speed of 2.721 mm/s, using a “object distance - speed - light source” collaborative calibration mode. To eliminate ambient light (<5 lx) and sensor dark current noise (<0.1 DN), the standardized process of “white reference calibration → dark field acquisition → radiometric calibration” was strictly followed. First, a 99% reflectance diffuse standard white panel (Labsphere, USA) was used for white field calibration, followed by capturing the full dark field reference value with the lens cap covered. Finally, radiometric calibration was completed using equation (1) to ensure the absolute radiometric accuracy of the original spectral data (R2 > 0.998).
Where, R is the corrected image; R0 is the original image; Rw is the white reference calibration image (reflectance > 99.9%); and Rb is the dark background calibration image (reflectance < 0%).
The foxtail millet grain samples were sequentially placed into the same experimental vessel with a diameter of 3 cm and a depth of 1 cm, ensuring the surface of the sample was flat and compact. Each sample was scanned three times, and the data were numbered and saved sequentially. To address the significant signal-to-noise ratio drop at the edges of the spectral response range of the hyperspectral imaging system (<950 nm and >1650 nm), where the relative standard deviation was greater than 15%, the effective modeling wavelength range was determined to be 950-1650 nm based on the principles of spectral stability and feature effectiveness. This range, which includes 148 feature channels, is suitable for the quantitative detection of GABA and vitamin B9 in foxtail millet.
2.3. Physicochemical Determination of GABA and Vitamin B9 in foxtail millet
The samples were ground thoroughly to ensure uniformity. The GABA content was determined using an Ultimate ODS-3 reverse-phase column (4.6 mm × 250 mm, 5 μm) in a high-performance liquid chromatography (HPLC) system. The detection conditions were set as follows: flow rate of 0.6 mL/min, column temperature of 40 °C, wavelength of 331 nm, and injection volume of 10 µL. The stock solution of GABA standard sample was diluted in a certain proportion to prepare standard solutions of different concentrations for the subsequent construction of the standard curve. An appropriate amount of derivatizing agent was prepared by accurately weighing o-phthalaldehyde, methanol, dimethylaminoethyl mercaptan chloride, then adding them to a suitable borate buffer solution and stirring to ensure thorough mixing and accurate component ratios. The detailed procedure can be found in reference [37]. The prepared sample solutions and standard solutions were injected sequentially into the HPLC system. The chromatographic peak area corresponding to each standard solution was recorded. Using these data, a standard curve was generated. The unknown sample’s data was then compared with the standard curve to accurately calculate the GABA content.
The ground samples were treated with an appropriate amount of hydrochloric acid to facilitate the dissociation of vitamin B9 more effectively from the samples. Zinc sulfate was then added to help precipitate impurities. After centrifugation and filtration, a relatively pure solution containing vitamin B9 was obtained. The vitamin B9 content was measured using liquid chromatography with a Nova Atom C18 column [38]. The mobile phase A was acetonitrile, and mobile phase B was potassium dihydrogen phosphate. The column temperature was maintained at 25 °C, the flow rate was stabilized at 1 mL/min, and the detection wavelength was set at 200 nm.
2.4. Data Preprocessing and Sample Set Division
When the hyperspectral imaging system acquires the spectral images of samples, instrument noise, environmental noise, and surface scattering can inevitably interfere with the experimental data. Therefore, preprocessing of the original spectral data is essential to eliminate or reduce the impact of instrument and environmental noise, while suppressing the surface scattering effect, thus effectively weakening the interference of external factors on spectral signals.
The Savitzky-Golay (S-G) filter [39] is primarily used to filter high-frequency noise from the spectral lines, improving the continuity of the data by smoothing the spectral curves The specific parameters adopted in this work were: polynomial order 1, frame length 3, and window size of 5 for the finite impulse response smoothing filter.
Wavelet transform [40] decomposes the signal into basis functions (wavelets) of different frequency and time to perform time-frequency analysis. Noise typically manifests as high-frequency components, while useful signals are often distributed in low-frequency or specific frequency bands. The signal is subjected to multi-scale wavelet decomposition, yielding approximation coefficients (low-frequency) and detail coefficients (high-frequency). The detail coefficients are thresholded to retain significant signals and suppress noise. The threshold determination principle of the Penalty strategy balances the model’s goodness of fit and complexity, adaptively selecting a global threshold. The signal is reconstructed using the processed coefficients.
The standard normal variate transformation (SNV) [41] aims to eliminate the influence of surface glossiness, scattering effects, and background interference on the reflection spectra of foxtail millet. After processing using SNV, the reflectance at each point shows regular variation, and each spectral value is standardized for correction.
In the process of modeling spectral data and chemical composition, the sample set partitioning based on joint x-y distance (SPXY) algorithm [42] was used to divide the sample set. This method simultaneously optimizes the spectral feature space (x space) and the chemical parameter distribution (y space) using dual distance metrics, dividing the dataset into a calibration set (143 samples) and a prediction set (47 samples) in a 3:1 ratio. The calibration set is used for model construction and cross-validation, while the prediction set is used to evaluate the prediction performance of the model.
2.5. Feature Wavelength Extraction
The hyperspectral imaging has high resolution, which leads to high data dimensions. Direct application often faces issues such as high computational complexity, difficult band selection, and susceptibility to overfitting. By extracting spectral feature variables from hyperspectral imaging, data dimensionality can be reduced while retaining key information, simplifying the model. This is beneficial for improving the efficiency of data processing and analysis, as well as enhancing the performance of subsequent algorithms. Therefore, extracting feature wavelengths is crucial. In this work, the “coarse-fine” selection strategy was adopted to gradually optimize the spectral variable space of the foxtail millet, in order to obtain the optimal variable combination for establishing detection models of GABA and vitamin B9 content. Four “coarse-fine” selection strategies are proposed: iRF-CARS, iRF-BOSS, iVISSA-CARS, and iVISSA-BOSS. The spectral matrix of foxtail millet is represented as X (m×p), and the nutritional index matrix as Y (m×1). After preprocessing X and dividing the X and Y datasets, the “coarse-fine” selection strategy was applied to extract feature variables for the corresponding physiological parameters. The specific steps are as follows:
Step 1 (Coarse Selection): Screening the wavelength intervals with strong interpretability in the form of interval spectral variables significantly reduces the variable space. From the initial larger feature wavelength set, spectral intervals with higher correlations and significant information extraction abilities are gradually selected. Coarse selection plays a critical role in this strategy because the wavelengths selected in this step serve as the data source for subsequent steps. If wavelengths related to the corresponding physiological parameters are not retained in this step, the final feature wavelengths will lose relevant information, thereby affecting the estimation accuracy of the corresponding physiological parameter models. By dividing X into intervals of a certain width and building models for each interval, the root mean square error of cross-validation (RMSECV) is obtained through cross-validation, and intervals with smaller RMSECV are retained to form the optimal wavelength combination matrix X1 (m×p1). In this step, the iterative random forests (iRF) [43] and interval variable iterative space shrinkage approach (iVISSA) [44] were used to perform coarse selection of the foxtail millet spectral full variables. The iRF parameters were set as follows: 1000 iterations, moving window size of 10, 20 sub-intervals, and a maximum of 10 principal components. The iVISSA parameters were set as: Window-Based Moving Subsampling (WBMS) generates k = 1000 subsets, with an initial weight w0 = 0.5.
Step 2 (Fine Selection): Based on the principle of model cluster analysis, the coarse-selected wavelength set is further refined to eliminate irrelevant and interfering variables and retain important ones. Strongly correlated feature wavelengths are meticulously selected from the coarse-selected spectral intervals to improve the robustness and stability of the model. Subsets of wavelengths are generated from X1 (m×p1) using specific sampling methods, and models are built for each subset. The RMSECV is obtained via cross-validation, and wavelengths with smaller RMSECV are retained to form the optimal wavelength combination matrix X2 (m×p2). In this step, the competitive adapative reweighted sampling (CARS) [45] and Bag of Symbolic Fourier Approximation Symbols (BOSS) [46] were used to fine-select the coarse spectral wavelengths of the foxtail millet, further reducing the variable space. The CARS parameters were set as follows: Monte Carlo Sampling (MCS) iterations = 100; the BOSS parameters were set as: Window-Based Subsampling (WBS) iterations = 1000, and the optimal model ratio = 0.1.
2.6. Model Construction
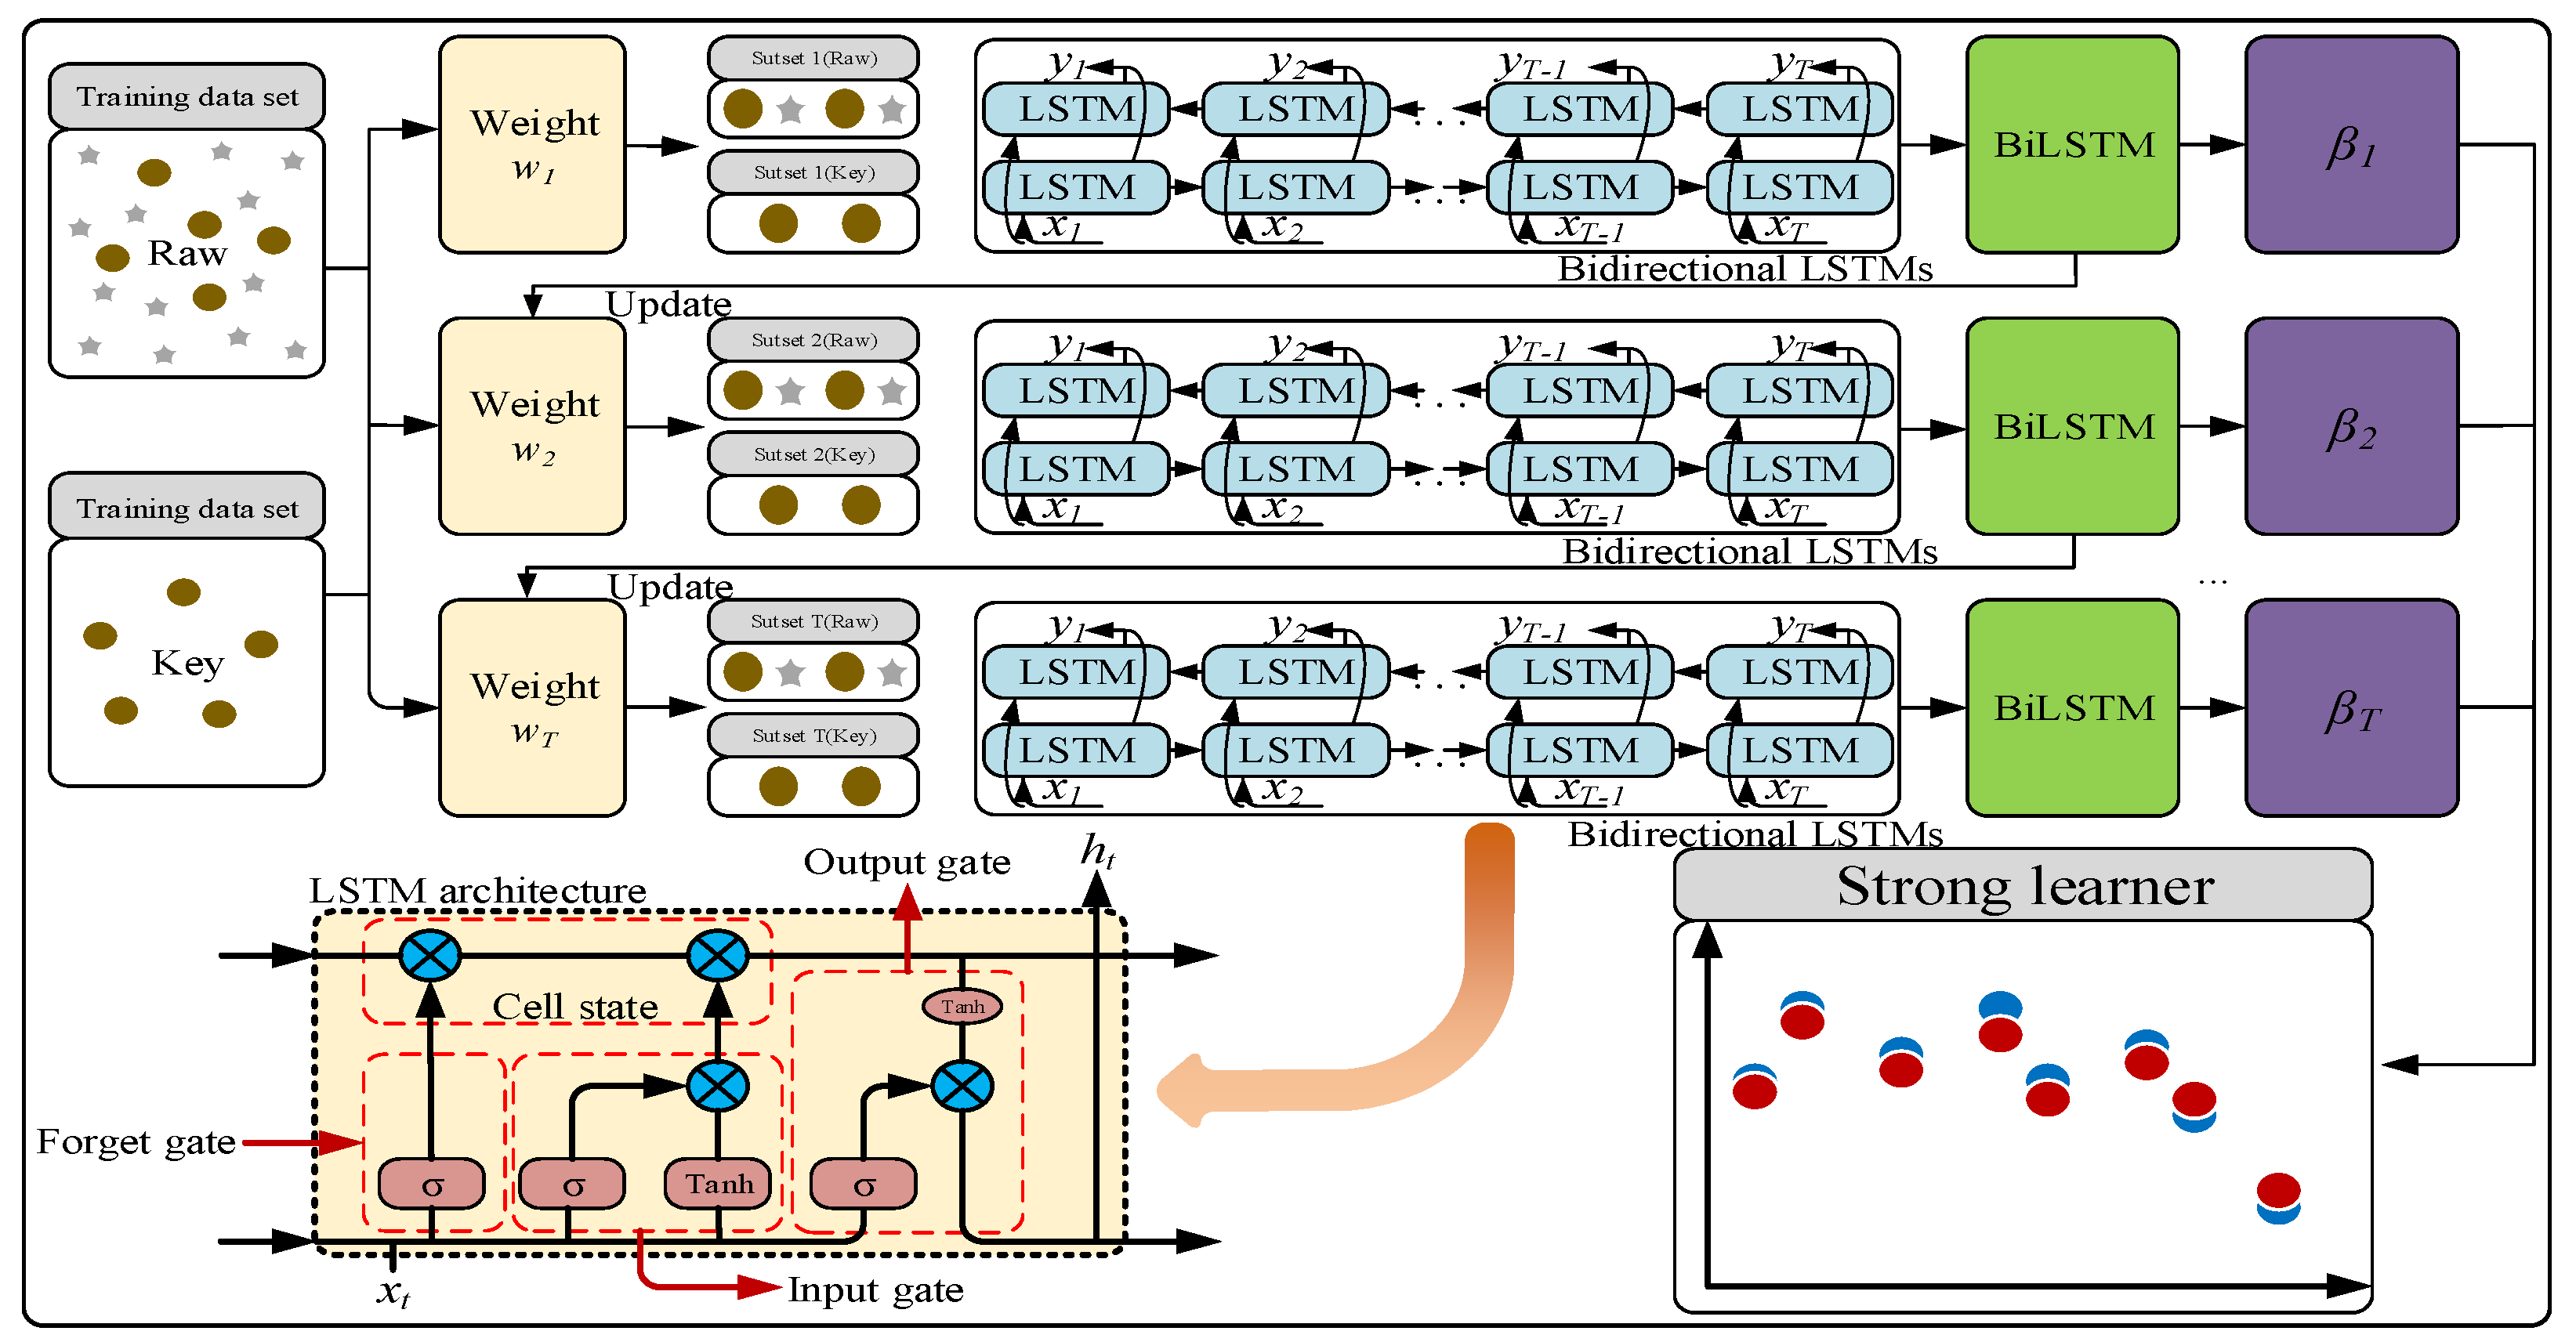
The stacked BilSTM-Adaboost model adopted in this work is an integrated learning model that integrates BiLSTM and Adaboost. The network structure is shown in Figure 2. The model stacks multiple layers of BiLSTM as basic weak learners to capture the bidirectional dependencies of the spectral data. It consists of two independent LSTM layers, which extract features from the sequence in both forward and reverse directions. These layers output hidden states containing spectral information, and eventually, the forward and reverse features are integrated through concatenation or weighted fusion to form a comprehensive representation of the spectral sequence. A two-layer BiLSTM is used to extract more complex hierarchical features by increasing the network depth. The two-layer BiLSTM extracts deeper features compared to a single-layer model, thus avoiding underfitting typically associated with shallow models. The number of hidden layer nodes in each BiLSTM layer is set to 6 to balance model complexity and training efficiency. Adaboost is used to iteratively train 10 weak learners. Based on the current sample weights, it trains BiLSTM weak learners and calculates prediction errors. Each weak learner focuses on fitting the samples with larger prediction errors from the previous round, and is assigned a weight based on its prediction accuracy. The final prediction is determined by the weighted output of all weak learners—weak learners with smaller errors have higher weights, thereby enhancing the model’s fitting ability for difficult samples. The final prediction is the weighted sum of all weak learners’ outputs. Adaboost progressively corrects the prediction bias of BiLSTM through iterative weighting, especially for noisy spectral data or feature wavelengths in foxtail millet, significantly improving the robustness of the model to “abnormal samples”. The iterative weighting mechanism of Adaboost enhances the overall prediction accuracy and robustness of the model. By integrating multiple BiLSTM weak learners, Adaboost gradually optimizes sample weights, reduces prediction bias, and addresses the issues of insufficient accuracy or instability of a single BiLSTM model.
The evaluation metrics for the quantitative detection model in this work include three key statistical indicators: correlation coefficient (R2), root mean square error (RMSE), and residual prediction deviation (RPD) [47].
Figure 2.
Network structure of the stacked BiLSTM-Adaboost model.
3. Results
3.1. Analysis of the Differences in GABA and Vitamin B9 Content Among Different foxtail millet Varieties
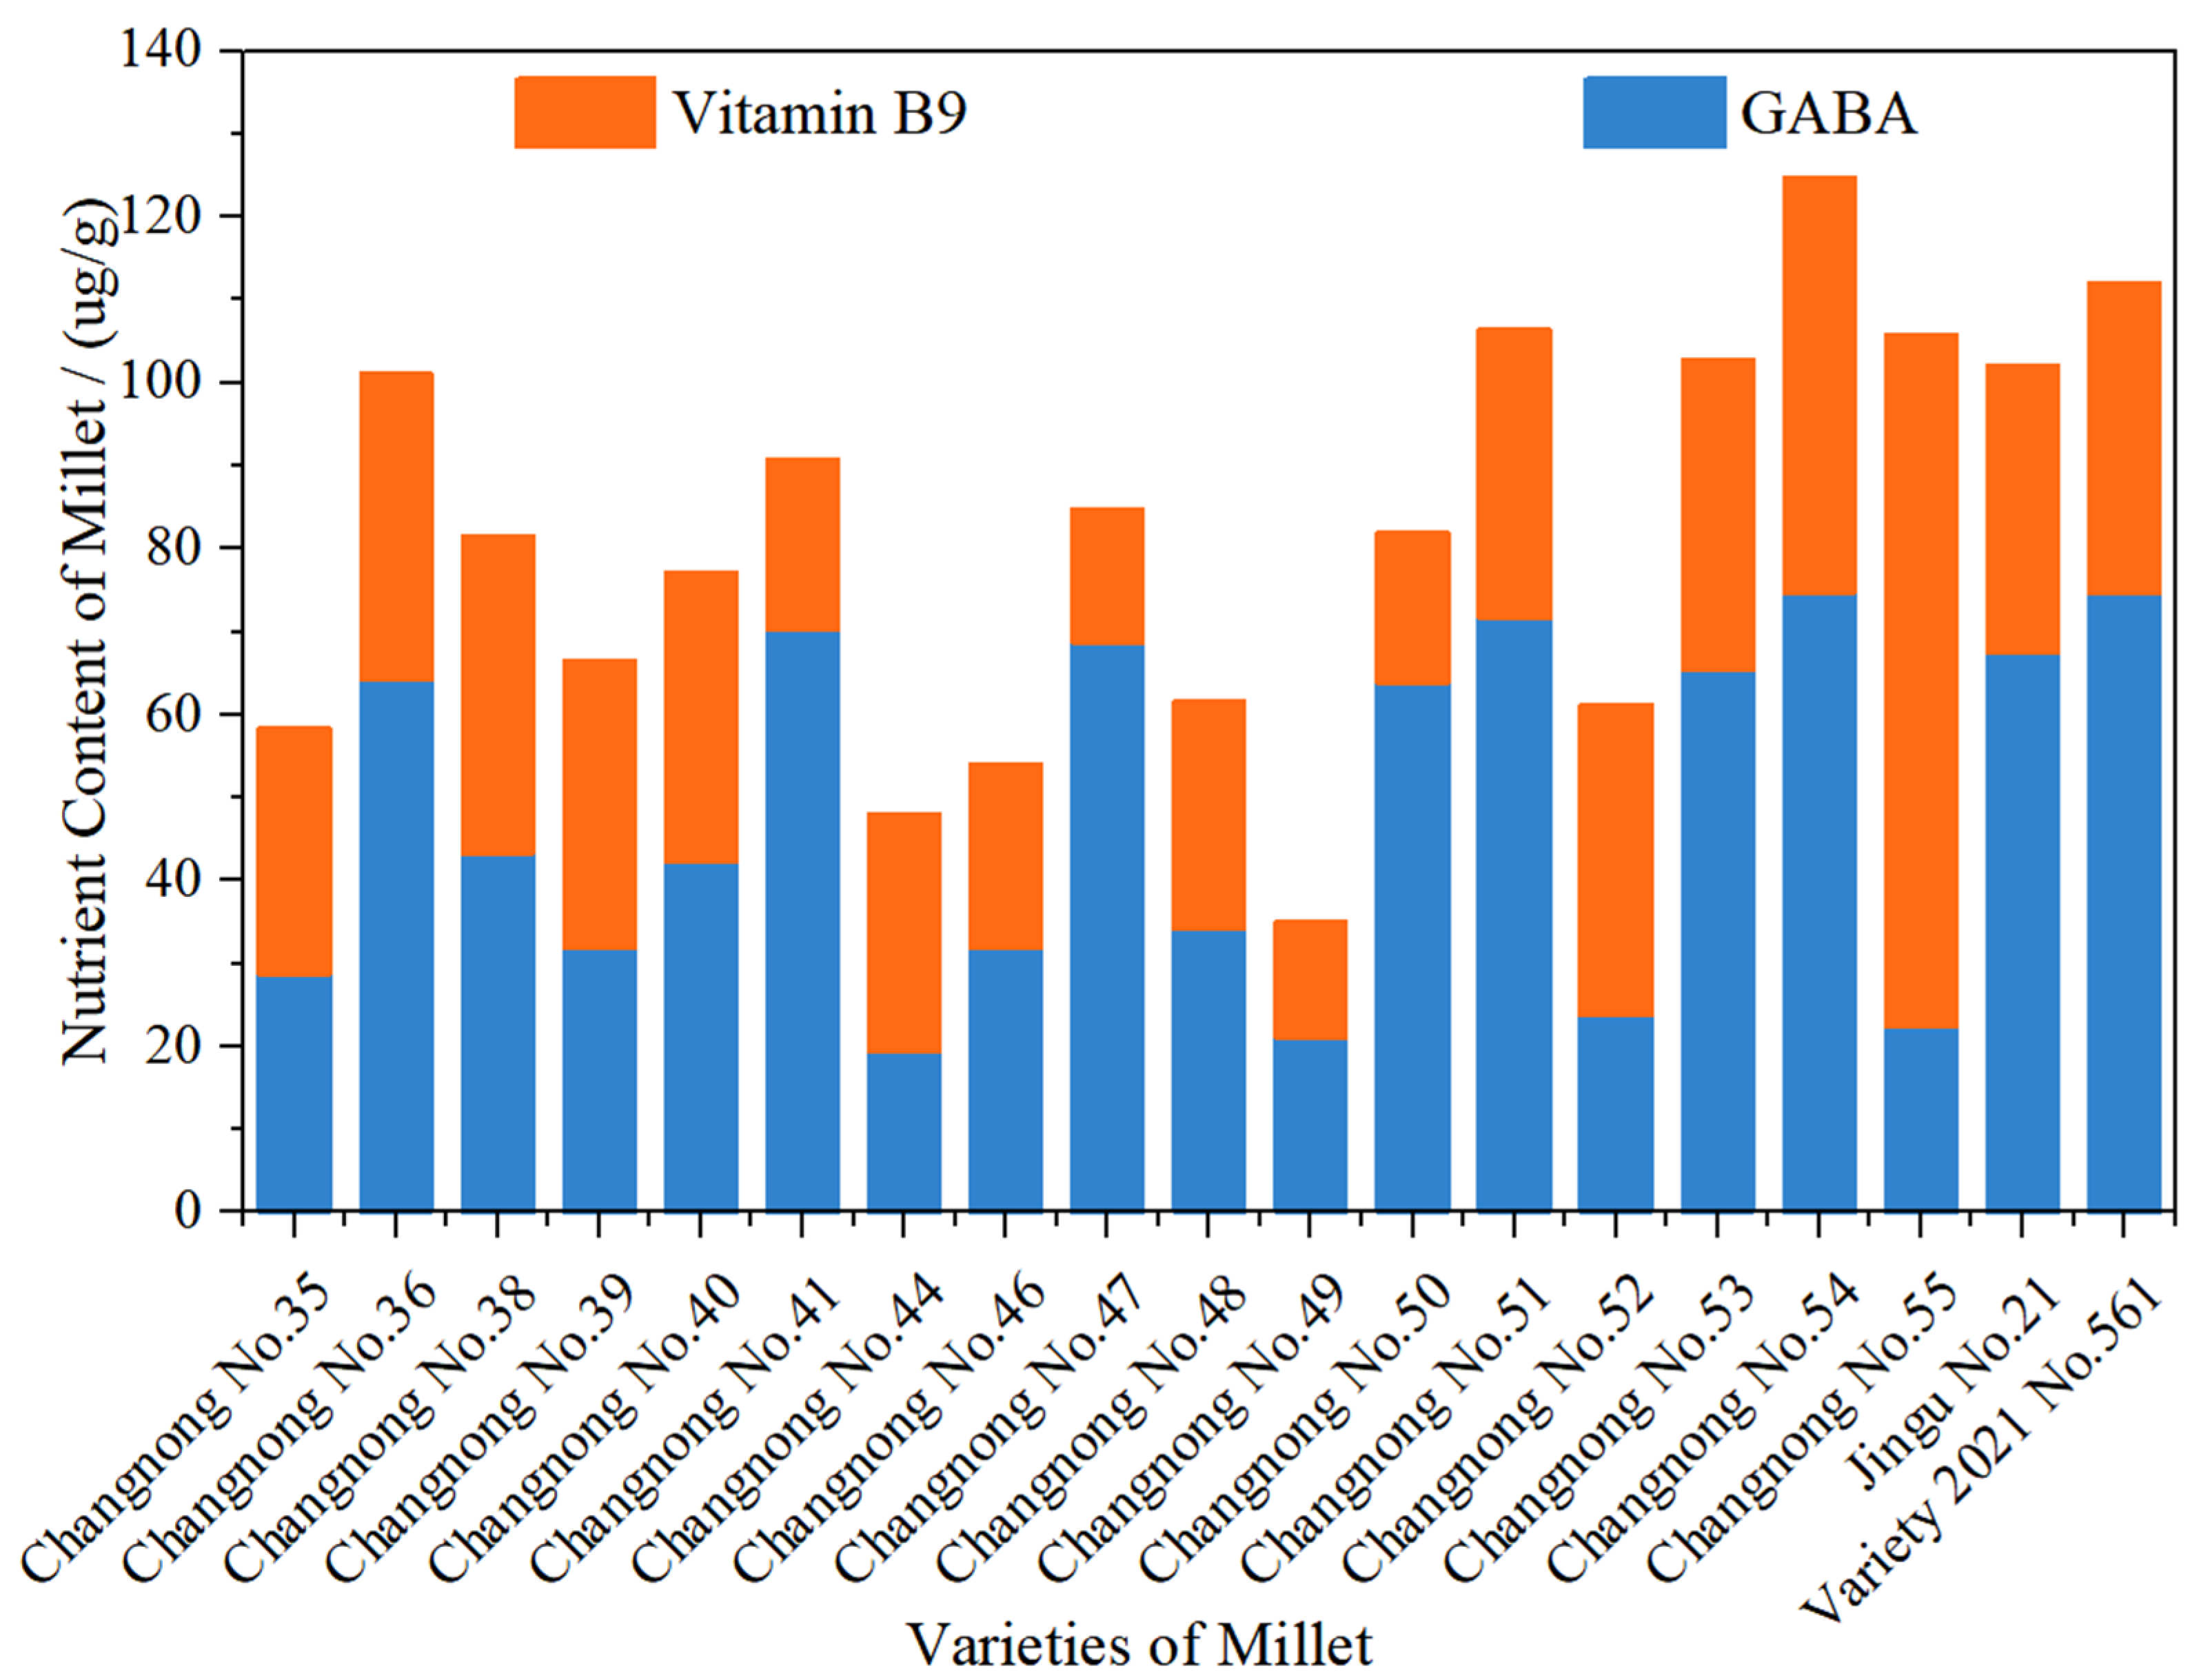
The following figure illustrates the differences in GABA and Vitamin B9 content among various varietiesof the foxtail millet. Significant fluctuations in GABA content were observed across different varieties. The GABA content in ‘Changnong No.35’ is relatively low, whereas varieties such as ‘Changnong No.41’ and ‘Changnong No.50’ have higher GABA content, indicating differences in the GABA accumulation ability among varieties. This variation could be related to factors such as the genetic characteristics of the varieties and the activity of related enzymes. Similarly, there is a notable variation in Vitamin B9 content across different varieties. ‘Changnong No.54’ stands out with a high Vitamin B9 content, while ‘Changnong No.49’ exhibits lower levels of this component. Some varieties, such as ‘Changnong No.54’, show higher total nutritional content, with Vitamin B9 making up a significant proportion. On the other hand, ‘Changnong No.49’ has a lower overall nutritional content, and Vitamin B9 is particularly scarce, reflecting the differences in the accumulation of this nutrient among the varieties. The ratio of GABA to Vitamin B9 also varies among the different varieties. ‘Changnong No.41’ has a higher proportion of GABA, while ‘Changnong No.54’ has a more prominent Vitamin B9 content. This suggests that different varieties exhibit distinct tendencies in accumulating these two nutrients. In conclusion, significant differences exist in the contents and ratios of GABA and vitamin B9 among different foxtail millet varieties. These differences provide a basis for selecting foxtail millet varieties with high nutritional quality and reflect how the genetic characteristics or environmental adaptability of the varieties influence the accumulation of these nutrients.
Figure 3.
Differences in GABA and Vitamin B9 content among 19 foxtail millet varieties.
3.2. Spectral Data Response and Preprocessing Results
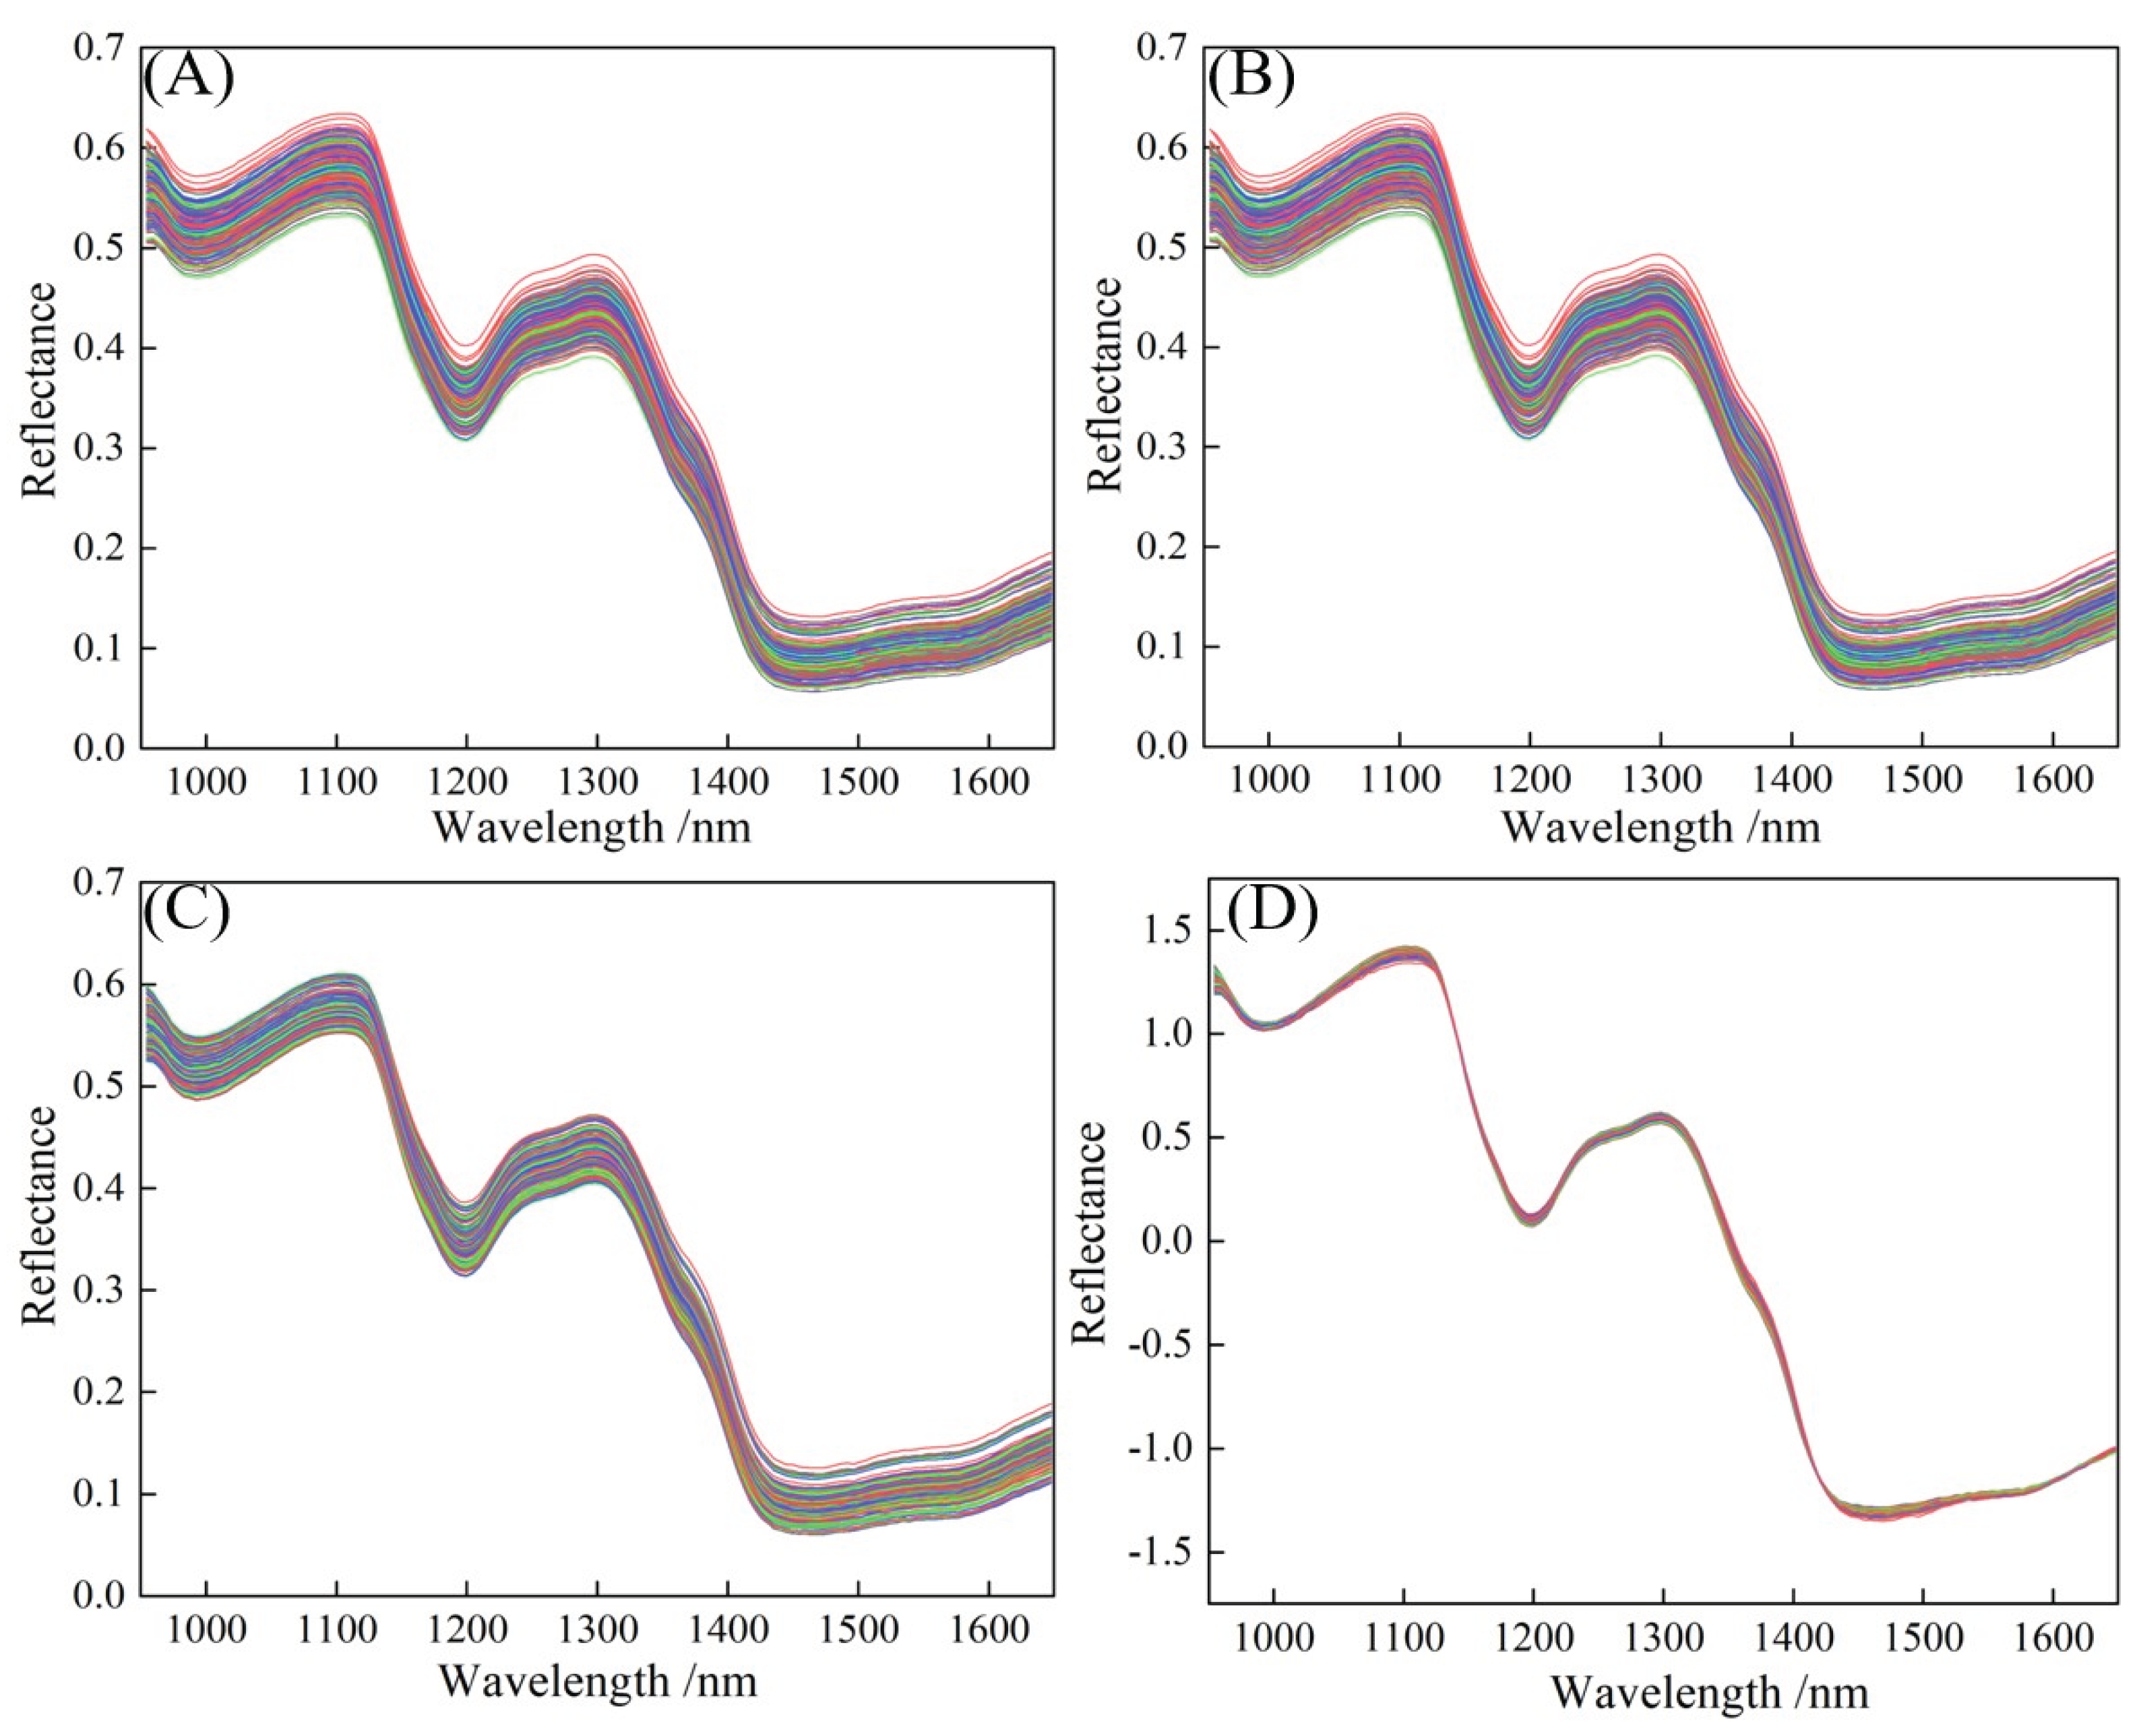
Figure 4 (A) shows the reflectance characteristics of the original spectral response in foxtail millet in the wavelength range of 950–1650 nm, which result from the interaction between multiple internal chemical components of foxtail millet and light. Reflection valleys appear at 997 nm, 1199 nm, and 1468 nm, while reflection peaks form at 1100 nm and 1298 nm. The variations across different wavelength intervals contain rich chemical information. The 950–997 nm range is mainly associated with the vibration absorption of chemical bonds in components such as water and carbohydrates. The O-H bond in water and the C-H bond in carbohydrates undergo vibrational energy level transitions within this wavelength range, absorbing light energy and resulting in a decrease in reflectivity. This absorption reflects the internal energy conversion of molecules, showcasing the selective absorption properties of these functional groups for light of specific wavelengths [48]. The wavelength range of 997-1100 nm may indicate that the vibration modes of some functional groups such as the amide groups in proteins or C-H stretching vibrations in fats, which cause a decrease in light absorption in this interval. This reflects the modulation effect of components like proteins and fats on the spectra in this wavelength segment [48]. The 1100–1199 nm range may correspond to enhanced comprehensive absorption of carbohydrates such as starch. As a polysaccharide, the complex molecular chain structure of starch (e.g., connections of multiple glucose units) leads to the superimposed vibration absorption of O-H, C-O, and other bonds in this range, enhancing light absorption and lowering reflectance, highlighting the dominant absorption of carbohydrates in this region [48]. The 1199–1298 nm range likely corresponds to the weakened absorption of partial functional groups (e.g., C-H, O-H overtone), reflecting the influence of the overtone vibration of functional groups on spectral features. The 1298–1468 nm range is dominated by the strong absorption of O-H stretching overtone in water. Water is a polar molecule. The vibration frequency doubling absorption of the O-H bond has a strong absorption intensity in this wavelength range, absorbing a large amount of light energy, which significantly reduces the reflectance. This feature highlights the key influence of water on the reflectance in this spectral range. The 1468–1650 nm range shows weakened absorption, likely due to the overlapping effects of absorption characteristics from various components in foxtail millet, such as proteins, fats, and carbohydrates. The reflectance exhibits a specific trend of variation,which is a macroscopic spectral manifestation of the synergistic effect of multiple chemical components, reflecting the complexity of the composition of foxtail millet and the comprehensiveness of its spectral characteristics [48, 49].
Figure 4 (B) shows the spectral curve after preprocessing of S-G, which effectively reduces random noise while preserving the shape and position of spectral characteristic peaks. Compared to Figure 4 (A), the spectral curve in Figure 4 (B) is smoother, with significantly reduced noise. The identification of characteristic peaks (in intervals such as 1000-1200 nm and 1300-1400 nm) has improved, and the baseline tends to be stable. However, there may still be slight shifts due to sample scattering or background differences. Following S-G smoothing, the data were processed with discrete eavelet transform (DWT) to decompose the spectral signal into components of different frequencies, removing high-frequency noise while retaining the low-frequency valid signal, as shown in Figure 4 (C). The spectral curve is further optimized, noise is more thoroughly suppressed, the resolution of the characteristic peaks is enhanced, and the baseline drift is better corrected, improving the overall spectral stability. SNV corrects the light scattering caused by the differences in particle size and stacking density of foxtail millet, making the spectra more comparable. Combining S-G, DWT, and SNV, the results achieved multiple optimizations, including noise suppression, baseline correction, and scattering correction, as shown in Figure 4 (D). The consistency of the spectral curves has been significantly improved, the fluctuation range of reflectance has been narrowed, the deviation caused by scattering has been eliminated, and the regularity of characteristic peaks has become more prominent, greatly enhancing the spectral quality.
3.3. Feature Wavelength Extraction and Detection Model Results for GABA in foxtail millet
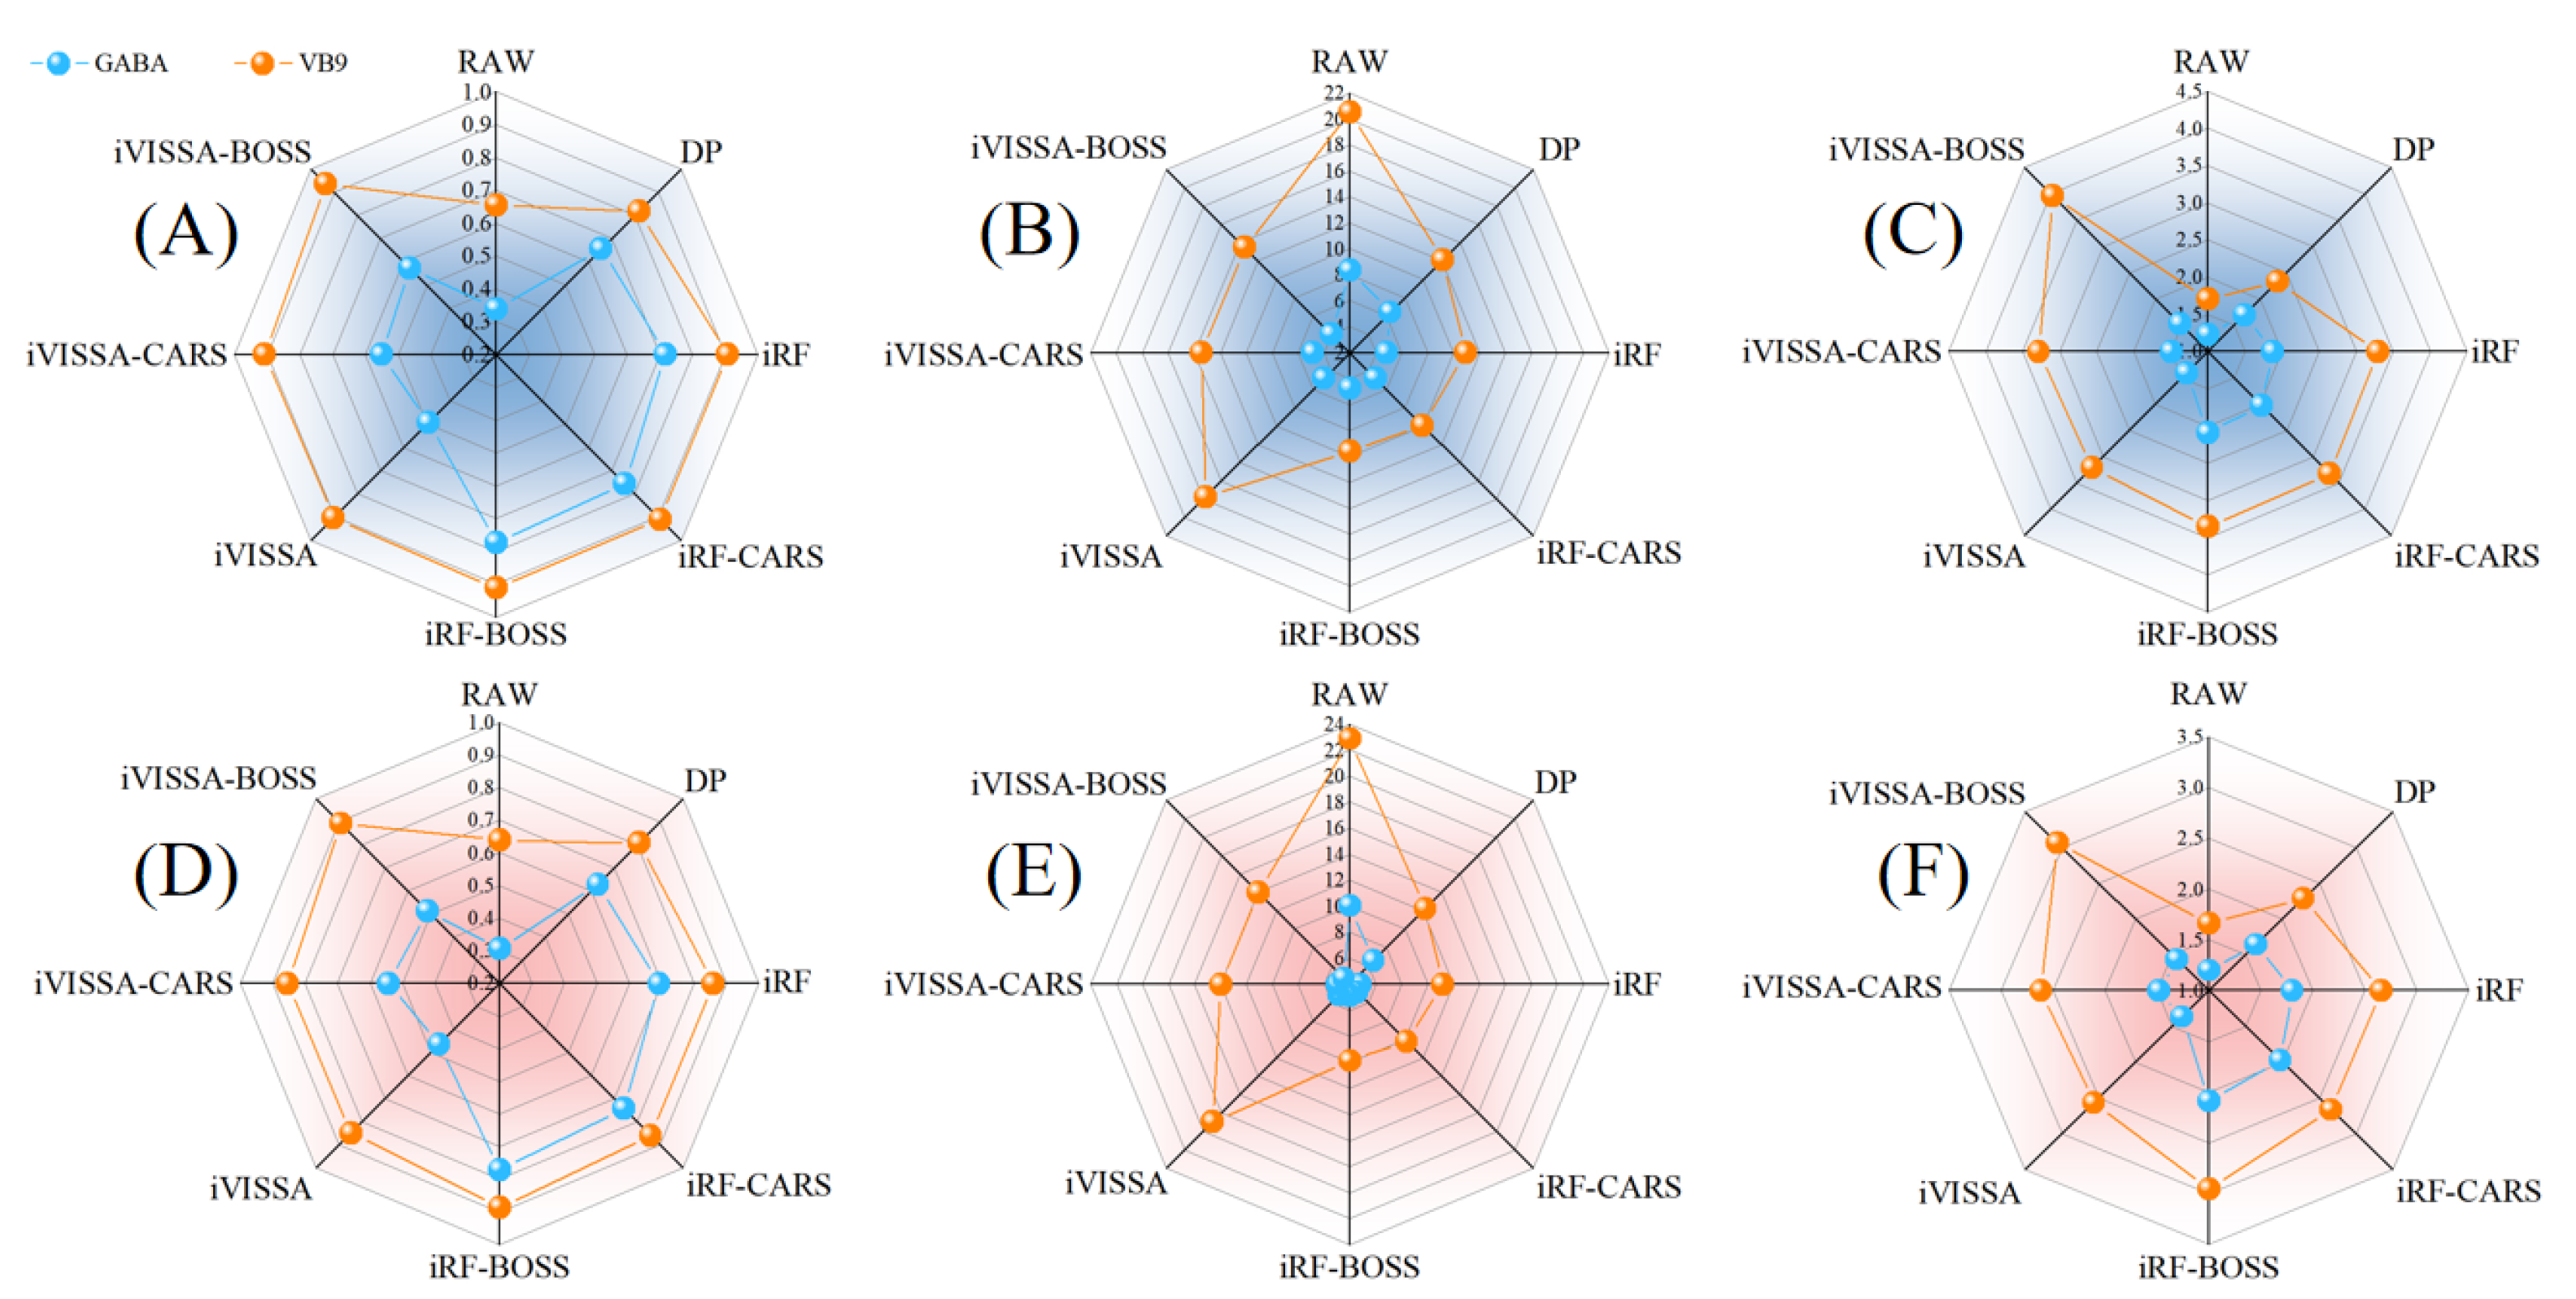
The results of using millet GABA raw data, preprocessing data, and feature extraction data combined with the BiLSTM-AdaBoost model are shown in Table S2. The stacked BiLSTM-Adaboost was used to establish an association model between the original spectral data of foxtail millet and the content of GABA. The results showed that RC2 = 0.3389, RMSEC = 20.5340, RPDC = 1.2299, RP2 = 0.3059, RMSEP = 22.8755, and RPDP = 1.2000. After preprocessing the data with combined S-G, DWT, and SNV, the results improved significantly: RC2 = 0.6539, RMSEC = 12.1143, RPDC = 1.7000, RP2 = 0.6297 RMSEP = 12.2218, and RPDP = 1.8022. This indicates that data preprocessing plays a crucial role in the process of constructing a component content detection model using spectral data, and can significantly improve the performance of the model. The range of 1275-1341 nm is related to the combined vibration modes of molecules, that is, the coupling effect of multiple chemical bond vibrations (the coordinated vibration of C-H and N-H bonds). The spectral signals in this interval is stable and less affected by noise, which can effectively capture the structural information of the molecular skeleton of the GABA. The prediction results of the model were: RC2 = 0.7169, RMSEC = 10.9565, RPDC = 1.8794, RP2 = 0.6921, RMSEP = 11.1451, RPDP = 1.8022. When iVISSA was applied for rough extraction, 42 feature wavelengths were obtained, which extended the wavelength range to include 1360–1445 nm, 1483–1558 nm, and 1643–1648 nm. The prediction results of the model at this time are shown in Figure 6. However, a comparison revealed that the prediction accuracy of the model based on iRF-extracted wavelengths was higher than that of iVISSA. Since iRF focuses on continuous, strong signal intervals—where spectral absorption is intense and the signal-to-noise ratio is high—it directly correlates with the core functional groups of GABA, thereby avoiding interference from weak signal intervals. Although iVISSA extended the wavelength range, the newly added discrete intervals exhibited weak signals and low specificity—potentially containing background noise irrelevant to GABA—which may cause the model to learn erroneous features.
The coarsely extracted feature wavelength set was refined using CARS and BOSS. For the feature wavelengths initially selected by iRF, CARS refined 23 feature wavelengths, while BOSS refined 26. Notably, the model built with the wavelengths selected by BOSS demonstrated higher prediction accuracy, achieving RC2 = 0.7715, RMSEC = 9.6015, RPDC = 2.0920, RP2 = 0.7701, RMSEP = 9.8746, and RPDP = 2.0856. The ultimately optimized wavelength set was determined as 1021, 1025, 1030, 1049, 1058, 1068, 1073, 1077, 1082, 1087, 1091, 1096, 1115, 1124, 1275, 1280, 1299, 1313, 1318, and 1327 nm.
For the feature wavelengths initially selected by iVISSA, CARS refined 17 feature wavelengths, while BOSS refined 16. However, the model built with wavelengths selected by CARS demonstrated higher prediction accuracy, achieving RC2 = 0.5510, RMSEC = 13.4580, RPDC = 1.4924, RP2 = 0.5421, RMSEP = 13.9349, and RPDP = 1.4778.
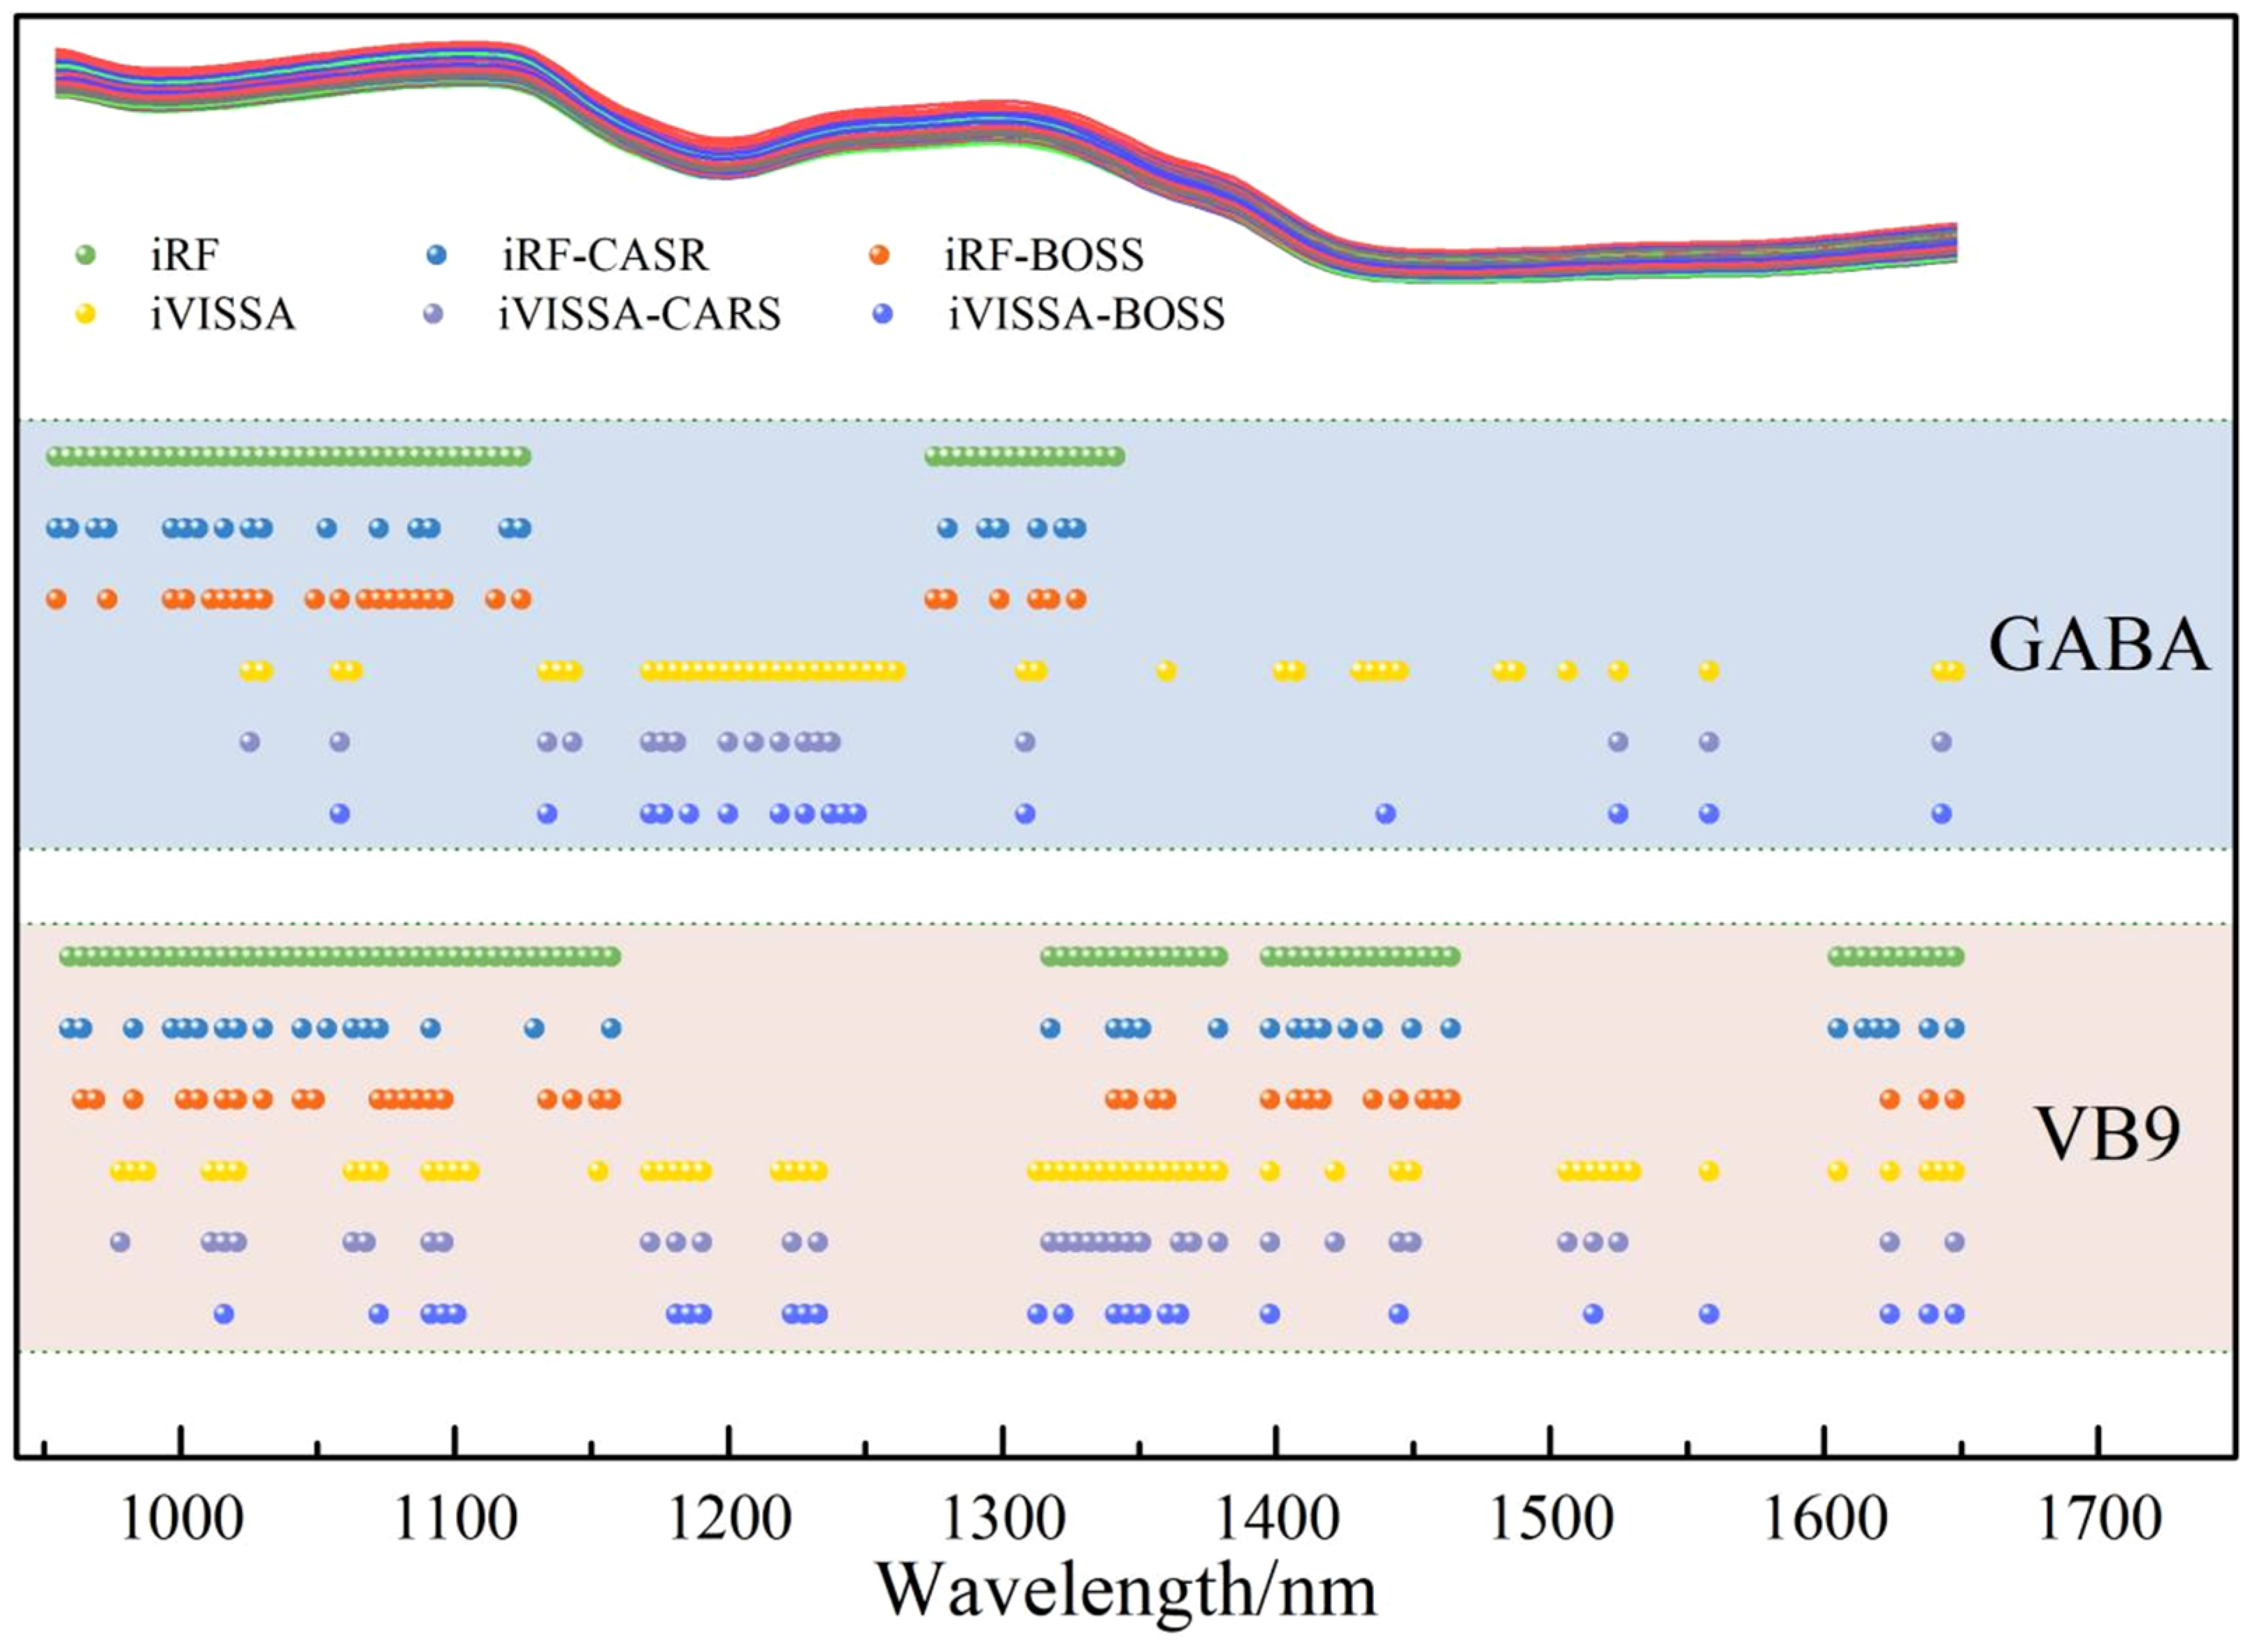
Comparative analysis revealed that the detection model built with the wavelength set refined by iRF-BOSS achieved optimal performance. The wavelengths are highly concentrated in strong absorption regions of hydrogen-containing groups: 14 wavelengths (70%) distributed within 1021–1124 nm represent the most typical spectroscopic fingerprints of GABA molecules. These wavelengths exhibit intense signals and high specificity, directly related to the content of amino groups and methylene groups. Moreover, 6 wavelengths covering 1275–1327 nm retain core sensitive points for combination vibrations. They encompass peak positions in the combination band region (1299 nm, 1313 nm) [50], which are sensitive to the conformational changes of GABA molecules, thereby further enhancing the accuracy of concentration prediction. The refined wavelengths exist as discrete single points, all located at the vertices or sudden slope changes of the spectral absorption peaks. These serve as “informational anchor points” that maximally reflect the changes in GABA concentration, effectively avoiding the interference from redundant wavelengths in continuous intervals.
Figure 5.
Distribution of feature wavelengths for GABA and Vitamin B9 in foxtail millet.
3.4. Feature Wavelength Extraction and Detection Model Results for Vitamin B9 in foxtail millet
The results of using millet Vitamin B9 raw data, preprocessing data, and feature extraction data combined with the BiLSTM-AdaBoost model are shown in Table S3. The BiLSTM-Adaboost was used to establish an association model between the original spectral data of foxtail millet and the content of vitamin B9. The prediction results are shown in Figure 6, with performance metrics: RC2 = 0.6554, RMSEC = 8.3265, RPDC = 1.7035, RP2 = 0.6391, RMSEP = 10.0447, and RPDP= 1.6646. After preprocessing with S-G, DWT, and SNV, the results improved: RC2 = 0.8164, RMSEC = 6.3903, RPDC = 2.3338, RP2 = 0.8083, RMSEP = 6.5725, RPDP = 2.2840.
For Vitamin B9, 82 feature wavelengths were extracted using iRF, which were distributed in the ranges of 959-1157, 1318-1379, 1398-1464, and 1605-1648 nm. The 959-1157 nm range primarily involves the first overtone of C-H and N-H bonds, which may be related to the aromatic or heterocyclic structures in the folic acid molecule. The 1318-1379 nm range corresponds to the second overtone of the O-H bonds in hydroxyl groups, which could be influenced by hydroxyl groups in the folic acid molecule or moisture. The 1398-1464 nm range is associated with hydrogen bonding interactions within the folic acid molecule. The 1605-1648 nm range may correspond to the characteristic absorption of the glutamic acid group in the side chain of folic acid. The iVISSA rough selection has additional wavelength intervals, of 1157-1318 and 1506-1605 nm compared to iRF. The 1157-1318 nm range may include interaction signals between folic acid and other components (such as proteins or carbohydrates) or the absorption from specific conjugated structures in the folic acid molecule. The 1506-1605 nm range could involve higher overtones of C-H bonds or vibrations of the overall molecular framework [51]. By adding these two wavelength intervals, iVISSA covers a more complete spectral feature of the folic acid molecule, reducing the omission of key information.
The coarsely extracted feature wavelength set was refined using CARS and BOSS. For the feature wavelengths initially selected by iRF, CARS refined 36 feature wavelengths, while BOSS refined 36 feature wavelengths. Meanwhile, through comparison, the model built with the wavelengths selected by BOSS demonstrated higher prediction accuracy, achieving RC2 = 0.9111, RMSEC = 4.7457, RPDC = 3.3539, RP2 = 0.8856, RMSEP = 4.8471, and RPDP = 2.9566.
For the feature wavelengths initially selected by iVISSA, CARS refined 33 feature wavelengths, while BOSS refined 25 feature wavelengths. However, through comparison, the model built with the wavelengths selected by BOSS demonstrated higher prediction accuracy, achieving RC2 = 0.9362, RMSEC = 4.0215, RPDC = 3.9590, RP2 = 0.8932, RMSEP = 4.6676, and RPDP = 3.0600. The ultimately optimized wavelength set was determined as 1016, 1073, 1091, 1096, 1101, 1181, 1186, 1190, 1223, 1228, 1233, 1313, 1322, 1341, 1346, 1351, 1360, 1365, 1398, 1445, 1516, 1558, 1624, 1638, and 1648 nm.
Comparative analysis revealed that the detection model built with the wavelength set refined by iVISSA-BOSS technology achieved optimal performance, demonstrating excellence in the detection of vitamin B9. This wavelength set precisely focuses on the characteristic spectral regions of the core structure of folic acid molecules: 15 wavelengths (60%) are distributed within the 959-1157 nm, primarily corresponding to the first overtone vibrations of C-H and N-H bonds. This represents the typical spectral feature range for the aromatic and heterocyclic structures in folic acid molecules, with signals exhibiting significant specificity that directly correlates with the content information of key structures in folic acid. Within the core sensitive regions reflecting intramolecular interactions, 8 wavelengths are distributed across the 1318-1379 nm and 1398-1464 nm intervals. Among them, 1318-1379 nm is related to the second overtone vibration of the O-H bonds in the hydroxyl groups, which can sensitively capture the impact of the hydroxyl functional groups and water in the folic acid molecule on the spectral signals. The 1398-1464 nm range corresponds to the characteristic region of hydrogen bond interactions within the molecule, presenting a highly sensitive response to structural changes in the folic acid molecule. These wavelengths cover the key sites of intramolecular interactions, providing spectral support at the structural level for the precise prediction of vitamin B9 concentration. Additionally, 2 wavelengths located at 1605-1648 nm are presumed to be related to the characteristic absorption of the glutamic acid moiety in the folic acid side chain, effectively supplementing the spectral representation of the overall structure of the molecule. Notably, all refined wavelengths exist as discrete single points, precisely located at the vertices or critical positions of sudden slope changes in the spectral absorption peaks. This strategy avoids the interference from redundant wavelengths in continuous intervals, enabling the model to efficiently extract core spectral information relevant to concentration, thereby achieving accurate detection of vitamin B9 content in foxtail millet. This wavelength selection strategy, focused on key informational anchor points, not only significantly enhances the model’s prediction accuracy but also strengthens the reliability of the detection method in terms of stability and generalization capability.
Figure 6.
Detection results of the BiLSTM-Adaboost model. (A) and (D) are R2 of the calibration set and the prediction set, respectively; (B) and (E) are the RMSE of the calibration set and the prediction set, respectively; (C) and (F) are the RPD of the calibration set and the prediction set, respectively.
4. Discussion
There are significant differences in the GABA and vitamin B9 contents among different varieties of the foxtail millet. These differences reflect both the genetic traits of the varieties and the regulatory effects of key enzymes in the metabolic pathways. The higher GABA content in ‘Changnong No.41’ and ‘Changnong No.50’ may be related to the activity of glutamate decarboxylase (GAD), an enzyme that catalyzes the decarboxylation of glutamate to produce GABA. The variations in the expression of its encoding genes may lead to the differences of accumulation capacity among varieties. The extreme differences in vitamin B9 content, with ‘Changnong No.54’ exhibiting high levels and ‘Changnong No.49’ exhibiting low levels, may be related to the activity of dihydrofolate reductase in the folic acid synthesis pathway, or to gene polymorphism. Notably, some varieties exhibit the characteristic of ‘specific accumulation’. ‘Changnong No.41’ has a particularly high proportion of GABA, while ‘Changnong No.54’ is predominantly rich in vitamin B9. This tendency may be related to the long-term breeding goals or environmental adaptability of the varieties.
Feature wavelength extraction is a key step in spectral modeling, aimed at selecting critical information points highly correlated with the target component from hundreds of wavelengths, thereby reducing data dimensionality and enhancing model efficiency. This work compared two coarse extraction methods, iRF and iVISSA, and found that the performance differences were closely related to the spectral response characteristics of the molecular structure of the components. In GABA detection, iRF outperforms iVISSA. iRF focuses on the continuous strong signal intervals of 955–1124 nm and 1275–1341 nm, corresponding to the first overtone absorption of C-H and N-H bonds and combination vibration modes in GABA molecules. These regions have strong signals and high signal-to-noise ratios, directly related to amino and methylene functional groups [51], avoiding interference from weak signal intervals. However, the additional ranges of iVISSA, such as 1360-1445 nm, contain absorption signals of water (O-H overtone) and carbohydrates, which have no direct correlation with the GABA structure, resulting in the model learning redundant information and having a lower prediction accuracy than iRF. In the detection of vitamin B9, iVISSA is superior. The additional 1157–1318 nm and 1506–1605 nm ranges in iVISSA cover the characteristic absorption of the aromatic ring, heterocyclic structures, and side-chain glutamic acid groups of the folate molecules [52]. These regions, which involve high-order overtones of C-H bonds and fundamental vibrations of the molecular skeleton, constitute integral components of folic acid-specific spectral signatures. In contrast, iRF does not include these ranges, potentially missing key structural information, leading to lower model accuracy than the iVISSA-BOSS combination. Further feature wavelength selection through CARS and BOSS revealed that BOSS performed better in both GABA and vitamin B9 detection. This may be due to the different selection mechanisms of the two methods. BOSS retains wavelengths with high stability through guided sampling, while CARS is based on variable weights and exponential decay, which is suitable for integrating strong signal regions and multi-interval features of complex structures in GABA and vitamin B9. Ultimately, the optimal wavelength set focuses on absorption peak vertices or slope mutation points, directly linking molecular structure to spectral response. This strategy avoids the interference of redundant information from continuous intervals, significantly improving the model's prediction accuracy and generalization ability.
The advantage of the stacked BiLSTM-Adaboost model in GABA detection is that it can fully utilize the processing power of BiLSTM on spectral sequence information to capture the dependencies between different wavelengths. At the same time, the ensemble learning of Adaboost is used to enhance the fitting ability and generalization ability of the model for complex data. Compared to traditional machine learning models, it is better at handling nonlinear relationships and long-range dependencies in spectral data, thus improving detection accuracy. In the detection of vitamin B9 , the model effectively captures the complex spectral features of folic acid molecules, improving both the prediction accuracy and stability. Compared to GABA detection, the feature wavelength distribution for vitamin B9 is more extensive and involves more molecular structural features. The model requires a stronger learning ability to process this information. The stacked BiLSTM-Adaboost model, with its unique structure and the advantages of ensemble learning, meets this need effectively.
5. Conclusions
This work analyzed the GABA and vitamin B9 content in different foxtail millet varieties and found significant differences among them, which are related to genetic characteristics and environmental adaptability. These findings provide a basis for the selection of foxtail millet varieties with high nutritional quality. The response of the spectral data and preprocessing results show that combining multiple preprocessing methods can effectively improve spectral quality, laying a solid foundation for subsequent model construction. In terms of feature wavelength extraction and model development, the stacked BiLSTM-Adaboost model demonstrated excellent performance, accurately detecting the GABA and vitamin B9 content in foxtail millet. The selected strategy for feature wavelengths enhanced the prediction accuracy and stability of the model.
Future research should further expand the sample size of varieties of the foxtail millet and investigate the specific mechanisms by which genetic and environmental factors influence the GABA and vitamin B9 content, establishing a more comprehensive variety selection model. In terms of spectral data processing, more advanced preprocessing methods and feature wavelength extraction techniques could be explored to improve the utilization of spectral data. For the stacked BiLSTM-Adaboost model, further optimization of the model structure and parameters is needed, along with the integration of other deep learning technologies, to enhance the generalization ability and detection speed of the model. Additionally, research on spectral detection of other nutritional components in foxtail millet could be conducted to build multi-component detection models, providing more comprehensive technical support for foxtail millet quality evaluation and functional food development.
Supplementary Materials
The following supporting information can be downloaded at the website of this paper posted on Preprints.org, Table S1: The detailed information of tested millet varieties. Table S2: Stacked BiLSTM-AdaBoost model results using millet GABA raw data (RAW), preprocessed data (PD), and feature extracted data. Table S3: Stacked BiLSTM-AdaBoost model results using millet Vitamin B9 raw data (RAW), preprocessed data (PD), and feature extracted data.
Author Contributions
For research articles with several authors, a short paragraph specifying their individual contributions must be provided. The following statements should be used “Conceptualization, A.Z. and E.G.; methodology, G.W.; software, G.W.; validation, E.G., Z.P. and G.W.; formal analysis, E.G.; investigation, J.H.; resources, W.Y.; data curation, J.H.; writing—original draft preparation, E.G.; writing—review and editing, G.W.; visualization, W.Y.; supervision, A.Z.; project administration, A.Z.; funding acquisition, A.Z. All authors have read and agreed to the published version of the manuscript.” Please turn to the CRediT taxonomy for the term explanation. Authorship must be limited to those who have contributed substantially to the work reported.
Funding
This research was funded by Shanxi Agricultural University Academic Revitalization Project (2023XSHF1); Shanxi Agricultural University Talent Introduction Research Start-up Project (2023BQ127); the National Key Research and Development Program of China (2023YFD1202704); the Construction Project of the National Modern Agricultural Industry Technology System (CARS-06-14.5-A21) and the Construction Project of the Modern Agricultural Industrial Technology System in Shanxi Province (2023CYJSTX04-04).
Data Availability Statement
Dataset available on request from the authors.
Conflicts of Interest
The authors declare no conflicts of interest.
Abbreviations
The following abbreviations are used in this manuscript:
| GABA | Gamma-aminobutyric acid |
| CNN | Convolutional neural networks |
| SVM | Support vector machines |
| SLR | Stepwise linear regression |
| LSTM | Long short-term memory networks |
| BiLSTM | Bidirectional long short-term memory network |
| Adaboost | Adaptive boosting |
| HPLC | High-performance liquid chromatography |
| S-G | Savitzky-Golay |
| SNV | Standard normal variate transformation |
| SPXY | Sample set partitioning based on joint x-y distance |
| RMSECV | Root mean square error of cross-validation |
| CARS | Competitive adapative reweighted sampling |
| BOSS | Bag of Symbolic Fourier Approximation Symbols |
| iRF | Iterative random forests |
| iVISSA | Interval variable iterative space shrinkage approach |
| MCS | Monte carlo sampling |
| WBS | Window-based subsampling |
| WBMS | Window-based moving subsampling |
| R2 | Correlation coefficient |
| RMSE | Root mean square error |
| RPD | Residual prediction deviation |
| GAD | Glutamate decarboxylase |
References
- Liu, L.; Zhang, J.; Sun, Z.; Zhang, Q. Unlocking the potential of foxtail millet: Spatial strategy and multiple benefits of expanding cultivation on marginal lands in China. AGR SYST 2025, 229, 104420. [Google Scholar] [CrossRef]
- Li, B.; Liu, X.; Li, Z.; Wang, G.; Zhao, B.; Xu, X.; Qi, Z.; Wang, G.; Dong, Z. Rotation with Soybean Improved Weed Control and Foxtail Millet Yield. Agronomy 2024, 14, 1622. [Google Scholar] [CrossRef]
- Zhang, L.; Ma, K.; Zhao, X.; Li, Z.; Zhang, X.; Li, W.; Meng, R.; Yuan, X. Development of a comprehensive quality evaluation system for foxtail millet from different ecological regions. FOODS 2023, 12, 2545. [Google Scholar] [CrossRef] [PubMed]
- Yang, L.; Wang, Y.; Li, P.; Weng, J.; Zhao, W.; Jia, Y.; Liu, J. (2025). Effect of wet ball milling on nutritional quality and physicochemical properties of non-waxy and waxy foxtail millet. FOOD CHEM 2025, 144554. [Google Scholar] [CrossRef] [PubMed]
- Hou, S.; Men, Y.; Wei, M.; Zhang, Y.; Li, H.; Sun, Z.; Han, Y. Total protein content, amino acid composition and eating-quality evaluation of foxtail millet (Setaria italica (L.) P. Beauv). FOODS 2022, 12, 31. [Google Scholar] [CrossRef] [PubMed]
- Sun, S.; Zhang, J.; Li, Y.; Xu, Y.; Yang, R.; Luo, L.; Xiang, J. Effects of Sodium Selenite on Accumulations of Selenium and GABA, Phenolic Profiles, and Antioxidant Activity of Foxtail Millet During Germination. FOODS 2024, 13, 3916. [Google Scholar] [CrossRef] [PubMed]
- Li, C.; Zhang, Y.; Xiang, J.; Zhang, J.; Johnson, J.B.; Xu, Y.; Beta, T. Accumulation of γ-aminobutyric acid and modifications of phenolic profiles and antioxidant capacity of foxtail millets during germination. J CEREAL SCI 2023, 114, 103815. [Google Scholar] [CrossRef]
- Shao, L.; Wang, L.; Bai, W.; Liu, Y. Evaluation and analysis of folic acid content in millet from different ecological regions in Shanxi province. Sci Agric Sin 2014, 47, 1265–1272. [Google Scholar] [CrossRef]
- Ma, K.; Yuan, X.; Jia, Z.; Lu, H.; Chen, X.; Wen, X.; Chen, F. Changes in the grain quality of foxtail millet released in China from the 1970s to the 2020s. FOOD RES INT 2025, 209, 116316. [Google Scholar] [CrossRef] [PubMed]
- Gottesmann, C. GABA mechanisms and sleep. NEUROSCIENCE 2002, 111, 231–239. [Google Scholar] [CrossRef] [PubMed]
- Sharma, S.; Saxena, D. C.; Riar, C. S. Changes in the GABA and polyphenols contents of foxtail millet on germination and their relationship with in vitro antioxidant activity. FOOD CHEM 2018, 245, 863–870. [Google Scholar] [CrossRef] [PubMed]
- Zhu, M. Q.; Mora-Plazas, M.; Villamor, E. Folate and vitamin B-12 status and sleep duration in middle childhood. SLEEP MED 2025, 106610. [Google Scholar] [CrossRef] [PubMed]
- Zhang, Y.; Zhang, C.; Man, X.; Men, Y.; Ren, X.; Li, X. , Han, L., Sun, Z., Yang, Y., Hou, S., Han, Y. Functional characterization of the SiFPGS2 gene of foxtail millet in folate accumulation and root development. PLANT GROWTH REGUL 2023, 99, 137–147. [Google Scholar] [CrossRef]
- Guo, Z.; Zhang, J.; Wang, H.; Li, S.; Shao, X.; Xia, L.; Darwish, I.; Guo, Y.; Sun, X. Advancing detection of fungal and mycotoxins contamination in grains and oilseeds: Hyperspectral imaging for enhanced food safety. FOOD CHEM 2024, 142689. [Google Scholar] [CrossRef] [PubMed]
- Aviara, N. A.; Liberty, J. T.; Olatunbosun, O. S.; Shoyombo, H. A.; Oyeniyi, S. K. Potential application of hyperspectral imaging in food grain quality inspection, evaluation and control during bulk storage. J Agr Food Res 2022, 8, 100288. [Google Scholar] [CrossRef]
- Medina–García, M.; Amigo, J. M.; Martínez-Domingo, M. A.; Valero, E. M.; Jiménez–Carvelo, A. M. Strategies for analysing hyperspectral imaging data for food quality and safety issues–A critical review of the last 5 years. MICROCHEM J 2025, 113994. [Google Scholar] [CrossRef]
- Zhang, J.; Guo, Z.; Ren, Z.; Wang, S.; Yue, M.; Zhang, S.; Yin, X.; Gong, K.; Ma, C. Rapid determination of protein, starch and moisture content in wheat flour by near-infrared hyperspectral imaging. J FOOD COMPOS ANAL 2023, 117, 105134. [Google Scholar] [CrossRef]
- Chen, B.; Shi, B.; Gong, J.; Shi, G.; Jin, H.; Qin, T.; Yang, Z.; Lim, K.; Liu, W.; Zhang, J.; Wang, Z. Quality detection and variety classification of pecan seeds using hyperspectral imaging technology combined with machine learning. J FOOD COMPOS ANAL 2024, 131, 106248. [Google Scholar] [CrossRef]
- Shi, T.; Gao, Y.; Song, J.; Ao, M.; Hu, X.; Yang, W.; Chen, W.; Liu, Y.; Feng, H. Using VIS-NIR hyperspectral imaging and deep learning for non-destructive high-throughput quantification and visualization of nutrients in wheat grains. FOOD CHEM 2024, 461, 140651. [Google Scholar] [CrossRef] [PubMed]
- Wang, C.; Liu, B.; Liu, L.; Zhu, Y.; Hou, J.; Liu, P.; Li, X. A review of deep learning used in the hyperspectral image analysis for agriculture. ARTIF INTELL REV 2021, 54, 5205–5253. [Google Scholar] [CrossRef]
- Ahmed, M. T.; Monjur, O.; Khaliduzzaman, A.; Kamruzzaman, M. A comprehensive review of deep learning-based hyperspectral image reconstruction for agri-food quality appraisal. ARTIF INTELL REV 2025, 58, 96. [Google Scholar] [CrossRef]
- Zhang, J.; Zhang, H.; Zhang, Y.; Yin, J.; Zhan, B.; Liu, X.; Luo, W. Qualitative and quantitative analysis of Nanfeng mandarin quality based on hyperspectral imaging and deep learning. FOOD CONTROL 2025, 167, 110831. [CrossRef]
- Ren, Y.; Wang, R.; Xue, D.; Zhou, Y.; Chen, X.; Yuan, X.; Yan, Q.; Luo, C. Soybean seed vigor detection based on deep learning combined with hyperspectral technology. Jiangsu J of Agr Sci 2025, 41, 927–936. [Google Scholar] [CrossRef]
- Yue, J. B.; Leng, M. D.; Tian, Q. J.; Guo, W.; Liu, Y.; Feng, H.; Qiao, H. B. Estimation of Leaf Physical and Chemical Parameters Based on Hyperspectral Remote Sensing and Deep Learning Technologies. SPECTROSC SPECT ANAL 2024, 44, 2873–2883. [Google Scholar] [CrossRef]
- Greff, K.; Srivastava, R. K.; Koutník, J.; Steunebrink, B. R.; Schmidhuber, J. LSTM: A search space odyssey. IEEE T NEUR NET LEAR 2016, 28, 2222–2232. [Google Scholar] [CrossRef] [PubMed]
- Lee, J.; Lee, N.; Son, J.; Shin, D. An LSTM model with optimal feature selection for predictions of tensile behavior and tensile failure of polymer matrix composites. KOREAN J CHEM ENG 2023, 40, 2091–2101. [Google Scholar] [CrossRef]
- Wang, Z.; Fan, S.; An, T.; Zhang, C.; Chen, L.; Huang, W. Detection of insect-damaged maize seed using hyperspectral imaging and hybrid 1D-CNN-BiLSTM model. INFRARED PHYS TECHN 2024, 137, 105208. [Google Scholar] [CrossRef]
- Ojo, M. O.; Zahid, A. Deep learning in controlled environment agriculture: A review of recent advancements, challenges and prospects. SENSORS-BASEL 2022, 22, 7965. [Google Scholar] [CrossRef] [PubMed]
- Huang, H.; Fang, Z.; Xu, Y.; Lu, G.; Feng, C.; Zeng, M.; Tian, J.; Ping, Y.; Han, Z.; Zhao, Z. Stacking and ridge regression-based spectral ensemble preprocessing method and its application in near-infrared spectral analysis. TALANTA 2024, 276, 126242. [Google Scholar] [CrossRef] [PubMed]
- Karakoyun, Y.; Katipoğlu, O. M.; Dogan, A. Deep learning and adaptive boosting for hydroelectric power prediction using hydro-meteorological data: Insights and feature importance analysis. ENG APPL ARTIF INTEL 2025, 158, 111434. [Google Scholar] [CrossRef]
- Wu, X.; Yang, Z.; Yang, Y.; Wu, B.; Sun, J. Geographical origin identification of Chinese red jujube using near-infrared spectroscopy and Adaboost-CLDA. FOODS 2025, 14, 803. [Google Scholar] [CrossRef] [PubMed]
- Zheng, Z.; Yang, Y. Adaptive boosting for domain adaptation: Toward robust predictions in scene segmentation. IEEE T IMAGE PROCESS 2022, 31, 5371–5382. [Google Scholar] [CrossRef] [PubMed]
- Liu, Y. Y.; Liu, D.; Wu, S. H.; Jing, Y. M. Hybrid-driven modeling using a BiLSTM–AdaBoost algorithm for diameter prediction in the constant diameter stage of Czochralski silicon single crystals. Sci Rep. 2025, 15, 1–20. [Google Scholar] [CrossRef] [PubMed]
- Pant, N.; Toshniwal, D.; Gurjar, B. R. Multi-step forecasting of dissolved oxygen in River Ganga based on CEEMDAN-AdaBoost-BiLSTM-LSTM model. Sci Rep. 2024, 14, 11199. [Google Scholar] [CrossRef] [PubMed]
- Ma, K.; Wang, Y.; Yang, Y. Fault Diagnosis of Wind Turbine Blades Based on One-Dimensional Convolutional Neural Network-Bidirectional Long Short-Term Memory-Adaptive Boosting and Multi-Source Data Fusion. Appl. Sci. 2025, 15, 3440. [Google Scholar] [CrossRef]
- Cai, J.; Wang, Y.; Chen, Z.; Gao, Y.; Tang, G. A CNN-BiLSTM short-term wind power forecasting model incorporating adaptive boosting. MEAS SCI TECHNOL 2025, 36, 026210. [Google Scholar] [CrossRef]
- Syu, K. Y.; Lin, C. L.; Huang, H. C.; Lin, J. K. Determination of theanine, GABA, and other amino acids in green, oolong, black, and Pu-erh teas with dabsylation and high-performance liquid chromatography. J. Agric. Food Chem. 2008, 56, 7637–7643. [Google Scholar] [CrossRef] [PubMed]
- Sobczyńska-Malefora, A.; Harrington, D. J. Laboratory assessment of folate (vitamin B9) status. J CLIN PATHOL 2018, 71, 949–956. [Google Scholar] [CrossRef] [PubMed]
- Vivó-Truyols, G.; Schoenmakers, P. J. Automatic selection of optimal Savitzky− Golay smoothing. Anal. Chem. 2006, 78, 4598–4608. [Google Scholar] [CrossRef] [PubMed]
- Tian, C.; Zheng, M.; Zuo, W.; Zhang, B.; Zhang, Y.; Zhang, D. Multi-stage image denoising with the wavelet transform. PATTERN RECOGN 2023, 134, 109050. [Google Scholar] [CrossRef]
- Sufriadi, E.; Idroes, R.; Meilina, H.; Munawar, A. A.; Lelifajri, *!!! REPLACE !!!*; Indrayanto, G. Partial Least Squares-Discriminant Analysis Classification for Patchouli Oil Adulteration Detection by Fourier Transform Infrared Spectroscopy in Combination with Chemometrics. ACS omega 2023, 8, 12348–12361. [Google Scholar] [CrossRef] [PubMed]
- Liu, Y.; He, C.; Jiang, X. Sample selection method using near-infrared spectral information entropy as similarity criterion for constructing and updating peach firmness and soluble solids content prediction models. J CHEMOMETR 2024, 38, e3528. [Google Scholar] [CrossRef]
- Que, H.; Zhao, X.; Sun, X.; Zhu, Q.; Huang, M. Identification of wheat kernel varieties based on hyperspectral imaging technology and grouped convolutional neural network with feature intervals. INFRARED PHYS TECHN 2023, 131, 104653. [Google Scholar] [CrossRef]
- Liu, Y.; Zhou, X.; Sun, J.; Li, B.; Ji, J. A method for non-destructive detection of moisture content in oilseed rape leaves using hyperspectral imaging technology. J NONDESTRUCT EVAL 2024, 43, 32. [Google Scholar] [CrossRef]
- Yao, K.; Sun, J.; Tang, N.; Xu, M.; Cao, Y.; Fu, L.; Zhou, X.; Wu, X. Nondestructive detection for Panax notoginseng powder grades based on hyperspectral imaging technology combined with CARS-PCA and MPA-LSSVM. J FOOD PROCESS ENG 2021, 44, e13718. [Google Scholar] [CrossRef]
- Cheng, J.; Sun, J.; Xu, M.; Zhou, X. Nondestructive detection of lipid oxidation in frozen pork using hyperspectral imaging technology. J FOOD COMPOS ANAL 2023, 123, 105497. [Google Scholar] [CrossRef]
- Zhao, J.; Chen, N.; Zhu, T.; Zhao, X.; Yuan, M.; Wang, Z.; Wang, G.; Li, Z.; Du, H. Simultaneous quantification and visualization of photosynthetic pigments in Lycopersicon esculentum mill. Under different levels of nitrogen application with visible-near infrared hyperspectral imaging technology. Plants 2023, 12, 2956. [Google Scholar] [CrossRef] [PubMed]
- Kim, M. J.; Lee, J. E.; Back, I.; Lim, K. J.; Mo, C. Estimation of total nitrogen content in topsoil based on machine and deep learning using hyperspectral imaging. Agriculture 2023, 13, 1975. [Google Scholar] [CrossRef]
- Zaukuu, J. L. Z.; Benes, E.; Bázár, G.; Kovács, Z.; Fodor, M. Agricultural potentials of molecular spectroscopy and advances for food authentication: An overview. PROCESSES 2022, 10, 214. [Google Scholar] [CrossRef]
- Guo, T.; Wu, Y.; Zhong, Y.; Li, D.; Xie, C.; Yang, R.; Jiang, D.; Zhou, Q.; Wang, P. Detecting γ‐aminobutyric acid and folates in wheat seedlings using hyperspectral imaging. J CEREAL SCI 2025, 121, 104083. [CrossRef]
- Yang, C.; Guo, Z.; Fernandes Barbin, D.; Dai, Z.; Watson, N.; Povey, M.; Zou, X. Hyperspectral Imaging and Deep Learning for Quality and Safety Inspection of Fruits and Vegetables: A Review. J. Agric. Food Chem. 2025, 73, 10019–10035. [Google Scholar] [CrossRef] [PubMed]
- Zhang, J.; Guo, Z.; Ma, C.; Jin, C.; Yang, L.; Zhang, D.; Yin, X.; Du, J.; Fu, P. Novel decision-level fusion strategies combined with hyperspectral imaging for the detection of soybean protein content. FOOD CHEM 2025, 469, 142552. [Google Scholar] [CrossRef] [PubMed]
Figure 1.
Technical route of this work.
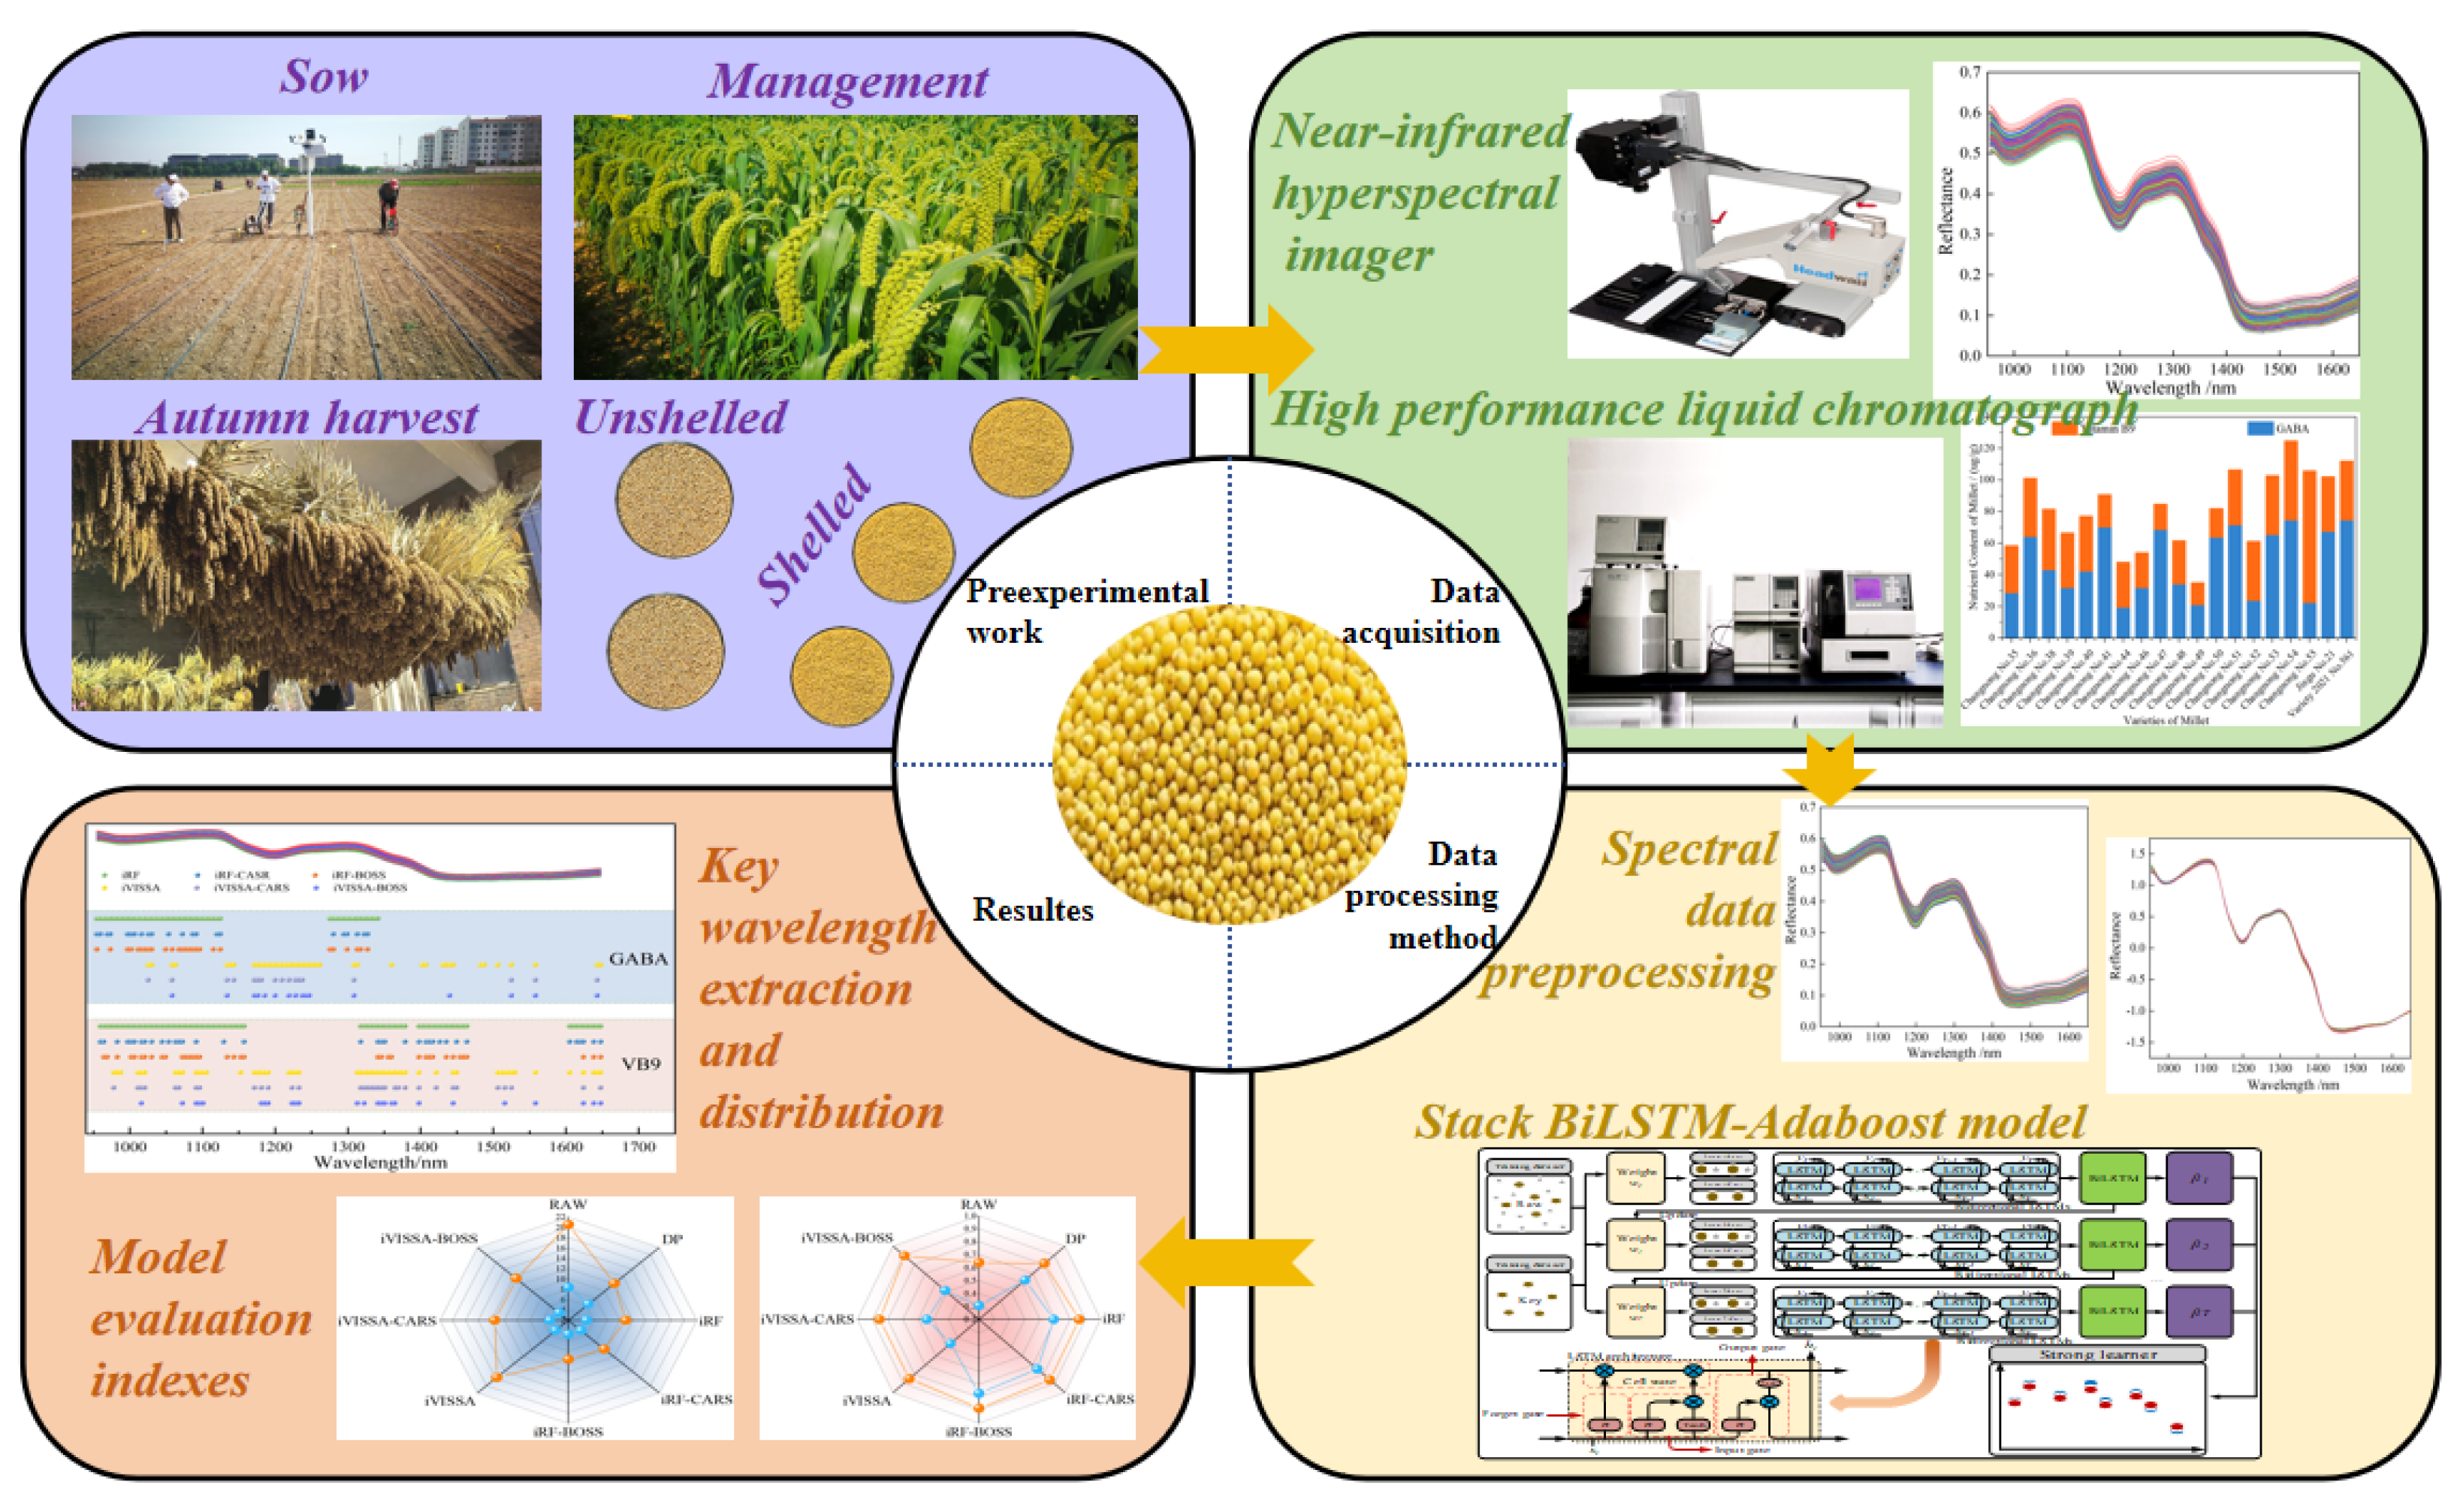
Figure 4.
foxtail millet spectral response curves. (A) Original spectra; (B) Spectra after S-G preprocessing; (C) Spectra after S-G and DWT preprocessing; (D) Spectra after S-G, DWT, and SNV preprocessing.
Figure 4.
foxtail millet spectral response curves. (A) Original spectra; (B) Spectra after S-G preprocessing; (C) Spectra after S-G and DWT preprocessing; (D) Spectra after S-G, DWT, and SNV preprocessing.
Disclaimer/Publisher’s Note: The statements, opinions and data contained in all publications are solely those of the individual author(s) and contributor(s) and not of MDPI and/or the editor(s). MDPI and/or the editor(s) disclaim responsibility for any injury to people or property resulting from any ideas, methods, instructions or products referred to in the content. |
© 2025 by the authors. Licensee MDPI, Basel, Switzerland. This article is an open access article distributed under the terms and conditions of the Creative Commons Attribution (CC BY) license (http://creativecommons.org/licenses/by/4.0/).
Copyright: This open access article is published under a Creative Commons CC BY 4.0 license, which permit the free download, distribution, and reuse, provided that the author and preprint are cited in any reuse.


