
Submitted:
09 July 2025
Posted:
11 July 2025
You are already at the latest version
Abstract
Background: Improving nutritional quality of widely consumed foods such as bread with natural additives is a rational approach for community nutrition and management of non-communicable diseases (e.g., diabetes, obesity). Pelemir (Cephalaria syriaca L.), an annual weed growing in wheat fields, improves the quality of bread when added to wheat flour and is expected to reduce the glycemic index due to its high protein, fiber and polyphenol contents. We aimed to investigate the effects of pelemir-added bread on glucose metabolism and appetite-regulating hormones. Materials and Methods: Study population consisted of three groups (healthy control, obesity, and diabetes; each n=20). The participants ingested two test meals (bread with and without pelemir) with one-week interval. Blood samples for glucose, insulin, C-peptide, GLP-1, leptin, ghrelin, and PYY were obtained at 0, 30, 60, 90, 120 minutes. The effect on appetite was evaluated subjectively by visual analog scales. Results: Area under curve (AUC)-Insulin and AUC-C-peptide were higher with pelemir-added bread in total group (p=0.044). In healthy group, AUC-GLP-1 was higher with pelemir-added bread (p=0.021). Additionally, pelemir-added bread resulted in an increased trend in AUC-C-peptide and AUC-PYY in healthy group; AUC-Insulin, AUC-C-peptide and AUC-Ghrelin in diabetes group; and a decreased trend in AUC-Leptin and AUC-PYY in obesity group. AUC for progressive food consumption was lower with pelemir bread in obesity group (p=0.006). Conclusion: The preliminary findings of this pilot study suggested that pelemir may possess beneficial effects on regulating glucose metabolism and hormonal responses. However, long-term, large-scale studies are needed to further clarify these effects.
Keywords:
pelemir
; Cephalaria syriaca
; bread
; diabetes
; obesity
; insulin resistance
1. Introduction
Non-communicable diseases (NCD) are considered the most important public health problems whose prevalence increased rapidly over the last 50 years. Obesity is a complex, multifactorial NCD, characterized with excessive fat accumulation in the body secondary to high energy intake and insufficient physical activity, and increases the risk of diabetes. Another NCD, diabetes is a chronic, broad-spectrum metabolic disorder that requires continuous medical care, in which the organism cannot adequately benefit from carbohydrates (CHO), fats and proteins due to insulin deficiency and/or defects in or resistance to insulin action.
Nutrition is the essential step in the treatment and management of obesity, diabetes, and accompanying diseases [1]. Consumption of low glycemic index (GI) and high fiber foods is one of the primary approaches in medical nutrition therapy to facilitate weight loss and glycemic control and ensure long-term satiety in patients with obesity as well as those with diabetes. Bread is an important source of CHO in nutrition and is widely consumed in Türkiye so that the annual bread consumption is much higher than the world average being mean 272.3 g/day according to the Turkey Nutrition and Health Survey-2017 data (328 g/day for men, 217 g/day for women) [2,3]. Although approximately 85% of bread consumed in Türkiye consists of white bread, the production of different types of bread and whole wheat flour products has been predominant in recent years [4]. Epidemiological studies have shown that consumption of whole wheat bread is inversely related to the incidence of type 2 diabetes mellitus (T2DM) and cardiovascular disease [5]. In contrast, some clinical studies have shown that whole wheat bread consumption improves glycemic control and has positive effects on postprandial glucose, insulin and incretin hormone responses [6,7]. Therefore, reducing the GI value of bread is worth in both prevention and management of obesity and diabetes.
Pelemir (Cephalaria syriaca L.) is an annual weed found in the family Dipsacaceae, which grows mostly in wheat fields [8]. This species is widely distributed especially in Anatolia as well as in other Mediterranean regions like southern France, southern Spain and in northern Africa. It is chilling resistant and can grow in infertile soils [9]. Different species of this genus contain plenty of triterpenes, flavonoids, glycosides and alkaloids, which are extensively used in traditional medicine as well as cosmetic and pharmaceutical industry [10,11,12]. Methanol and water extracts of Cephalaria tchihatchewii Boiss have various biological activities, including antioxidant activity and α-glycosidase, acetylcholinesterase, carbonic anhydrase -II enzyme inhibition effect [13]. The root water and leaf ethanol extracts of Cephalaria gigantea displayed the most potent inhibition of α-amylase and α-glucosidase. This suggested that these extracts have antioxidant and antidiabetic potentials [14]. Cephalaria syriaca is rich in vitamins and minerals, and contains protein (14-21%), dietary fiber (9-30%), and polyphenols which is responsible for its antioxidant properties [11,15]. Dietary polyphenols exhibit antidiabetic activities via lowering the GI of foods and increasing glucose entry into the cells [16]. Cephalaria syriaca is also considered an oilseed with high oil content (21-26%) [10]. The fatty acid composition of pelemir is 36.9% linoleic, 23.0% oleic, 19.5% myristic, 9.4% palmitic, 2% stearic, and 1.5% lauric acid [17,18,19]. Addition of pelemir products (whole or degreased flours) substantially changed the rheological properties of dough and improved the quality of bread. In Kayseri and Erzican regions of Türkiye, pelemir is specifically grown for its seeds, which are added to wheat to ameliorate its baking value and to delay staling [18,20]. Flour and oil obtained from pelemir seeds are mixed with wheat flour at low levels (0.5-3.0%) for delaying the staleness of the bread and making the dough rise better [15,21]. Considering the seed’s less exacting character, the Turkish Ministry of Agriculture made some field trials with pelemir to replace wheat in the arid and less productive areas of southeastern Türkiye [17,22,23,24,25].
The dietary fiber, fat, and protein contents in foods and their polyphenol constituents lower their GI. Therefore, Cephalaria syriaca added to bread flour is expected to reduce the GI of bread. In our country, bread made up pelemir-added flour is produced with the brand name “Akdeniz BreadTM”. The content of CHO in pelemir-added bread flour is same as the white bread without pelemir but the fat and protein contents of pelemir-added bread are higher.
Although there are few in vitro studies regarding the effects of several Cephalaria species on glucose metabolism in the literature, no clinical studies with published results have been found on glucose metabolism and gut hormones [26]. Therefore, this study is planned to investigate the effects of adding Cephalaria syriaca flour to wheat flour on glucose metabolism, gut hormones, and appetite in individuals with obesity and diabetes, and healthy volunteers.
2. Materials and Methods
This study was carried out between 05 April 2022 and 01 February 2023 at Istanbul University, Istanbul Faculty of Medicine, Dept. Internal Medicine, Div. Endocrinology and Metabolism. The study was approved by the Local Ethical Review Board (Istanbul Faculty of Medicine, Clinical Research Ethics Committee) (05.04.2022-834721). The study was conducted with good clinical practice in accordance with the Declaration of Helsinki latest criteria [27]. Written informed consent was obtained from all participants. This study was registered in the ’ClinicalTrials.gov’ (NCT05687812).
Participants were gathered in three groups categorized as healthy control, obesity, and diabetes (T2DM) groups. The sample size was calculated using G*Power software (version 3.1.9.7; Heinrich-Heine-Universität, Düsseldorf, Germany), with 0.05 type 1 error and 80% power. A total of 60 individuals over the age of 18 were included. The first group consisted of healthy individuals (n=20) with a normal body mass index (BMI: 18.5-24.9 kg/m2), with no known chronic disease (diabetes, hypertension, etc.), not smoking and not using alcohol, not on any regular medication (antihypertensive, antilipidemic, antidepressant, etc.) and not using food supplements. The second group included individuals with obesity (BMI ≥30 kg/m2) but no diabetes (n=20), and the third group consisted of individuals with a diagnosis of T2DM who were using only oral antidiabetic drugs (n=20). Individuals in healthy control and obesity groups underwent a 2-hour OGTT with 75 g glucose after 10-12 hours of fasting and confirmed to have normal glucose tolerance. Exclusion criteria were pregnancy, breastfeeding, presence of chronic diseases (chronic kidney disease, chronic obstructive pulmonary disease, malignancy etc.), regular use of food supplements, use of DPP-4 inhibitors for diabetes and glucagon-like peptide-1 (GLP-1) receptor analogues for the treatment of diabetes or obesity and engaging excessive physical activity.
All participants ingested two test meals with one-week interval, first bread produced by wheat flour (called “regular bread” throughout the article), then followed by a bread produced by pelemir-added wheat flour (called “pelemir bread” throughout the article). The breads used in this study were produced by “Istanbul Halk Ekmek Co.”. Pelemir used in the study was supplied by “Ziya Organik Tarım İşletmeleri A.Ş”. A serving of both types of bread contained 50 g CHO. The weight of the pelemir bread (added 0.3% pelemir) was 100 g and that of regular bread was 95 g. Other ingredients are shown in Table 1.
The body composition of the participants was measured with bioelectrical impedance analyzer (TANITA BC 420 MA) before the test. Height was measured using a stadiometer. BMI was calculated by weight in kilograms (kg) divided by the square of height in meters (m2). BMI is classified normal if 18.5-24.9 kg/m2, overweight if 25.0-29.9 kg/m2 and obesity if ≥30.0 kg/m2 according to the World Health Organization [28].
Participants were asked not to restrict CHO and not make any changes in their diet during the day before the tests. First, they were fed with regular bread containing 50 g CHO with 250 ml water for breakfast (following 10-12 hours of fasting). After one week, they were fed with pelemir bread (including 0.3% Cephalaria syriaca added flour) containing 50 g of CHO with 250 ml water. Participants were asked to consume the bread within 10 minutes. During the test, venous blood samples were taken at 0, 30, 60, 90, and 120 minutes from the time of bread ingestion via an indwelling cannula placed in the antecubital fossa for measurement of glucose, insulin, C-peptide, triglycerides (TG), glucagon-like peptide 1 (GLP-1), polypeptide YY (PYY), leptin, ghrelin, and interleukin-6 (IL-6). The samples were transferred to the laboratory and analyzed within half an hour. Abbott Architect CI 8200 Integrated System device was used for analyses of glucose (hexokinase/G-6-PDH method), TG (glycerol phosphate oxidase method), insulin (Chemiluminescent microparticle immunoassay method-CMIA) and C-peptide (CMIA). Peptide YY (E-EL-H1237, Elabscience, USA), ghrelin (E-EL-H1919, Elabscience, USA), IL-6 (E-EL-H0102, Elabscience, USA), leptin (E-EL-H6017, Elabscience, USA), and GLP-1 (E-EL-H6025, Elabscience, USA) were analyzed by ELISA. The homeostasis model of assessment insulin resistance (HOMA-IR) was calculated using the formula: ‘Fasting Glucose (mg/dl) × Fasting Insulin (μU/ml)] / 405’ [29]. The quantitative insulin sensitivity check index (QUICKI) was calculated using the formula: ‘QIUCKI = 1 / (log[Fasting Insulin (μU/ml)] + log[Fasting Glucose (mg/dl)]) [30]. Glycemic index (GI) is defined as the ratio of area under the curve (AUC) for 0-2 hour blood glucose after the ingestion of a given amount of test food (usually containing 50 g CHO) to the AUC for 0-2 hour blood glucose after the ingestion of a reference food (containing the same amount of white bread or glucose) [31]. The GI of pelemir is calculated using the formula ‘GI = AUC-Glucose-Pelemir / AUC-Glucose-Regular x 100’. If the GI value of the regular (white) bread taken as reference is accepted as 100, the reference ranges of foods with low, moderate and high GI are ≤55, 56-69 and ≥70, respectively [32]. Subjective appetite was assessed with visual analog scales (VAS) [33]. It is a measurement tool for subjective characteristics or attitudes that cannot be measured directly. VAS was used to measure satiety (S), hunger (H), fullness (F), and prospective food consumption (PFC) scores immediately before consumption of test meal and at 30, 60, 90 and 120 min later. The VAS was a 100-mm straight line, and the patients were asked to make a vertical mark across this line corresponding to their concurrent feelings from 0 (not at all) to 100 (very) measuring S, H, F, and PFC.
Statistical analysis: Statistical analysis was performed with SPSS software version 21. The normality of the variables was tested with visual (histogram) and analytical methods (Kolmogorov-Smirnov/Shapiro-Wilk test), and an analysis of the distribution was made. Comparisons of the parameters in groups composed of patients with diabetes and obesity, and healthy individuals after consuming pelemir bread and regular bread were determined by Wilcoxon signed-rank test. Kruskal-Wallis and Mann-Whitney U tests were used to compare the parameters between groups. Pearson and Spearman tests were used to test correlations between variables. A p value less than 0.05 was considered statistically significant. Additionally, a p value between 0.05 and 0.10 was considered as a potential trend. AUC for glucose, insulin, C-peptide, TG, GLP-1, PYY, leptin, ghrelin, and IL-6, during the meal tests were calculated with the trapezoidal method. End point changes from baseline were assessed using ANOVA.
3. Results
The general characteristics of the study group are presented in Table 2. The proportion of female participitants was numerically higher in all groups except the obesity group. The only significant difference was between healthy and obesity groups (p=0.001). The healthy group had significantly lower BMI than both diabetes and obesity groups. Weight, fat mass and fat-free mass were notably different between the groups, obesity group having the highest (p<0.001 for all).
The AUC of the biochemical parameters, HOMA-IR and QUICKI calculated for regular bread and pelemir bread meals of the whole group and subgroups are shown in Table 3.
Comparison of healthy control, obesity and diabetes groups: Glycemic index (GI): The GI of pelemir bread was similar in all groups (healthy: 99.2, obesity: 99.2, diabetes: 101.5).
AUC-Glucose: With both regular and pelemir breads, AUC-Glucose was lowest in healthy group and highest in diabetes group (p<0.001 for both).
AUC-Insulin: With both regular and pelemir breads, AUC-Insulin was lowest in healthy group and highest in diabetes group (regular bread: p=0.006, pelemir bread: p=0.008).
AUC-C-peptide: With regular bread, AUC-C-peptide was lowest in healthy group and highest in diabetes group (p<0.001). In contrast, with pelemir bread, AUC-C-peptide was numerically lowest in healthy group and highest in diabetes group.
AUC-TG: With both regular and pelemir breads, AUC-TG was lowest in healthy group and highest in diabetes group (p<0.001 for both).
AUC-Leptin: With regular bread, AUC-Leptin was lowest in healthy group and highest in obesity group (p=0.002). In contrast, with pelemir bread, AUC-Leptin was lowest in healthy group and highest in diabetes group (p=0.004).
AUC-PYY: With regular bread, AUC-PYY was numerically highest in healthy group and lowest in obesity group, while with pelemir bread, AUC-PYY was highest in healthy group and lowest in obesity group (p=0.018).
AUC-GLP-1: With both regular and pelemir breads, AUC-GLP-1 was highest in healthy group, and similar in-obesity and diabetes groups (regular bread: p=0.066, pelemir bread: p=0.002).
AUC-Ghrelin: With both regular and pelemir breads, AUC-Ghrelin was highest in healthy group, and similar in obesity and diabetes groups (regular bread: p<0.001, pelemir bread: p=0.001).
AUC-IL-6: With both regular and pelemir breads AUC-IL-6 was highest in healthy group, and similar in obesity and diabetes groups.
HOMA-IR calculated before regular and pelemir breads, was lowest in healthy group, and highest in diabetes group (regular bread: p<0.001, pelemir bread: p=0.001).
QUICKI calculated before regular and pelemir breads, was highest in healthy group, and similar in diabetes and obesity groups (regular bread: p=0.104, pelemir bread: p=0.030).
Comparison of the regular bread and pelemir bread in the groups: In the whole study population, AUC-Insulin and AUC-C-peptide were significantly higher with pelemir bread (p=0.044, p=0.004; Table 3, Figure 1a,b). No significant difference was obtained in AUC-glucose, AUC-TG, AUC-Leptin, AUC-PYY, AUC-GLP-1, AUC-Ghrelin, and AUC-IL-6. Likewise, there was no statistical difference of HOMA-IR and QUICKI between pelemir bread and regular bread. However, AUC-TG was numerically lower and AUC-Ghrelin higher with pelemir bread.
In healthy group, AUC-GLP-1 was significantly higher with pelemir bread (p=0.021; Table 3, Figure 1c). Furthermore, AUC-C-peptide, AUC-PYY, and AUC-IL-6 exhibited upward trends with pelemir bread (p=0.07, p=0.073, p=0.097). The other AUCs did not differ between the two breads (Table 3).
In obesity group, AUC-Leptin and AUC-PYY revealed downward trends with pelemir bread (p=0.073, p=0.067). The other AUCs showed no significant difference between the two breads (Table 3).
In diabetes group, AUC-Insulin, AUC-C-peptide, and AUC-Ghrelin with pelemir bread displayed increased trends (p=0.053, p=0.064, p=0.091). The other AUCs did not differ between the two tests (Table 3).
Correlation analysis: The detected correlations were generally weak or moderate, except for those between AUC-Insulin and AUC-C-peptide. Overall, the correlations found with pelemir bread were more remarkable than with regular bread (Table 4).

Table 4a.
Correlation analysis of biochemical parameters in total study population with regular bread.
Table 4a.
Correlation analysis of biochemical parameters in total study population with regular bread.
| a. Regular bread test | AUC-Insulin | AUC-C-peptide | AUC-Leptin | AUC-PYY | AUC-GLP-1 | AUC-Ghrelin | HOMA-IR | QUICKI |
|---|---|---|---|---|---|---|---|---|
| AUC-Insulin | 1 | p<0.001 r=0.786 |
p<0.001 r=0.477 |
p<0.001 r=0.552 |
p<0.001 r=-0.470 | |||
| AUC-C-peptide | 1 | p=0.013 r= -0.322 |
p=0.045 r= -0.262 |
p=0.001 r=0.421 |
p=0.001 r= -0.420 |
|||
| AUC-Leptin | 1 | p=0.022 r= -0.299 | p=0.003 r= -0.374 |
p=0.001 r=0.435 |
p=0.001 r= -0.428 |
|||
| AUC-PYY | 1 | |||||||
| AUC-GLP-1 | 1 | p<0.001 r=0.470 | ||||||
| AUC-Ghrelin | 1 | p<0.001 r= -0.473 |
p<0.001 r=0.476 |
|||||
| HOMA-IR | 1 | |||||||
| QUICKI | 1 |
Table 4b.
Correlation analysis of biochemical parameters in total study population with pelemir bread.
Table 4b.
Correlation analysis of biochemical parameters in total study population with pelemir bread.
| b. Pelemir bread test | AUC-Insulin | AUC-C-peptide | AUC-Leptin | AUC-PYY | AUC-GLP-1 | AUC-Ghrelin | HOMA-IR | QUICKI |
|---|---|---|---|---|---|---|---|---|
| AUC-Insulin | 1 | p<0.001 r=0.830 | p<0.001 r=0.548 | p=0.003 r= -0.387 | p=0.041 r= -0.271 | p<0.001 r= -0.512 |
||
| AUC-C-peptide | 1 | p=0.017 r= -0.316 | p=0.001 r=0.446 |
p=0.002 r= -0.401 |
||||
| AUC-Leptin | 1 | p=0.006 r= -0.355 | p=0.002 r= -0.397 |
p<0.001 r=0.530 |
p<0.001 r= -0.493 |
|||
| AUC-PYY | 1 | p=0.002 r=0.399 | ||||||
| AUC-GLP-1 | 1 | p<0.001 r=0.456 | p=0.027 r= -0.293 |
|||||
| AUC-Ghrelin | 1 | p=0.016 r= -0.318 |
p=0.047 r=0.265 |
|||||
| HOMA-IR | 1 | |||||||
| QUICKI | 1 |
AUC, area under the curve; PYY, peptide YY; GLP-1, glucagon like peptide 1; QUICKI, quantitative insulin sensitivity check index; HOMA-IR, homeostatic model assessment insulin resistance.
Considering the total study population, with regular bread, AUC-Insulin was positively correlated with AUC-C-peptide, AUC-Leptin, HOMA-IR; but inversely correlated with QUICKI. Both AUC-C-peptide and AUC-Leptin-were positively correlated with HOMA-IR, but negatively correlated with AUC-GLP-1, AUC-Ghrelin and QUICKI. There was a positive correlation between AUC-GLP-1 and AUC-Ghrelin. In addition, AUC-Ghrelin was positively correlated with QUICKI but inversely correlated with HOMA-IR (Table 4a).
Contrariwise, with pelemir bread, AUC-Insulin positively correlated with AUC-C-peptide and AUC-Leptin, but inversely correlated with AUC-GLP-1, AUC-Ghrelin and QUICKI. AUC-C-peptide negatively correlated with AUC-GLP-1 and QUICKI, but positively correlated with HOMA-IR. AUC-Leptin was inversely correlated with AUC-GLP-1, AUC-Ghrelin and QUICKI, but positively correlated with HOMA-IR. There was a positive correlation between AUC-PYY and AUC-GLP-1. AUC-GLP-1 was positively correlated with AUC-Ghrelin but inversely correlated with HOMA-IR. Moreover, AUC-Ghrelin was negatively correlated with HOMA-IR and positively correlated with QUICKI (Table 4b).
Evaluation of the VAS scores: The AUC-VAS scores of the entire group and individual groups with regular and pelemir bread were evaluated in four categories:
Satiety: In the total and in the individual groups, AUC-satiety with pelemir bread was not different from regular bread (Figure 2a).
Hunger: In the total, healthy and diabetes groups, AUC-hunger with pelemir bread was not different from regular bread. In obesity group, AUC-hunger with pelemir bread was significantly higher than regular bread (p=0.044) (Figure 2b).
Fullness: In the total and obesity groups, AUC-fullness with pelemir bread was meaningfully lower than regular bread (total: p=0.026, obesity: p=0.037). In diabetes group, there was also a tendency for a decrease in AUC-fullness with pelemir bread (p=0.094). In healthy group, there was no difference in AUC-fullness between the two bread tests (Figure 2c).
Prospective food consumption (PFC): In the total and obesity groups, AUC-PFC with pelemir bread was considerably lower than regular bread (total: p=0.005, obesity: p=0.006). In diabetes group, there was also a slight tendency for a decrease in AUC-PFC with pelemir bread (p=0.098). In healthy group, there was no significant difference in AUC-PFC between the two breads (Figure 2d).
4. Discussion
Nutrition plays a key role in the prevention and treatment of NCDs such as obesity and diabetes. Dietary modifications are more likely to be successful when they are compatible with the sociocultural and eating habits of societies. In Turkish society, carbohydrated foods with high-GI such as bread and baked goods play a crucial role in daily diet. Increasing the dietary fiber, protein, fat and polyphenol content of foods decreases their GI. Therefore, adding natural additives to foods consumed intensively has become a preferred method. Cephalaria syriaca L. (pelemir), which grows as a weed in wheat fields, is a plant rich in dietary fiber, protein, fat and polyphenols. It has been used as a natural additive to flour to improve the quality of dough in baking industry [11,15,34]. It is also used in traditional medicine due to anti-oxidant, prebiotic, anti-inflammatory, anti-diabetic, and immunomodulatory effects, and these effects have been evidenced in in vitro studies [11,13]. This study was planned to investigate the effects of pelemir-added bread on glucose and lipid metabolism, appetite-regulating hormones and inflammation in healthy subjects and patients with obesity or diabetes.
The addition of Cephalaria syriaca to wheat flour is expected to reduce the GI value of bread. A study conducted in 2020 showed that the GI of bread decreased by 17% with addition of 5% Cephalaria syriaca flour [26]. However in our study, the AUC-Glucose of pelemir bread was close to regular bread in healthy control, obesity, and diabetes groups. This might be due to the very low proportion of pelemir (0.3%) we used. In addition, the breads we used as reference and test contained comparable number of supplements such as protein (whey powder) and antioxidants (vinegar and ascorbic acid) which may have prevented the GI of pelemir bread from being sufficiently different from regular bread.
When the whole study population was evaluated, the ingestion of pelemir bread resulted in notably higher AUC-Insulin and AUC-C-peptide than regular bread. These results indicate that pelemir may stimulate the pancreas to secrete more insulin than the regular bread, which is an important effect for postprandial glucose control. The fact that AUC-Insulin with pelemir bread in diabetes group, and AUC-C-peptide in healthy and diabetes groups displayed higher trends than regular bread supports this idea. Meanwhile, the difference for AUC-Insulin and AUC-C-peptide that did not reach statistical significance may be due to the relatively small size of the groups.
In healthy control group, AUC-GLP-1 with pelemir bread was 2.1 times higher than regular bread (p=0.021), whereas in obesity and diabetes groups, AUC-GLP-1 with pelemir bread was not different from regular bread. This finding together with the increase in AUC-Insulin and AUC-C-peptide can be interpreted as the stimulatory effect of pelemir to release GLP-1 in healthy individuals. However, pelemir was not able to induce GLP-1 increase in diabetes and obesity groups as it is known that GLP-1 response to CHO ingestion is blunted in both conditions. Our findings are consistent with the results of our previous study where postprandial blood glucose and insulin responses were prominent, while GLP-1 response was blunted after ingestion of 50 g white bread in overweight and obese subjects with normal glucose tolerance [4]. GLP-1 is an incretin hormone, known to have ameliorating effects on glucose metabolism via stimulating insulin secretion by the pancreatic β-cells. [35] GLP-1 is also recognized to increase satiety by effects on central nervous system and slowing down the intestinal motility. Due to these effects, GLP-1 receptor analogues are widely used in the treatment of T2DM and obesity over the last two decades. These drugs have favorable effects on the secondary prevention of cardiovascular diseases and mortality. The AUC-GLP-1 response to pelemir bread findings in our healthy group is compatible to the in vitro studies which reported strong inhibitory effects of Cephalaria syriaca on α-amylase and α-glycosidase [11,13,14]. Inhibitors of these enzymes are known to increase GLP-1 and reduce postprandial glucose levels. Therefore, increase of GLP-1 secretion would be considered as favorable effects of Pelemir on CHO-rich nutrients like bread.
GLP-1 and PYY are released from the L cells of the small intestine and colon. PYY is an anorexigenic hormone, acts to reduce appetite and food intake postprandially. Considering that GLP-1 is a glucose-dependent insulinotropic hormone and also reduces food intake, these two hormones are expected to act synergistically [36]. Our findings in obesity group, that pelemir bread tended to result in a lower AUC-PYY compared to regular bread (p=0.067), together with the positive correlation between AUC-GLP-1 and AUC-PYY during consumption of pelemir bread but not regular bread in the whole group verify the pathophysiology of these gut hormones. The findings with pelemir bread are notable because increase of these hormones is expected to decrease energy intake. Moreover, the inverse correlation between AUC-GLP-1 and AUC-HOMA-IR during ingestion of pelemir bread but not with regular bread, suggests that pelemir may be beneficial to decrease insulin resistance through secretion of GLP-1.
Leptin, mainly secreted by the adipose tissue is a hormone that normally increases the feeling of satiety. In our study AUC-Leptin was much higher in obesity and diabetes groups than in healthy control group, which may be related to leptin resistance. The fact that pelemir bread resulted in a lower AUC-Leptin compared to regular bread may also be considered a potential favorable effect of pelemir on leptin resistance [36,37,38,39].
Another gut hormone contributing to regulation of appetite is ghrelin, increases the feeling of hunger. Ghrelin is an orexigenic hormone primarily produced by enteroendocrine cells of the gastrointestinal tract, especially the stomach. In addition to being a "hunger hormone”, ghrelin has much broader functions in regulating glucose and energy homeostasis through inhibition of insulin secretion, regulating hepatic glucose output, increasing adipogenesis, decreasing lipolysis and thermogenesis [40]. In diabetes group, pelemir bread resulted in approximately 40% higher AUC-Ghrelin than regular bread (p=0.091). The negative correlation between AUC-Leptin and AUC-Ghrelin during ingestion of both regular and pelemir breads in the entire population suggests that these two hormones are counteracting at least in case of high-CHO food exposure.
Due to the limited number of cases in individual groups, we did not find it appropriate to discuss the correlation results separately. However, it is noteworthy that in the entire population, AUC-GLP-1 was inversely correlated with AUC-insulin, AUC-C-peptide, and AUC-Leptin, but positively correlated with AUC-PYY with pelemir bread. Contrarily, negative correlations were observed between AUC-GLP-1 and AUC-C-peptide and AUC-Leptin, but not with AUC-insulin with regular bread test. Our findings support that pelemir bread may possess stronger metabolic effects compared to regular bread.
The postprandial state is assumed to be highly proinflammatory and prooxidative. In our study, AUC-IL-6 in healthy group increased with both breads, more robustly with pelemir bread. Our findings are consistent with the literature showing that IL-6 levels nearly doubled following both high-CHO and high-fat meals [41].
Although the self-rated VAS by the participants we used in our study is a subjective assessment and need to be carefully interpreted, the increase in satiety and decrease in hunger and fullness feelings during pelemir bread in healthy group are notable findings supporting the dynamics of gut hormones. Furthermore, the significant decrease in AUC-PFC with pelemir bread in obesity group and similarly, a lower trend for AUC-PFC in diabetes group can be considered another beneficial effect of pelemir addition to wheat flour. This suggests that consumption of pelemir bread may decrease subsequent eating or snacking desires.
The most important limitations of our study are that it was based on a single test and far from physiological conditions of real life since the breakfast used in the study included only regular or pelemir breads and water. Moreover, the test duration was limited to two hours, and the sample size in the groups was small. Another limitation is the low amount of pelemir (0.3%) in the flour that could not induce stronger hormonal responses. Cephalaria syriaca is very bitter as it contains non-toxic sugar esters (glycosides), therefore, it is not possible adding to wheat flour in higher proportions [15]. Lastly, protein and antioxidant contents of both breads might have contributed to a relatively weak response to pelemir bread in glucose metabolism. One of the strengths of our study is that we examined both glucose and lipid parameters and gut hormones related to appetite. Also, simultaneously evaluated hunger and satiety during consumption of two breads. Another strength of the study is that the experiments were conducted in three groups: healthy, obese and diabetic subjects. The present study is important as it is the first to examine the effects of pelemir (Cephalaria syriaca L.) on carbohydrate and lipid metabolism, gastrointestinal and appetite-regulating hormones.
In summary, single meal composed of wheat bread with 0.3% added pelemir, did not substantially shift circulating gut-derived hormones or indices of glucose metabolism, suggesting that longer-term exposures would be important in the evaluation of effects of Cephalaria syriaca on metabolic conditions. However, some of the potential preliminary effects we found in this study (e.g., the relationship between GLP-1 and PYY induced by pelemir bread, possible changes in insulin resistance and insulin sensitivity) suggest that this topic is worth further investigation.
5. Conclusions
The preliminary results of this single-center pilot study suggest possible positive effects of pelemir (Cephalaria syriaca L.) supplementation to high-CHO foods on glucose metabolism and dynamics of gut hormones, but long-term, large-scale, multicenter studies are needed. If these beneficial effects are confirmed, in addition to improving the quality of bread and other bakery products, the routine use of pelemir as food additive could be a useful nutritional approach for both healthy individuals and people with obesity and diabetes, which are increasing rapidly.
Author Contributions
Conceptualization, Hakan Yilmazturk and Ilhan Satman; Data curation, Özlem Soyluk Selçukbiricik, Fulya Calikoglu, Kubilay Karsidag and Ilhan Satman; Formal analysis, Gulay Dura and Gokmen Sir; Investigation, Özlem Soyluk Selçukbiricik, Fulya Calikoglu, Cemile Idiz and Isik Kulaksiz; Methodology, Özlem Soyluk Selçukbiricik, Fulya Calikoglu, Cemile Idiz, Onder Eryigit, Ayse Kubat Uzum and Kubilay Karsidag; Supervision, Özlem Soyluk Selçukbiricik, Fulya Calikoglu and Ayse Kubat Uzum; Visualization, Cemile Idiz; Writing – original draft, Özlem Soyluk Selçukbiricik; Writing – review & editing, Özlem Soyluk Selçukbiricik and Ilhan Satman.
Funding
This study was funded by “İstanbul Halk Ekmek Co.” an organization of Istanbul Metropolitan Municipality and was conducted at Istanbul University.
Institutional Review Board Statement
The study was conducted according to the guidelines of the Declaration of Helsinki, and approved by the Institutional Ethics Committee) of Istanbul Medical Faculty (05.04.2022-834721).
Informed Consent Statement
Informed consent was obtained from all subjects involved in the study.
Data Availability Statement
The data presented in this study are available on request from the corresponding author.
Acknowledgments
The authors would like to thank all study participants and laboratory staff of “Ahenk” laboratory and “Şehzadebaşı” medical center who performed the tests, as well as “Ziya Organik Tarım İşletmeleri Co.”, who complimentary provided kits for intestinal hormones and other tests.
Conflicts of Interest
The authors declare no conflict of interest.
References
- American Diabetes Association Professional Practice Committee. 2. Diagnosis and classification of diabetes: Standards of Care in Diabetes—2024. Diabetes Care 2024;47(Suppl. 1): S20–S42; [CrossRef]
- Akgun S, Pekcan G, Aksoydan E, et al. Türkiye Beslenme ve Saglik Arastirmasi 2017 (TBSA 2017). T.C. Saglik Bakanligi Halk Sagligi Genel Mudurlugu, Yayin No. 1132, Ankara: 2019. ISBN: 978–975–590–722–2.
- Karaoğlu, MM. Organik ekmek. The Journal of Food 2007;32 (4):195-203.
- Kayalı M, Duman SÖ, Tütüncü Y, et al. Farklı ekmek çeşitlerinin karbonhidrat intoleransı olmayan kilolu ve obez gönüllülerde etkisi. Türk Diyab Obez / Turk J Diab Obes 2019;3(1):1-13. [CrossRef]
- Newby PK, Maras J, Bakun P, et al. Intake of whole grains, refined grains, and cereal fiber measured with 7-d diet records and associations with risk factors for chronic disease. Am J Clin Nutr 2007;86(6):1745-1753. 1. [CrossRef]
- Pereira MA, Jacobs DR Jr, Pins JJ, et al. Effect of whole grains on insulin sensivity in overweight hyperinsulinemich adults. Am J Clin Nutr 2002;75(5):848-855. [CrossRef]
- Jensen KM, Koh-Banerjee P, Franz M, et al. Whole grains, bran, and germ in relation to homocysteine and markers of glycemic control, lipids, and inflammation. Am J Clin Nutr 2006;83(2):275-283. [CrossRef]
- Rahimi A, Moghaddam SS, Ghiyasi M, et al. The ınfluence of chemical, organic and biological fertilizers on agrobiological and antioxidant properties of Syrian cephalaria (Cephalaria syriaca L.). Agriculture 2019;9(122);1-13. [CrossRef]
- Göktürk RS, Sümbül H. A taxonomic revision of the genus Cephalaria (Caprifoliaceae) in Turkey. Turk J Bot 2014;38:927–968. [CrossRef]
- Kırmızıgül S, Sarıkahya NB, Sümbül H, et al. Fatty acid profile and biological data of four endemic Cephalaria species grown in Turkey. Rec Nat Prod 2012;6(2):151–155.
- Chrzaszcz M, Krzeminska B, Celinski R, et al. Phenolic composition and antioxidant activity of plants belonging to the Cephalaria (Caprifoliaceae) genus. Plants 2021;10(5):952. [CrossRef]
- Sarikahya NB, Onay Ucar EO, Kayce P, et al. Fatty acid composition and antioxidant potential of ten Cephalaria species. Rec Nat Prod 2015;9(1):116-123.
- Güven, L. Cephalaria tchihatchewii Boiss. ekstrelerinin antioksidan aktivitesi, metabolik enzimler üzerine etkisi ve UPLC-MS/MS analizi ile kimyasal karakterizasyonun belirlenmesi (Determination of Cephalaria tchihatchewii Boiss.’s extracts antioxidant activity, effect on metabolic enzymes, and chemical characterization by UPLC-MS/MS Analysis). Iğdır Üniv Fen Bil Enst Derg (J Inst Sci Technol) 2023;13(4): 2655-2672. [CrossRef]
- Mbhele N, Balogun FO, Kazeem MI, et al. In vitro studies on the antimicrobial, antioxidant and antidiabetic potential of Cephalaria gigantea. Bangladesh J Pharmacology 2015;0(1):214-221. [CrossRef]
- Karaoğlu M. Effect of Cephalaria syriaca addition on rheological properties of composite flour. International Agrophysics, 2012; 26:387-393, *!!! REPLACE !!!*. [CrossRef]
- de Paulo Farias D, de Araújo FF, Neri-Numa IA, et al. Antidiabetic potential of dietary polyphenols: a mechanistic review. Food Res Int 2021;145:110383. [CrossRef]
- Yazıcıoğlu T, Karaali A, Gökçen J. Cephalaria syriaca seed oil. J Am Oil Chemists’ Society 1978;55(4):412-415. [CrossRef]
- Uslu EŞ. Uslu EŞ. Zayıf unların ekmeklik kalitelerinin pelemir (Cephalaria syriaca) ekstraktı ilavesiyle geliştirilmesi / Improvement of bread quality of weak flour with pelemir (Cephalaria syriaca) extract. (Y. Lisans Tezi; YÖK Tez no: 432053), 2016.
- Subaşı I, Arslan Y, Aydın O, et al. Pelemir (Cephalaria syriaca L.) bitkisinin bazı bitkisel özelliklerinin ve tohum yağı kompozisyonlarının belirlenmesi (Determination of some plant traits and seed oil compositions of Cephalaria syriaca L). Uluslararası Tarım ve Yaban Hayatı Bilimleri Dergisi (Int J Agriculture Wildlife Sci) 2021;7(1):90-95. [CrossRef]
- Yazıcıoğlu T, Karaali A, Gökçen J. Pelemir Tohumu Yağı ve Küspesi Üzerinde Bir Araştırma. T.B.T.A.K. Marmara B.A.E., Beslenme ve Gıda Teknik Ünitesi, Proje Rap. No: 2807, 1977.
- Bekiroğlu H, Akman PK, Topçu Ö, et al. Effect of ethanolic extract of Cephalaria syriaca on dough rheological properties from different wheat flour blends: A comparative study with ascorbic acid. European Food Science and Engineering 2023;4(1):26-32. [CrossRef]
- Sezgin M, Tezcan H, Şahin M, et al. Bazı pelemir (Cephalaria syriaca L.) çeşitlerinin Türkiye’nin farklı ekolojik koşullarında verim ve kalite değerlerinin belirlenmesi (Determination of yield and quality values of some type Cephalaria syriaca L cultivated in different ecological conditions in Turkey). KSU Doğa Bilimleri Dergisi (KSU J. Nat. Sci) 2017;20(Özel Sayı):192-195. 1. [CrossRef]
- Başar S, Karaoğlu MM. The effects of Cephalaria syriaca flour on physical, rheological and textural properties of sunn pest (Eurygaster integriceps) damaged wheat dough and bread. J Cereal Sci 2021;99: 103215. [CrossRef]
- Boz H, Karaoğlu MM. Improving the quality of whole wheat bread by using various plant origin materials. Czech J Food Science 2013;31(5):457-466. [CrossRef]
- Altıniğne N, Saygın E. Pelemir katımlı undan yapılan ekmeklerde bayatlama süresi. Gıda 1985;10(5):323-332.
- Yaman, M. Pelemirli Ekmeğin In-vivo Glisemik İndeksinin Belirlenmesi-Çalışma Ön Sonuç Raporu. İstanbul Sabahattin Zaim Üniversitesi, Sağlık Bilimleri Fakültesi, Beslenme ve Diyetetik Bölümü; 2020.
- World Medical Association. Declaration of Helsinki: Ethical principles for medical research ınvolving human subjects. JAMA 2013;310(20):2191–2194. [CrossRef]
- WHO Expert Consultation. Appropriate body-mass index for Asian populations and its ımplications for policy and intervention strategies. Lancet 2004;363(9403):157-163. [CrossRef]
- Matthews DR, Hosker JP, Rudenski AS, et al. Homeostasis model assessment: insulin resistance and beta-cell function from fasting plasma glucose and insulin concentrations in man. Diabetologia 1985;28(7):412–419. [CrossRef]
- Katz A, Nambi SS, Mather K, et al. Quantitative insulin sensitivity check index: a simple, accurate method for assessing insulin sensitivity in humans. J Clin Endocrinol Metab 2000;85(7):2402–2410. [CrossRef]
- Frost, G. Glucose - glucose tolerance and the glycemic (glycaemic) ındex. In “Caballero B (Chief Editor). Encyclopedia of Human Nutrition, Second Edition. Academic Press, 2003, pp. 2916-2922. ISBN: 978-0-12-227055-0”.
- Foster-Powell K, Holt SH, Brand-Miller JC. International table of glycemic index and glycemic load values: 2002. Am J Clin Nutr 2002;76(1):5–56. [CrossRef]
- Flint A, Raben A, Blundell JE, et al. Reproducibility, power and validity of visual analogue scales in assessment of appetite sensations in single test meal studies. Internat J Obes Related Metab Disord 2000;24(1):38-48. [CrossRef]
- Kavak C, Baştürk A. Antioxidant activity, volatile compounds and fatty acid compositions of Cephalaria syriaca seeds obtained from different regions in Turkey. Grasas y Aceites 2020;71(4):379. [CrossRef]
- Holst JJ. The physiology of glucagon-like peptide 1. Physiol Rev 2007;87(4):1409–1439. [CrossRef]
- Behary P, Tharakan G, Alexiadou K, et al. Combined GLP-1, oxyntomodulin, and peptide YY improves body weight and glycemia in obesity and prediabetes/type 2 diabetes: a randomized, single-blinded, placebo-controlled study. Diabetes Care 2019;42(8):1446–1453. [CrossRef]
- Batterham RL, Cohen MA, Ellis SM, et al. Inhibition of food intake in obese subjects by peptide YY3-36. N Engl J Med 2003;349(10):941–948. [CrossRef]
- Batterham RL, Cowley MA, Small CJ, et al. Gut hormone PYY(3-36) physiologically inhibits food intake. Nature 2002;418(6898):650–654. [CrossRef]
- Calikoglu F, Barbaros U, Uzum AK, et al. The metabolic effects of pre-probiotic supplementation after roux-en-y gastric bypass (RYGB) surgery: a prospective, randomized controlled study. Obes Surg 2021;31(1):215–22. [CrossRef]
- Pradhan G, Samson SL, Sun Y. Ghrelin: much more than a hunger hormone. Curr Opin Clin Nutr Metab Care. 2013;16(6):619-624. [CrossRef]
- Emerson SR, Kurti SP, Harms CA, et al. Magnitude and timing of the postprandial inflammatory response to a high-fat meal in healthy adults: a systematic review. Adv Nutr 2017;8(2):213-225.
Figure 1.
The AUC for postprandial hormonal responses to regular and pelemir bread meals in the study groups. a. AUC-Insulin, b. AUC-C-peptide, c. AUC-GLP-1 (based on ‘mean±SD’).
Figure 1.
The AUC for postprandial hormonal responses to regular and pelemir bread meals in the study groups. a. AUC-Insulin, b. AUC-C-peptide, c. AUC-GLP-1 (based on ‘mean±SD’).
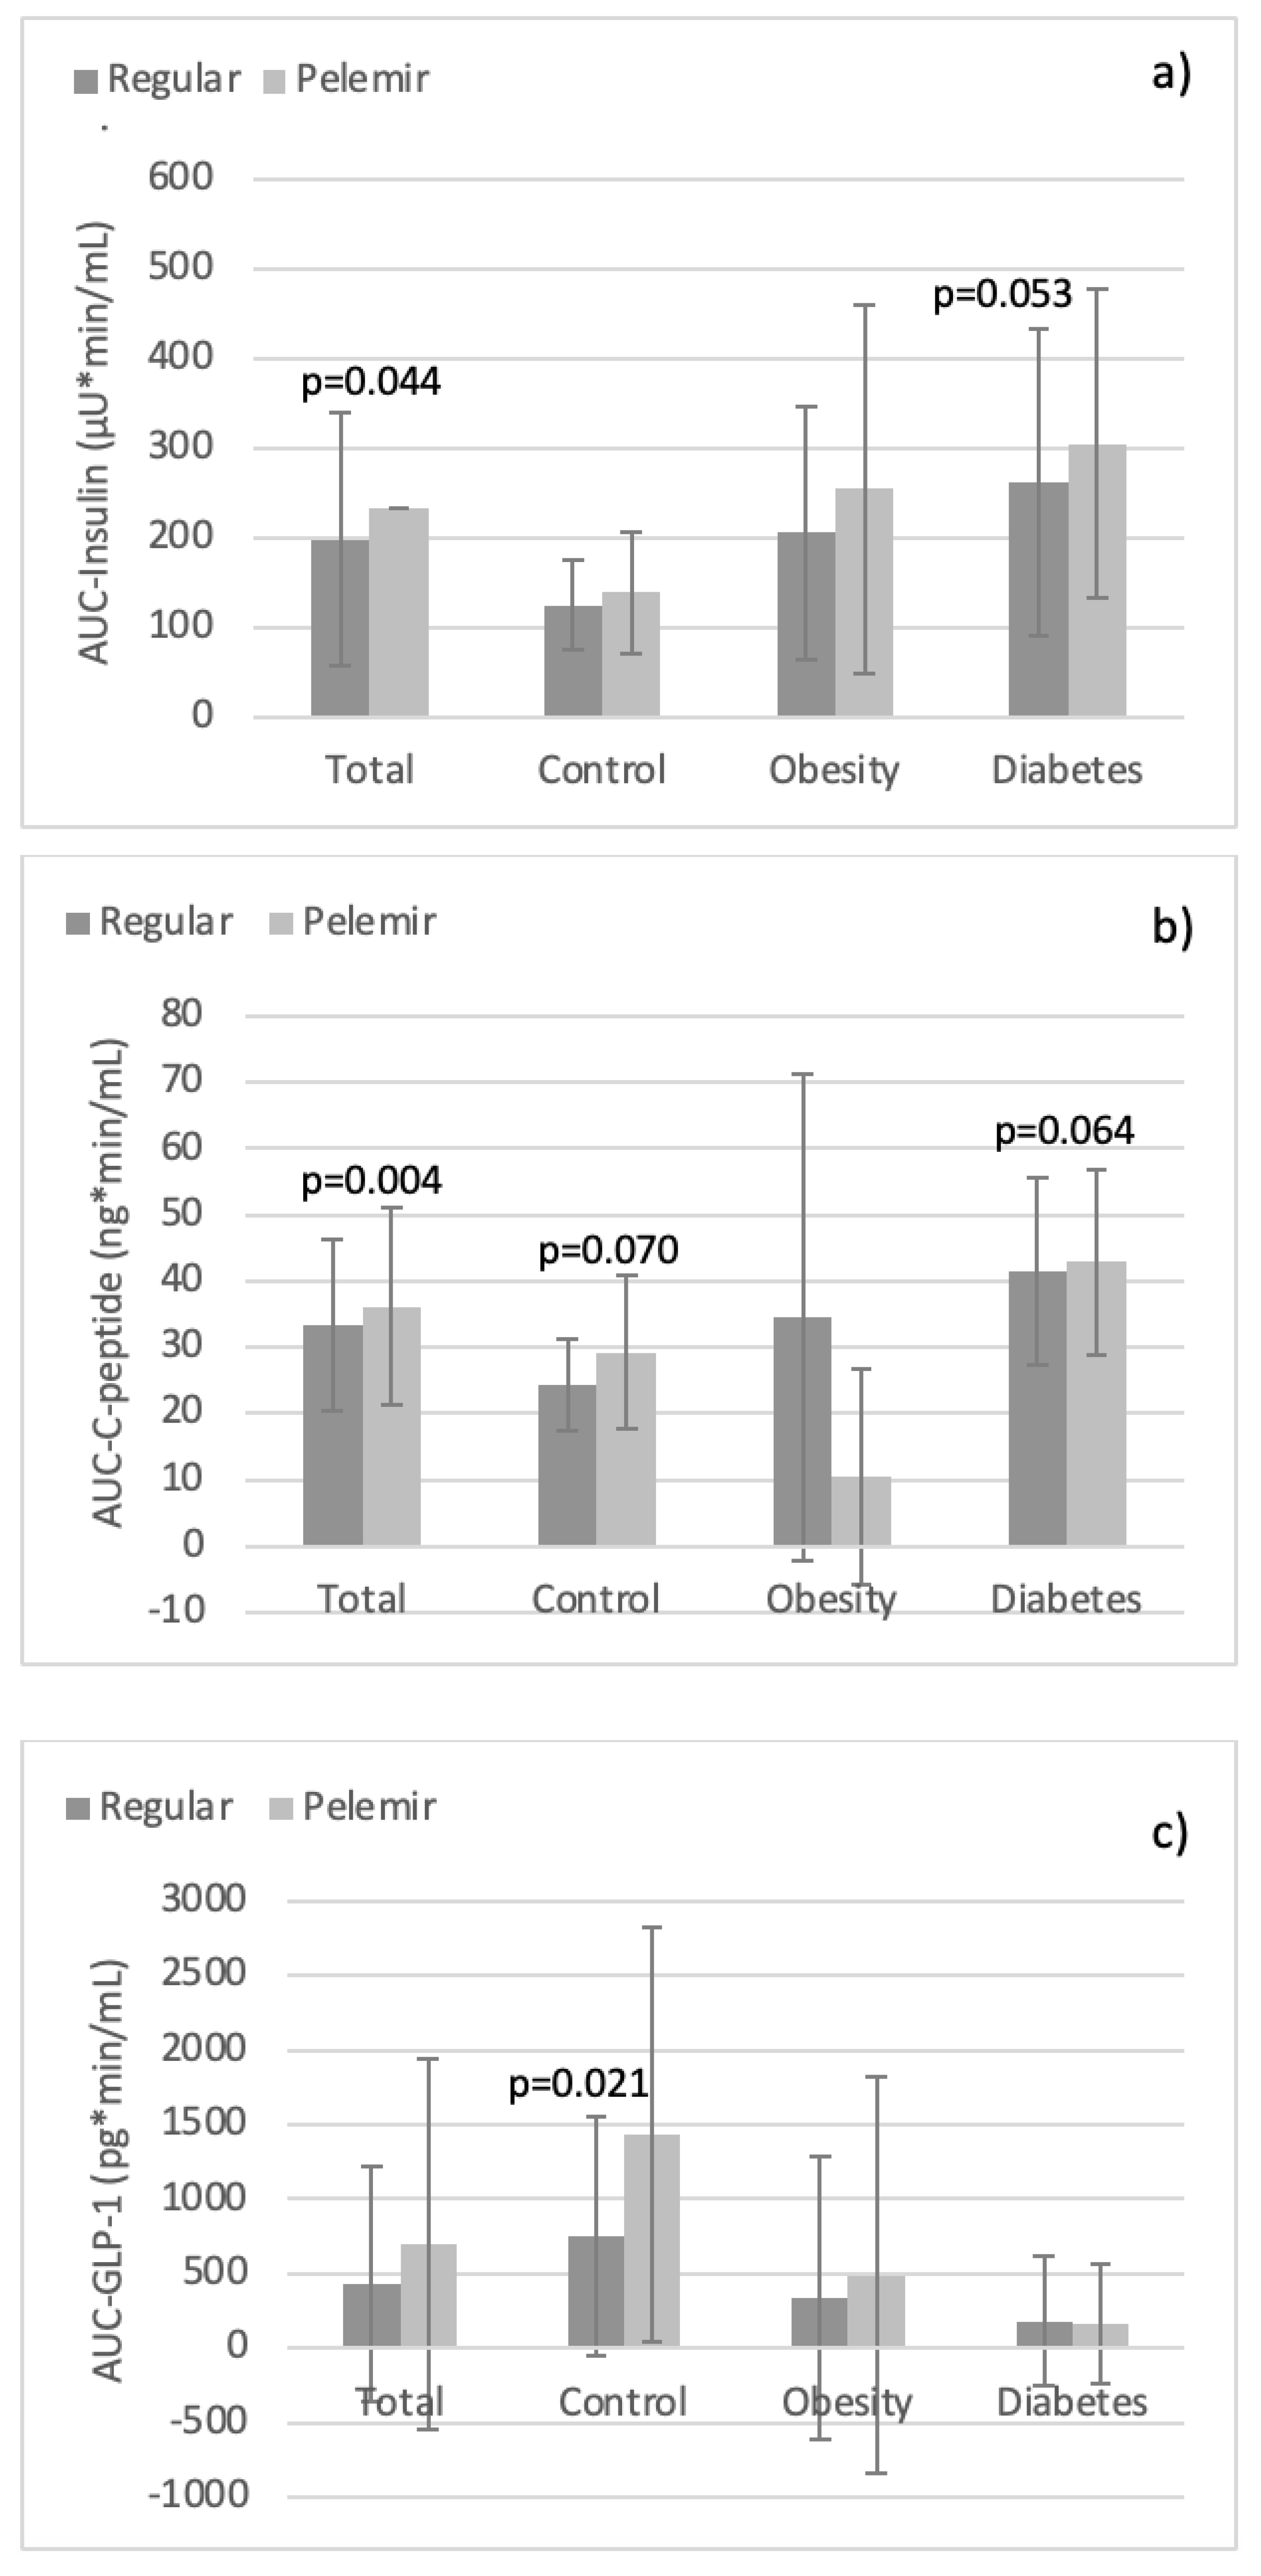
Figure 2.
The AUC for VAS scores during regular and pelemir bread meals in the study groups. a. Satiety, b. Hunger, c. Fullness, d. Prospective food consumption (PFC).
Figure 2.
The AUC for VAS scores during regular and pelemir bread meals in the study groups. a. Satiety, b. Hunger, c. Fullness, d. Prospective food consumption (PFC).
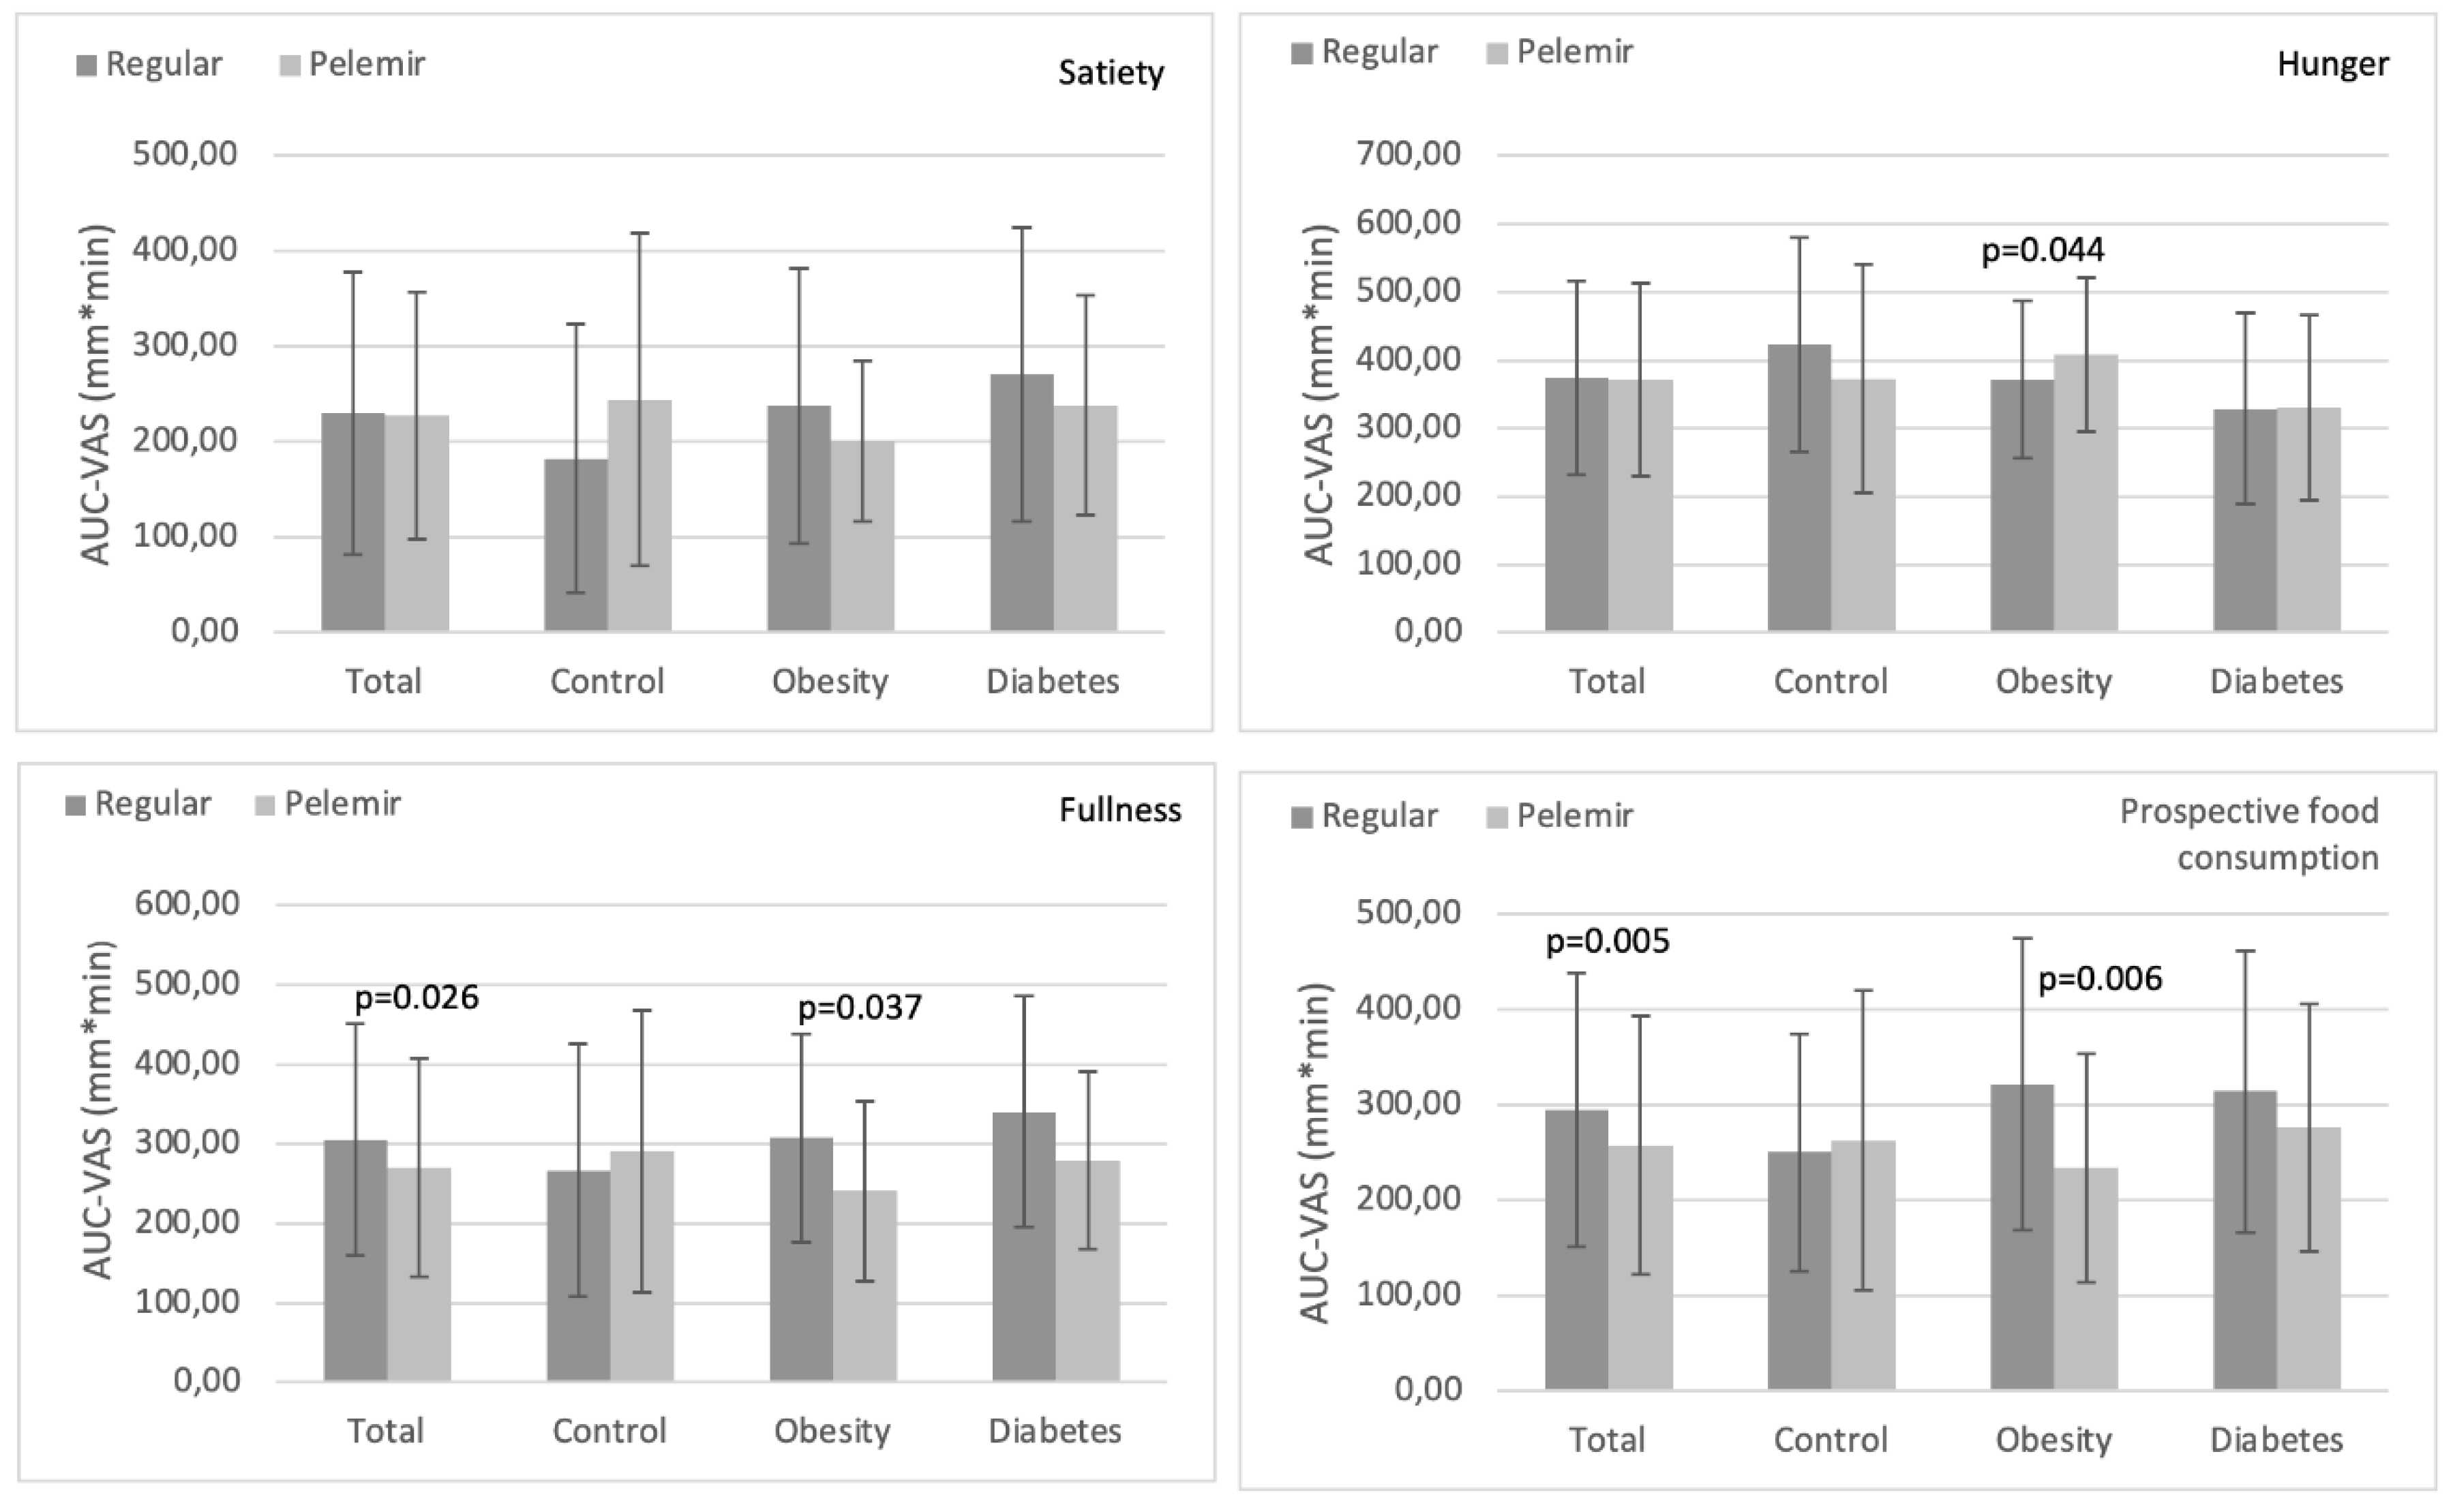
Table 1.
Ingredients of the test breads.
| Ingredient | Regular bread | Pelemir bread |
|---|---|---|
| Wheat flour (g) | 95 | 100 |
| CHO (g) | 50 | 50 |
| Energy (kcal) | 291.5 | 285.4 |
| Dietary fiber (%) | 3.40 | 3.12 |
| Fat (%) | 2.25 | 2.64 |
| Saturated FA (%) | 0.52 | 0.80 |
| Protein (%) | 9.20 | 10.10 |
| Pelemir flour (%) | 0 | 0.3 |
| NaCl (%) | 0.71 | 0.70 |
CHO, carbohydrate; FA, fatty acid; NaCl, sodium chlorine.
Table 2.
General characteristics of the study groups.
| Total participants (n=60) |
Healthy control group (n=20) |
Obesity group (n=20) |
Diabetes group (n=20) |
p (intra-groups) |
|
|---|---|---|---|---|---|
| Women/Men (n) | 38/22 | 18/2 | 7/13 | 13/7 | 0.001 |
| Age (year) | 43.40±10.01 | 38.10±7.58 | 39.45±6.53 | 52.65±8.66 | <0.001 |
| BMI (kg/m2) | 29.67±7.71 | 22.45±2.13 | 35.09±4.57 | 31.47±8.38 | <0.001 |
| Weight (kg) | 80.36±20.38 | 61.62±6.19 | 99.41±15.10 | 80.05±16.49 | <0.001 |
| Height (cm) | 165.51±7.80 | 165.80±6.50 | 168.10±8.18 | 162.65±8.01 | 0.084 |
| Fat mass (%) | 31.17±7.77 | 26.41±6.27 | 34.33±7.81 | 32.78±7.06 | 0.002 |
| Fat mass (kg) | 25.60±10.49 | 16.46±4.99 | 34.06±9.47 | 26.29±7.97 | <0.001 |
| FFM (kg) | 54.70±13.25 | 45.16±4.51 | 65.19±12.88 | 53.76±12.12 | <0.001 |
BMI, body mass index; FFM, fat free mass.
Table 3.
Comparison of the biochemical parameters after consuming regular bread and pelemir bread in the study groups. Data are given as ‘median (range)’.
Table 3.
Comparison of the biochemical parameters after consuming regular bread and pelemir bread in the study groups. Data are given as ‘median (range)’.
| Median (range) |
Total (n=60) |
Healthy control group (n=20) |
Obesity group (n=20) |
Diabetes group (n=20) |
p (inter-groups) |
|||||||||
|---|---|---|---|---|---|---|---|---|---|---|---|---|---|---|
| Regular bread | Pelemir bread | p | Regular bread | Pelemir bread | p | Regular bread | Pelemir bread | p | Regular bread | Pelemir bread | p | Regular bread | Pelemir bread | |
|
AUC-Glucose (mg*min/dL) |
684.75 (585.68-585.68) |
670,25 (568.75-924.00) |
0.483 | 579.63 (493.19- 617.50) |
574.75 (528.75- 628.13) |
0.823 | 659.50 (591.63-727.25) |
659,13 (514.69- 755.81) |
0.126 | 1109.88 (818.69-1281.00) |
1127.00 (821.50- 1348.75) |
0.717 | <0.001 | <0.001 |
|
AUC-Insulin (µU*min/mL) |
163.66 (105.80-225.04) |
183.70 (109.06-318.03) |
0.044 | 124.79 (89.53-155.57) |
132.55 (84.88- 168.00) |
0.615 | 167.88 (109.85- 299.76) |
192.24 (129.64- 327.25) |
0.313 | 219.25 (132.89- 366.21) |
277.70 (199.95- 403.35) |
0.053 | 0.006 | 0.008 |
|
AUC-C-peptide (ng*min/mL) |
31.82 (24.38-40.80) |
34.82 (24.69-46.32) |
0.004 | 25.31 (17.64-30.11) |
28.26 (22.78- 36.39) |
0.070 | 33.99 (27.13- 42.57) |
33.48 (26.77-46.28) |
0.351 | 37.89 (31.14-54.80) |
39.16 (34.76-60.95) |
0.064 | <0.001 | 0.374 |
|
AUC-TG (mg*min/dL) |
632.63 (423.56- 1132.25) |
567.25 (412.31- 1195.81) |
0.917 | 412.50 (318.75- 509.88) |
407.25 (331.25- 493.25) |
0.936 | 747.63 (497.44-1367.44) |
591.00 (470.38- 1475.00) |
0.823 | 1079.88 (647.00- 1372.75) |
921.75 (694.75- 1601.50) |
0.809 | <0.001 | <0.001 |
|
AUC-Leptin (pg*min/mL) |
7010.13 (2493.63- 16342.13) |
5968.75 (2633.00- 16020.00) |
0.464 | 2265.63 (1673.19- 7038.31) |
2507.00 (1644.75-6432.69) |
0.601 | 12155.63 (3507.25- 24742.38) |
7940.63 (4045.81- 15807.69) |
0.073 |
8818.50 (5056.88- 21236.19) |
8887.50 (3720.00- 22728.50) |
0.748 | 0.002 | 0.004 |
|
AUC-PYY (pg*min/mL) |
406.9 (265.73- 598.28) |
347.5 (212.67- 537.37) | 0.895 | 429.33 (257.05-686.79) | 450.02 (319.65-842.84) |
0.073 | 362.45 (196.69- 571.27) |
311.44 (169.04- 439.34) |
0.067 | 402.38 (292.79- 657.53) |
339.05 (180.83- 583.48) |
0.546 | 0.181 | 0.018 |
|
AUC-GLP-1 (pg*min/mL) |
74.38 (66.08- 431.81) |
77.00 (62.60- 1204.65) |
0.192 | 641.46 (69.09-1257.53) |
1355.06 (204.26- 1745.84) |
0.021 | 72.28 (65.20-89.42) |
70.11 (59.87-93.13) |
0.940 | 73.01 (66.12- 80.57) |
71.75 (60.89-79.08) |
0.243 | 0.066 | 0.002 |
|
AUC-Ghrelin (ng*min/mL) |
5.18 (2.59-11.07) |
5.90 (3.55-16.48) |
0.129 | 13.98 (5.56-22.44) |
14.51 (5.97-25.95) |
0.737 | 3.51 (2.02-5.64) |
4.08 (2.04-8.53) |
0.370 | 3.67 (2.35-6.92) |
5.25 (3.55-10.21) |
0.091 | <0.001 | 0.001 |
|
AUC-IL-6 (pg*min/mL) |
14.96 (9.04-41.56) |
19.82 (9.09-64.69) |
0.476 | 20.57 (7.11-89.83) |
52.77 (24.09-142.35) |
0.097 | 13.95 (10.57-33.81) |
13.96 (9.56-36.57) |
0.654 | 11.93 (8.36-31.43) |
11.67 (5.10-24.60) |
0.147 | 0.262 | 0.961 |
| HOMA-IR | 1.56 (0.96-2.87) |
1.66 (0.97-2.46) |
0.596 | 1.06 (0.68-1.30) |
1.06 (0.81-1.26) |
0.778 | 1.79 (1.16-3.19) |
2.15 (0.97-2.47) |
0.575 | 2.77 (1.45-3.75) |
2.19 (1.69-3.67) |
0.872 | <0.001 | 0.001 |
| OUICKI |
0.36 (0.33-0.38) |
0.36 (0.33-0.39) |
0.795 |
0.38 (0.37-0.41) |
0.38 (0.37-0.40) |
0.494 |
0.35 (0.32-0.37) |
0.34 (0.33-0.40) |
0.391 |
0.33 (0.31-0.36) |
0.34 (0.31-0.35) |
0.872 | 0.104 | 0.030 |
AUC, area under the curve; TG, triglyceride; PYY, polypeptide Y; GLP-1, glucagon like peptide-1; IL-6, interleukin-6; HOMA-IR, homeostasis model of assessment insulin resistance; OUICKI, quantitative insulin sensitivity check index.
Disclaimer/Publisher’s Note: The statements, opinions and data contained in all publications are solely those of the individual author(s) and contributor(s) and not of MDPI and/or the editor(s). MDPI and/or the editor(s) disclaim responsibility for any injury to people or property resulting from any ideas, methods, instructions or products referred to in the content. |
© 2025 by the authors. Licensee MDPI, Basel, Switzerland. This article is an open access article distributed under the terms and conditions of the Creative Commons Attribution (CC BY) license (http://creativecommons.org/licenses/by/4.0/).
Copyright: This open access article is published under a Creative Commons CC BY 4.0 license, which permit the free download, distribution, and reuse, provided that the author and preprint are cited in any reuse.


