Submitted:
10 July 2025
Posted:
11 July 2025
You are already at the latest version
Abstract
Local genetic correlation analysis has recently emerged as a way to assess patterns of genetic overlap between phenotypes at a regional level. In a recent report in Nature Genetics, Li et al. present a novel method (HDL-L) that implements such analysis, and use simulations to compare it to an existing method, LAVA. The results suggest statistical shortcomings in LAVA and superior performance for HDL-L. We revisit these conclusions and demonstrate that the simulations in Li et al. exhibit several major flaws that undermine the interpretation of their results. When correcting these issues, we find no support for the conclusions drawn by Li et al., and contrary to their findings show LAVA to have performance generally superior to that of HDL-L.
Keywords:
genetics
; statistical genetics
; GWAS
; local genetic correlation
There are two major issues with the simulations conducted by Li et al. First of these is the use of a simulation model that matches the model used by HDL-L, but not that used by LAVA, which consequently cannot be used to evaluate type 1 error rates for LAVA. Although the statistical models implemented by LAVA and HDL-L are similar, they estimate and test different forms of local genetic correlation. For a continuous phenotype , both use a standard linear model of the form with genetic component , with genotype matrix and vector of true SNP effects . However, LAVA defines genetic correlation as the correlation between the genetic components of different phenotypes, using a fixed effects model that treats as a fixed but unknown parameter vector. By contrast, HDL-L defines genetic correlation as the correlation of the true SNP effects , using a random effects model that assigns a multivariate normal distribution to .
The fixed effects model used by LAVA thus estimates the realized genetic correlation in a population, and tests the null hypothesis that this is exactly zero. Yet in the simulations conducted by Li et al., genetic effects were all generated using a random effects model. Under this model the realized genetic correlations are not fixed, instead being distributed around their expected value, which equals the correlation parameter of the random effects model. As such, even if the expected genetic correlation is zero, the realized genetic correlations are not. The simulations by Li et al. therefore inherently cannot evaluate type 1 error rates for LAVA, and the values they present as type 1 error rates instead reflect statistical power for LAVA to detect those non-zero realized genetic correlations.
The second major issue in the Li et al. simulations is the use of different reference data for each method. Reference data is required by both methods to account for linkage disequilibrium (LD) between SNPs. In their simulations, Li et al. use UK Biobank [5,6] genotype data (N = 167,636) both as the basis for their simulations and as reference data for the HDL-L analyses. However, for the LAVA analyses they instead used the much smaller 1,000 Genomes [7] (N = 503) as reference, even though they could have used UK Biobank here as well. This introduces an additional source of error not present when evaluating HDL-L, making it impossible distinguish effects due to the methods themselves from those due to the reference data used. This is not mentioned in the paper, with differences in simulation results all attributed to differences between the two methods.
To evaluate the impact of these issues, we partially repeated the simulations in Li et al., correcting the issues with the simulation design (see also Supplemental Methods – Simulation Procedure). We used UK Biobank genotype data for chromosome 22, with the same sample size (N = 167,636), genomic blocks, SNP selection, and 10% of SNPs within each block selected as causal. Genetic effects were generated under both fixed effects and random effects models, setting whole-genome heritability for the two phenotypes to 20% and 80%, to match Figure 1 in Li et al. Causal signal was either distributed homogeneously across all genomic blocks (100%), or concentrated in 10% or 4% of blocks, adding the latter two conditions because under the original 100% condition the local heritability within each genomic block was very low (Supplemental Figure 1).
Analyses for both methods were performed for the following reference data: the UK Biobank sample used as basis for the simulations, a range of smaller UK Biobank samples (N = 503 to 100,000) not overlapping with the simulation sample, the European panel of the 1,000 Genomes data (N = 503), and the reference data now available for each method, both based on UK Biobank (Supplemental Methods – Data and Software).
Evaluating both methods under their own respective null models, and with the UK Biobank sample used as basis for the simulations as LD reference, our results show that type 1 error rates are well-controlled for both methods (Figure 1). As expected, we also observe elevated significance rates for LAVA under the random effects simulation model with expected genetic correlation of zero. This reflects the statistical power for LAVA to detect the non-zero realized genetic correlations generated under the random effects model, which varied considerably, with the 95% quantile interval ranging from -0.41 to 0.42 (see also Supplemental Table 1).
Comparing statistical power and efficiency between methods (Figure 1, Supplemental Figures 2-5), we found that in the ‘100% causal regions’ setting used by Li et al. performance for HDL-L was better than for LAVA, generally consistent with their own results. However, statistical power to detect genetic correlations in this condition was very low for either method, with little chance of significant results after applying any multiple testing correction (Supplemental Figures 2, 3). In the two higher power conditions, which are likely to be more representative of results of interest in a real data analysis, LAVA consistently outperformed HDL-L, and was not far behind HDL-L even as an estimator of the expected genetic correlation (Supplemental Figures 4, 5).
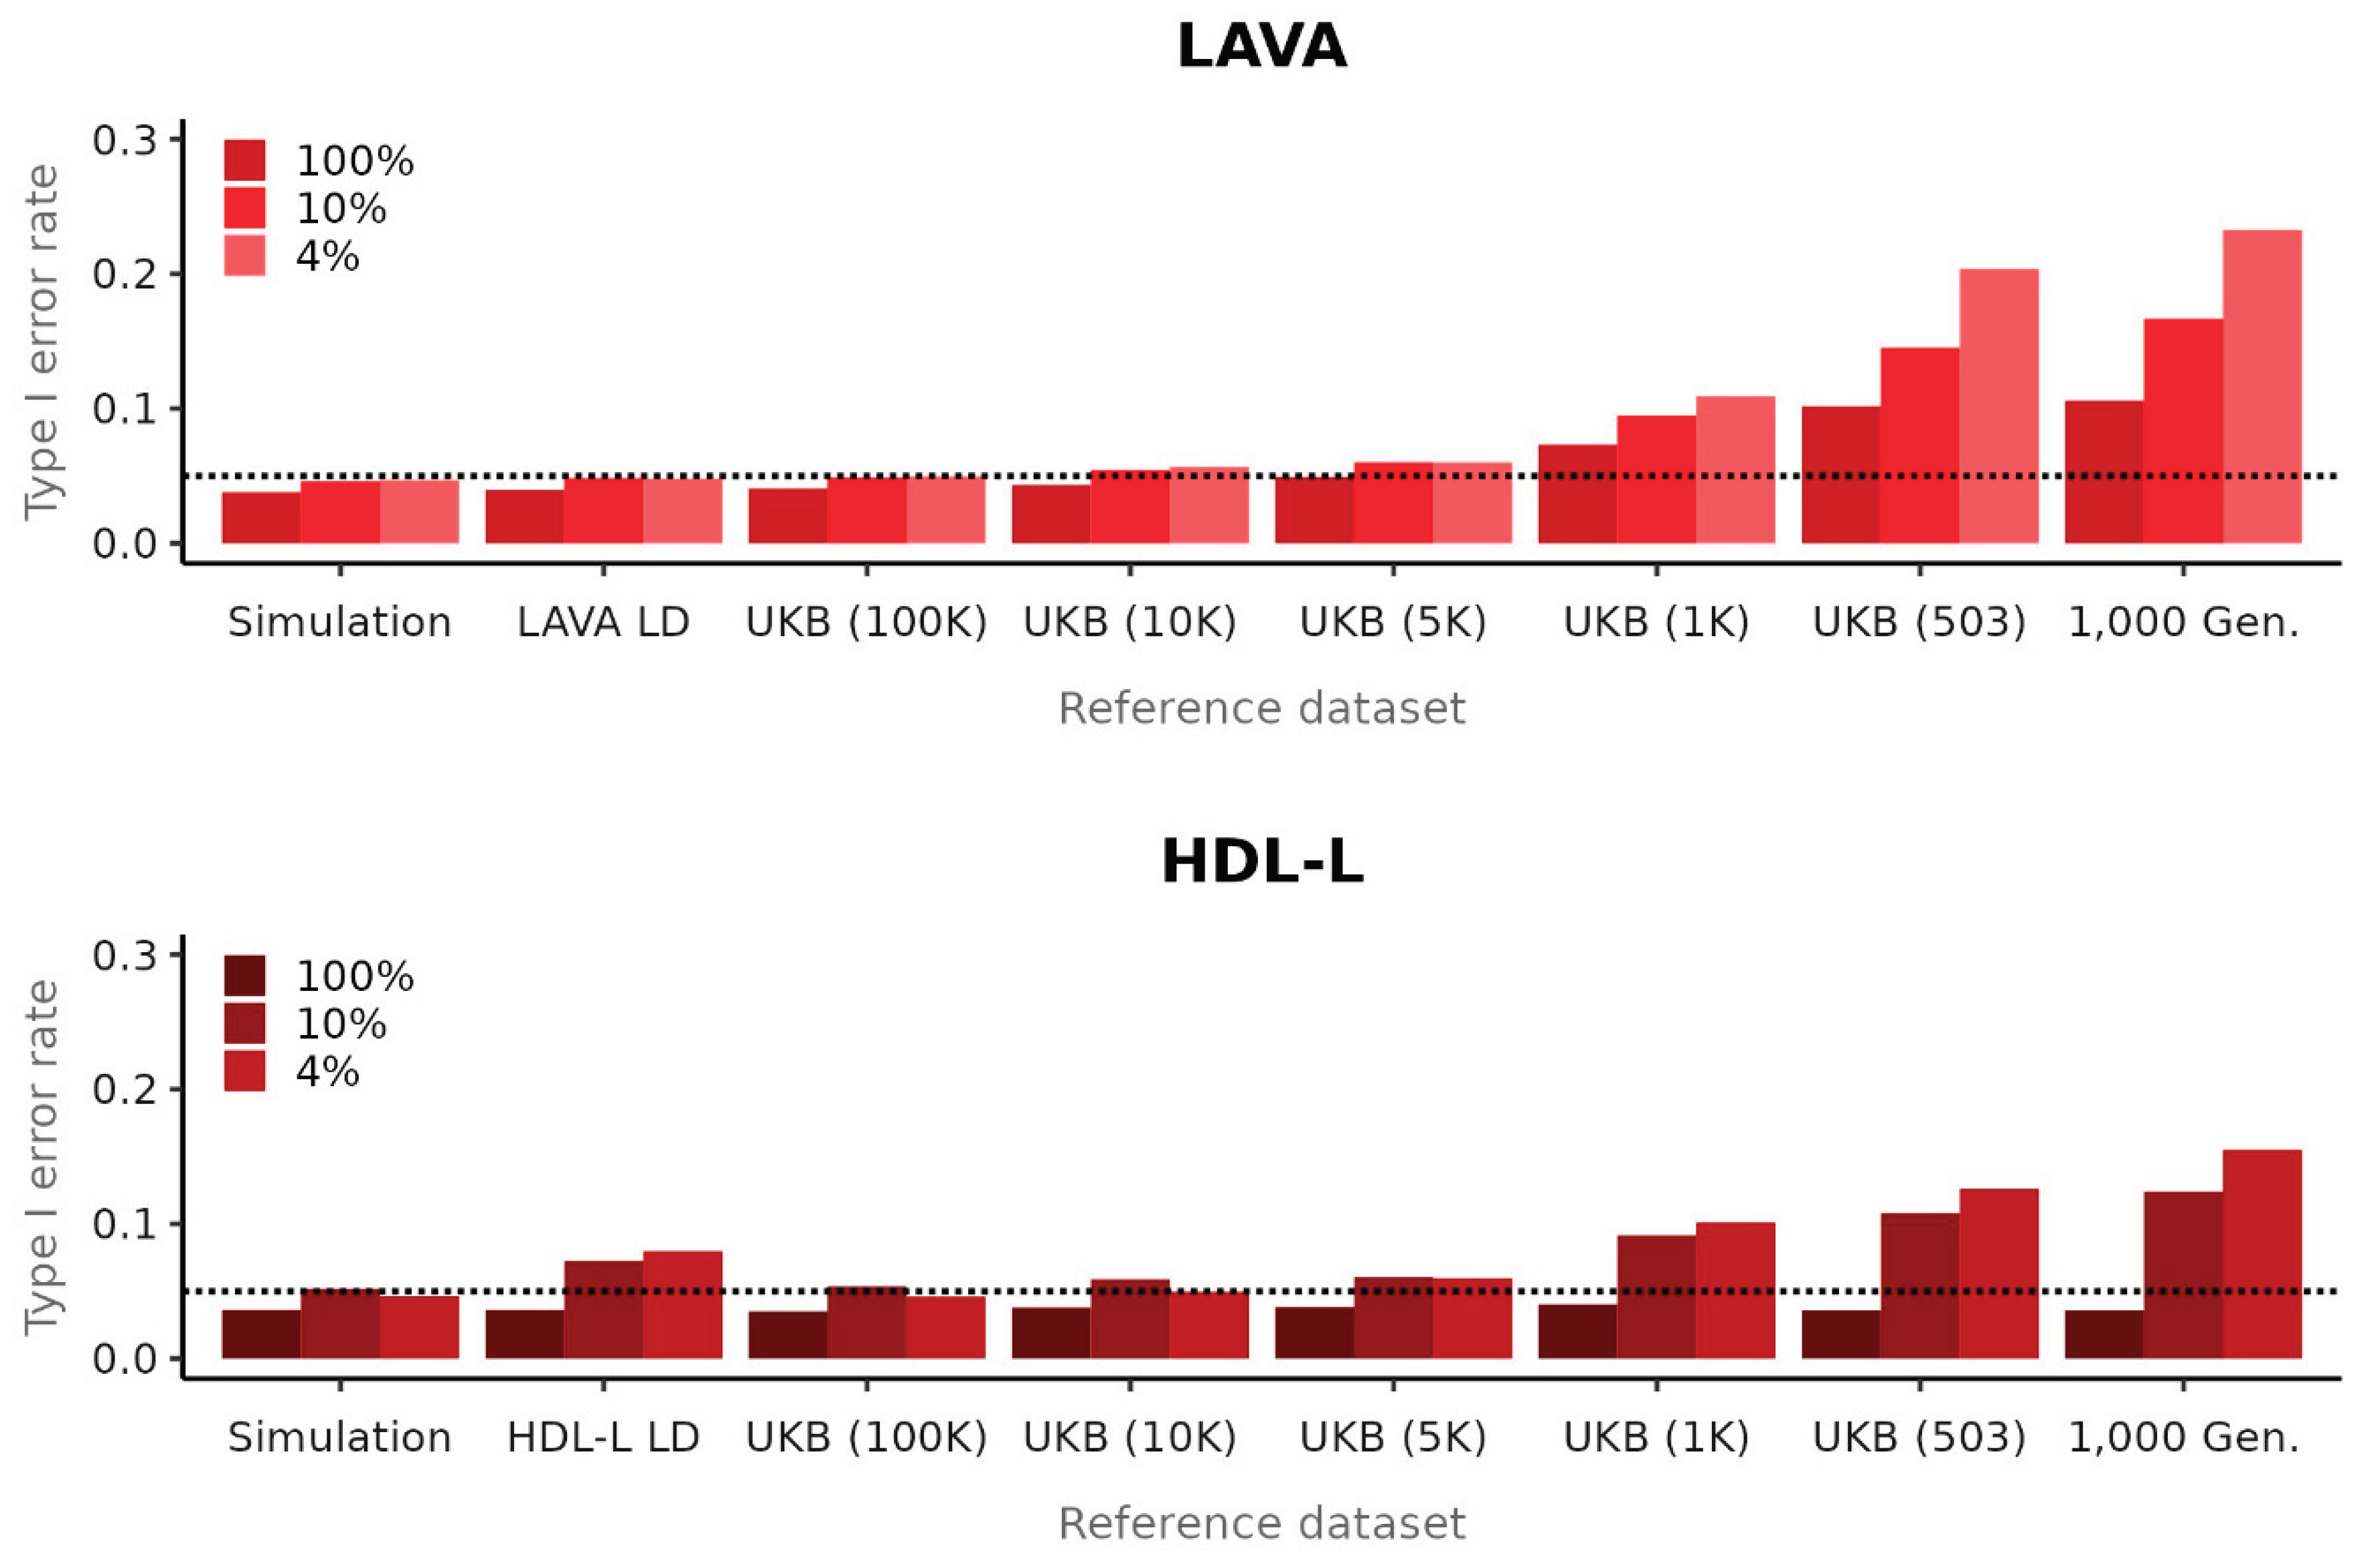
Consistent with results from Li et al., using 1,000 Genomes as reference data resulted in an upward bias in local heritability estimates (Supplemental Figures 6, 7) as well as inflated type 1 error rates for the genetic correlation for LAVA (Figure 2). However, although Li et al. attribute this to a problem with LAVA, our results show that these issues are not method-specific, as HDL-L exhibits bias in the local heritability estimates (though downward) and inflated type 1 error rates when using 1,000 Genomes data as reference as well. This issue appears to be driven almost entirely by the sample size of the reference data, with a UK Biobank sample of the same sample size showing only marginal improvement over 1,000 Genomes.
Contrary to the conclusions drawn by Li et al., our results demonstrate that, when using the correct null model and reference data, LAVA exhibits well-controlled type 1 error rates and estimates as well as generally superior performance to HDL-L. We also observed a sensitivity for both methods to the reference data, with the commonly used 1,000 Genomes data yielding biases and inflated type 1 error rates due to its small sample size. Since many other types of localized methods for secondary analysis of GWAS results similarly rely on LD estimated from reference data, further research will be needed to determine to what extent those methods are affected by this issue.
Supplementary Materials
The following supporting information can be downloaded at the website of this paper posted on Preprints.org.
Author contributions
C.d.L performed the simulations and analyses and wrote the manuscript. All authors conceived of the study and participated in the interpretation of there results and revision of the manuscript.
Data availability
UK Biobank genotype data was obtained from https://www.ukbiobank.ac.uk under application #16406. The European panel of the 1000 Genomes data was downloaded from https://cncr.nl/research/magma. The HDL-L-specific LD reference files and genomic block definitions, as well as the simulation scripts used by Li et al., were obtained from https://zenodo.org/records/14825987. The LAVA-specific LD reference files can be obtained from https://github.com/josefin-werme/LAVA.
Acknowledgements
D.P. is supported by the Netherlands Organization for Scientific Research - Gravitation project ‘BRAINSCAPES: A Roadmap from Neurogenetics to Neurobiology’ (024.004.012). C.d.L and D.P. are supported by the European Research Council advanced grant ‘From GWAS to Function’ (ERC-2018-ADG 834057).
Competing interests
The authors declare no competing interests.
Code availability
LAVA version 0.1.0 was used for all LAVA analyses, except those using the LAVA-specific LD files which used version 0.1.5. Both versions can be obtained from https://github.com/josefin-werme/LAVA. The HDL-L software was downloaded from https://github.com/zhenin/HDL, using the HDL.L.R script with timestamp 7 February 2025. Scripts used for simulations and analyses can be found at https://github.com/cadeleeuw/hdll-response-scripts2025.
References
- Li, Y.; Pawitan, Y.; Shen, X. An enhanced framework for local genetic correlation analysis. Nat. Genet. 2025, 57, 1053–1058. [Google Scholar] [CrossRef] [PubMed]
- Werme, J.; van der Sluis, S.; Posthuma, D.; de Leeuw, C.A. An integrated framework for local genetic correlation analysis. Nat. Genet. 2022, 54, 274–282. [Google Scholar] [CrossRef] [PubMed]
- Yang, J.; Lee, S.H.; Goddard, M.E.; Visscher, P.M. GCTA: a tool for genome-wide complex trait analysis. Am. J. Hum. Genet. 2011, 88, 76–82. [Google Scholar] [CrossRef] [PubMed]
- Bulik-Sullivan, B.K.; et al. LD Score regression distinguishes confounding from polygenicity in genome-wide association studies. Nat. Genet. 2015, 47, 291–295. [Google Scholar] [CrossRef] [PubMed]
- Sudlow, C.; et al. UK Biobank: An Open Access Resource for Identifying the Causes of a Wide Range of Complex Diseases of Middle and Old Age. PLoS Med. 2015, 12, e1001779. [Google Scholar] [CrossRef] [PubMed]
- Bycroft, C.; et al. The UK Biobank resource with deep phenotyping and genomic data. Nature 2018, 562, 203–209. [Google Scholar] [CrossRef] [PubMed]
- Auton, A.; et al. A global reference for human genetic variation. Nature 2015, 526, 68–74. [Google Scholar] [CrossRef] [PubMed]
Figure 1.
Significance rates for testing local genetic correlations across methods and conditions, at α = 0.05. Results are shown for the analyses using the UK Biobank simulation sample as reference, separately for the fixed effects (top row) and random effects (bottom row) generative models, and for the proportion of causal regions (columns). The dashed lines indicate the significance threshold of 0.05. Bars are plotted as solid if the generative model matches the method, and with diagonal lines otherwise. The ‘null’ simulations are thus represented by the solid bars in the condition with genetic correlation parameter of zero, ie. the fixed effects generate model for LAVA and the random effects generative model for HDL-L. The significance rates represent type 1 error rates for those methods in those conditions, and statistical power otherwise.
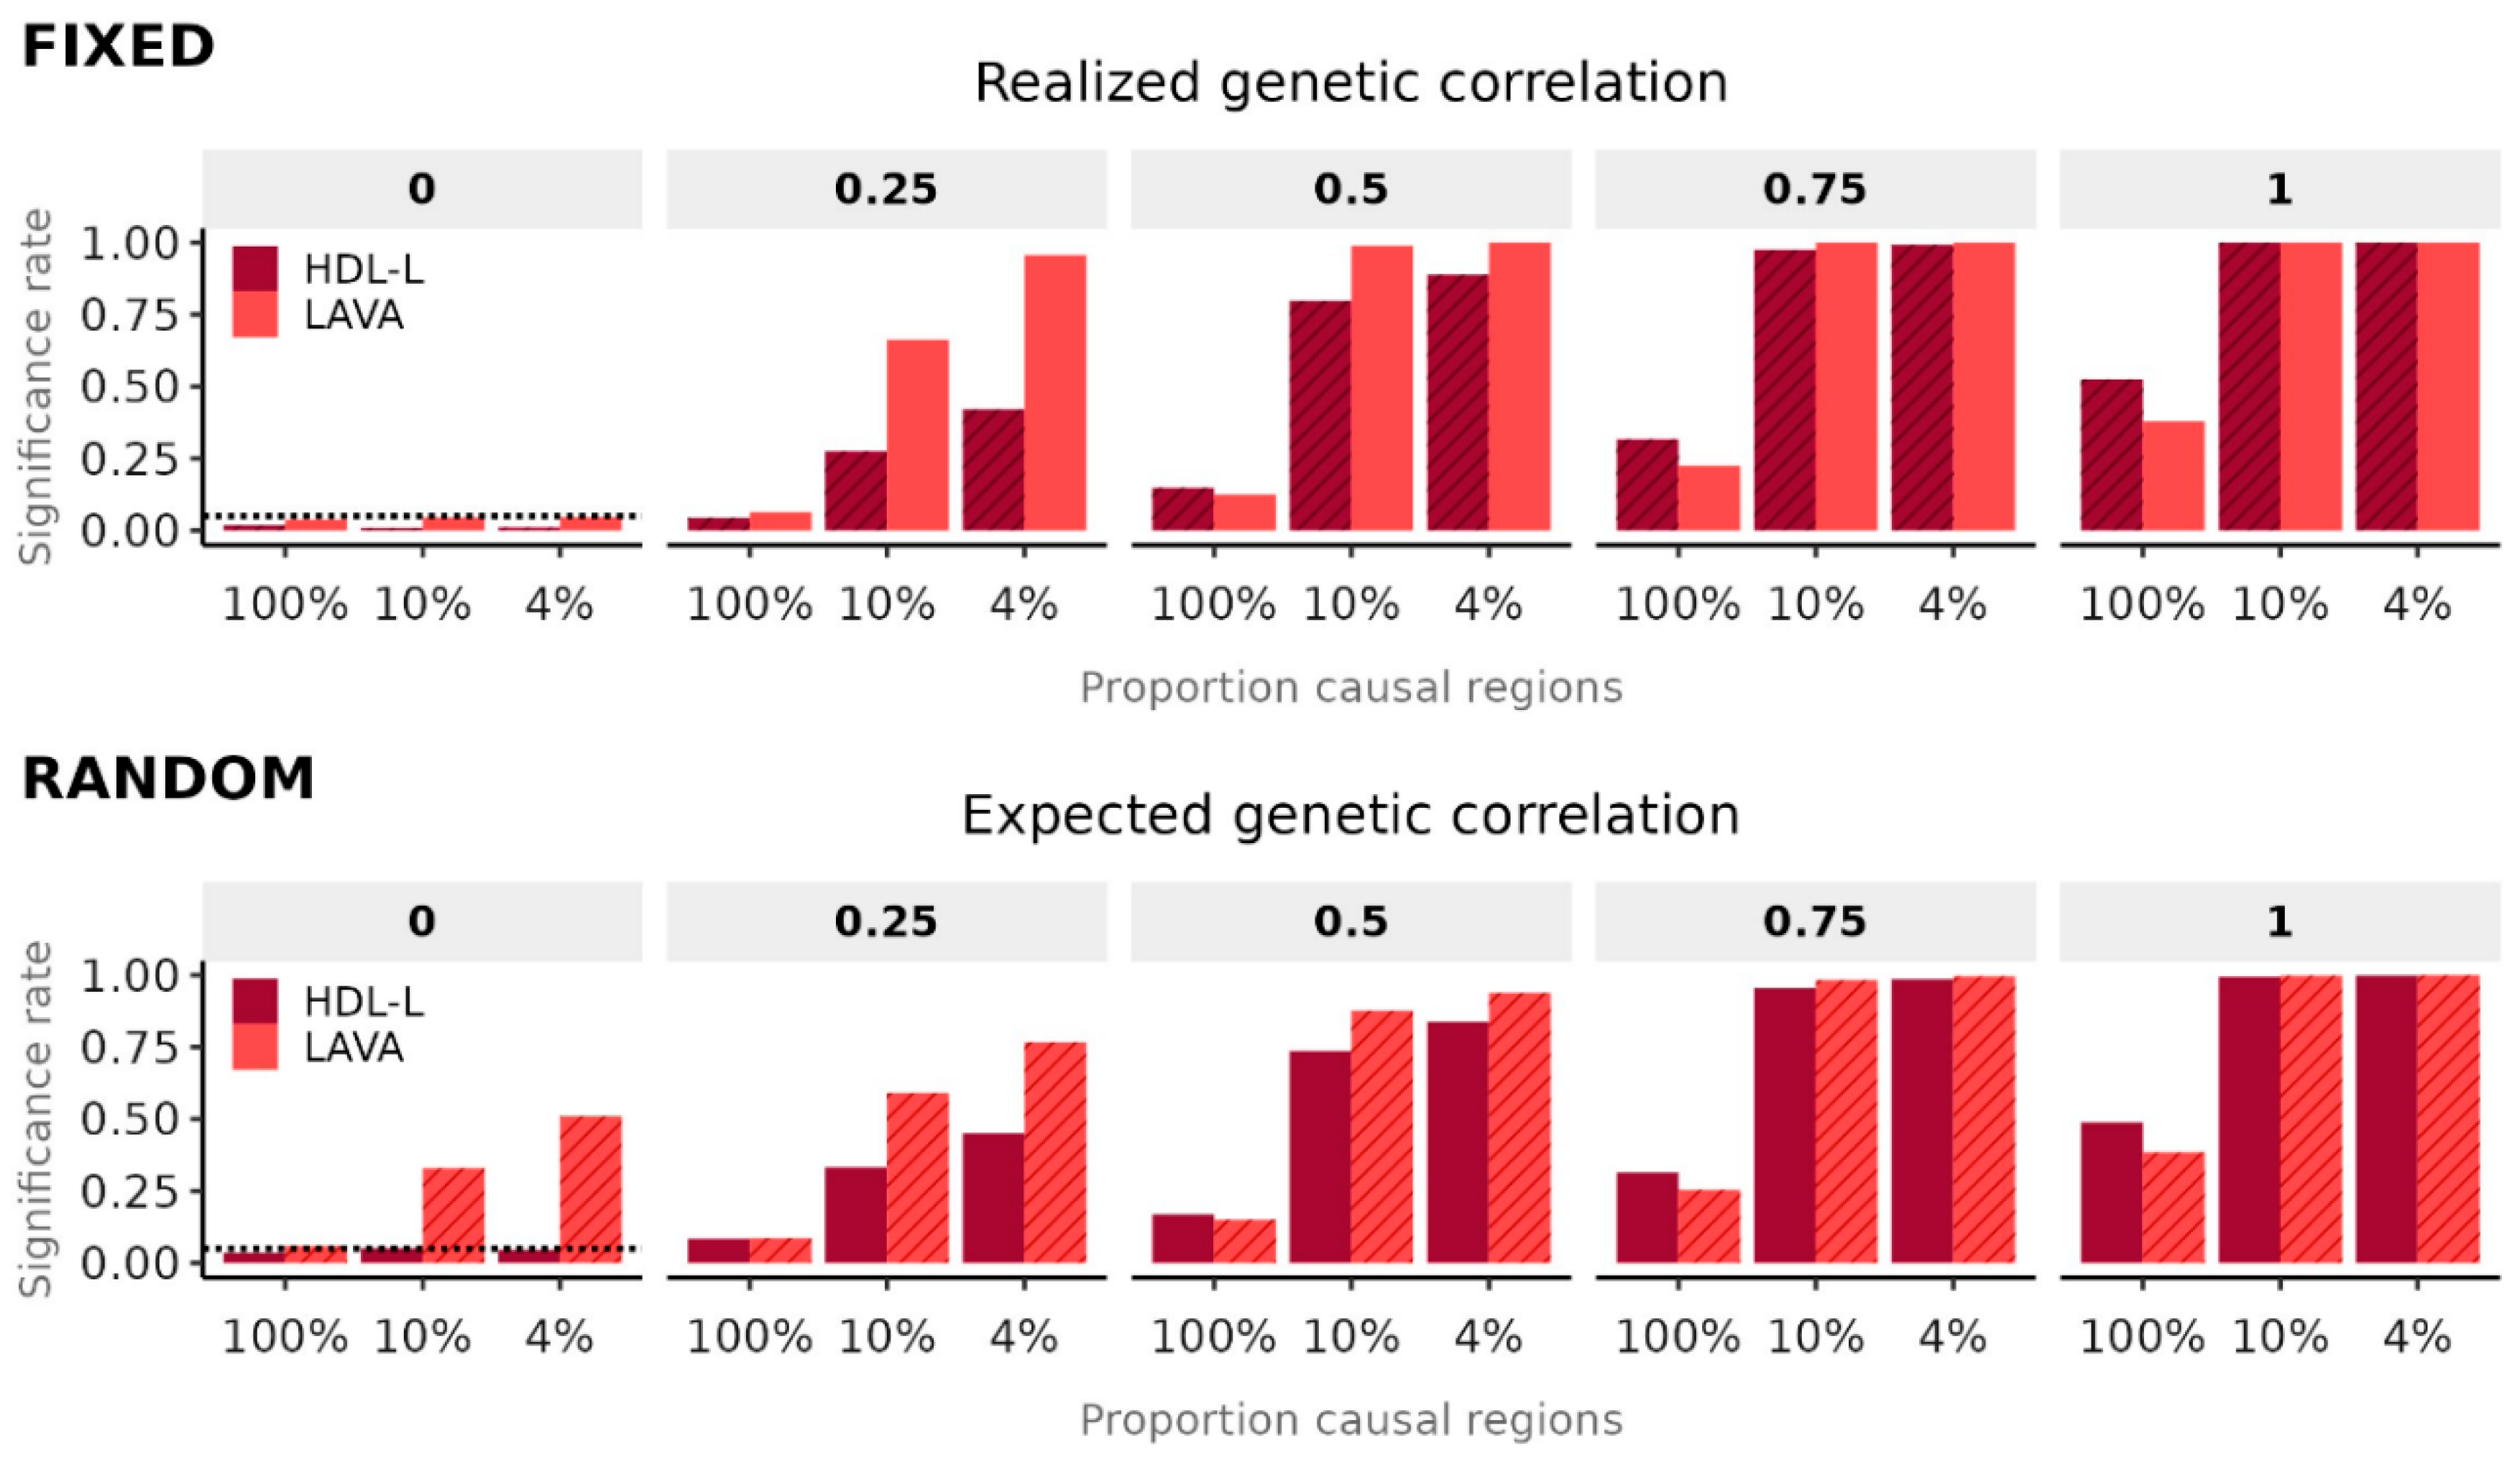
Figure 2.
Type 1 error rates for local genetic correlations when using different reference data, at α = 0.05. Results are shown for the generative model corresponding to each method, ie. the fixed effects model for LAVA and the random effects model for HDL-L, with genetic correlation parameter set to zero. The dashed lines indicate the significance threshold of 0.05. Note that the additional UK Biobank samples shown in the figure do not overlap with the original UK Biobank simulation sample. The LAVA and HDL-L specific LD are the publicly available reference data sets for each method, both of which are based on UK Biobank as well.
Disclaimer/Publisher’s Note: The statements, opinions and data contained in all publications are solely those of the individual author(s) and contributor(s) and not of MDPI and/or the editor(s). MDPI and/or the editor(s) disclaim responsibility for any injury to people or property resulting from any ideas, methods, instructions or products referred to in the content. |
© 2025 by the authors. Licensee MDPI, Basel, Switzerland. This article is an open access article distributed under the terms and conditions of the Creative Commons Attribution (CC BY) license (http://creativecommons.org/licenses/by/4.0/).
Copyright: This open access article is published under a Creative Commons CC BY 4.0 license, which permit the free download, distribution, and reuse, provided that the author and preprint are cited in any reuse.


