
Submitted:
24 April 2025
Posted:
24 April 2025
You are already at the latest version
Abstract
Understanding the genetic structure of North African populations within a global context remains an essential yet understudied area of human population genomics. In this study, we analyzed a subset of individuals from the 1000 Genomes Project, including Iberian (IBS), Tuscan (TSI), Northern/Western European (CEU), and Yoruba (YRI) populations, to contextualize Amazigh-related ancestries using Chromosome 22 data. Using a filtered set of ~50,000 high-quality biallelic SNPs, we performed Principal Component Analysis (PCA), ADMIXTURE clustering, FST analysis, and Multidimensional Scaling (MDS). PCA revealed a clear continental split between African and European individuals, with minimal separation among European subpopulations. ADMIXTURE analysis (K=4) detected subtle intra-European components and significant African-European ancestry divergence, consistent with known demographic histories. Pairwise FST values confirmed these patterns, with low differentiation among European groups (FST ≈ 0.0016–0.0030) and much higher divergence from YRI (FST > ≈ 0.137–0.141). Ancestry proportions varied slightly by gender, though differences were not statistically significant. We further visualized inter-individual relatedness using phylogenetic trees and genetic distance matrices, which aligned with continental ancestries. Collectively, these findings underscore the genetic continuity among Southern European populations and their divergence from West African ancestry, providing a strong reference for future studies involving indigenous North African (Amazigh) genomic data. Our integrative, Python-based workflow demonstrates how publicly available datasets can illuminate population structure and support future North African-focused genome studies.
Keywords:
Amazigh
; North Africa
; population structure
; 1000 Genomes Project
; genetic diversity
; principal component analysis (PCA)
; ADMIXTURE
; FST statistics
; human ancestry
; chromosome 22
1. Introduction
The Amazigh, often referred to as Berbers, are the
indigenous peoples of North Africa, with a historical presence that extends
back thousands of years—predating the Arab-Islamic expansion and many ancient civilizations
that rose and fell in the Mediterranean basin. Their presence spans across
modern-day Morocco, Algeria, Tunisia, Libya, Mauritania, and parts of the
Sahara, with diasporic communities extending into Europe and beyond. The
Amazigh have maintained distinct cultural, linguistic, and social identities,
largely through the preservation of Tamazight languages, tribal structures, and
oral histories [1].
Historically, the genetic landscape of North
Africa, including that of the Amazigh, has been shaped by multiple waves of
migration, local adaptation, and complex demographic events. These include the
Neolithic expansions, Phoenician and Roman colonization, Vandal and Byzantine
invasions, Arab conquests, trans-Saharan trade, and later European colonialism [2,3,4]. Such events left discernible genetic
signatures within Amazigh groups, creating a mosaic of ancestries that is not
homogeneously distributed across North Africa but varies regionally and even
microgeographically [5,6,7,8].
Despite their unique heritage, Amazigh populations
remain underrepresented in global genomic reference datasets, such as the 1000
Genomes Project (1KGP) [9]. However,
comparative analyses using proxy populations—especially Iberian (IBS) and
Southern European (TSI) groups—offer a starting point for approximating
Amazigh-related components. Historically, there has been substantial gene flow
between North Africa and Southern Europe, particularly across the Strait of
Gibraltar, as supported by archaeological, historical, and genetic evidence [10,11].
Genetically, the Amazigh are frequently associated
with Y-chromosome haplogroup E1b1b1b1a (E-M81), which is highly prevalent in
North Africa and considered a marker of Amazigh paternal ancestry [10, 12,13].
However, maternal lineages, captured via mtDNA, and autosomal SNP data reveal a
more complex picture, indicating admixture with sub-Saharan, European, and
Middle Eastern populations [2,4,5,6].
Genome-wide analyses have further refined our
understanding of Amazigh genetic structure. Notably, genome-wide SNP studies
have identified both endemic North African components and shared ancestry with
neighboring populations, as well as signals of historical selection and genetic
drift [4,14]. Yet, the limited availability of
whole-genome sequence data from indigenous Amazigh individuals has hindered
efforts to comprehensively assess their population structure, demographic
history, and evolutionary dynamics.
To address these gaps, public datasets like the
1000 Genomes Project remain a powerful tool. Although it does not explicitly
include North African or Amazigh populations, it offers a high-resolution
resource for investigating population structure, admixture, and genetic
differentiation using carefully selected comparison groups [9]. For example, IBS, TSI, CEU, and YRI populations
can serve as proxies for inferring North African-related ancestries and
admixture signatures, especially in genome-wide clustering and PCA frameworks [9,15].
Moreover, the chromosome-specific approach—such as
analyses restricted to chromosome 22—has proven effective in capturing local
ancestry patterns, reducing computational burden, and providing insights into
differential selective pressures or recombination landscapes [16,17]. When integrated with computational tools
like PLINK, ADMIXTURE, scikit-allel, and principal component analysis, these
data enable fine-scale analyses of allele frequency spectra, genetic distances,
and population structure [18,19].
In this study, we leverage chromosome 22 variant
data from the 1000 Genomes Project to explore the genetic relationships between
European and African populations with the aim of identifying patterns
potentially indicative of Amazigh ancestry. We utilize PCA [20], ADMIXTURE [18],
Weir and Cockerham’s FST statistics [21], and
phylogenetic clustering to dissect the genetic structure and divergence across
populations. Although limited by the absence of directly sampled Amazigh
individuals, this framework provides a scalable, reproducible, and
insight-generating model for future North African genomics studies, especially
as more Amazigh genomes become publicly available.
By contextualizing these findings with known
historical, linguistic, and genetic evidence, our analysis contributes to the
growing literature on human population genomics and highlights the genetic
uniqueness of North African indigenous populations within the broader scope of
human diversity.
2. Methods
2.1. Data Source and Sample Selection
We used variant call format (VCF) files from
Chromosome 22 of the 1000 Genomes Project Phase 3 release [9,22], specifically the high-coverage phased
genotypes:
[ALL.chr22.phase3_shapeit2_mvncall_integrated_v5b.20130502.genotypes.vcf.gz]
Sample metadata were obtained from the
corresponding 1000 Genomes annotation file 20130606_sample_info.txt. From the
full dataset, four populations were selected based on geographic and ancestral
relevance: CEU (Utah Residents with Northern and Western European Ancestry),
TSI (Toscani in Italia), IBS (Iberian Population in Spain), YRI (Yoruba in
Ibadan, Nigeria). A total of 421 individuals were retained after filtering for
completeness and ancestry.
2.2. VCF Processing and Genotype Extraction
We used bcftools v1.21 for subsetting samples and
indexing the VCF file. The command:
[bcftools view -S sample_ids.txt -Oz -o
amazigh_subset_chr22.vcf.gz ALL.chr22*.vcf.gz]
selected the relevant samples. The VCF was then parsed in Python using scikit-allel [23]. Only biallelic SNPs with no missing genotype calls were retained. A filtered set of 50,050 SNPs was randomly sampled to accelerate PCA and ADMIXTURE runs.
2.3. Principal Component Analysis (PCA)
Genotype data were converted to alternate allele count matrices, transposed to a samples × variants format, and passed to scikit-learn's PCA module [20]. The top two principal components were visualized using Matplotlib and Seaborn. Additional PCA was performed stratified by gender to explore sex-specific variation.
2.4. Site Frequency Spectrum
We computed the site frequency spectrum (SFS) by summing alternate allele counts across all individuals and plotting the distribution using 100 histogram bins. The SFS was used to infer overall patterns of allele frequency, highlighting common vs. rare variant contributions.
2.5. ADMIXTURE Analysis
The amazigh_subset_chr22.vcf.gz file was converted to PLINK format using PLINK --vcf [24], followed by ADMIXTURE analysis with K=4 using a Dockerized ADMIXTURE v1.3.0 container [18]. Cross-validation was enabled to estimate model fit.
Ancestry proportions (Q matrix) were merged with population and gender metadata and visualized using stacked bar plots. Gender-specific ancestry profiles were explored using grouped boxplots and Mann–Whitney U tests for significance.
2.6. FST Calculation
Pairwise Weir and Cockerham's FST statistics [21] were computed using scikit-allel. The weir_cockerham_fst function was applied across the filtered GenotypeArray for each pair of populations, and results were aggregated to compute average genome-wide divergence. The resulting FST matrix was visualized as a heatmap using Seaborn.
2.7. Multidimensional Scaling (MDS)
Pairwise genetic distances between individuals were computed from the alternate allele count matrix using Euclidean distance via scipy.spatial.distance.pdist. A 2D MDS embedding was computed using scikit-learn's MDS implementation.
2.8. Phylogenetic Tree Construction
A hierarchical clustering dendrogram was generated using the same genetic distance matrix. Ward’s linkage was used via scipy.cluster.hierarchy.linkage. The tree was visualized with individual sample IDs.
2.9. Software and Environment
All analyses were conducted in Python 3.11 (https://www.python.org/), using Anaconda on macOS with M1 Pro chip. Major packages include: Scikit-learn [20], Scikit-allel [23], Numpy [25], Pandas [26], Matplotlib [27], Seaborn [28], bcftools [19,22], PLINK [24], ADMIXTURE [18], and Docker for containerized execution [29].
All analyses were performed on a standard personal computer (Mac Book Pro) running Mac OS Sonoma 14.4.1. All code and Jupyter Notebooks [30] are available upon request.
3. Results
3.1. Principal Component Analysis (PCA)
Figure 1 displays the PCA of 421 individuals from four populations (IBS, CEU, TSI, YRI), based on 50,000 randomly selected SNPs from chromosome 22. The first two principal components explain 11.88% and 0.78% of the total variance, respectively. The PCA clearly separates YRI from the three European populations along PC1, with European clusters (IBS, CEU, TSI) largely overlapping, suggesting shared ancestry among them [31]. A few individuals appear as slight outliers, which may indicate cryptic population substructure or recent admixture.
Figure 2 overlays gender on the same PCA coordinates. There is no visual evidence of gender-based clustering, supporting the absence of sex-biased allele distribution at a genome-wide level across these populations.
3.2. Site Frequency Spectrum (SFS)
Figure 3 presents the site frequency spectrum (SFS), showing a strong skew toward rare variants (i.e., alternate alleles with low frequencies), a common pattern in human populations due to recent population expansions and purifying selection [32]. The steep drop-off reinforces that most polymorphisms are low-frequency alleles.
3.3. Population Structure via ADMIXTURE
Figure 4 shows ADMIXTURE estimates for K = 4 ancestral clusters. The YRI population exhibits nearly exclusive ancestry from Ancestry 1 and 4, while CEU, IBS, and TSI are dominated by Ancestry 2 and 3, with subtle gradients among them. TSI and IBS appear more similar to each other than to CEU. This pattern reflects both continental-level divergence and intra-European differentiation.
Figure 5 further dissects ADMIXTURE results by gender. Each of the four ancestry clusters is plotted separately, revealing no consistent or significant sex-based biases in ancestry proportions. Minor variation between males and females exists but falls within expected stochastic bounds.
3.4. Pairwise Genetic Differentiation (FST Matrix)
Figure 6 and Table 1 summarize the pairwise FST estimates calculated using Weir and Cockerham’s method [21]. These values reflect the extent of genetic differentiation between the studied populations.
As expected, genetic distances among the European populations—IBS, TSI, and CEU—are extremely low, with FST values ranging from 0.0016 to 0.0030, indicating shared ancestry and extensive gene flow. In stark contrast, the YRI population shows consistently high differentiation from all three European groups, with FST values between 0.137 and 0.141, consistent with deep continental divergence and the effects of historical population structure such as the out-of-Africa migration bottleneck [9].
This divergence underscores the strong genetic separation between African and European ancestries, while highlighting the fine-scale homogeneity within Europe. These patterns reinforce the findings from PCA and ADMIXTURE and provide a quantitative measure of population structure.
3.5. Multidimensional Scaling (MDS)
Figure 7 shows results from MDS based on a genetic distance matrix. The first two dimensions recapitulate the major population structure seen in PCA, with YRI individuals separated from Europeans. European clusters again exhibit partial overlap, though CEU shows a slight shift relative to TSI and IBS. This consistency across dimensionality reduction methods strengthens the robustness of the observed structure.
3.6. Phylogenetic Tree
Figure 8 presents a hierarchical clustering dendrogram based on pairwise genetic distances. Individuals cluster into two primary branches, clearly separating the African (YRI) and European populations. Within the European clade, IBS and TSI are more closely grouped, with CEU forming a slightly distinct sub-branch. This tree reflects phylogenetic distances driven by both geographic separation and historical demographic events [33].
4. Discussion
This study leveraged publicly available data from the 1000 Genomes Project to explore genetic structure, divergence, and ancestry among four human populations—IBS, TSI, CEU, and YRI—using a diverse array of population genomic tools. The use of 50,000 randomly selected SNPs from chromosome 22 allowed for efficient computation while retaining sufficient resolution to uncover robust genetic patterns.
4.1. Continental and Regional Structure
Principal Component Analysis (PCA) and Multidimensional Scaling (MDS) both consistently revealed a major axis of variation distinguishing the African YRI population from European groups, consistent with known human evolutionary history and the out-of-Africa model [34,35]. The tight clustering of European individuals and their partial overlap further reflect low intra-European differentiation, in agreement with prior reports showing subtle but detectable structure within Europe [36,37].
Hierarchical clustering and FST metrics supported this pattern: FST values among European populations were near zero, whereas comparisons involving YRI were significantly elevated (FS≈0.14), reflecting ancient divergence and long-term geographic separation [33,38,39]. Interestingly, TSI and IBS exhibited the lowest pairwise FST (0.0016), likely due to geographic proximity and shared Mediterranean ancestry [40].
4.2. Site Frequency Spectrum and Rare Variants
The site frequency spectrum was markedly skewed toward low-frequency variants, a signature of recent population expansion and purifying selection, especially within European populations [32,41]. The abundance of rare alleles may also reflect the inclusion of both common and uncommon SNPs in the random subsampling strategy, thus recapitulating known demographic histories.
4.3. Ancestry Proportions and Admixture
ADMIXTURE analysis with K = 4 revealed distinct ancestry components, sharply distinguishing African and European individuals, with YRI individuals showing consistent ancestry from two specific clusters, likely reflecting deeper population structure within West Africa [42,43]. In contrast, European individuals displayed more mixed proportions, likely representing overlapping but distinct sub-ancestries within the continent [44].
The admixture proportions suggest TSI and IBS share more ancestry than either does with CEU, supporting observations from PCA and hierarchical clustering. This reflects regional patterns of historical gene flow across southern Europe and the Mediterranean Basin [45].
4.4. Sex-Specific Analyses
Boxplots comparing ancestry proportions across genders revealed no significant sex-biased patterns. This indicates that autosomal ancestry components are equally distributed among males and females, as expected for biparentally inherited markers [46]. While mitochondrial DNA and Y chromosome studies have found evidence for sex-biased migration [47], such patterns are often muted in genome-wide autosomal analyses.
4.5. Implications and Limitations
Our results reinforce fundamental principles of human population genetics, highlighting both the power and efficiency of dimensionality reduction, clustering, and allele frequency–based analyses. The use of a subset of chromosome 22 SNPs offers an accessible framework for conducting similar educational or pilot analyses with reduced computational resources.
However, several caveats must be noted. First, the analysis is restricted to a single autosome, and thus may not capture genome-wide patterns of linkage or structural variation. Second, sample sizes are moderate (~100 per population), and more subtle signals (e.g., recent admixture or local adaptation) may require larger cohorts or whole-genome sequencing. Finally, the focus on just four populations omits broader global context, though the inclusion of African and European populations provides a solid basis for continental comparisons.
5. Conclusions
This study provides a comprehensive analysis of genetic structure and ancestry among selected populations from the 1000 Genomes Project using a 50,000 SNP panel from chromosome 22. Through an integrated framework of PCA, ADMIXTURE, FST, MDS, phylogenetic clustering, and sex-specific ancestry profiling, we reveal both broad continental divergence and fine-scale European substructure.
Key findings include the clear genetic separation between African and European populations, subtle but consistent differences among Southern and Northern Europeans, and the predominance of rare alleles consistent with recent demographic expansions. ADMIXTURE results suggest shared ancestry patterns among TSI and IBS individuals, while FST analysis confirms minimal divergence among European groups and greater differentiation from YRI.
Importantly, this work demonstrates how publicly available genomic data, even from a single chromosome, can be used to infer evolutionary history, population relationships, and admixture patterns. The pipeline presented here is replicable, extensible, and suitable for both research and educational purposes.
Future work may expand this analysis genome-wide, incorporate additional global populations, and examine functional implications of population-specific variants, particularly in relation to disease-associated loci.
Funding
This research received no external funding.
Data Availability Statement
The 1000 Genomes Project data are publicly available from the International Genome Sample Resource (IGSR) at (https://www.internationalgenome.org), including VCF and metadata files for all Phase 3 populations. All scripts, Jupyter notebooks, and analysis workflows used in this study are available from the author upon reasonable request.
Acknowledgments
The author thanks the Department of Biological and Forensic Sciences and Fayetteville State University (FSU) for providing an intellectually supportive environment and the resources necessary to complete this research. The author acknowledges the open-source genomics software community for the development of critical tools used in this study, including scikit-allel, PLINK, ADMIXTURE, bcftools, and the ADMIXTOOLS suite. Lastly, the author gratefully acknowledges their Amazigh heritage, which inspired this work and continues to motivate a broader effort toward equitable representation of North African populations in human genomics.
Conflicts of Interest
The authors declare no conflicts of interest.
References
- Maddy-Weitzman, B. "Notes". The Berber Identity Movement and the Challenge to North African States, New York, USA: University of Texas Press, 2011, pp. 211-254. [CrossRef]
- Henn, B.M.; Botigué, L.R.; Gravel, S.; Wang, W.; Brisbin, A.; Byrnes, J.K.; Fadhlaoui-Zid, K.; Zalloua, P.A.; Moreno-Estrada, A.; Bertranpetit, J., Bustamante, C.D., Comas, D. Genomic Ancestry of North Africans Supports Back-to-Africa Migrations. PLoS Genetics, 2012, 8(1): e1002397. [CrossRef]
- Brisighelli, F.; Blanco-Verea, A.; Boschi, I.; Garagnani, P.; Pascali, V.L.; Carracedo, A.; Capelli, C.; Salas, A. Patterns of Y-STR variation in Italy. Forensic Science International: Genetics, 2012, 6, 6, 834-839. [CrossRef]
- Arauna, L.R.; Mendoza-Revilla, J.; Mas-Sandoval, A.; Izaabel, H.; Bekada, A.; Benhamamouch, S.; Fadhlaoui-Zid, K.; Zalloua, P.; Hellenthal, G.; Comas, D. Recent Historical Migrations Have Shaped the Gene Pool of Arabs and Berbers in North Africa. Molecular Biology and Evolution, 2017, 34(2), 318–329. [CrossRef]
- Fadhlaoui-Zid, K., Martínez-Cruz, B., Khodjet-el-khil, H., Mendizabal, I.; Benammar-Elgaaied, A.; Comas, D. Genetic structure of Tunisian ethnic groups revealed by paternal lineages. American Journal of Physical Anthropology, 2011, 146(2), 271–280. [CrossRef]
- Fadhlaoui-Zid, K.; Haber, M.; Martínez-Cruz, B.; Zalloua, P.; Benammar-Elgaaied, A.; Comas, D. (2013) Genome-Wide and Paternal Diversity Reveal a Recent Origin of Human Populations in North Africa. PLoS ONE, 2013, 8(11): e80293. [CrossRef]
- Bekada, A.; Fregel, R.; Cabrera, V.M.; Larruga, J.M.; Pestano, J.; Benhamamouch, S.; Gonzalez, A.M. Introducing the Algerian Mitochondrial DNA and Y-Chromosome Profiles into the North African Landscape. PLoS ONE, 2013, 8(2): e56775. [CrossRef]
- Bekada, A.; Arauna, L.R.; Deba, T.; Calafell, F.; Benhamamouch, S.; Comas, D. Genetic Heterogeneity in Algerian Human Populations. PLoS ONE, 2015, 10(9): e0138453. [CrossRef]
- The 1000 Genomes Project Consortium. A Global Reference for Human Genetic Variation. Nature 2015, 526, 68–74. [CrossRef]
- Arredi, B.; Poloni, E.S.; Paracchini, S.; Zerjal, T.; Fathallah, D.M.; Makrelouf, M.; Pascali, V.L.; Novelletto, A.; Tyler-Smith, C. A Predominantly Neolithic Origin for Y-Chromosomal DNA Variation in North Africa. Am. J. Hum. Genet., 2004, 75, 338–345. [CrossRef]
- Botigué, L.R.; Henn, B.M.; Gravel, S.; Maples, B.K.; Gignoux, C.R.; Corona, E.; Atzmon, G.; Burns, E.; Ostrer, H.; Flores, C.; Bertranpetit, J.; Comas D.; Bustamante, C.D. Gene flow from North Africa contributes to differential human genetic diversity in southern Europe. PNAS, 2013, 110(29), 11791-11796. [CrossRef]
- Semino, O.; Magri, C.; Benuzzi, G.; Lin, A.A.; Al-Zahery, N.; Battaglia, V.; Maccioni, L.; Triantaphyllidis, C.; Shen, P.; Oefner, P.J.; Zhivotovsky, L.A.; King, R.; Torroni, A.; Cavalli-Sforza, L.L.; Underhill, P.A.; Santachiara-Benerecetti, A.S. Origin, Diffusion, and Differentiation of Y-Chromosome Haplogroups E and J: Inferences on the Neolithization of Europe and Later Migratory Events in the Mediterranean Area. Am. J. Hum. Genet., 2004, 74, 1023–1034. [CrossRef]
- Cruciani, F.; La Fratta, R.; Santolamazza, P.; Sellitto, D.; Pascone, R.; Moral, P.; Watson, E.; Guida, V.; Colomb, E.B.; Zaharova, B.; Lavinha, J.; Vona, G.; Aman, R.; Calì, F.; Akar, N.; Richards, M.; Torroni, A.; Novelletto, A.; Scozzari, R. Phylogeographic Analysis of Haplogroup E3b (E-M215) Y Chromosomes Reveals Multiple Migratory Events Within and Out Of Africa. The American Journal of Human Genetics, 2004, 74(5), 1014–1022. [CrossRef]
- Montinaro, F.; Busby, G.B.J.; Pascali, V.L.; Myers, S.; Hellenthal, G.; Capelli, C. Unravelling the hidden ancestry of American admixed populations. Nature Communications, 2015, 6, 6596. [CrossRef]
- Martin, A.R.; Gignoux, C.R.; Walters, R.K.; Wojcik, G.L.; Neale, B.M.; Gravel, S.; Daly, M.J., Bustamante, C.D.; Kenny, E.E. Human Demographic History Impacts Genetic Risk Prediction across Diverse Populations. The American Journal of Human Genetics, 2017, 100, 4, 635-649. [CrossRef]
- McVean, G. A genealogical interpretation of principal components analysis. PLoS Genetics, 2009, 5(10), e1000686. [CrossRef]
- Novembre, J.; Ramachandran, S. Perspectives on Human Population Structure at the Cusp of the Sequencing Era. Annual Reviews of Genomics and Human Genetics, 2011, 12, 245-274. [CrossRef]
- Alexander, D.H.; Novembre, J.; Lange, K. Fast Model-Based Estimation of Ancestry in Unrelated Individuals. Genome Research, 2009, 19, 1655–1664. [CrossRef]
- Danecek, P.; Bonfield, J.K.; Liddle, J.; Marshall, J.; Ohan, V.; Pollard, M.O.; Whitwham, A.; Keane, T.; McCarthy, S.A.; Davies, R.M.; Li, H. Twelve years of SAMtools and BCFtools, GigaScience, 2021, 10, 2, giab008. [CrossRef]
- Pedregosa F, Varoquaux G, Gramfort A, et al. Scikit-learn: Machine learning in Python. J Mach Learn Res., 2011;12:2825-2830. https://jmlr.org/papers/v12/pedregosa11a.html.
- Weir, B.S.; Cockerham, C.C. Estimating F-Statistics for the Analysis of Population Structure. Evolution, 1984, 38, 6, 1358–1370. [CrossRef]
- Danecek, P.; Auton, A.; Abecasis, G.; Albers, C.A.; Banks, E.; DePristo, M.A.; Handsaker, R.E.; Lunter, G.; Marth, G.T.; Sherry, S.T.; McVean, G.; Durbin, R. 1000 Genomes Project Analysis Group, The variant call format and VCFtools. Bioinformatics, 2011, 27, 15, 2156–2158, . [CrossRef]
- Miles, A., Ralph, P., Rae, S., Pisupati, R. cggh/scikit-allel: v1.2.1. Zenodo, 2019. https://zenodo.org/record/3238280.
- Purcell, S.; Neale, B.; Todd-Brown, K.; Thomas, L.; Ferreira, M.A.R.; Bender, D.; Maller, J.; Sklar, P.; de Bakker, P.I.W.; Daly, M.J.; Sham, P.C. PLINK: a tool set for whole-genome association and population-based linkage analyses. Am. J. Hum. Genet., 2007, 81(3), 559–575. [CrossRef]
- Harris CR, Millman KJ, van der Walt SJ, et al. Array programming with NumPy. Nature, 2020, 585(7825):357-362. [CrossRef]
- McKinney W. Data structures for statistical computing in Python. In: Proceedings of the 9th Python in Science Conference. Austin, TX; 2010, 51-56. [CrossRef]
- Hunter, J.D. Matplotlib: A 2D graphics environment. Computing in Science and Engineering, 2007, 9(3):90-95. [CrossRef]
- Waskom ML. Seaborn: statistical data visualization. J. Open Source Software, 2021, 6(60):3021. [CrossRef]
- Merkel, D. Docker: lightweight linux containers for consistent development and deployment. Linux Journal, 2014, 239, 2.
- Kluyver, T.; Ragan-Kelley, B.; Pérez, F.; Granger, B.; Bussonier, M.; Frederic, J.; Kelly, K.; Hamrick, J.; Grout, J.; Corlay, S.; Ivanov, P.; Avila, D.; Abdalla, S.; Willing, C.. Jupyter Notebooks – a publishing format for reproducible computational workflows. In: Loizides F, Schmidt B, eds. Positioning and Power in Academic Publishing: Players, Agents and Agendas. IOS Press, 2016, 87-90. [CrossRef]
- Patterson, N.; Price, A.L.; Reich, D. Population Structure and Eigenanalysis. PLoS Genetics, 2006, 2, e190. [CrossRef]
- Keinan, A.; Clark, A. G. Recent explosive human population growth has resulted in an excess of rare genetic variants. Science, 2012, 336, 6082, 740-743. [CrossRef]
- Reich, D.; Thangaraj, K., Patterson, N.; Price, A.L.; Singh L. Reconstructing Indian population history. Nature, 2009, 461, 489–494. [CrossRef]
- Tishkoff, S.A.; Reed, F.A.; Friedlaender, F.R.; Ehret, C.; Ranciaro, A.; Froment, A.; Hirbo, J.B.; Awomoyi, A.A.; Bodo, J.M.; Doumbo, O.; Ibrahim, M.; Juma, A.T.; Kotze, M.J.; Lema, G.; Moore, J.H.; Mortensen, H.; Nyambo, T.B.; Omar, S.A.; Powell, K.; Pretorius, G.S.; Smith, M.W.; Thera, M.A.; Wambebe, C.; Weber, J.L.; Williams, S.M. The genetic structure and history of Africans and African Americans. Science, 2009, 324, 5930, 1035–1044. [CrossRef]
- Pagani, L.; Lawson, D.; Jagoda, E.; Morseburg, A.; Ericsson, A.; et al. Genomic analyses inform on migration events during the peopling of Eurasia. Nature, 2016, 538, 238–242. [CrossRef]
- Novembre, J.; Johnson, T.; Bryc, K.; Kutalik, Z.; Boyko, A.R.; Auton, A.; Indap, A.; King, K.S.; Bergmann, S.; Nelson, M.R.; Stephens, M.; Bustamante, C.D. Genes mirror geography within Europe. Nature, 2008, 456, 98–101. [CrossRef]
- Lao, O.; Lu, T.T.; Nothnagel, M.; Junge, O.; Freitag-Wolf, S.; Caliebe, A.; Balascakova, M.; Bertranpetit, J.; Bindoff, L.A.; Comas, D.; Holmlund, G.; Kouvatsi, K.; Macek, M.; Mollet, I.; Parson, W.; et al. Correlation between genetic and geographic structure in Europe. Current Biology, 2008, 18(16), 1241–1248. [CrossRef]
- Rosenberg, N. A.; Pritchard, J.K.; Webber, J.L.; Cann, H.M.; Kidd, K.K.; Zhivotovsky, L.A.; Feldman, M.W. Genetic structure of human populations. Science, 2002, 298(5602), 2381–2385. [CrossRef]
- Rosenberg, N.A.; Mahajan, S.; Ramachandran, S.; Zhao, C.; Pritchard, J.K.; Feldman, M.W. Clines, Clusters, and the Effect of Study Design on the Inference of Human Population Structure. PLoS Genetics, 2005, 1, e70. [CrossRef]
- Capocasa, M.; Anagnostou, P.; Bachis, V.; Battaggia, C.; et al. Linguistic, geographic and genetic isolation: a collaborative study of Italian populations. Journal of Anthropological Sciences, 2014, 92, 201-231. [CrossRef]
- Tennessen, J.A.; Bigham, A.W.; O'Connor, T.D.; Fu, W.; Kenny, E.E.; Gravel, S.; et al. Evolution and functional impact of rare coding variation from deep sequencing of human exomes. Science, 2012, 337(6090), 64–69. [CrossRef]
- Tishkoff, S.A.; Williams, S.M. Genetic analysis of African populations: human evolution and complex disease. Nature Reviews Genetics, 2002, 3(8), 611–621. [CrossRef]
- Gurdasani, D.; Carstensen, T.; Tekola-Ayele, F.; Pagani, L.; Tachmazidou, I.; et al. The African Genome Variation Project shapes medical genetics in Africa. Nature, 2015, 517, 327–332. [CrossRef]
- Nelson, M. R.; Bryce, K.; King, K.S.; Indian, A.; Boyko, A.R.; et al. The population reference sample, POPRES: a resource for population, disease, and pharmacological genetics research. American Journal of Human Genetics, 2008, 83(3), 347–358. [CrossRef]
- Fiorito, G.; Di Gaetano, C., Guarrera, S.; Guarrera, S.; Rosa, F.; Feldman, M.W.; Piazza, A.; Matullo, G. The Italian genome reflects the history of Europe and the Mediterranean basin. European Journal of Human Genetics, 2016, 24, 1056–1062. [CrossRef]
- Mathieson, I.; Lazaridis, I.; Rohland, N.; Mallick, S.; Patterson, N.; Alpaslan, S. Genome-wide patterns of selection in 230 ancient Eurasians. Nature, 2015, 528, 499–503. [CrossRef]
- Goldberg, A.; Gunter, T.; Rosenberg, N.A; Jacobson, M. Ancient X chromosomes reveal contrasting sex bias in Neolithic and Bronze Age Eurasian migrations. PNAS, 2017, 114(10), 2657–2662. [CrossRef]
Figure 1.
PCA of Selected 1000 Genomes Populations (50K SNPs).
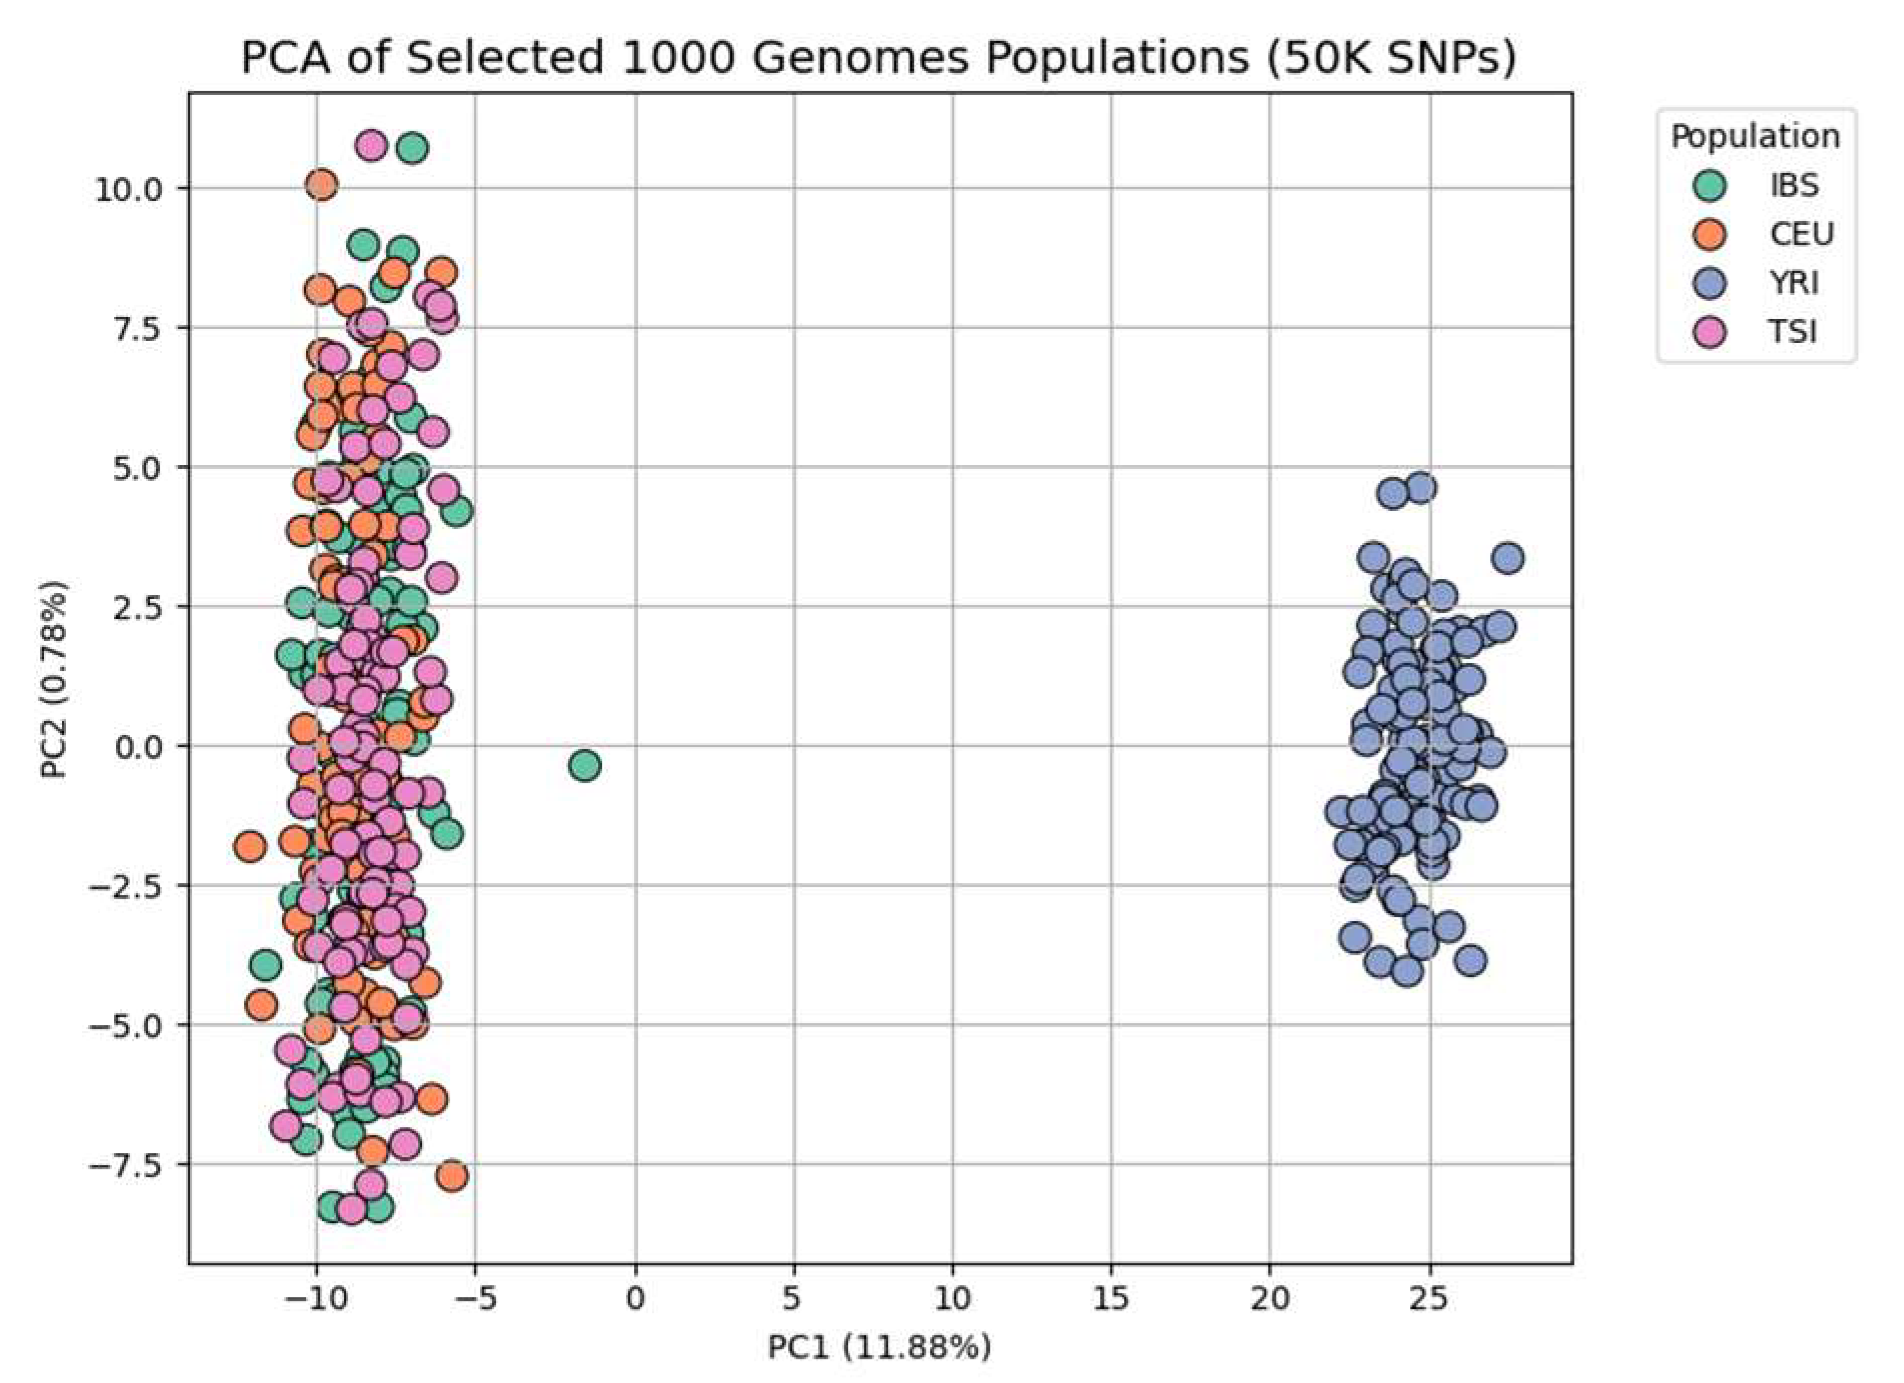
Figure 2.
PCA Colored by Gender.
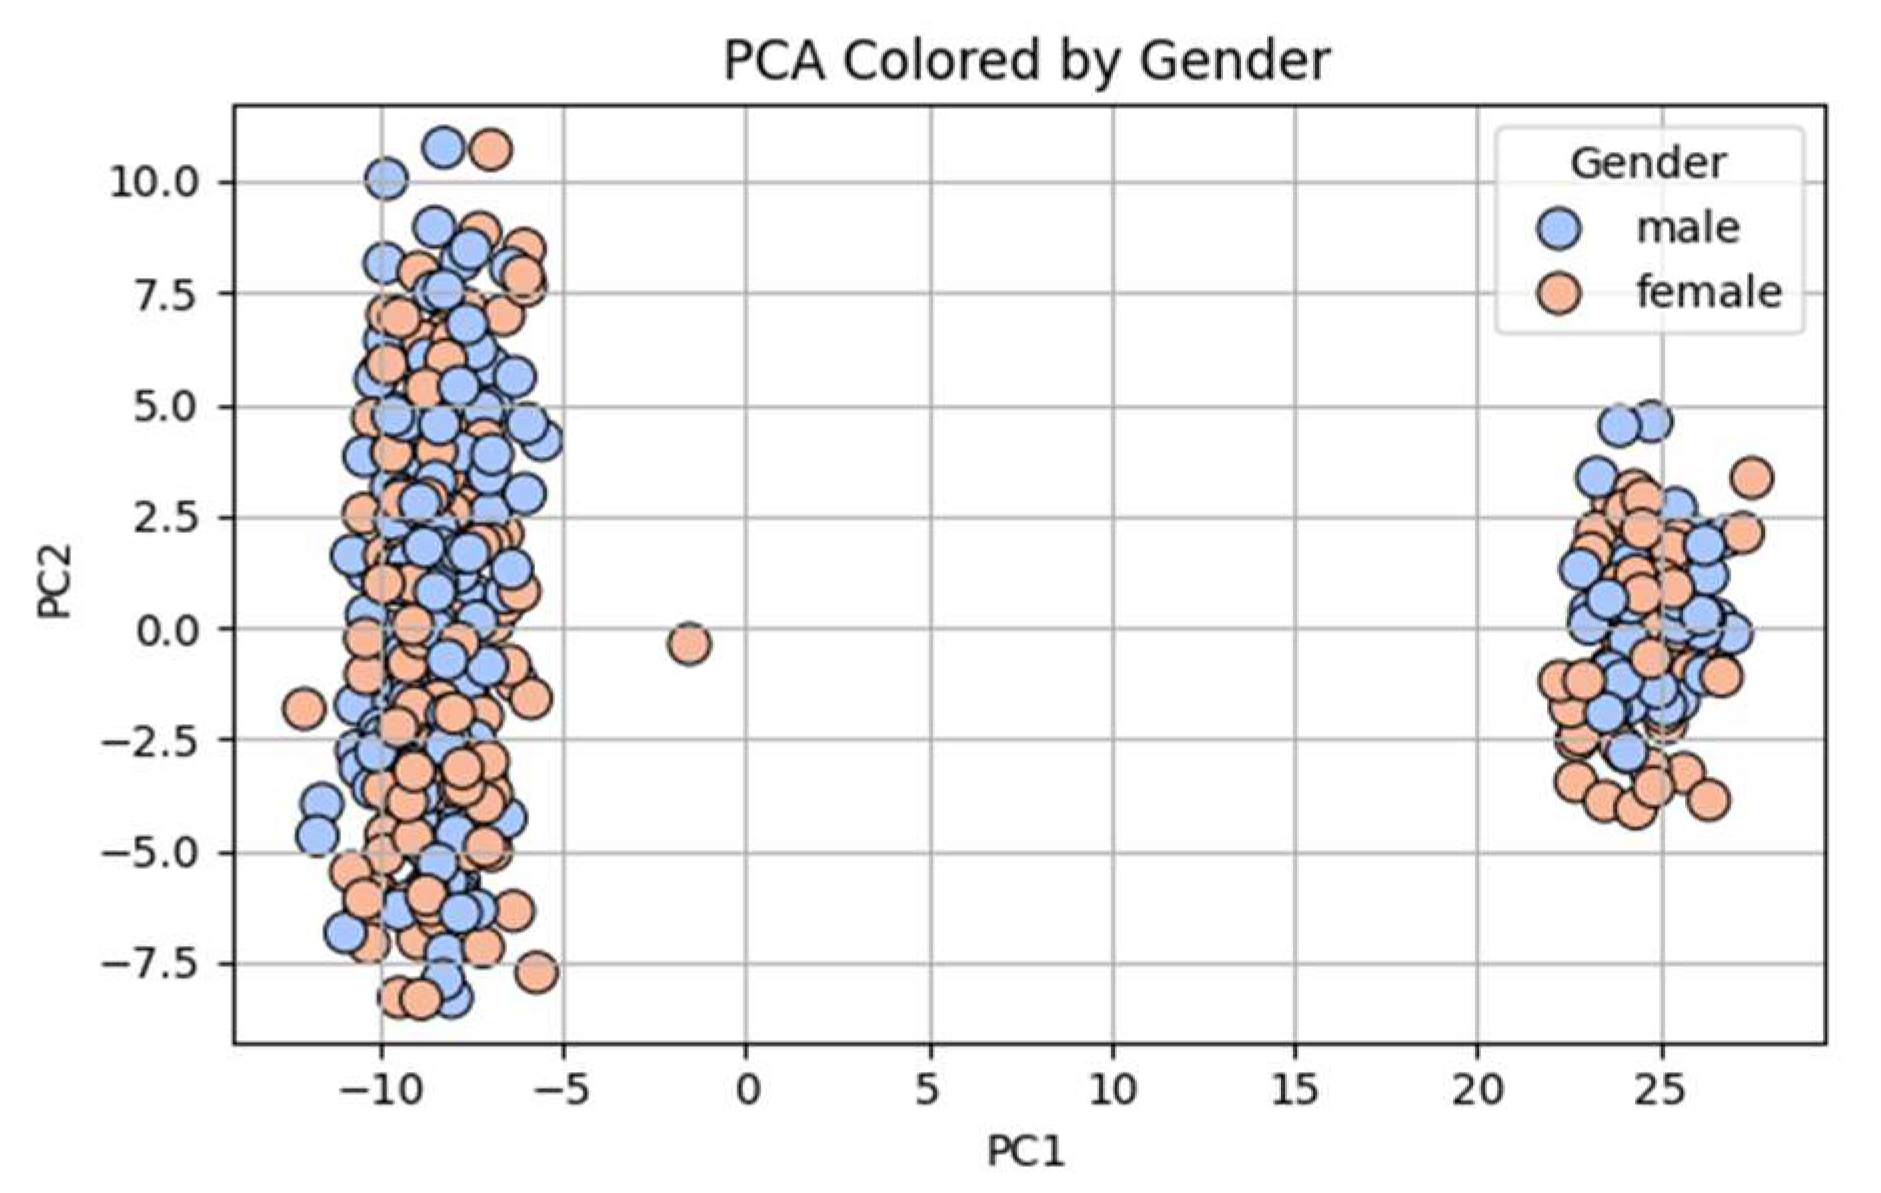
Figure 3.
Site Frequency Spectrum.
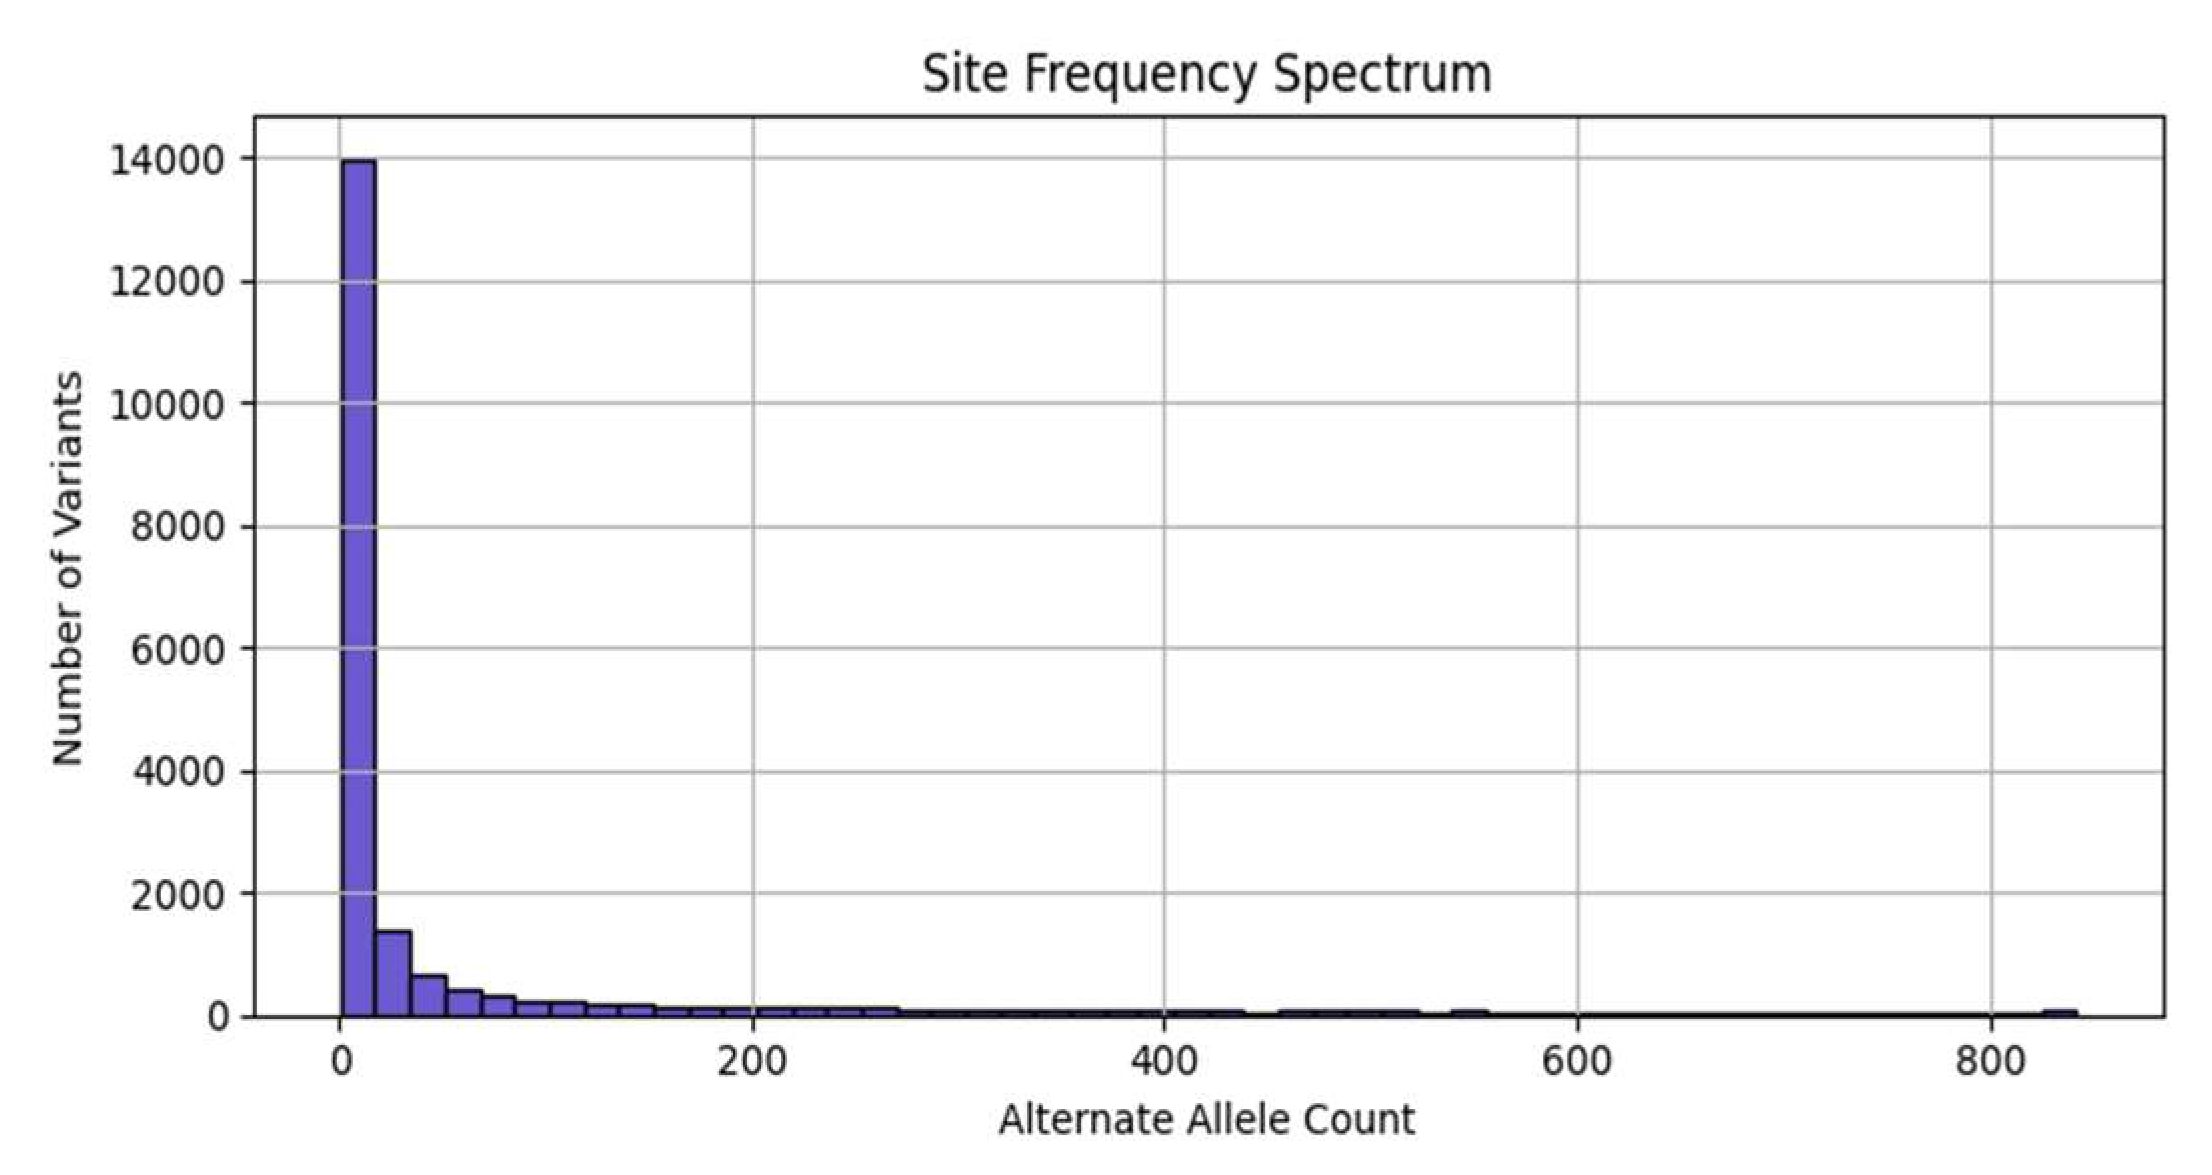
Figure 4.
ADMIXTURE Ancestry Proportions (K=4).

Figure 5.
ADMIXTURE Ancestry Proportions by Gender (K=4).
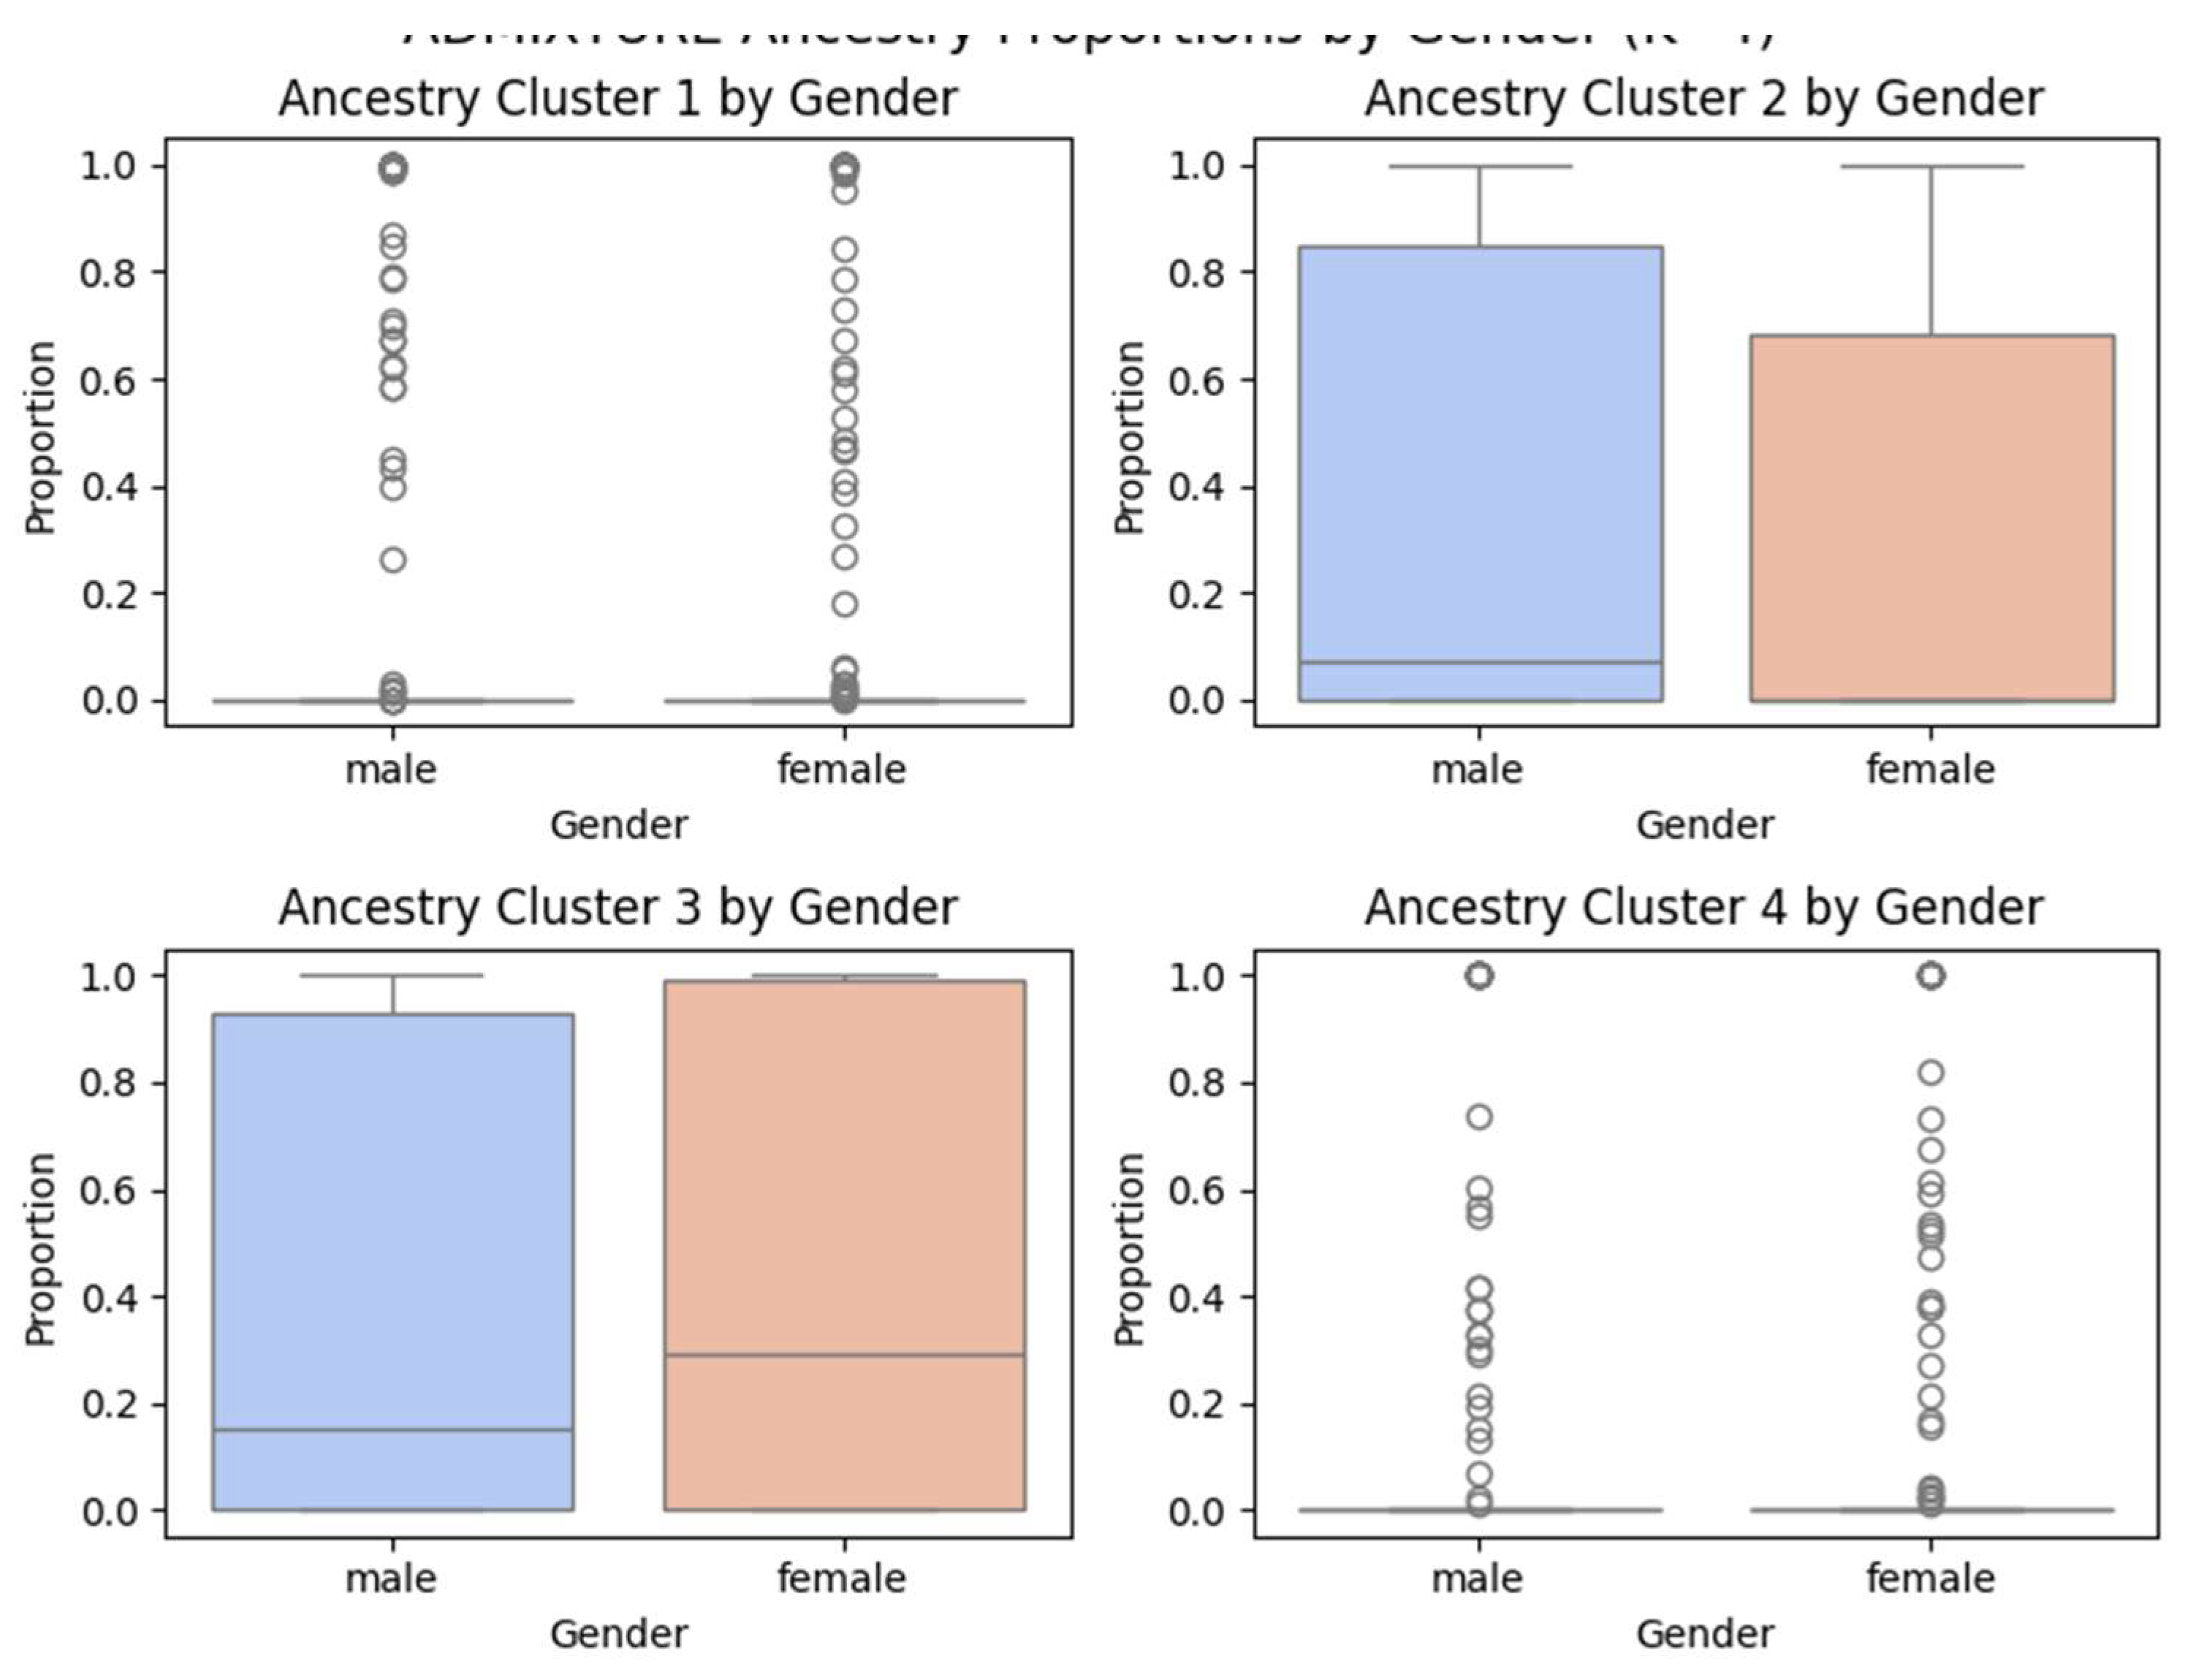
Figure 6.
Weir & Cockerham FST Between Populations.
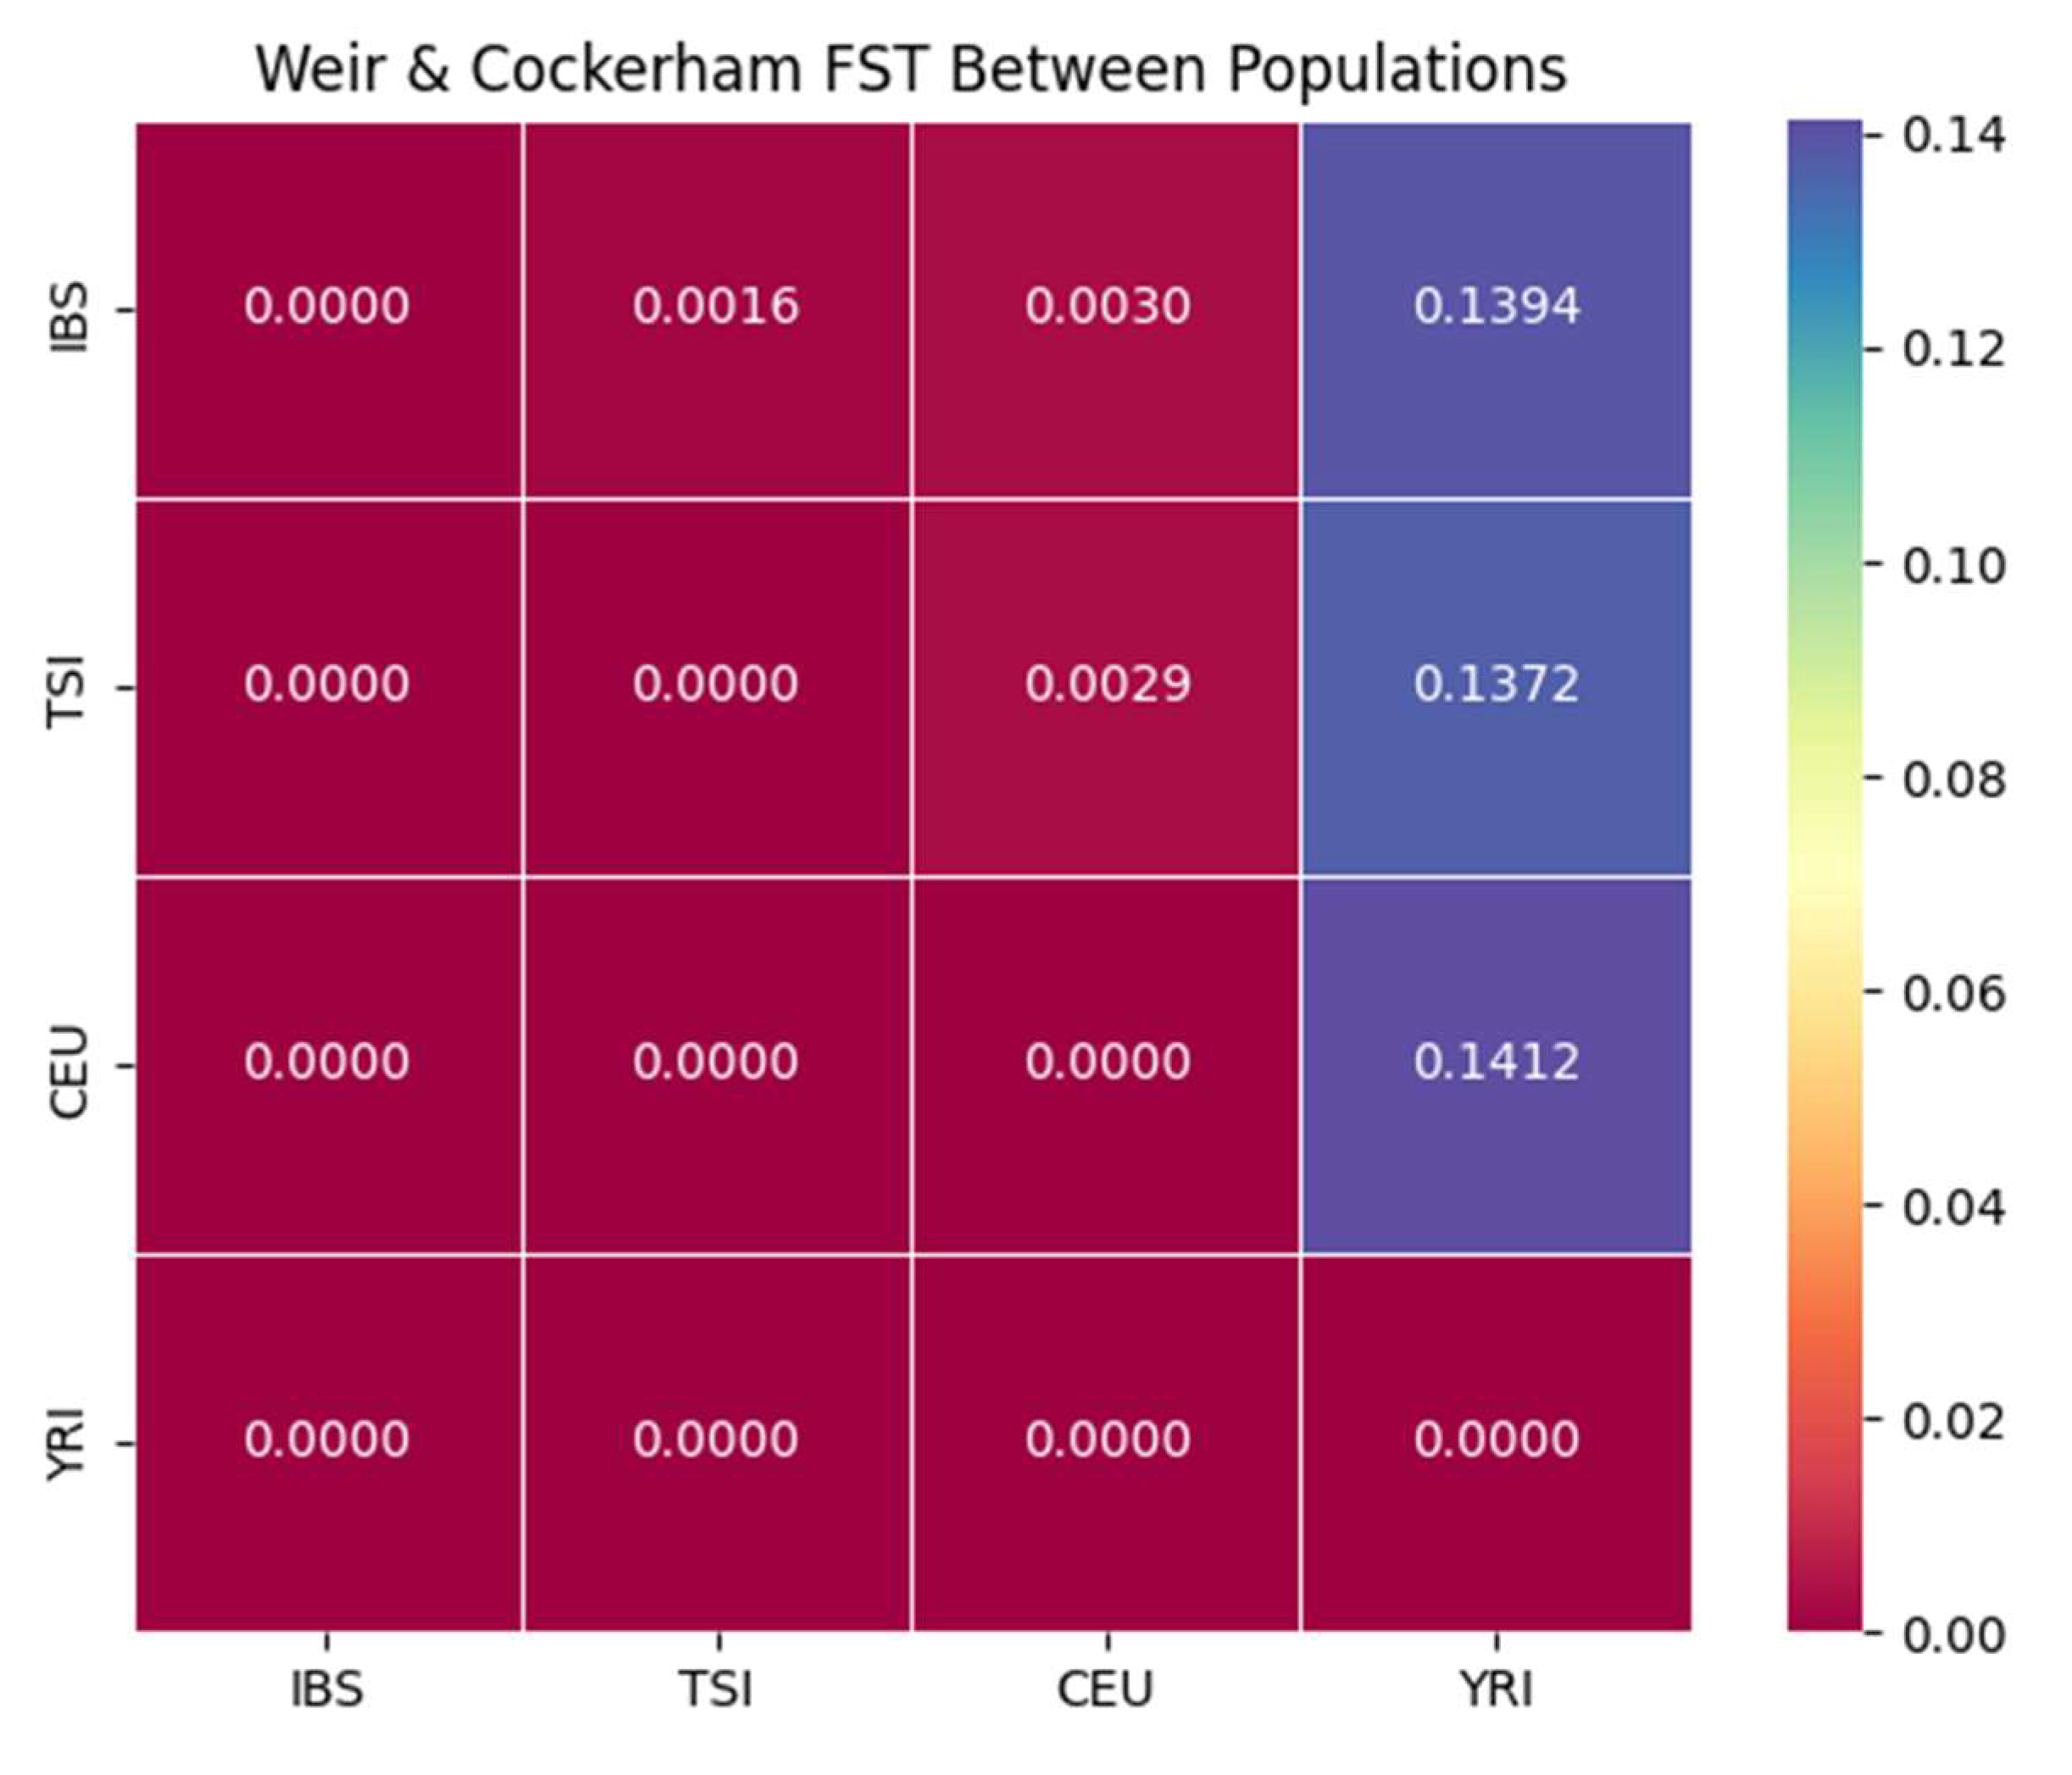
Figure 7.
MDS of Genetic Distances.
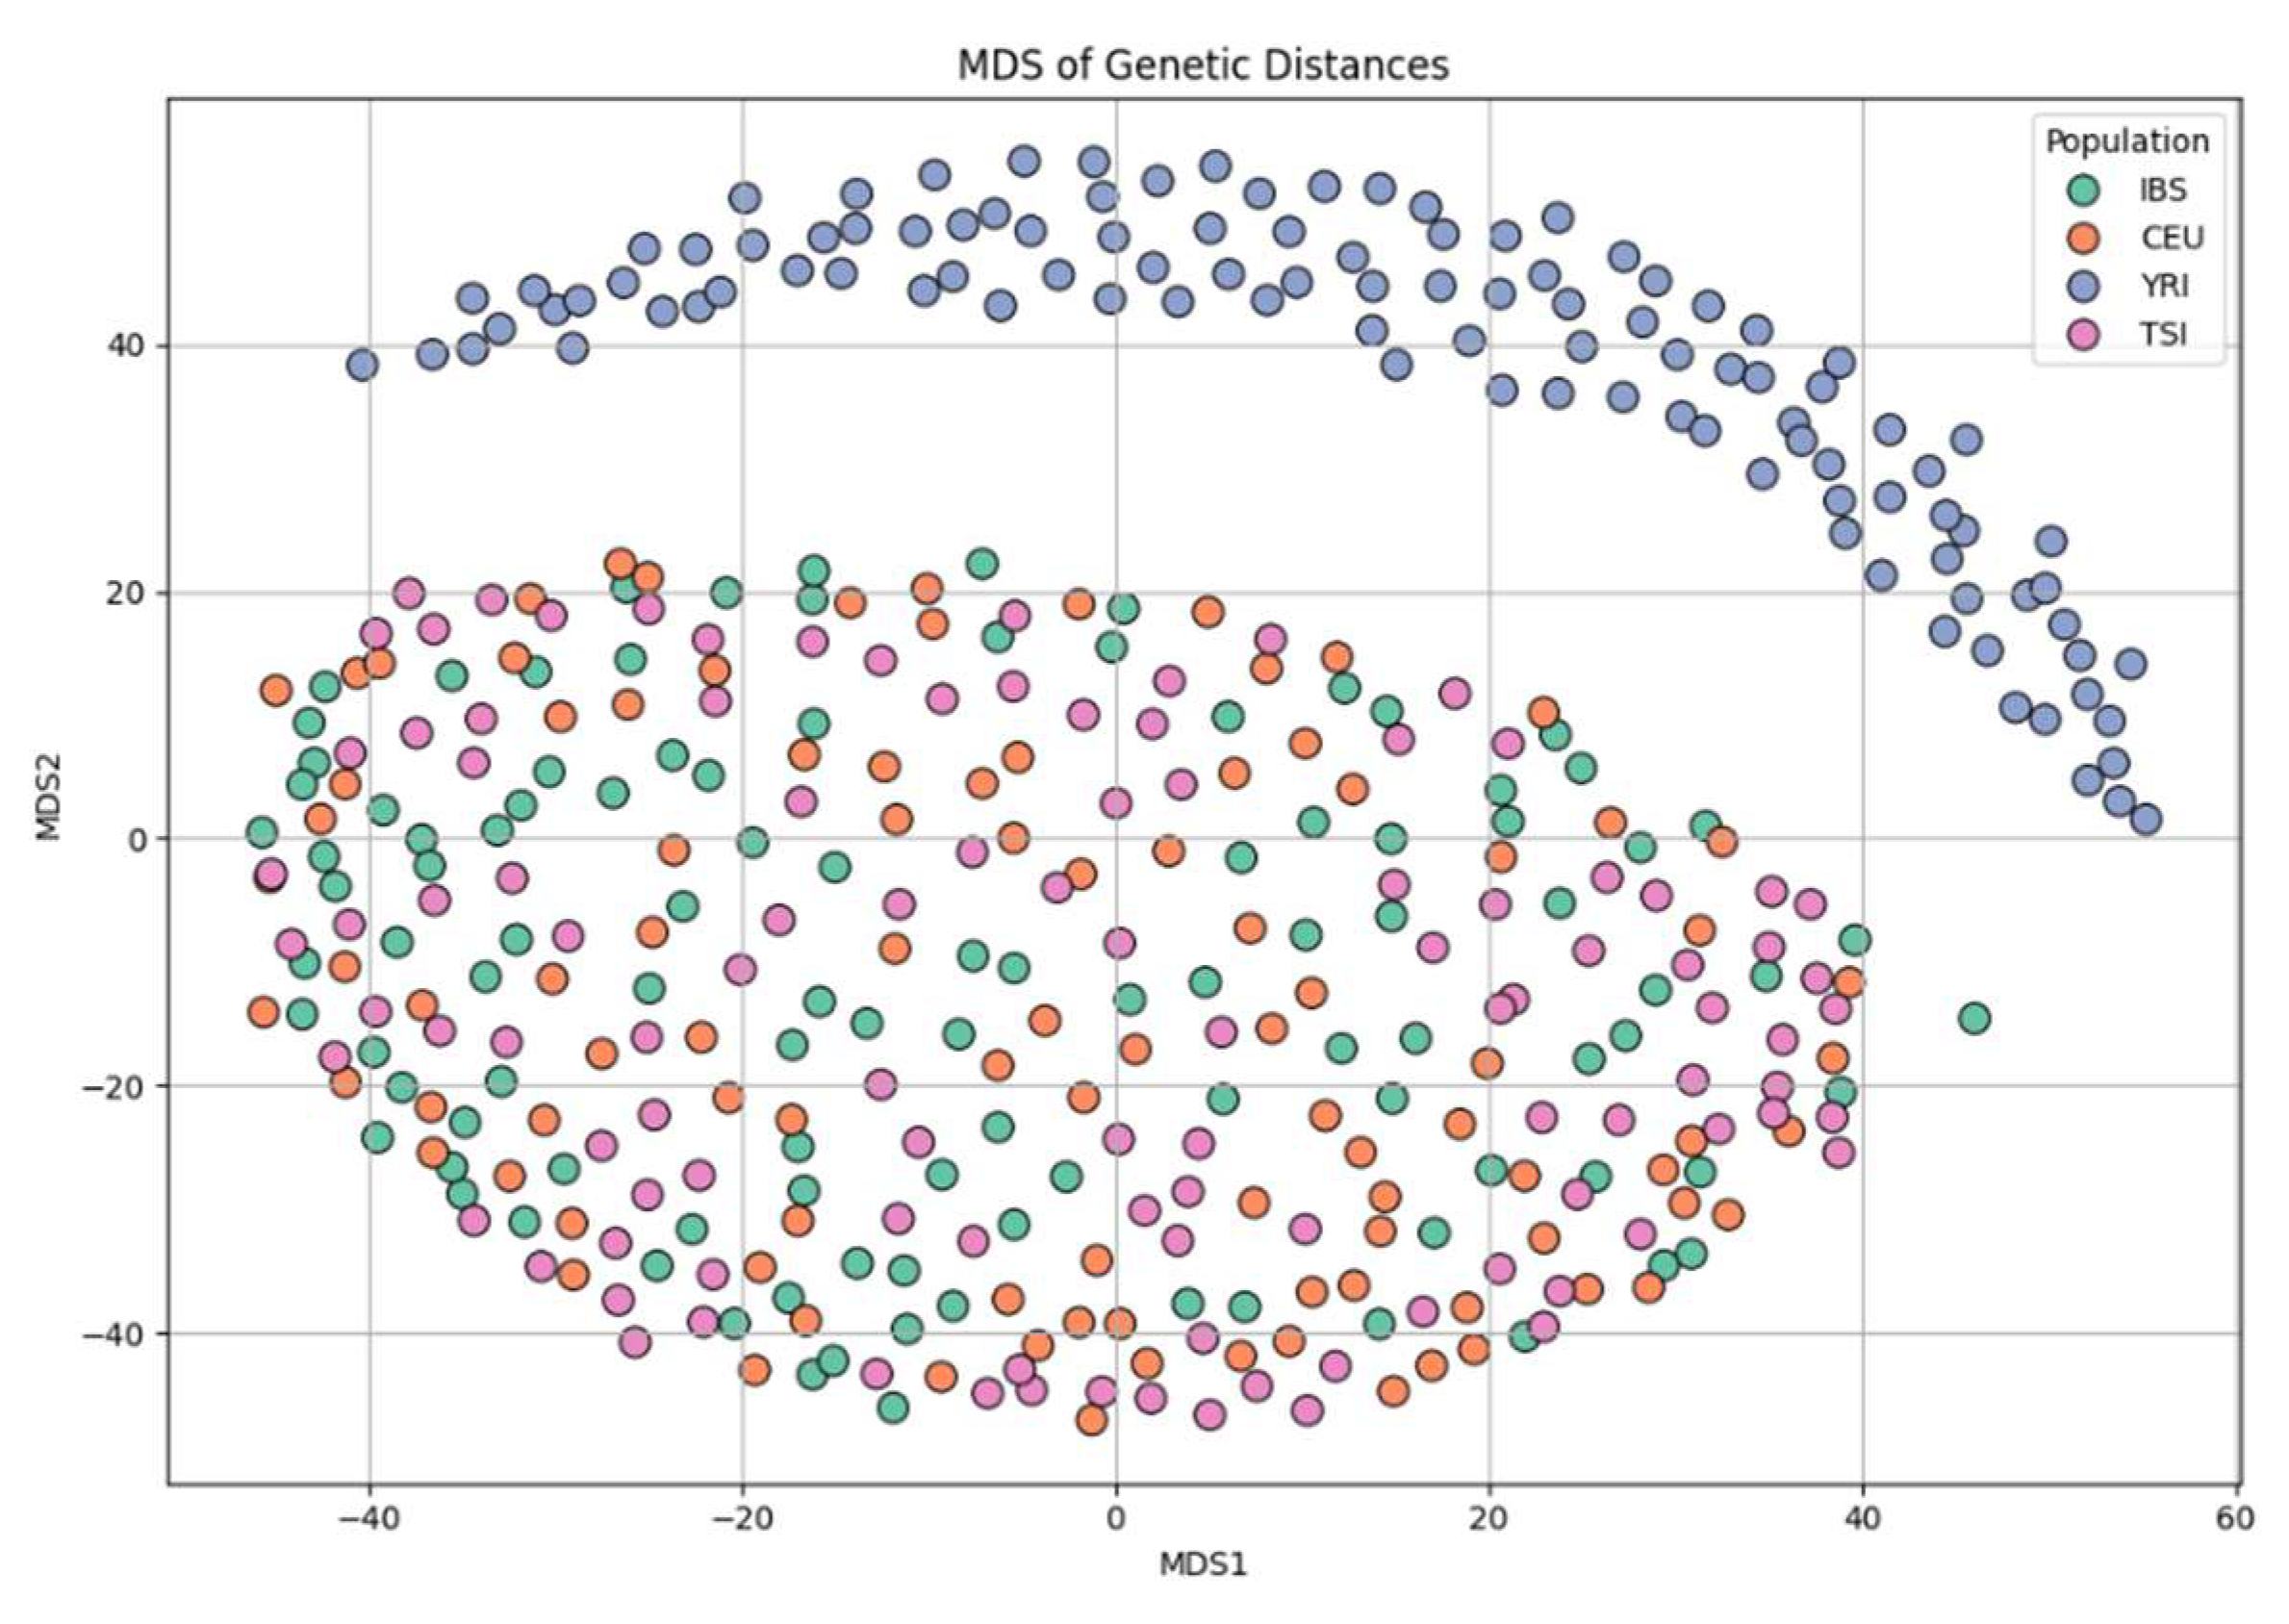
Figure 8.
Phylogenetic Tree (Hierarchical Clustering).
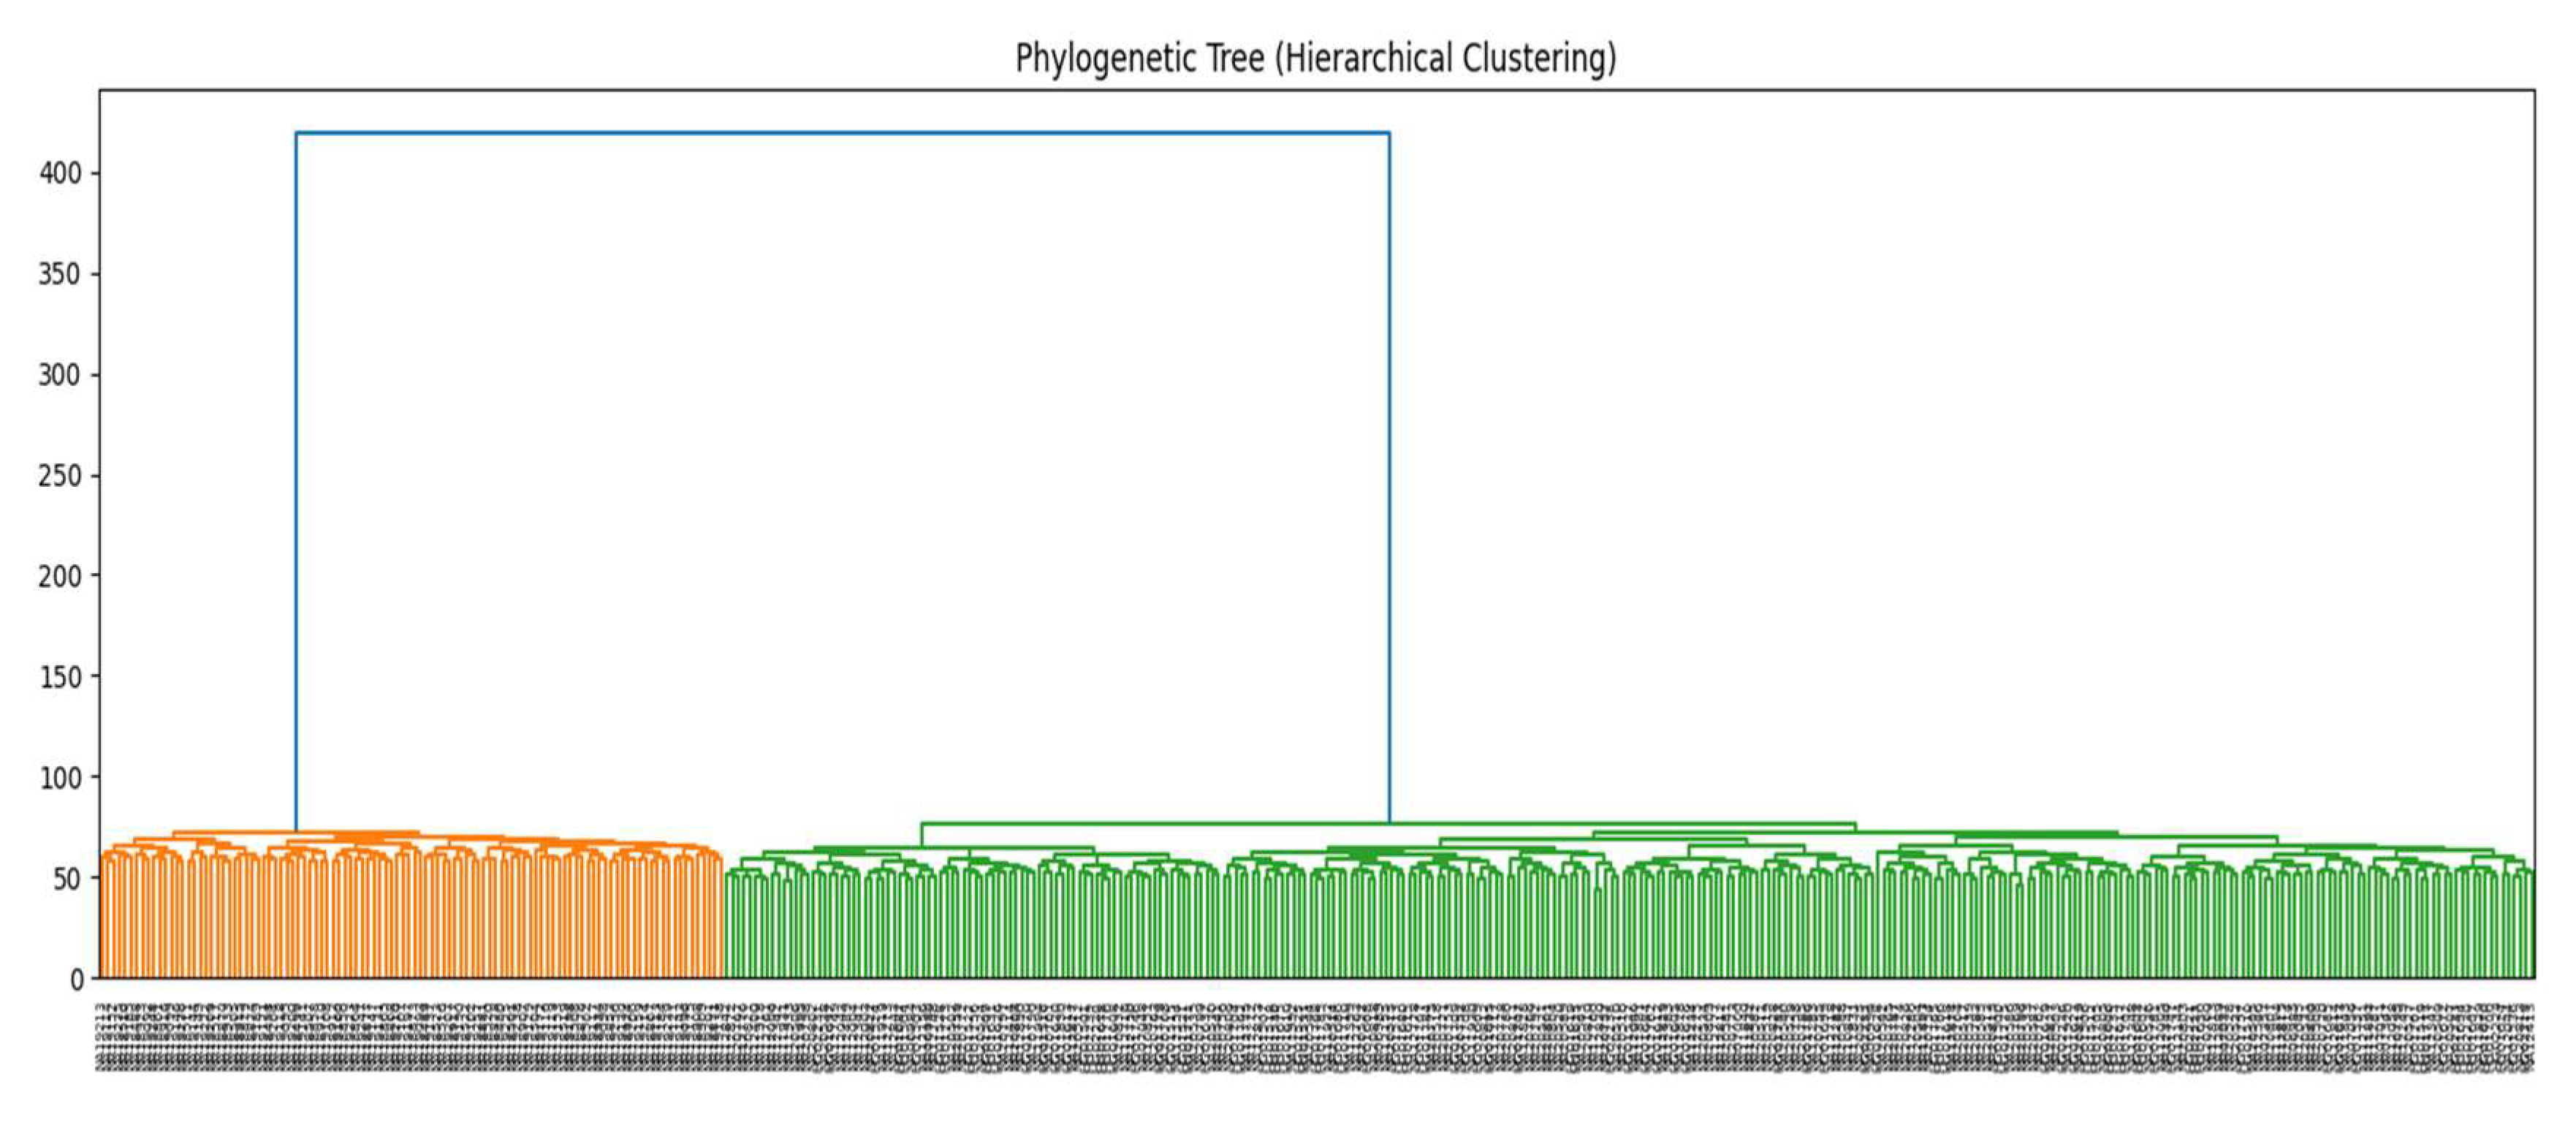

Table 1.
Pairwise Weir & Cockerham FST Between Populations.
| IBS | TSI | CEU | YRI | |
| IBS | 0 | 0.0016 | 0.003 | 0.1394 |
| TSI | 0 | 0 | 0.0029 | 0.1372 |
| CEU | 0 | 0 | 0 | 0.1412 |
| YRI | 0 | 0 | 0 | 0 |
Disclaimer/Publisher’s Note: The statements, opinions and data contained in all publications are solely those of the individual author(s) and contributor(s) and not of MDPI and/or the editor(s). MDPI and/or the editor(s) disclaim responsibility for any injury to people or property resulting from any ideas, methods, instructions or products referred to in the content. |
© 2025 by the authors. Licensee MDPI, Basel, Switzerland. This article is an open access article distributed under the terms and conditions of the Creative Commons Attribution (CC BY) license (http://creativecommons.org/licenses/by/4.0/).
Copyright: This open access article is published under a Creative Commons CC BY 4.0 license, which permit the free download, distribution, and reuse, provided that the author and preprint are cited in any reuse.


