Submitted:
10 July 2025
Posted:
11 July 2025
You are already at the latest version
Abstract
N-Nitroso drug substance-related impurities (NDSRIs) have raised major safety concerns due to their genotoxic potential in pharmaceutical products. In this study, we developed and validated a sensitive LC-MS/MS method based on hydrophilic interaction liquid chromatography (HILIC) for the quantification of N-nitroso-desloratadine (NO-desloratadine). To minimize matrix effects from excess active pharmaceutical ingredient (API), the method was optimized to elute the NDSRI prior to the API. The method demonstrated excellent specificity, linearity (1–50 ng/mL, r² > 0.999), and sensitivity, with a limit of quantification (LOQ) of 1.0 ng/mL. Validation confirmed acceptable precision, accuracy, robustness, and system suitability in accordance with regulatory guidelines. NO-desloratadine was detected in both APIs and finished dosage forms at levels below the acceptable intake threshold based on the Carcinogenic Potency Categorization Approach (CAPA). Furthermore, the method was successfully applied to other structurally diverse NDSRIs, including NO-fluoxetine and NO-betahistidine, without modification. This HILIC-based LC-MS/MS approach offers a broadly applicable and reliable platform for the routine analysis of trace-level NDSRIs in pharmaceutical matrices.
Keywords:
NDSRIs
; LC-MS/MS
; HILIC
; NO-Desloratadine
; genotoxic impurities
; method validation
; pharmaceutical analysis
1. Introduction
Genotoxic impurities (GTIs) in pharmaceuticals pose a unique safety concern due to their potential to cause DNA damage, leading to mutations and carcinogenesis even at very low exposure levels [1,2]. Regulatory agencies such as the International Council for Harmonization (ICH) have established guidelines, notably ICH M7(R2), to limit patient exposure to such compounds by setting threshold values like the acceptable daily intake (ADI) based on carcinogenic risk [3,4]. Traditionally, a default threshold of toxicological concern (TTC) value of 1.5 µg/day has been applied when com-pound-specific carcinogenicity data are unavailable [5].
Valsartan active pharmaceutical ingredients (API) and finished dosage form (FDF) have been found to contain nitrosamine impurities, such as N-Nitrosodimethylamine (NDMA) and N-Nitrosodiethylamine (NDEA), which are small-molecule genotoxic impurities, at levels exceeding acceptable daily intake based on the available com-pound-specific carcinogenicity data [6]. As a result, certain FDF have been recalled or withdrawn from the market, sparking a global issue.
Recently, since 2021, there have been frequent cases of Varenicline, Sitagliptin and Amoxapine etc., where secondary and tertiary amines contained in API react with nitrite ions present in the surrounding environment during various stages of the manufacturing process or storage under acidic conditions, forming nitrosamine drug sub-stance-related impurities (NDSRIs). Nitrite can be converted to dinitrogen trioxide or nitrous acid ion by forming nitrous acid under acidic conditions. Both forms result in genotoxic NDSRIs by liberating hydrogen from secondary amines and adding NO group to the nucleophilic nitrogen of APIs or degradation products [7,8].
Regulatory alerts, such as those from the U.S. FDA, EMA, and other health authorities, have emphasized the need for robust risk assessment and control strategies for these NDSRIs impurities. To address this, the Carcinogenic Potency Categorization Approach (CPCA) was introduced as a science-based framework to estimate ADIs using structure-activity relationships and available rodent carcinogenicity data. CPCA classifies nitrosamines into five categories based on their predicted or known carcinogenic potency. This classification is informed by structural motifs, presence of activating or deactivating groups, and comparison with analogs that have been tested in long-term rodent bioassays. For each category, a default ADI value is assigned, for example, 1,500 ng/day for Category 5 (lowest concern) down to 18 or 26.5 ng/day for Category 1 (highest concern) [3,9].
According to the U.S. FDA, the number of NDSRIs with recommended acceptable intake (AI) limits that could theoretically be generated 284 items by June 2025. This presents a challenge in developing an analytical method for each NDSRIs corresponding to the number of APIs. It is extremely difficult and time-consuming to establish in-dividual analysis methods for each of the numerous NDSRIs, and it is difficult for pharmaceutical companies to respond to each item, and there is a possibility that it may not be useful in practice. Therefore, there is a need for the development of a versatile analysis method that can be applied to the analysis of NDSRIs with different structures using a single NDSRI analysis method.
NDSRIs impurities exist in API or FDF at the nanogram scale, requiring high-sensitive analytical instruments, such as LC-MS/MS system. In a recent study, NDSRIs were analyzed using a reversed-phase porous graphitic carbon column and supercritical fluid chromatography high-resolution mass spectrometry (SFC-HR-MS), although most of other APIs and related nitroso-APIs could not be well separated [10,11,12]. Furthermore, in the reverse-phase column mode commonly used for pharmaceutical analysis, NDSRIs—which are trace impurities that are structurally similar to the API—elute after the API has eluted, even under optimal conditions. This can obscure small NDSRIs peaks behind API peaks, increasing significant matrix effects and making quantitative analytical challenges. Therefore, to overcome these limitations, we designed that eluting NDSRIs earlier than the corresponding API using HILIC mode, similar to normal phase mode, would be advantageous for quantification.
We performed analytical method validation using N-nitroso Desloratadine (NO-Desloratadine) as the analyte. NO-Desloratadine is the nitrosated form of desloratadine with a piperidine structure. We established this method by examining separation conditions and detection sensitivity using a HILIC column. We then applied this method to other NDSRIs such as NO-Fluoxetine and NO-Betahistidine with different structures to expand its applicability.
2. Materials and Methods
2.1. Materials and Reagents
The acetonitrile and water used as eluents were purchased as HPLC grade solvents. High-purity formic acid was purchased from Merck Co. and added to the eluent for use. Desloratadine (API), and N-nitroso Desloratadine (NO-Desloratadine), a generated impurity, and all other pharmaceutical standards NO-Fluoxetine, Fluoxetine, NO-Betahistidine and Betahistidine were purchased from Toronto Research Chemicals and used in the study (Table 1). All other reagents used in the experiments were of analytical grade or higher quality.
2.2. Standard Solutions and Sample Pretreatment
Prepare a stock solution by dissolving 1 mg of NO-Desloratadine in 1 ml of acetonitrile. Dilute the stock solution with acetonitrile to achieve a working concentration of 100 ng/ml, then dilute the required volume of acetonitrile to attain concentrations of 1, 2, 5, 10, 25 and 50 ng/ml. The stock solution of NO-Desloratadine-d4 was diluted with acetonitrile to attain a working concentration of 100 ng/ml.
Five milligrams of the drug substance Desloratadine were taken and diluted with acetonitrile to make a total volume of 10 mL. For the drug products, more than 20 Desloratadine tablets were weighed, crushed, and 5 mg of Desloratadine was diluted with acetonitrile to a final volume of 10 mL. The concentration was calculated and used to make appropriate concentration. After getting the final volume to be 10 mL, it was mixed for 5 minutes using a mixer. Then, the sample was spun at 4,000 rpm for 10 minutes in a centrifuge. Finally, it was filtered with a 0.22 µm PVDF membrane filter and used (Figure 1).
2.3. LC-MS/MS Analysis by HILIC Separation Mode
We used an ABSciex triple quadrupole 3200 Mass spectrometer, which is connected to a Shiseido nanospace SI-2 HPLC system, to perform the analysis. The software version used was ABSciex 1.4.2. The XBridge HILIC column (2.1 × 150 mm, 3.5 μm) was used at a constant temperature of 40°C and operated in isocratic mode. The mobile phase was made up of two parts: (A) 0.01% (v/v) formic acid in water and (B) 0.01% (v/v) formic acid in acetonitrile. The flow rate was 0.15 mL/min, and the injection volume was 5 μL.
The optimized positive electrospray ionization (ESI) probe was operated in multiple reaction monitoring (MRM) mode. The ion spray voltage (V) was kept at 5500, the curtain gas at 20 psi, the collision gas at 7 psi, the temperature at 300 °C, and GS1 and GS2 at 10 psi each. The MRM conditions of Desloratadine, NO-Desloratadine, and NO-Desloratadine-d4 are shown in Table 2.
2.4. Method Validation
This method has been validated for specificity, linearity, precision, accuracy, system suitability, limit of quantification (LOQ), limit of detection (LOD), and robustness. Standard solutions diluted with acetonitrile were used to determine specificity, linearity, LOQ, and LOD. Specificity was evaluated by the presence or absence of interfering substances at the same retention time as the analyte. Linearity was determined using the correlation coefficient (R²) values of calibration curves obtained using standard solutions over three days. The signal-to-noise ratio (S/N ratio) of 10 was accepted for the LOQ, and an S/N ratio of 3 was accepted for the LOD. Acetonitrile solutions were extracted from drug substances or pharmaceuticals, and NO-Desloratadine and NO-Desloratadine-d4 were added to prepare samples for precision, accuracy, and system suitability tests. Precision and accuracy were measured at three different concentrations and evaluated using relative standard deviation (RSD, %) and recovery rate (%). Low-concentration-added samples were injected six times, and RSD% was calculated to evaluate system suitability.
2.5. Method Validation
The established analytical method was applied to two types of N-nitroso fluoxetine (NO-Fluoxetine) and N-nitroso betahistidine (NO-Betahistidine) classified as CPCA category 1 for high toxicity. Using the methods described in the Materials and Methods section, we validated the sample pretreatment and LC-MS/MS analytical method under the same conditions as NO-Desloratadine, including separation efficiency on the HILIC column and analytical sensitivity.
3. Results
3.1. Column Selection for N-Nitroso Desloratadine(NO-Desloratadine)
First, we searched for examples of NO-Desloratadine separation to select a separation column. Fortunately, Schmidtsdorff et al. published a paper in 2022 reporting an example of NO-Desloratadine separation [12]. However, the separation mechanism was not the typical reverse phase separation, but rather a method that used supercritical fluids for separation followed by analysis with a mass spectrometer. Supercritical mass spectrometry is difficult to operate and not widely used, so it had limitations as a general separation method. Therefore, we focused on columns based on reverse-phase or HILIC mechanisms, which are suitable for general chromatography. The characteristics of the evaluated columns are summarized in Table 3.
Using four columns with different selectivity, gradient elution was performed with water and acetonitrile, each containing 0.01% formic acid, to observe the separation of the API Desloratadine and NO-Desloratadine using a UV detector (278 nm). To minimize analysis time, the total separation time was set to within 8 minutes. As shown in Figure 2, in reverse phase mode, the impurity NO-Desloratadine eluted later than Desloratadine and was well separated (elution time approximately 5–7 minutes) (Figure 2a and 2b). In this condition, the API eluted in approximately 2 minutes, and under these conditions, sufficient separation is considered to have been achieved. However, since the concentration of the API is typically thousands of times higher than that of impurities, even under conditions with sufficient separation, the quantification of trace impurities eluting later may be affected. As shown in Figure 2a and 2b, Desloratadine exhibits slight peak tailing, which is considered to potentially affect the quantification of the impurity NO-Desloratadine.
Next, we evaluated the separation efficiency in HILIC mode. Generally, HILIC mode exhibits selectivity like that of normal phase separation mode. Therefore, we set the initial concentration of the organic solvent acetonitrile to a high value and gradually reduced it over the analysis time to optimize the separation conditions. As shown in Figure 2c, in the Luna column, the API Desloratadine eluted first, and the separation efficiency from NO-Desloratadine was good. However, as mentioned earlier, we determined that analyzing the impurity NO-Desloratadine was difficult at high API concentrations.
Ultimately, in the selected XBridge column, under the same conditions as the Luna column, the impurity NO-Desloratadine eluted first at approximately 3 minutes. On the other hand, the API, Desloratadine, eluted between 4.5 and 5.5 minutes, but exhibited severe peak tailing (Figure 2d). Under these separation conditions, since the impurity NO-Desloratadine elutes first, it was considered that this separation condition would allow for easy quantification of impurities under actual conditions where excess API is present. Another important point is that NO-Desloratadine is rapidly eluted, resulting in a sharp peak shape, which is advantageous for quantification. In addition, the divert line completely removes Desloratadine that eluted later so that it does not enter the MS/MS detector.
3.2. Effects of Changes in Formic Acid Concentration
In LC-MS/MS system, formic acid (pKa ≈ 3.75) improves ionization in positive ESI mode by providing protons for [M+H]⁺ formation and enhancing sensitivity and thus maintaining MS compatibility due to its volatility. To establish optimal separation conditions for NO-Desloratadine in the XBridge column, we investigated the optimal concentration of formic acid to be added to mobile phases A and B. As a result, as the formic acid concentration was increased from 0.01% to 0.1% and then to 1.0%, there was no significant change in the elution time of NO-Desloratadine, but the elution time of Desloratadine tended to decrease progressively(Figure 3). The reason for this is that many HILIC columns (e.g., silica, zwitterionic, bare silica) have residual negatively charged silanol groups. Formic acid causes protonation, reducing the negative charge at these sites and decreasing the cation exchange interaction with protonated desloratadine [13,14]. This results in reduced electrostatic retention and enhanced elution. Therefore, separation conditions that keep the API Desloratadine and the impurity NO-Desloratadine as far apart as possible are desirable. We established the optimal conditions for analysis by adding 0.01% formic acid to both eluent A and eluent B.
3.3. Optimized Conditions for NO-Desloratadine Analysis by LC-MS/MS
To confirm the MRM transition, NO-Desloratadine and NO-Desloratadine-d4 (IS) standard solution were injected directly into the mass spectrometer. Both compounds predominantly generated [M+H]+ form at m/z 340.1 and m/z 344.3 as precursor ions in positive ion mode [15,16]. The precursor ions then produced fragment ions in the collision energy product ion scan mode. The product ion mass spectra obtained by selecting these precursor ions are shown in Figure 4. For NO-Desloratadine, m/z 310.1 was the abundant product ion corresponding to [M+H-NO]+. NO-Desloratadine-d4, which was used as an internal standard in our study, had the same pattern, so m/z 314.1 was obtained for the major product ion. These results indicate that NO-Desloratadine has the characteristic of always preferentially removing the NO group. Therefore, MRM transitions of m/z 340.1 → 310.1 were selected for NO-Desloratadine quantification, and m/z 344.3 → 314.1 for NO-Desloratadine-d4 (IS).
3.4. Method Validation
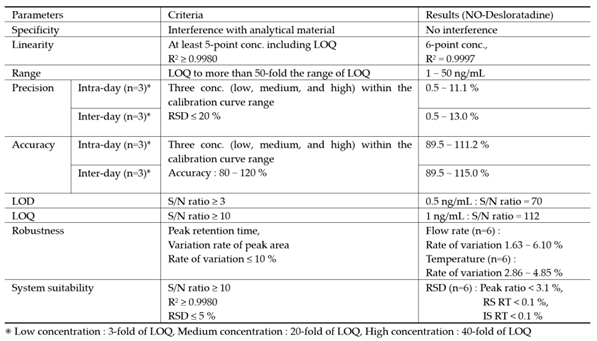
3.4.1. Specificity
The specificity was evaluated by analyzing blank acetonitrile, NO-Desloratadine standard solutions to ensure that NO-Desloratadine was well-resolved and free from interference. No significant interference was observed at the retention time or MRM transitions of NO-Desloratadine and NO-Desloratadine-d4, confirming the method's specificity (Figure 5).
3.4.2. Linearity and LOD, LOQ Values
Linearity was assessed by preparing a set of 6 different concentrations of 1, 2, 5, 10, 25, and 50 ng/mL of NO-Desloratadine in acetonitrile. Each standard solution was analyzed in triplicate, and the calibration curve was drawn by peak ratio using NO-Desloratadine-d4 as internal standard was generated using a least-squares linear regression. The correlation coefficient (r²) was ≥ 0.99, and the accuracy of each calibration point met the acceptance criteria defined in regulatory guidelines (±20% at LLOQ), confirming the method’s linear response across the tested range (Table 4).
The detection limit (LOD) and quantification limit (LOQ) required sufficiently high sensitivity conditions to quantify impurities of NO-Desloratadine at levels of 10% or less of the regulatory limit in FDF. Therefore, when a NO-Desloratadine standard solution equivalent to 1.0 ng/mL (10% of the regulatory limit) was injected into the LC-MS/MS system three times, the signal-to-noise (S/N) ratio averaged 112. At 0.5 ng/mL of NO-Desloratadine, the S/N ratio was an average of 70. Therefore, despite sufficient analytical sensitivity, the LOD and LOQ for this analytical method were conveniently set at 0.5 ng/mL and 1.0 ng/mL, respectively.
3.4.3. Accuracy and Precision
To verify precision and accuracy, three different concentrations (3, 20, and 40 ng/mL) of NO-Desloratadine within the calibration range were added to the drug substance, drug product, and excipient (cellulose), and three measurements were verified.
The results of the intra-day precision test showed that the precision ranged from a minimum of 89.5% to a maximum of 111.2%, satisfying the criteria (criteria: 80~120%). Additionally, the precision ranged from a minimum of 0.5% to a maximum of 11.1%, meeting the standard (standard: within 20%). The results of the inter-day test showed that the precision ranged from a minimum of 89.5% to a maximum of 115.0%, meeting the standard (standard: 80~120%), and the reproducibility ranged from a minimum of 0.5% to a maximum of 13.0%, meeting the standard (standard: within 20%) (Table 5).
3.4.4. Robustness
We intentionally varied the total flow rate of the eluent in chromatography and the temperature of the column oven within a ±10% deviation range from the established conditions to verify the robustness of the quantitative method. The flow rate of the mobile phase increased and decreased from the initial 0.150 mL/min to 0.135 mL/min or 0.165 mL/min, respectively, corresponding to a ±10% change. The column oven temperature was also changed from 40°C to 36°C or 44°C, respectively. Under these modified conditions, six independent injections of the sample were performed, and the peak areas were compared. The results showed that the robustness of the method was satisfactory within 10% for both flow rate changes and column oven temperature changes. (Table 6). Therefore, the intentionally modified flow rate and column oven temperature did not affect the quantification of NO-Desloratadine.
3.4.5. System Suitability
The results of measuring a sample with a concentration of 1 ng/mL (LOQ) by repeatedly injecting it six times showed that the precision of the peak area ratio, NO-Desloratadine, and IS elution time were 3.1%, 0.1%, and 0.1%, respectively, meeting the criteria of RSD within 5% (Table 7).
3.5. NO-Desloratadine Levels in Medicines Available on the Market
To measure the contamination level of NO-Desloratadine impurities in API and FDF of Desloratadine, we quantified the contamination levels using an established LC-MS/MS method in MRM mode. The results showed that the contamination levels of NO-Desloratadine were found at an average of 1.48 ppb in API and 1.80 ppb in FDF (Figure 6). When converted to acceptable intake, the concentrations were 2.96 ppm and 3.60 ppm in API and FDF, respectively. The concentration detected in both API and FDF were below the acceptable intake of 8.89 ppm for the maximum daily dose (45 mg/day Desloratadine) for NO-Desloratadine calculated using the CPCA category 3 ( 400 ng/day).
If more than 10% (more than 0.89 ppm) of the acceptable intake is detected in the sample, specific control strategy is required. Therefore, a thorough review process is necessary for potential contamination sources such as API, synthetic reagents, solvents, and synthesis processes for Desloratadine. For FDF, there is a high risk of NO-Desloratadine being generated due to nitrite contamination sources during the complex formulation process, so more precise review is required.
3.6. Applications to Other NDSRIs
The established analytical conditions were directly applied to NO-Fluoxetine and NO-Betahistidine, which are pharmaceutical impurities with chemical structures different from NO-Desloratadine, within NDSRI, to verify the validity of this analytical method. NO-Fluoxetine eluted first under the same separation conditions as NO-Desloratadine and was clearly separated from Fluoxetine (Figure 7a). Under MS/MS conditions, the correlation coefficient (r²) value was 0.9998 within the range of 1–50 ng/mL. System suitability and precision were confirmed to meet the criteria with peak area of 4.96% and retention time of 3.61%. The LOQ was confirmed to be 1 ng/mL, with an S/N ratio of 39 (Figure 7b). NO-Betahistidine was also eluted first and clearly separated from Betahistidine (Figure 7c). Under MS conditions, the correlation coefficient (r²) value was 0.9999 in the range of 1–50 ng/mL. System suitability and precision were within the criteria, with peak area at 3.65% and retention time at 0.42%. The LOQ was confirmed to be 1 ng/mL, with an S/N ratio of 81 (Figure 7d). Therefore, this assay has been demonstrated to be applicable not only to NO-Desloratadine but also to other NDSRI compounds with different structures, such as NO-Fluoxetine and NO-Betahistidine.
4. Discussion
Using a HILIC column, we established LC separation conditions in which NDSRI elutes first and API elutes later and established a high-sensitivity analytical method for NO-Desloratadine using LC-MS/MS. NO-Desloratadine has previously been analyzed using supercritical fluid chromatography, but supercritical fluid chromatography equipment is not widely available [12].
HILIC column uses a high percentage of organic solvents (typically acetonitrile), which enhances desolvation and ionization efficiency in ESI-MS/MS, improving sensitivity. However, it requires a long equilibrium time because the stationary phase is hydrated and surrounded by a water-rich layer, column re-equilibration between injections can be slow and requires precise solvent control [17,18]. Therefore, we used stable isocratic elution (A/B = 20/80,v/v) without changing the composition of the mobile phase solvent, and after analysis, we allowed sufficient stabilization time of 20 minutes until the next injection to enhance the stability of the HILIC column.
A major advantage of this separation method using the HILIC column is that the API elutes later, fundamentally reducing the matrix effect caused by high API concentrations, and the NDSRI elutes quickly, resulting in very sharp peaks, which is advantageous for quantitative analysis.
The sample pretreatment method for analyzing API and FDF was simple and enabled the simultaneous processing of many samples in a short time. Each parameter examined in the analytical method validation was set to criteria acceptable to most regulatory authorities, and the validation results for the NO-Desloratadine analytical method met all the criteria conditions (Table 8).
By applying this method without modifying the sample pretreatment method or LC-MS/MS analysis conditions, we successfully analyzed two structurally distinct NDSRIs, namely NO-Fluoxetine and NO-betahistidine. Therefore, this method is expected to be utilized as a standard analytical method for the analysis of various structurally diverse NDSRIs.
However, although this method is highly versatile, it may be necessary to promptly adjust the analytical conditions to accommodate not only NDSRIs derived from various APIs through nitrosation but also newly identified NDSRIs with different structures, such as thermal decomposition products and diverse metabolites [19].
5. Conclusions
We established an analytical method for NO-Desloratadine by examining separation conditions and detection sensitivity using a HILIC column. We then applied this method to other NDSRIs such as NO-Fluoxetine and NO-Betahistidine with different structures to expand its applicability.
Author Contributions
conceptualization, Y.-M.L.; methodology, M.-J.L. and C.-M.L.; validation, M.-J.L.; formal analysis, M.-J.L., C.-M.L. and H.-G.L.; investigation, C.-M.L. and H.-G.L.; data curation, M.-J.L., C.-M.L. and H.-G.L.; writing—original draft preparation, M.-J.L., C.-M.L. and Y.-M.L.; writing—review and editing, H.-K.Y., and Y.-M.L. All authors have read and agreed to the published version of the manuscript.
Funding
This work was conducted during the research year of Chungbuk National University in 2022. This research was supported by a grant for the Funding R&D Project funded by the Ministry of Food and Drug Safety, Republic of Korea (2023, 23194MFDS086)
Conflicts of Interest
The authors declare no conflict of interest.
References
- Friscia, O.; Pulci, R.; Fassio, F.; Comelli, R. Chemical reagents as potential impurities of pharmaceutical products: investigations on their genotoxic activity. J Environ Pathol Toxicol Oncol 1994, 13, 89–110. [Google Scholar] [PubMed]
- Humfrey, C.D. Recent developments in the risk assessment of potentially genotoxic impurities in pharmaceutical drug substances. Toxicol Sci 2007, 100, 24–28. [Google Scholar] [CrossRef] [PubMed]
- Kruhlak, N.L.; Schmidt, M.; Froetschl, R.; Graber, S.; Haas, B.; Horne, I.; Horne, S.; King, S.T.; Koval, I.A.; Kumaran, G.; et al. Determining recommended acceptable intake limits for N-nitrosamine impurities in pharmaceuticals: Development and application of the Carcinogenic Potency Categorization Approach (CPCA). Regul Toxicol Pharmacol 2024, 150, 105640. [Google Scholar] [CrossRef] [PubMed]
- Felter, S.P.; Ponting, D.J.; Mudd, A.M.; Thomas, R.; Oliveira, A.A.F. Maximizing use of existing carcinogenicity data to support acceptable intake levels for mutagenic impurities in pharmaceuticals: Learnings from N-nitrosamine case studies. Regul Toxicol Pharmacol 2023, 143, 105459. [Google Scholar] [CrossRef] [PubMed]
- Snodin, D.J. The cancer threshold of toxicological concern (TTC) in relation to foodstuffs and pharmaceuticals: A potentially useful concept compromised by a dubious derivation. Hum Exp Toxicol 2018, 37, 789–802. [Google Scholar] [CrossRef] [PubMed]
- Gomm, W.; Rothlein, C.; Schussel, K.; Bruckner, G.; Schroder, H.; Hess, S.; Frotschl, R.; Broich, K.; Haenisch, B. N-Nitrosodimethylamine-Contaminated Valsartan and the Risk of Cancer-A Longitudinal Cohort Study Based on German Health Insurance Data. Dtsch Arztebl Int 2021, 118, 357–362. [Google Scholar] [CrossRef] [PubMed]
- Burns, M.J.; Ponting, D.J.; Foster, R.S.; Thornton, B.P.; Romero, N.E.; Smith, G.F.; Ashworth, I.W.; Teasdale, A.; Simon, S.; Schlingemann, J. Revisiting the Landscape of Potential Small and Drug Substance Related Nitrosamines in Pharmaceuticals. J Pharm Sci 2023, 112, 3005–3011. [Google Scholar] [CrossRef] [PubMed]
- Schlingemann, J.; Burns, M.J.; Ponting, D.J.; Martins Avila, C.; Romero, N.E.; Jaywant, M.A.; Smith, G.F.; Ashworth, I.W.; Simon, S.; Saal, C.; et al. The Landscape of Potential Small and Drug Substance Related Nitrosamines in Pharmaceuticals. J Pharm Sci 2023, 112, 1287–1304. [Google Scholar] [CrossRef] [PubMed]
- Ponting, D.J.; Czich, A.; Felter, S.P.; Glowienke, S.; Harvey, J.S.; Nudelman, R.; Schlingemann, J.; Simon, S.; Smith, G.F.; Teasdale, A.; et al. Control of N-nitrosamine impurities in drug products: Progressing the current CPCA framework and supporting the derivation of robust compound specific acceptable intakes. Regul Toxicol Pharmacol 2025, 156, 105762. [Google Scholar] [CrossRef] [PubMed]
- Nakka, S.; Katari, N.K.; Muchakayala, S.K.; Jonnalagadda, S.B.; Manabolu Surya, S.B. A novel LC-TQ-MS/MS method for quantifying mefenamic acid-NDSRI (N-nitroso drug substance-related impurity) in mefenamic acid tablet and pediatric suspension dosage forms: a comparative study with a cost-effective white, green, and blue UPLC method. RSC Adv 2025, 15, 1957–1969. [Google Scholar] [CrossRef] [PubMed]
- Vikram, P.R.H.; Kandula, D.R.; Gunta, U.; Kumar, G.; Deka, R.; Chiriki, D.S.; Chethan, K.S.; Bannimath, N.; Yadav, T.; Beeraka, N.M.; et al. NDSRIs Crisis in Pharmaceuticals; Insights on Formation Pathways, Root Causes, Risk Management, and Novel Analytical Techniques. Curr Med Chem 2025, 32, 1065–1081. [Google Scholar] [CrossRef] [PubMed]
- Schmidtsdorff, S.; Neumann, J.; Schmidt, A.H.; Parr, M.K. Risk assessment for nitrosated pharmaceuticals: A future perspective in drug development. Arch Pharm (Weinheim) 2022, 355, e2100435. [Google Scholar] [CrossRef] [PubMed]
- Yeung, D.; Spicer, V.; Krokhin, O.V. Peptide retention time prediction for hydrophilic interaction liquid chromatography at acidic pH in formic-acid based eluents. J Chromatogr A 2024, 1736, 465355. [Google Scholar] [CrossRef] [PubMed]
- Chen, J.; Chen, L.; Li, M.; Sun, Y. Quantitative determination of six steroid alkaloids by sensitive hydrophilic interaction liquid chromatography electrospray ionization mass spectrometry and its application to pharmacokinetic study in rats. Biomed Chromatogr 2019, 33, e4377. [Google Scholar] [CrossRef] [PubMed]
- Hasnain, M.S.; Rao, S.; Singh, M.K.; Vig, N.; Singh, M.K.; Budakoti, S.K.; Ansari, A. Development and validation of an improved LC-MS/MS method for the quantification of desloratadine and its metabolite in human plasma using deutrated desloratadine as internal standard. J Pharm Bioallied Sci 2013, 5, 74–79. [Google Scholar] [CrossRef] [PubMed]
- Ponnuru, V.S.; Challa, B.R.; Nadendla, R. Quantification of desloratadine in human plasma by LC-ESI-MS/MS and application to a pharmacokinetic study. J Pharm Anal 2012, 2, 180–187. [Google Scholar] [CrossRef] [PubMed]
- McCalley, D.V. A study of column equilibration time in hydrophilic interaction chromatography. J Chromatogr A 2018, 1554, 61–70. [Google Scholar] [CrossRef] [PubMed]
- Gritti, F.; Sehajpal, J.; Fairchild, J. Using the fundamentals of adsorption to understand peak distortion due to strong solvent effect in hydrophilic interaction chromatography. J Chromatogr A 2017, 1489, 95–106. [Google Scholar] [CrossRef] [PubMed]
- Planinsek Parfant, T.; Roskar, R. A comprehensive approach for N-nitrosamine determination in pharmaceuticals using a novel HILIC-based solid phase extraction and LC-HRMS. Talanta 2025, 282, 126752. [Google Scholar] [CrossRef] [PubMed]
Figure 1.
Sample preparation scheme.
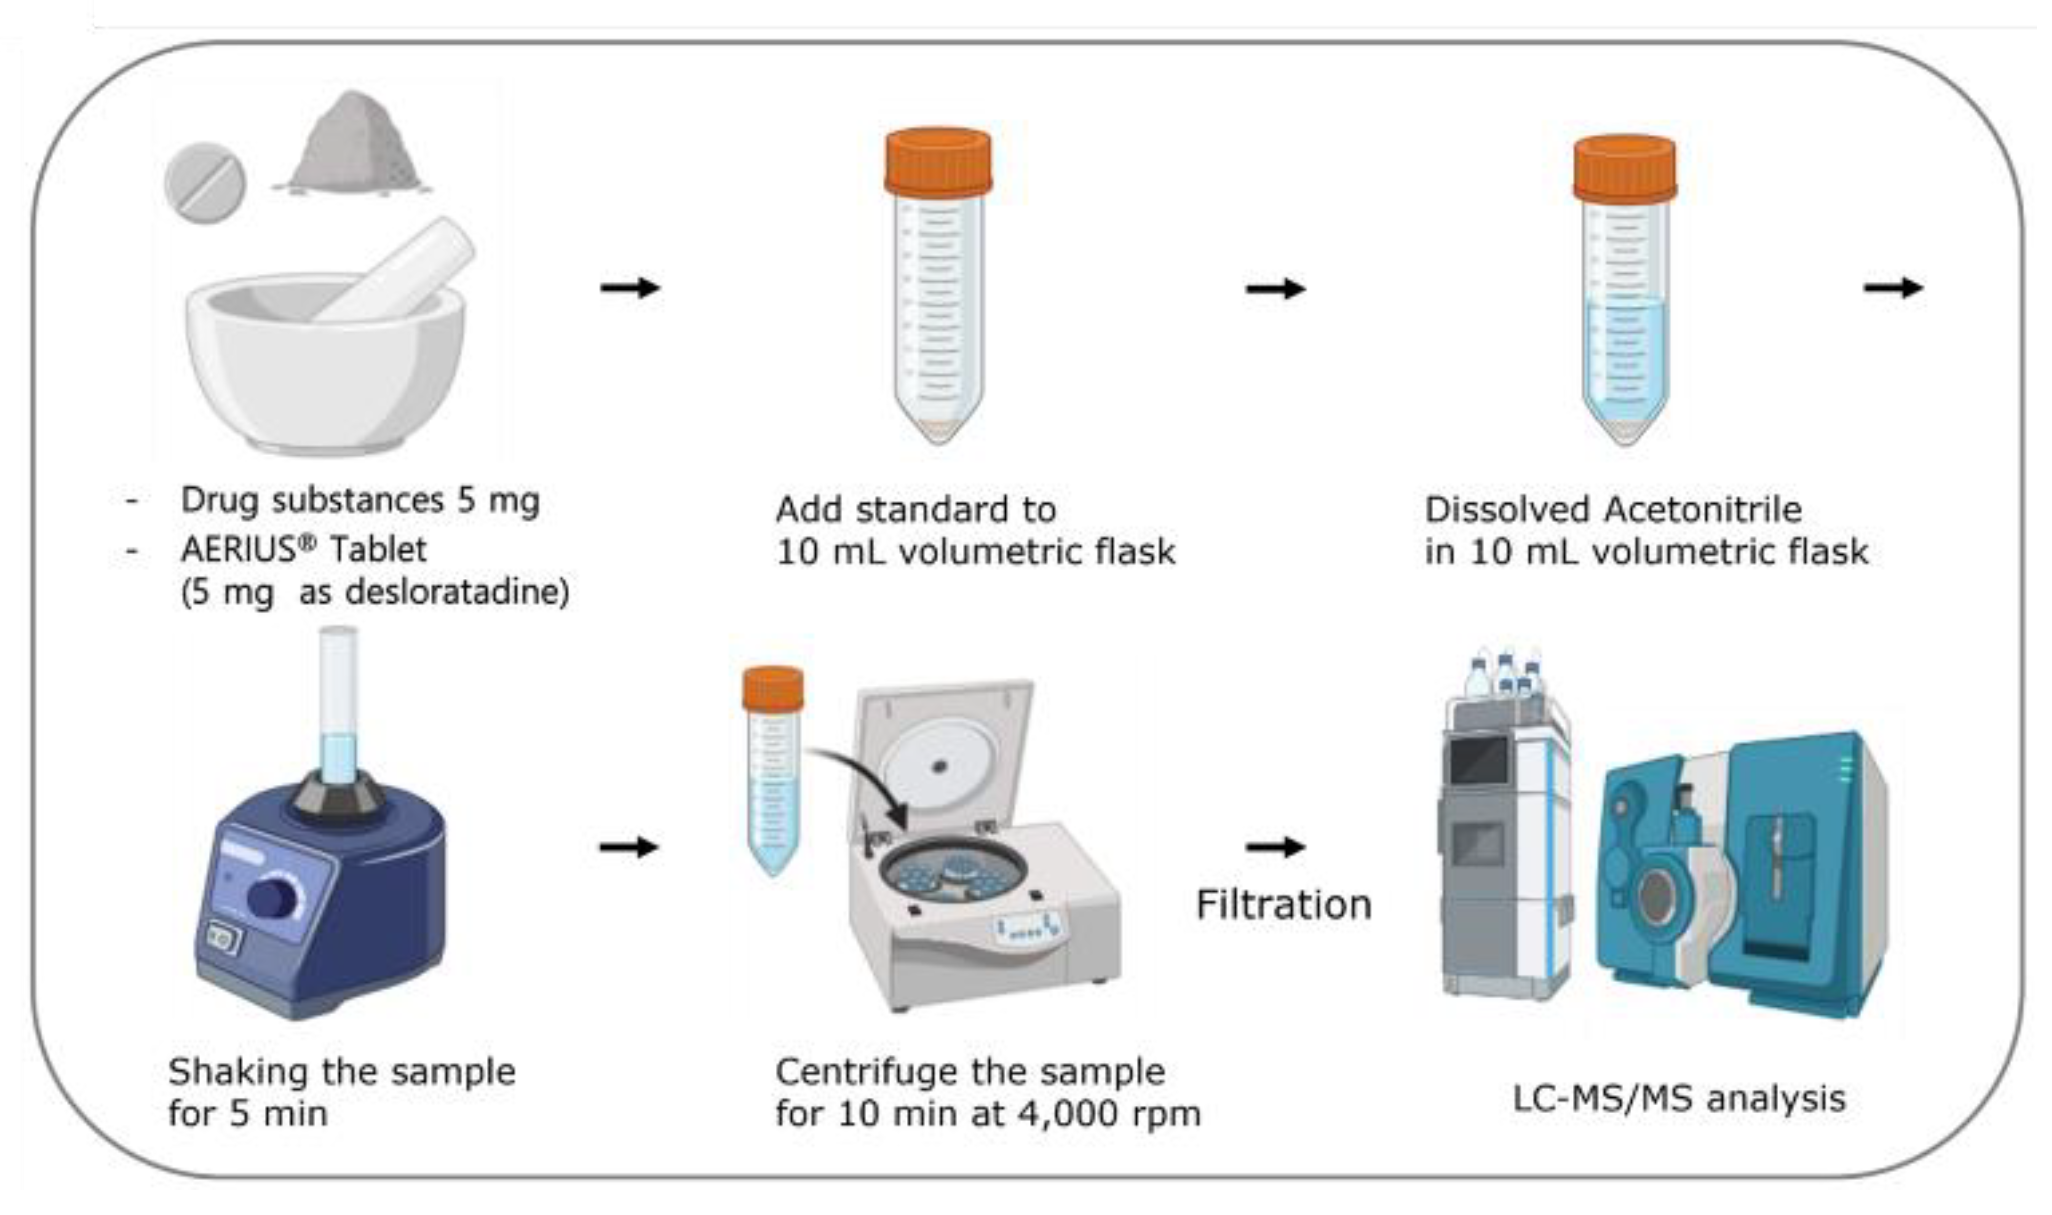
Figure 2.
Column investigation for the optimal NO-Desloratadine separation in Kinetex F5 (a), Hypercarb (b), Luna HILIC (c) and XBridge HILIC (d) at 40℃.
Figure 2.
Column investigation for the optimal NO-Desloratadine separation in Kinetex F5 (a), Hypercarb (b), Luna HILIC (c) and XBridge HILIC (d) at 40℃.
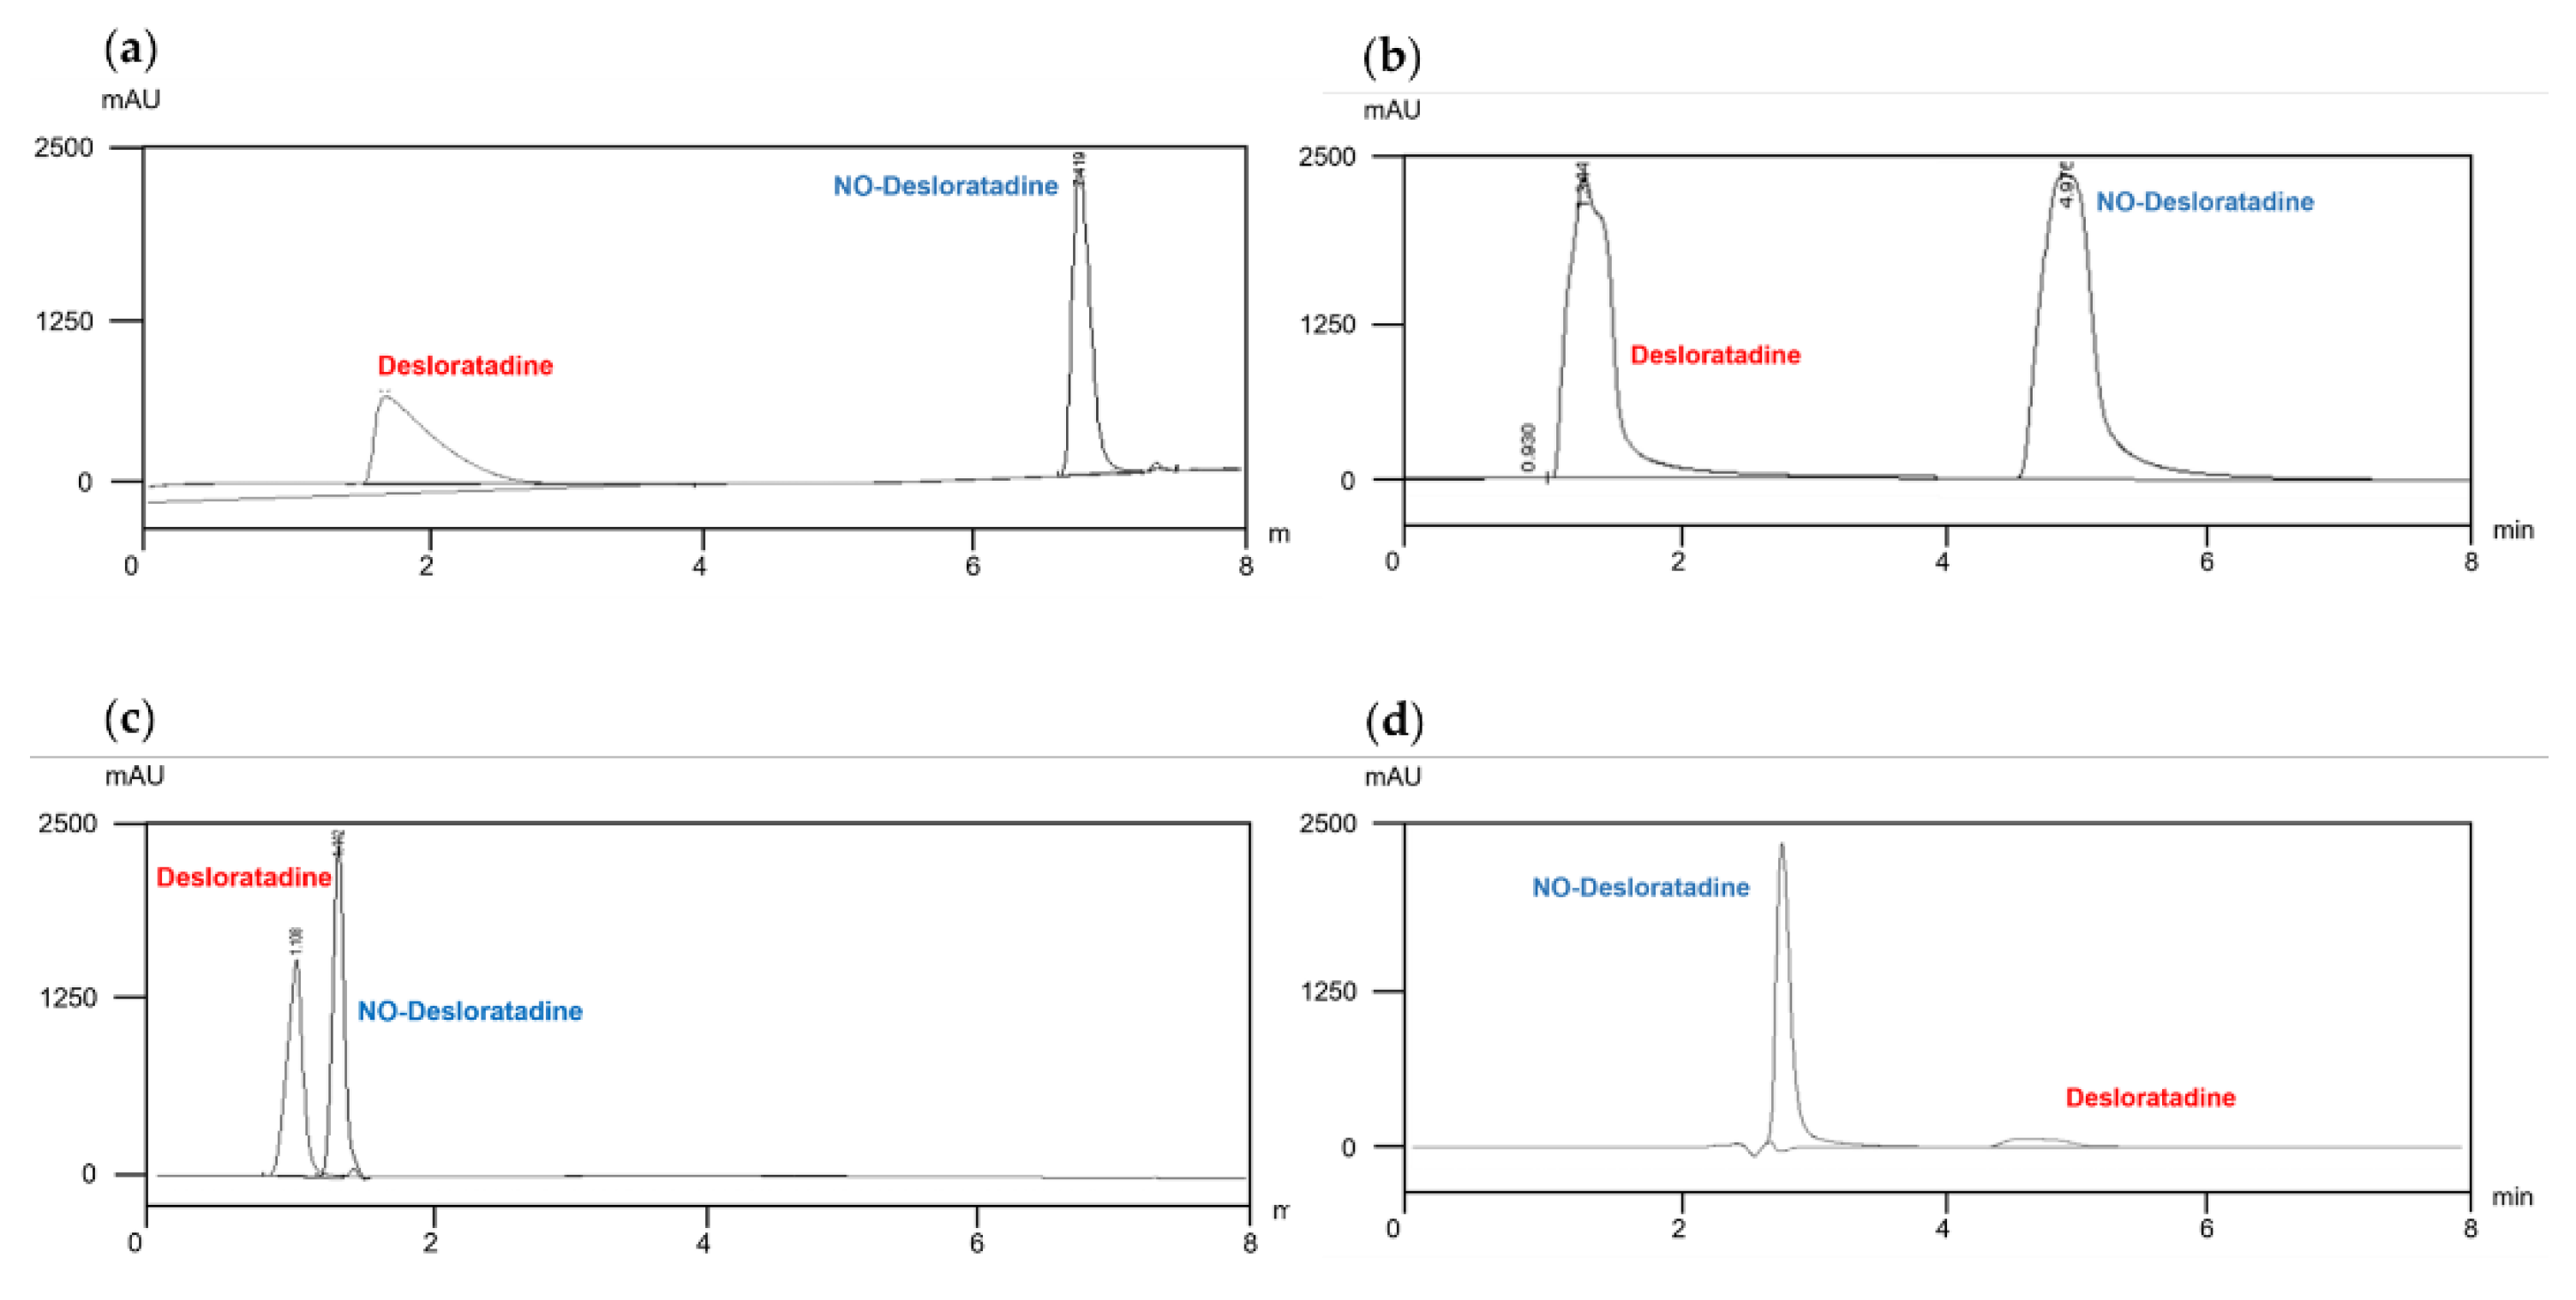
Figure 3.
Effects of formic acid concentration for optimal NO-Desloratadine separation in XBridge HILIC column at 40℃.
Figure 3.
Effects of formic acid concentration for optimal NO-Desloratadine separation in XBridge HILIC column at 40℃.
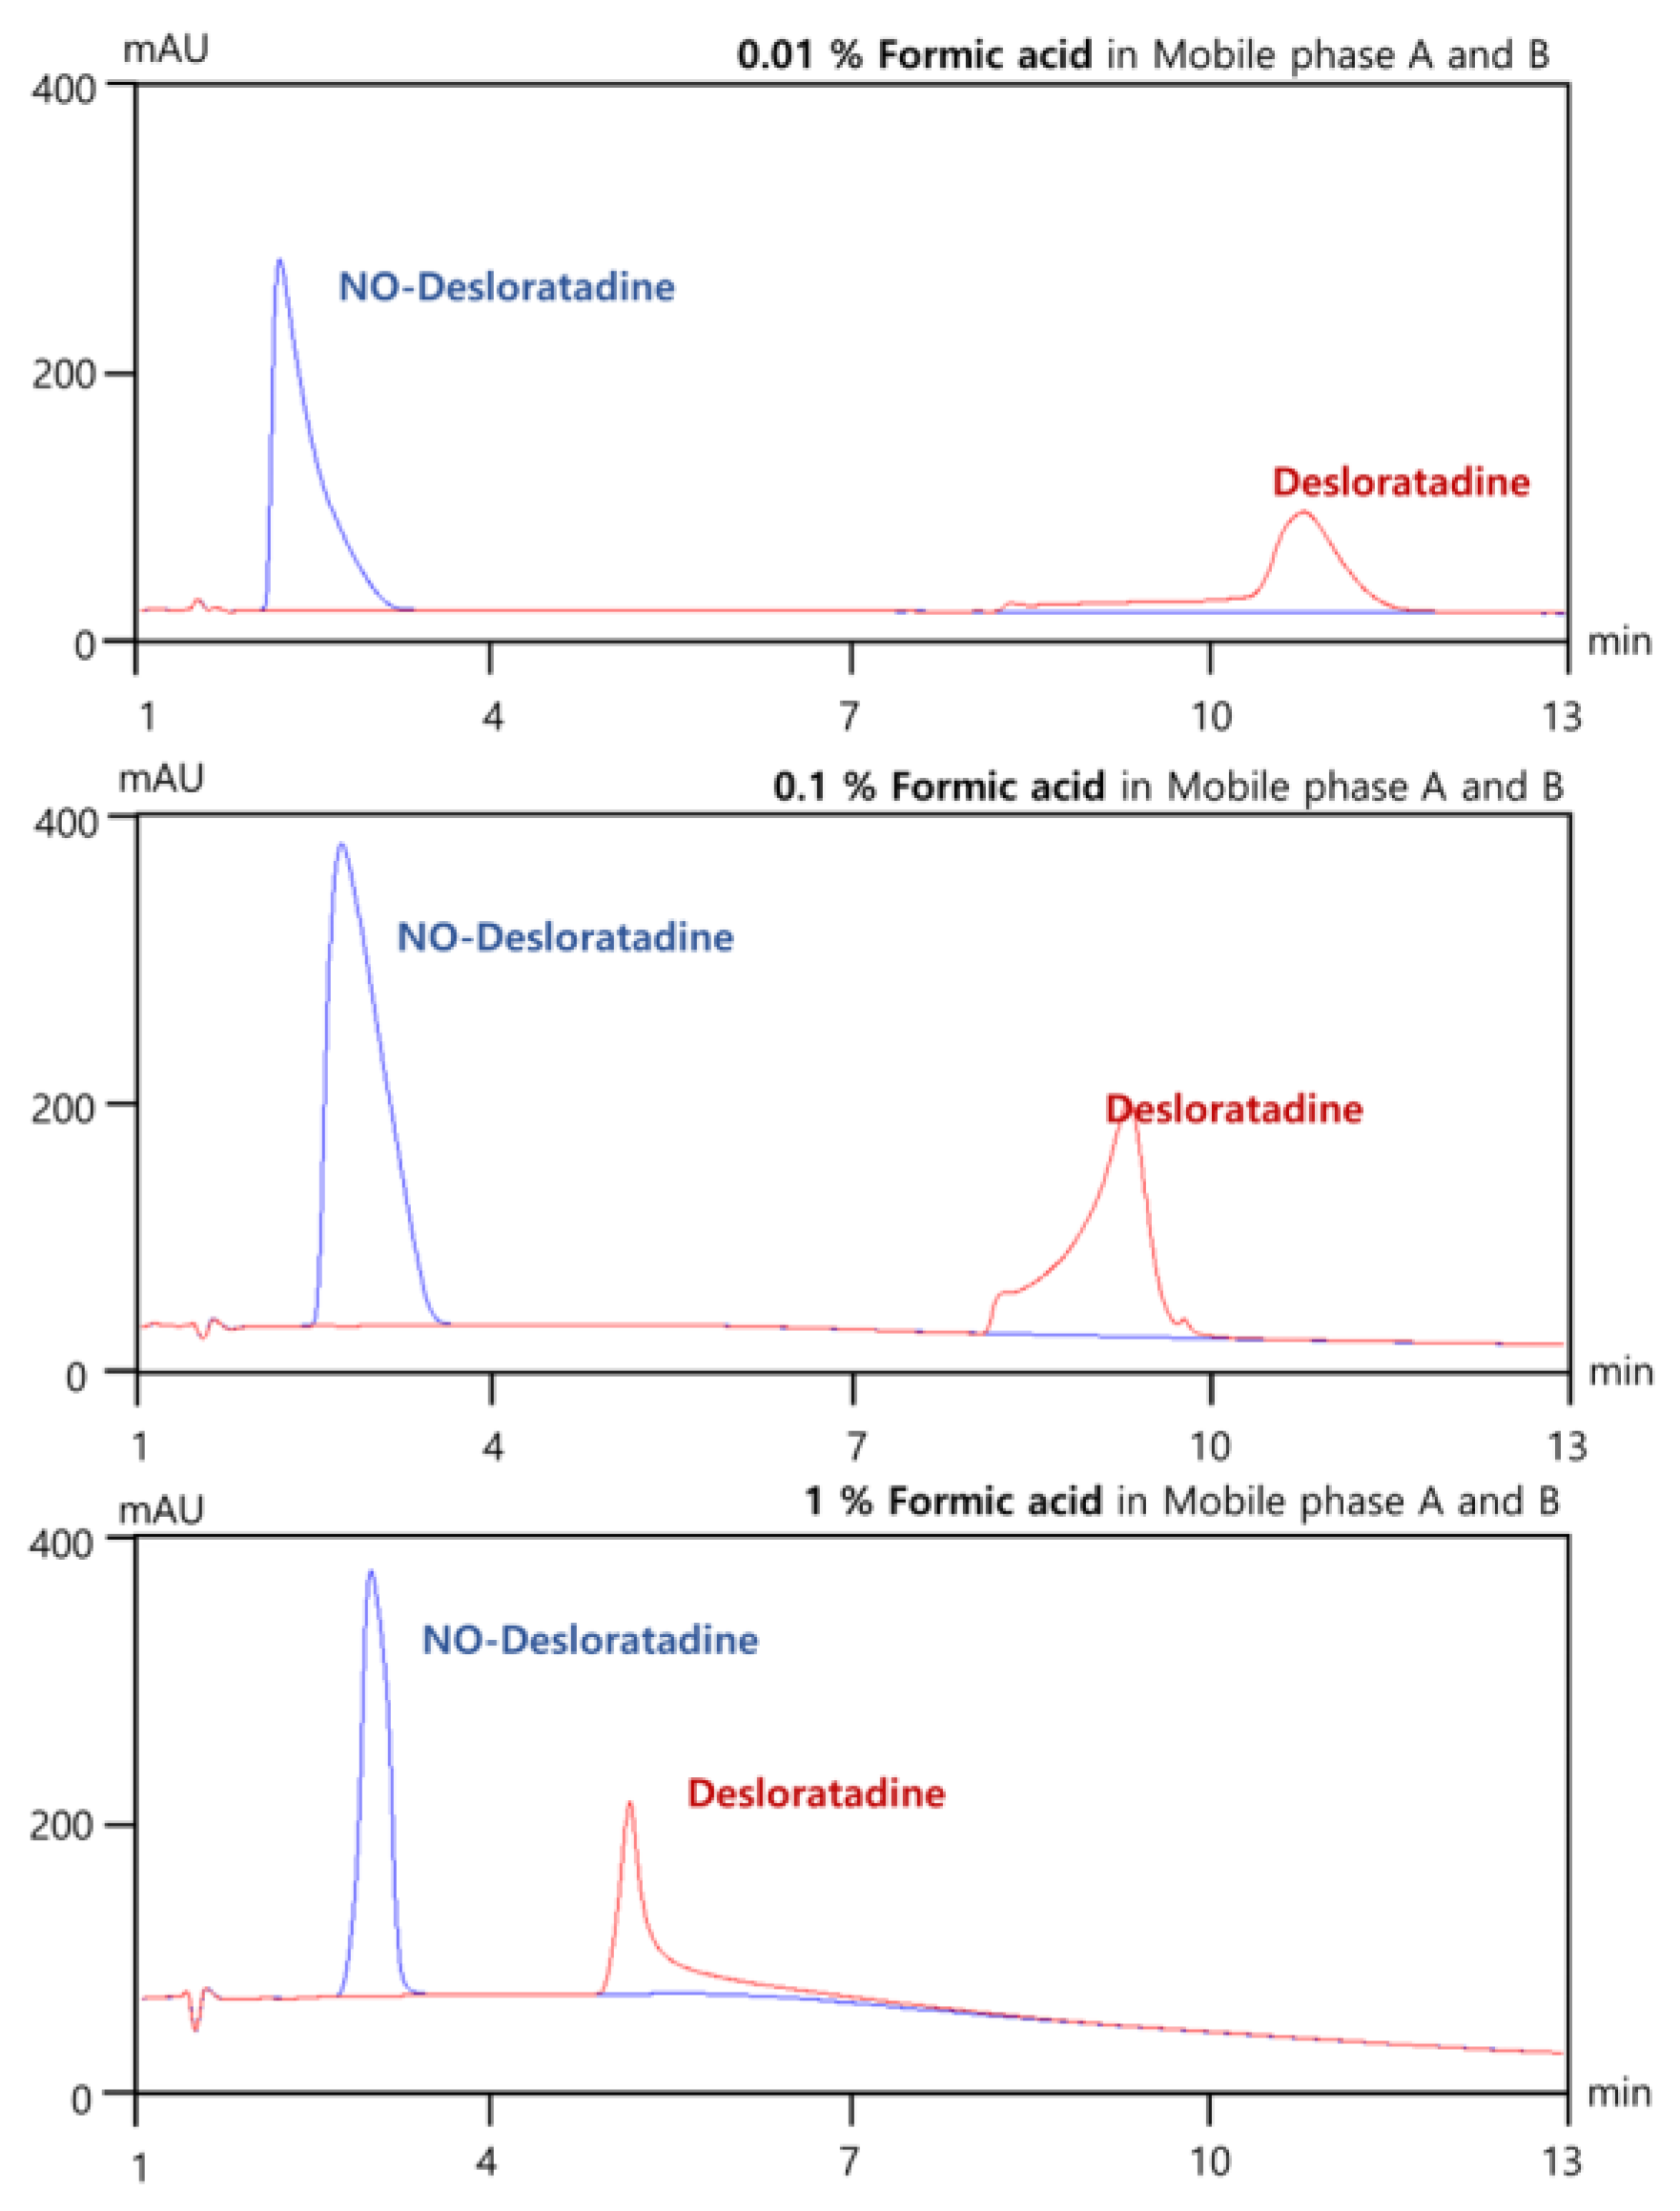
Figure 4.
MS fragmentation pattern of NO-Desloratadine.
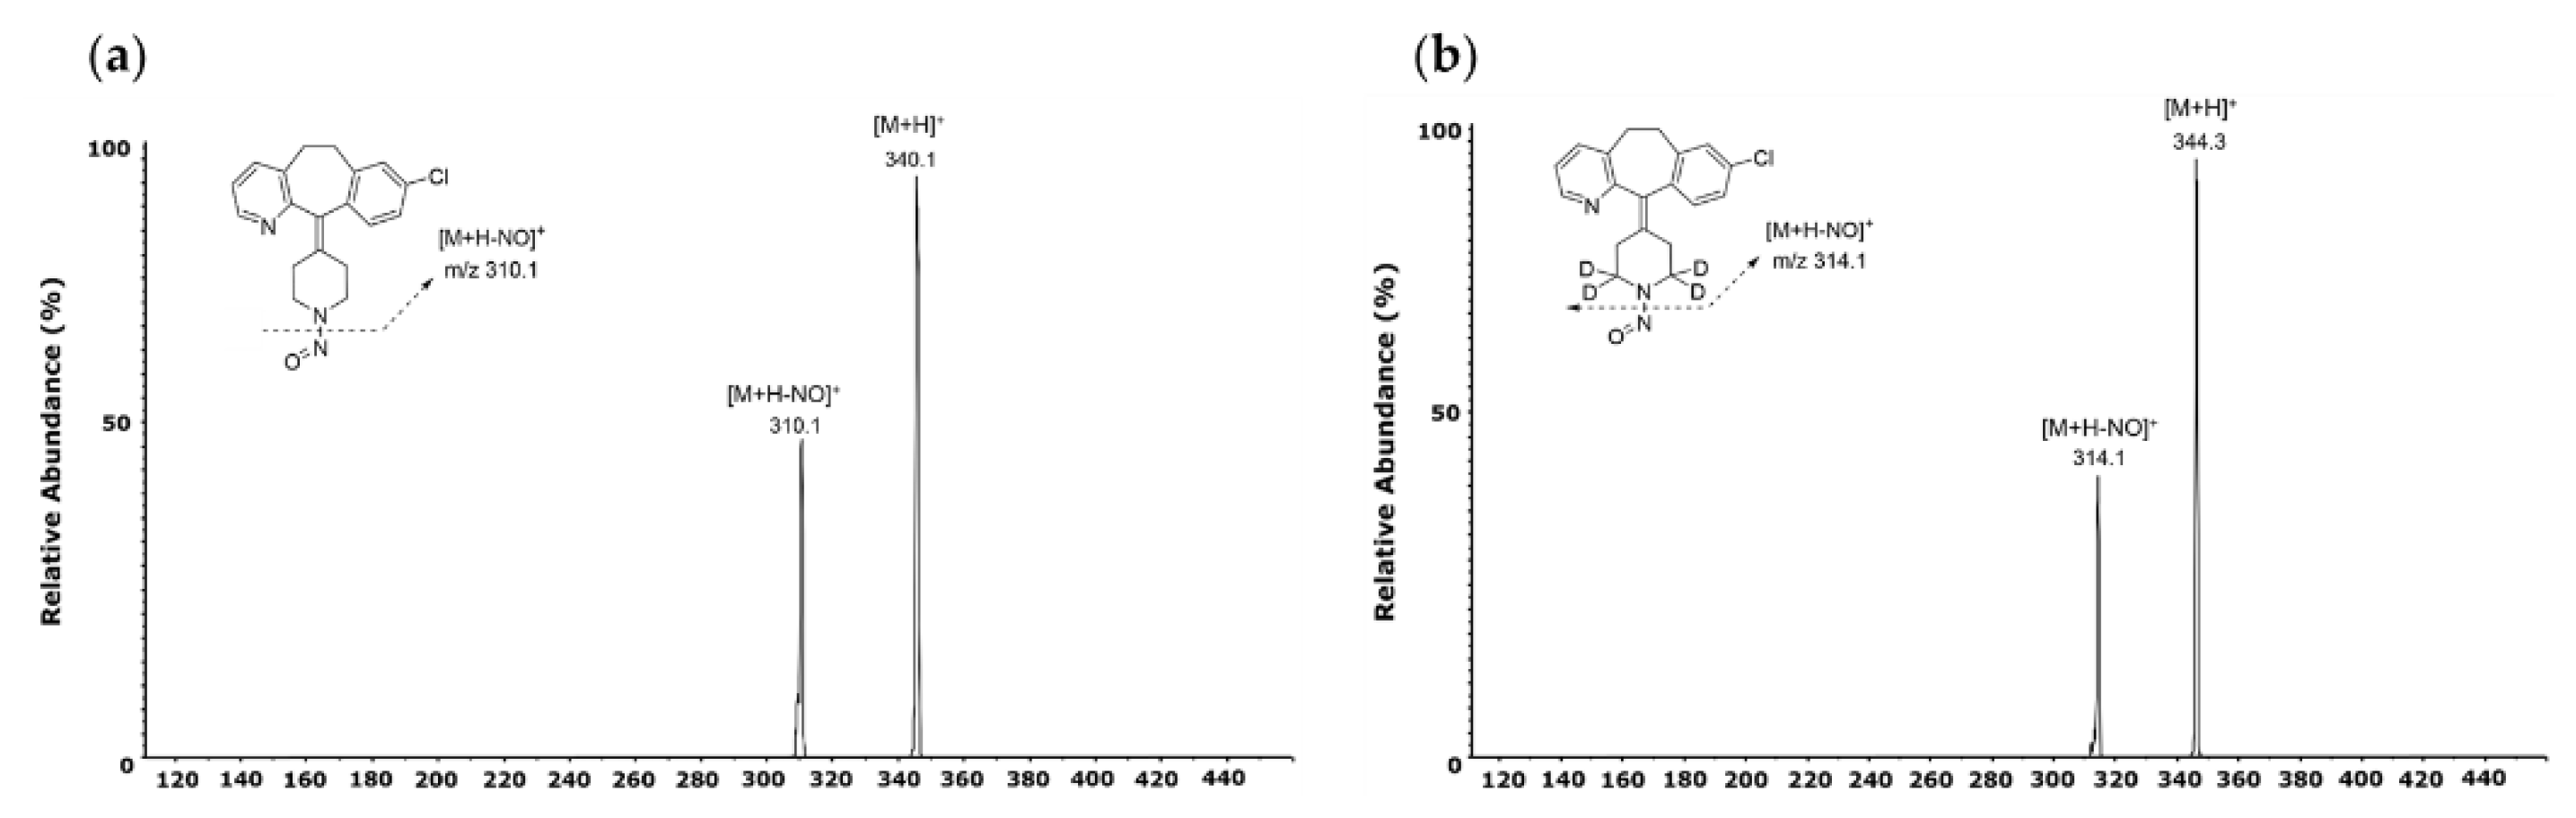
Figure 5.
Typical LC-MS/MS elution profile of acetonitrile blank (a) and NO-Desloratadine (b).
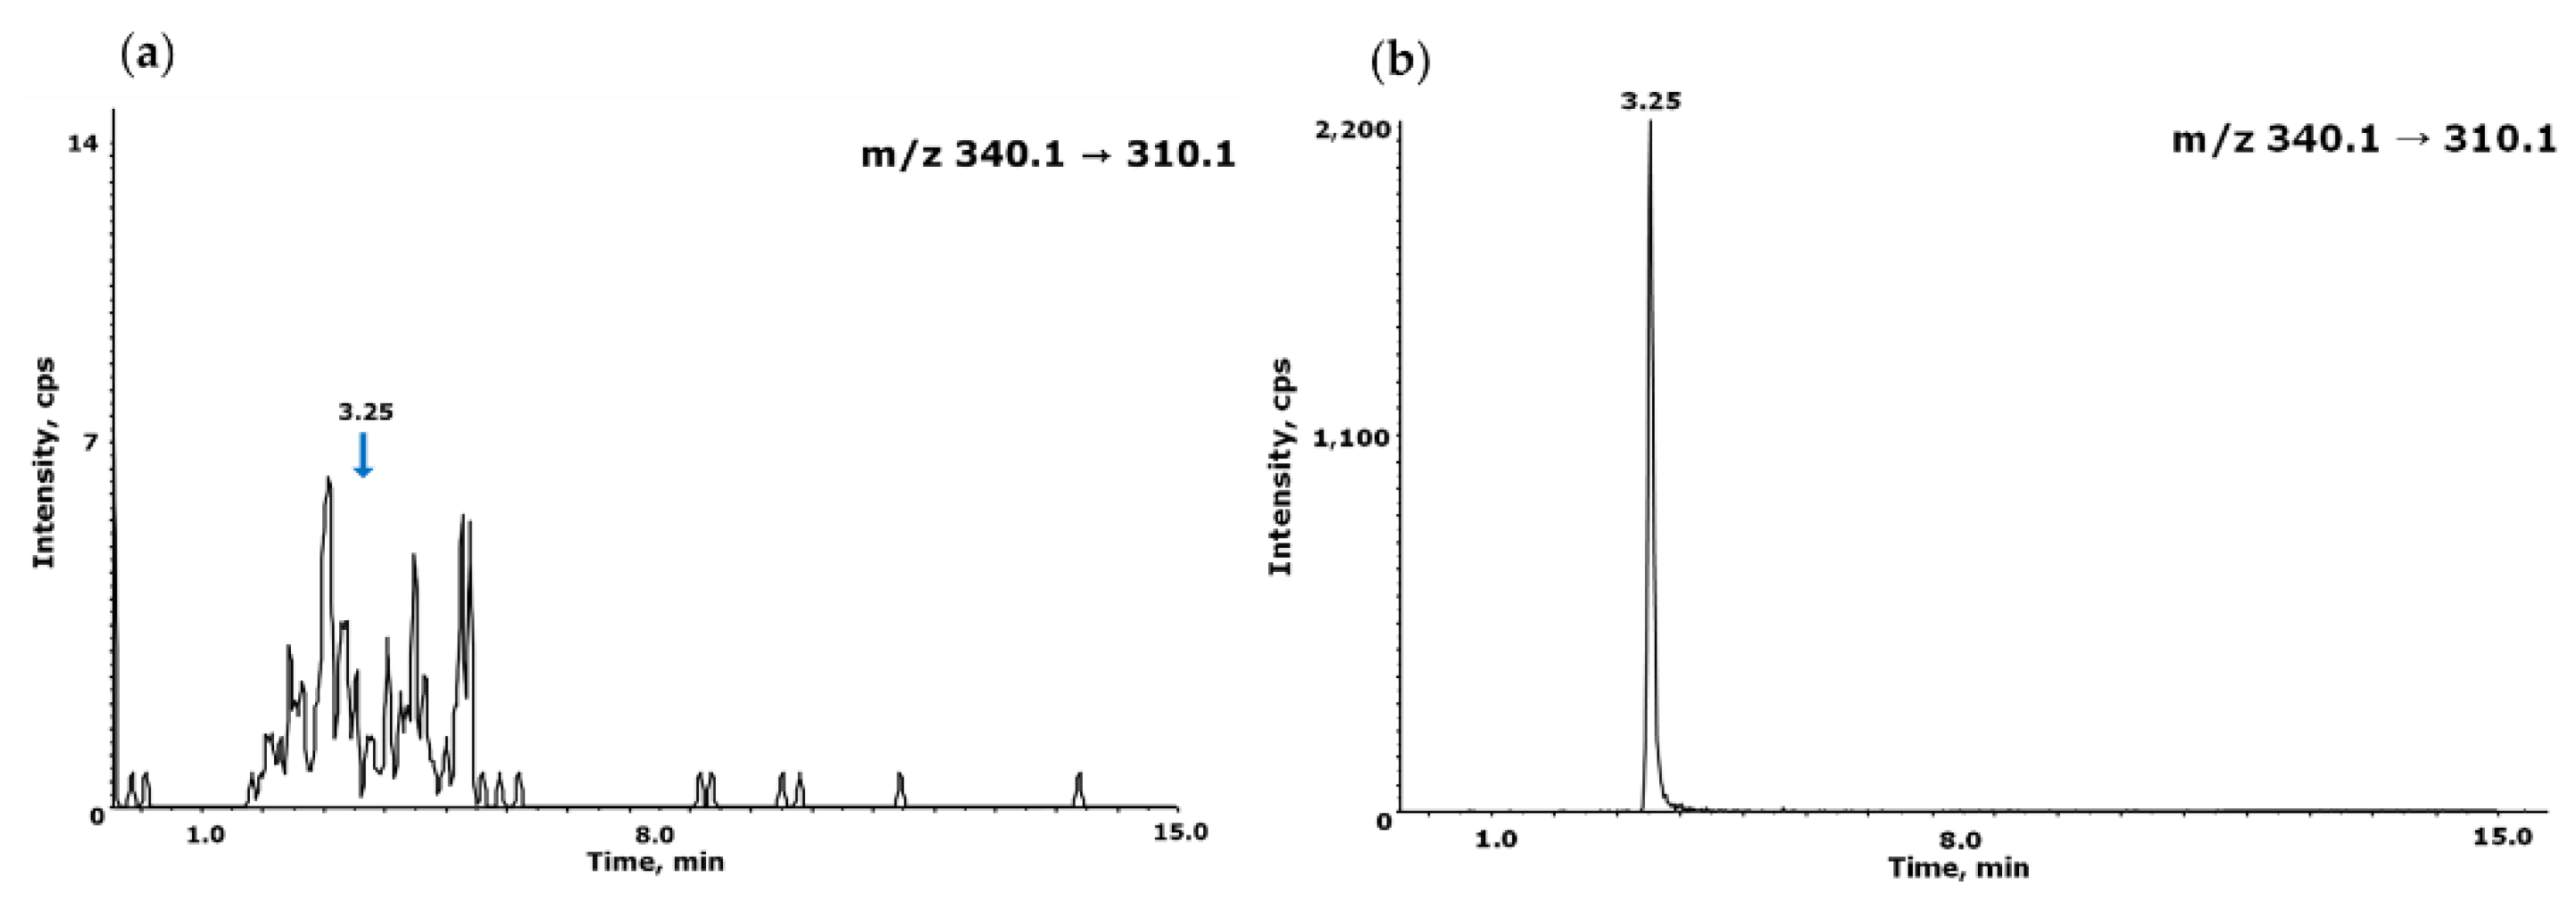
Figure 6.
Typical chromatograms of NO-Desloratadine determination in API (a) and FDF (b). NO-Desloratadine was eluted at 3.25 min.
Figure 6.
Typical chromatograms of NO-Desloratadine determination in API (a) and FDF (b). NO-Desloratadine was eluted at 3.25 min.
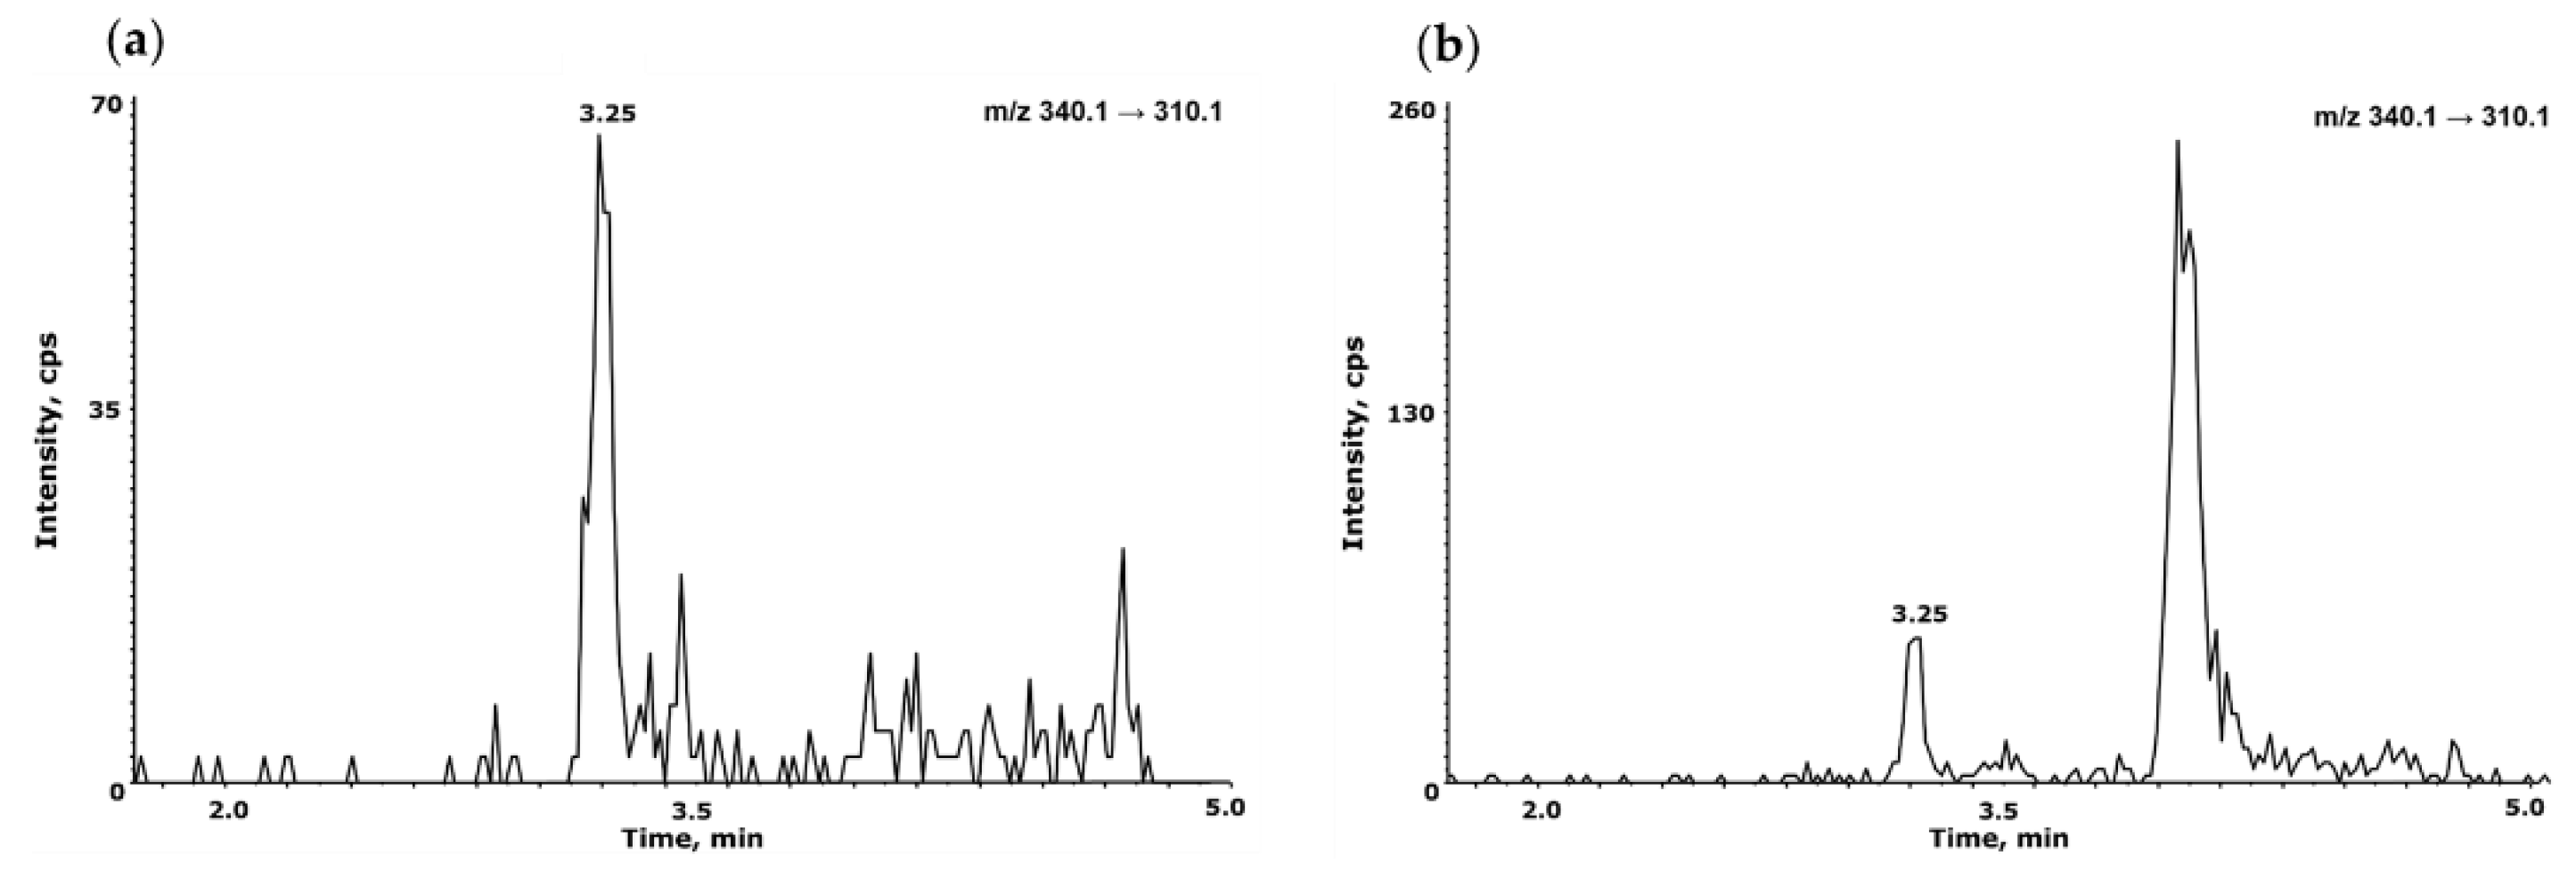
Figure 7.
Applications for the separations of other NDSRIs, NO-Fluoxetine (a) and its LOQ 1 ng/mL (b) and NO-Betahistidine (c) and its LOQ 1 ng/mL (d).
Figure 7.
Applications for the separations of other NDSRIs, NO-Fluoxetine (a) and its LOQ 1 ng/mL (b) and NO-Betahistidine (c) and its LOQ 1 ng/mL (d).
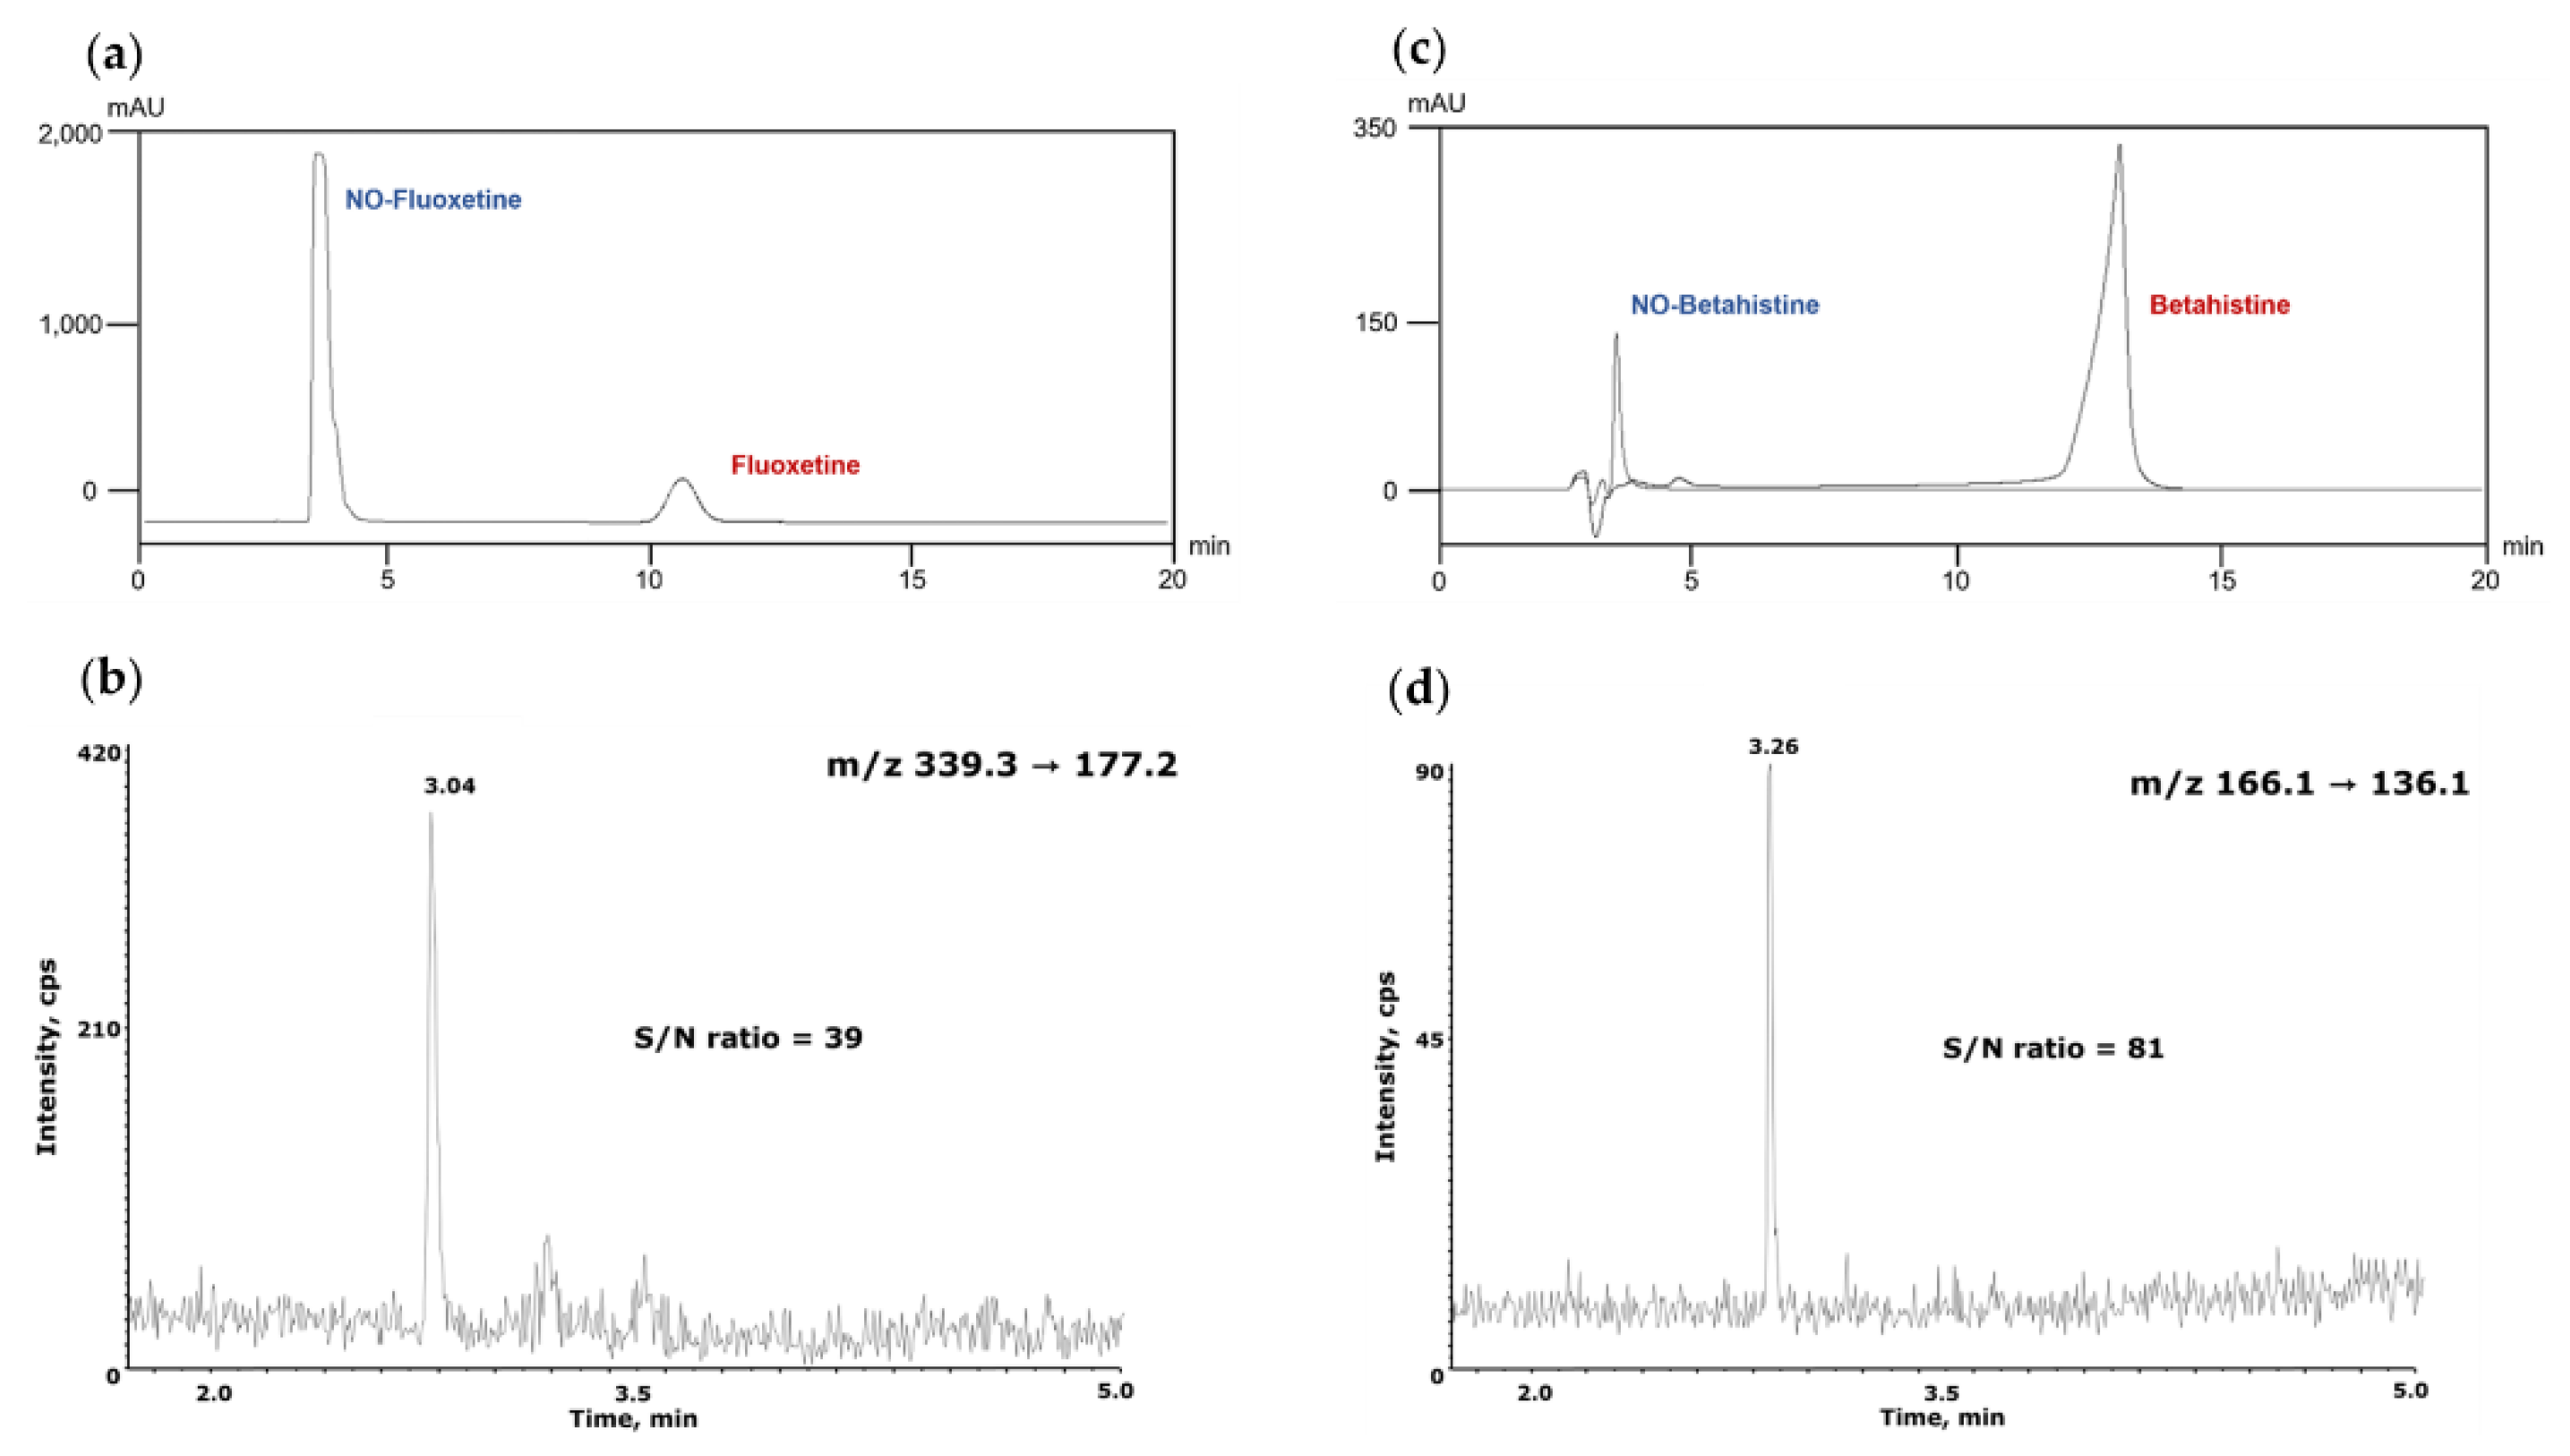

Table 1.
Lists of NDSRI structures and their ADIs analyzed by this method.
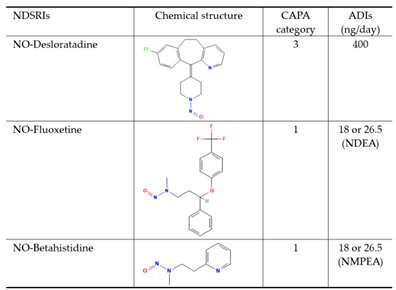
Table 2.
LC-MS/MS analytical condition.
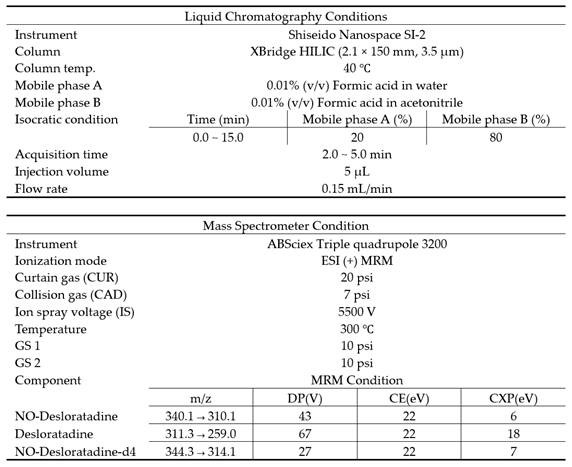
Table 3.
Characteristics of columns evaluated for NO-Desloratadine separation.
| Column (dimension) |
Separation mode | Selectivity |
|---|---|---|
| Kinetex F5® (2.6 μm, 3.0 mm × 100 mm) |
Reversed | π-π interactions, dipole–dipole, halogen bonding capacity, hydrogen bonding capacity, mixed mode behavior |
| Hypercarb® (3.0 μm, 2.1 mm × 150 mm) |
Reversed | Strong π–π interaction, electron-accepting surface, planarity recognition, strong retention power for polar compounds, capable of electrostatic interaction |
| Luna HILIC® (3.0 μm, 2.0 mm × 150 mm) |
HILIC | Formation of persistent water-rich layer, maintenance based on polar interactions, complementary selectivity, interactions with ionized species, selectivity sensitive to changes in mobile phase composition |
| XBridge HILIC® (3.5 μm, 2.1 mm × 150 mm) |
HILIC | Hydrophilic Interaction Liquid Chromatography mode, mixed mode behavior, selectivity adjustable by pH, simultaneous analysis of lipid-soluble drugs and polar metabolites |
Table 4.
Dose-response linearity.
| n | Slope | y-intercept | r² |
|---|---|---|---|
| 1 | 0.0292 | 0.0046 | 0.9998 |
| 2 | 0.0276 | 0.0227 | 0.9996 |
| 3 Average |
0.0287 0.0285 |
0.0050 0.0108 |
0.9998 0.9997 |
Table 5.
Accuracy and precision.
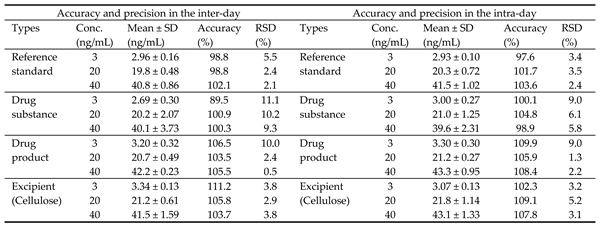
Table 6.
Robustness.
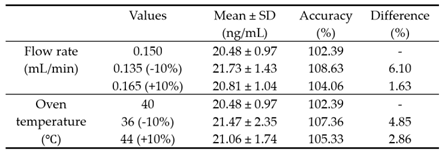
Table 7.
System suitability.
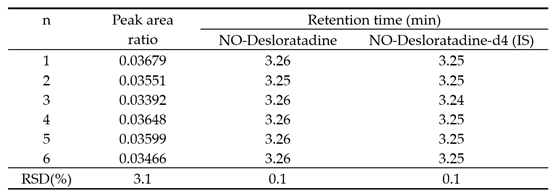
Table 8.
Method validation for NO-Desloratadine.
Disclaimer/Publisher’s Note: The statements, opinions and data contained in all publications are solely those of the individual author(s) and contributor(s) and not of MDPI and/or the editor(s). MDPI and/or the editor(s) disclaim responsibility for any injury to people or property resulting from any ideas, methods, instructions or products referred to in the content. |
© 2025 by the authors. Licensee MDPI, Basel, Switzerland. This article is an open access article distributed under the terms and conditions of the Creative Commons Attribution (CC BY) license (http://creativecommons.org/licenses/by/4.0/).
Copyright: This open access article is published under a Creative Commons CC BY 4.0 license, which permit the free download, distribution, and reuse, provided that the author and preprint are cited in any reuse.


