
Submitted:
14 October 2025
Posted:
14 October 2025
You are already at the latest version
Abstract
β-Methylphenethylamine (BMPEA), a positional isomer of amphetamine increasingly detected in dietary supplements and weight‐loss products, poses significant analytical challenges in forensic and doping control due to its structural similarity to amphetamine. This study presents a validated analytical workflow combining mixed‐mode solid‐phase extraction (MMSPE) with ultra‐performance liquid chromatography–quadrupole time‐of‐flight mass spectrometry (UPLC-qTOF-MS) for the selective quantification of BMPEA and identification of its metabolites in rat cardiac blood. Blood was taken at 20 and 90 minutes after injection from twelve adult male Sprague-Dawley rats that were randomly assigned to four groups (n = 3): an untreated control, a low-dose cohort (10 mg/kg, i.p.), and two high-dose cohorts (30 mg/kg, i.p.). The technique demonstrated strong differentiation between BMPEA and amphetamine isomers, excellent linearity over 20–1,000 ng/mL (R2 > 0.99), and quantification limits appropriate for forensic applications. A short biological half-life and quick elimination kinetics are consistent with related phenethylamines, as evidenced by the peak BMPEA concentrations of 899 ng/mL at 20 min and 22 ng/mL at 90 min. Comprehensive low- and high-energy mass spectrometric analyses revealed a novel BMPEA metabolite, characterized as 1-amino-2-phenylpropan-2-ol, based on fragmentation patterns and retention time comparison with reference standards. This work delivers a rigorous, high‐sensitivity analytical tool for BMPEA detection in biological matrices and enhances understanding of its metabolic fate, offering critical biomarkers for forensic toxicology and anti-doping investigations.
Keywords:
amphetamine-related substances
; forensic toxicology
; β-methylphenethylamine (BMPEA)
; 1-amino-2-phenylpropan-2-ol
; UPLC-qTOF-MS
1. Introduction
A synthetic compound in the phenethylamine class, β-methylphenethylamine (BMPEA) is a positional isomer of amphetamine that differs in the location of the methyl group but shares a similar core structure. BMPEA was first synthesized in 1930 as a substitute for amphetamine. Since then, it has been found in a number of dietary supplements and weight-loss products, frequently without proper labeling, which has raised questions about its uncontrolled use and abuse potential [1,2,3]. The chemical structures of amphetamine and BMPEA are depicted in Figure 1.
BMPEA is a dopamine and norepinephrine transporter substrate, but it was ten times lower than amphetamine at dopamine transporters. Importantly, BMPEA had strong effects on norepinephrine transporters and has been shown to increase blood pressure (BP) in rats and may cause adverse cardiovascular effects via substrate activity at peripheral norepinephrine sites, while producing minimal stimulant effects on locomotor activity compared to amphetamine [3,4].
Given that their mass spectrometric profiles are almost identical, the discovery of BMPEA in sports supplements has led to unintentional doping violations and serious health risks, underscoring the significance of precise detection and differentiation from amphetamine [5,6,7]. Different isomers differ in terms of safety and efficacy, as well as regulatory controls. Isomeric form identification is therefore becoming increasingly crucial, especially in forensic and doping control applications.
In response to these analytical challenges, this study employs a validated ultra-performance liquid chromatography-quadrupole time-of-flight mass spectrometry (UPLC-qTOF-MS) method in conjunction with mixed-mode solid-phase extraction, to quantify BMPEA and identify its metabolites in rat cardiac blood [7]. This advances the toxicological and forensic understanding of BMPEA exposure and metabolism.
2. Materials and Methods
2.1. Chemicals and Materials
Standards for (±) amphetamine, (S,S)-(+)-pseudoephedrine, (1S,2R)-(+)-ephedrine-d3 HCl, and (±)-amphetamine-d11 were purchased from Cerilliant (Round Rock, TX, USA) as 1 mg/mL methanolic solutions and diluted as required. (R*,S*)-(±)-ephedrine HCl, DL-norephedrine, and (R)-(+)-β-methylphenethylamine were obtained from Sigma Aldrich (Oakville, Ontario, Canada) as 1 mg/mL methanolic solutions and diluted as required. (+)-Norpseudoephedrine hydrochloride (cathine hydrochloride) was purchased from LGC Standards (Manchester, NH, USA) as a 0.1 mg/mL methanolic solution and diluted as required. ACN, MeOH, and purified water, used in drug extraction and UPLC analysis, were of reagent grade and obtained from EMD Milipore (Billerica, MA, USA). Ammonium acetate was purchased from Mallinckrodt Baker Inc. (Phillipsburg, NJ, USA). Acetic acid and HCl were obtained from BDH (Radnor, PA, USA). Ammonium hydroxide, ammonium formate, and formic acid were purchased from Fisher Chemicals (Bridgewater, NJ, USA). Amphetamines-specific MIP-SPE (25 mg) was purchased from Biotage (Uppsala, Sweden). Mixed-mode SPE (Oasis MCX, 30 mg) and FTPE (HLB Prime, 100 mg) were purchased from Waters (Milford, MA, USA). Aged animal blood was obtained from Ottawa Laboratory (Nepean, Ontario, Canada). Blank human whole blood was obtained from Utak Laboratories Inc. (Valencia, CA, USA).
2.2. Drug Administration to Rats and Blood Sampling
Male Sprague-Dawley rats (230–250 g, n = 12) were provided by Charles River Laboratories (St-Constant, QC, Canada). The animals were housed in an environmentally controlled breeding room at the Laurentian University Animal Care Facility and were acclimated to the laboratory conditions for 3 days. Adult male Sprague-Dawley rats were housed in groups of three in cages with ¼″ bedding (Harlan Teklad, Indianapolis, IN, USA) under a 12-h light/dark cycle at a temperature of 20 ºC. The animals were provided free access to water and Harlan Teklad laboratory diet 8640. The animal procedures used in this study were approved by the Laurentian University Animal Care Committee. Twelve adult male Sprague-Dawley rats were randomly assigned to four groups (n = 3 each): a control group, in which the rats did not receive BMPEA; a low-dose group where the rats received a dose of 10 mg/kg of BMPEA (i.p.); and two high-dose groups where rats were injected with a dose of 30 mg/kg (i.p.). The rats from the low-dose and one of the two high-dose groups were euthanized by CO2 asphyxiation, within 20 min. Those from the other high-dose group were euthanized by CO2 asphyxiation 90 min post-injection. Perimortem blood samples were obtained from the rat heart (cardiac puncture). The blood was collected in sodium fluoride vacutainer tubes obtained from BD (Mississauga, ON, Canada).
2.3. BMPEA Concentration Determination
Two standard curves were constructed using six calibrators samples in duplicate for each analyte. Calibrators were prepared in a drug-free rat cardiac blood matrix (control group). Rat blood calibrators (250 μL) were assayed at concentrations of 20, 40, 200, 500, 800, and 1,000 ng/mL using a combined working standard solution, with addition of 125 ng ISs to each calibrant. Quantification was performed based on the ratio of the integrated area under EIC of BMPEA to that of amphetamine-d11 using specific quantifier ions (Table 1).
2.4. BMPEA Metabolite Identification
The identification process of the BMPEA metabolite was carried out by comparison with drug-free samples. Molecular or fragmented ions uniquely found in LE mass spectral profiles of BMPEA-dosed samples were considered potential metabolites and were used for subsequent analysis by examining their HE mass spectral profiles.
2.5. Data Processing
The raw data obtained after analysis were processed by two types of software. Analyte identification criteria were manually assessed using Masslynx 4.1 software (Waters, Manchester, UK); the raw data were also processed automatically using the streamlined workflow of the UNIFI 1.7.0 software (Waters, Manchester, UK) for identification and quantification of the analytes. Compound identification was based on retention time (±0.05 min), mass deviation (± 10 mDa) and appropriate isotope profile.
3. Results
The validated UPLC-qTOF-MS analytical method in conjunction with mixed-mode solid-phase extraction (MMSPE) successfully determined the concentrations of β-methylphenethylamine (BMPEA) and identified its metabolites in rat cardiac blood samples. Excellent performance characteristics were shown by the analytical parameters for both BMPEA and the internal standard amphetamine-d11. BMPEA showed a molecular ion [M+H]+ at m/z 136.1121 and key fragment ions at m/z 119.0855 (quantifier ion) and m/z 91.0542 (qualifier ion), whereas amphetamine-d11 displayed corresponding ions at m/z 147.1653, 130.1388, and 102.1075, respectively. With BMPEA eluting at 6.21 minutes under the specified analytical conditions, the chromatographic separation produced baseline resolution between BMPEA and amphetamine positional isomers. The method’s dependability for quantitative analysis was demonstrated by calibration curves built over the concentration range of 20–1,000 ng/mL, which showed quadratic regression behavior with excellent correlation coefficients (R2 > 0.99), demonstrating the method’s reliability for quantitative analysis across the validated working range. The averaged quadratic calibration equation (y = 0.0003x² + 0.0341x + 0.0149) provided robust quantification capabilities with acceptable precision and accuracy parameters.
The UPLC-qTOF-MS data for BMPEA in rat drug-free perimortem blood samples prepared by MMSPE are summarized in Table 1 and are shown in Figure 2.
3.1. Quantitative Analysis of BMPEA
BMPEA concentrations in rat cardiac blood were fitted with quadratic regression lines, and concentration dependence was assessed over a 20-1,000 ng/mL range. The findings revealed a strong correlation (R2 > 0.99). Averaged quadratic calibration curve is shown in Figure 3. The BMPEA concentrations in the rat cardiac blood of the three groups (low, high, and high delayed groups) were determined using the averaged quadratic regression equation of the two constructed standard curves (Figure 4).
The determined concentrations of BMPEA are shown in Table 2. The high-dose group samples, collected within 20 minutes post-injection of 30 mg/kg BMPEA, demonstrated the highest mean concentration of 869 ± 29 ng/mL, with individual sample concentrations ranging from 841 to 899 ng/mL. In contrast, the high delayed-dose group samples, collected 90 minutes after the same dose administration, exhibited dramatically reduced concentrations with a mean of 31 ± 9 ng/mL and individual values ranging from 22 to 40 ng/mL. The low-dose group, administered 10 mg/kg BMPEA, showed correspondingly lower but detectable concentrations with a mean of 104 ± 25 ng/mL and individual measurements ranging from 85 to 132 ng/mL. All determined concentrations (22–899 ng/mL) across the experimental groups were within the validated analytical range of 20–1,000 ng/mL, confirming the method’s applicability for pharmacokinetic studies. The measured concentrations of BMPEA are shown in Table 3.
3.2. BMPEA Metabolites Identification Analysis
Through comprehensive mass spectrometric analysis, metabolite identification analysis identified the presence of a novel BMPEA biotransformation product. Using both low-energy and high-energy acquisition modes, a compound that produced a fragmented ion at m/z 134 was consistently found in all drug-positive rat blood extracts, but it was not present in drug-free control samples. In comparison to low-dose and delayed high-dose samples, the metabolite showed a greater instrumental response in high-dose group samples, indicating dose-dependent formation. Significant structural similarities between the detected metabolite and these phenylpropanolamine positional isomers were found in the fragmentation patterns, especially in the high-energy mass spectra, when compared to reference standards norephedrine and cathine. Chromatographic resolution in line with positional isomer separation attained for amphetamine and BMPEA was demonstrated by the metabolite’s retention time of 5.43 minutes as compared to norephedrine’s 5.71 minutes. Figure 5 show the EIC and mass spectral profiles of the detectable metabolite. A comparative approach was used to compare EICs and mass spectra of the proposed metabolite (Figure 6) with those of NOR (Figure 7) and CAT (Figure 8).
The novel metabolite was determined to be 1-amino-2-phenylpropan-2-ol based on the proposed metabolic pathway that was derived from amphetamine metabolism patterns and validated by mass spectrometric fragmentation analysis as shown in Figure 9.
This metabolite, which is the hydroxylated derivative of BMPEA produced by oxidative metabolism, shows distinctive fragmentation patterns, including water loss (m/z 134), followed by aromatic stabilization processes. Comparison with theoretical fragmentation patterns and structural analysis further confirmed the identification. However, the molecular ion at m/z 152 was not detectable, most likely because of in-source fragmentation phenomena related to the XEVO-G2XS qTOF-MS instrument’s StepWave® ion focusing system. Since 1-amino-2-phenylpropan-2-ol has never before been identified as a metabolite of BMPEA, it has greatly advanced our knowledge of the biotransformation pathways of BMPEA and offered promising biomarkers for toxicological and forensic applications. Figure 10 and Figure 11 show the chemical structure of the proposed metabolite and its fragmentation patterns, respectively.
4. Discussion
Measurement of β-methylphenethylamine (BMPEA), a positional isomer of amphetamine, presents significant analytical challenges due to potential misidentification as amphetamine during routine toxicological screening [8]. This distinction is particularly crucial in clinical and forensic toxicology, especially in cases involving fatal poisoning. Also, BMPEA has been included in the World Anti-Doping Agency’s (WADA) list of prohibited substances [9]. It has been implicated in serious adverse events, notably hemorrhagic stroke, following the consumption of dietary supplements containing this compound [10,11]. Previous pharmacological studies in laboratory rats have demonstrated that BMPEA exhibits properties comparable to amphetamine, with particular concern regarding its potential to produce adverse cardiovascular effects [4]. These emphasizes the importance of reliable analytical methods for its detection and discrimination from similar compounds in both clinical and forensic toxicology.
The present study successfully applied a validated UPLC-qTOF-MS analytical method in conjunction with mixed-mode solid-phase extraction (MMSPE) to determine BMPEA concentrations and identify its metabolites in rat cardiac blood samples, demonstrating the method’s applicability to biological specimens from subjects exposed to BMPEA. Post-injection blood samples from rats were subjected for pretreated and extracted following established MMSPE pretreatment and extraction protocols [7]. This methodological approach represents a significant advancement in the analysis of BMPEA and its metabolites in complex biological matrices, offering improved sensitivity and specificity. The method’s capability to detect and quantify both the parent compound and its metabolite provides crucial insights into the pharmacokinetic profile of BMPEA in biological systems.
The identification of BMPEA in rat blood was based on agreement between the putative compound and BMPEA (calibrator) in relative intensity at m/z 136, 119, and 91, and retention time. The EIC (m/z = 119) and mass spectrum of a calibrant sample (positive control) corresponded to those from a sample derived from a drug-positive rat in terms of the relative intensity of the fragment ions formed and retention times. The S/N ratios were above the lower acceptable limits of 3:1 for m/z 136 and 91(qualifiers ions) and 10:1 for m/z 119 (quantifier ion) in all drug-postive rat blood samples. BMPEA quantification was based on the averaged standard curve using drug-free cardiac rat blood (control group), fit with a quadratic regression equation (R2 = 0.9995); Table 1, Figure 3.
The highest determined concentration of BMPEA was 899 ng/mL in a sample obtained from the high-dose group, whereas the lowest determined concentration was 22 ng/mL in a sample collected from the high delayed-dose group. Both the highest and lowest determined concentrations were within the validated working range of the assay (20-1,000 ng/mL). Interestingly, the high delayed-dose samples (collected 90 min post-injection) showed a marked decline in the concentration levels of BMPEA (31 ng/mL ± 9 ng/mL) compared to the high-dose samples (collected within 20 min of injection), which showed very high concentration levels of BMPEA (869 ng/mL ± 29 ng/mL). This finding proved that BMPEA has a short elimination half-life in rat blood. It consistent with β-phenylethylamine, which exhibits rapid metabolism and a half-life of 6-16 minutes, depending on dose [12]. Further experiments are required to precisely estimate the half-life of BMPEA.
The main purpose of this study was to apply the validated method [7] to authentic samples from subjects exposed to BMPEA and to identify one or more BMPEA metabolites. A theoretical metabolic pathway of BMPEA is proposed in Figure 9. This metabolic pathway was proposed based on the published metabolic pathway of amphetamine [13]. According to this theoretical metabolic pathway, 4-hydroxy-β-methylphenethylamine, 1-amino-2-phenylpropan-2-ol, and 4-(1-amino-2-hydroxypropan-2-yl) phenol were proposed to be the metabolites of BMPEA. These proposed metabolites may be expected to be detectable by the analytical method proposed here, whereas 2-phenylpropanol, benzoic acid, and hippuric acid may not provide superior sensitivity and may not be detectable in positive ionization mode [14]. A method for detection of putative metabolites by negative ionization mode was not developed in this work.
Compared with previously developed analytical methods by Piotr C. et al (2014) [15] and the method used in the current study Alamir A., et al (2022) [7], significant methodological advances are apparent, particularly in the area of isomer discrimination. The earlier UPLC/MS/MS method was specifically designed to achieve discrimination between BMPEA and amphetamine, offering a targeted approach for these analytes. In contrast, the current UPLC-qTOF-MS approach not only retains the capability to distinguish BMPEA from amphetamine but also extends the analysis to a comprehensive array of isomeric compounds, covering a broad spectrum of amphetamine-related drugs (ARDs) as well as BMPEA and its metabolites. A key enhancement in the current methodology is the adoption of mixed-mode solid-phase extraction, which provides superior cleanup of complex matrices compared with the extraction techniques used in the earlier study. This improved sample preparation, in combination with the high mass accuracy of qTOF-MS and complete baseline resolution achieved through pseudo-isocratic separation, allows for reliable quantification and identification of multiple isomers. Furthermore, the current study includes a stability assessment of analytes for up to 36 hours, highlighting its robustness and suitability for forensic applications. Overall, the evolution from the initial UPLC/MS/MS method to the advanced UPLC-qTOF-MS platform demonstrates not only better isomer discrimination but also broader application potential, making it a more versatile tool for toxicological analysis and forensic investigations.
The metabolite identification process was carried out through manual and automated searches. The manual search process was performed using Masslynx® software, through search for molecular ions of common metabolite products (e.g., hydroxylation products). As was observed through analysis of the EICs corresponding to [M+H] (i.e., m/z = 152; hydroxylated metabolite of BMPEA) or [M+H+16] (e.g., m/z = 168; doubly hydroxylated metabolite of BMPEA), no detectable compounds were observed. Considering the fragmentation phenomena of the molecular ions of analytes included in validation within the qTOF-MS used, it is reasonable to anticipate similar patterns with any observed BMPEA metabolites.
The ion focusing system used in the XEVO-G2XS qTOF-MS is known as the StepWave® system (Waters, Milford, MA, USA), which plays a significant role in transferring ions from the ion source to the first mass filter (quadrupole) and improving sensitivity of UPLC-qTOF-MS [16]. The StepWave® uses a relatively high electric field to guide ions toward the first mass filter. Such an electric field may lead to “in-source” fragmentation of certain analytes prior to reaching the mass selector, especially at a low concentration level, leading to low sensitivity of detection of the molecular ion of an analyte. This phenomenon of in-source fragmentation could explain the underlying reason for the inability to detect the molecular ions of the theoretically proposed metabolites. Interestingly, a compound producing the ion with m/z 134 was detectable in all extracts from drug-positive rats at HE and LE but not in those from the drug-free controls.
Figure 5 show EICs (m/z = 134) and mass spectral profiles from extracts of drug-positive and drug-negative rats. The presence of a compound forming this ion in extracts from the drug-positive animals was demonstrated using the automated Metabolite Identification feature of the UNIFI® software (Waters, Manchester, UK). Unfortunately, UNIFI® was not able to conclusively determine the identity of the proposed metabolite, even though the software was able to detect the compound. Furthermore, a search through the scientific libraries of the UNIFI® software yielded more than 100 candidate compounds. Most of these candidate compounds were excluded based on their chemical structures and compositions (chemical formula and nominal mass).
The current study predicted BMPEA metabolic pathway. 4-hydroxy-β-methylphenethylamine, 1-amino-2-phenylpropan-2-ol, and 4-(1-amino-2-hydroxypropan-2-yl) phenol were proposed metabolites. In this regard, two candidates underwent comparison with the proposed metabolite at the level of mass spectral profiles. These candidate compounds were 4-hydroxyamphetamine and norephedrine. Since norephedrine was included in the validated method, its EIC and mass spectra at HE and LE were compared with those of the detectable metabolite, as shown in Figure 7 and Figure 8. There was agreement between the spectra of norephedrine and the proposed metabolite in the HE and LE mass spectra (Figure 7 a and b). However, the ion with m/z 152 was not detectable in the mass spectrum of the proposed metabolite, probably due to in-source fragmentation, as suggested earlier. Surprisingly, the HE mass spectra of cathine and the proposed metabolite were in good agreement, as shown in Figure 8 b. These findings support the idea that the proposed metabolite might be a positional isomer of phenylpropanolamine (norephedrine and cathine).
Experimentally, this proposition was strengthened by comparison of the retention times of the proposed metabolite and, which were 5.43 and 5.71 min, respectively, as shown in Figure 6. This degree of resolution is consistent with that of the positional isomers included in the validated method (i.e. amphetamine and BMPEA). Accordingly, the metabolite of BMPEA was proposed to be 1-amino-2-phenylpropan-2-ol which is the corresponding positional isomer of norephedrine in the proposed metabolic pathway of BMPEA (Figure 9). This was one newly detected metabolite of BMPEA, which is proposed to be 1-amino-2-phenylpropan-2-ol. This proposed metabolite structure was determined through its fragmentation pattern by using the MSE acquisition mode of qTOF-MS. Two fragmentation patterns were proposed for 1-amino-2-phenylpropan-2-ol, as shown in Figure 10 and Figure 11.
The formation of this metabolite can provide critical insights into BMPEA’s metabolic fate in the human body. Similar to BMPEA, the presence of 1-amino-2-phenylpropan-2-ol in biological samples such as blood, urine, or tissues can serve as a marker of BMPEA ingestion or exposure. Its detection can aid in confirming exposure to BMPEA in cases of suspected intoxication or overdose and enhances our understanding of BMPEA biotransformation. These insights are pivotal for both clinical diagnostics and the forensic investigation of poisoning cases. The current analytical method markedly improve our capacity to accurately quantify such metabolites. This advancement supports more investigations into BMPEA exposure and its related toxicological effects. Further experiments are required to confirm the proposed chemical structure of this newly detected metabolite of BMPEA; 1-amino-2-phenylpropan-2-ol. Additional studies focused on structural elucidation will be essential to verify its identity and fully understand its role in BMPEA metabolism.
In addition, 4-hydroxy-β-methylphenethylamine could not be excluded as a candidate metabolite of BMPEA. Since a reference standard for 4-hydroxy-β-methylphenethylamine was not available for inclusion in this study, further investigation could not be carried out. Thus, further experiments are required to confirm the identity of the detected metabolite of BMPEA as 1-amino-2-phenylpropan-2-ol or 4-hydroxy-β-methylphenethylamine, or to exclude both candidates. This confirmatory study can be carried out by analyzing neat standards, and spiked blood of 1-amino-2-phenylpropan-2-ol and 4-hydroxy-β-methylphenethylamine and comparing their mass spectra (HE and LE) with those of the metabolite of BMPEA detected in this study.
5. Conclusions
The validated UPLC-qTOF-MS method in conjunction MMSPE were successfully applied in this study to determine BMPEA concentrations and identify its metabolite in rat blood. There was one newly detected metabolite of BMPEA, which is proposed to be 1-amino-2-phenylpropan-2-ol. This proposed metabolite structure was determined through its fragmentation pattern by using the MSE acquisition mode of qTOF-MS. Further experiments are required to confirm the proposed chemical structure of this newly detected metabolite of BMPEA.
Author Contributions
Conceptualization, J.W. and A.A.; methodology, A.A.; software, A.A.; validation, A.A. and J.W.; formal analysis, A.A.; investigation, A.A.; resources, J.W.; data curation, A.A. and J.W.; writing—original draft preparation, I.A.; writing—review and editing, A.A., I.A. and J.W.; visualization, A.A. and I.A.; supervision, J.W.; project administration, J.W.; funding acquisition, A.A. All authors have read and agreed to the published version of the manuscript.
Funding
This research received no external funding.
Institutional Review Board Statement
The study protocol was approved by Laurentian University’s Animal Care Committee [Animal Use Protocol certificate number AUP 2017-09-01].
Informed Consent Statement
Not applicable.
Data Availability Statement
All relevant details are included in the article.
Acknowledgments
This research was conducted at Laurentian University in Sudbury, Ontario, Canada.
Conflicts of Interest
The authors declare no conflicts of interest.
References
- Hartung WH, Munch JC. Amino alcohols. VI. The preparation and pharmacodynamic activity of four isomeric phenylpropylamines. Journal of the American Chemical Society. 1931;53(5):1875-1879.
- Cohen PA, Bloszies C, Yee C, Gerona R. An amphetamine isomer whose efficacy and safety in humans has never been studied, β-methylphenylethylamine (BMPEA), is found in multiple dietary supplements. Drug testing and analysis. 2016;8(3-4):328-333.
- McGriff SA, Chojnacki MR, Thorndike EB, Rice KC, Baumann MH, Schindler CW. Reinforcing effects of phenethylamine analogs found in dietary supplements. Psychopharmacology. 2022;239(11):3723-3730.
- Schindler CW, Thorndike EB, Rice KC, Partilla JS, Baumann MH. The supplement adulterant β-methylphenethylamine increases blood pressure by acting at peripheral norepinephrine transporters. Journal of Pharmacology and Experimental Therapeutics. 2019;369(3):328-336.
- Duiven E, van Loon LJ, Spruijt L, Koert W, de Hon OM. Undeclared doping substances are highly prevalent in commercial sports nutrition supplements. Journal of Sports Science & Medicine. 2021;20(2):328.
- Walpurgis K, Thomas A, Geyer H, Mareck U, Thevis M. Dietary supplement and food contaminations and their implications for doping controls. Foods. 2020;9(8):1012.
- Alamir A, Watterson J, Attafi I. Development and Validation of a Uplc-Qtof-Ms Method for Blood Analysis of Isomeric Amphetamine-Related Drugs. Separations. 2022;9(10):285.
- Pawar RS, Grundel E, Fardin-Kia AR, Rader JI. Determination of selected biogenic amines in Acacia rigidula plant materials and dietary supplements using LC–MS/MS methods. Journal of pharmaceutical and biomedical analysis. 2014;88:457-466.
- World Anti-Doping Code International Standard Prohibited List. 2025. https://www.wada-ama.org/sites/default/files/2024-09/2025list_en_final_clean_12_september_2024.pdf. Accessed 06 February 2025.
- Amatto AN, Amatto MD, Jaime CY. Preworkout supplement induced hemorrhagic stroke: a case report. Clinical Journal of Sport Medicine. 2021;31(6):e506-e508.
- Cohen PA, Zeijlon R, Nardin R, Keizers PH, Venhuis B. Hemorrhagic stroke probably caused by exercise combined with a sports supplement containing β-methylphenyl-ethylamine (BMPEA): a case report. Annals of Internal Medicine. 2015;162(12):879-880.
- Shannon HE, Cone EJ, Yousefnejad D. Physiologic effects and plasma kinetics of beta-phenylethylamine and its N-methyl homolog in the dog. Journal of Pharmacology and Experimental Therapeutics. 1982;223(1):190-196.
- Barceloux DG. Medical toxicology of drug abuse: synthesized chemicals and psychoactive plants. John Wiley & Sons; 2012.
- Penner N, Ramanathan R, Zgoda-Pols J, Chowdhury S. Quantitative determination of hippuric and benzoic acids in urine by LC–MS/MS using surrogate standards. Journal of pharmaceutical and biomedical analysis. 2010;52(4):534-543.
- Chołbiński P, Wicka M, Kowalczyk K, et al. Detection of β-methylphenethylamine, a novel doping substance, by means of UPLC/MS/MS. Analytical and bioanalytical chemistry. 2014;406:3681-3688.
- Zhou S-S, Xu J-D, Zhu H, et al. Simultaneous determination of original, degraded ginsenosides and aglycones by ultra high performance liquid chromatography coupled with quadrupole time-of-flight mass spectrometry for quantitative evaluation of Du-Shen-Tang, the decoction of ginseng. Molecules. 2014;19(4):4083-4104.
Figure 1.
Chemical structures of amphetamine and β-methylphenethylamine.
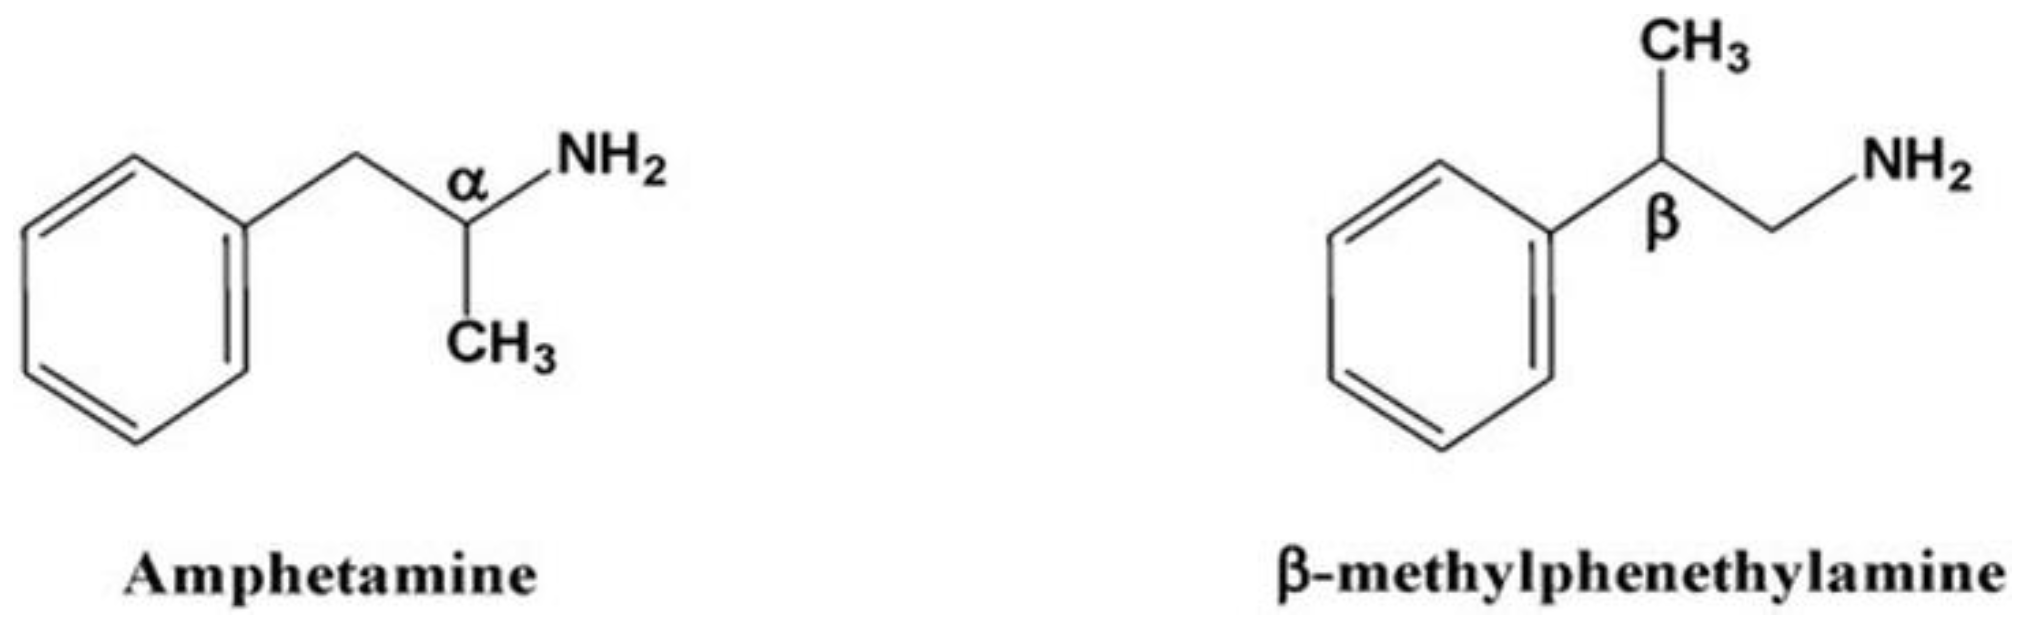
Figure 2.
Total ion chromatogram of extracted rat postmortem whole blood; (a) drug-free control, and (b) spiked with 800 ng/mL of the combined working solution and 500 ng/mL of the internal standard solution; (1) ephedrine-d3, (2) amphetamine-d11 and (3) β-methylphenethylamine.
Figure 2.
Total ion chromatogram of extracted rat postmortem whole blood; (a) drug-free control, and (b) spiked with 800 ng/mL of the combined working solution and 500 ng/mL of the internal standard solution; (1) ephedrine-d3, (2) amphetamine-d11 and (3) β-methylphenethylamine.
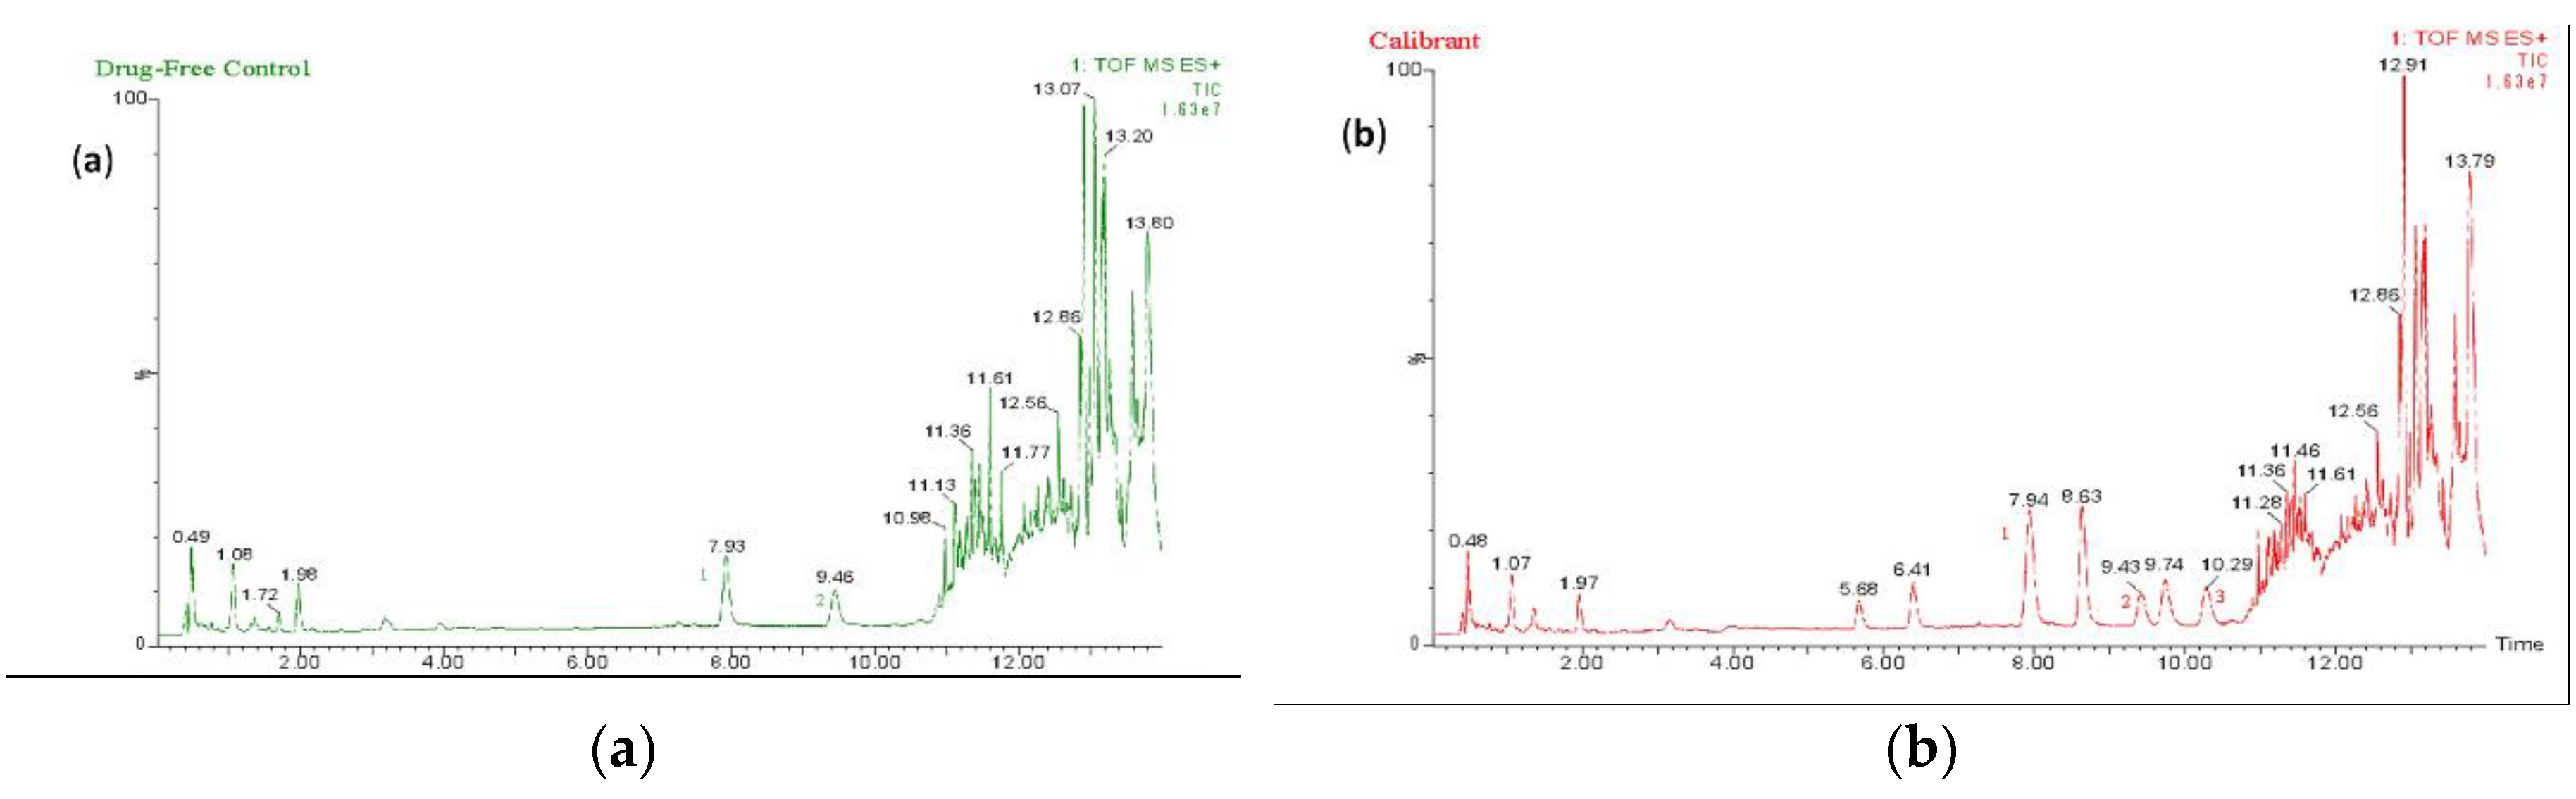
Figure 3.
Averaged quadratic calibration curve of β-methylphenethylamine. Error bars represent the standard error of the mean of the response ratio of duplicate samples at each concentration level.
Figure 3.
Averaged quadratic calibration curve of β-methylphenethylamine. Error bars represent the standard error of the mean of the response ratio of duplicate samples at each concentration level.
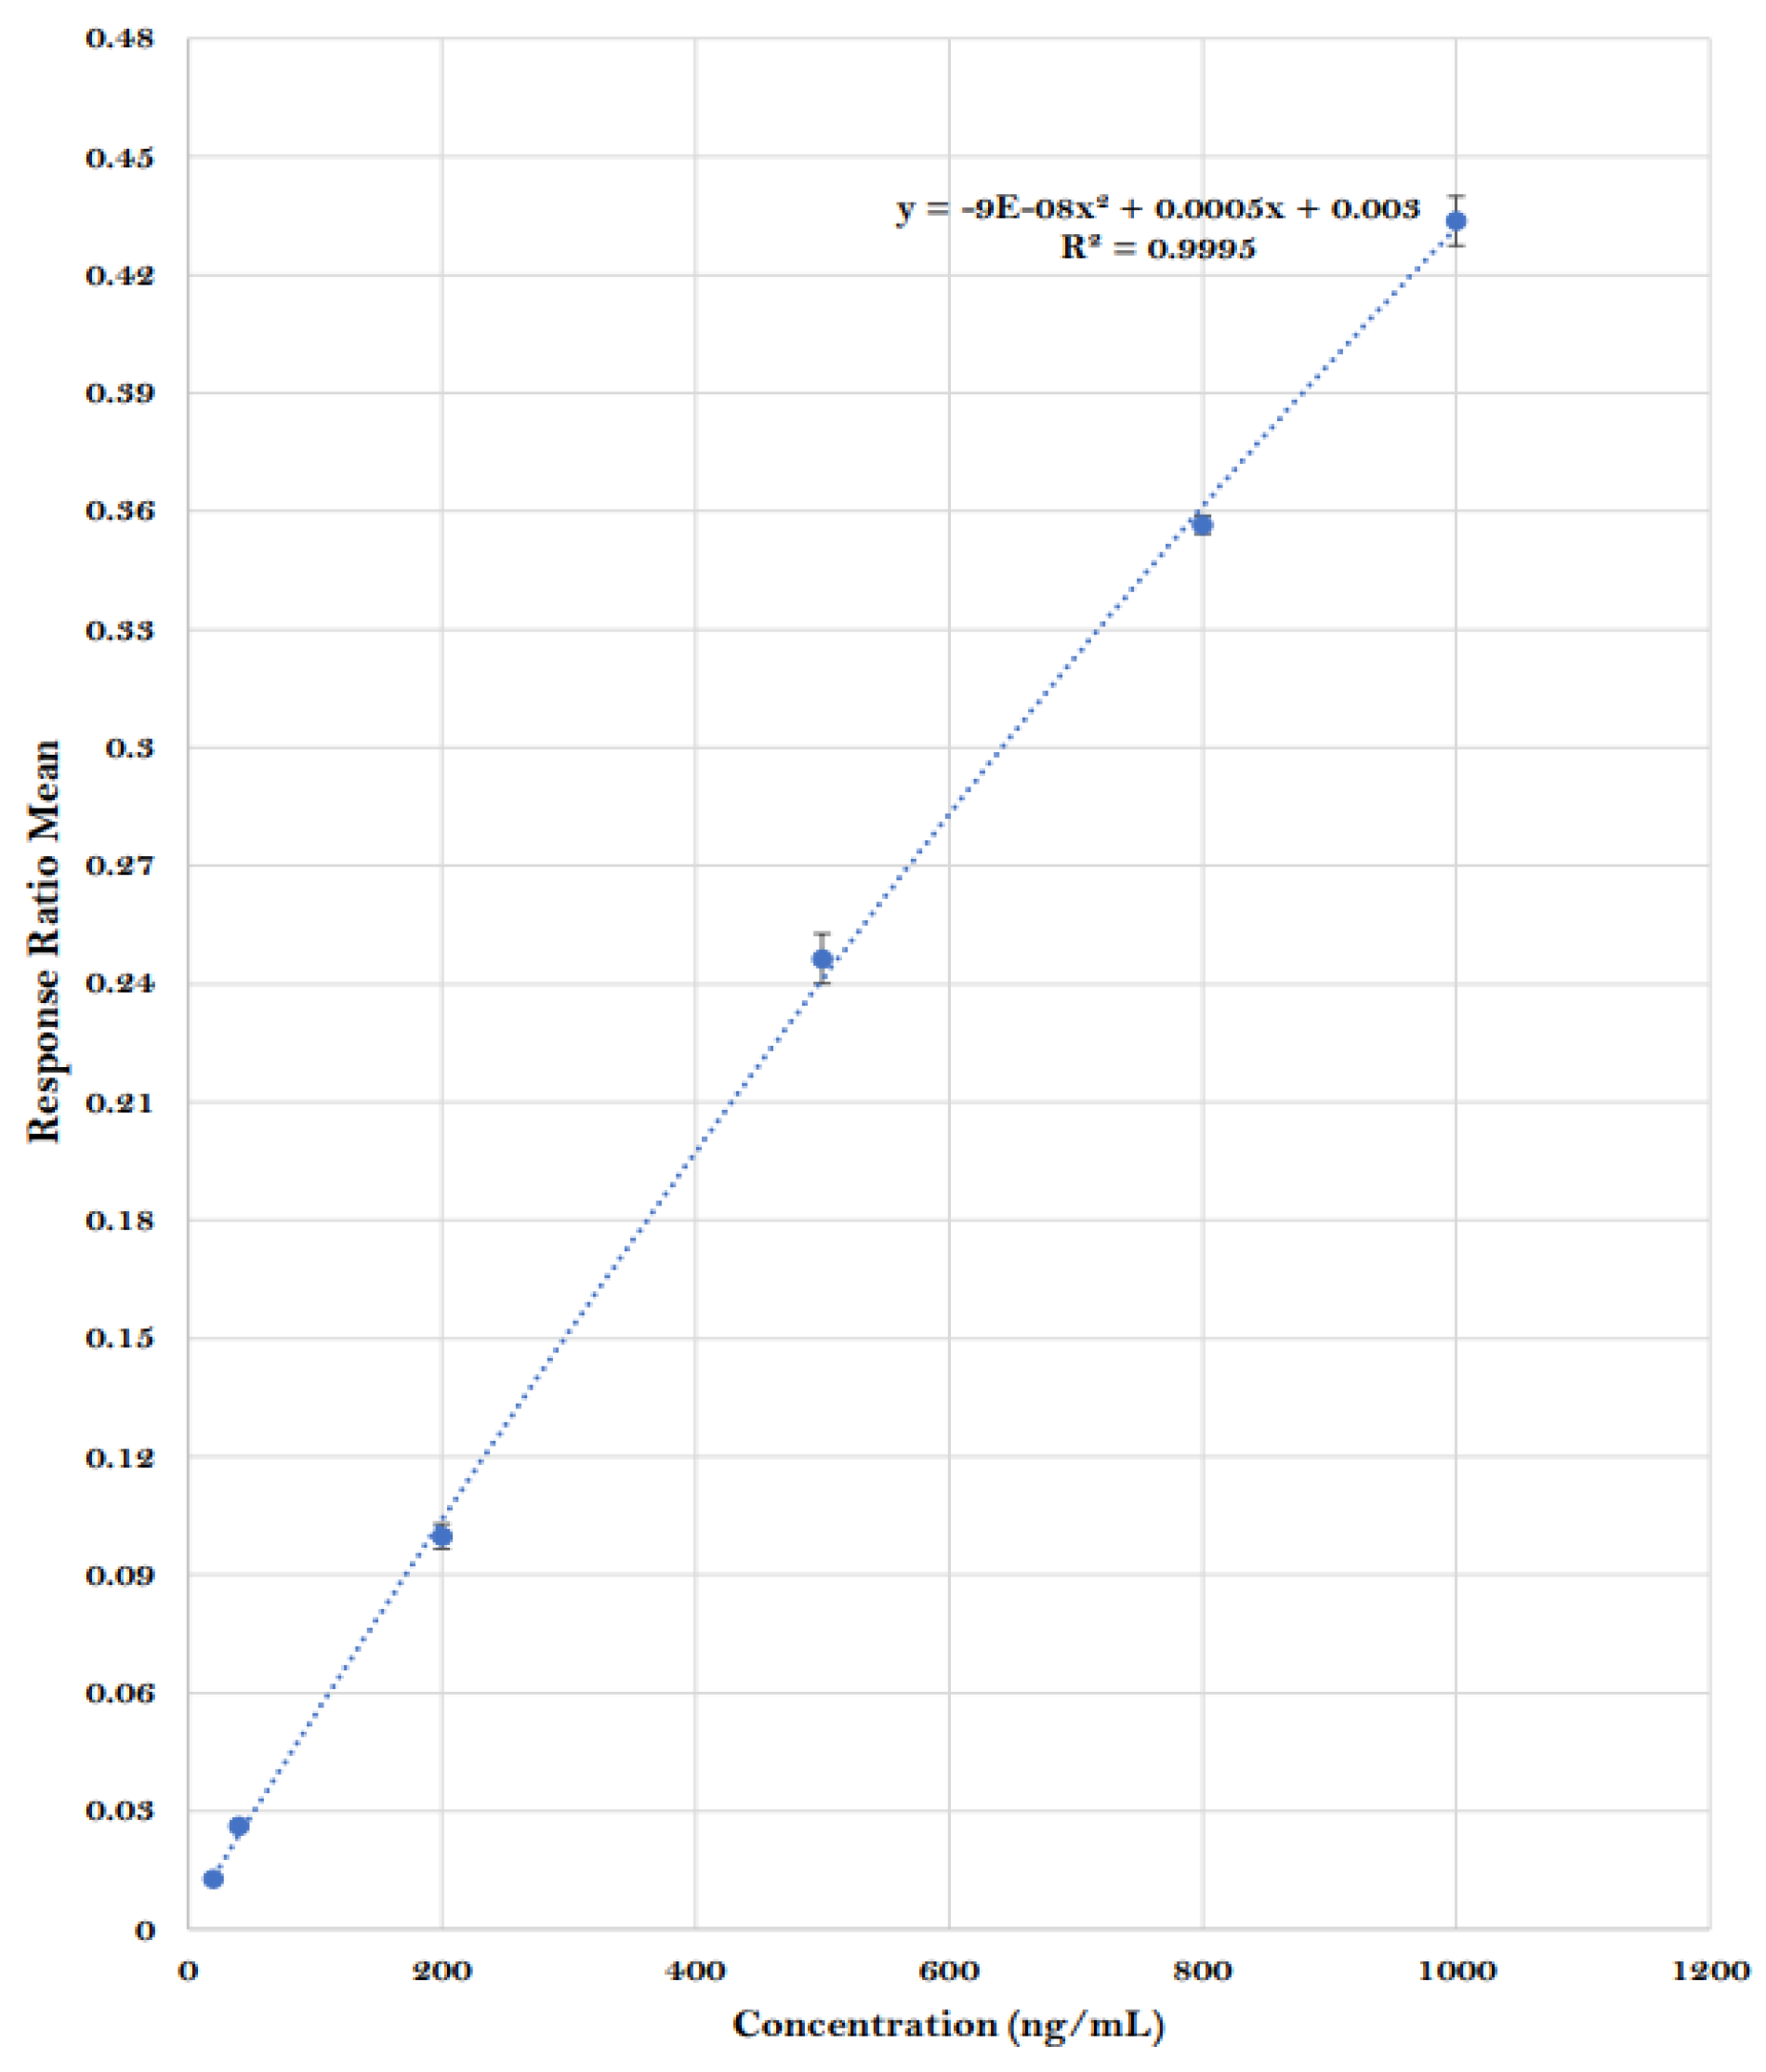
Figure 4.
Extracted ion chromatograms (a 1-5) obtained using the molecular ion m/z 119 for β-methylphenethylamine from extracts of perimortem whole-blood (rat) samples: (a 1) high delayed-dose, (a 2) high-dose, and (a 3) low-dose; (a 4) calibrant at a concentration of 1,000 ng/mL; (a 5) drug-free control. Mass spectral profile (b 1-4) of β-methylphenethylamine in extracts of perimortem whole-blood samples: (b 1) high delayed -dose, (b 2) high-dose, and (b 3) low-dose; (b 4) calibrant at a concentration of 1,000 ng/mL.
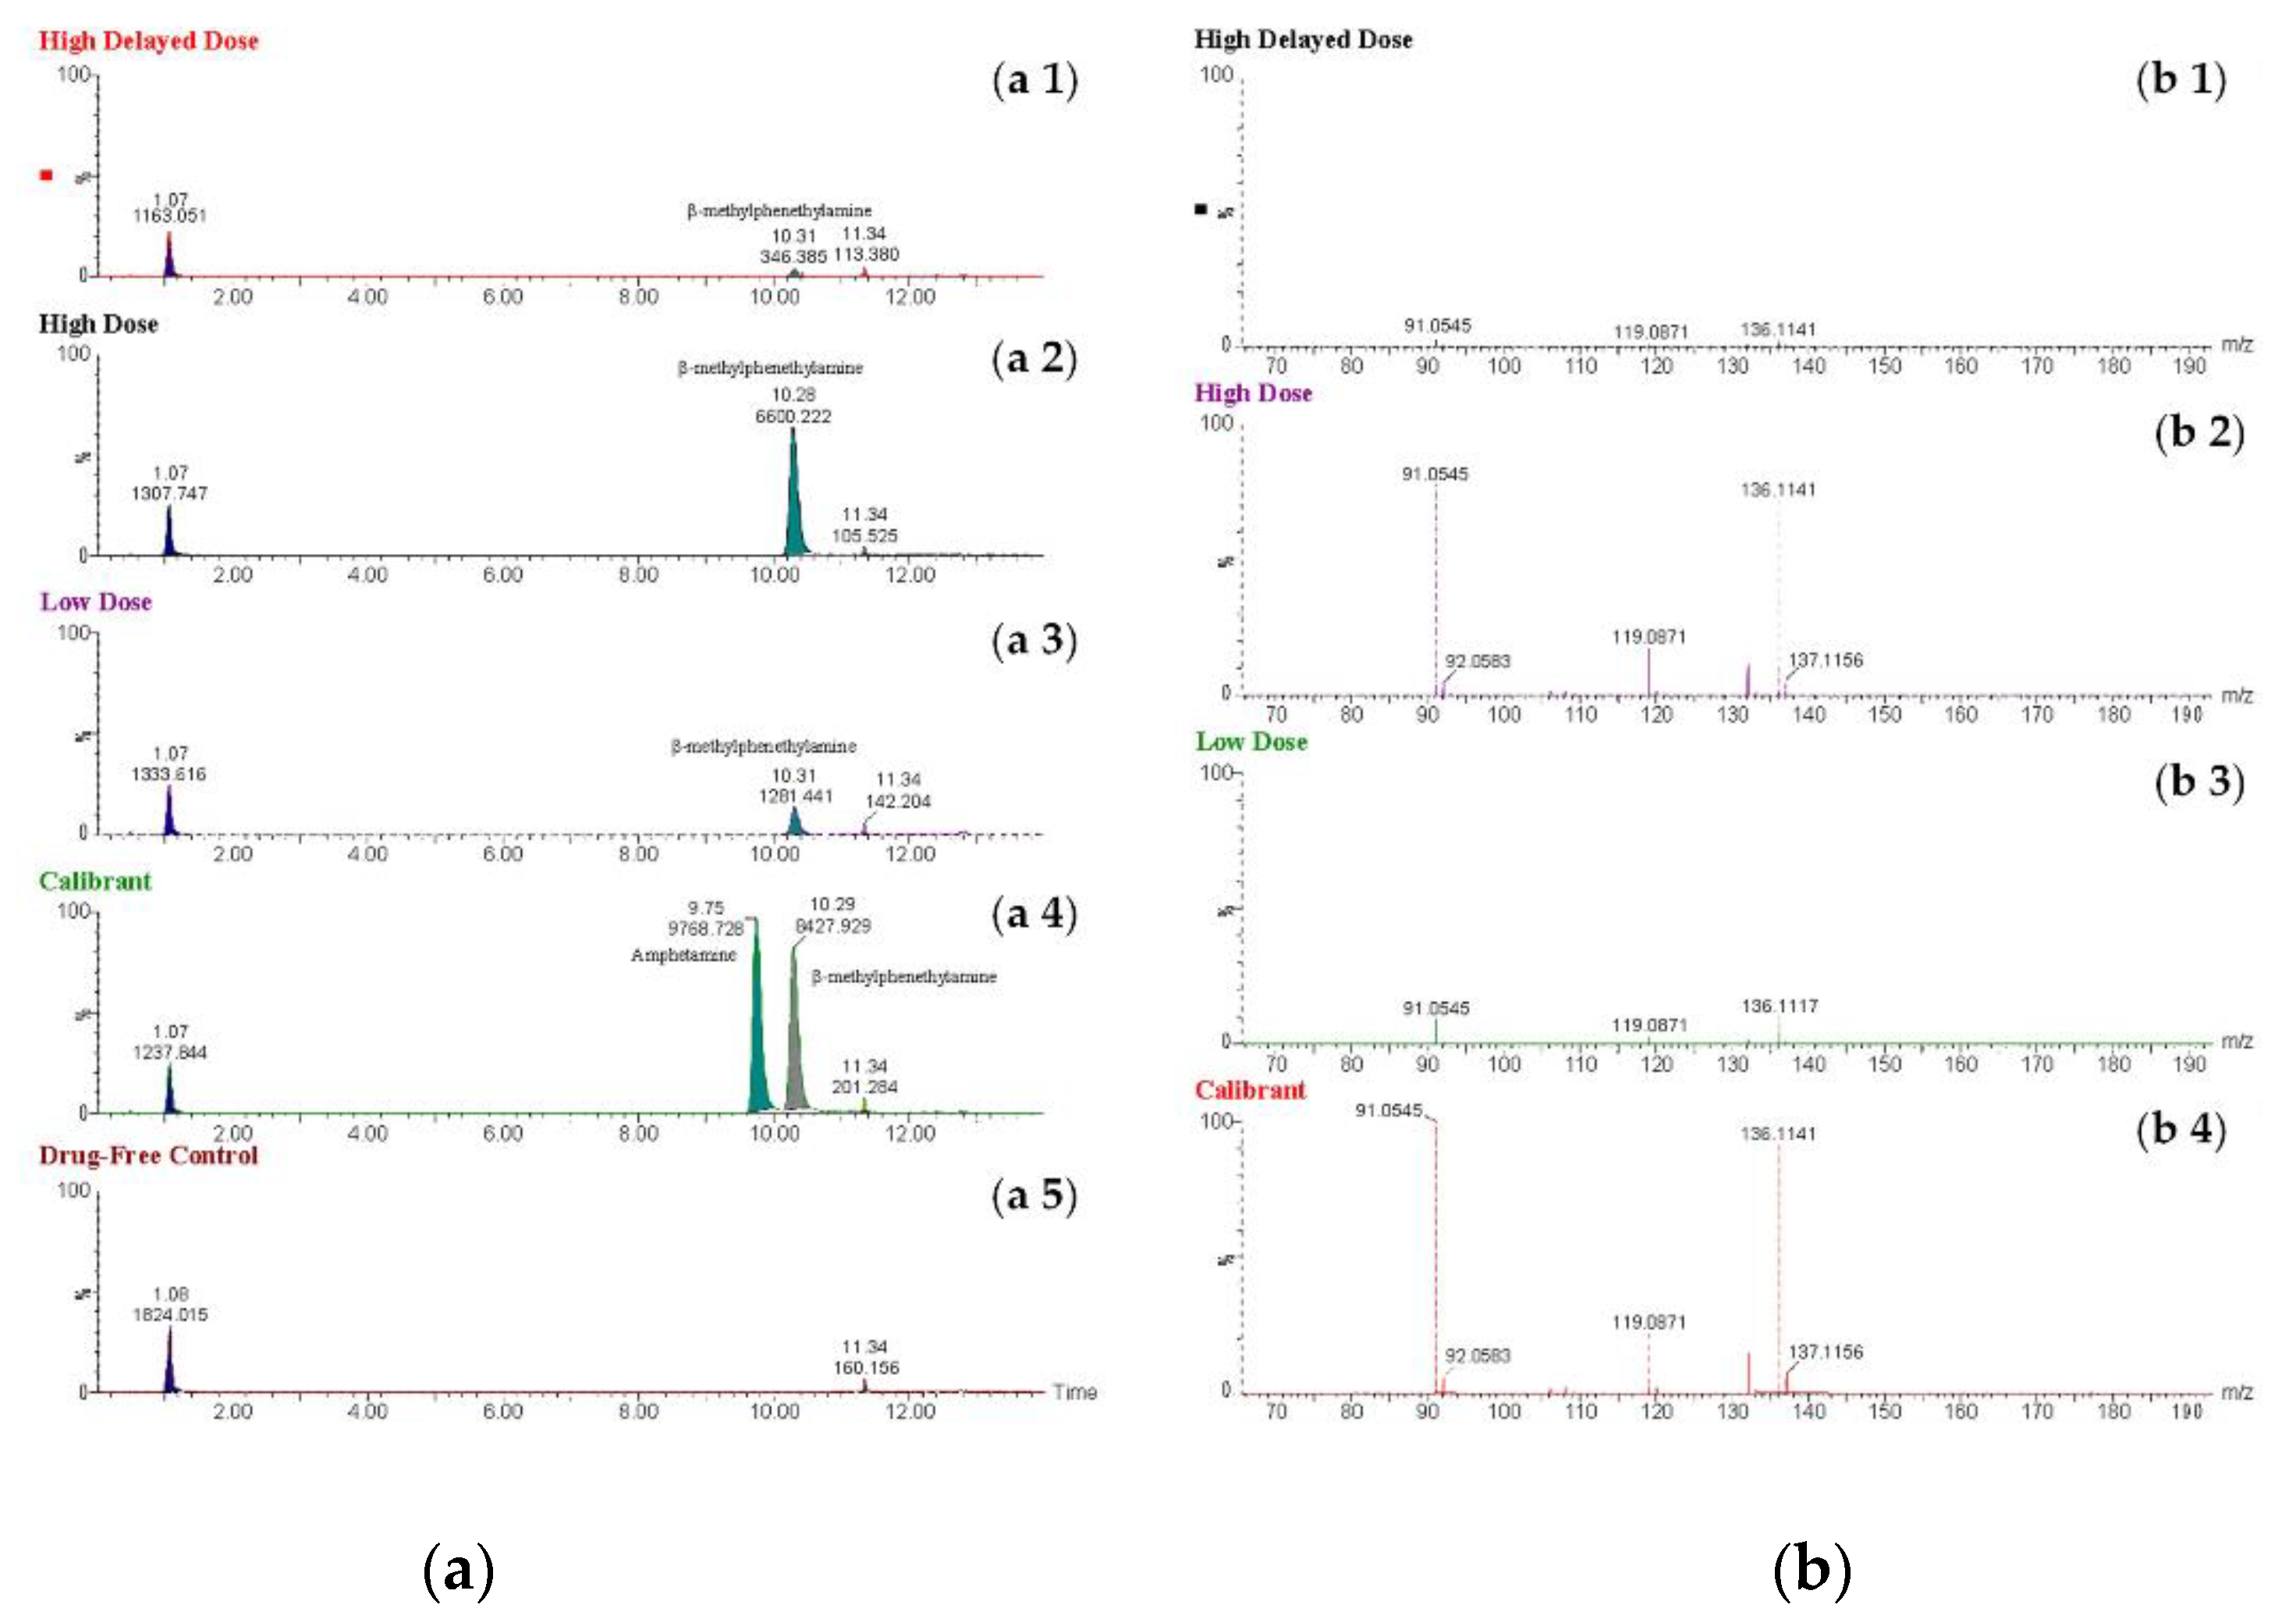
Figure 5.
Extracted ion chromatograms (a 1–4) obtained using the fragmented ion m/z 134 for β-methylphenethylamine in extracts of perimortem whole-blood samples: (a 1) high delayed-dose, (a 2) high-dose, and (a 3) low-dose; (a 4) drug-free control. Mass spectra of the proposed metabolite of β-methylphenethylamine obtained at low energy (b 1) and high energy (b 2).
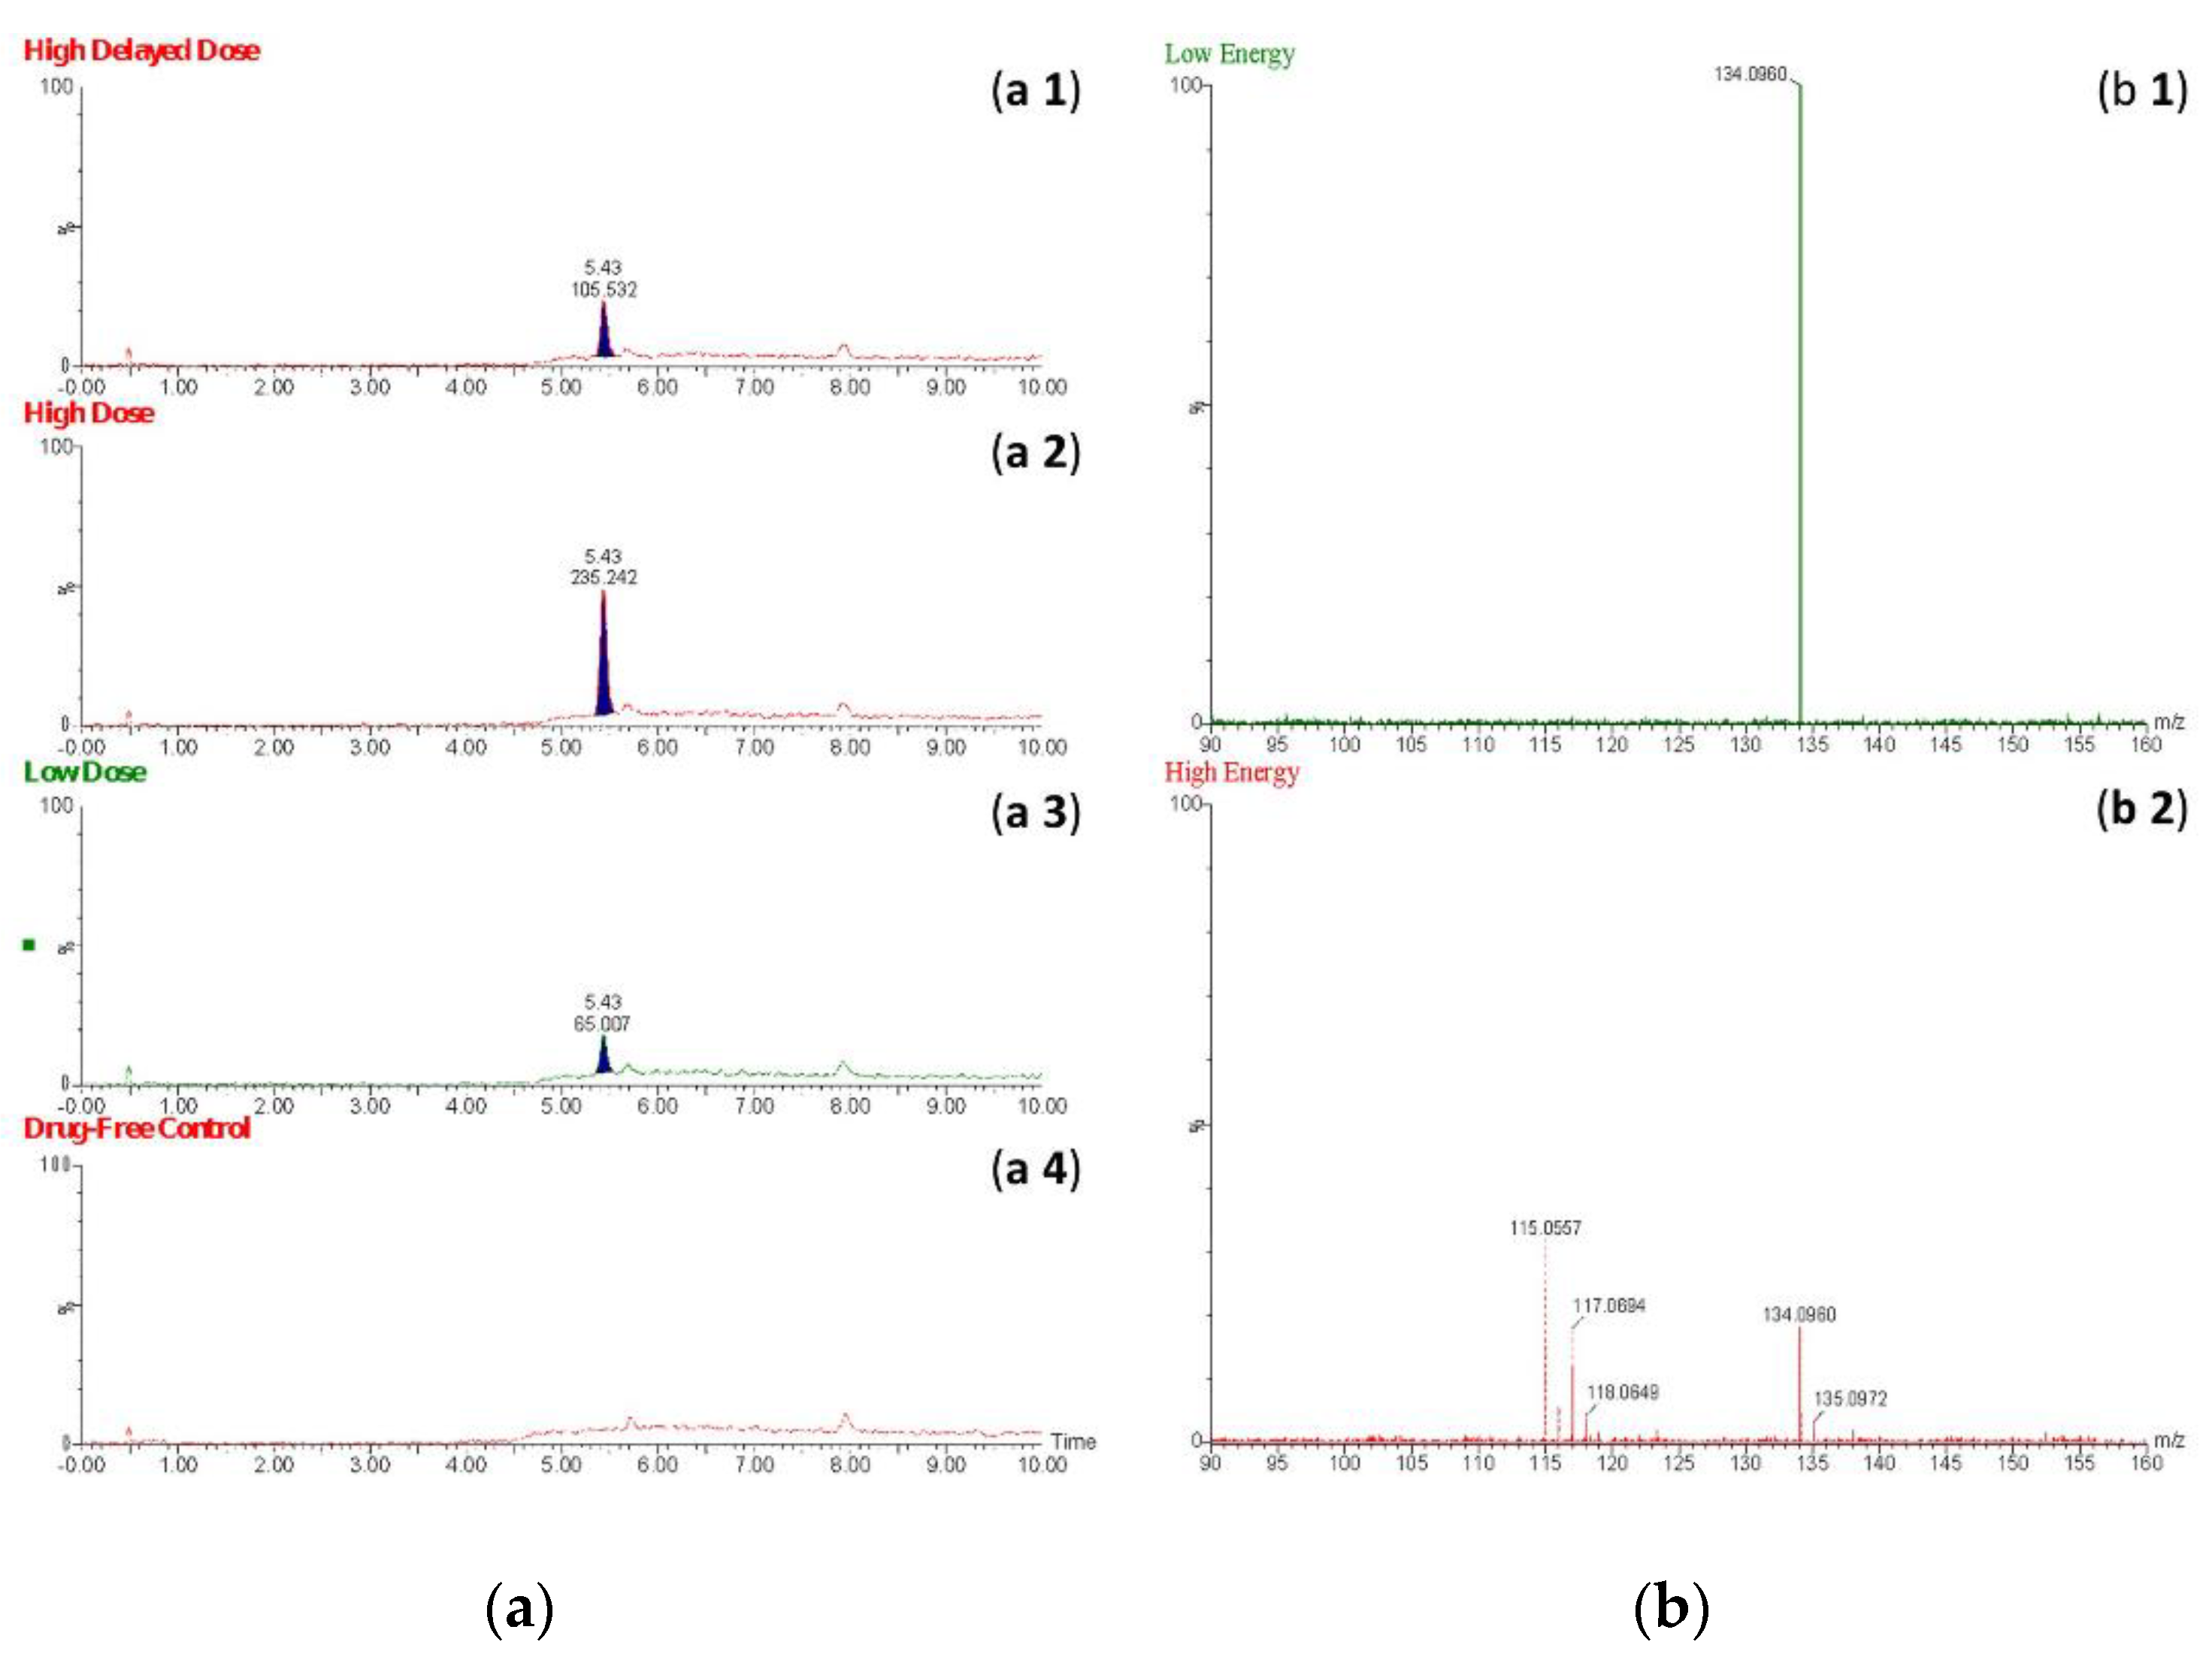
Figure 6.
Extracted ion chromatograms obtained using the fragmented ion m/z 134 for (a) the metabolite of β-methylphenethylamine in extracts of the high-dose rat perimortem whole-blood samples and (b) norephedrine and cathine at a concentration of 20 ng/mL in the calibrant.
Figure 6.
Extracted ion chromatograms obtained using the fragmented ion m/z 134 for (a) the metabolite of β-methylphenethylamine in extracts of the high-dose rat perimortem whole-blood samples and (b) norephedrine and cathine at a concentration of 20 ng/mL in the calibrant.
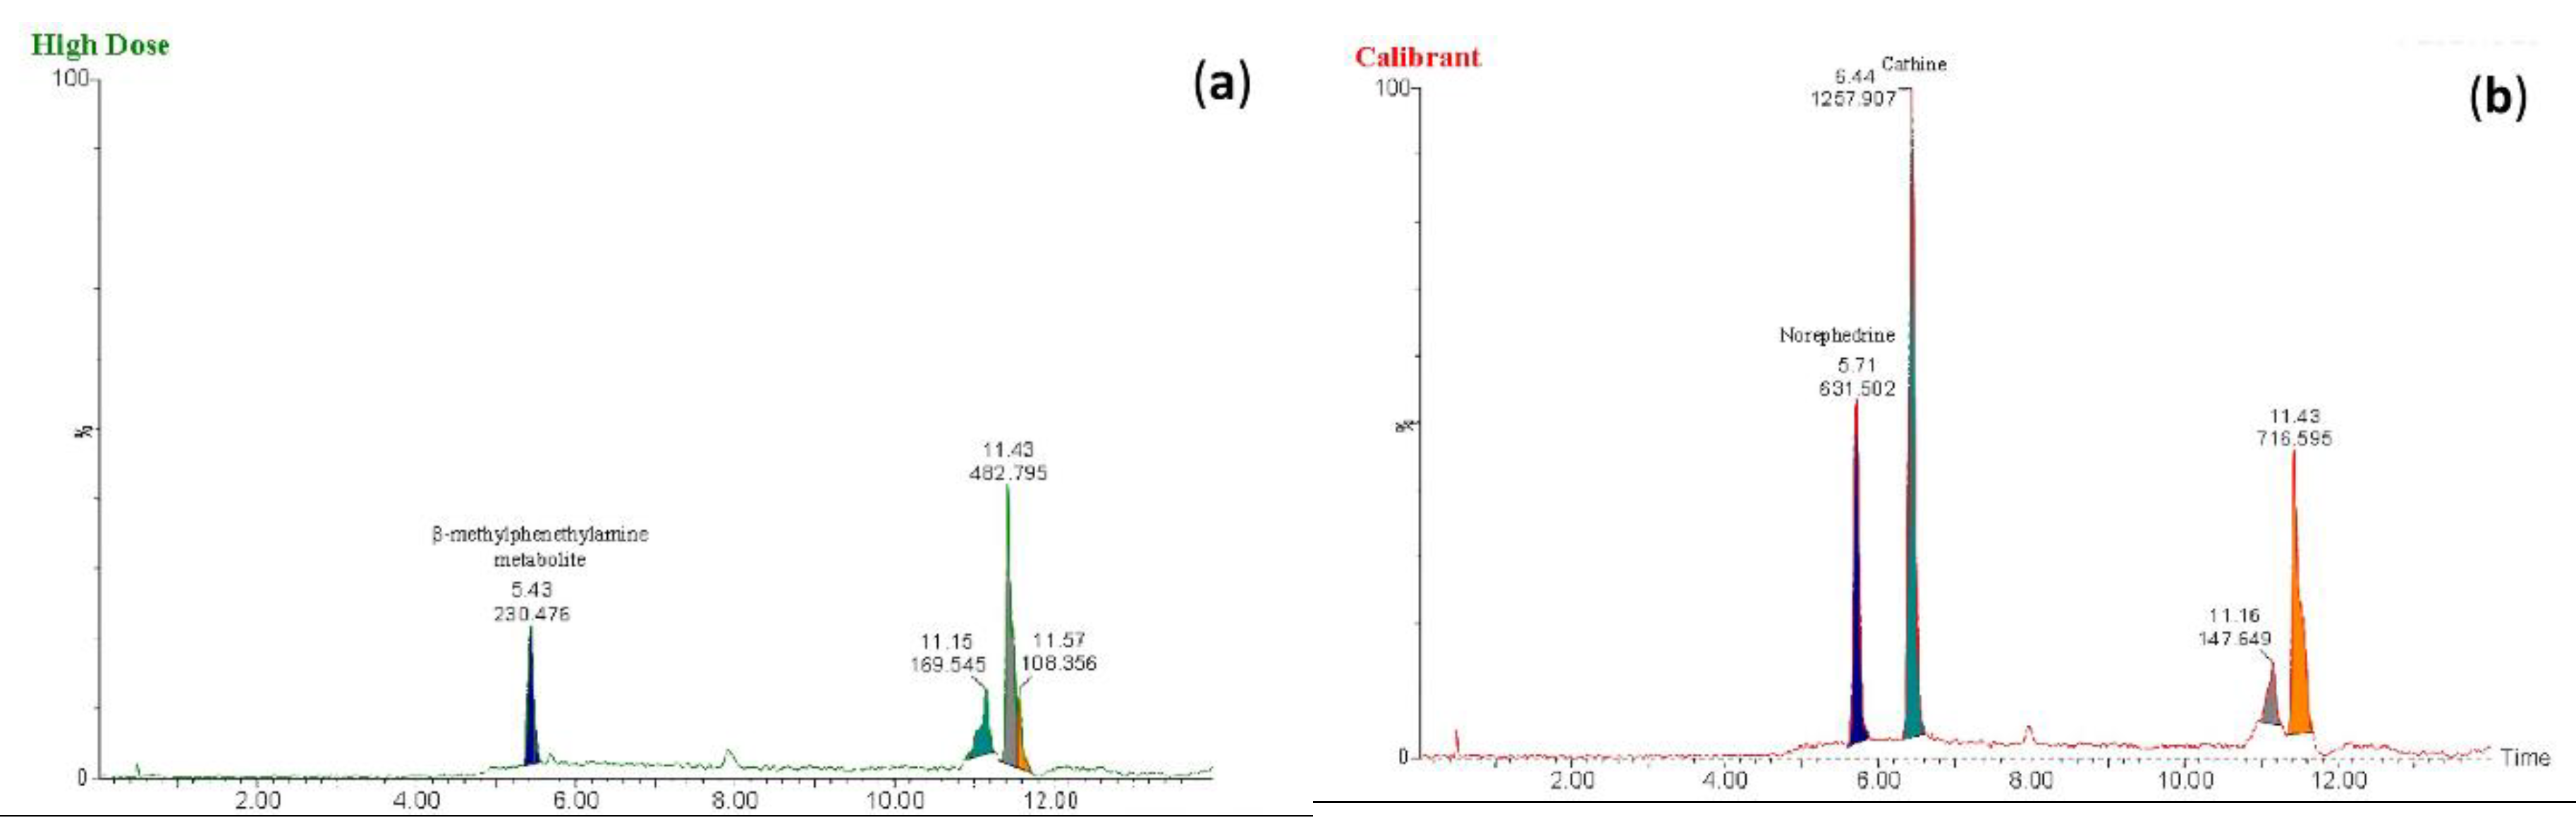
Figure 7.
Mass spectra obtained at low energy (a) and high energy (b) for (a 1 and b 1) the proposed metabolite of β-methylphenethylamine and (a 2 and b 2) norephedrine at a concentration of 20 ng/mL.
Figure 7.
Mass spectra obtained at low energy (a) and high energy (b) for (a 1 and b 1) the proposed metabolite of β-methylphenethylamine and (a 2 and b 2) norephedrine at a concentration of 20 ng/mL.
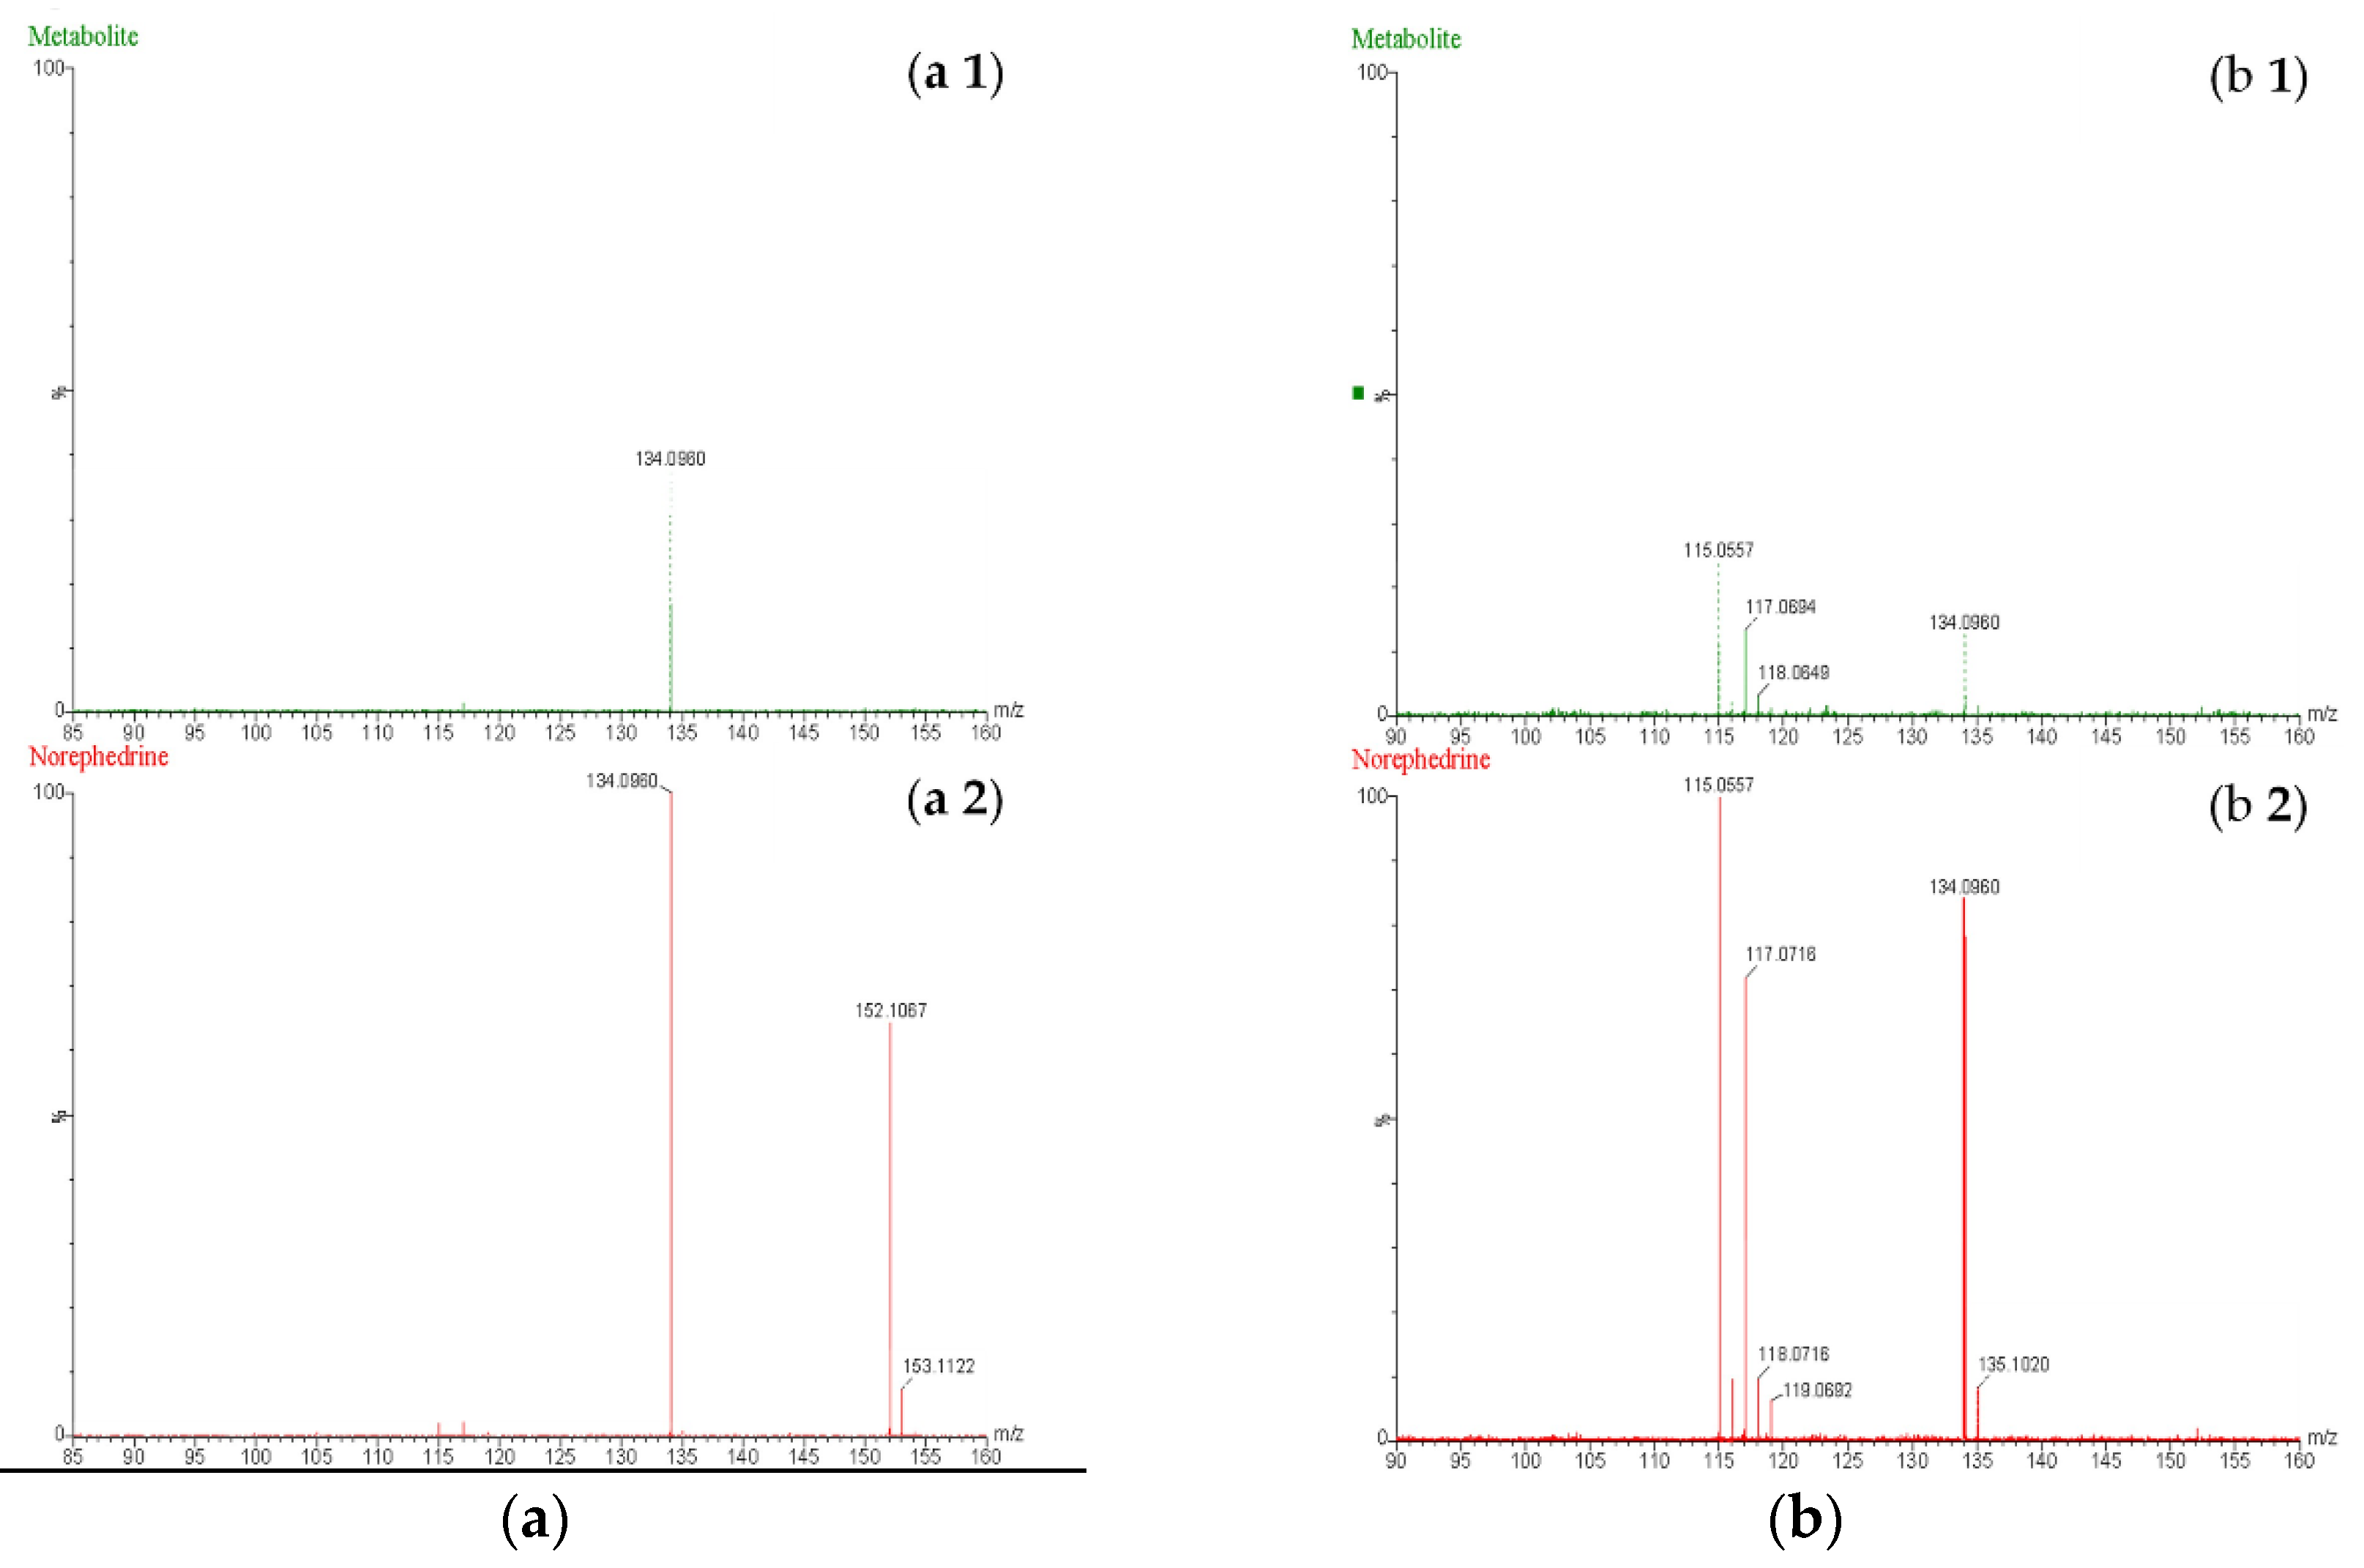
Figure 8.
Mass spectra obtained at low energy (a) and high energy (b) for the proposed metabolite of β-methylphenethylamine (a 1 and b 1) and cathine (a 2 and b 2) at a concentration of 20 ng/mL.
Figure 8.
Mass spectra obtained at low energy (a) and high energy (b) for the proposed metabolite of β-methylphenethylamine (a 1 and b 1) and cathine (a 2 and b 2) at a concentration of 20 ng/mL.
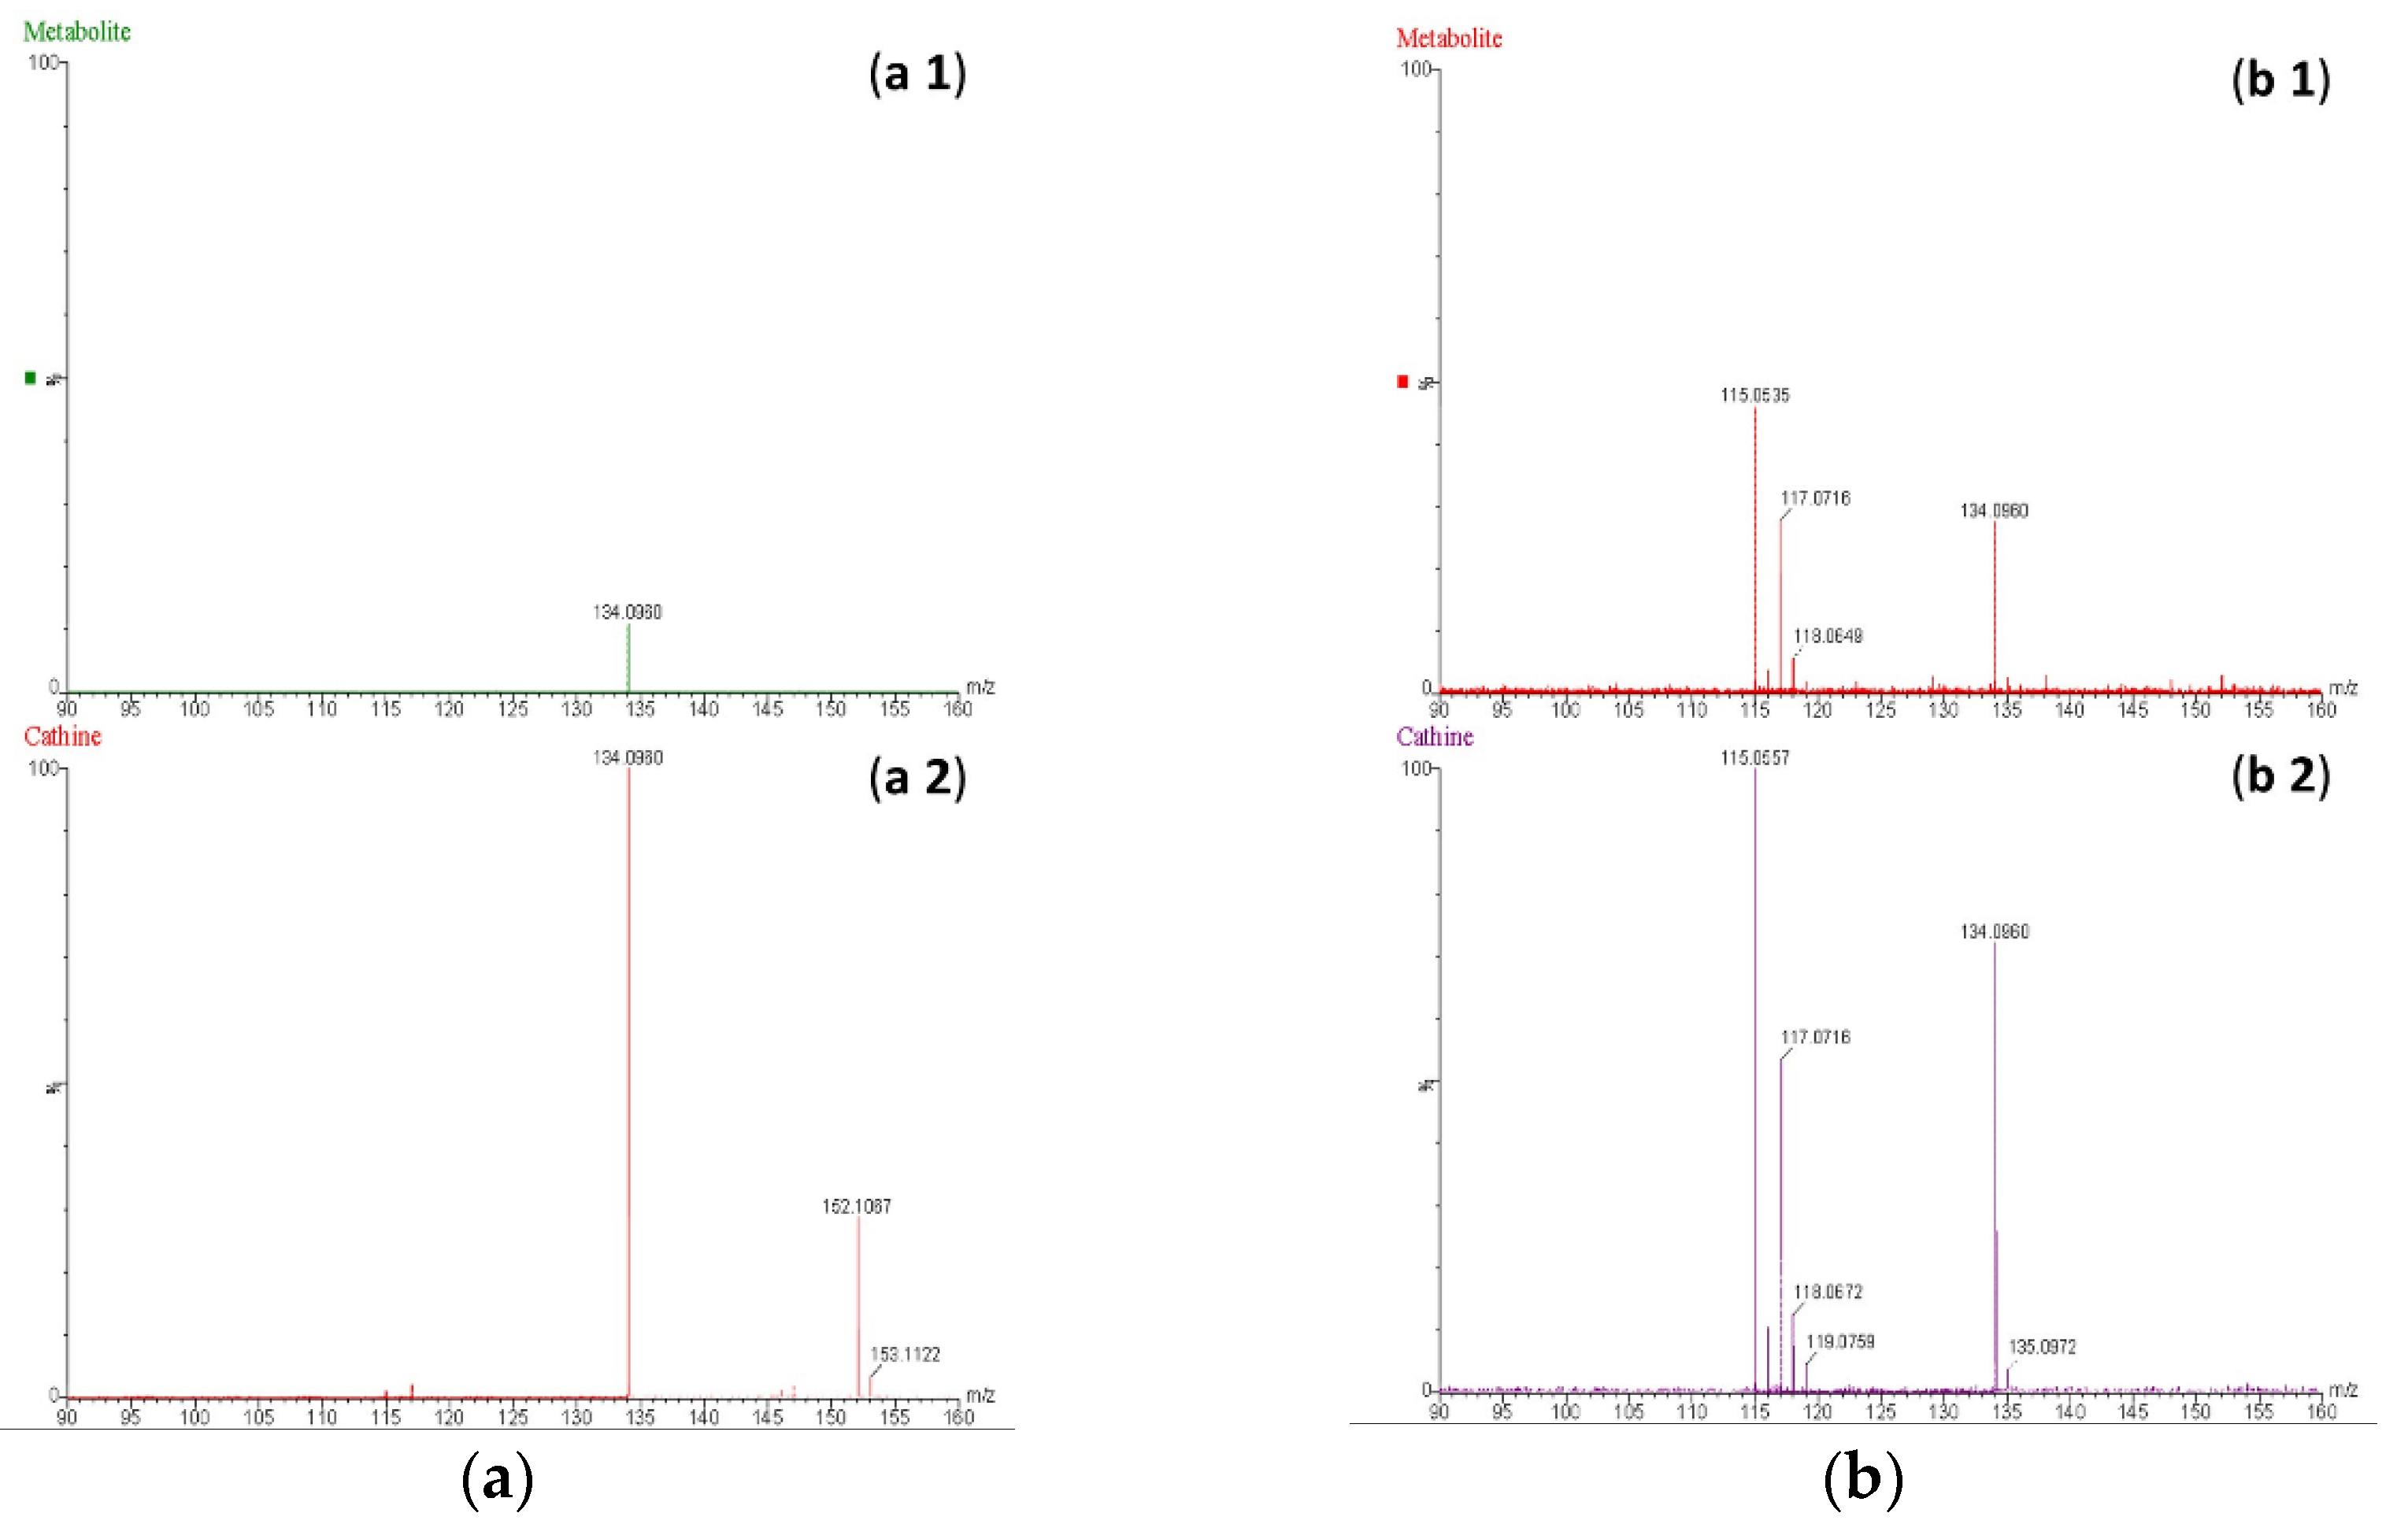
Figure 9.
Proposed metabolic pathway of β-methylphenethylamine.
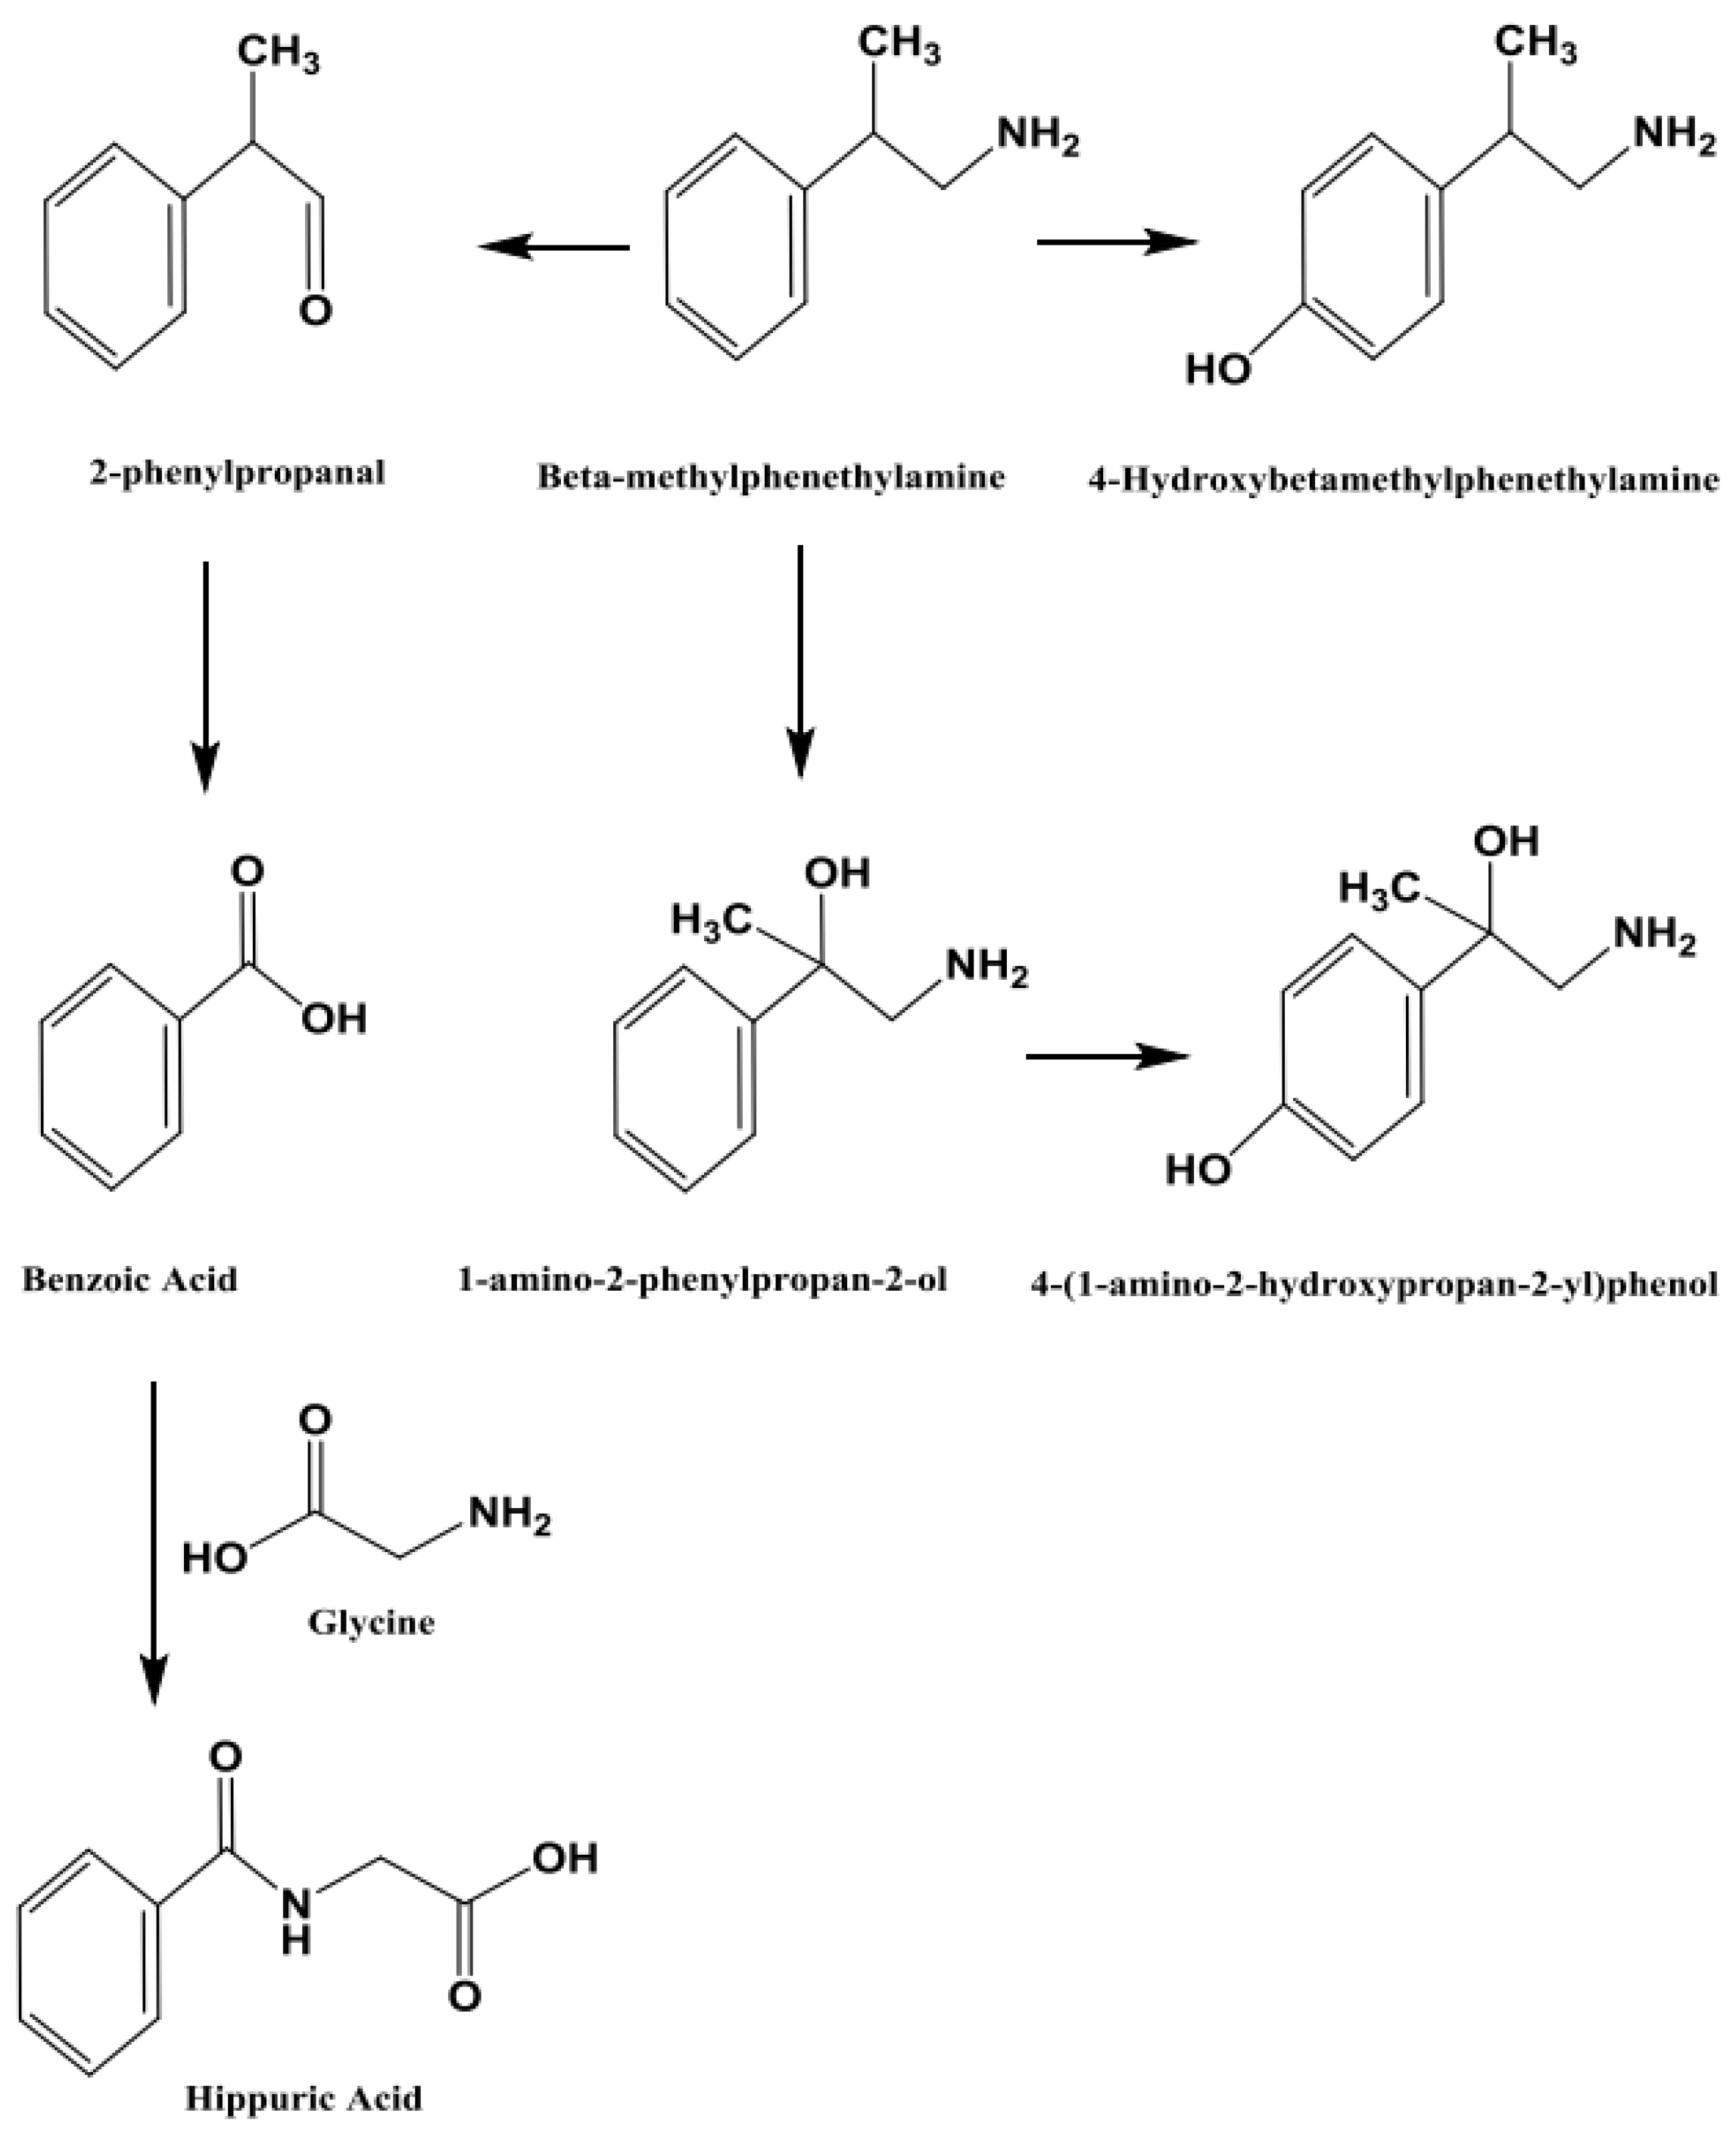
Figure 10.
Proposed chemical structures and fragmentation pattern of the metabolite of β-methylphenethylamine.
Figure 10.
Proposed chemical structures and fragmentation pattern of the metabolite of β-methylphenethylamine.
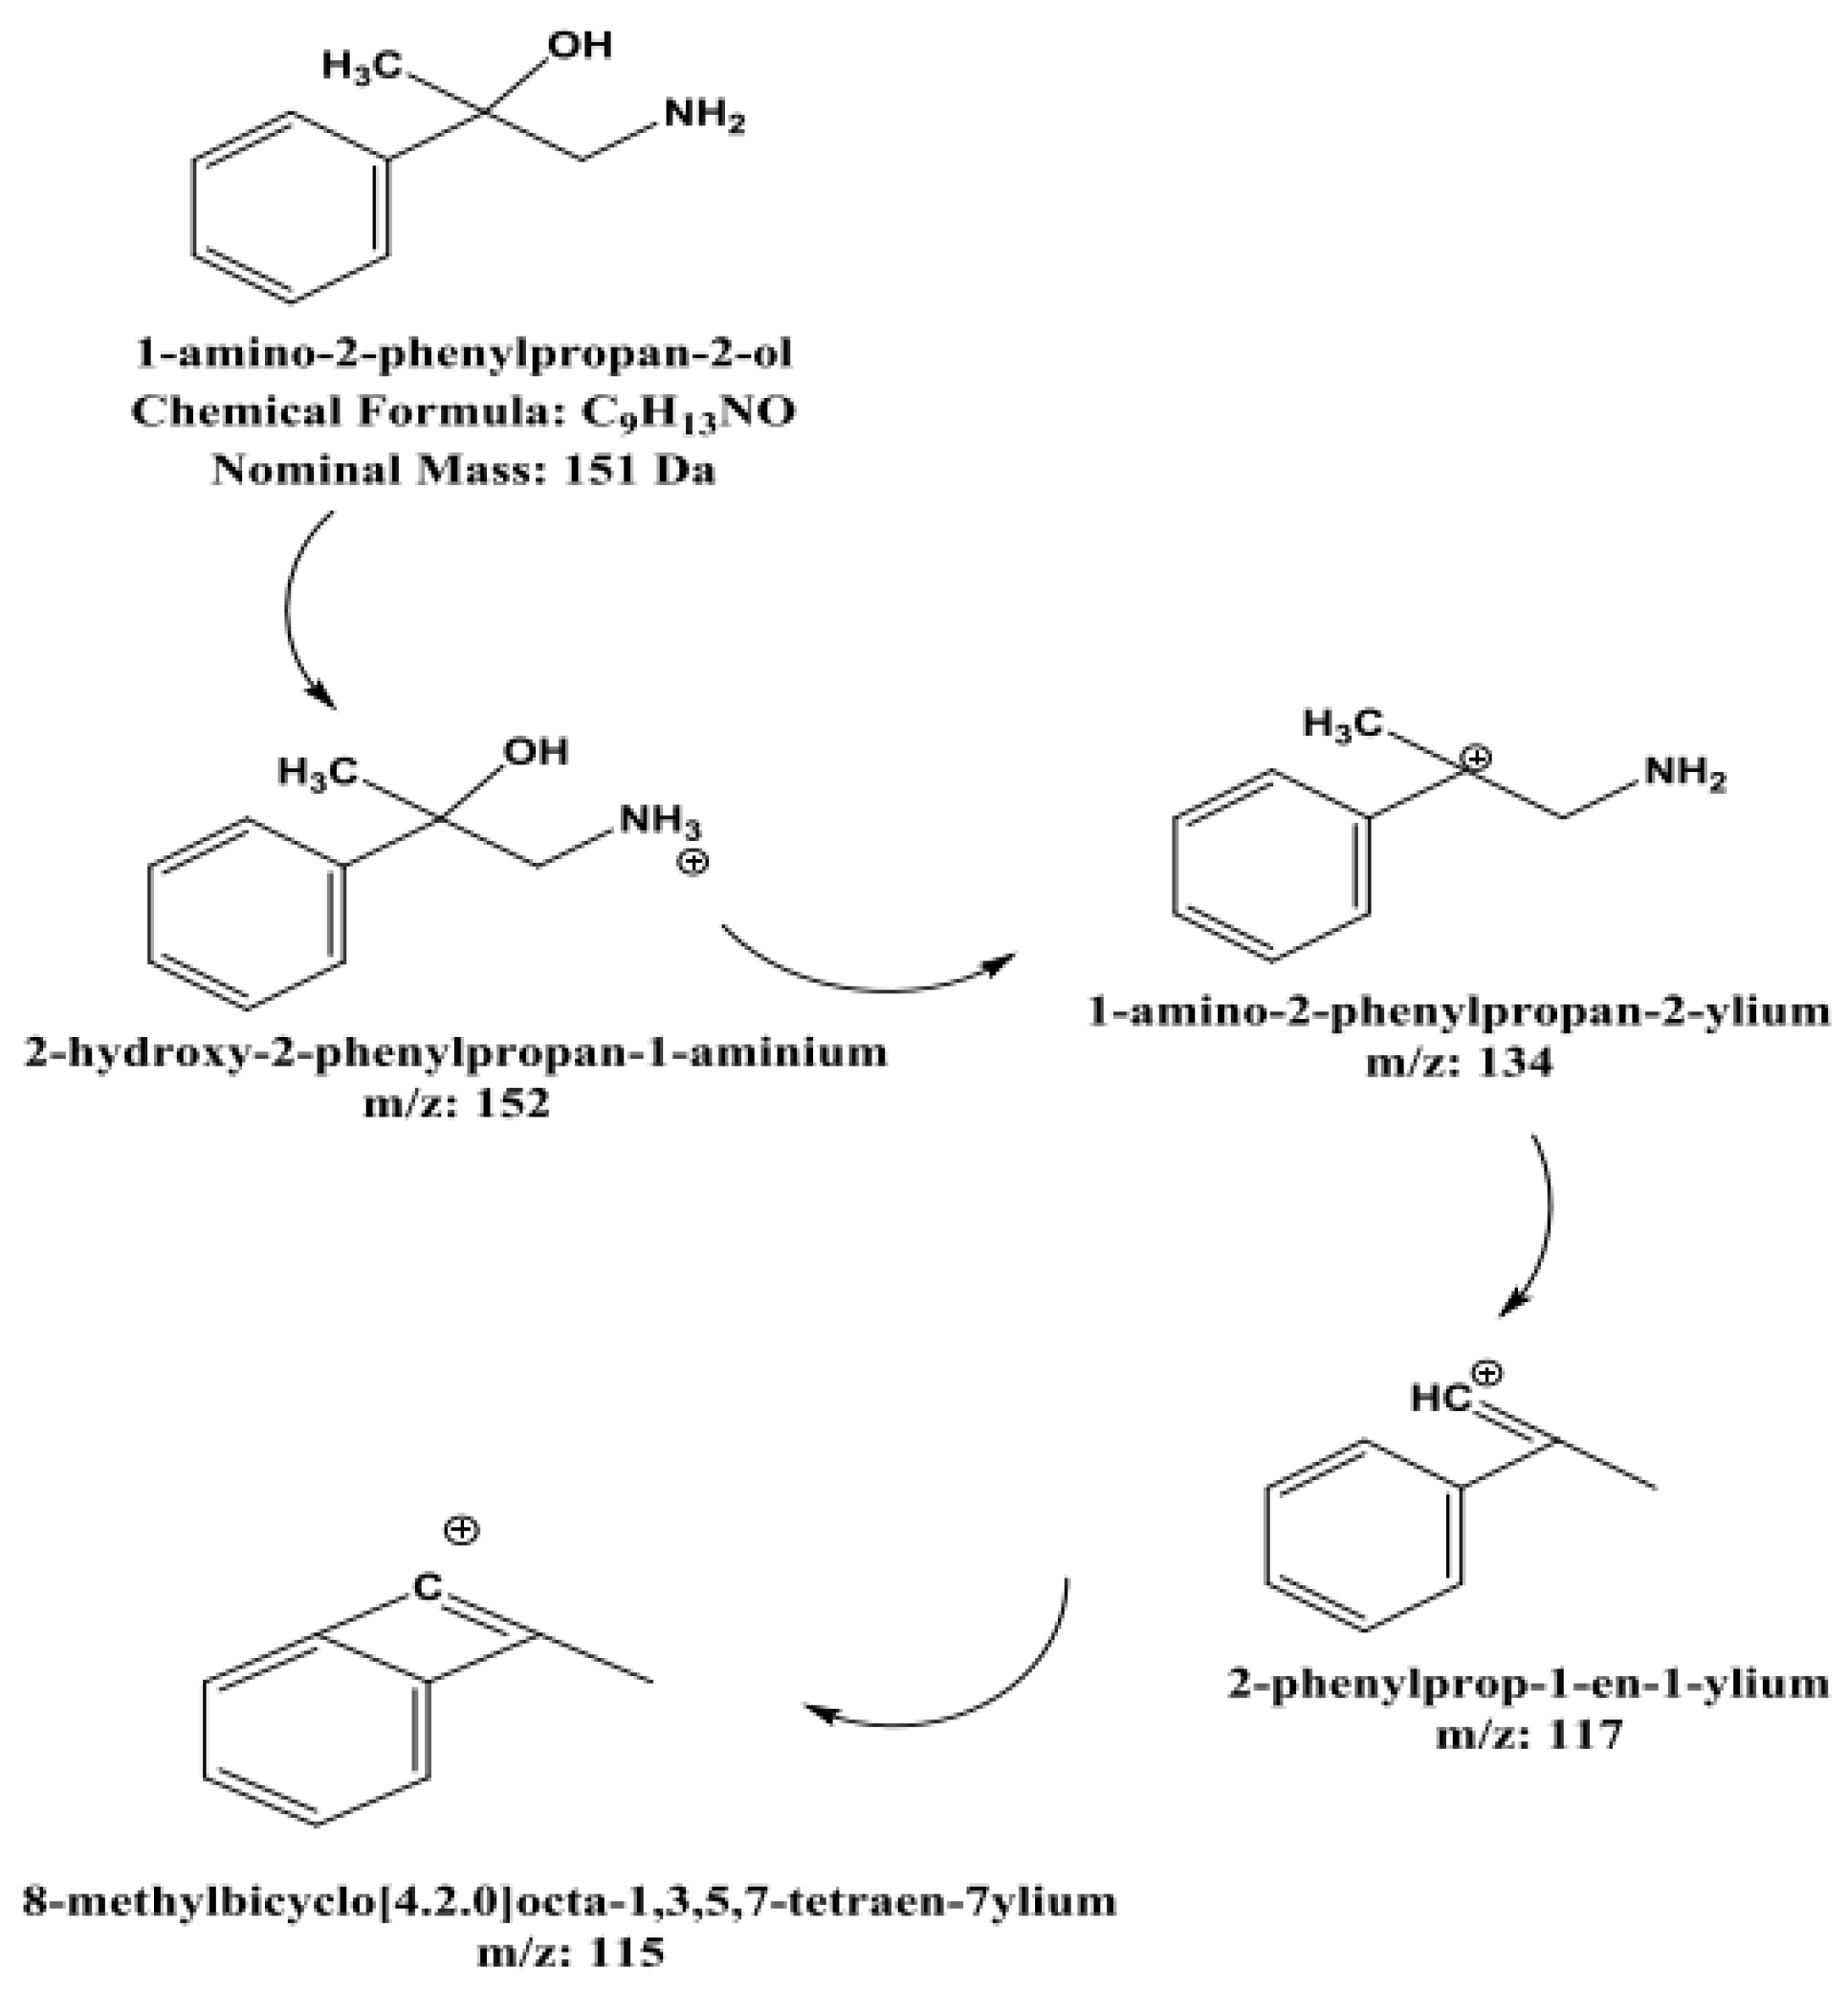
Figure 11.
Proposed fragmentation pattern of the metabolite of β-methylphenethylamine presented on the mass spectral profile of β-methylphenethylamine, obtained at high energy (a). Second proposed chemical structures of the metabolite of β-methylphenethylamine (b).
Figure 11.
Proposed fragmentation pattern of the metabolite of β-methylphenethylamine presented on the mass spectral profile of β-methylphenethylamine, obtained at high energy (a). Second proposed chemical structures of the metabolite of β-methylphenethylamine (b).
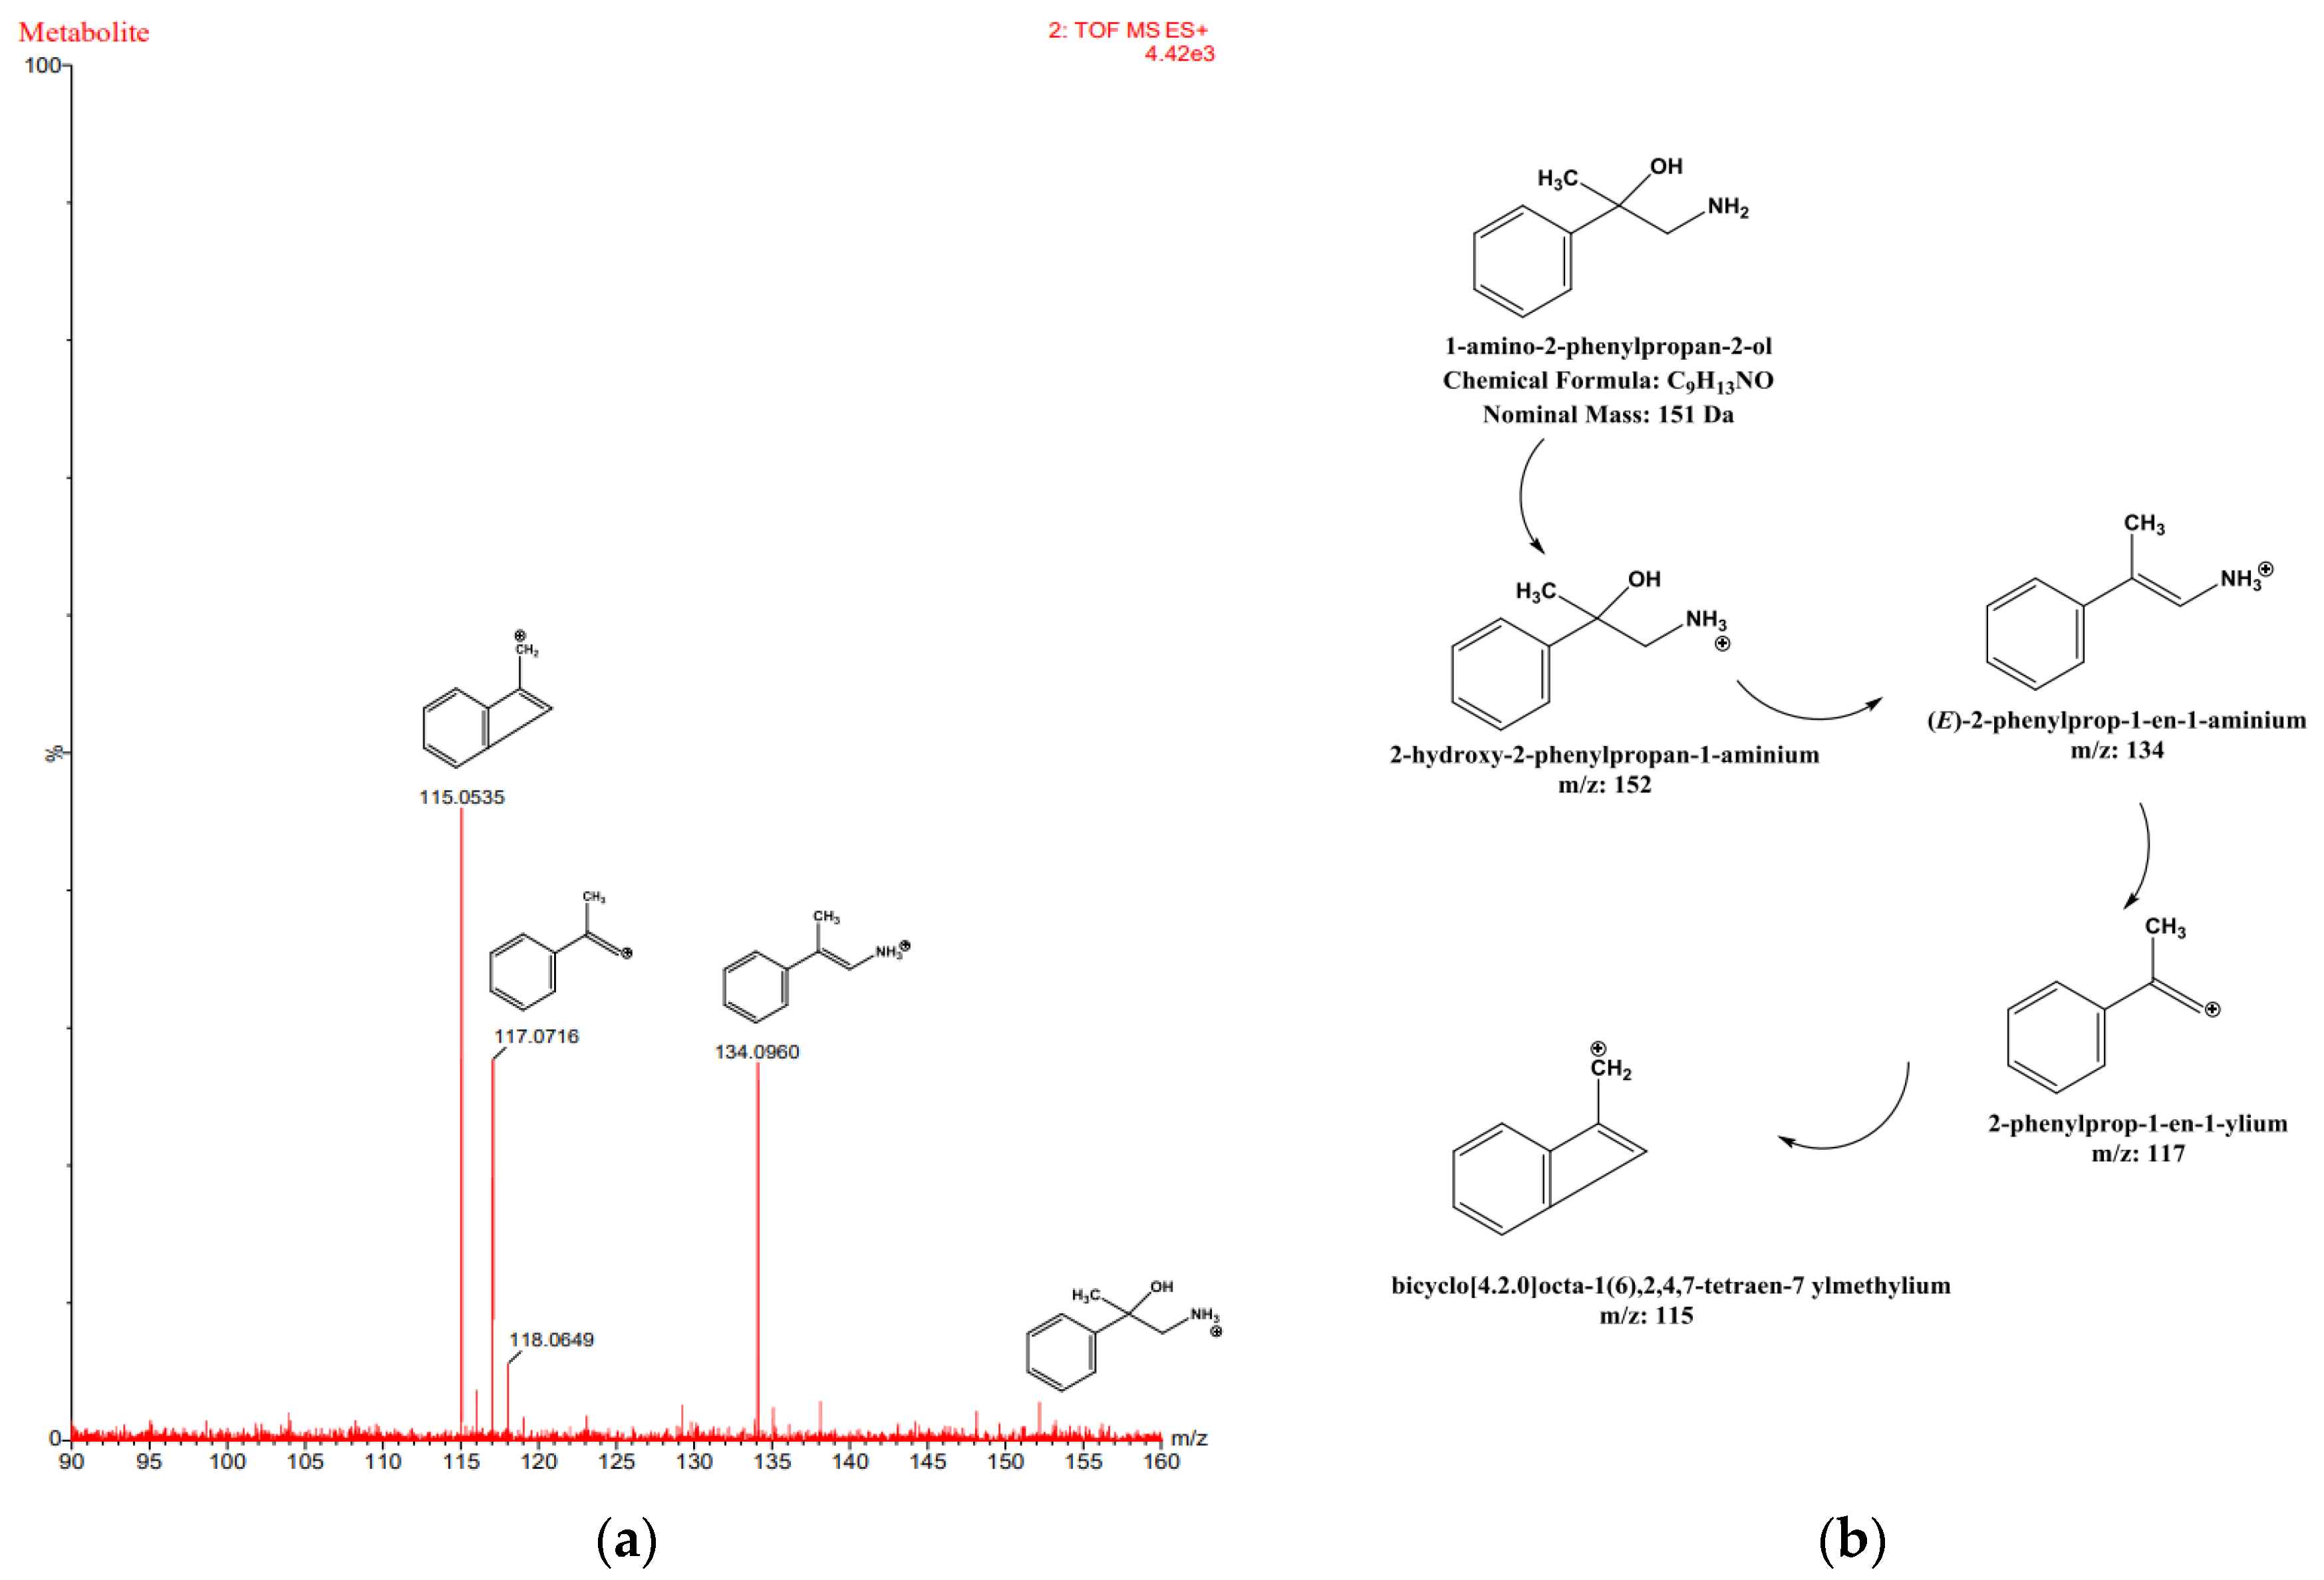

Table 1.
Analytical parameters of β-methylphenethylamine and amphetamine-d11.
| Analyte | Ionization Mode | Molecular Ion (m/z) | Fragmented Ion (m/z) (± 0.01) | Retention Time (min) (± 0.05) |
| Amphetamine-d11 | Positive | 147.1938 | 98.1000*/130.1653 | 9.43 |
| β-methylphenethylamine | Positive | 136.1219 | 91.0553/119.0868* | 10.28 |
* Quantifier ion.
Table 2.
Regression equation and correlation coefficient of a beta-methylphenethylamine concentration curve in rat perimortem blood.
Table 2.
Regression equation and correlation coefficient of a beta-methylphenethylamine concentration curve in rat perimortem blood.
| Analyte |
Linear Range (ng/mL) |
Regression Equation | R2 |
| β-methylphenethylamine | 20–1,000 | 0.9995 |
Table 3.
Concentrations of β-methylphenethylamine in perimortem whole-blood (rat, n=9) samples.
| Dose | Calculated Concentration (ng/mL) | Average (ng/mL) | STDEV (ng/mL) |
| Low Dose | |||
| Rat 1 | 132 | 104 | 25 |
| Rat 2 | 96 | ||
| Rat 3 | 85 | ||
| High dose | |||
| Rat 1 | 868 | 869 | 29 |
| Rat 2 | 841 | ||
| Rat 3 | 899 | ||
| High delayed dose | |||
| Rat 1 | 40 | 31 | 9 |
| Rat 2 | 22 | ||
| Rat 3 | 32 |
Disclaimer/Publisher’s Note: The statements, opinions and data contained in all publications are solely those of the individual author(s) and contributor(s) and not of MDPI and/or the editor(s). MDPI and/or the editor(s) disclaim responsibility for any injury to people or property resulting from any ideas, methods, instructions or products referred to in the content. |
© 2025 by the authors. Licensee MDPI, Basel, Switzerland. This article is an open access article distributed under the terms and conditions of the Creative Commons Attribution (CC BY) license (http://creativecommons.org/licenses/by/4.0/).
Copyright: This open access article is published under a Creative Commons CC BY 4.0 license, which permit the free download, distribution, and reuse, provided that the author and preprint are cited in any reuse.


