
Submitted:
30 July 2025
Posted:
31 July 2025
You are already at the latest version
Abstract
Background/Objectives: Cocaine is a widely used illicit stimulant with significant toxic effects. Despite its clinical relevance, the broader metabolic alterations associated with co-caine use remain incompletely characterized. This study aims to identify novel bi-omarkers for cocaine exposure by applying untargeted metabolomics to retrospective urine drug screening data. Methods: We conducted a retrospective analysis of raw mass spectrometry (MS) dataset from urine comprehensive drug screening (UCDS) from 363 pa-tients at the University of Pittsburgh Medical Center Clinical Toxicology Laboratory. The liquid chromatography-quadrupole time-of-flight mass spectrometry (LC-qToF-MS) data were preprocessed with MS-DIAL and subjected to multiple statistical analyses to identify features significantly associated with cocaine-enzyme immunoassay (EIA) results. Signif-icant features were further evaluated using MS-FINDER for feature annotation. Results: Out of 14,883 features, 262 were significantly associated with cocaine EIA results. A subset of 37 more significant features, including known cocaine metabolites and impurities, nic-otine metabolites, norfentanyl, and tryptophan-related metabolite (3-hydroxy-tryptophan) were annotated. Cluster analysis revealed co-varying features, including parent com-pounds, metabolites, and related ion species. Conclusions: Features associated with co-caine exposure, including previously underrecognized cocaine metabolites and impuri-ties, co-exposure markers and alterations in endogenous metabolic pathway, were identi-fied. Notably, norfentanyl was found to be significantly associated with cocaine-EIA, re-flecting current trends in illicit drug use. This study demonstrates the potential of repur-posing real-world clinical toxicology data for biomarker discovery, offering a valuable ap-proach to identifying exposure biomarkers and expanding our understanding of drug-induced metabolic disturbances in clinical toxicology. Further validation and ex-ploration using complementary analytical platforms are warranted.
Keywords:
cocaine
; cocaine-related disorders
; urine drug screening
; data reuse
; metabolites
; metabolomics
; biomarkers
; liquid chromatography-mass spectrometry
1. Introduction
Cocaine is one of the most widely used illicit stimulants globally, associated with diverse toxic effects, including cardiovascular complications, neuropsychiatric syndromes, and long-term addiction [1,2,3,4,5]. Despite its clinical and forensic relevance, the broader metabolic alterations associated with cocaine use remain incompletely understood, especially in real-world clinical settings. Routine urine drug screening relies on immunoassays and subsequent mass spectrometry-based assays to detect known drugs and their primary metabolites [6]. These approaches are practical for confirming exposure but do not capture the full extent of biochemical changes induced by drug use.
Metabolomics, the global profiling of small molecules in biological systems, enables more profound insight into drug-induced metabolic perturbations. Untargeted metabolomics has been increasingly applied in toxicology research to identify novel biomarkers, uncover altered pathways, and better understand drug mechanisms [7,8,9,10,11,12,13]. With advances in liquid chromatography-high-resolution mass spectrometry (LC-HRMS), especially liquid chromatography–quadrupole time-of-flight mass spectrometry (LC-qToF-MS), untargeted data acquisition is now routinely incorporated into clinical toxicology workflows, creating opportunities for retrospective analysis [6].
As part of routine clinical practice, we conduct urine comprehensive drug screening (UCDS) (> 500 cases per month) to identify causative drugs and chemicals for intoxication and to monitor compliance of prescription drugs at the University of Pittsburgh Medical Center Clinical Toxicology Laboratory. In urine comprehensive drug screening, we acquire mass spectral data of analytes in an untargeted manner using LC-qToF-MS with all ion fragmentation scans [6,14]. LC-qToF-MS reveals 5000 - 10000 features per specimen, but our clinical practice focuses only on 50 features of xenobiotics (drugs and their metabolites) per sample at best, leaving the remaining features unannotated and untouched. These unannotated features represent an underutilized resource that may harbor clinically actionable biomarkers and provide novel insights into the metabolic effects of drug exposure.
In this study, we repurposed data from our UCDS, which employs LC-qToF-MS for qualitative toxicological assessment. Although the primary goal of this platform is drug screening, the untargeted data generated by LC-qToF-MS are suitable for downstream metabolomics. Using an archived mass spectrometry dataset, we conducted a retrospective metabolomics study, classifying specimens using qualitative cocaine-enzyme immunoassay (EIA) results as metadata. By comparing the metabolic profiles of EIA-positive and EIA-negative samples, we aimed to identify discriminating features associated with cocaine use.
While cocaine itself is not a novel analyte, our approach demonstrates the value of mining routine clinical toxicology data for metabolomic insights. Specifically, we show how retrospective feature-level analysis can reveal potential biomarkers of cocaine exposure, identify co-eluting compounds and metabolites, and shed light on broader biochemical alterations. We also address analytical challenges, including annotating isomeric features and possible in-source fragmentation, which are common in LC-MS-based metabolomics [15,16,17,18,19].
This study highlights the translational potential of integrating metabolomics into clinical toxicology workflows. By leveraging existing diagnostic data, we provide a model for low-barrier biomarker discovery and a deeper understanding of drug-induced metabolic profiles using real-world clinical samples.
2. Materials and Methods
2.1. Specimens
The UCDS datasets were originally derived from the urine specimens from 363 patients (242 patients with age ≥ 20 years and 121 patients with age ≤ 19 year-old) between Mar and May 2021 and in June 2022 (Table 1). The specimens were sent from emergency departments of UPMC hospitals and clinics in Pittsburgh, PA. These specimens underwent the initial EMIT-II-based qualitative drug screening panel including the one for cocaine (cocaine-EIA) with the cutoff at 300 ng/mL for benzoylecgonine (Siemens Healthineers USA, Malvern, PA) before mass spectrometry-based analysis. One volume of urine specimen was mixed with 4 volumes of distilled water spiked with nitrazepam and tenoxicam as internal standards (40 ng/mL final). Diluted urine specimen was directly injected to LC-qToF-MS (3 μL).
2.2. LC-qToF-MS conditions/settings
Xevo® G2-S QToF mass spectrometer and an ACQUITY UPLC® I-Class system with UPLC HSS C18 column (Waters) was used for UCDS. The acquired mass spectrometry datasets were analyzed using UNIFI® Scientific Information System (Waters) to screen compounds through retention time, monoisotopic mass accuracy, and fragment ions match in the UCDS.
Gradient-elution chromatography in reverse-phase systems was achieved using the mobile phase A (5 mM ammonium formate pH 3.0) and mobile phase B (Acetonitrile containing 0.1% formic acid). The gradient elution was performed as follows in the 15 min run: the column was equilibrated with 87% A for 0.5 minutes, then the concentration of A was decreased to 50% over 9.5 minutes, then decreased to 5% over 0.75 minutes and held for 1.5 minutes, then increased back to 87% over 2 minutes. The column temperature was set at 50.0 ⁰C.
Electron spray ionization (ESI) in the positive ionization mode was used. The ESI settings are as follows: capillary 0.80 kV, sample cone voltage 25 V, source temperature 150 ⁰C, desolvent gas 800 L/h at 400 ⁰C, and cone gas 20 L/h. MS data of both precursor and product ions of 50 – 1000 Da mass range were collected in a non-targeted manner using MSE technology with the following settings (Collision cell setting: low energy 6 eV, high energy ramp 10 to 40 eV; Scan time: 0.1 sec; Data format: Continuum).
2.3. Data export and preprocessing
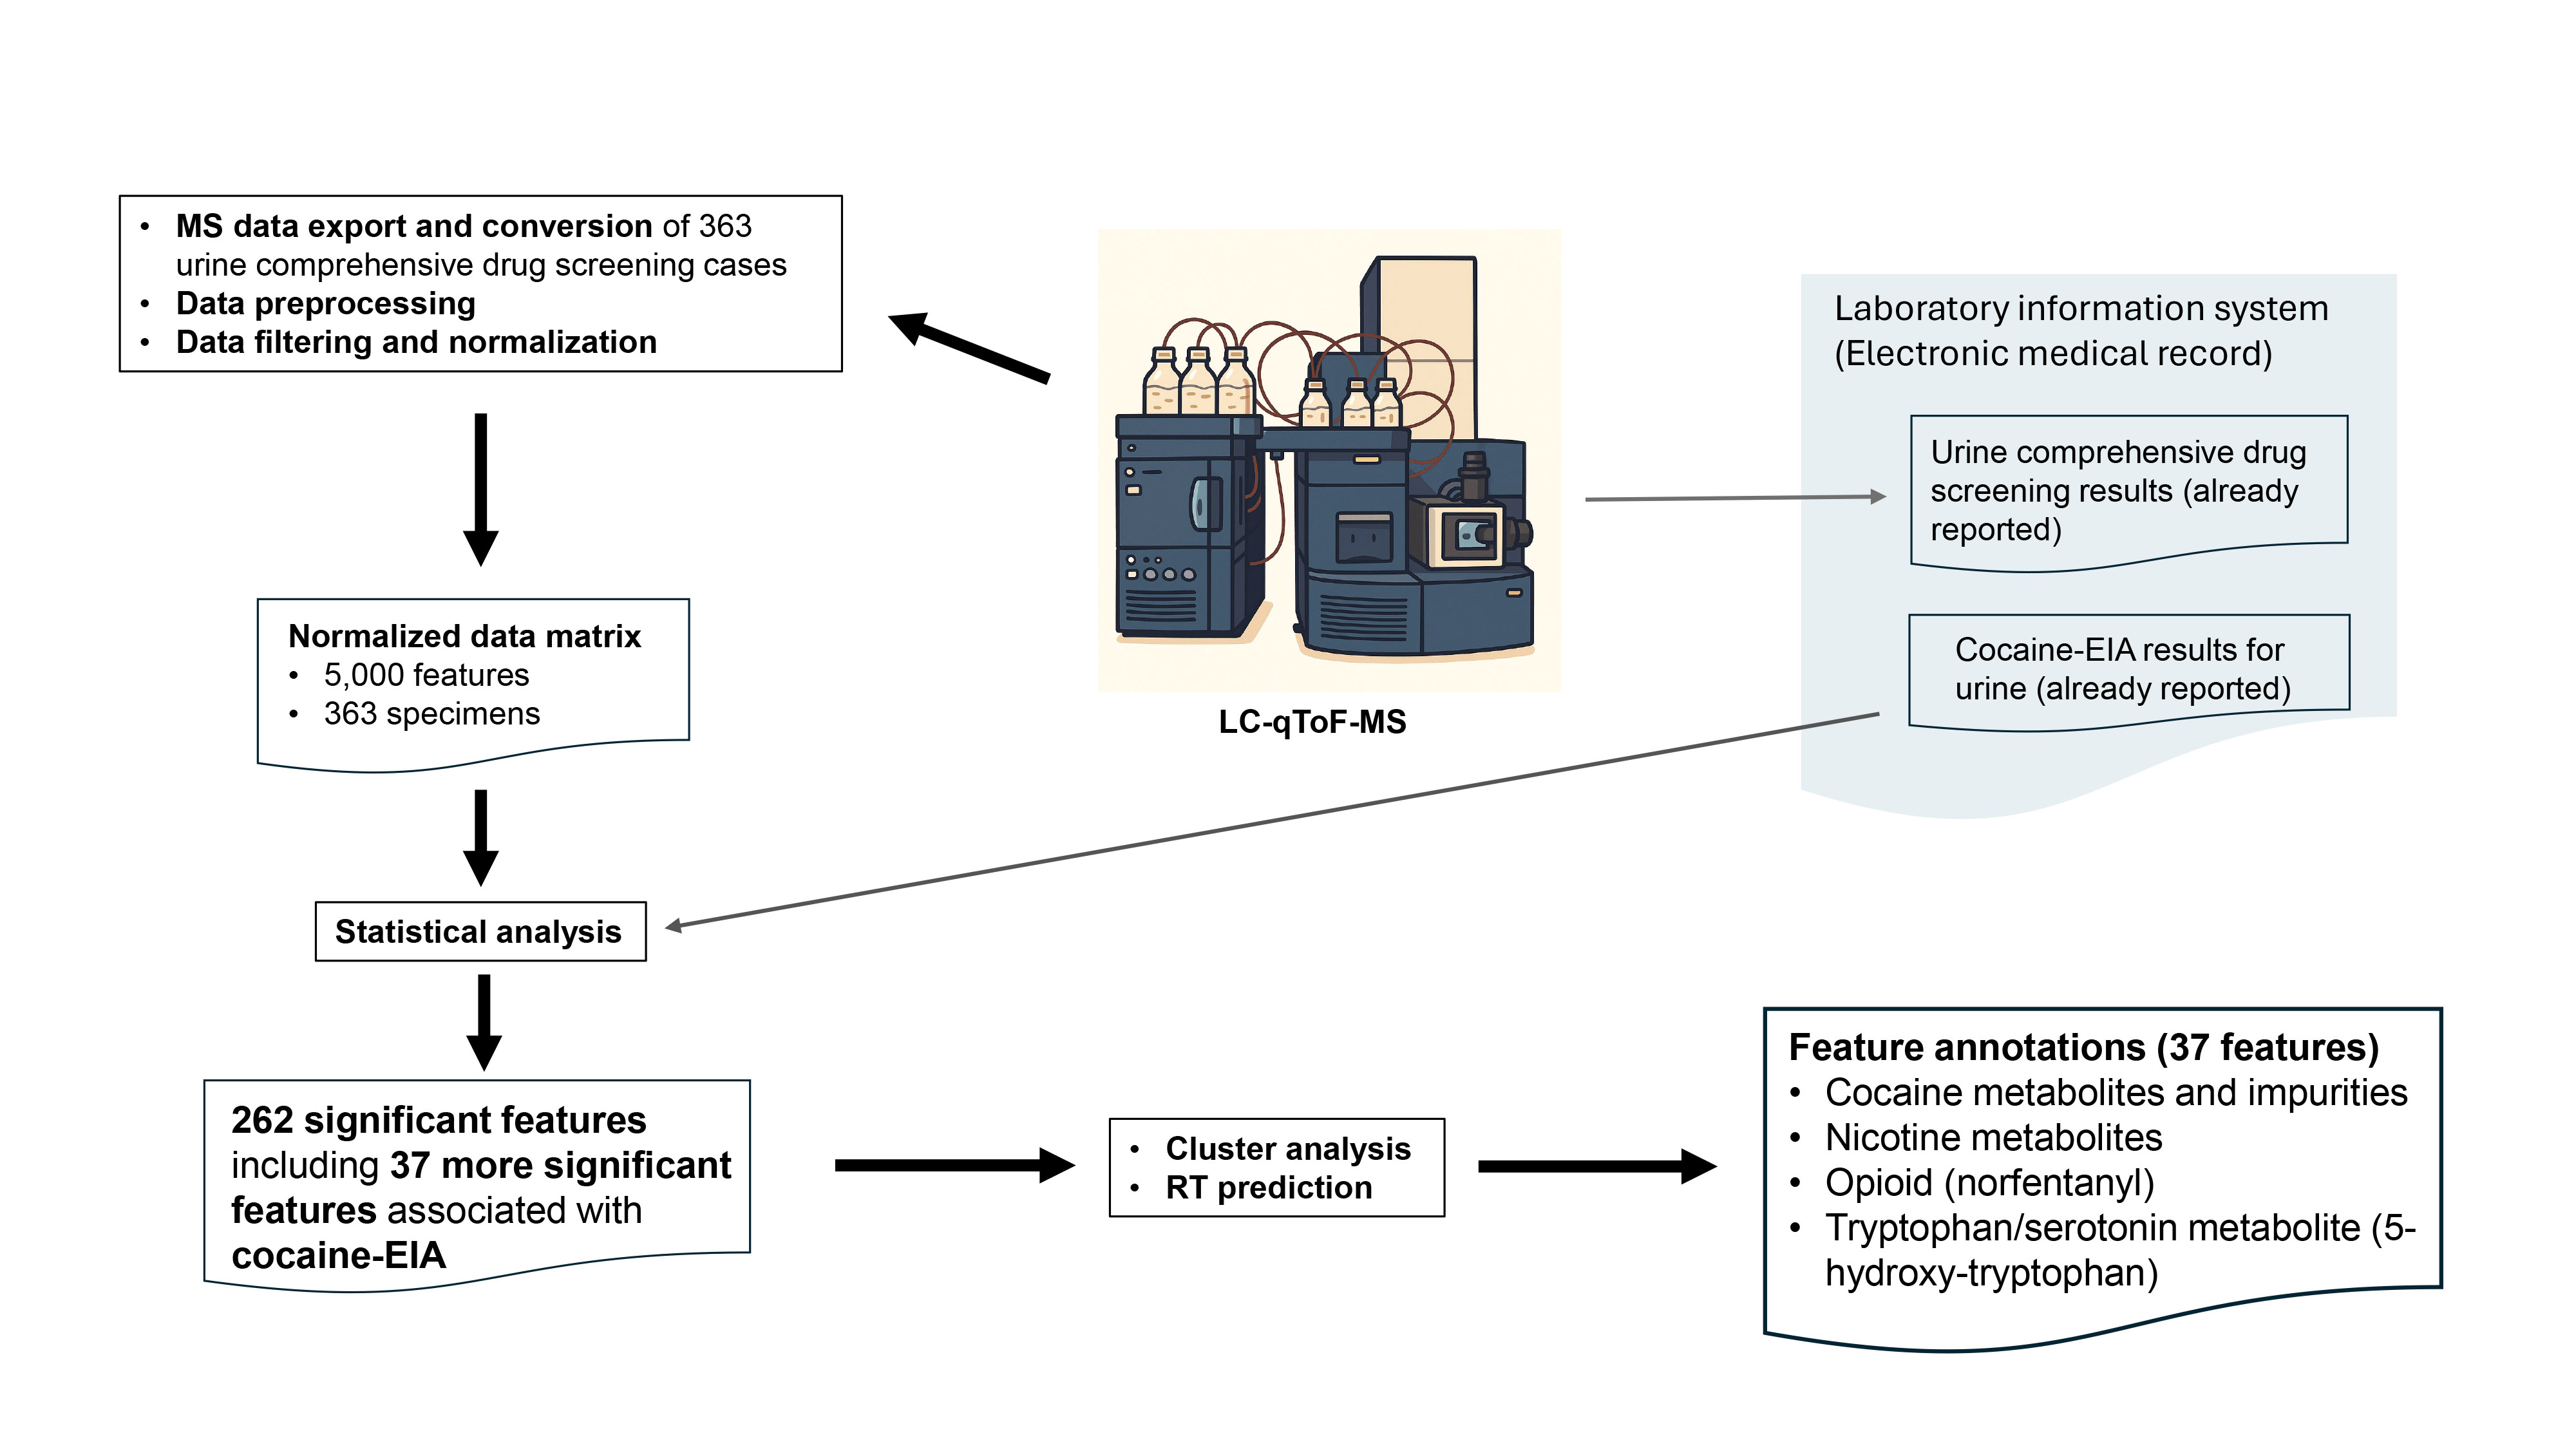
An overview of the overall data processing and analysis workflow, from raw mass spectrometry data export through statistical analysis, is presented in Figure 1. MS datasets in (.uep) files were first exported from UNIFI as (.raw) files. After removing any personal identifiers and lock mass data, these files were converted to (mzML) files in the centroid mode using ProteoWizard msConvert [20].
From the MS datasets (.mzML), peak detection, deconvolution, alignment, and putative annotation of the aligned features were performed using MS-DIAL version 4.90 [21], resulting in a peak aligned table comprising 14,883 features across 363 urine specimens. As for MS libraries, 48189 MS records (both experimental and predicted) of human urine metabolites were downloaded from Human Metabolome Database Ver 5 [22], converted into the NIST msp format library, and added to the existing 56694 MS records in MS libraries (MassBank, MassBank EU, ReSpect, GNPS, Fiehn HILIC, CASMI2016 MetaboBASE, RIKEN PlaSMA authentic standards, RIKEN PlaSMA bio-MS/MS (MSI level 1,2,3, or 4) from plant tissues, Karolinska institute and Gunma (GIAR) zic-HILIC deconvoluted MS2 spectra in data independent acquisition, Fiehn Pathogen Box, and Fiehn/Vaniya natural product library) available for MS-DIAL. Mass accuracy parameters for feature detection and spectral deconvolution were set to 0.01 Da for MS1 and 0.05 Da for MS2. For MS/MS spectral annotation, the accurate mass tolerances were set to 0.025 Da for MS1 and 0.25 Da for MS2, reflecting the modest mass accuracy due to the absence of lock mass correction. Peak detection was performed with a minimum peak height of 5,000 amplitude and a mass slice width of 0.1 Da. For peak alignment, the retention time tolerance was set to 0.25 minutes, and the MS1 tolerance was 0.025 Da. From the peak-aligned table generated by MS-DIAL, the peak intensity data matrix was constructed by applying row-wise normalization using probabilistic quotient normalization (PQN). The median of the entire dataset was used as the reference to minimize the effects of varying urine concentrations and improve comparability across specimens [23].
2.4. Data analysis
The peak intensity data matrix was further processed for data exploration and analysis using MetaboAnalyst (both the web version and R-version or MetaboAnalystR), a unified platform developed for comprehensive metabolomics data analysis[24,25,26,27,28]. Statistical analyses were selected to balance sensitivity for feature discovery (e.g. volcano plot) with robustness to complex, high-dimensional data and class imbal-ance (e.g., Random Forest), ensuring comprehensive identification and valida-tion of cocaine-associated metabolic features. Both column-wise normalization and data filtering were first applied to the peak intensity data matrix to generate the normalized data matrix, before statistical analyses were performed using MetaboAnalyst. Column-wise normalization with log transformation and autoscaling was performed to make each feature comparable. Data filtering was performed to remove non-informative features with very small or near-constant values to reduce the number of features to 5000, the maximum number of the features that MetaboAnalyst can analyze. The cocaine-EIA results were used as metadata to categorize the specimens for further statistical analysis.
Point biserial correlation analysis was performed with MetaboAnalystR to explore the correlations between metabolomics features and EIA-results (binary metadata). The significant features with FDR < 0.05 were selected.
Volcano plot was performed with MetaboAnalystR to combine the results from fold change analysis and t-tests. Fold changes are calculated as the ratios between two group means > 2 using the original data before normalization. T-tests were also conducted for each feature with p-value threshold < 0.05.
Significance analysis of microarrays and metabolites (SAM) [29] and Empirical Bayesian analysis of microarrays and metabolites (EBAM) [30] were performed with MetaboAnalystR to select the significant features based on false discovery rate (FDR). The SAM plot is a scatter plot of the observed relative difference versus the expected relative difference estimated by data permutation. The EBAM was performed to select the significant features at posterior delta of 0.9 and FDR < 0.05.
Partial least squares discriminant analysis (PLS-DA) was performed with MetaboAnalystR to select significant features to predict EIA results (metadata-based classification) by calculating the weighted sum of absolute regression coefficient for the overall components. The selected features were evaluated further only when statistically significant results were obtained by permutation testing 2000 times.
Random Forest was performed using R packages (caret and randomForest) after class imbalance of samples was corrected by combination of random oversampling of the non-dominant class samples and undersampling of the dominant class samples using R package ROSE.
Cluster analysis was performed by calculating the feature-to-feature Pearson correlation coefficients from the transposed peak intensity matrix of cocaine-associated features for the cocaine-EIA positive specimens. The resulting correlation matrix was visualized as a heatmap using the pheatmap package in R and hierarchical clustering was performed using Ward’s method (ward.D2). Features were grouped into seven clusters (Clusters A–G; Table 2A–G) by high-level dendrogram slicing (k = 7). Middle-level (k = 14) and low-level (k = 50) dendrogram slicing were additionally applied to identify subclusters of co-varying features that may reflect structurally related compounds or analytical associations.
| Cluster C (Table 2C) | Cluster D (Table 2D) | ||||
| 91.05293_0.83 | 135.05078_2.818 | 91.05488_2.605 | 94.03997_0.693 | 116.22058_0.802 | |
| 168.11021_0.847 | 230.1496_1.057 | 149.06212_3.642 | 105.03697_0.875 | 200.09056_1.02 | |
| 200.12935_0.795 | 230.29869_1.051 | 186.01846_4.664 | 290.10568_6.327 | 200.09056_1.294 | |
| 441.17444_0.915 | 168.10132_1.248 | 121.04194_0.825 | 522.40491_12.074 | 168.06374_1.28 | |
| 117.05989_0.864 | 168.10931_1.568 | 122.07076_0.782 | 107.04818_1.115 | 186.08173_1.203 | |
| 139.12474_1.347 | 184.10083_1.021 | 137.19272_0.733 | 546.40143_11.75 | 200.09158_0.796 | |
| 163.12866_0.849 | 186.11212_1.025 | 150.05968_0.839 | 131.11659_0.693 | ||
| 177.34515_0.976 | 186.11491_0.834 | 152.07004_2.343 | 402.37381_11.955 | ||
| 198.11752_1.083 | 192.10089_1.04 | 191.02417_0.942 | 534.41858_11.965 | ||
| 214.10306_1.408 | 208.09537_1.018 | 140.07437_0.729 | 172.10063_1.902 | ||
| 216.12822_1.072 | 177.10405_0.988 | 185.07774_1.451 | 173.08467_2.303 | ||
| 150.09793_0.812 | 177.14621_0.68 | 201.08185_1.004 | 187.06279_0.952 | ||
| 162.108_2.008 | 177.23868_0.976 | 265.11493_0.706 | 238.84851_0.721 | ||
| 186.11717_1.818 | 179.12364_0.927 | 155.07788_0.851 | 256.82074_0.732 | ||
| 258.08966_1.448 | 193.10092_0.876 | 182.08345_0.819 | 384.85068_0.716 | ||
| 339.16333_0.701 | 193.13478_0.697 | 268.09927_0.854 | 400.82483_0.724 | ||
| 193.24315_0.872 | |||||
| 357.22891_0.88 | |||||
| 214.15097_0.935 | |||||
| 240.10555_1.076 | |||||
| 264.12234_0.734 | |||||
| 475.2739_9.493 | |||||
| 504.31165_11.765 | |||||
| 218.08513_1.244 | |||||
| 221.08717_1.055 | |||||
| 282.15509_4.618 | |||||
| 309.13354_1.511 | |||||
| 331.22858_4.093 | |||||
| 388.22858_3.758 |
| Cluster E (Table 2E) | Cluster F (Table 2F) | Cluster G (Table 2G) | ||||
| 104.10567_0.733 | 104.10567_11.995 | 106.06516_1.994 | 153.13197_4.525 | 116.05332_11.649 | ||
| 104.2101_0.734 | 104.10775_11.868 | 256.18127_1.385 | 311.15509_4.525 | 135.04501_11.694 | ||
| 152.065_2.776 | 104.10775_11.447 | 258.08966_1.149 | 378.18292_2.252 | 311.34421_11.694 | ||
| 207.15585_2.426 | 149.05659_1.326 | 300.20895_1.719 | 165.07965_0.797 | 312.16464_12.233 | ||
| 233.17049_3.226 | 213.12489_0.836 | 330.18475_1.651 | 224.12656_0.967 | 312.16464_11.693 | ||
| 125.06116_2.653 | 395.29956_11.649 | 338.26901_11.447 | 277.12286_2.952 | 527.40106_12.155 | ||
| 223.11052_1.41 | 104.10567_0.978 | 498.27695_6.524 | 292.15628_2.97 | 593.33722_10.015 | ||
| 323.14807_2.849 | 142.08922_1.821 | 554.4505_12.18 | 519.40143_12.072 | 659.48175_11.901 | ||
| 382.83783_0.703 | 149.06207_4.254 | 680.44757_11.809 | 544.40845_11.628 | 142.12054_0.995 | ||
| 449.16858_4.928 | 169.10295_0.889 | 124.07899_1.053 | 639.43219_12.067 | 203.06929_2.133 | ||
| 470.35092_11.745 | 165.07159_4.713 | 253.05179_3.2 | 180.08086_2.536 | 237.07332_1.753 | ||
| 462.8587_0.722 | 165.07463_5.316 | 278.14926_2.887 | 235.13065_0.829 | 303.16507_3.432 | ||
| 467.10083_11.731 | 218.0378_1.446 | 301.11752_4.474 | 195.12511_1.716 | 146.05814_1.87 | ||
| 250.86957_0.719 | 329.21564_3.3 | 246.10471_0.754 | 188.06906_1.861 | |||
| 256.17471_1.742 | 332.25024_4.576 | 256.18103_6.388 | 247.14194_1.873 | |||
| 350.02979_0.703 | 183.09117_0.77 | 239.15465_1.732 | 247.29958_1.876 | |||
| 468.81296_0.725 | 201.16733_0.774 | 283.18033_2.464 | 182.123_0.87 | |||
| 498.89853_0.711 | 237.131_1.815 | 300.21008_1.962 | 200.13109_4.253 | |||
| 290.20178_3.419 | 344.23004_1.752 | 200.13182_1.007 | ||||
| 362.12997_4.903 | 200.13376_1.911 | |||||
| 220.12494_1.151 | 292.1264_4.051 | |||||
| 220.27379_1.155 | 304.15652_4.399 | |||||
| 242.0983_1.15 | ||||||
| 247.09369_1.997 | ||||||
| 254.17285_0.906 | ||||||
| 261.15073_2.827 | ||||||
| 330.17572_5.651 | ||||||
| 354.23468_5.676 | ||||||
| 493.37396_11.814 | ||||||
| 544.42969_11.838 | ||||||
| 553.40015_11.93 |
2.5. Feature annotations
MS-FINDER version 3.61[31,32] was utilized to further elucidate the putative chemical structures of selected features based on MS/MS fragmentation patterns and elemental composition. Minor metabolites and impurities of recreational drugs, including cocaine, tobacco, opioids, and benzodiazepines, and major novel psychoactive substance (NPS), were also fed into MS-FINDER through the user-defined database prepared manually. SMILES and InChIKey of these metabolites were prepared manually using ChemDraw (Ver 23.1.2) (PerkinElmer, Waltham, MA) if SMILES and InChIKey are not available in the public database (Human Metabolome Database and Pubchem).
3. Results
Among the 14,883 features in the dataset, 262 were initially identified as significantly associated with cocaine EIA results by at least one statistical analysis. However, initial putative annotation of these features using MS-DIAL and MS-FINDER met with only limited success, presumably because of the limited inclusion of minor cocaine metabolites, cocaine-related impurities and their metabolites including phase II metabolites in the public databases [36]. Thus, we created a user-defined database covering these analytes for MS-FINDER. In-source fragments might also be mistaken as precursor ions [15,37]. To better interpret these features, we performed cluster analyses on the 262 features in the normalized data matrix, based on the assumption that structurally related compounds—such as parent drugs, their immediate metabolites, and associated ion signatures—would cluster together. The features were grouped into seven high-level clusters (Clusters A–G), corresponding to Table 2A through 2G. This hierarchical clustering approach was designed to reflect co-variation patterns and facilitate the interpretation of unannotated or partially annotated signals (Table 2 and Figure 2).
Based on these analyses, we attempted to annotate 37 more significant features that were selected by more than one analysis and, thus, more strongly associated with the cocaine-EIA results. These 37 significant features and their annotations are summarized in Table 3. These 37 features are classified as cocaine and its metabolites, cocaine impurities, nicotine and its metabolites, opioid (norfentanyl) and tryptophan/serotonine metabolite (3-hydroxy-tryptophan) (Table 3).
3.1. Features 200.12935_0.795, 200.13182_1.007 and 200.13109_4.253
These features likely correspond to the molecular formula of C10H17NO3 ([M+H]+ 200.12812). Possible chemical structures for C10H17NO3 elucidated by MS-FINDER include ethyl norecgonine or methyl ecgonine among the cocaine metabolites, and methyl ecgonine is the top candidate for these three features. The RT of ethyl norecgonine is predicted to be slightly longer than that of methyl ecgonine (RT: 0.80 min, determined experimentally) (Table 4) and thus, the feature 200.13182_1.007 is putatively annotated to be ethyl norecgonine. Even though the annotation of the feature 200.13109_4.253 is unclear, this feature is clustered in the low slicing together with cocaine 304.15652_4.399 and its metabolites including the feature 200.13182_1.007 (putative ethyl norecgonine) in Cluster G (Table 2G), and this feature 200.13109_4.253 is likely another cocaine metabolite or possibly an in-source fragment of another cocaine metabolite.
3.2. Features 304.15652_4.399, 304.16803_4.254
These features likely correspond to the molecular formula of C17H21NO4 ([M+H]+ 304.15434). Among the structures proposed by MS-FINDER, one of the top candidates includes cocaine, which has the RT of 4.46 min, consistent with these features. The feature 304.15652_4.399 is clustered in the low slicing together with other cocaine metabolites such as methyl ecgonine 200.12935_0.795 in Cluster G (Table 2G), as discussed previously, whereas the feature 304.16803_4.254 is clustered together in the low slicing with an illicit cocaine impurity (Cinnamoylcocaine, 330.17252_5.513) and in the middle slicing with a cocaine metabolite (Benzoylecgonine, 290.14951_3.314) in Cluster A (Table 2A), as discussed below.
These two closely eluting features with almost the same m/z values are likely representation of cocaine. Manual inspection of the extracted ion chromatograms (EICs) confirmed that these features share a single chromatographic peak shape with slightly offset apexes. Given the absence of lock mass correction, minute m/z drift and centroid rounding likely caused the algorithm to assign separate features to the same molecular ion.
3.3. Feature 182.123_0.87
This feature likely corresponds to the molecular formula of C10H15NO2 ([M+H]+ 182.11756). Possible chemical structures for C10H15NO2 elucidated by MS-FINDER include ethyl norecgonidine or methyl ecgonidine (anhydroecgonine methylester) among the cocaine metabolites. While methyl ecgonidine is the top match based on structure scoring, its experimentally determined RT is 1.10 min, which does not match the observed RT of 0.87 min. Since ethyl norecgonidine is predicted to have an even longer RT than methyl ecgonidine (Table 4), it is also an unlikely match for this feature.
An alternative and more plausible explanation is that this feature represents an in-source loss of water ([M+H–H2O]+) from a parent ion at m/z 200.1291, corresponding to methyl ecgonine 200.12935_0.795. Although methyl ecgonine and its in-source fragment are expected to co-elute, they can be assigned slightly different retention times (0.80 min vs. 0.87 min) by MS-DIAL. This difference likely reflects the way MS-DIAL independently detects and deconvolutes each ion feature based on apex intensity within its respective m/z window, rather than a true chromatographic separation, in the peak alignment process [21]. Furthermore, this feature was observed in the same peak-slicing cluster as cocaine 304.15652_4.399 and other known cocaine-related metabolites in Cluster G (Table 2G), supporting its biological relevance to cocaine metabolism.
3.4. Features 186.11491_0.834, 186.11212_1.025 and 186.11717_1.818
These features likely correspond to the molecular formula of C9H15NO3 ([M+H]+ 186.11247). Possible chemical structures for C9H15NO3 elucidated by MS-FINDER include ecgonine or methyl norecgonine among the cocaine metabolites. Ecgonine is the top candidate for these three features, whereas methyl norecgonine is one of the top hits for the feature (186.11212_1.025). The RT of methyl norecgonine is predicted to be longer than that of ecgonine (RT: 0.80 min determined experimentally) (Table 4). Thus, ecgonine is likely the molecule of the feature 186.11491_0.834, and methyl norecgonine would be the molecule of the feature 186.11212_1.025.
To seek alternative explanation for the feature 186.11717_1.818, we manually reviewed the aligned peak table generated by MS-DIAL for other cocaine metabolites [8,38] eluting around 1.8 min and identified another feature 306.14551_1.781 for which hydroxy-benzoylecgonine (C16H19NO5, [M+H]+ 306.13360) is elucidated to be the top candidate by MS-FINDER. This feature was filtered out by MetaboAnalyst; therefore, it is not included in the normalized data matrix or cluster analysis. The MS2 spectrum of this feature includes an ion 186.1163, which can be generated after the neutral loss of C7H4O2, which corresponds to the hydroxybenzaldehyde moiety, leaving the ecgonine moiety (Figure 3A). Peak patterns of these features look similar to each other in the EIC of MS1 around 1.8 min (Figure 3B,C).
In-source fragmentation is a rather common phenomenon in the ESI-based analysis of natural molecules [39]. Ion fragments generated through in-source fragmentation and a collision cell are comparable [40,41]. Thus, we speculate that the feature 186.11717_1.818 might be an in-source fragment of hydroxybenzoylecgonine.
3.5. Features 330.17252_5.513 and 330.17572_5.651
3.6. Features 168.11021_0.847, 168.10132_1.248, and 168.10931_1.568
These features likely correspond to the molecular formula of C9H13NO2 ([M+H]+ 168.10191), which is either ecgonidine or methyl norecgonidine among the cocaine metabolites. The RT of methyl norecgonine is predicted to be slightly longer than that of ecgonidine (RT: 0.84 min, determined experimentally)(Table 4); thus, the feature 168.11021_0.847 would be annotated to be ecgonidine whereas the feature 168.10132_1.248 or 168.10931_1.568 would be methyl norecgonine.
Both features (168.10132_1.248 and 168.10931_1.568) are grouped together in the low slicing with a feature 186.11212_1.025, which is suspected to be methyl norecgonine in Cluster C (Table 2C) (see above). Notably, the mass difference between this feature and the 168 m/z features is approximately 18 Da, suggesting a possible in-source loss of water ([M+H–H2O]+) for methyl norecgonine. This raises the possibility that 186.11212_1.025 may be the intact parent ion, while 168.11021_0.847 and 168.10132_1.248 could include contributions from its in-source fragment of 186.11212_1.025.
Furthermore, this m/z 168 signal also matches several isomeric compounds unrelated to cocaine metabolism, including p-synephrine, phenylephrine (m-synephrine), and 3-methoxytyramine. Synephrine is occasionally reported as an adulterant in street cocaine and is also found in weight-loss supplements [44], while phenylephrine is a common over-the-counter decongestant. 3-Methoxytyramine, an immediate dopamine metabolite, is biologically relevant in the context of cocaine use, which alters dopaminergic signaling. Increased urinary levels of 3-methoxytyramine have been reported during early abstinence [45].
Given the physicochemical similarity with the shared formula, overlapping MS/MS spectra, and similar RTs (p- and m-synephrine for 0.83 min and 3-methoxytyramine for 0.98 min experimentally) and possible occurrence of in-source fragmentation, these features, especially 168.11021_0.847 and 168.10132_1.248, might possibly represent composite signals from multiple co-eluting compounds and an in-source fragment of another ion.
3.7. Feature 214.15097_0.935
These features likely correspond to the molecular formula of C11H19NO3 ([M+H]+ 214.14377), for which MS-FINDER suggests ethyl ecgonine as a top candidate molecule among the cocaine metabolites. The RT of ethyl ecgonine is 0.93 min (experimentally determined), matching that of this feature. Thus, the feature 214.15097_0.935 is likely the representation of ethyl ecgonine.
3.8. Feature 233.17049_3.226
These features likely correspond to the molecular formula of C14H20N2O ([M+H]+ 233.16484). Possible chemical structures for C14H20N2O elucidated by MS-DIAL and MS-FINDER include norfentanyl, a dealkylated metabolite of fentanyl, but not any cocaine metabolites. The RT of norfentanyl is 3.25 min (experimentally determined), matching that of this feature. Thus, the feature 233.17049_3.226 is likely the representation of norfentanyl. Opioids such as fentanyl are often co-ingested with cocaine in the fourth wave of the opioid crisis [46,47], supporting this finding.
3.9. Feature 292.1264_4.051
This feature likely corresponds to the molecular formula of C15H17NO5 ([M+H]+ 292.11795), for which hydroxy-benzoylnorecgonine is suggested among the cocaine metabolites by MS-FINDER. There are four isomers possible, based on the hydroxylation site (o-, m-, p-, or N-), which was not discernible by mass spectra in this case. There are four isomers possible, based on the hydroxylation site (o-, m-, p-, or N-); MS-FINDER lists N-hydroxy-benzoylnorecgonine as the top molecule among cocaine metabolites, but it also lists other isomers among the top metabolites as well. N-hydroxy-benzoylnorecgonine elutes at 3.74 min and (o-, m-, or p-)hydroxy-benzoylnorecgonine elutes at 2.48 min in a similar but slightly shorter gradient RPLC program (10 min instead of 15 min in our program) [38]. Thus, N-hydroxy-benzoylnorecgonine would be the putative annotation for the feature 292.1264_4.051, but (o-, m-, or p-)hydroxy-benzoylnorecgonine cannot be ruled out as well.
3.10. Feature 290.14951_3.314
This feature likely corresponds to the molecular formula C16H19NO4 ([M+H]+ 290.13869), which matches both benzoylecgonine (experimentally observed RT: 2.90 min) and norcocaine (RT: 4.54 min) among cocaine metabolites. Based on the MS2 pattern and RT, this feature aligns more closely with benzoylecgonine. However, the RT is approximately 0.4 min later than expected for benzoylecgonine.
The closer examination suggests that this feature may represent the tailing portion of a large benzoylecgonine peak (the feature 290.14487_2.854). Notably, this main peak was removed during data filtering by MetaboAnalyst, likely due to its detection across both cocaine-EIA-positive and -negative specimens, possibly due to its rather ubiquitous presence of this feature across both cocaine-EIA-positive and -negative specimens because of its relatively high cut-off level (300 ng/mL). In the meantime, MS-DIAL seems to detect the tail of the large benzoylecgonine peak as a distinct feature, a known limitation of peak detection algorithms in the presence of broad or asymmetric chromatographic peaks [48,49].
3.11. Feature 221.08717_1.055
This feature likely corresponds to the molecular formula of C11H12N2O3 ([M+H]+ 221.092069). Possible chemical structures for C11H12N2O3 elucidated by MS-FINDER include 5-hydroxy-tryptophan (RT: 0.90 experimentally), an immediate precursor of the neurotransmitter serotonin generated from tryptophan [50], but no cocaine metabolites are suggested by MS-FINDER. Cocaine use is associated with altered tryptophan and serotonin metabolism [51], with elevated plasma serotonin levels observed in abstinent cocaine users [52]. Thus, the feature 221.08717_1.055 is annotated as 5-hydroxy-tryptophan.
3.12. Features 193.10092_0.876, and 193.24315_0.872
This feature likely corresponds to the molecular formula of C10H12N2O2 ([M+H]+ 193.09715). Possible chemical structures for C10H15NO2 elucidated by MS-FINDER include hydroxycotinines and cotinine N-oxide. Among these metabolites, 3-hydroxycotinine is the dominant nicotine metabolite in the urine [53]. The RT is experimentally determined to be 0.90 min, whereas that of cotinine N-oxide is 0.96 min. Thus, the feature 193.10092_0.876 is likely 3-hydroxycotinine, but minor contributions from other isomeric nicotine metabolites (e.g., 5-hydroxycotinine and cotinine-N-oxide) cannot be ruled out.
Regarding the feature 193.24315_0.872, both MS-DIAL and MS-FINDER do not suggest any candidate molecules. This feature has an almost identical RT to that of the feature 193.24315_0.872 (3-hydroxycotinine) but exhibits a slightly higher m/z (Figure 4A,C). It is also grouped together with the features of nicotine metabolites, including 3-hydroxycotinine 193.10092_0.876, in the low slicing in Cluster C (Table 2C). Furthermore, the injection of authentic 3-hydroxycotinine yields both m/z 193.0861 and m/z 193.2396 at RT 0.90 min (Figure 5A). Based on these facts, we speculate that this higher-mass feature 193.24315_0.872 would be derived from 3-hydroxycotinine, rather than being an unrelated artefact, even though there is no plausible explanation for this possible mass shift of ~0.14 Da.
3.13. Feature 179.12364_0.927
This feature likely corresponds to the molecular formula of C10H14N2O ([M+H]+ 179.117889). Possible chemical structures for C10H14N2O elucidated by MS-FINDER include 2-hydroxynicotine and nicotine-N-oxide. Among these metabolites, nicotine-N-oxide has been known as a minor primary metabolite of nicotine excreted in urine, whereas 2-hydroxynicotine has not been identified in human urine. The RT of nicotine-N-oxide is experimentally determined to be 0.96 min. Thus, this feature is identified as nicotine-N-oxide.
3.14. Features 177.10405_0.988, and 177.23868_0.976
This feature likely corresponds to the molecular formula of C10H12N2O ([M+H]+ 177.102239). Possible chemical structures for C10H12N2O elucidated by MS-FINDER include cotinine, the dominant nicotine metabolite in the urine [53]. The RT is experimentally determined to be 1.0 min; thus, the feature 177.10405_0.988 is cotinine.
Regarding the feature 177.23868_0.976, both MS-DIAL and MS-FINDER do not suggest any candidate molecules. This feature has an almost identical RT to that of the feature 177.10405_0.988 (cotinine) but exhibits a slightly higher m/z (Figure 4B,D). It is also grouped together with the features of nicotine metabolites, including 3-hydroxycotinine 193.10092_0.876 and cotinine 177.10405_0.988, in the low slicing in Cluster C (Table 2C). Furthermore, the injection of authentic cotinine yields both m/z 177.1052 and m/z 177.2387 at RT 1.05 min (Figure 5). Based on these facts, we speculate that this higher-mass feature 177.23868_0.976 would be derived from cotinine, similar to the feature 193.24315_0.872 for 3-hydroxycotinine (see above). This phenomenon appears to be characteristic of cotinine and 3-hydroxycotinine, even though there is no plausible explanation for this possible mass shift of ~0.14 Da.
4. Discussion
This retrospective untargeted metabolomics analysis of routine UCDS data revealed the features significantly associated with cocaine exposure. Table 3 summarizes annotated features, including known cocaine metabolites and related impurities, nicotine metabolites, opioid metabolite (norfentnayl), and tryptophan/serotonin metabolite (3-hydroxy-tryptophan).
Various features were annotated as known or putative cocaine metabolites, consistent with expected urinary excretion patterns in cocaine users. Notably, one significant feature is likely ethyl ecgonine. Cocaine and alcohol are frequently used together by cocaine users [54,55,56]. While ethyl ecgonine has been previously reported in the context of ethanol and cocaine co-exposure [8], it has not been widely utilized as a biomarker of co-ingestion compared to cocaethylene, a toxic cocaine metabolite formed in the presence of ethanol [57]. However, the corresponding feature 318.17764_5.403 for cocaethylene (RT 5.55 experimentally) was filtered out by MetaboAnalyst during preprocessing as a non-informative feature due to low prevalence and signal intensity across most specimens. Our data indicates ethyl ecgonine as a useful biomarker of ethanol and cocaine co-exposure.
In addition to cocaine-related compounds, other classes of exogenous metabolites were also annotated among the features significantly associated with cocaine-EIA. For example, co-use of tobacco products was evident in the dataset, with features corresponding to hydroxycotinine, cotinine, nicotine-N-oxide, and related metabolites. This aligns with known behavioral co-use patterns [58]. Additionally, norfentanyl, a major fentanyl metabolite, was also included among the significant features. Recent studies indicate both cross-contamination of fentanyl within illicit cocaine products and intentional co-use of cocaine and fentanyl, consistent with this finding [46,47,59,60,61,62,63,64].
Besides exogeneous metabolites, the detection of 5-hydroxy-L-tryptophan as a discriminating feature between cocaine-EIA-positive and cocaine-EIA-negative groups is noteworthy. Cocaine alters tryptophan and serotonin metabolism [51]. Plasma serotonin levels are elevated among abstinent cocaine users, and psychiatric comorbidity among them is related to higher plasma serotonin levels than the abstinent cocaine users without psychiatric comorbidity[52]. As 5-hydroxy-L-tryptophan is an immediate precursor of serotonin, it would be worth investigating if urinary 5-hydroxy-L-tryptophan levels could be used for stratification of cocaine-addicted patients for risk of psychiatric symptoms during abstinence from cocaine.
This study has several limitations inherent to untargeted metabolomics workflows by LC-HRMS. The first issue is annotation uncertainty, an intrinsic limitation to metabolomics research [65,66], caused by the limited availability of authentic standards for most metabolites and the presence of isomeric molecules with shared molecular formulas. These isomeric molecules often yield similar MS/MS fragmentation due to conserved substructures, complicating confident differentiation. For example, the molecule formula of C9H13NO2 ([M+H]+ 168.1019) can be exogeneous metabolites (e.g., cocaine metabolites (ecgonidine or methyl norecgonidine) and p/m-synephrine) or endogenous metabolites (e.g., 3-methoxytyramine), and these molecules have similar MS/MS spectra and RTs. Indeed, synephrine was identified along with coca-alkaloids in the Mariani wine, a popular 19th century tonic wine with coca leaf extracts, by LC-high resolution-MS [67], but an alternative annotation of that feature might be either ecgonidine or ISF of ecgonine. Even targeted data acquisition with the multiple reaction monitoring mode might lead to misidentification of isomeric molecules in LC-MS/MS analysis[68,69]. Authentic chemicals, orthogonal separation techniques (e.g., ion mobility), or confirmatory NMR analysis are required to overcome this challenge in LC-HRMS-based metabolomics.
Potential analytical artifacts are other issues. In-source fragmentation can produce artifactual features whereas peak tailing can slightly shift RT values. Both phenomena can lead to false annotation of the features [15,70]. Furthermore, our MS dataset were centroided without lock mass correction, contributing to reduced mass accuracy and potential feature duplication. This was why we adapted rather generous mass tolerance parameters in MS-DIAL and MS-FINDER.
Other limitations include potential bias in the collected data and data preprocessing. Our MS dataset was generated using positive ESI mode, which is suitable for providing comprehensive coverage of xenobiotics, most of which are basic and neutral drugs. However, positive ESI mode might not be ideal for analysis of acidic metabolites, as they typically ionize better in negative ESI mode [71,72]. Thus, our dataset might not provide comprehensive coverage of acidic metabolites.
Other limitations of our study relate to potential bias secondary to sample preparation and normalization strategy. The mass spectrometry dataset was acquired using a dilute-and-shoot approach (1:4 dilution) of urine, which avoids analyte loss and facilitates broad metabolome coverage. However, this approach is also susceptible to matrix effects and ion suppression, especially in complex biological matrices like urine [14]. Although positive ESI mode is generally less prone to ion suppression than negative ESI mode when analyzing urine specimens for drug testing [73], matrix-related variability may still affect features. Additionally, we applied PQN to mitigate variability in urine concentration across specimens [23], but no urinary creatinine-based normalization was performed. As a result, residual bias due to differences in hydration status may persist despite normalization efforts, and thus, the peak heights might not accurately reflect the amounts of the analytes in some specimens.
Despite these limitations, our study underscores the translational potential of repurposing clinical toxicology data generated by LC-qTof-MS for metabolomics research, offering a feasible approach to identifying clinically relevant but often overlooked biomarkers of drug exposure and drug-related metabolic disturbances in real-world settings.
5. Conclusions
This study demonstrates the utility of repurposing routine LC-qToF-MS data from clinical toxicology workflows for untargeted metabolomics analysis. By retrospectively analyzing UCDS data, we identified features associated with cocaine exposure, including known metabolites, potential indicators of co-exposures (e.g., ethyl ecgonine), and alterations in endogenous metabolic pathways such as tryptophan metabolism. While many of these markers are not entirely novel, they remain underutilized in clinical and forensic toxicology. Our findings emphasize the potential of routine mass spectrometry data as a resource for exposure biomarker discovery and for expanding our understanding of drug-related metabolic perturbations in real-world populations. Further validation studies using authentic standards and complementary analytical platforms are warranted to refine the biological interpretation of these features and assess their clinical relevance.
Supplementary Materials
Not applicable.
Author Contributions
Conceptualization, K.T.; methodology, K.T.; formal analysis, R.V., R.K. and K.T.; investigation, R.V., R.S., D.M., S.P., and K.T.; data curation, R.S., S.P. and K.T.; funding acquisition, K.T.; visualization, K.T.; supervision, K.T.; writing—original draft preparation, R.S. and K.T.; writing—review and editing, R.S. and K.T. All authors have read and agreed to the published version of the manuscript.
Funding
This study was financially supported by the University of Pittsburgh Clinical and Translational Science Institute (CTSI) and the Department of Pathology University of Pittsburgh School of Medicine (K.T.).
Institutional Review Board Statement
The study was conducted in accordance with the Declaration of Helsinki, and approved by the University of Pittsburgh IRB (STUDY21040167, June 11, 2021).
Informed Consent Statement
Patient consent was waived due to impracticability to perform the research, not impracticable to obtain consent, without the waiver or alteration. The study subjects are the ones who had comprehensive drug screening as part of their medical care and practice at Clinical Toxicology Laboratory. These tests have already been completed a while ago and they are not readily available to consent. Even if you could contact a portion of these individuals to obtain consent, this would decrease the sample size, skewing the data and limiting generalizability of the study. Thus, the research could not practicably be carried out without the waiver or alteration.
Data Availability Statement
The datasets presented in this article are not readily available because the data are part of an ongoing study. The original datasets generated and/or analyzed during the current study contain protected health information (PHI); thus, cannot be publicly shared due to the Health Insurance Portability and Accountability Act (HIPAA) Privacy Rule in the U.S. .
Acknowledgments
We thank Todd Rates for his technical assistance in the laboratory.
Conflicts of Interest
K.T. is a contractor for Siemens Healthineers. The funders had no role in the design of the study; in the collection, analyses, or interpretation of data; in the writing of the manuscript; or in the decision to publish the results.
Abbreviations
The following abbreviations are used in this manuscript:
| MS | Mass spectrometry |
| LC-qToF-MS | Liquid chromatography-quadrupole time-of-flight mass spectrometry |
| EIA | Enzyme immunoassay |
| LC-HRMS | Liquid chromatography-high-resolution mass spectrometry |
| UCDS | Urine comprehensive drug screening |
| UPMC | University of Pittsburgh Medical Center |
| ESI | Electron spray ionization |
| PQN | probabilistic quotient normalization |
| SAM | Significance analysis of microarrays and metabolites |
| EBAM | Empirical Bayesian analysis of microarrays and metabolites |
| FDR | False discovery rate |
| PLS-DA | Partial least squares discriminant analysis |
| RT | Retention time |
| xgb | XGBoost |
| rf | Random Forest |
| brnn | Bayesian Neural Network |
| PQN | probabilistic quotient normalization |
References
- Goldstein, R.A.; DesLauriers, C.; Burda, A.M. Cocaine: history, social implications, and toxicity--a review. Dis Mon 2009, 55, 6–38. [Google Scholar] [CrossRef]
- Substance Abuse and Mental Health Services Administration (SAMHSA). Key substance use and mental health indicators in the United States: Results from the 2023 National Survey on Drug Use and Health. 2024.
- Drug Enforcement Administration. 2024 National Drug Threat Assessment. 2024.
- European Monitoring Centre for Drugs and Drug Addiction (EMCDDA). European Drug Report 2024: Trends and Developments. 2024.
- Tamama, K.; Lynch, M.J. Newly Emerging Drugs of Abuse. Handb Exp Pharmacol 2020, 258, 463–502. [Google Scholar] [CrossRef] [PubMed]
- Tamama, K. Advances in drugs of abuse testing. Clin Chim Acta 2021, 514, 40–47. [Google Scholar] [CrossRef]
- Caspani, G.; Sebok, V.; Sultana, N.; Swann, J.R.; Bailey, A. Metabolic phenotyping of opioid and psychostimulant addiction: A novel approach for biomarker discovery and biochemical understanding of the disorder. Br J Pharmacol 2022, 179, 1578–1606. [Google Scholar] [CrossRef] [PubMed]
- Dinis-Oliveira, R.J. Metabolomics of cocaine: implications in toxicity. Toxicol Mech Methods 2015, 25, 494–500. [Google Scholar] [PubMed]
- Dinis-Oliveira, R.J. Metabolomics of drugs of abuse: a more realistic view of the toxicological complexity. Bioanalysis 2014, 6, 3155–3159. [Google Scholar] [CrossRef]
- Doke, M.; McLaughlin, J.P.; Baniasadi, H.; Samikkannu, T. Sleep Disorder and Cocaine Abuse Impact Purine and Pyrimidine Nucleotide Metabolic Signatures. Metabolites 2022, 12. [Google Scholar] [CrossRef]
- Zaitsu, K.; Hayashi, Y.; Kusano, M.; Tsuchihashi, H.; Ishii, A. Application of metabolomics to toxicology of drugs of abuse: A mini review of metabolomics approach to acute and chronic toxicity studies. Drug Metab Pharmacokinet 2016, 31, 21–26. [Google Scholar] [CrossRef]
- Zaitsu, K.; Miyawaki, I.; Bando, K.; Horie, H.; Shima, N.; Katagi, M.; Tatsuno, M.; Bamba, T.; Sato, T.; Ishii, A.; et al. Metabolic profiling of urine and blood plasma in rat models of drug addiction on the basis of morphine, methamphetamine, and cocaine-induced conditioned place preference. Anal Bioanal Chem 2014, 406, 1339–1354. [Google Scholar] [CrossRef]
- Bouhifd, M.; Hartung, T.; Hogberg, H.T.; Kleensang, A.; Zhao, L. Review: toxicometabolomics. J Appl Toxicol 2013, 33, 1365–1383. [Google Scholar] [CrossRef]
- Tamama, K. Dilute and shoot approach for toxicology testing. Front Chem 2023, 11, 1278313. [Google Scholar] [CrossRef] [PubMed]
- Guo, J.; Shen, S.; Xing, S.; Yu, H.; Huan, T. ISFrag: De Novo Recognition of In-Source Fragments for Liquid Chromatography-Mass Spectrometry Data. Anal Chem 2021, 93, 10243–10250. [Google Scholar] [CrossRef] [PubMed]
- Nash, W.J.; Ngere, J.B.; Najdekr, L.; Dunn, W.B. Characterization of Electrospray Ionization Complexity in Untargeted Metabolomic Studies. Anal Chem 2024, 96, 10935–10942. [Google Scholar] [CrossRef] [PubMed]
- Xu, Y.F.; Lu, W.; Rabinowitz, J.D. Avoiding misannotation of in-source fragmentation products as cellular metabolites in liquid chromatography-mass spectrometry-based metabolomics. Anal Chem 2015, 87, 2273–2281. [Google Scholar] [CrossRef]
- Domingo-Almenara, X.; Montenegro-Burke, J.R.; Benton, H.P.; Siuzdak, G. Annotation: A Computational Solution for Streamlining Metabolomics Analysis. Anal Chem 2018, 90, 480–489. [Google Scholar] [CrossRef]
- Tsugawa, H. Advances in computational metabolomics and databases deepen the understanding of metabolisms. Curr Opin Biotechnol 2018, 54, 10–17. [Google Scholar] [CrossRef]
- Chambers, M.C.; Maclean, B.; Burke, R.; Amodei, D.; Ruderman, D.L.; Neumann, S.; Gatto, L.; Fischer, B.; Pratt, B.; Egertson, J.; et al. A cross-platform toolkit for mass spectrometry and proteomics. Nat Biotechnol 2012, 30, 918–920. [Google Scholar] [CrossRef]
- Tsugawa, H.; Cajka, T.; Kind, T.; Ma, Y.; Higgins, B.; Ikeda, K.; Kanazawa, M.; VanderGheynst, J.; Fiehn, O.; Arita, M. MS-DIAL: data-independent MS/MS deconvolution for comprehensive metabolome analysis. Nat Methods 2015, 12, 523–526. [Google Scholar] [CrossRef]
- Wishart, D.S.; Guo, A.; Oler, E.; Wang, F.; Anjum, A.; Peters, H.; Dizon, R.; Sayeeda, Z.; Tian, S.; Lee, B.L.; et al. HMDB 5.0: the Human Metabolome Database for 2022. Nucleic Acids Res 2022, 50, D622–d631. [Google Scholar] [CrossRef] [PubMed]
- Dieterle, F.; Ross, A.; Schlotterbeck, G.; Senn, H. Probabilistic quotient normalization as robust method to account for dilution of complex biological mixtures. Application in 1H NMR metabonomics. Anal Chem 2006, 78, 4281–4290. [Google Scholar] [CrossRef]
- Chong, J.; Wishart, D.S.; Xia, J. Using MetaboAnalyst 4.0 for Comprehensive and Integrative Metabolomics Data Analysis. Curr Protoc Bioinformatics 2019, 68, e86. [Google Scholar] [CrossRef]
- Pang, Z.; Chong, J.; Zhou, G.; de Lima Morais, D.A.; Chang, L.; Barrette, M.; Gauthier, C.; Jacques, P.E.; Li, S.; Xia, J. MetaboAnalyst 5.0: narrowing the gap between raw spectra and functional insights. Nucleic Acids Res 2021, 49, W388–W396. [Google Scholar] [CrossRef]
- Pang, Z.; Zhou, G.; Ewald, J.; Chang, L.; Hacariz, O.; Basu, N.; Xia, J. Using MetaboAnalyst 5.0 for LC-HRMS spectra processing, multi-omics integration and covariate adjustment of global metabolomics data. Nat Protoc 2022, 17, 1735–1761. [Google Scholar] [CrossRef] [PubMed]
- Xia, J.; Psychogios, N.; Young, N.; Wishart, D.S. MetaboAnalyst: a web server for metabolomic data analysis and interpretation. Nucleic Acids Res 2009, 37, W652–660. [Google Scholar] [CrossRef] [PubMed]
- Xia, J.; Wishart, D.S. MSEA: a web-based tool to identify biologically meaningful patterns in quantitative metabolomic data. Nucleic Acids Res 2010, 38, W71–77. [Google Scholar] [CrossRef]
- Tusher, V.G.; Tibshirani, R.; Chu, G. Significance analysis of microarrays applied to the ionizing radiation response. Proc Natl Acad Sci U S A 2001, 98, 5116–5121. [Google Scholar] [CrossRef]
- Efron, B.; Tibshirani, R.; Storey, J.D.; Tusher, V. Empirical Bayes Analysis of a Microarray Experiment. J Am Stat Assoc 2001, 96, 1151–1160. [Google Scholar] [CrossRef]
- Tsugawa, H.; Kind, T.; Nakabayashi, R.; Yukihira, D.; Tanaka, W.; Cajka, T.; Saito, K.; Fiehn, O.; Arita, M. Hydrogen Rearrangement Rules: Computational MS/MS Fragmentation and Structure Elucidation Using MS-FINDER Software. Anal Chem 2016, 88, 7946–7958. [Google Scholar] [CrossRef] [PubMed]
- Lai, Z.; Tsugawa, H.; Wohlgemuth, G.; Mehta, S.; Mueller, M.; Zheng, Y.; Ogiwara, A.; Meissen, J.; Showalter, M.; Takeuchi, K.; et al. Identifying metabolites by integrating metabolome databases with mass spectrometry cheminformatics. Nat Methods 2018, 15, 53–56. [Google Scholar] [CrossRef]
- Katajamaa, M.; Miettinen, J.; Oresic, M. MZmine: toolbox for processing and visualization of mass spectrometry based molecular profile data. Bioinformatics 2006, 22, 634–636. [Google Scholar] [CrossRef]
- Schmid, R.; Heuckeroth, S.; Korf, A.; Smirnov, A.; Myers, O.; Dyrlund, T.S.; Bushuiev, R.; Murray, K.J.; Hoffmann, N.; Lu, M.; et al. Integrative analysis of multimodal mass spectrometry data in MZmine 3. Nat Biotechnol 2023, 41, 447–449. [Google Scholar] [CrossRef]
- Bonini, P.; Kind, T.; Tsugawa, H.; Barupal, D.K.; Fiehn, O. Retip: Retention Time Prediction for Compound Annotation in Untargeted Metabolomics. Anal Chem 2020, 92, 7515–7522. [Google Scholar] [CrossRef] [PubMed]
- Chen, J.Y.; Sutaria, S.R.; Xie, Z.; Kulkarni, M.; Keith, R.J.; Bhatnagar, A.; Sears, C.G.; Lorkiewicz, P.; Srivastava, S. Simultaneous profiling of mercapturic acids, glucuronic acids, and sulfates in human urine. Environ Int 2025, 199, 109516. [Google Scholar] [CrossRef] [PubMed]
- Muñoz-Muñoz, A.C.; Pekol, T.; Schubring, D.; Johnson, C.; Andrade, L. Identification of Novel Opioid Interferences using High-Resolution Mass Spectrometry. J Anal Toxicol 2018, 42, 6–16. [Google Scholar] [CrossRef]
- Yao, D.; Shi, X.; Wang, L.; Gosnell, B.A.; Chen, C. Characterization of differential cocaine metabolism in mouse and rat through metabolomics-guided metabolite profiling. Drug Metab Dispos 2013, 41, 79–88. [Google Scholar] [CrossRef]
- Chen, L.; Pan, H.; Zhai, G.; Luo, Q.; Li, Y.; Fang, C.; Shi, F. Widespread occurrence of in-source fragmentation in the analysis of natural compounds by liquid chromatography-electrospray ionization mass spectrometry. Rapid Commun Mass Spectrom 2023, 37, e9519. [Google Scholar] [CrossRef]
- Buré, C.; Le Falher, G.; Lange, C.; Delmas, A. Fragmentation study of peptide acetals and aldehydes using in-source collision-induced dissociation. J Mass Spectrom 2004, 39, 817–823. [Google Scholar] [CrossRef]
- Gabelica, V.; De Pauw, E. Internal energy and fragmentation of ions produced in electrospray sources. Mass Spectrom Rev 2005, 24, 566–587. [Google Scholar] [CrossRef]
- Moore, J.M.; Casale, J.F. In-depth chromatographic analyses of illicit cocaine and its precursor, coca leaves. J Chromatogr A 1994, 674, 165–205. [Google Scholar] [CrossRef]
- Moore, J.M.; Moore, J.F.; Fodor, G.; Jones, A.B. Detection and Characterization of Cocaine and Related Tropane Alkaloids in Coca Leaf, Cocaine, and Biological Specimens. Forensic Sci Rev 1995, 7, 77–101. [Google Scholar]
- Choe, A.J.; Ellison, R.; Ramaswamy, S.R.; Schult, R.F.; Gerona, R.; Nacca, N. Profound Hyperthermia Associated With Fentanyl and Cocaine Use With Suspected Synephrine Adulteration. J Emerg Med 2023, 64, 259–262. [Google Scholar] [CrossRef]
- Wyatt, R.J.; Angrist, B.; Karoum, F. Urinary Dopamine Metabolites During Cocaine Abstinence Am J Addict 1995, 4, 133-140.
- Ciccarone, D. The rise of illicit fentanyls, stimulants and the fourth wave of the opioid overdose crisis. Curr Opin Psychiatry 2021, 34, 344–350. [Google Scholar] [CrossRef] [PubMed]
- Park, J.N.; Rashidi, E.; Foti, K.; Zoorob, M.; Sherman, S.; Alexander, G.C. Fentanyl and fentanyl analogs in the illicit stimulant supply: Results from U.S. drug seizure data, 2011-2016. Drug Alcohol Depend 2021, 218, 108416. [Google Scholar] [CrossRef]
- Guo, J.; Huan, T. Mechanistic Understanding of the Discrepancies between Common Peak Picking Algorithms in Liquid Chromatography-Mass Spectrometry-Based Metabolomics. Anal Chem 2023, 95, 5894–5902. [Google Scholar] [CrossRef]
- Pirttila, K.; Balgoma, D.; Rainer, J.; Pettersson, C.; Hedeland, M.; Brunius, C. Comprehensive Peak Characterization (CPC) in Untargeted LC-MS Analysis. Metabolites 2022, 12. [Google Scholar] [CrossRef] [PubMed]
- Davidson, M.; Rashidi, N.; Hossain, M.K.; Raza, A.; Nurgali, K.; Apostolopoulos, V. Tryptophan and Substance Abuse: Mechanisms and Impact. Int J Mol Sci 2023, 24. [Google Scholar] [CrossRef]
- Patkar, A.A.; Rozen, S.; Mannelli, P.; Matson, W.; Pae, C.U.; Krishnan, K.R.; Kaddurah-Daouk, R. Alterations in tryptophan and purine metabolism in cocaine addiction: a metabolomic study. Psychopharmacology (Berl) 2009, 206, 479–489. [Google Scholar] [CrossRef] [PubMed]
- Araos, P.; Vidal, R.; O'Shea, E.; Pedraz, M.; Garcia-Marchena, N.; Serrano, A.; Suarez, J.; Castilla-Ortega, E.; Ruiz, J.J.; Campos-Cloute, R.; et al. Serotonin is the main tryptophan metabolite associated with psychiatric comorbidity in abstinent cocaine-addicted patients. Scientific reports 2019, 9, 16842. [Google Scholar] [CrossRef]
- Neurath, G.B.; Dunger, M.; Krenz, O.; Orth, D.; Pein, F.G. Trans-3'-hydroxycotinine--a main metabolite in smokers. Klin Wochenschr 1988, 66 Suppl 11, 2–4. [Google Scholar] [CrossRef]
- Apantaku-Olajide, T.; Darker, C.D.; Smyth, B.P. Onset of cocaine use: associated alcohol intoxication and psychosocial characteristics among adolescents in substance abuse treatment. J Addict Med 2013, 7, 183–188. [Google Scholar] [CrossRef] [PubMed]
- Stinson, F.S.; Grant, B.F.; Dawson, D.A.; Ruan, W.J.; Huang, B.; Saha, T. Comorbidity between DSM-IV alcohol and specific drug use disorders in the United States: results from the National Epidemiologic Survey on Alcohol and Related Conditions. Drug Alcohol Depend 2005, 80, 105–116. [Google Scholar] [CrossRef]
- Pennings, E.J.; Leccese, A.P.; Wolff, F.A. Effects of concurrent use of alcohol and cocaine. Addiction 2002, 97, 773–783. [Google Scholar] [CrossRef]
- McCance, E.F.; Price, L.H.; Kosten, T.R.; Jatlow, P.I. Cocaethylene: pharmacology, physiology and behavioral effects in humans. J Pharmacol Exp Ther 1995, 274, 215–223. [Google Scholar] [CrossRef]
- Benowitz, N.L. Pharmacology of nicotine: addiction, smoking-induced disease, and therapeutics. Annu Rev Pharmacol Toxicol 2009, 49, 57–71. [Google Scholar] [CrossRef]
- Estadt, A.T.; White, B.N.; Ricks, J.M.; Lancaster, K.E.; Hepler, S.; Miller, W.C.; Kline, D. The impact of fentanyl on state- and county-level psychostimulant and cocaine overdose death rates by race in Ohio from 2010 to 2020: a time series and spatiotemporal analysis. Harm Reduct J 2024, 21, 13. [Google Scholar] [CrossRef]
- Jones, C.M.; Bekheet, F.; Park, J.N.; Alexander, G.C. The Evolving Overdose Epidemic: Synthetic Opioids and Rising Stimulant-Related Harms. Epidemiol Rev 2020, 42, 154–166. [Google Scholar] [CrossRef]
- Park, J.N.; Schneider, K.E.; Fowler, D.; Sherman, S.G.; Mojtabai, R.; Nestadt, P.S. Polysubstance Overdose Deaths in the Fentanyl Era: A Latent Class Analysis. J Addict Med 2022, 16, 49–55. [Google Scholar] [CrossRef]
- Spencer, M.R.; Minino, A.M.; Warner, M. Drug Overdose Deaths in the United States, 2001-2021. NCHS Data Brief 2022, 1–8. [Google Scholar]
- Liu, X.; Singer, M.E. Intentional use of both opioids and cocaine in the United States. Prev Med Rep 2023, 33, 102227. [Google Scholar] [CrossRef] [PubMed]
- Nolan, M.L.; Shamasunder, S.; Colon-Berezin, C.; Kunins, H.V.; Paone, D. Increased Presence of Fentanyl in Cocaine-Involved Fatal Overdoses: Implications for Prevention. J Urban Health 2019, 96, 49–54. [Google Scholar] [CrossRef]
- Rakusanova, S.; Cajka, T. Tips and tricks for LC–MS-based metabolomics and lipidomics analysis. Trends Analyt Chem 2024, 180, 117940. [Google Scholar] [CrossRef]
- Dunn, W.B.; Erban, A.; Weber, R.J.M.; Creek, D.J.; Brown, M.; Breitling, R.; Hankemeier, T.; Goodacre, R.; Neumann, S.; Kopka, J.; et al. Mass appeal: metabolite identification in mass spectrometry-focused untargeted metabolomics. Metabolomics 2013, 9, 44–66. [Google Scholar] [CrossRef]
- Arbouche, N.; de Lestrange, A.; Raul, J.S.; Kintz, P. Mariani wine: What's really in it? Analysis of the most popular tonic drink of the 19th century after 100 years of storage. J Pharm Biomed Anal 2024, 238, 115804. [Google Scholar] [CrossRef]
- Yan, Z.; Maher, N.; Torres, R.; Cotto, C.; Hastings, B.; Dasgupta, M.; Hyman, R.; Huebert, N.; Caldwell, G.W. Isobaric metabolite interferences and the requirement for close examination of raw data in addition to stringent chromatographic separations in liquid chromatography/tandem mass spectrometric analysis of drugs in biological matrix. Rapid Commun Mass Spectrom 2008, 22, 2021–2028. [Google Scholar] [CrossRef]
- Song, Y.; Song, Q.; Liu, W.; Li, J.; Tu, P. High-confidence structural identification of metabolites relying on tandem mass spectrometry through isomeric identification: A tutorial. Trends Analyt Chem 2023, 160, 116982. [Google Scholar] [CrossRef]
- Mahieu, N.G.; Patti, G.J. Systems-Level Annotation of a Metabolomics Data Set Reduces 25 000 Features to Fewer than 1000 Unique Metabolites. Anal Chem 2017, 89, 10397–10406. [Google Scholar] [CrossRef]
- Cech, N.B.; Enke, C.G. Practical implications of some recent studies in electrospray ionization fundamentals. Mass Spectrom Rev 2001, 20, 362–387. [Google Scholar] [CrossRef] [PubMed]
- Holcapek, M.; Kolárová, L.; Nobilis, M. High-performance liquid chromatography-tandem mass spectrometry in the identification and determination of phase I and phase II drug metabolites. Anal Bioanal Chem 2008, 391, 59–78. [Google Scholar] [CrossRef] [PubMed]
- Pitt, J.J.; Eggington, M.; Kahler, S.G. Comprehensive screening of urine samples for inborn errors of metabolism by electrospray tandem mass spectrometry. Clin Chem 2002, 48, 1970–1980. [Google Scholar] [CrossRef] [PubMed]
Figure 1.
Analytical and computational workflow for untargeted urine metabolomics analysis of cocaine-associated features.
Figure 1.
Analytical and computational workflow for untargeted urine metabolomics analysis of cocaine-associated features.
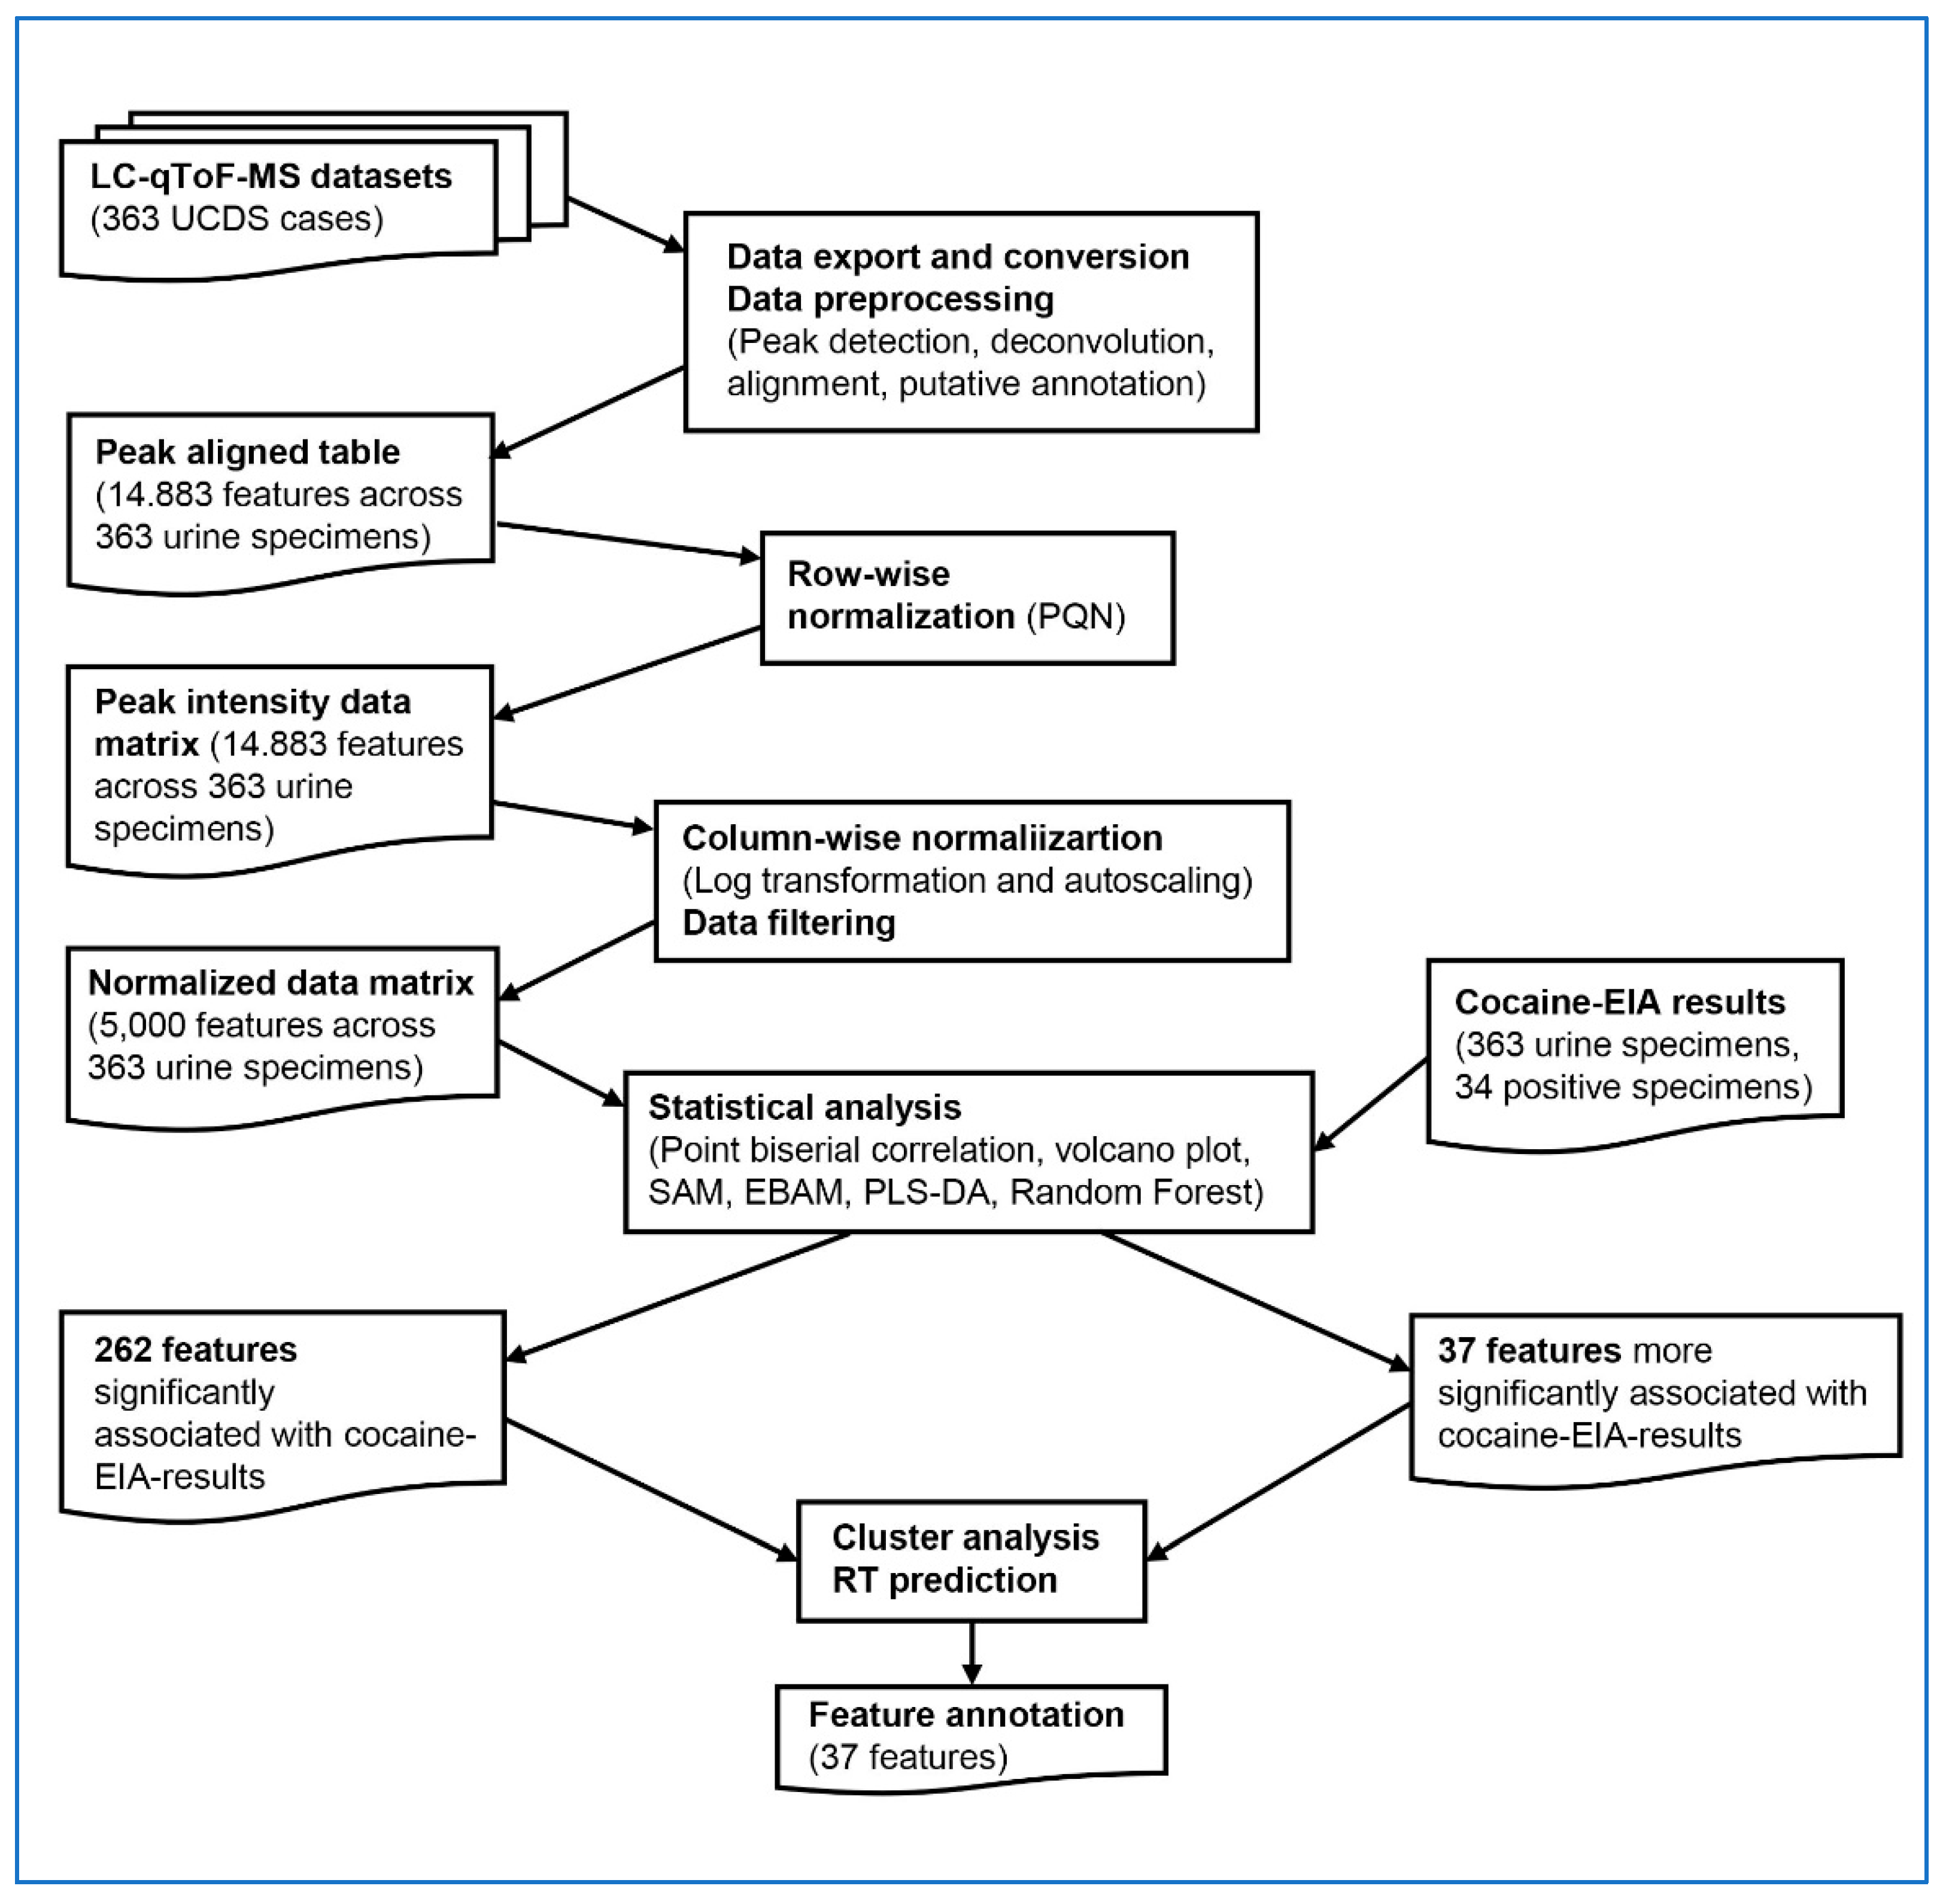
Figure 2.
Correlation heatmap and hierarchical clustering of 262 cocaine-associated features. The heatmap displays pairwise Pearson correlation coefficients among the 262 cocaine-associated features. Both axes represent the same feature set, ordered identically according to hierarchical clustering. Color indicates correlation strength (red: positive; blue: negative). The accompanying dendrogram (top and left) was generated using Ward’s linkage on 1 − Pearson correlation distance. Block-like red regions along the diagonal reflect clusters of co-varying features, used to define Clusters A–G (Table 2A–G) and guide further interpretation of structurally related signals.
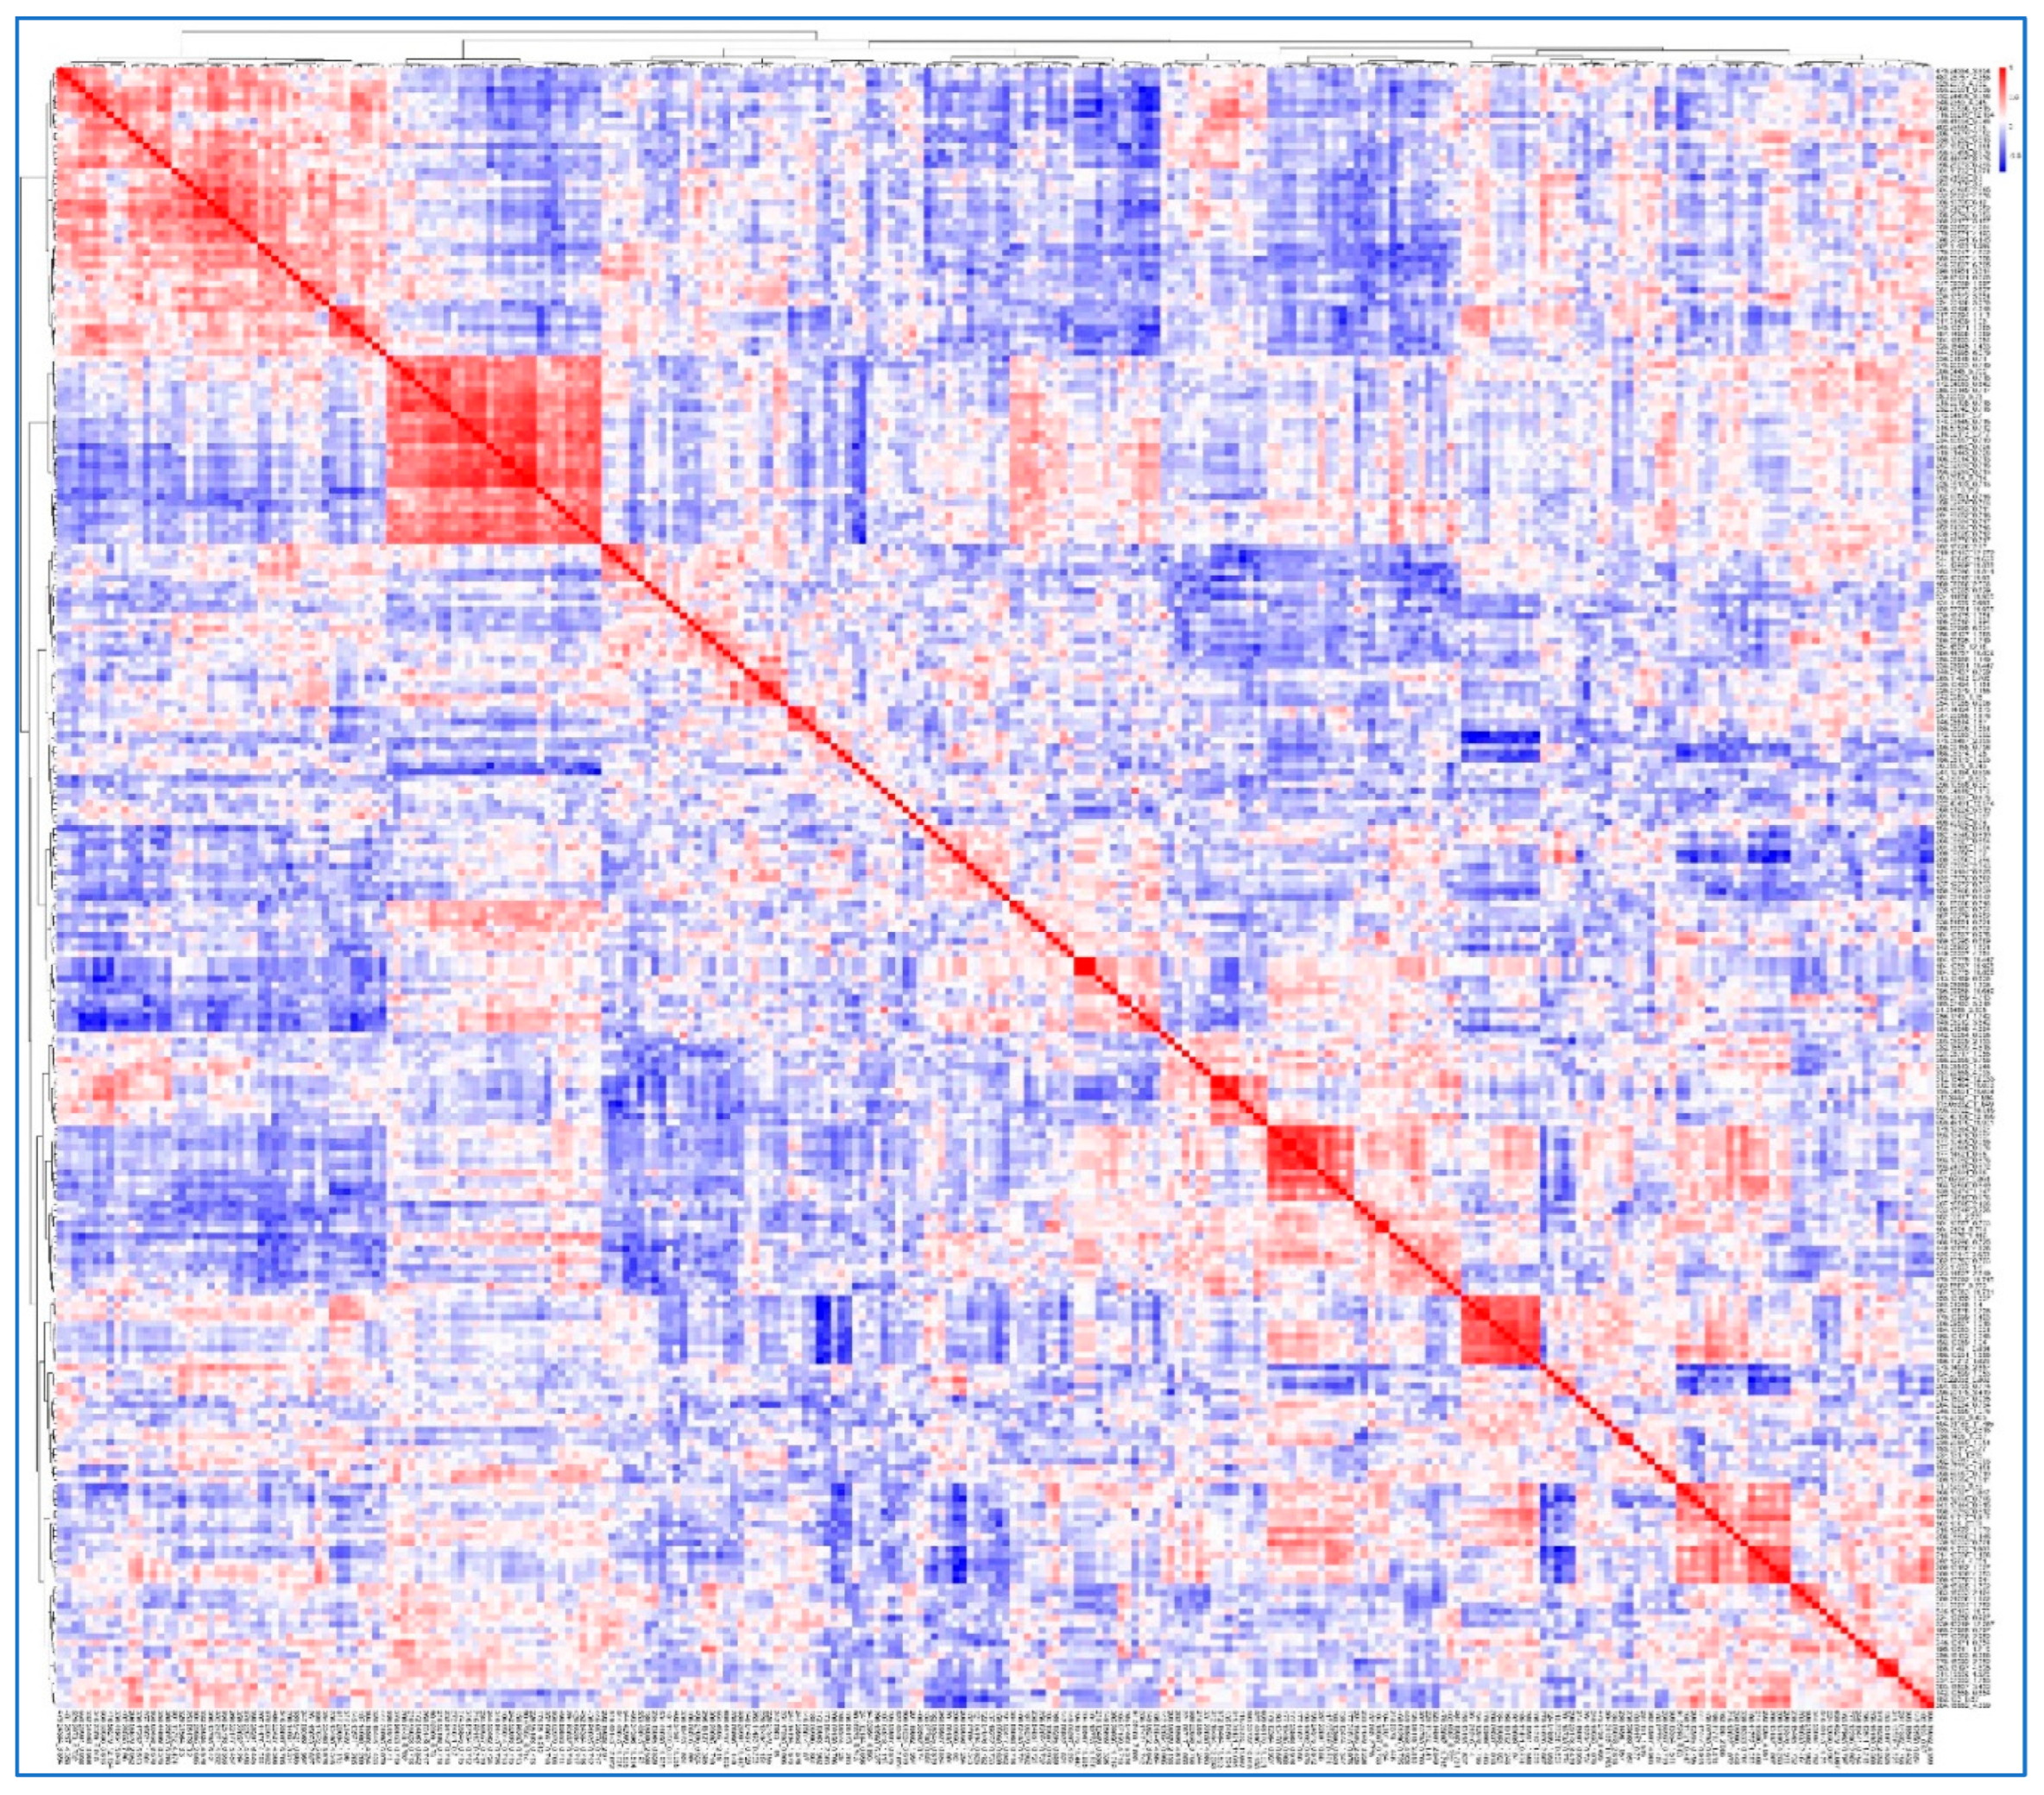
Figure 3.
The deconvoluted MS/MS spectrum of the feature 306.14551_1.781 and in silico MS/MS spectrum matching of hydroxy-benzoylecgonine (A) and extracted ion chromatograms of m/z 306.1384 (B) and m/z 186.1135 (C) between 1.6 and 2.0 min. The striking similarity in retention profiles between the ion pairs 306.1384 /186.1135 (Panels B and C) suggests a possible analytical relationship, likely through in-source fragmentation of hydroxy-benzoylecgonine.
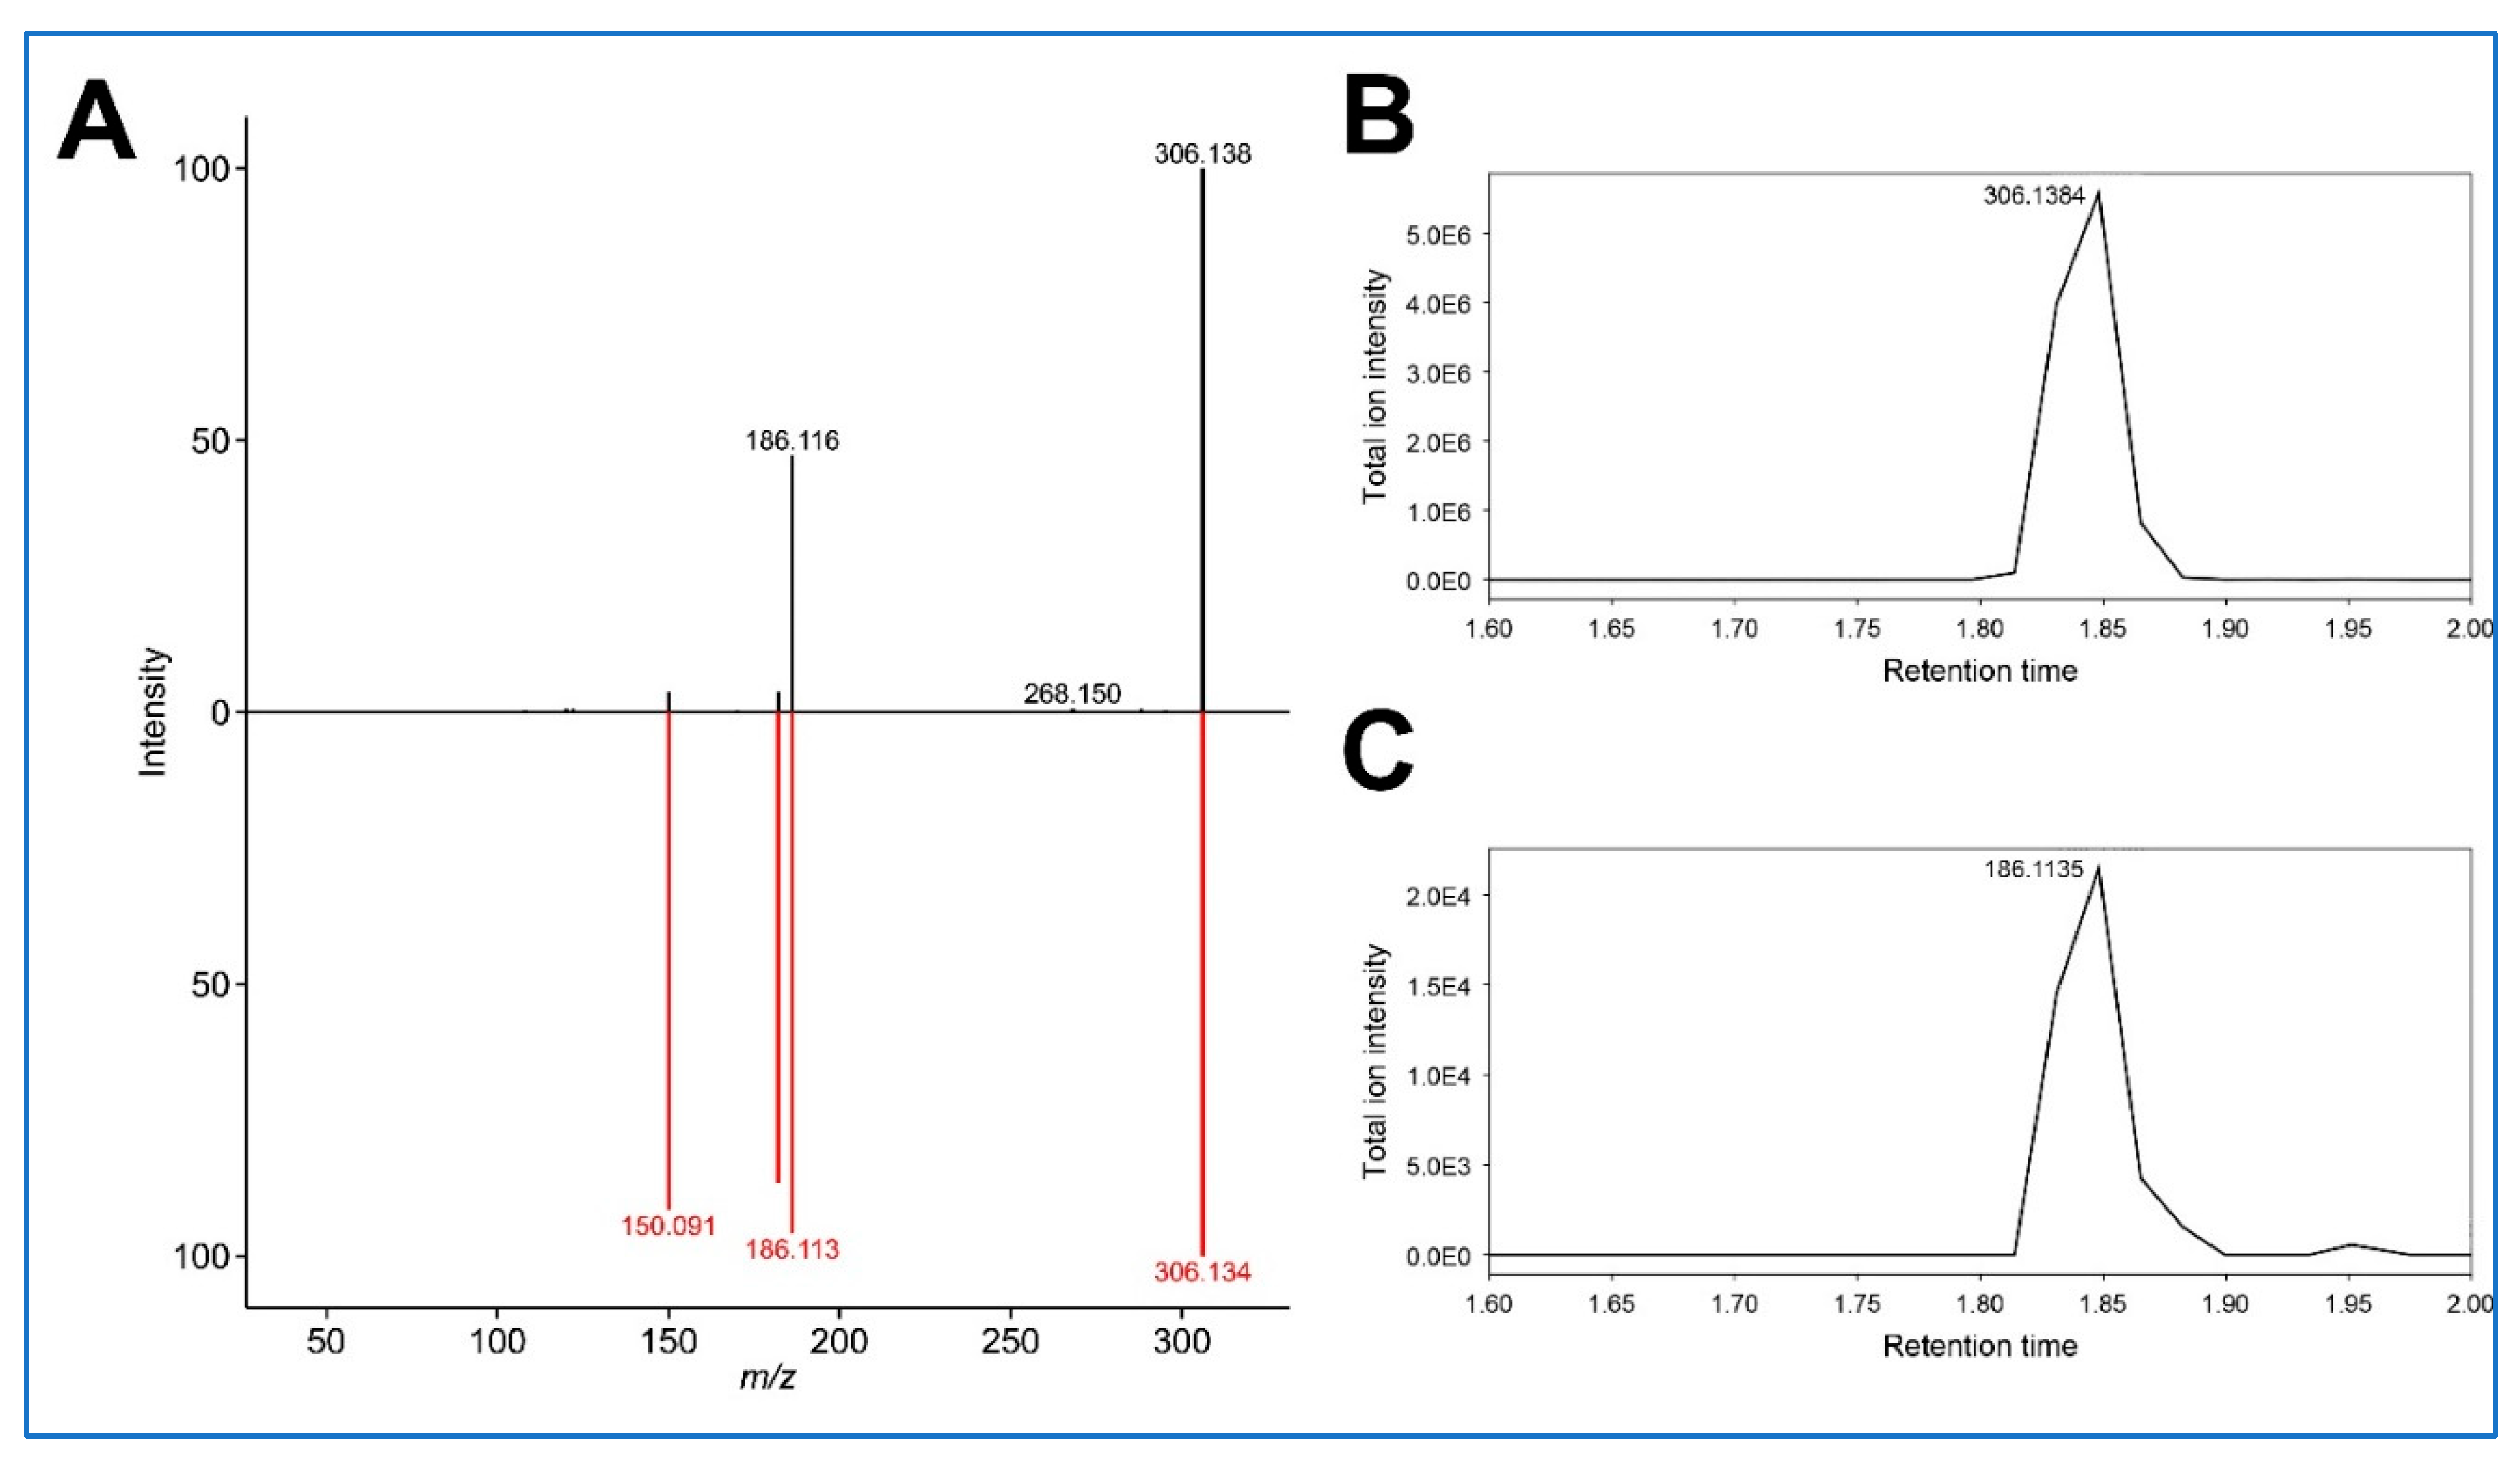
Figure 4.
MS1 spectra and extracted ion chromatograms (EICs) from a urine specimen positive for cocaine by EIA. Panels A and B show MS1 spectra acquired at retention times 0.90 min and 0.98 min, respectively. Panels C and D display EICs for m/z 193.1038 and 193.2431, while Panels E and F show EICs for m/z 177.1057 and 177.2419. The striking similarity in retention profiles between the ion pairs 193.0861/193.2396 (Panels C and D) and 177.0889/177.2387 (Panels E and F) suggests a possible analytical relationship, although the exact mechanism remains undetermined. Co-elution and matching chromatographic shapes support this association.
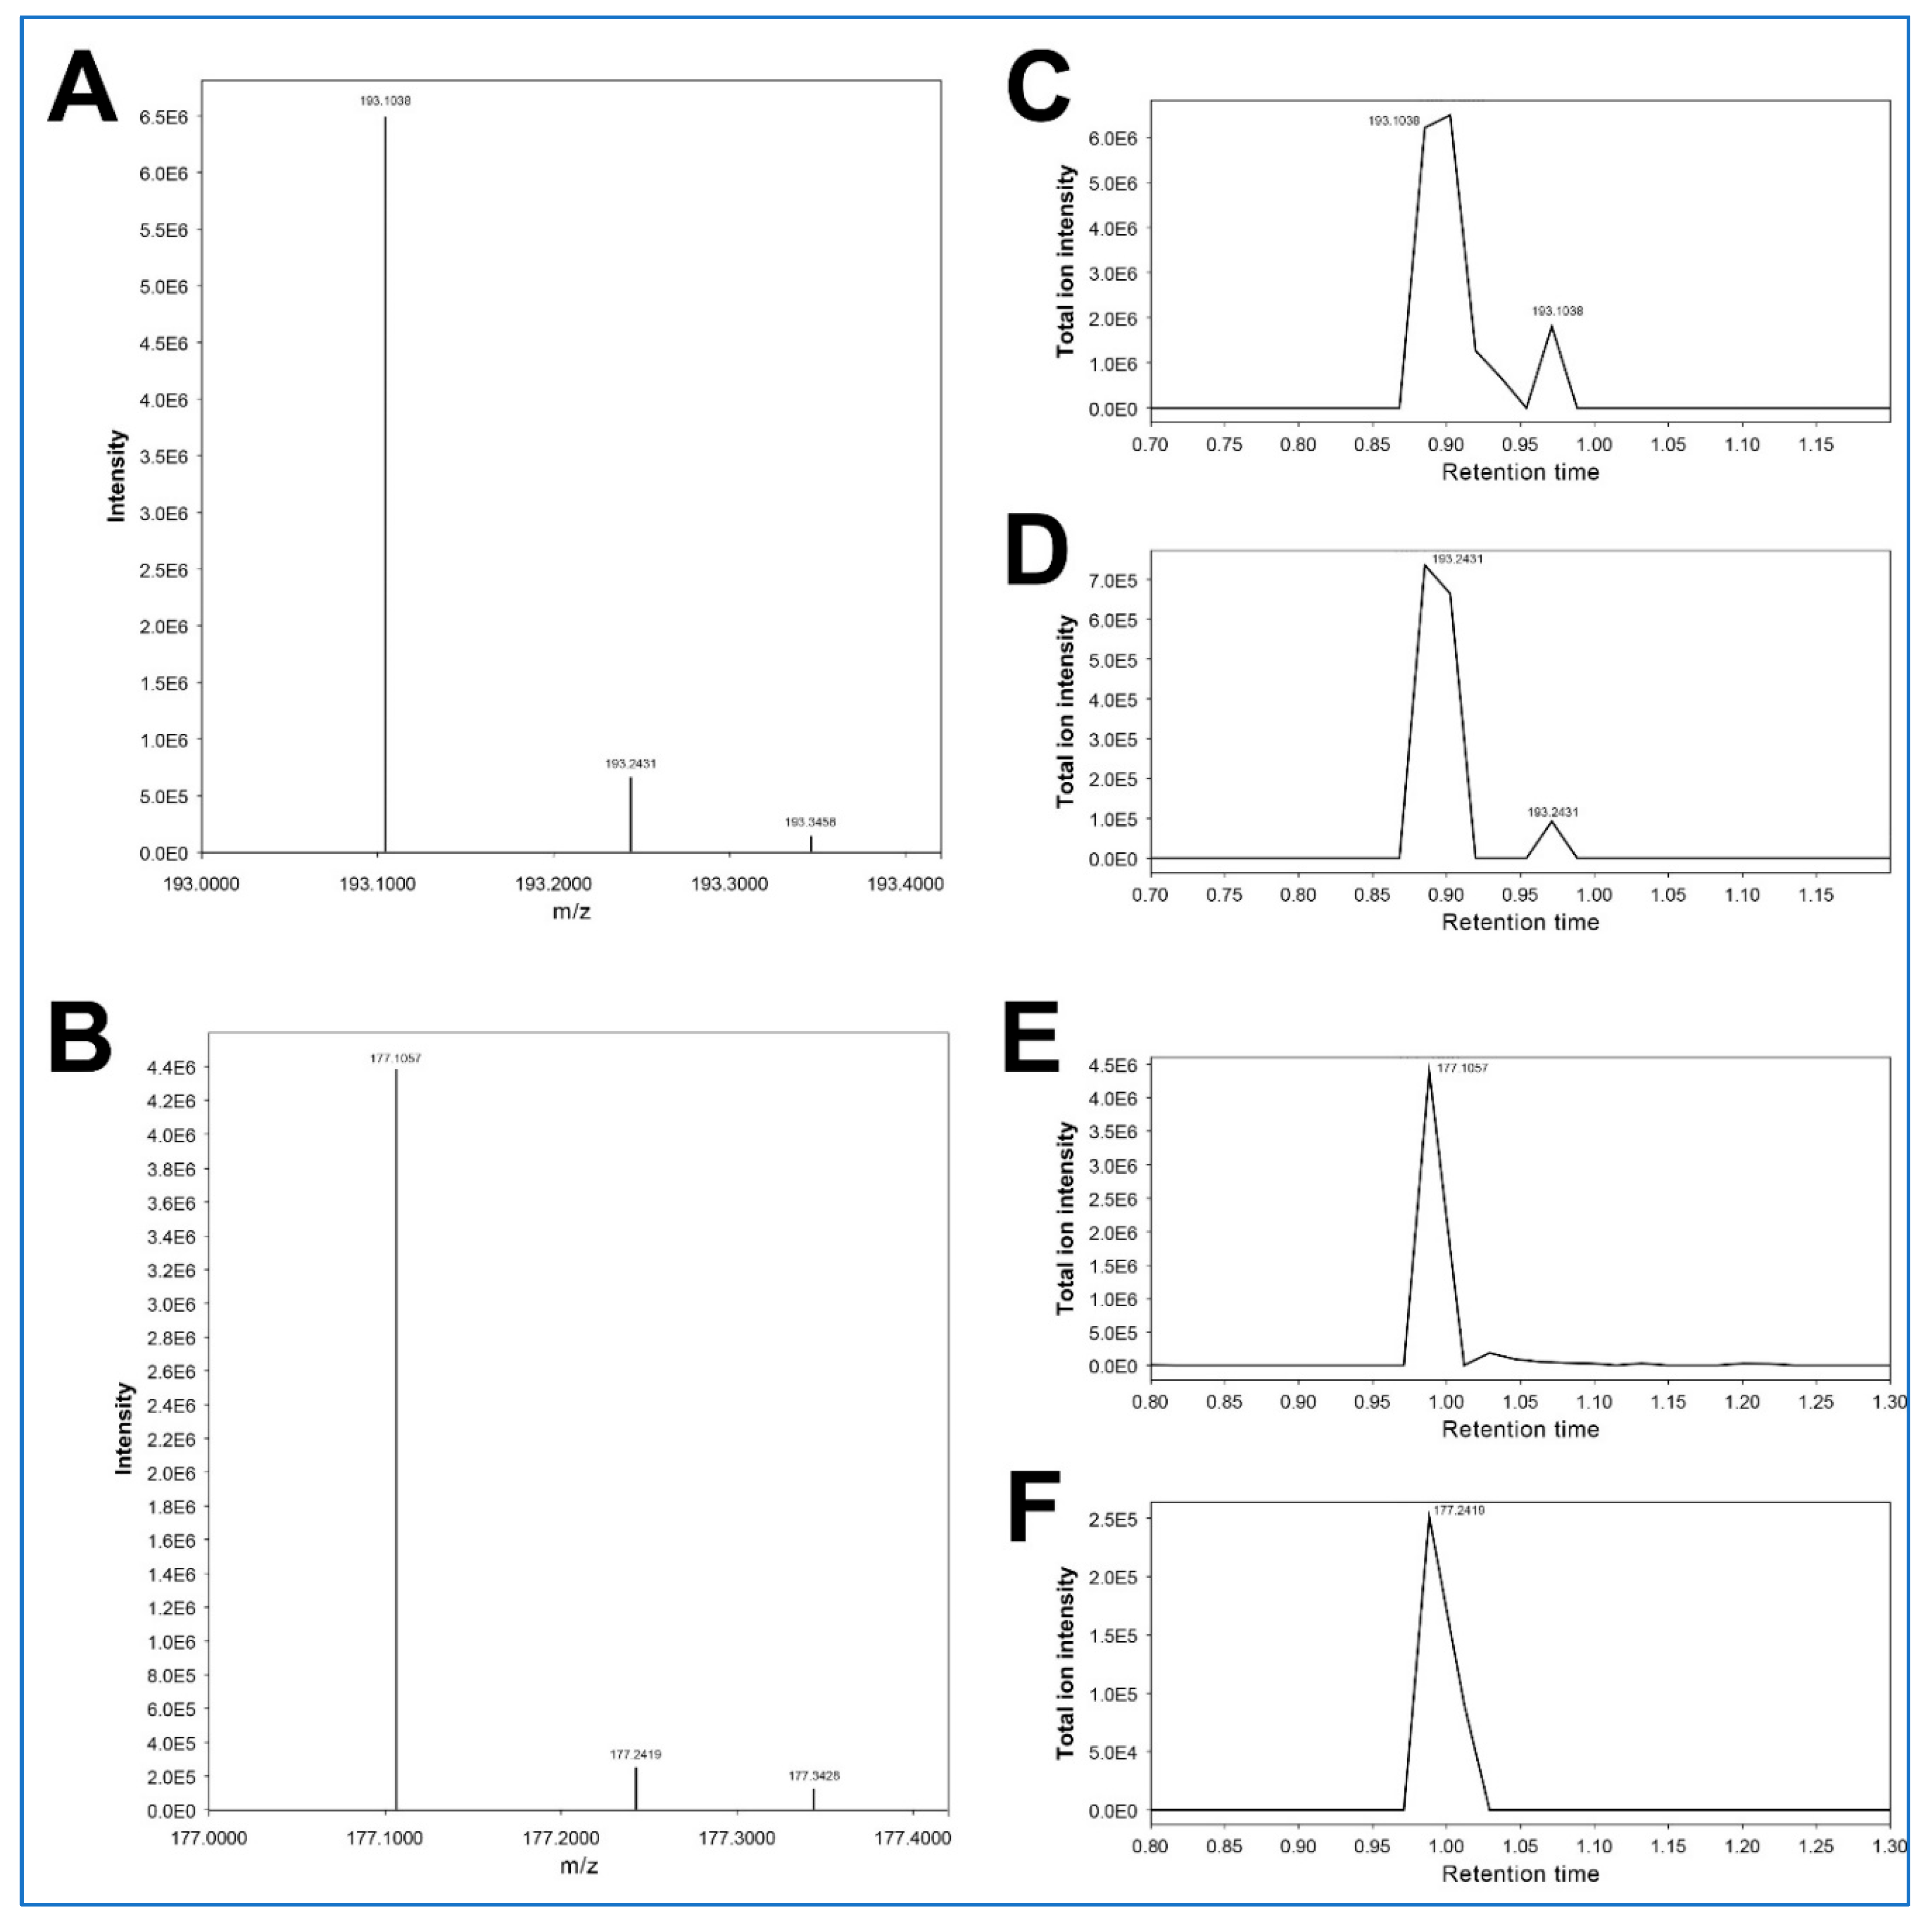
Figure 5.
MS1 spectra and extracted ion chromatograms (EICs) from a blank urine sample spiked with 3-hydroxycotinine and cotinine. Panels A and B show MS1 spectra acquired at retention times 0.90 min and 1.01 min, corresponding to authentic 3-hydroxycotinine and cotinine, respectively. Panels C and D display EICs for m/z 193.0861 and 193.2396, while Panels E and F show EICs for m/z 177.0889 and 177.2387. In both ion pairs, the secondary ions (D and F) exhibit nearly identical retention times and peak shapes as their primary counterparts (C and E), suggesting a potential analytical relationship. This pattern parallels the observations from the cocaine-positive specimen in Figure 4.
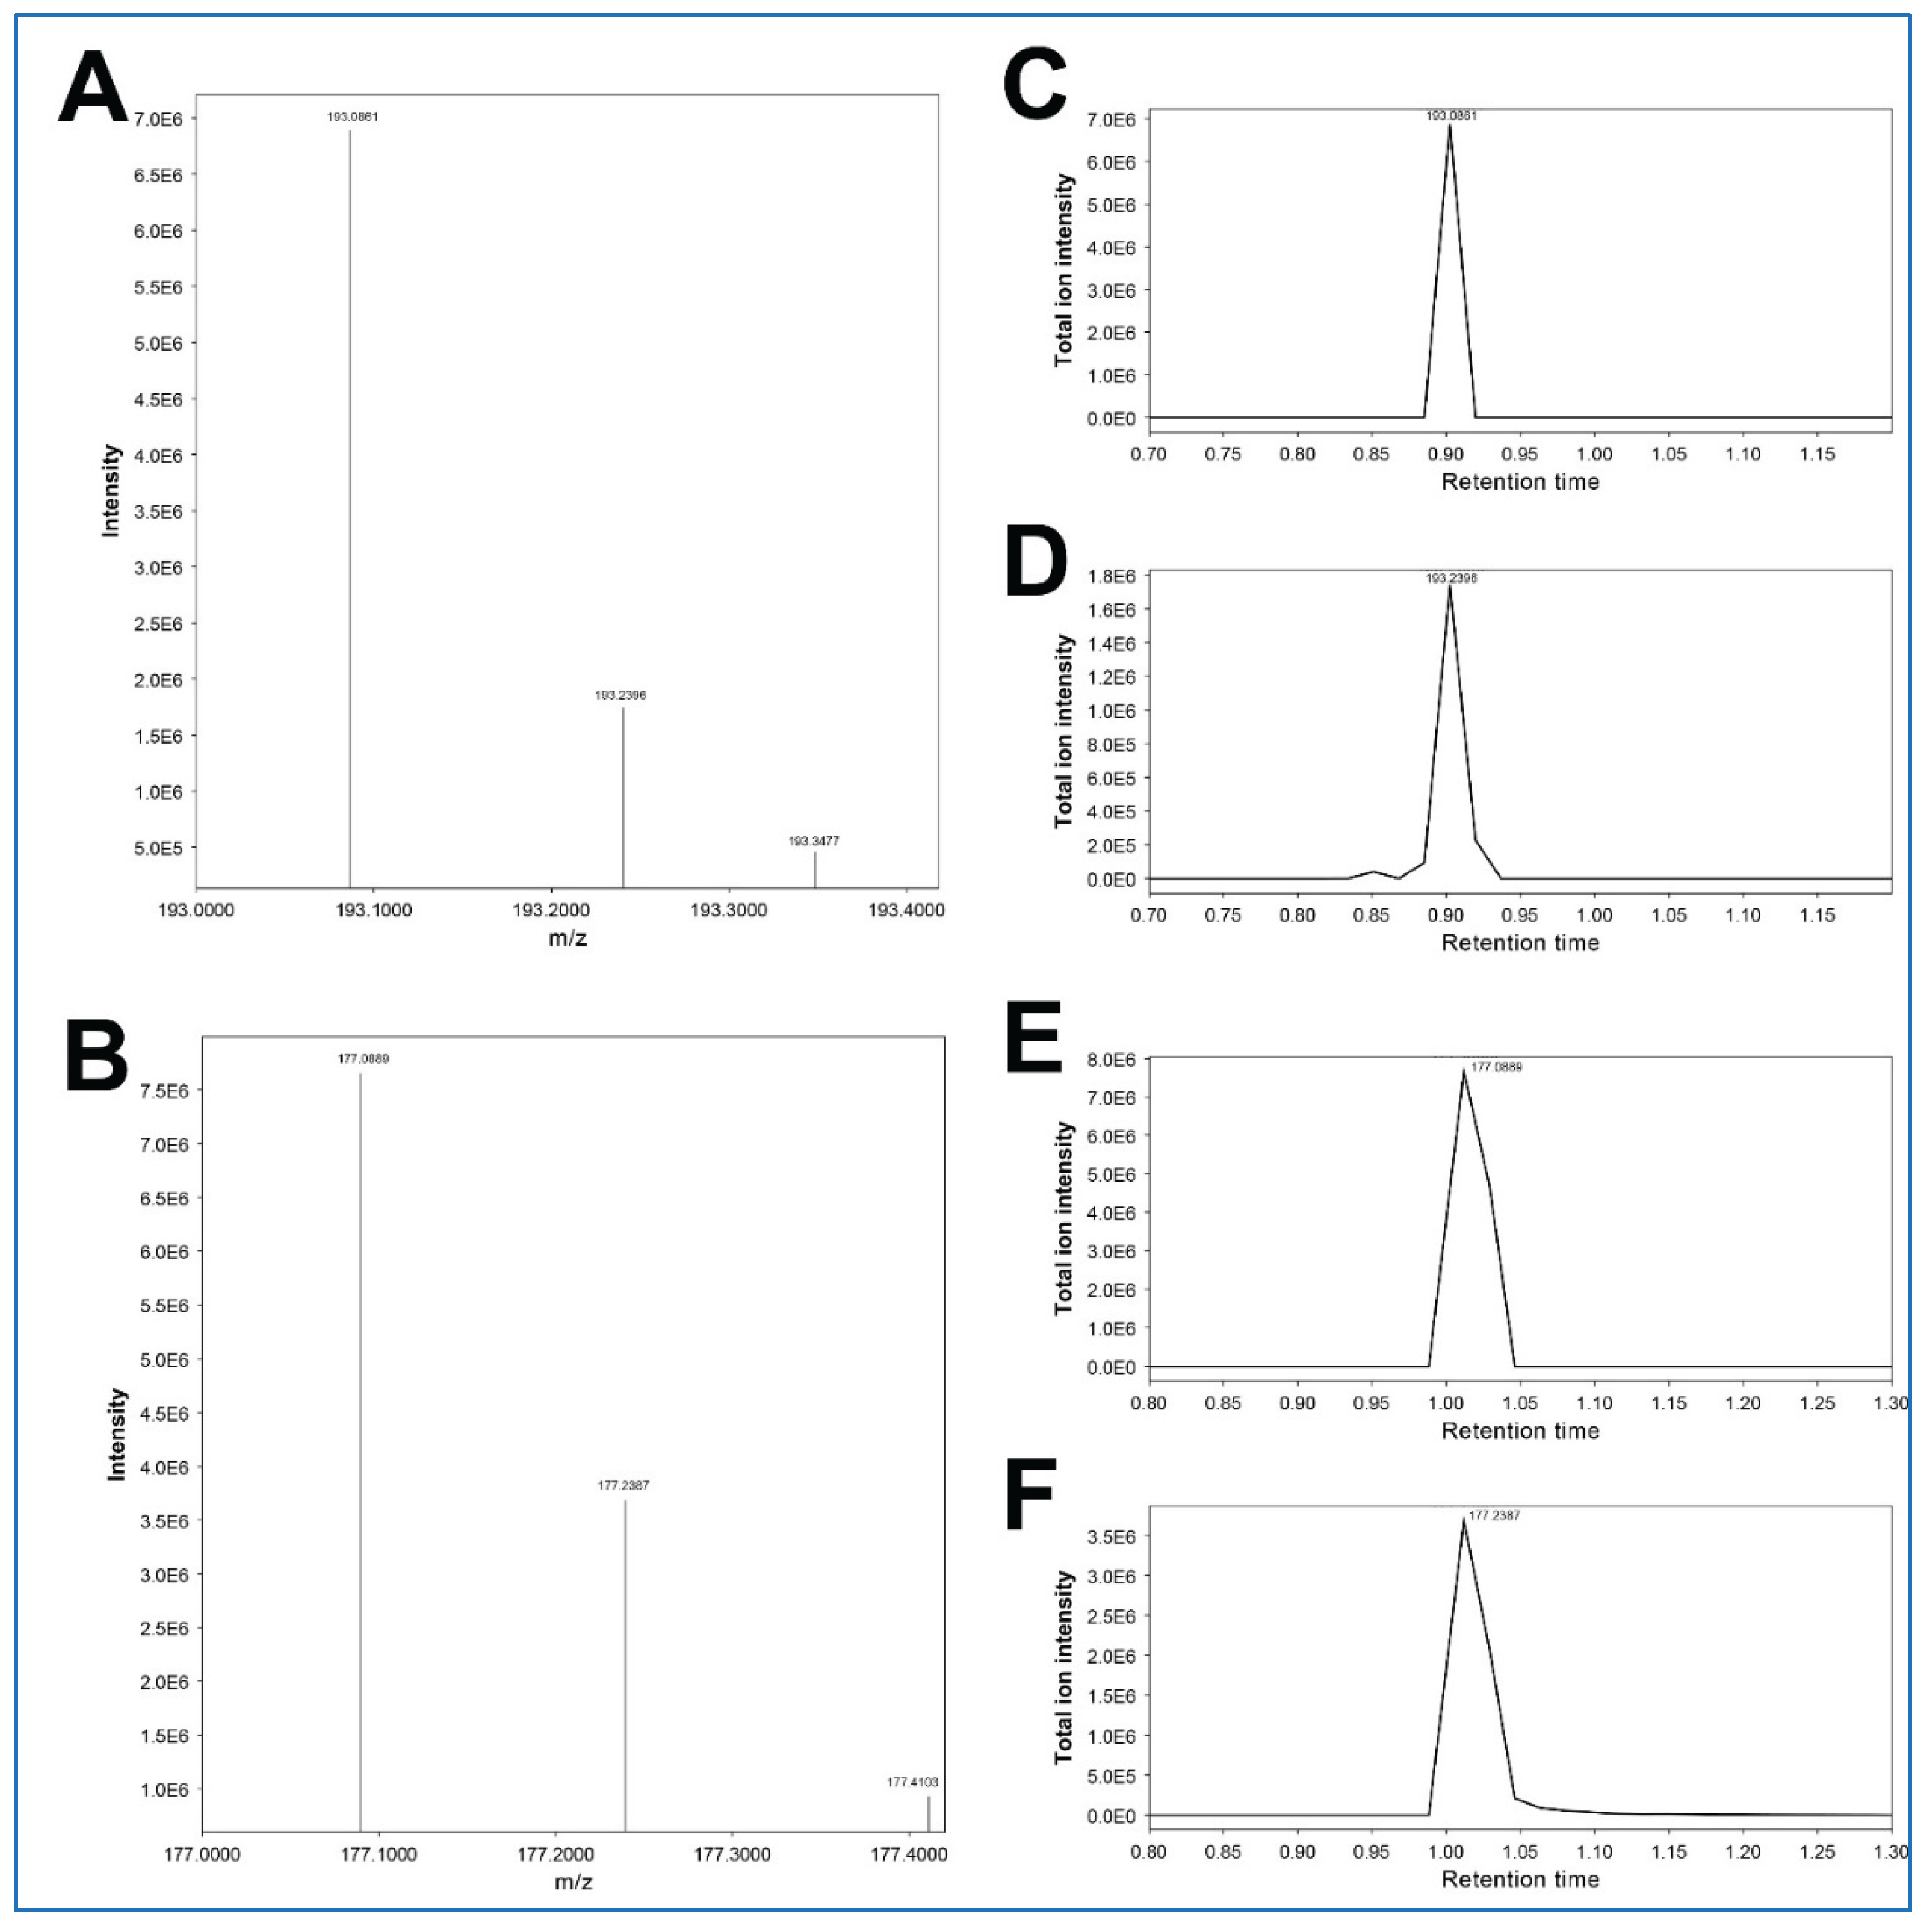

Table 1.
The patient demographics of this study. The number of cocaine-EIA positive cases are given in parenthesis.
Table 1.
The patient demographics of this study. The number of cocaine-EIA positive cases are given in parenthesis.
| Male | Female | |||
| Age (year) | Outpatient | Non-outpatient | Outpatient | Non-outpatient |
| 0-9 | 0 | 38 (2) | 0 | 33 |
| 10-19 | 1 | 23 | 3 | 29 |
| 20-29 | 7 | 10 (1) | 10 | 7 (3) |
| 30-39 | 12 (4) | 11 (2) | 19 (3) | 10 (1) |
| 40-49 | 23 (4) | 8 (2) | 21 (2) | 6 (3) |
| 50-59 | 20 | 13 (1) | 15 | 6 (1) |
| 60-69 | 12 (1) | 3 (2) | 6 | 5 |
| 70- | 5 (2) | 4 | 2 | 2 |
Table 2.
The 262 features associated with cocaine exposure were grouped into seven high-level clusters, designated as Cluster A through Cluster G (corresponding to Tables 2A–2G), based on hierarchical clustering of their intensity profiles. Within each table, columns represent feature groupings obtained from middle-level dendrogram slicing, while features enclosed by thin lines indicate sub-clusters defined by low-level dendrogram slicing. This hierarchical clustering framework was used to capture co-varying features, which may include parent compounds, metabolites, and related ion species.
| Cluster A (Table 2A) | Cluster B (Table 2B) | |||
| 90.05575_0.743 | 145.13571_1.285 | 154.12878_1.735 | 90.97554_0.714 | |
| 241.12184_0.698 | 187.14908_1.289 | 155.13155_1.637 | 106.95014_0.713 | |
| 142.12558_0.854 | 206.08679_2.052 | 170.12999_1.403 | 158.96283_0.713 | |
| 201.16602_1.997 | 304.16803_4.254 | 361.21246_1.4 | 174.93845_0.715 | |
| 400.20502_8.74 | 328.18445_1.433 | 236.13498_4.346 | 175.05_0.912 | |
| 330.41934_5.048 | 330.17252_5.513 | 317.20694_1.113 | 216.92113_0.717 | |
| 402.28555_7.96 | 332.24408_3.986 | 317.21439_1.06 | 226.95103_0.713 | |
| 716.56219_12.134 | 346.2359_4.045 | 234.89557_0.719 | ||
| 960.61224_5.519 | 560.30536_5.815 | 242.92693_0.715 | ||
| 207.11478_4.599 | 244.92462_0.724 | |||
| 260.22177_5.457 | 272.94611_0.7 | |||
| 290.14951_3.314 | 294.93652_0.718 | |||
| 304.20865_2.685 | 310.91443_0.726 | |||
| 306.13705_6.42 | 316.87534_0.712 | |||
| 332.24271_4.252 | 352.89661_0.718 | |||
| 339.97421_0.665 | 420.88394_0.717 | |||
| 358.25793_6.353 | 430.91025_0.712 | |||
| 359.22852_4.294 | 446.88776_0.717 | |||
| 370.22571_4.493 | 452.84384_0.716 | |||
| 370.23047_4.832 | 98.92009_0.73 | |||
| 398.26291_6.445 | 172.04063_0.842 | |||
| 444.31995_6.079 | 200.0448_0.702 | |||
| 460.22427_4.308 | 210.93623_0.718 | |||
| 546.26807_6.705 | 218.92108_0.718 | |||
| 257.15521_1.881 | 232.91742_0.718 | |||
| 358.44699_8.378 | 268.03149_0.717 | |||
| 358.60458_8.576 | 336.01816_0.71 | |||
| 398.25073_6.293 | 378.90033_0.719 | |||
| 479.24384_3.894 | ||||
| 481.25757_4.358 | ||||
| 529.2973_4.732 | ||||
| 553.29901_9.038 |
Table 3.
Thirty-seven significant features positively associated with cocaine-EIA results selected at least by two analyses.
Table 3.
Thirty-seven significant features positively associated with cocaine-EIA results selected at least by two analyses.
| Feature | Correlation | Volcano | PLS | EBAM | SAM | RF | Annotation |
| 200.12935_0.795 | X | X | X | Methyl ecgonine* | |||
| 304.15652_4.399 | X | X | X | X | X | X | Cocaine* |
| 200.13182_1.007 | X | X | X | Ethyl norecgonine (putative) | |||
| 182.123_0.87 | X | X | X | X | X | X | ISF (-H2O) of methyl ecgonine |
| 186.11491_0.834 | X | X | X | X | X | X | Ecgonine* |
| 330.17252_5.513 | X | X | X | Cinnamoylcocaine (putative) | |||
| 168.11021_0.847 | X | X | X | X | X | X | Ecgonidine*# |
| 198.11752_1.083 | X | X | Unknown | ||||
| 277.12286_2.952 | X | X | X | Unknown | |||
| 330.17572_5.651 | X | X | X | Cinnamoylcocaine (putative) | |||
| 162.108_2.008 | X | X | X | Unknown | |||
| 186.11212_1.025 | X | X | X | X | X | X | Methyl norecgonine (putative) |
| 214.15097_0.935 | X | X | Ethyl ecgonine* | ||||
| 233.17049_3.226 | X | X | Norfentanyl* | ||||
| 186.11717_1.818 | X | X | X | ISF of Hydroxy-benzoylecgonine (putative) | |||
| 200.13109_4.253 | X | X | X | Unknown $ | |||
| 91.05293_0.83 | X | X | Unknown | ||||
| 292.1264_4.051 | X | X | N-Hydroxy-norbenzoylecgonine (putative) | ||||
| 168.10931_1.568 | X | X | Methyl norecgonidine (putative) | ||||
| 290.14951_3.314 | X | X | Benzoylecgonine ^ | ||||
| 216.12822_1.072 | X | X | Unknown | ||||
| 168.10132_1.248 | X | X | X | X | Methyl norecgonidine and ISF of methyl norecgonine # (putative) | ||
| 304.16803_4.254 | X | X | X | X | Cocaine* | ||
| 155.13155_1.637 | X | X | Unknown | ||||
| 560.30536_5.815 | X | X | Unknown | ||||
| 221.08717_1.055 | X | X | X | 5-Hydroxy-L-tryptophan* | |||
| 193.13478_0.697 | X | X | Unknown | ||||
| 206.08679_2.052 | X | X | Unknown | ||||
| 292.15628_2.97 | X | X | Unknown | ||||
| 104.2101_0.734 | X | X | Unknown | ||||
| 188.06906_1.861 | V | X | Unknown | ||||
| 193.10092_0.876 | X | X | X | 3-Hydroxycotinine # | |||
| 177.23868_0.976 | X | X | X | Cotinine artifact (putative) | |||
| 177.14621_0.68 | X | X | X | Unknown | |||
| 177.10405_0.988 | X | X | Cotinine* | ||||
| 179.12364_0.927 | X | X | Nicotine-N-oxide* | ||||
| 193.24315_0.872 | X | X | 3-Hydroxycotinine artifact (putative) | ||||
| * Confirmed by spike study | |||||||
| ^Tail part | |||||||
| # Composite peak by more than one analyte ion cannot be ruled out | |||||||
| $ Cocaine metabolite or its ISF suspected | |||||||
Table 4.
Retention times (RTs) of cocaine-related metabolites, nicotine-related metabolites, other xenobiotics, and endogenous metabolites in urine, as determined experimentally and predicted using various computational models. The predicted RTs were calculated using the R package Retip based on the following models; XGBoost (xgb), Random Forest (rf), Bayesian Neural Network (brnn), and an automatic machine learning tool using the following molecular descriptors; logP (XLogP), atomistic logP (ALogP), number of hydrogen bond donors (nHBDon), and number of basic groups (nBase).
| RT (experimentally determined) | xgb | rf | brnn | XLogP | ALogP | nHBDon | nBase | |
| Cocaine-related metabolites | ||||||||
| Benzoylecgonine | 2.95 | 3.1 | 3.36 | 2.56 | 3.18 | 3.02 | 3.17 | 3.2 |
| cis-Cinnamoylcocaine | 6.94 | 7.02 | 4.77 | 6.38 | 5.99 | 5.93 | 5.99 | |
| trans-Cinnamoylcocaine | 6.94 | 7.02 | 4.77 | 6.38 | 5.99 | 5.93 | 5.99 | |
| Cocaethylene | 5.55 | 5.79 | 5.58 | 5.39 | 5.56 | 5.63 | 5.16 | 5.84 |
| Cocaine | 4.46 | 4.26 | 4.32 | 4.11 | 4.37 | 4.61 | 4.52 | 4.53 |
| Ecgonidine | 0.84 | 1.24 | 1.73 | 1.05 | 1.18 | 0.91 | 1.69 | 0.91 |
| Ecgonine | 0.80 | 0.51 | 1.3 | 0.34 | 0.29 | 0.87 | 1.27 | 1.52 |
| Ethyl ecgonine | 0.93 | 1.95 | 3.05 | 1.85 | 2 | 1.9 | 1.79 | 1.9 |
| Ethyl norecgonidine | 3.08 | 3.46 | 3.52 | 2.16 | 2.03 | 1.66 | 2.03 | |
| Ethyl norecgonine | 1.84 | 2.93 | 2.18 | 1.83 | 1.58 | 1.56 | 1.58 | |
| Methyl ecgonidine | 1.10 | 1.39 | 1.69 | 1.62 | 1.32 | 1.16 | 1.5 | 1.71 |
| Methyl ecgonine | 0.80 | 0.88 | 1.19 | 1 | 0.7 | 0.74 | 0.91 | 0.83 |
| Methyl norecgonidine | 2.76 | 3.17 | 2.4 | 1.55 | 1.59 | 1.05 | 1.59 | |
| Methyl norecgonine | 0.87 | 1.32 | 1.25 | 1 | 1.17 | 1.1 | 1.17 | |
| m-Hydrox-benzoylecgonine | 2.68 | 3.67 | 2.17 | 3.89 | 4.14 | 3.77 | 4.14 | |
| o-Hydrox-benzoylecgonine | 2.94 | 4 | 2.12 | 2.97 | 3.28 | 2.63 | 3.28 | |
| p-Hydrox-benzoylecgonine | 2.74 | 3.67 | 1.96 | 3.86 | 4 | 3.77 | 4 | |
| m-Hydroxy-benzoylnorecgonine | 2.66 | 3.11 | 2.6 | 2.45 | 2.44 | 2.63 | 3.23 | |
| N-Hydroxy-benzoylnorecgonine | 3.22 | 3.15 | 4.12 | 2.84 | 2.74 | 3.08 | 3.18 | |
| o-Hydroxy-benzoylnorecgonine | 2.81 | 3.61 | 2.82 | 2.84 | 2.79 | 3.29 | 3.84 | |
| p-Hydroxy-benzoylnorecgonine | 2.66 | 3.1 | 2.41 | 2.46 | 2.38 | 2.63 | 3.23 | |
| Norcocaine | 4.54 | 4.32 | 4.05 | 4.47 | 4.1 | 4.32 | 4.19 | 4.31 |
| Nicotine-related metabolites | ||||||||
| Cotinine N-oxide | 1.18 | 1.41 | 0.76 | 1.59 | 1.65 | 1.62 | 1.29 | |
| Cotinine | 1.06 | 1.12 | 1.23 | 0.65 | 1.18 | 1.2 | 1.38 | 1.39 |
| 2-Hydroxynicotine | 0.7 | 1.4 | -0.18 | 0.55 | 0.8 | 1.14 | 0.79 | |
| 3-Hydroxycotinine | 0.90 | 0.78 | 1.36 | 0.21 | 0.86 | 0.96 | 1.23 | 1.01 |
| 5-Hydroxycotinine | 1.11 | 1.37 | -0.03 | 1.39 | 1.07 | 1.78 | 2.05 | |
| Nicotine N-oxide | 0.92 | 1.07 | 1.4 | 0.12 | 1.2 | 1.29 | 1.28 | 1.42 |
| Other xenobiotics | ||||||||
| p-Synephrine | 0.83 | 0.92 | 1.5 | 0.55 | 0.89 | 0.81 | 1.35 | 1.21 |
| Phenylephrine (m-synephrine) | 0.83 | 0.92 | 1.47 | 0.62 | 0.81 | 0.83 | 1.31 | 1.06 |
| Norfentanyl | 3.25 | 3.24 | 3.49 | 2.78 | 3.32 | 3.26 | 3.42 | 3.16 |
| Endogenous metabolite | ||||||||
| 3-Methoxytyramine | 0.98 | 1.5 | 1.53 | 1.94 | 1.19 | 1.18 | 1.17 | 1.43 |
| 5-Hydroxytryptophan | 0.90 | 1.19 | 1.66 | 0.25 | 0.78 | 0.71 | 1.6 | 1.34 |
Disclaimer/Publisher’s Note: The statements, opinions and data contained in all publications are solely those of the individual author(s) and contributor(s) and not of MDPI and/or the editor(s). MDPI and/or the editor(s) disclaim responsibility for any injury to people or property resulting from any ideas, methods, instructions or products referred to in the content. |
© 2025 by the authors. Licensee MDPI, Basel, Switzerland. This article is an open access article distributed under the terms and conditions of the Creative Commons Attribution (CC BY) license (http://creativecommons.org/licenses/by/4.0/).
Copyright: This open access article is published under a Creative Commons CC BY 4.0 license, which permit the free download, distribution, and reuse, provided that the author and preprint are cited in any reuse.


