Submitted:
10 July 2025
Posted:
10 July 2025
You are already at the latest version
Abstract
Aiming at the issues of the true mechanical performance and failure mechanism of large-span cast-in-situ hollow core floor slabs with square-box core molds under vertical loads, this study conducted systematic research combining in-situ tests and refined numerical simulations. Based on an actual project at the Hefei Xinluzhou Industrial Park, a distributed water tank loading system was employed to apply five-stage cyclic loading to an 8m × 8m slab section. The strains in both the reinforcing steel and concrete were monitored in real-time. Simultaneously, a coupled finite element model incorporating a concrete plastic damage constitutive model and an elastic-plastic model for steel reinforcement was established. This model was used to quantitatively analyze the stress distribution, stiffness evolution, and failure progression. The study shows that under a design load of 9.0kN/m², the floor slab operates in an elastic state, with stress distribution exhibiting “banded gradient” and “island-shaped loading” characteristics. This means a banded gradient in the middle span and localized concentration at the column capital edge. The strain-load relationship of the steel reinforcement and concrete is linear, and the bidirectional stiffness is similar. The finite element model accurately reproduced the experimental phenomena, confirming its reliability. Limit analysis revealed that the floor slab's load-bearing capacity reaches 27.2kN/m², with failure starting from diagonal cracks at the column capital edge and propagating to the positive bending cracks at the middle span bottom of the slab. The findings of this study reveals the bidirectional bending mechanism and failure path of box-shaped core mold hollow floor slabs, providing important theoretical and experimental support for optimizing the design of large-span floor slabs.
Keywords:
square-box core molds
; hollow core slabs
; structural response
; load-bearing performance
1. Introduction
Floor slabs constitute one of the fundamental components within building structures, significantly impacting both the functional utility and overall cost of buildings [1,2]. As building spans increase, the self-weight of floor slabs typically rises correspondingly. This escalation not only restricts the efficient utilization of architectural space but also constrains the realization of desired building functions. Consequently, effectively reducing the self-weight of floor slabs during the design phase [3,4] has emerged as a critical challenge. Cast-in-situ hollow core slabs, as an innovative structural form, achieve a significant reduction in self-weight by incorporating hollow sections within the slab core while simultaneously enhancing mechanical performance. This structural system has found widespread application in various construction projects. Beyond effectively minimizing slab weight, this structure also offers advantages in improving seismic resistance and thermal performance, making it particularly suitable for large-span slab design.
However, despite the extensive practical application of cast-in-situ hollow core slabs, their structural mechanical behavior, particularly the deformation characteristics under actual loading conditions of slabs employing rectangular box core molds, has not been sufficiently validated through comprehensive engineering tests [5]. To gain a thorough understanding of the stress distribution in reinforcement and concrete, strength reserves, and safety performance of hollow core slabs under load, detailed investigation and validation through in-situ testing are essential [6,7,8].
Within the realm of design and construction for cast-in-situ concrete hollow core slabs, researchers have extensively explored aspects including mechanical properties, construction techniques, material selection, and design optimization. Chen Y. et al. [9] experimentally revealed the strengthening mechanism of interface composite action on the flexural performance in profiled steel sheet-concrete composite hollow slabs, providing a comparative reference for the two-way flexural design of cast-in-situ concrete hollow core slabs. Regarding construction technology, Zhang Y. et al. [10,11,12] systematically summarized construction techniques for cast-in-situ concrete assembled box hollow core slabs, proposing effective construction schemes and optimization strategies that significantly enhance project quality and construction efficiency. Furthermore, Kim H. et al. [13,14,15] analyzed key design considerations for cast-in-situ concrete hollow core slabs, emphasizing the effective integration of structural form and mechanical performance. As research progresses, an increasing number of scholars have focused on the vertical load-bearing behavior and design methodologies for hollow core slabs. For instance, Liu Y. et al. [16,17,18,19] through in-depth studies on the vertical load-bearing characteristics of cast-in-situ concrete hollow core slabs, proposed novel design parameters, offering theoretical foundations for the engineering application of hollow slabs. Finite element analysis (FEA), as an efficient simulation tool, is widely applied in studying the structural mechanics of hollow core slabs. Meng X. et al. [20] utilized FEA to analyze the mechanical properties of hollow core slabs under different structural configurations. Jin J. et al. [21,22] validated the predictive accuracy of their models by comparing experimental results at ultimate load with finite element simulation outcomes. Additionally, Li X. et al. [23,24] conducted deformation tests on concrete hollow core slabs, verifying their mechanical characteristics and providing experimental evidence for design. These studies have accumulated valuable practical experience and theoretical foundations for the construction design of hollow core slabs.
To verify the rationality and safety of the hollow core slab structural design, this study will acquire mechanical data under real loading conditions through in-situ testing. This data will be combined with refined finite element simulation models to assess the deformation characteristics and stress distribution of the slab under vertical loading. The experimental monitoring will facilitate a deeper understanding of the load-bearing mechanism of hollow core slabs and provide a scientific basis for further optimizing design methods. Furthermore, this research will evaluate the influence of construction quality on slab performance, offering technical support and practical experience for future engineering projects, thereby promoting continuous improvement and innovation in structural design and construction techniques. Through this combined experimental and simulation analysis, the present study aims not only to contribute to refining the existing design theory for hollow core slabs but also to provide practical evidence supporting their engineering application.
2. Project Overview
The high-rise Building 1# of the Hefei Xinluzhou Integrated Circuit Industrial Park is situated in a highly developed urban area at the northeast corner of the intersection of Tianshui Road and Jinchi Road, Luyang Economic Development Zone. The surrounding area features high development density and experiences heavy traffic on existing roads. Building 1# comprises one basement level and 24 above-ground stories, with a total building height of 96.35 meters, as shown in Figure 1(a). The main structure of the project adopts a frame-core tube structural system. The floors use a box-shaped core mold hollow floor slab structure, as shown in Figure 1b and c.
The hollow core slabs are connected to the cast-in-situ reinforced concrete columns via main beams. Within the internal area, the core molds are arranged at uniform intervals according to the design. The core molds are factory-precast elements. The bottom slab reinforcement is placed below the molds, while the top slab reinforcement is placed above them. These two layers of reinforcement are interconnected by rib reinforcement. When the hollow core slab thickness is 350 mm, core molds with dimensions of 650 mm (length) × 650 mm (width) × 230 mm (height) are employed. When the slab thickness is 300 mm, core molds measuring 650 mm × 650 mm × 180 mm are used. For a slab thickness of 270 mm, core molds sized 650 mm × 650 mm × 160 mm are utilized.
The dimensions of the hollow floor slab are 8000mm × 8000mm, with a thickness of 300mm, including a top slab thickness of 60mm, and double-layer bidirectional surface reinforcement with an 8mm diameter and 150mm spacing. The bottom slab thickness is 60mm. The cross-sectional dimensions of the rib beams are 150mm × 180mm, with longitudinal spacing of 800mm and transverse spacing of 800mm. The concrete strength grade is C30, the rib beam reinforcement strength grade is HRB400, and the surface reinforcement strength grade is HRB300. The detailed structural layout of the hollow floor slab is shown in Figure 2.
3. In-Situ Experiment of the Box-Shaped Hollow Floor Slab
3.1. Experiment Plan
The in-situ experiment on the load-bearing deformation characteristics of the box-shaped hollow floor slab was conducted on the 15th floor of Building 1 in the Hefei Core Luchou Integrated Circuit Industry Park, in an 8.0m × 8.0m area. The test program included stress and strain measurements of reinforcement and concrete in the primary and secondary ribs, stress and strain measurements of reinforcement and concrete in the top and bottom cast-in-situ concrete cover slabs of the floor slab, and monitoring of concrete surface cracks on the slab. The primary instrumentation consisted of static strain gauges with supporting hardware and software, reinforcement strain gauges, concrete surface strain gauges, and concrete crack observation instruments, as shown in Figure 3.
3.2. Experimental Methods
This study employed an in-situ loading test system to evaluate the structural response of the rectangular box-core hollow slab. The testing procedure comprised three main stages: monitoring system installation, staged loading implementation, and structural response monitoring.
3.2.1. Monitoring System Installation
Based on the bidirectional flexural behavior of the structure and in accordance with the Standard for Test Methods of Concrete Structures (GB/T 50152-2012) [28], strain monitoring points were established in the critical load-bearing zones of the primary and secondary rib beams and the cast-in-intu concrete thin slabs at both the top and bottom surfaces of the slab. During the reinforcement installation stage for the primary and secondary rib beams and the thin slabs at the top and bottom of the slab, rebar stress gauges were welded onto the rib beam reinforcement at the designated test points (see Figure 4a). Simultaneously, concrete strain gauges were installed on the slab reinforcement at the same test points during concrete pouring. Following the completion of concrete pouring and attainment of the required curing period, concrete strain gauges were bonded onto the concrete surface at the corresponding test points (see Figure 4b).
3.2.2. Implementation of Graded Loading
A distributed water tank loading system was employed at the test site to simulate uniformly distributed vertical loading. The water tanks were arranged symmetrically on an orthogonal grid over the 8.0 m × 8.0 m test area. A central 1m-wide access corridor was reserved within the loading system (see Figure 5a) to facilitate water filling operations and real-time monitoring. The test used a five-level cyclic loading-unloading system, initially applying a 1.0kN/m² preload to eliminate contact nonlinearity. The load was then incrementally increased by 2.0kN/m², reaching peak values of 3.0kN/m², 5.0kN/m², 7.0kN/m², and 9.0kN/m², before being unloaded in stages, from 7.0kN/m² to 0.0kN/m². According to the Chinese standard GB/T 50152-201228, each load stage was applied or removed and held for 30 minutes to ensure that the structural stress redistribution reached a steady-state balance, as shown in Figure 5b.
3.2.3. Structural Response Monitoring
During the loading process, close monitoring of the floor slab surface was performed to check for visible cracks in the concrete. Simultaneously, to fully reflect the structural response, strain variations in both the rebar and concrete were monitored (see Figure 6a). After loading was completed, a concrete crack tester was used to measure the crack width, and the length, number, and distribution characteristics of potential cracks were also measured (see Figure 6b). The test results showed that under a maximum load of 9.0kN/m², no visible cracks appeared on the floor slab surface, the crack width measurement was zero, and the distribution was uniform with no abnormal concentration.
3.3. Experimental Results and Analysis
The load-strain curve of the rib beam reinforcement of the hollow floor slab is shown in Figure 7. The specific measurement points include: upper reinforcement at the center of the X-direction hidden beam span (S1), bottom center measurement point (S3), quarter of the Y-direction hidden beam (S8), and lower reinforcement at the center of the X-direction hidden beam span (X1), bottom center measurement point (X3), and quarter of the Y-direction hidden beam (X8). It should be noted that the strain values of the rebar are derived from the measured stress values. This conversion was performed according to Hooke's law (Equation 1):
where:
E -- Elastic Modulus,
σ -- Stress,
ε – Strain
This conversion ensures direct comparability with concrete strain data and provides a unified benchmark for validating the cooperative performance of rebar and concrete.
As seen in the figure, the upper rib beam reinforcement exhibits compressive behavior under load, with the maximum strain occurring at the center of the span. The strain decreases from the center of the slab towards the edge rib, and from the edge rib towards the two sides. Additionally, the strain in the upper reinforcement of the center slab changes from positive to negative, indicating that before the load was applied, the upper reinforcement of the slab ribs was under tensile stress. As the load increased, it gradually transitioned to compressive stress. The stress-strain behavior of the lower reinforcement in the rib beam of the box-shaped core mold hollow floor slab is the opposite of that of the upper reinforcement. Under load, the lower rib beam reinforcement is in a tensile state, with strain decreasing from the center of the slab towards the edge rib and further reducing towards both sides. The strain in the lower reinforcement of the center slab rib changes from negative to positive, indicating that initially the lower reinforcement of the slab rib was under compressive stress. As the load increases, the lower reinforcement transitions to tensile stress. This phenomenon is hypothesized to be related to the upward camber effect applied to the slab during the installation of the formwork, as required by the construction specifications.
The load-strain relationship of the hollow floor slab concrete is shown in Figure 8. Figure 8 shows the structural response of the bottom slab concrete at key measurement points, specifically including the Y-direction hidden beam center points (HX1, HY1), center points (HX3, HY3), and X-direction hidden beam 1/4 span points (HX8, HY8) load-strain curves.
From the figure, it can be seen that the hollow floor slab exhibits distinct load distribution characteristics under loading. The top slab concrete is under compression, while the bottom slab concrete is under tension. The strain data from each measurement point show a linear trend with the load, indicating that the floor slab remains in the elastic stress stage under the 9.0kN/m² load. During the staged loading up to the 9.0kN/m² ultimate load and complete unloading process, the surface of the floor slab was thoroughly inspected visually and scanned by a crack observation instrument, with no visible macro cracks observed. This phenomenon is corroborated by the linear characteristics of the strain data, confirming that the structure is in an elastic working state under the test load. The data from different measurement points show banded variations, which are closely related to the load-bearing characteristics and structural features of the hollow floor slab, especially where strain is most noticeable at the loaded areas, gradually concentrating from the boundary to the center of the span, with strain values progressively increasing. Additionally, the stress near the edge ribs increases as the slab ribs are approached, forming an island-like stress concentration, which is consistent with the stress distribution principle of hollow floor slabs. The strain variation trend at the concrete measurement points is consistent with the variation trends of the corresponding rib beams and surface reinforcement, reflecting the collaborative effect of reinforced concrete. Overall, the strain differences between the top and bottom slab concretes and the measurement points in the X and Y directions are minimal, indicating that the hollow floor slab has similar bending stiffness in both the X and Y directions.
4. Numerical Calculation Analysis of the Box-shaped Hollow Floor Slab
4.1. Model Construction
4.1.1. Material Constitutive Relationship
In this study, the concrete constitutive model used is a plastic damage model, which complies with the relevant standards[27]. This model can effectively describe the mechanical behavior of concrete under monotonic and cyclic loading. The rebar constitutive model uses an elastoplastic bilinear model. The mechanical performance indicators of concrete and rebar are shown in Table 1. The uniaxial compressive stress-strain curve is established based on the standard formula. When using the plastic damage model for numerical simulation, five parameters must be input: the expansion angle, eccentricity, compressive strength ratio fb0/fc0 (axial compressive strength to cube compressive strength), the ratio of second stress invariant in the meridian plane for tension and compression (K), and the viscous coefficient. Other parameter values are shown in Table 2.
4.1.2. Model Establishment
A three-dimensional finite element numerical calculation model of the box-shaped hollow floor slab was established based on the actual project of Building 1 at the Hefei Core Luchou Integrated Circuit Industry Park. The calculation model adopts a separated modeling approach, where rebar and concrete are established as separate modules to form three-dimensional components. These components are then assembled using the Assembly function, with efficient generation of repeating components via the linear array function. Boolean operations are used to merge components of the same type into the overall structure, eventually forming the structural assembly model shown in Figure 9. Key parameters such as column capital (800mm × 800mm), core mold (650mm × 650mm × 130mm), and hidden beams (150mm × 600mm, spacing 800mm) were set based on the actual engineering dimensions to form a complete structural model. Material and cross-sectional properties were created through the Property module, and section properties were assigned to the components. The analysis steps were set in the Step module. The interaction between concrete and rebar is defined through the Interaction module. The Embedded Element technique is used to embed rebar into concrete, simulating the coupling relationship between rebar and concrete and accurately modeling the reinforcement effect and constraint behavior of the rebar when concrete is under compression. The loading method is surface load application, with vertical loads uniformly applied to the top slab surface of the hollow floor slab. The boundary conditions are fixed at the column ends, meaning that fixed constraints are set at the column base to simulate the structural constraints in actual engineering. In the numerical model, concrete is represented using C3D8R (three-dimensional 8-node linear brick elements) solid elements, while rebar is represented using T3D2 (three-dimensional 2-node truss) elements. The mesh size for concrete and rebar elements is controlled at 200mm and 100mm, respectively. Complex cavity structures are divided to ensure computational efficiency and accuracy.
4.2. Simulation Results and Analysis
To systematically evaluate the load response characteristics of the box-shaped core mold hollow floor slab in the elastic stage, this section conducts numerical calculations based on finite element simulations. The calculations refer to the on-site experimental conditions and achieve a numerical reproduction of the loading conditions through incremental staged loading. Stepwise uniform loads are applied to the top slab surface (1.0kN/m² → 3.0kN/m² → 5.0kN/m² → 7.0kN/m² → 9.0kN/m²). The design of this loading system aims to quantitatively analyze the structural stiffness degradation pattern and stress redistribution path, providing theoretical support for validating the observed experimental phenomena.
4.2.1. Rebar Strain Analysis
Under the four-edge simple support constraint, the rebar strain distribution in the hollow floor slab under 9.0kN/m² uniformly distributed load is shown in Figure 10. From the rebar strain cloud diagram, it can be seen that under the test load and loading mode, the rebar stress-strain cloud diagram exhibits a distinct island-shaped distribution trend. The rebar strain concentrates towards the column capital area, showing positive strain and radiating outward with decreasing strain, which is the characteristic of island-shaped radiation. From the rebar stress cloud diagram, it can be seen that under the uniformly distributed load, the center part of the rebar mesh bears compressive stress, while the edge parts of the rebar (near the column capital) bear tensile stress. The stress cloud diagram changes uniformly and exhibits an axisymmetric pattern, which aligns with the bidirectional bending stress state of the hollow floor slab.
4.2.2. Concrete Strain Analysis
The stress cloud diagrams of the top and bottom concrete slabs of the hollow floor slab are shown in Figure 11. It can be seen that the center of the top slab is under compression, transitioning to tension towards both sides. Similarly, the center of the bottom slab is under tension, transitioning to compression towards both sides. The strain increases closer to the column capital. Due to the vertical connection between the column capital and the floor slab, strain concentration occurs at the edges, which aligns with the bidirectional bending stress state of the hollow floor slab. Due to the presence of internal cavities, the strain contour lines are not smooth, and they distort at the core mold edges, indicating that the cavity weakens the continuity of the concrete. Comparing the strain distribution cloud diagrams in the X and Y directions, their overall trends are highly consistent. This result strongly proves that the hollow floor slab has similar bending stiffness in both the X and Y directions, which is in line with the design expectations of bidirectional bending.
4.2.3. Ultimate Load Capacity Analysis of the Hollow Floor Slab
The total load in the experiment reached 9.0kN/m². Due to limitations of the testing site and equipment, the floor slab was not loaded to failure, and its ultimate load capacity was not directly measured through the experiment. Further research into its load capacity beyond 9.0kN/m² was conducted, and finite element simulation was proven to be a supplementary method [25]. To investigate the ultimate load capacity of the hollow floor slab, the load was continuously increased until the calculation did not converge, which provided the load at the time of slab failure. In the finite element model of this structure, the calculation reached TIME 4.2, where the structural deformation became excessive. When the next load increment was attempted, the structure could no longer carry the load, thus the load at this point is considered the plastic limit load, which is 27.2kN/m².To further compare the crack distribution, this study selected the tensile damage index (DAMAGET) as the core parameter (26). The crack distribution of the hollow floor slab at this point is shown in Figure 12.
From the figure, it can be seen that cracks are mainly concentrated in the middle of the bottom span and at the edge of the column capital at the top of the slab, which corresponds to the maximum positive and negative bending moments of the slab. Additionally, diagonal cracks appear at the intersections of the slab corners and columns. Cracks first appear at the slab-column junction. In the middle of the bottom span, cracks first appear in the vertical direction along the box-shaped cavity units. The design should focus on strengthening the bending and punching shear resistance around the column capital and optimizing the core mold spacing in the center span to delay the propagation of cracks.
4.3. Comparison Analysis of Experiments and Finite Element Simulation
To further explore the load-bearing characteristics of the box-shaped core mold hollow floor slab and verify the reliability of the finite element model, this study conducts a comparative analysis between experimental and numerical simulation results based on the strain gradient distribution theory, selecting representative key monitoring points.
The center point of the rebar mesh (center span, corresponding to test point S3) was selected as the monitoring point for comparison. The comparison results are shown in Figure 13. Under the 9.0kN/m² load, the experimental measured rebar strain was 13με, while the finite element simulation value was 12.1με, with a relative error of 6.9%, indicating a high degree of agreement. The finite element simulation successfully captured the core feature of rebar stress—the "island-shaped radiation" distribution pattern, where tensile strain concentrates in the column capital area and spreads outwards, decreasing. This feature is consistent with the experimental measured strain gradient distribution, effectively verifying the accuracy of the model in simulating the rebar stress state. In the finite element simulation, the Embedded Element technique was used to model the rebar-concrete interaction, which reflects the initial rebar stress state caused by formwork camber and is in close agreement with the stress reversal observed in the experiment, further validating the model’s capability to reflect real-world structural behavior.
Concrete slab bottom center points (center span, corresponding to test points HX8, HY8) were selected as the X and Y direction monitoring points for comparison. The comparison results are shown in Figure 14. In the finite element simulation under the 9.0kN/m² load, the maximum tensile strain at the X-direction bottom was 16.8με, while the experimental measured value was 16.5με, with a relative error of 1.8%. The maximum tensile strain at the Y-direction bottom was 15.2με, and the experimental measured value was 13.85με, with a relative error of 8.8%, showing good consistency. In the finite element simulation, due to the exclusion of concrete shrinkage and creep effects and defects in the on-site pouring process, there was a certain deviation in the strain simulation values at the edges of the bottom slab. However, the overall strain distribution trend still highly matched the experimental data.
In summary, the overall trend of the finite element simulation is generally consistent with the experimental results. However, there are still some errors, mainly arising from six aspects: (1) The mechanical properties of the actual materials exhibit variability, and the measured average or standard values of the materials used in the experiments may differ from the actual strength of the test specimens used in the finite element simulation. (2) Limitations of numerical methods and solution accuracy. (3) The finite element simulation does not consider the compression between elements, which leads to deviations from actual deformation. (4) The Embedded Element technique was used to embed rebar into concrete in the simulation, but the bond-slip relationship between the two materials was not considered. (5) There are construction defects and environmental changes that cannot be precisely simulated. (6) Measurement and data processing errors, including the accuracy of strain gauges, crack observation instruments, calibration, installation positions, and other factors, directly affect the quality of the data obtained.
5. Conclusion
This study investigates the load-bearing characteristics of box-shaped core mold hollow floor slabs under vertical loads. Through on-site experiments and refined numerical simulations, the bidirectional bending mechanism and failure evolution of the hollow floor slab under vertical loads were systematically revealed. The main conclusions are as follows:
(1) Through on-site experimental studies, under vertical staged loading, the box-shaped core mold hollow floor slab did not exhibit visible cracks, and the strain-load curve of the rebar and concrete showed a linear relationship, indicating that the load-bearing deformation is in the elastic stage. The stress distribution exhibited significant dual characteristics of "banded gradient" and "island-shaped loading," with the center span forming a bidirectional bending core zone and stress concentration at the column capital edge due to stiffness discontinuity. This intuitively reflects the load transfer path to the supporting components.
(2) The concrete-rebar coupled finite element model based on plastic damage constitutive relations successfully reproduced the "island-shaped radiation" strain distribution of the rebar and the compressive response at the top slab and tensile response at the bottom slab in the experiment. Under a 9.0kN/m² load, the rebar strain simulation error was ≤6.9%, and the concrete strain error was ≤8.8%, verifying the reliability of the model.
(3) Based on the results of on-site experiments and finite element simulations, optimization directions for the hollow floor slab structural design are proposed: To address the issue of "island-shaped loading" concentration around the column capital, rebar mesh can be locally densified, or high-strength concrete can be used to enhance stress diffusion. The center span slab can optimize the core mold spacing based on the stress gradient, reducing material usage while ensuring stiffness. At the same time, during construction, strict control of the formwork camber accuracy is required to prevent initial deformation from affecting the collaboration between rebar and concrete. Structural detail optimization can improve the overall mechanical performance and cost-effectiveness of the floor slab.
Author Contributions
Conceptualization, Z.Z. and F.C.; Data curation, X.L.and F.C.; Methodology, Z.Z.and X.L.; Formal analysis, Z.Z.and Y.H.; Investigation. Y.H.and W.L.; Writing—original draft, Z.Z.and Y.H.; Writing—review & editing, Z.Z.and X.L.; Supervision, Z.Z and L.W.; Project administration, Z.Z.and X.L.; Resources, Z.Z, X.L and L.W; Supervision, Z.Z.and L.W.; Validation, M.Z.and Y.H.; Visualization, M.Z. and Y.H. All authors have read and agreed to the published version of the manuscript.
Funding
This study was funded by the Science and Technology Plan of Housing and Urban-Rural Construction in Anhui Province (2022-YF096), and Science and technology development project (HYB20250019, HYB20250012).
Data Availability Statement
Data is contained within the article.
Conflicts of Interest
The authors declare that they have no conflicts of interest.
References
- Xu X, Yu J, Wang S, et al. Research and application of active hollow core slabs in building systems for utilizing low energy sources[J]. Applied Energy, 2014, 116: 424-435. [CrossRef]
- Zhu G, Wang X, Wang W, et al. Research on the Flexural Behavior of Profiled Steel Sheet–Hollow Concrete Composite Floor Slab[J]. Buildings, 2025, 15(12): 2140. [CrossRef]
- Mahdi A A, Ismael M A. Structural behavior of hollow-core one way slabs of high strength self-compacting concrete[J]. vol, 2021, 34: 39-45. [CrossRef]
- Li M, et al. Finite Element Modeling of Hollow Core Slabs Under Eccentric Loading: Parametric Study[J]. Thin-Walled Structures, 2023, 189: 110653.
- Frăţilă E, Kiss Z. Finite element analysis of hollow-core slabs[J]. Journal of Applied Engineering Sciences, 2016, 6(1): 29-33. [CrossRef]
- Mahboob A, Hassanshahi O, Hakimi A, et al. Evaluating the performance of hollow core slabs (HCS)-concrete and simplifying their implementation[J]. Recent Progress in Materials, 2023, 5(2): 1-15. [CrossRef]
- Al-Azzawi A A, Al-Aziz B M A. Behavior of reinforced lightweight aggregate concrete hollow-core slabs[J]. Computers and concrete, 2018, 21(2): 117-126.
- Supriya T J, Praveen J V. Use of Precast Hollow Core Slabs in High Rise Buildings[J]. International Journal of Engineering Research & Technology (IJERT), ISSN, 2278-0181.
- Chen Y, Wu Z. Shear behavior of prestressed hollow core slabs strengthened with CFRP sheets[J]. Composite Structures, 2020, 247: 112523.
- Zhang Y, Li Q. Mechanical behavior and design method of cast-in-place concrete hollow floor with bidirectional orthogonal ribs[J]. Journal of Building Structures, 2023, 44(5): 125–137.
- Tan K H, Zheng L X, Paramasivam P. Designing hollow-core slabs for continuity[J]. PCI journal, 1996, 41: 82-91. [CrossRef]
- Li, Y, et al. Experimental Investigation on Flexural Behavior of Prefabricated Hollow Core Slabs with Steel Fibers. Engineering Structures, 2024, 305: 117345.
- Kim H, et al. Shear Strengthening of Hollow Core Slabs Using CFRP Plates: Experimental Validation[J]. Composite Structures, 2022, 313: 115734.
- Firouzranjbar S, Schultz A. Numerical Investigation of Modified Punching Shear Behavior in Precast Prestressed Hollow Core Slabs Under Concentrated Loads[J]. Available at SSRN 5076557.
- Bosco C, Debernardi P G. Experimental investigation on plastic rotational capacity of prestressed hollow core panels[J]. WIT Transactions on The Built Environment, 2025, 19.
- Liu Y, et al. Full-Scale Test of Long-Span Cast-in-Situ Hollow Core Slabs: Cracking Behavior and Load-Carrying Capacity. Journal of Bridge Engineering, 2021, 26(8) : 04021053.
- Prakashan L V, George J, Edayadiyil J B, et al. Experimental study on the flexural behavior of hollow core concrete slabs[J]. Applied Mechanics and Materials, 2017, 857: 107-112.. [CrossRef]
- Ahmed S M, Avudaiappan S, Sheet I S, et al. Prediction of longitudinal shear resistance of steel-concrete composite slabs[J]. Engineering structures, 2019, 193: 295-300. [CrossRef]
- Aghdam P P, Parent S, Dinehart D W, et al. Investigation of the degree of composite action in composite beams with precast concrete hollow core slabs[C]//Structures. Elsevier, 2025, 76: 108882.
- Meng X. Shear strengthening of prestressed hollow core slabs using externally bonded carbon fiber reinforced polymer sheets[D]. University of Windsor (Canada), 2016. [CrossRef]
- Jin J, Hu W, Zheng F, et al. Experimental and Numerical Studies on the Mechanical Behavior of a Novel Bidirectional, Prestressed, Prefabricated, Composite Hollow-Core Slab[J]. Buildings, 2025, 15(2): 232. [CrossRef]
- Pinheiro G, Moreno Júnior A, Schultz A, et al. Shear behavior of prestressed hollow core one-way slabs with openings: Experimental, numerical, and standard formulation verification[J]. Buildings, 2023, 13(7): 1857. [CrossRef]
- Li X, Wu G, Popal M S, et al. Experimental and numerical study of hollow core slabs strengthened with mounted steel bars and prestressed steel wire ropes[J]. Construction and Building Materials, 2018, 188: 456-469. [CrossRef]
- Barbieri D M, Chen Y, Mazzarolo E, et al. Longitudinal joint performance of a concrete hollow core slab bridge[J]. Transportation Research Record, 2018, 2672(41): 196-206. [CrossRef]
- Safar A, Lou K B. A study of the action of the beam and beamless (flush) floor slabs of the multistorey buildings[J]. Erciyes Üniversitesi Fen Bilimleri Enstitüsü Fen Bilimleri Dergisi, 2007, 23(1): 127-135.
- Gong L, Chen Z, Feng Y, et al. Experimental Study on an Innovative Hollow Concrete Floor System Assembled with Precast Panels and Self-Thermal-Insulation Infills[J]. Advances in Civil Engineering, 2021, 2021(1): 6663412. [CrossRef]
- JGJ/T 268-2012; Echnical Specification for Cast-in-situ Concrete Hollow Floor Structure. China Architecture & Building Press: Beijing, China, 2012.
- GB/T 50152-2012; Standard for Test Method of Concrete Structures. China Architecture & Building Press: Beijing, China, 2012.
Figure 1.
Schematic Diagram of the Box-shaped Core Mold and Its Layout in the Hollow Floor Slab. (a) Architectural rendering; (b) Floor slab layout; (c) Core Mold Schematic Diagram.
Figure 1.
Schematic Diagram of the Box-shaped Core Mold and Its Layout in the Hollow Floor Slab. (a) Architectural rendering; (b) Floor slab layout; (c) Core Mold Schematic Diagram.
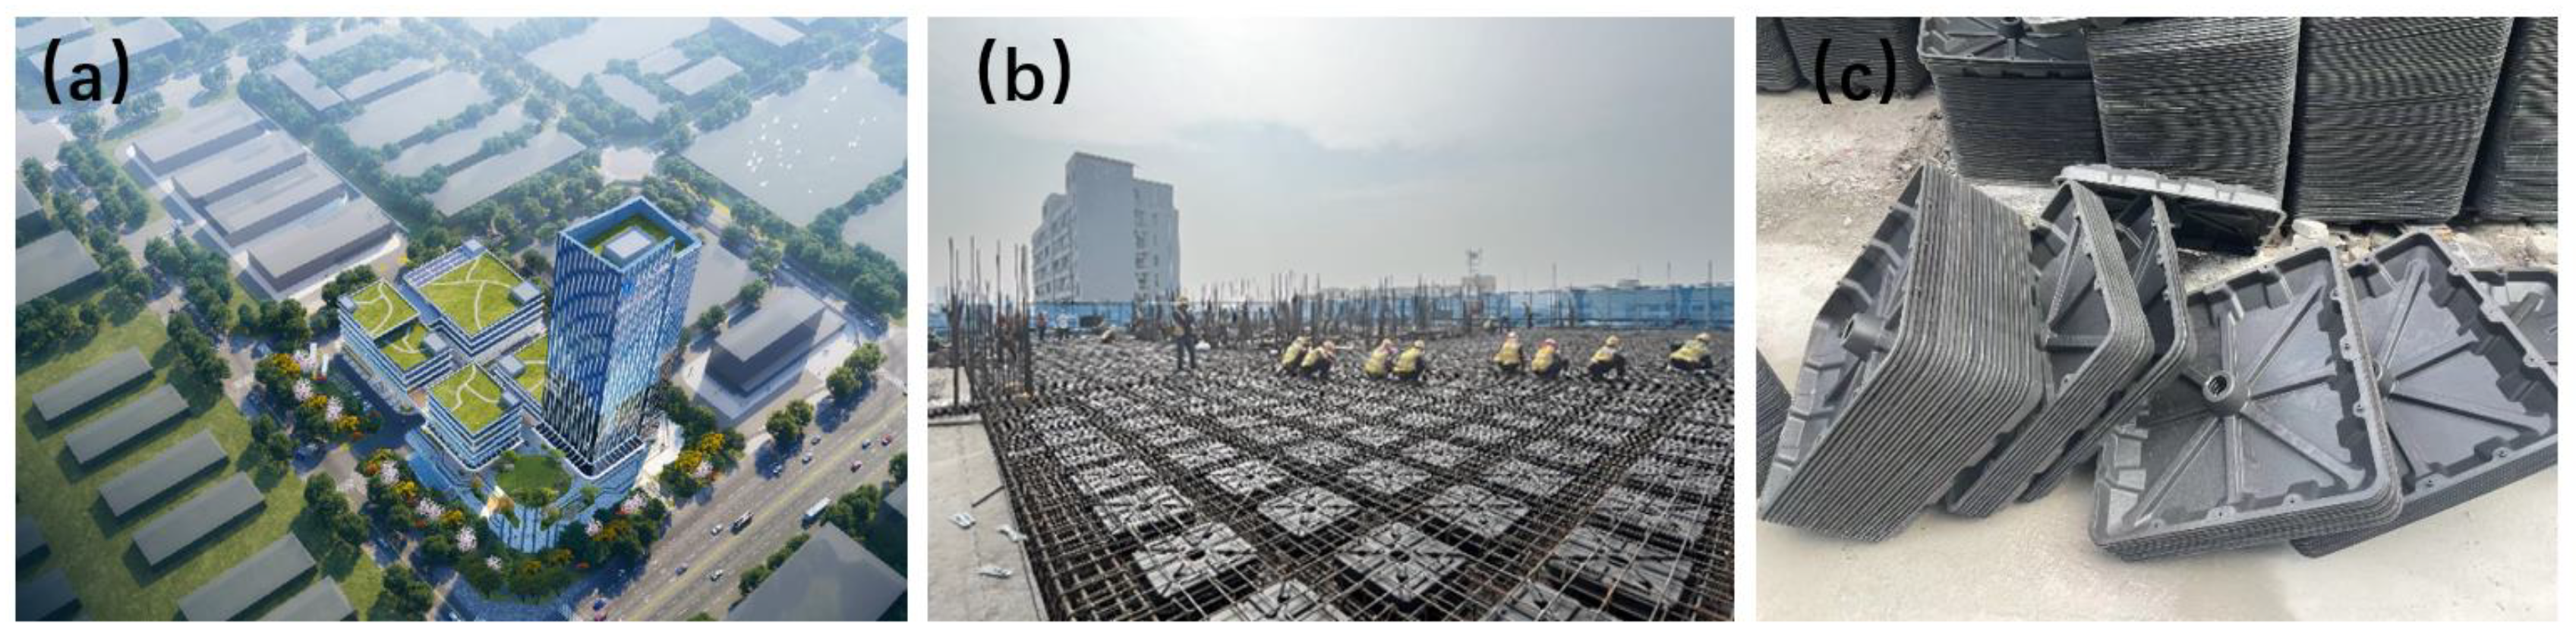
Figure 2.
Detailed structural arrangement of the hollow core slab. (a) Plan view schematic; (b) Sectional reinforcement detail drawing.
Figure 2.
Detailed structural arrangement of the hollow core slab. (a) Plan view schematic; (b) Sectional reinforcement detail drawing.
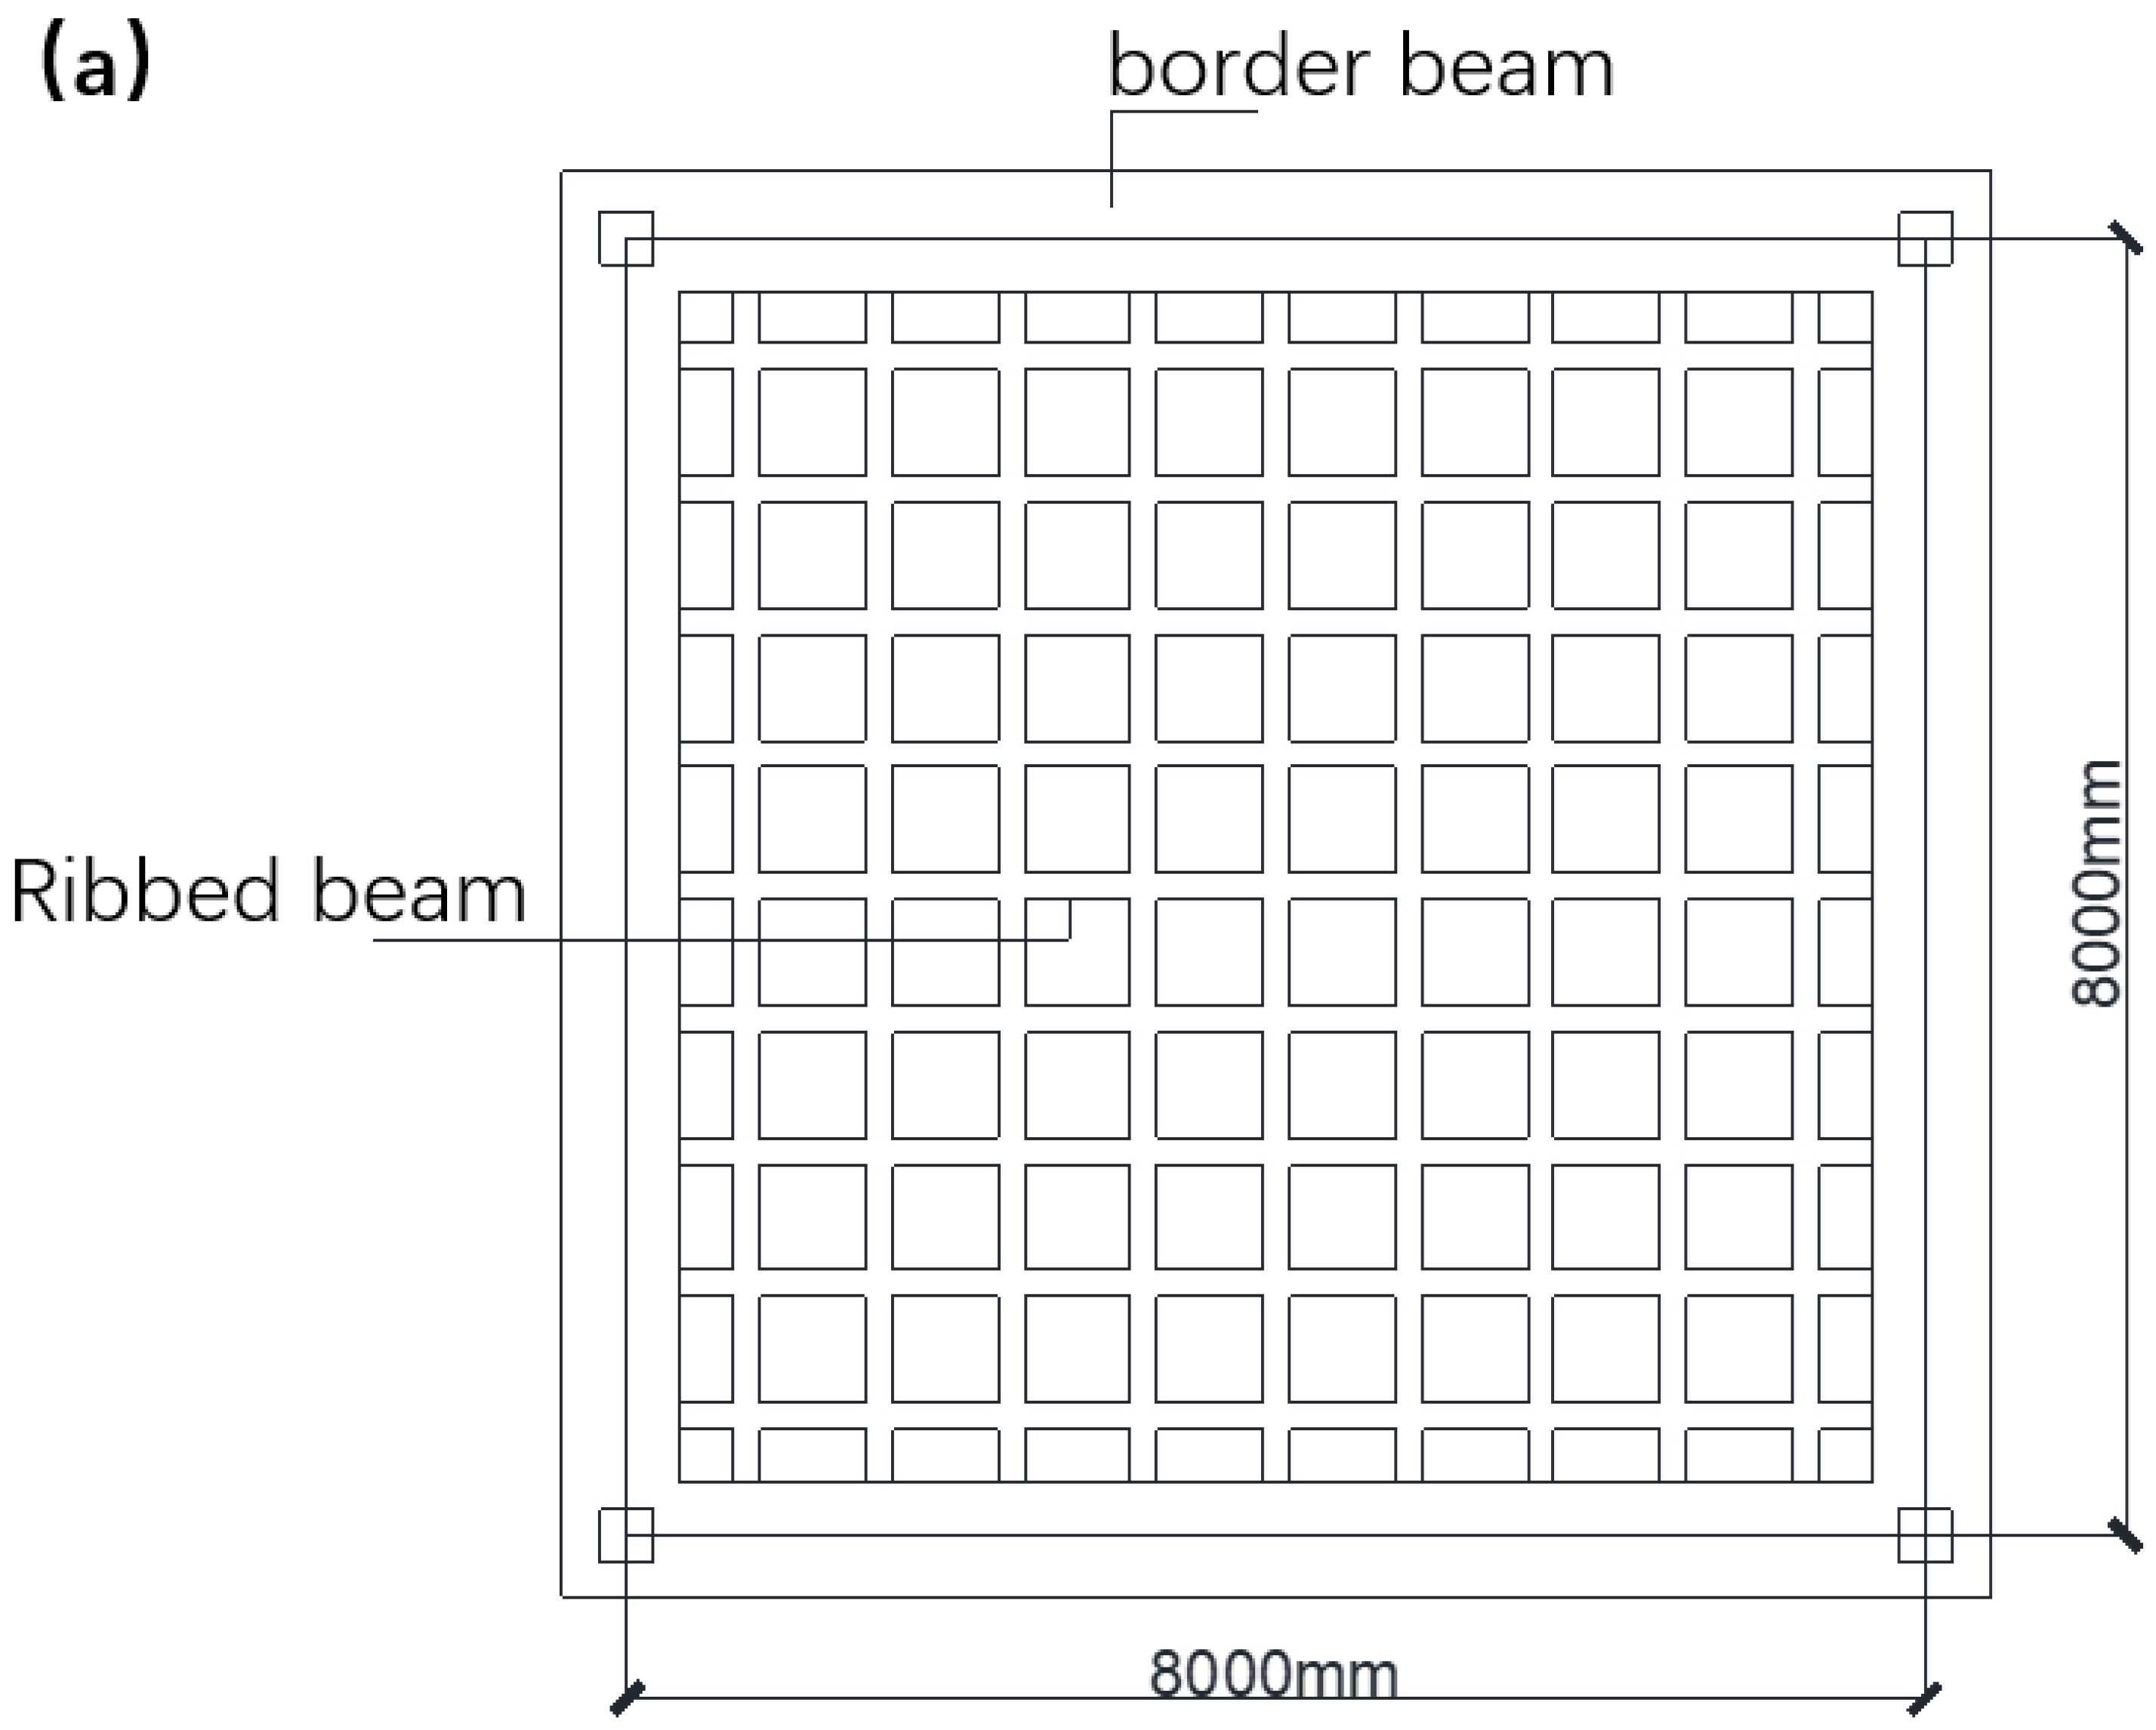
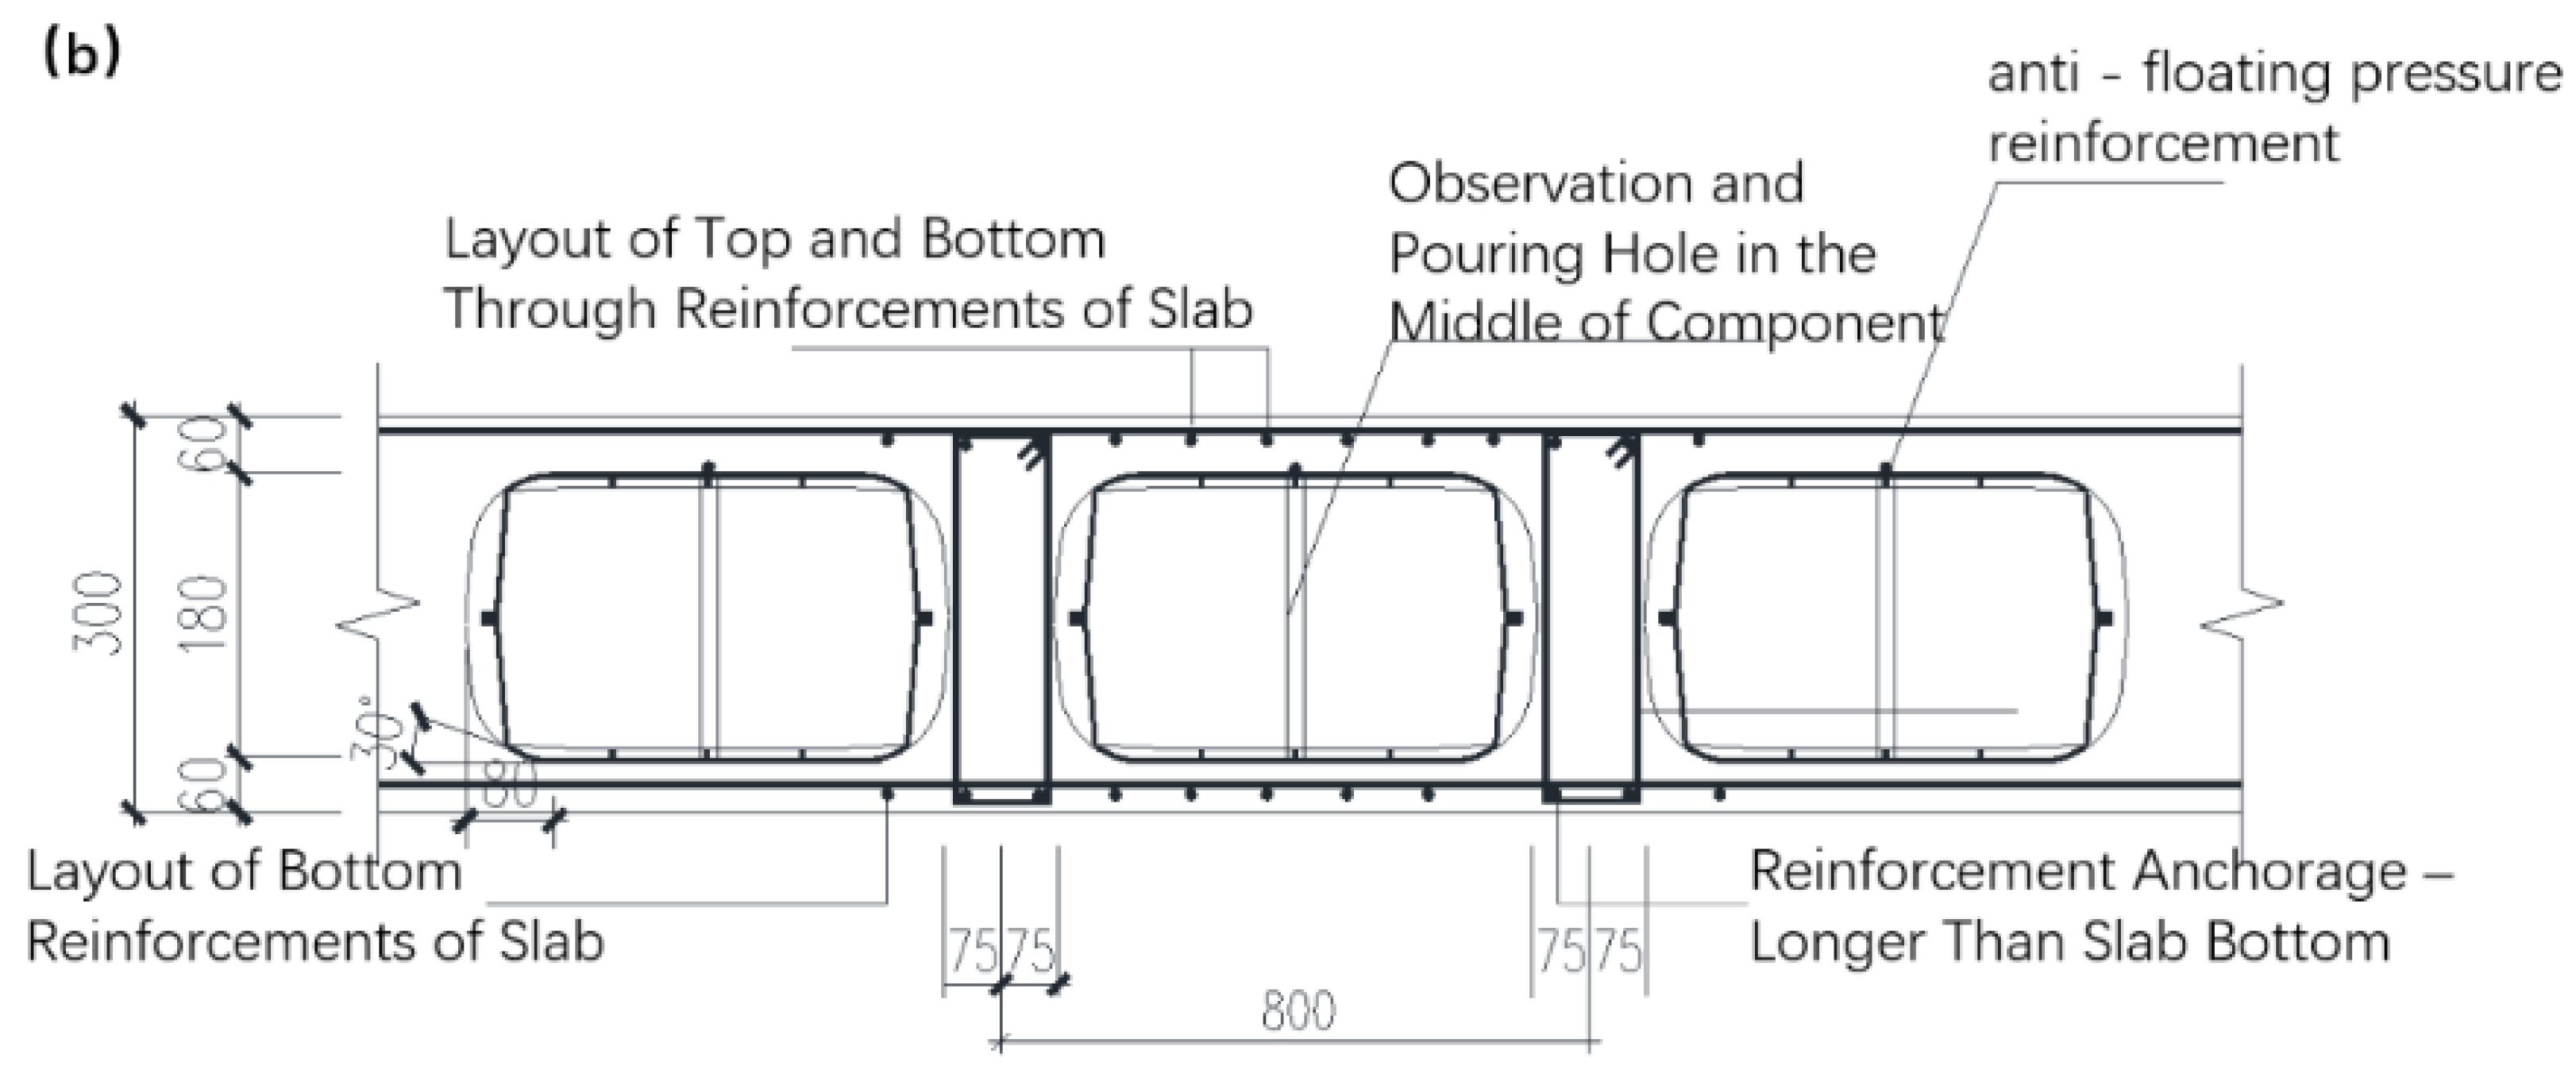
Figure 3.
Photographs of test instrumentation. (a) Concrete strain gauge; (b) Concrete strain gauge; (c) Reinforcement strain gauge; (d) Crack comparator.
Figure 3.
Photographs of test instrumentation. (a) Concrete strain gauge; (b) Concrete strain gauge; (c) Reinforcement strain gauge; (d) Crack comparator.
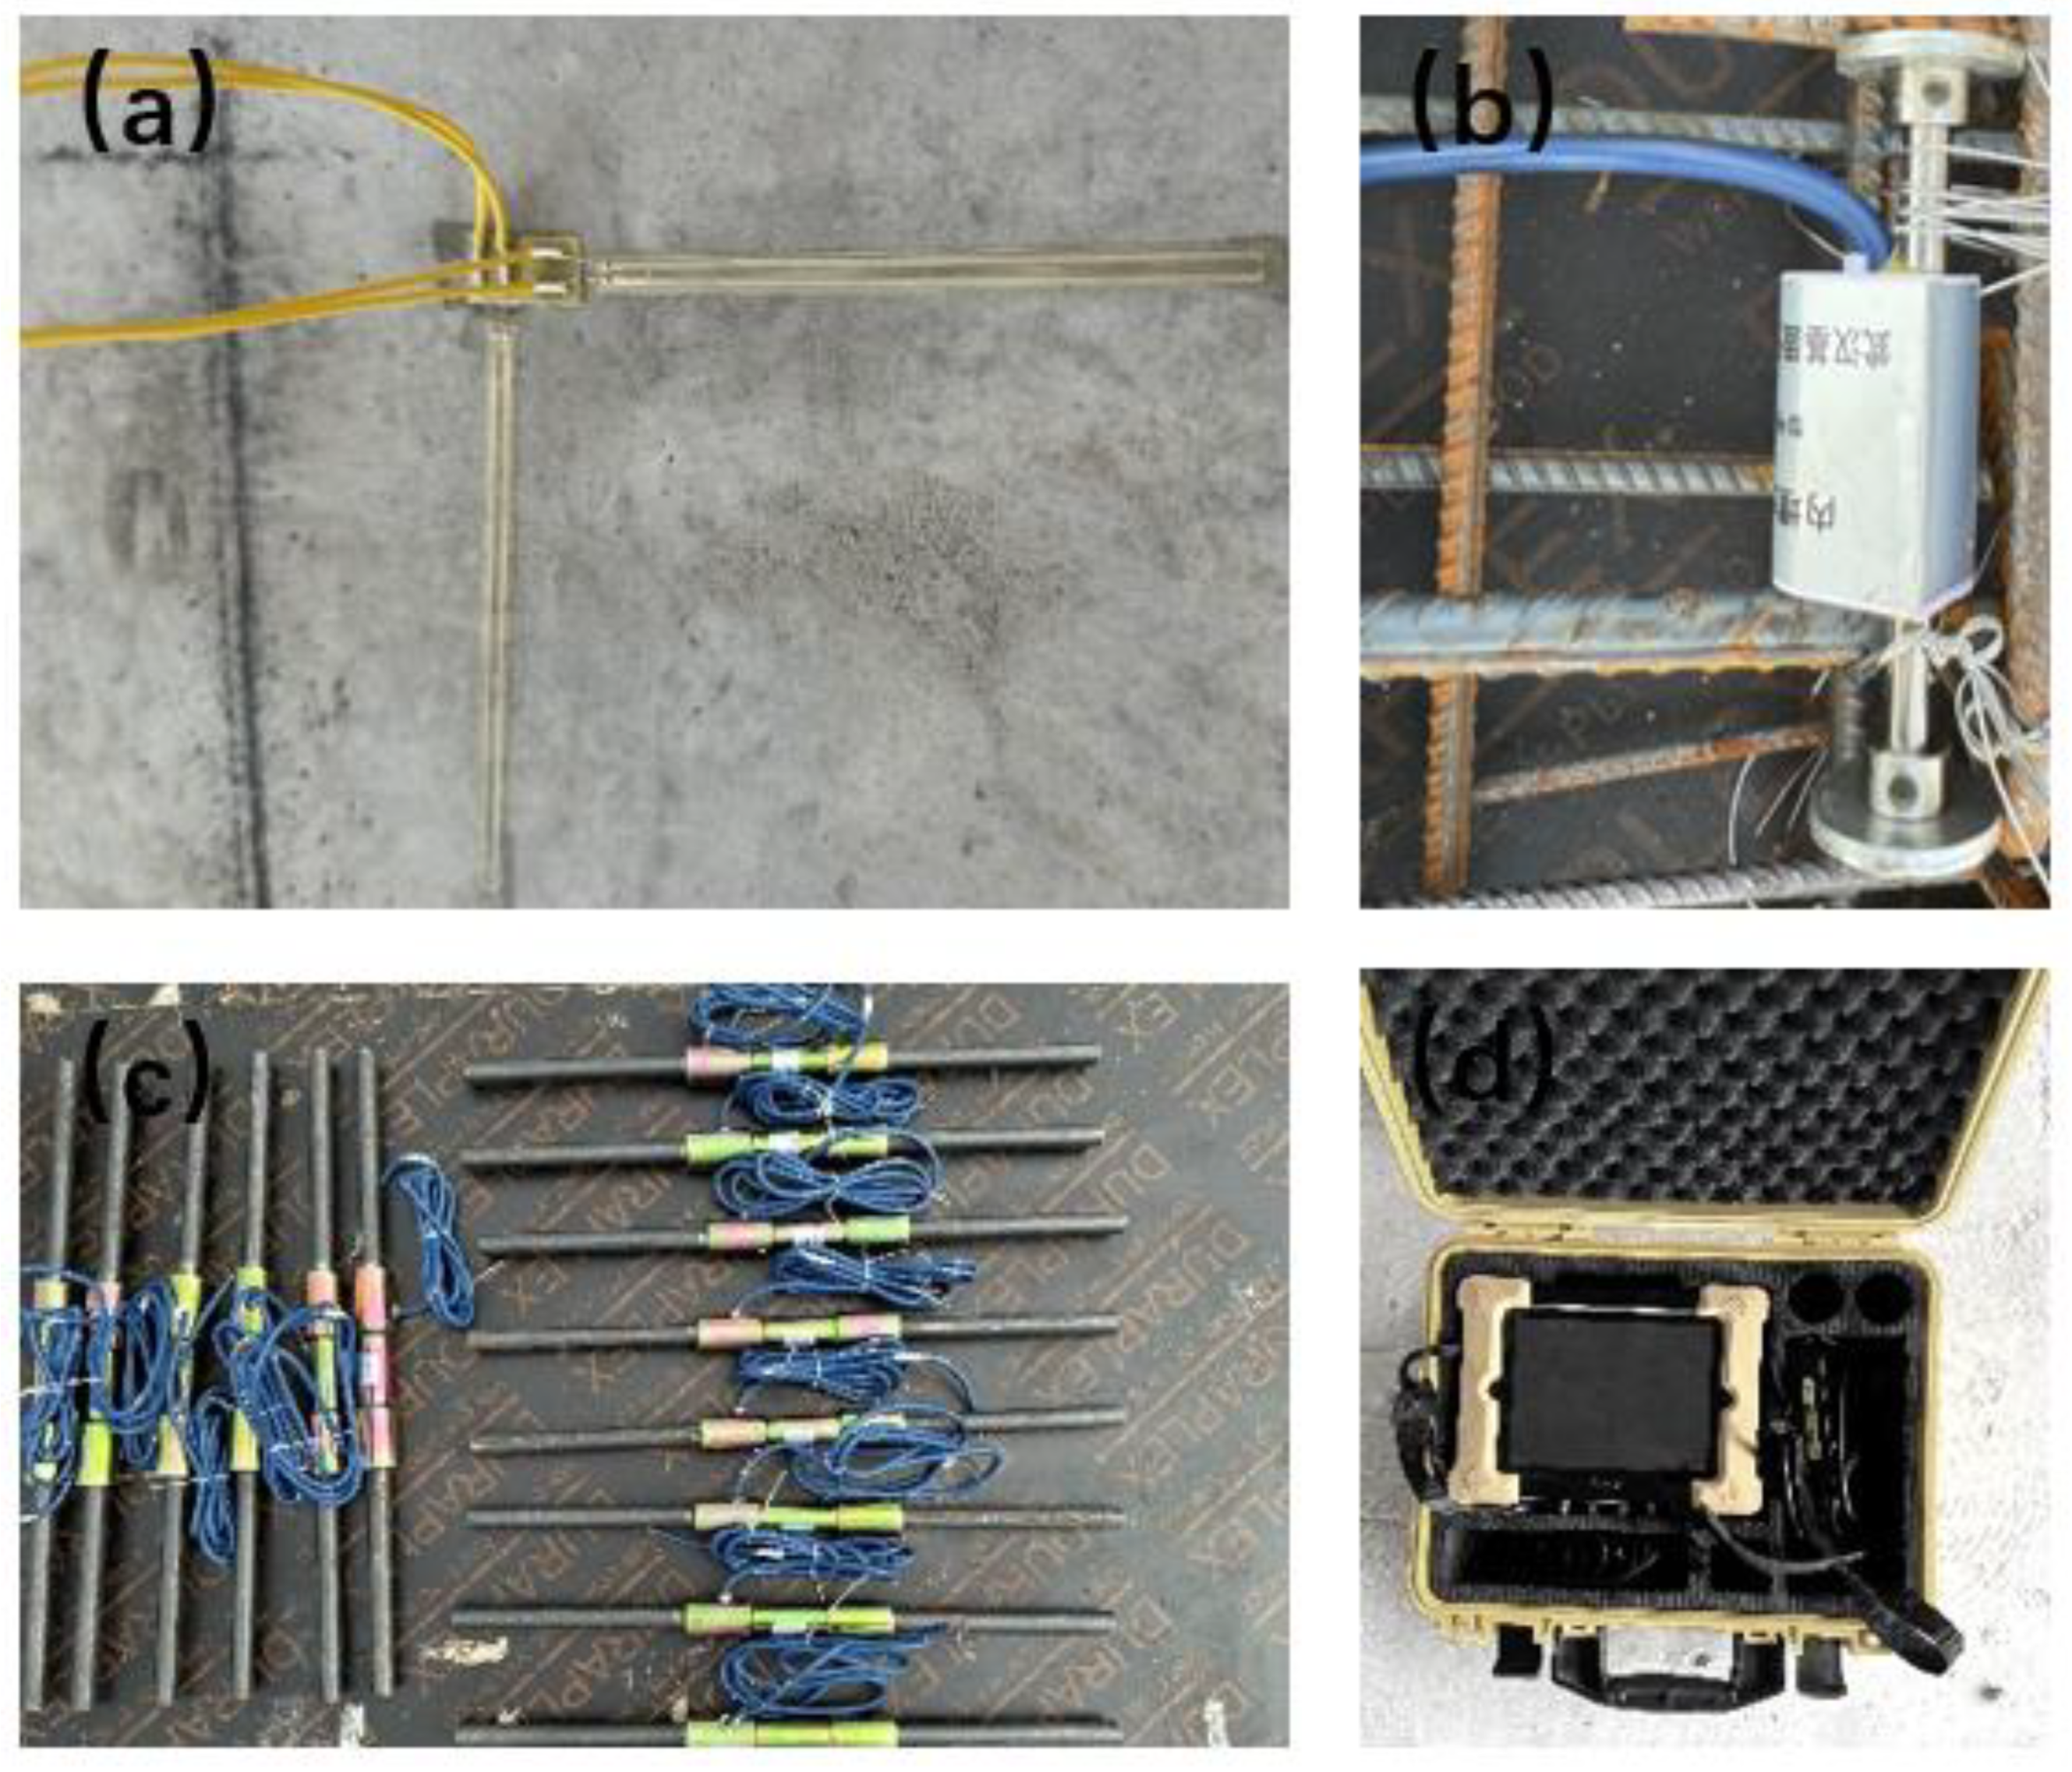
Figure 4.
Schematic layout of strain monitoring points. (a) Arrangement of rebar stress gauges and concrete strain gauges; (b) Locations of concrete surface strain gauges on the bottom slab.
Figure 4.
Schematic layout of strain monitoring points. (a) Arrangement of rebar stress gauges and concrete strain gauges; (b) Locations of concrete surface strain gauges on the bottom slab.
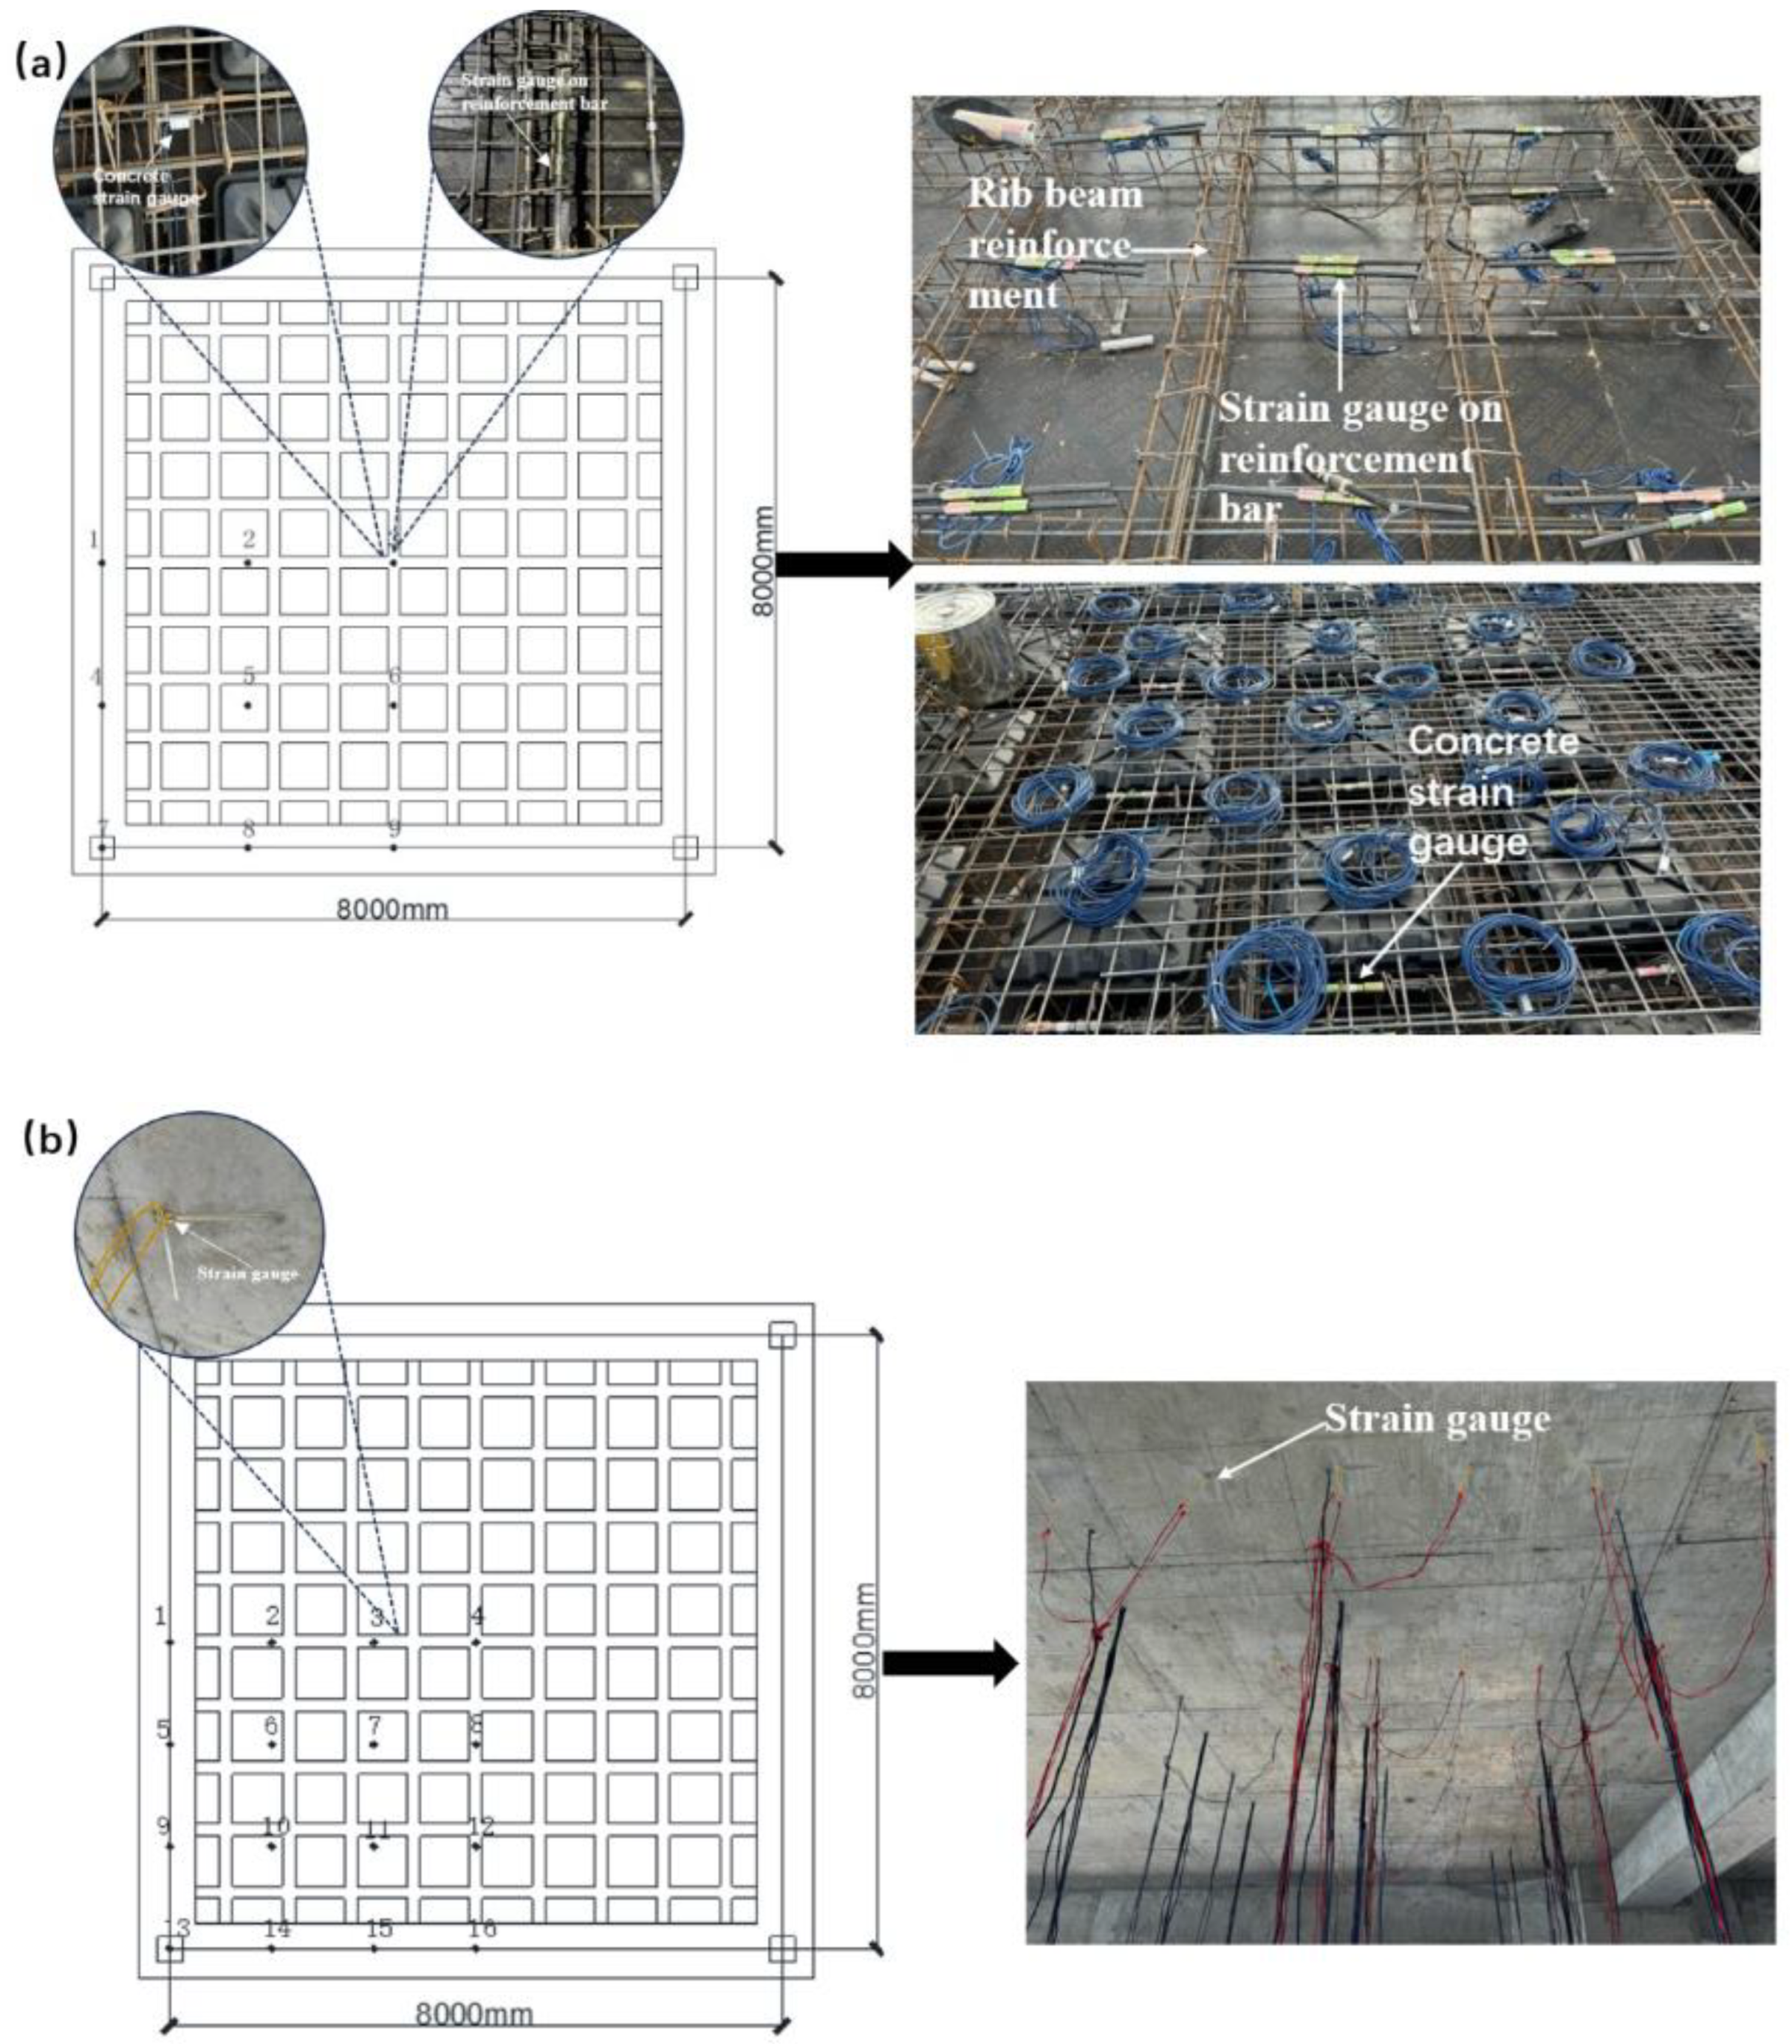
Figure 5.
Field Loading Test Setup. (a) Plan Layout of the Water Tank Loading System; (b) Schematic of the Staged Loading System.
Figure 5.
Field Loading Test Setup. (a) Plan Layout of the Water Tank Loading System; (b) Schematic of the Staged Loading System.
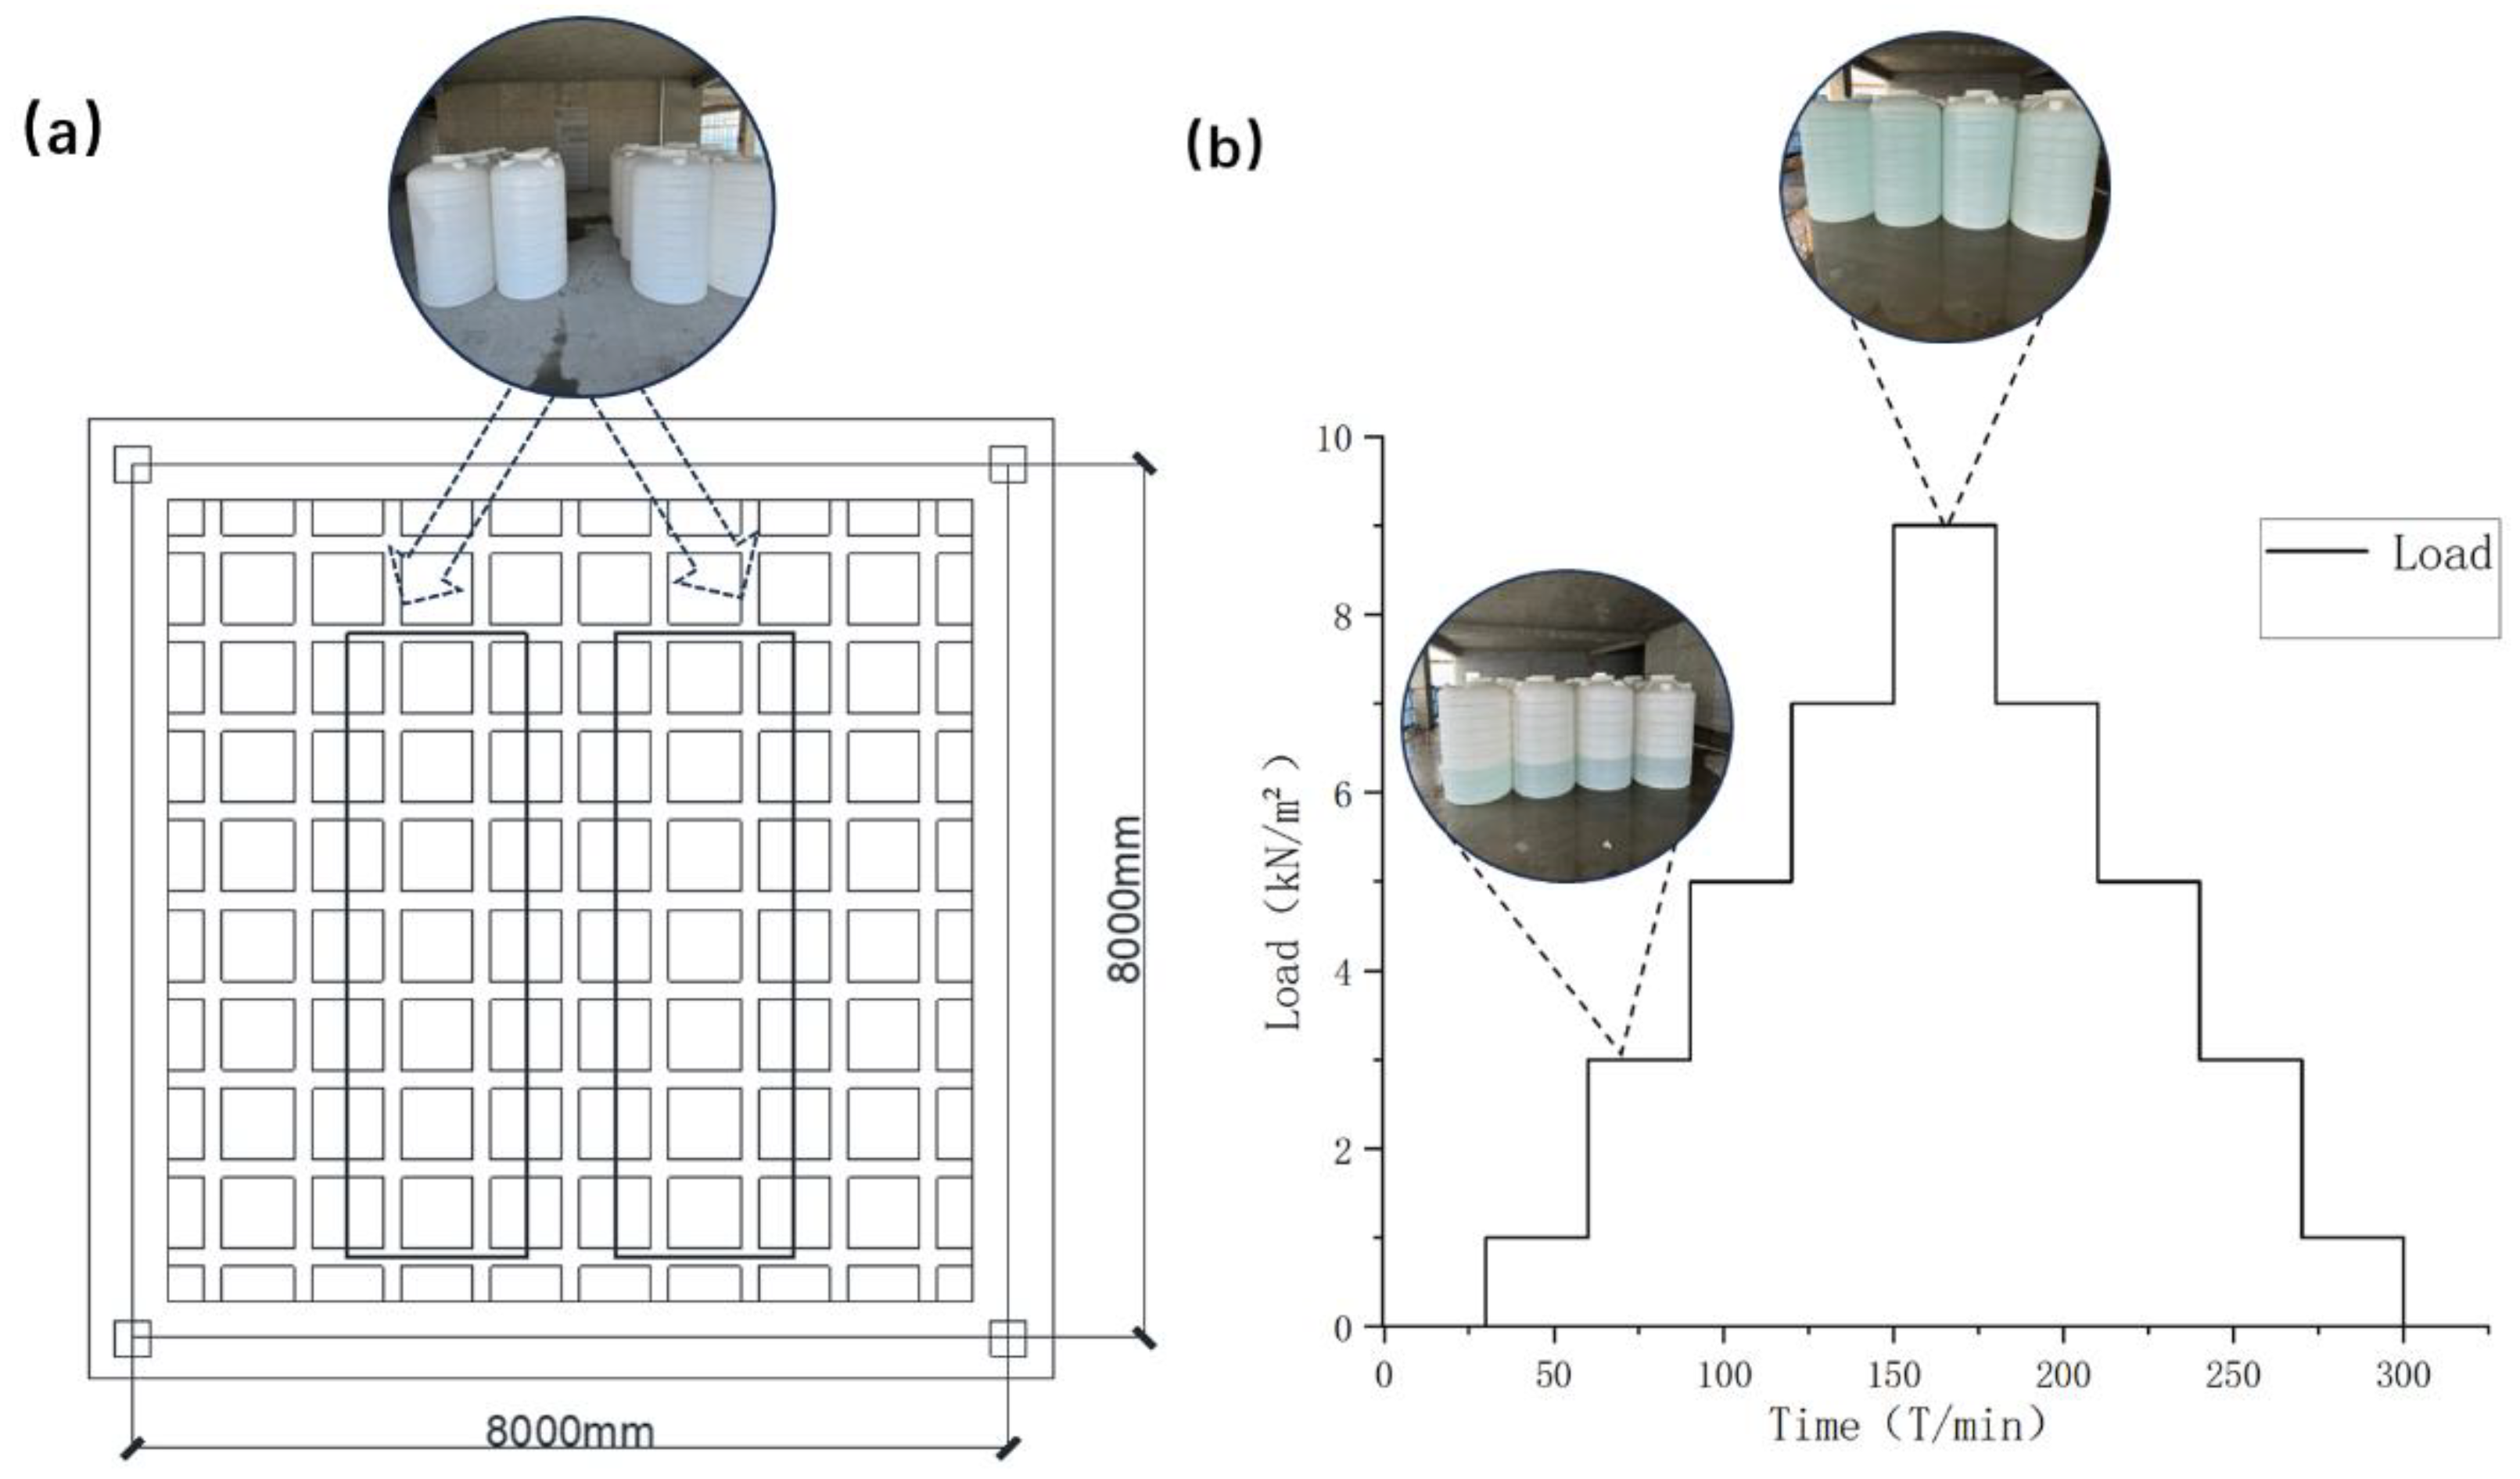
Figure 6.
Real-time Data Monitoring on Site. (a) Data Collection; (b) Crack Observation.
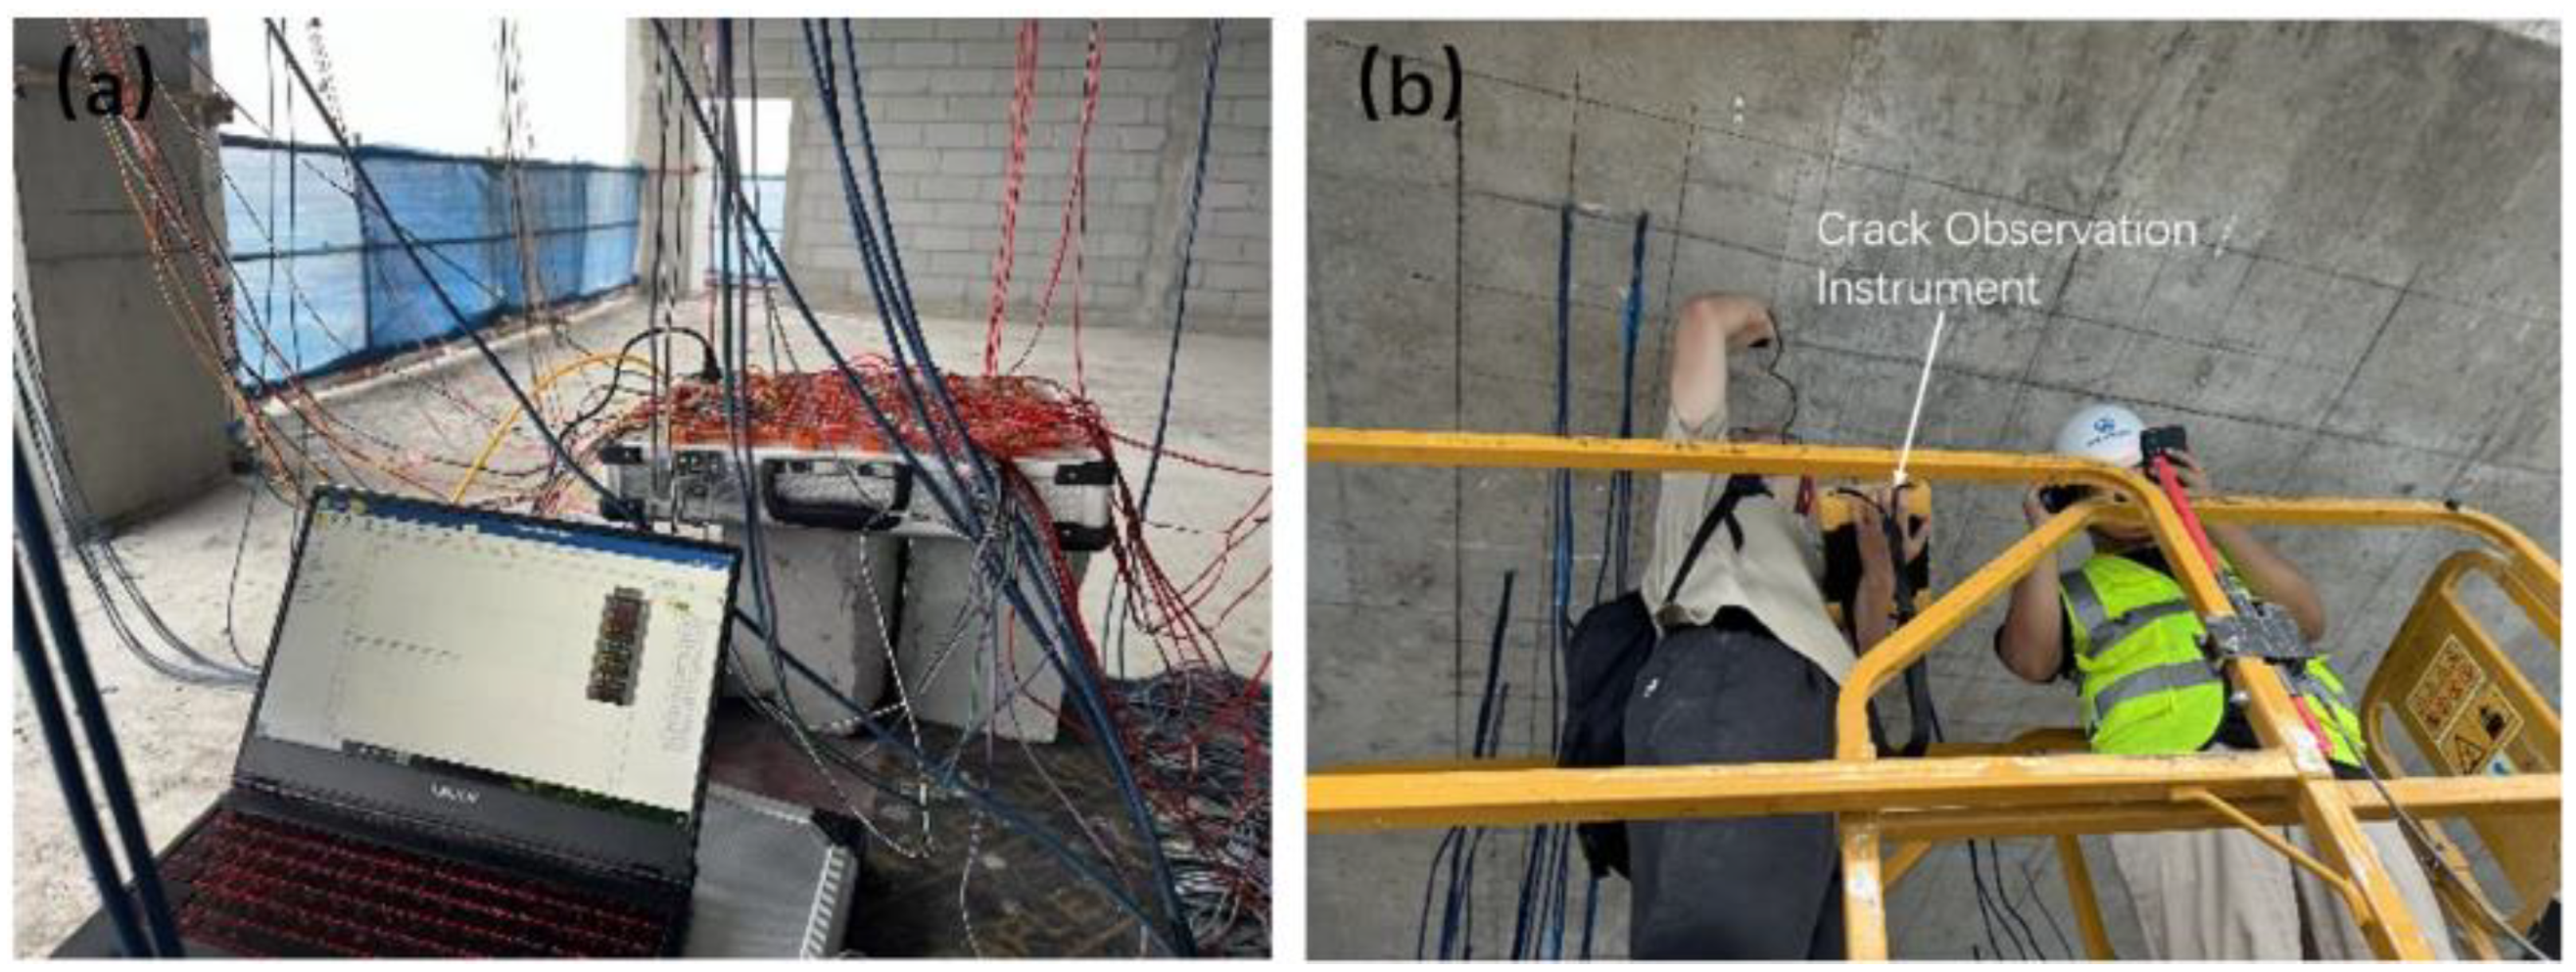
Figure 7.
Load-Strain Curve of the Rib Beam Reinforcement under Vertical Staged Loading.
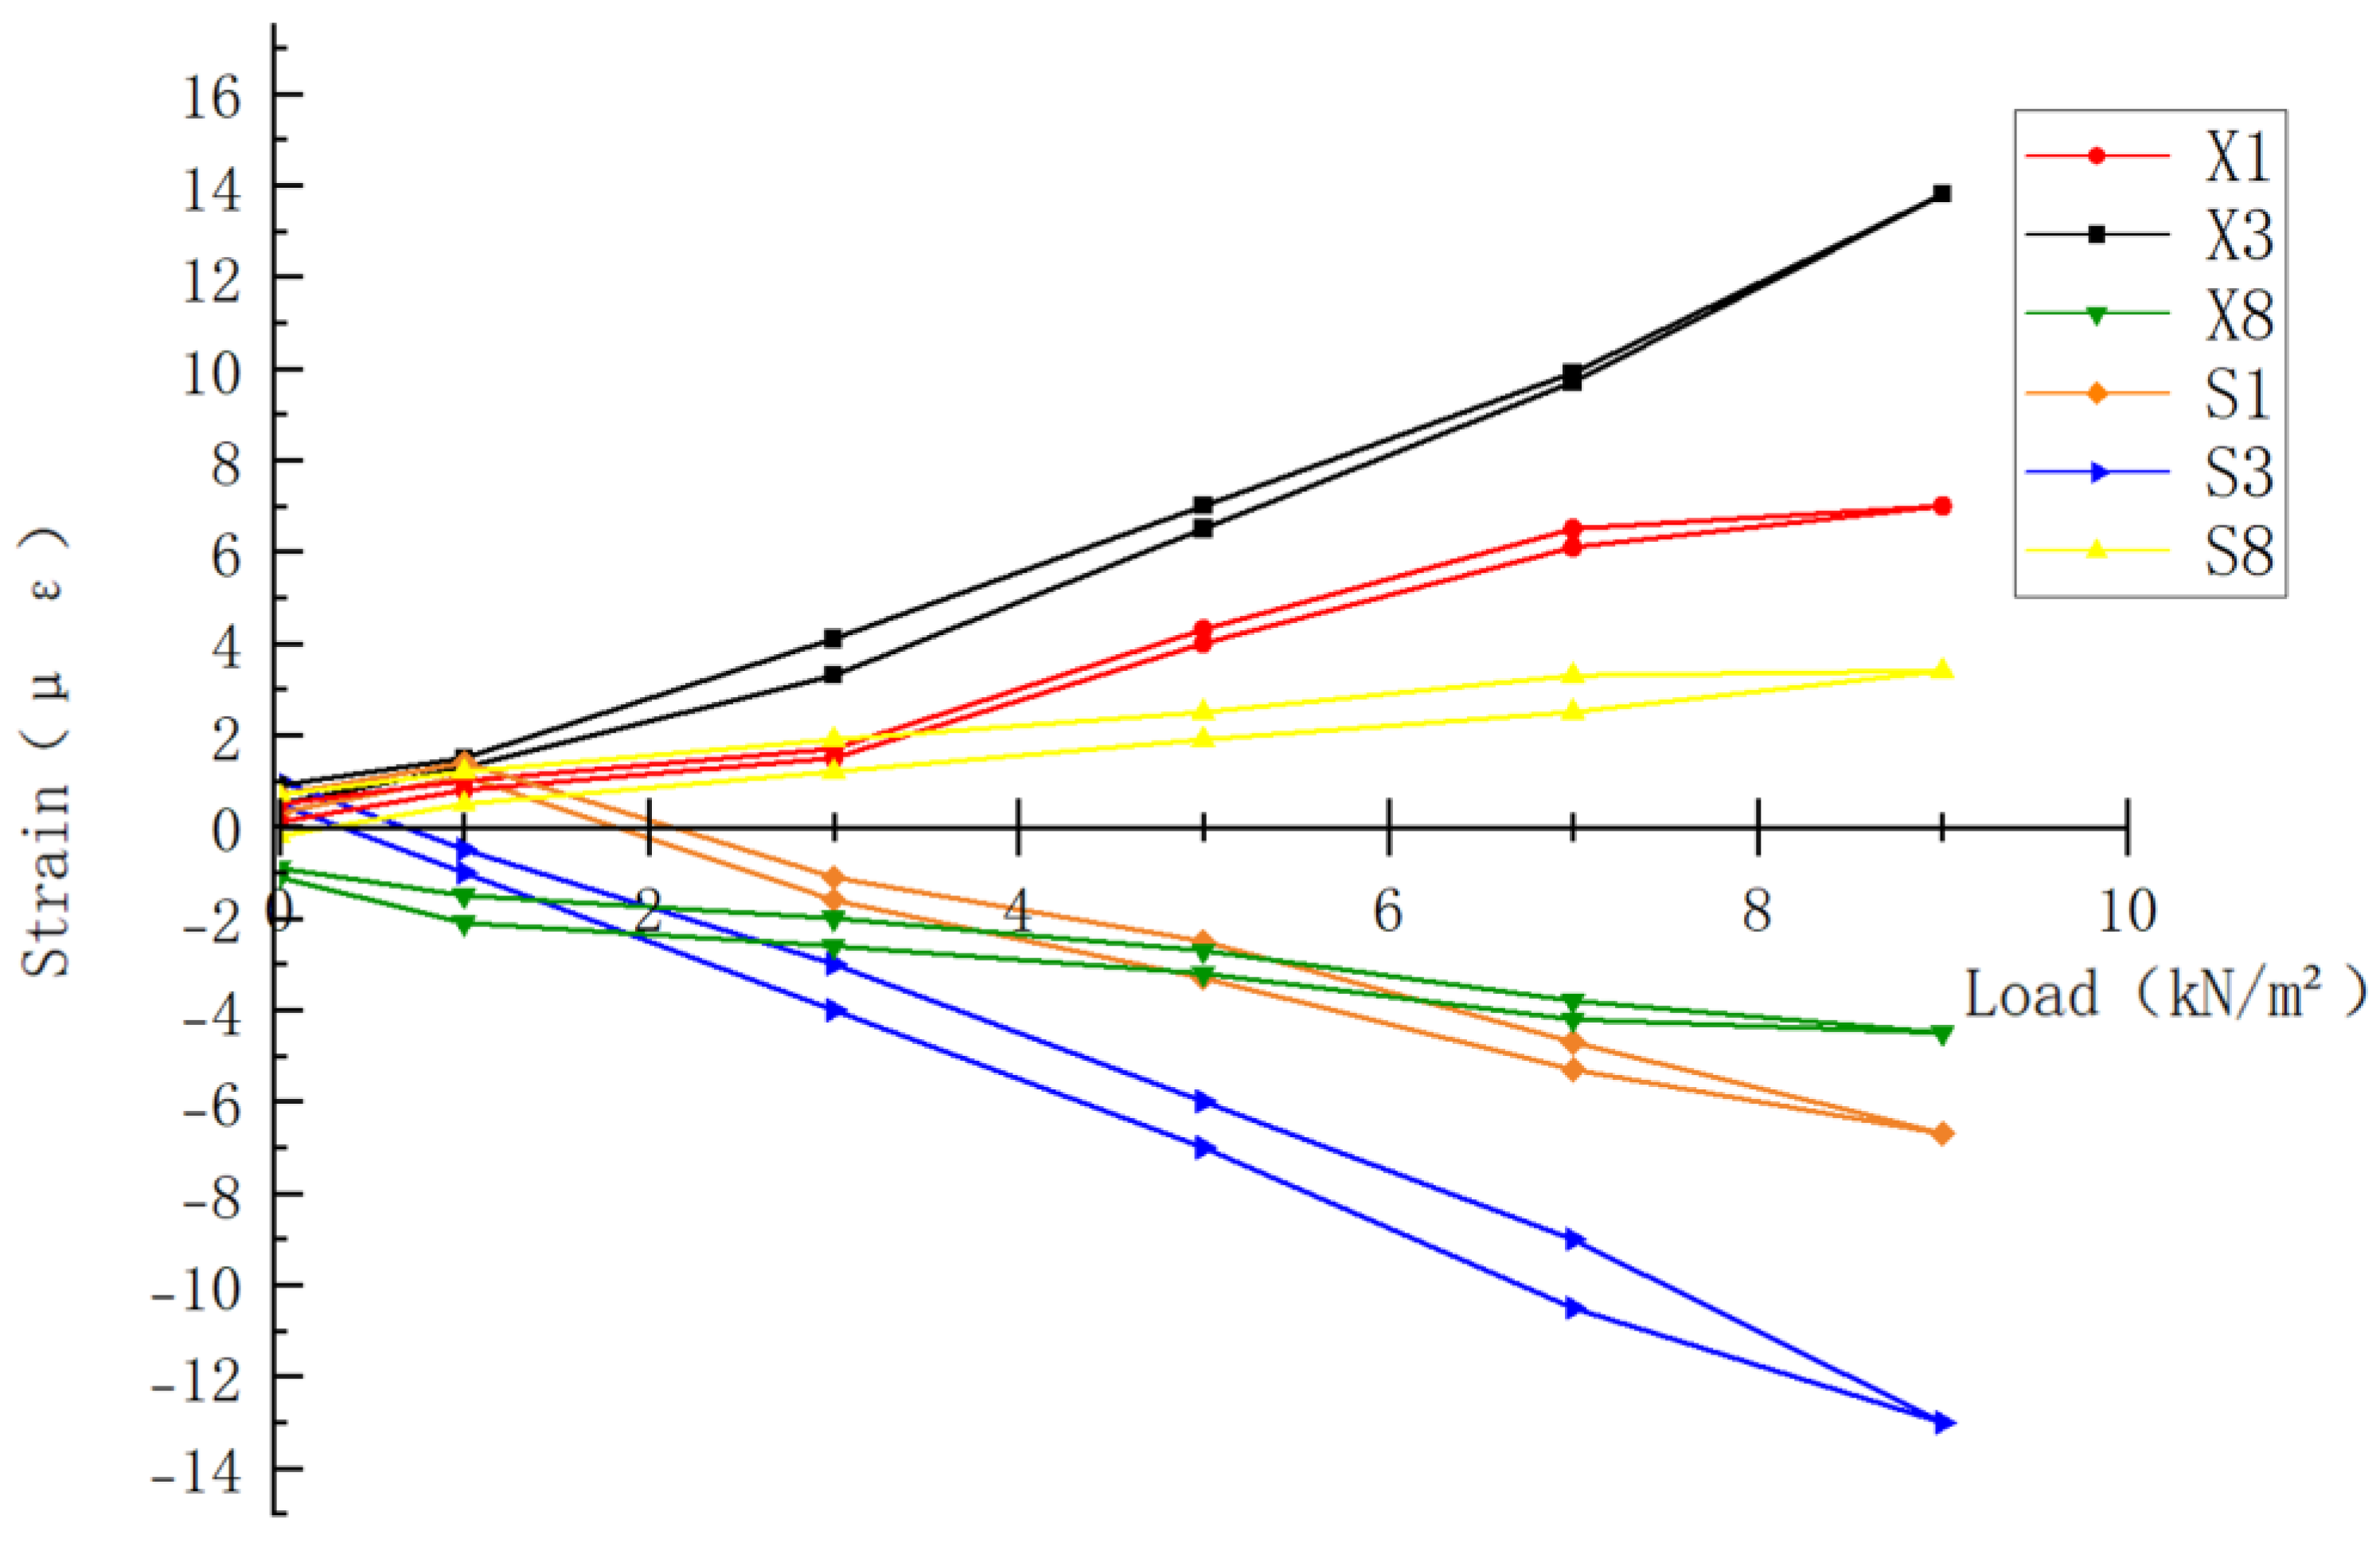
Figure 8.
Concrete Load-Strain Curve of the Bottom Slab under Vertical Staged Loading.
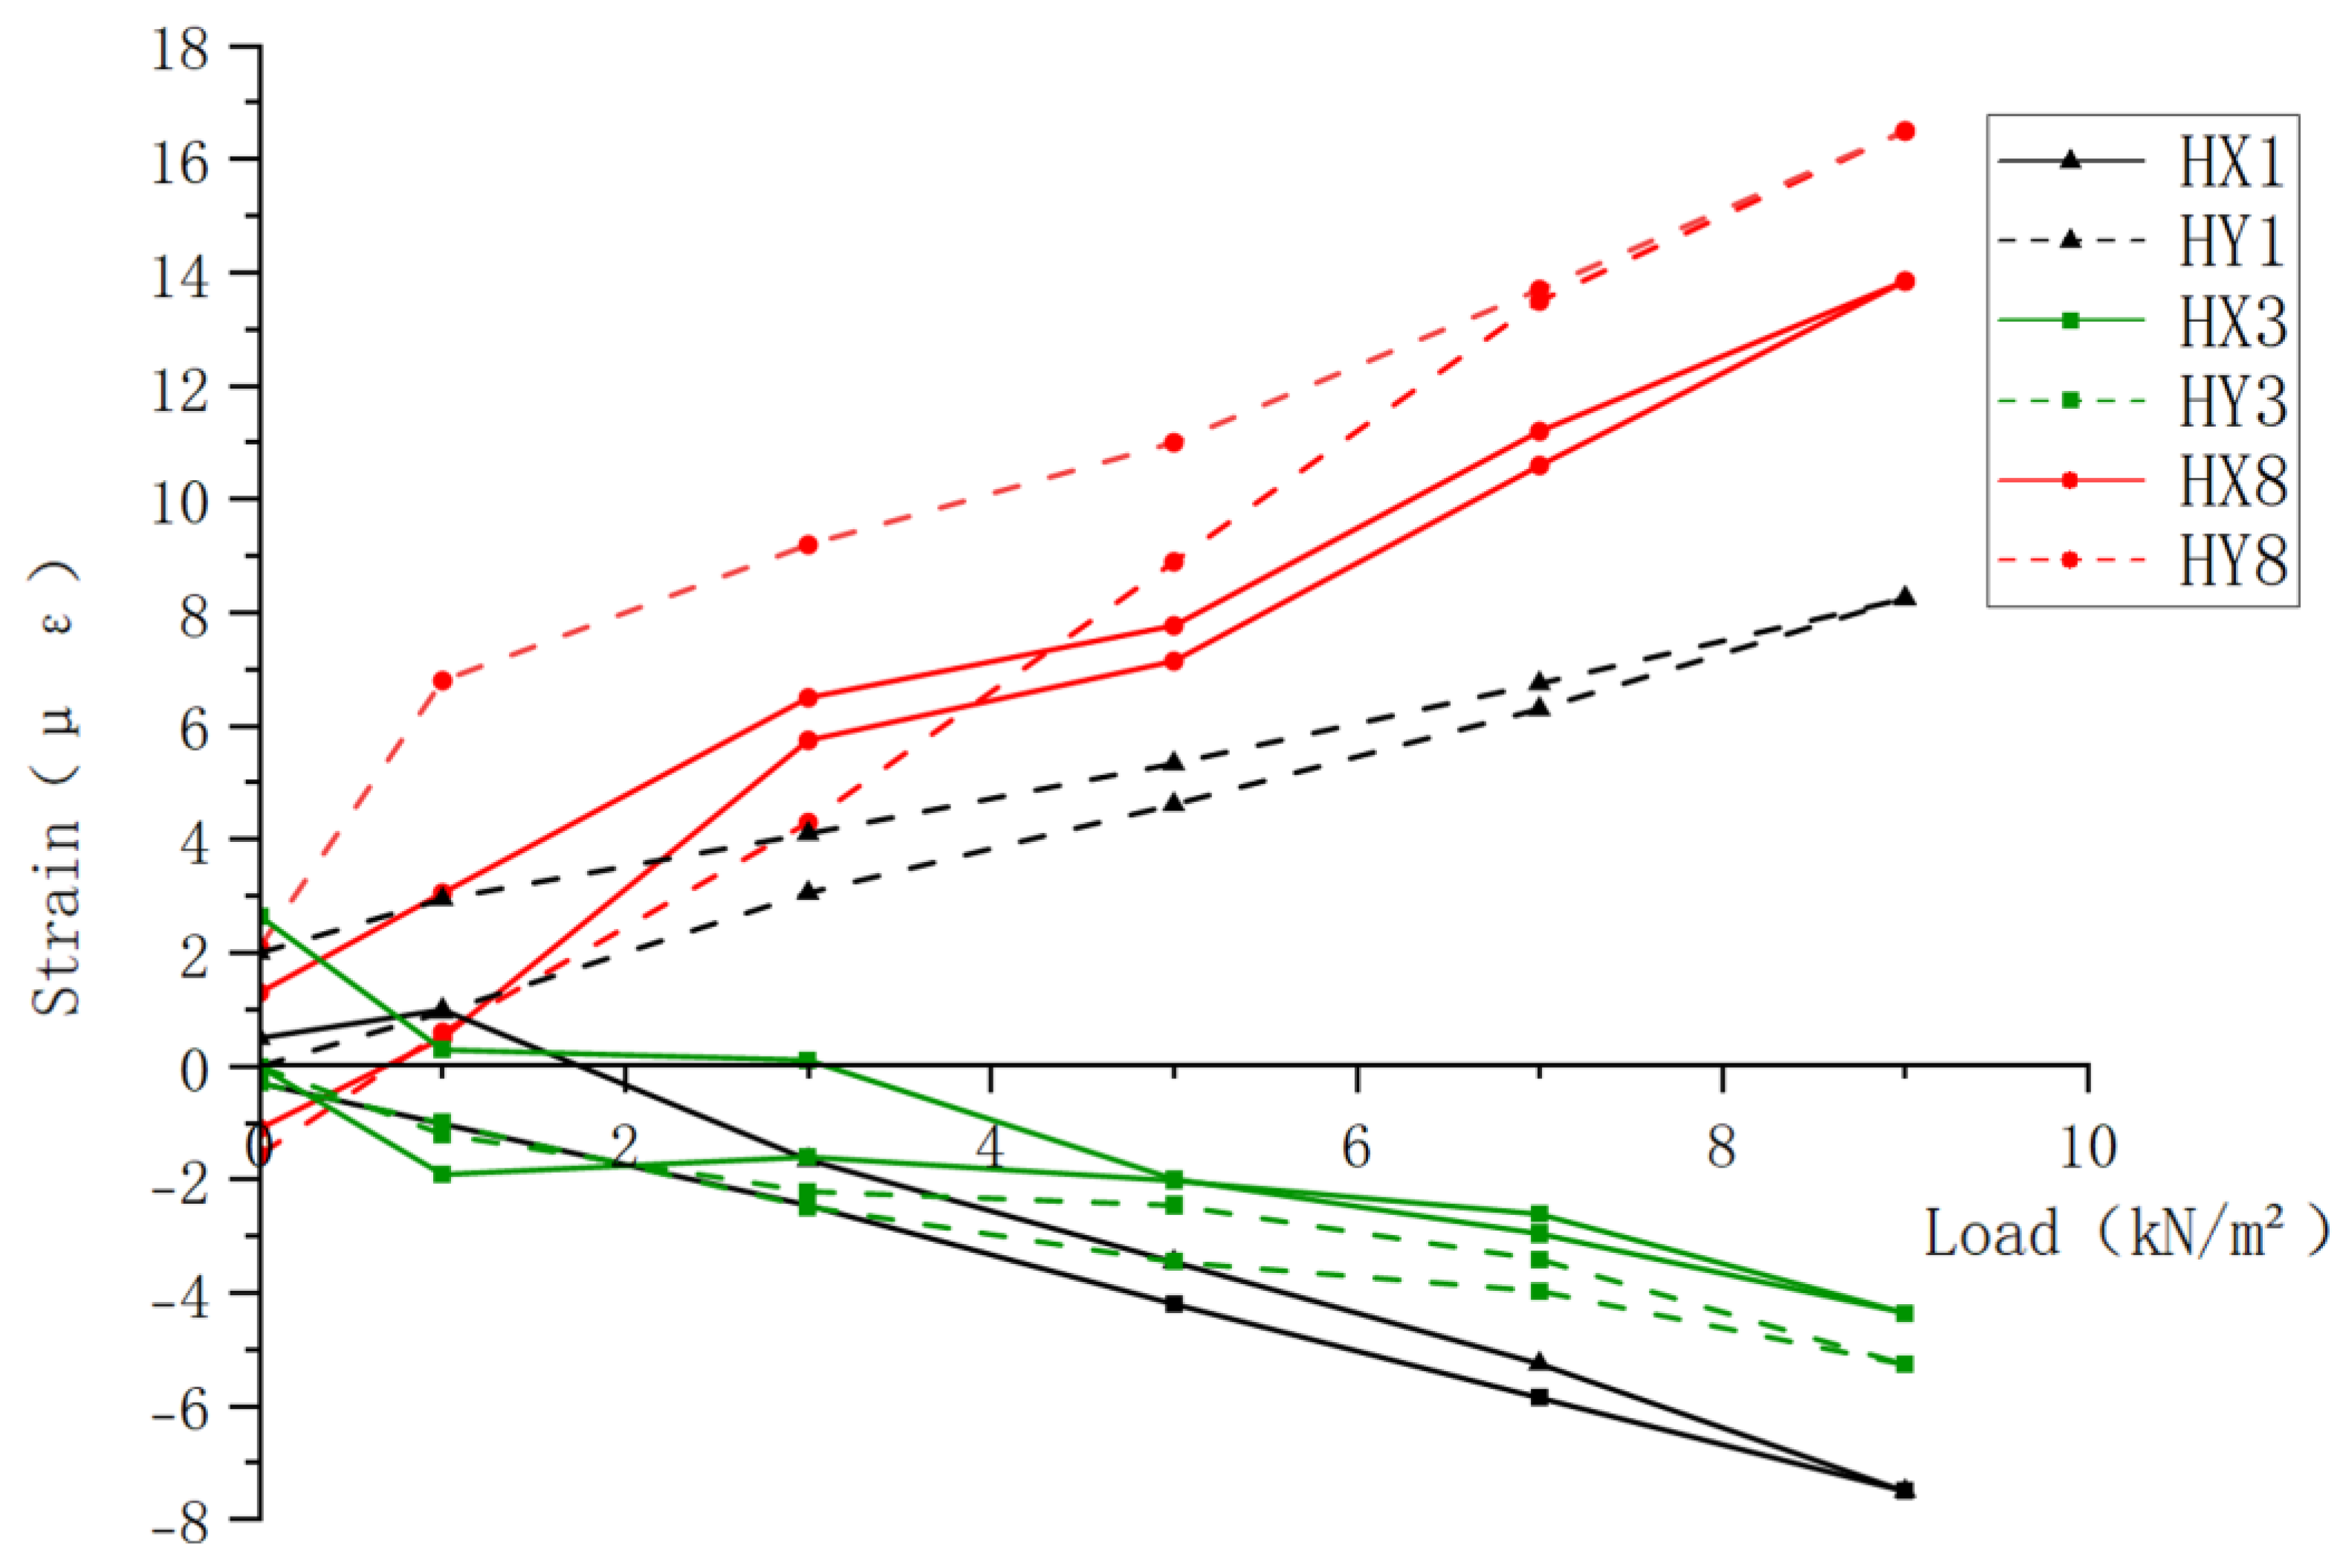
Figure 9.
Model Assembly Diagram.
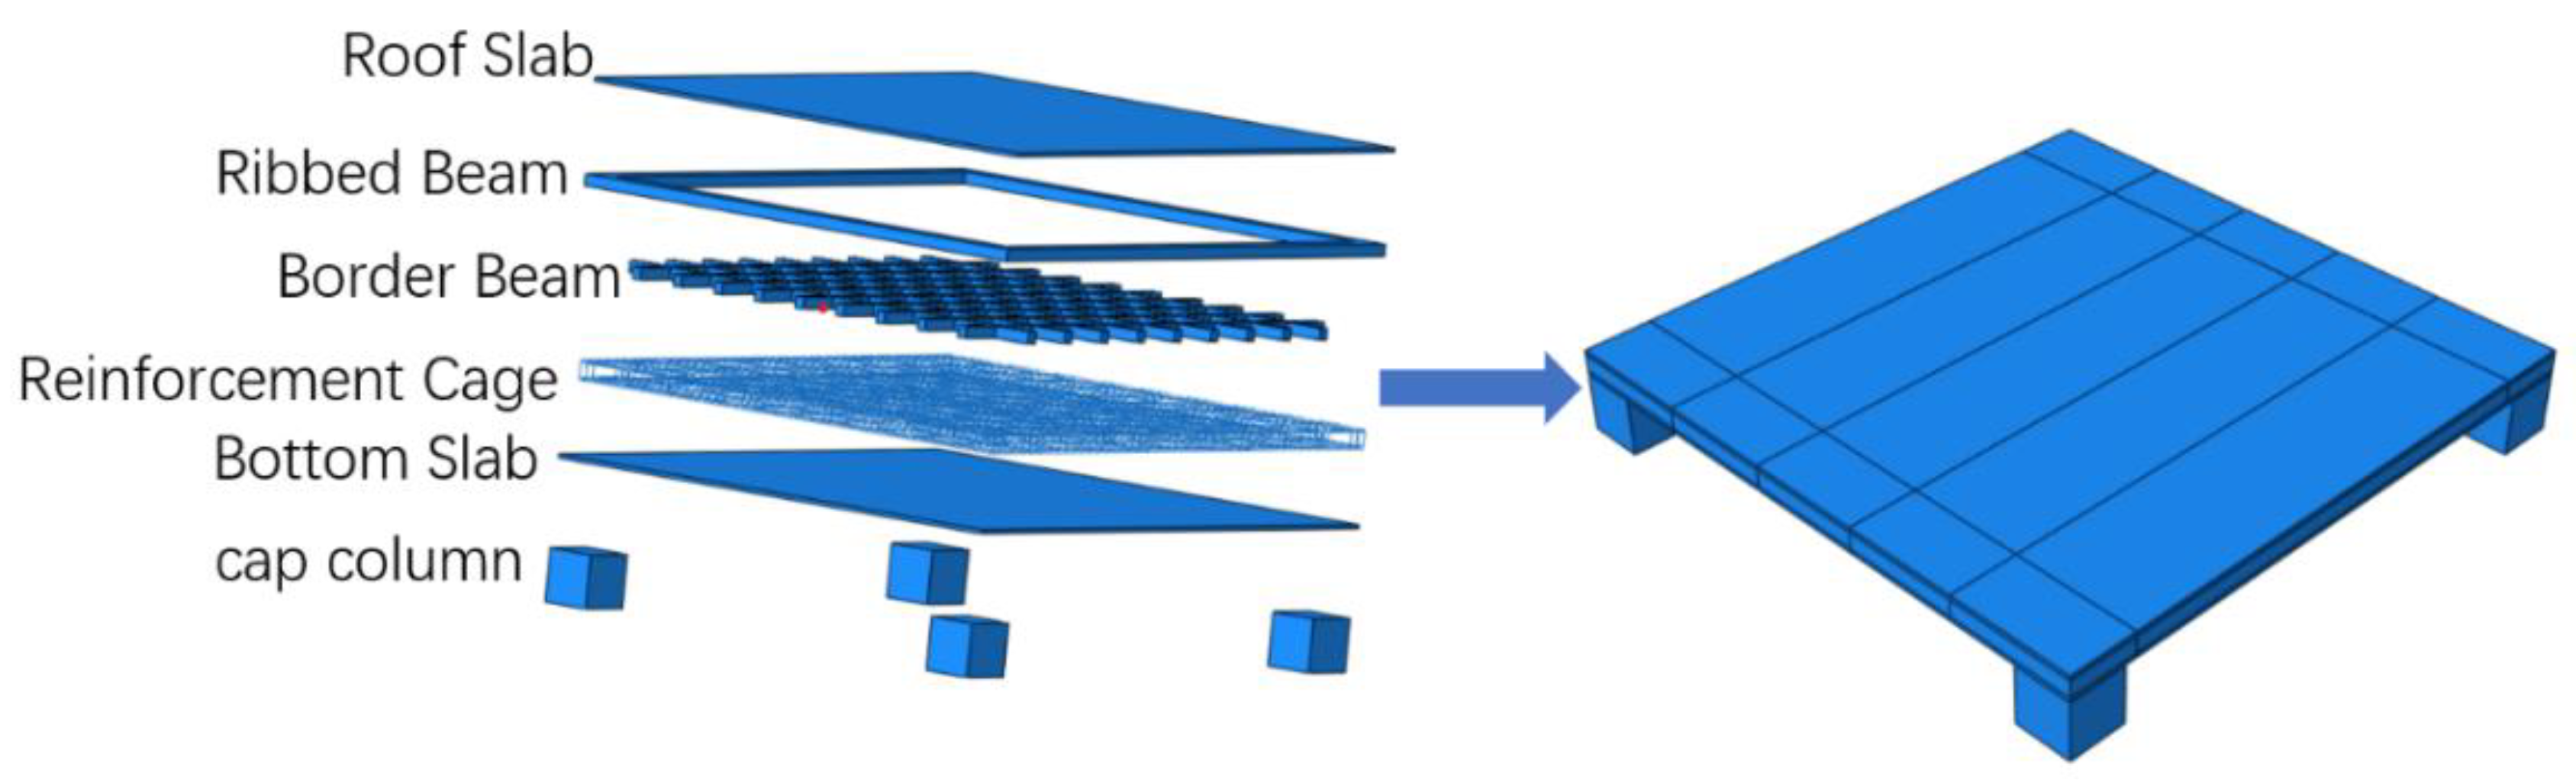
Figure 10.
Rebar Strain Cloud Diagram of the Hollow Floor Slab.
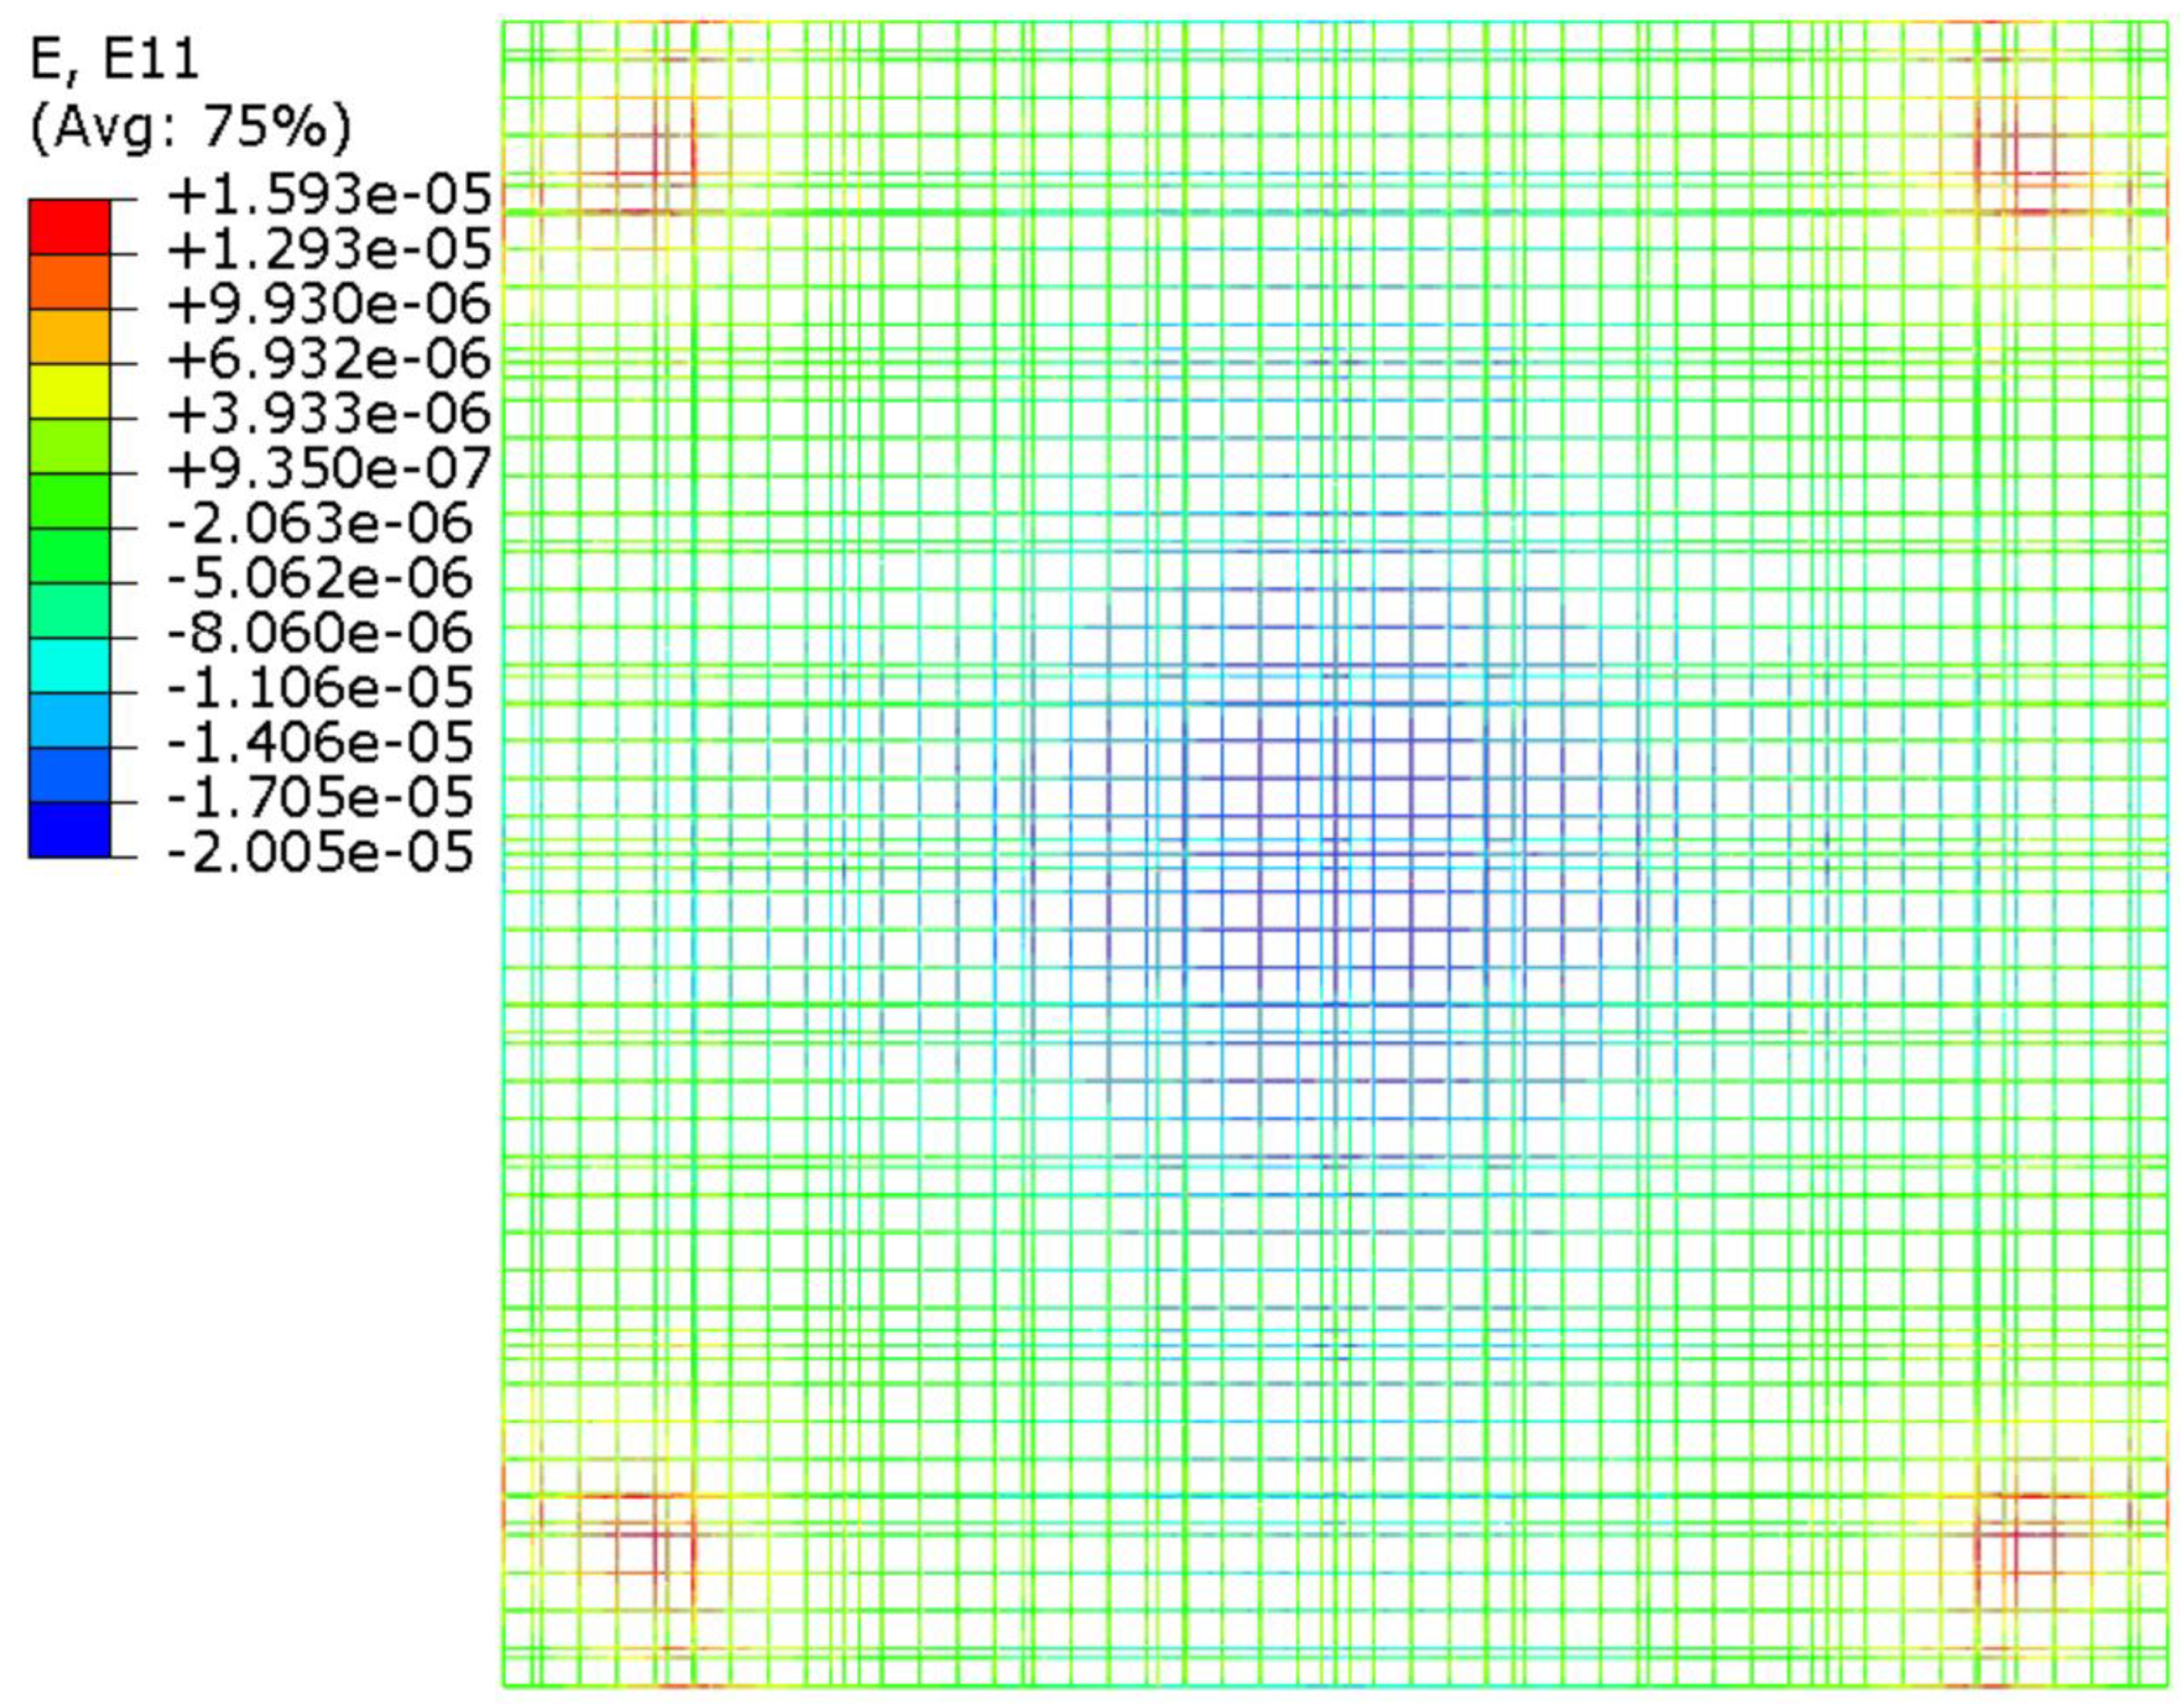
Figure 11.
Concrete Strain Cloud Diagram of the Hollow Floor Slab. (a) Y-direction Stress Cloud Diagram of the Top Slab; (b) X-direction Stress Cloud Diagram of the Top Slab; (c) Y-direction Stress Cloud Diagram of the Bottom Slab; (d) X-direction Stress Cloud Diagram of the Bottom Slab.
Figure 11.
Concrete Strain Cloud Diagram of the Hollow Floor Slab. (a) Y-direction Stress Cloud Diagram of the Top Slab; (b) X-direction Stress Cloud Diagram of the Top Slab; (c) Y-direction Stress Cloud Diagram of the Bottom Slab; (d) X-direction Stress Cloud Diagram of the Bottom Slab.
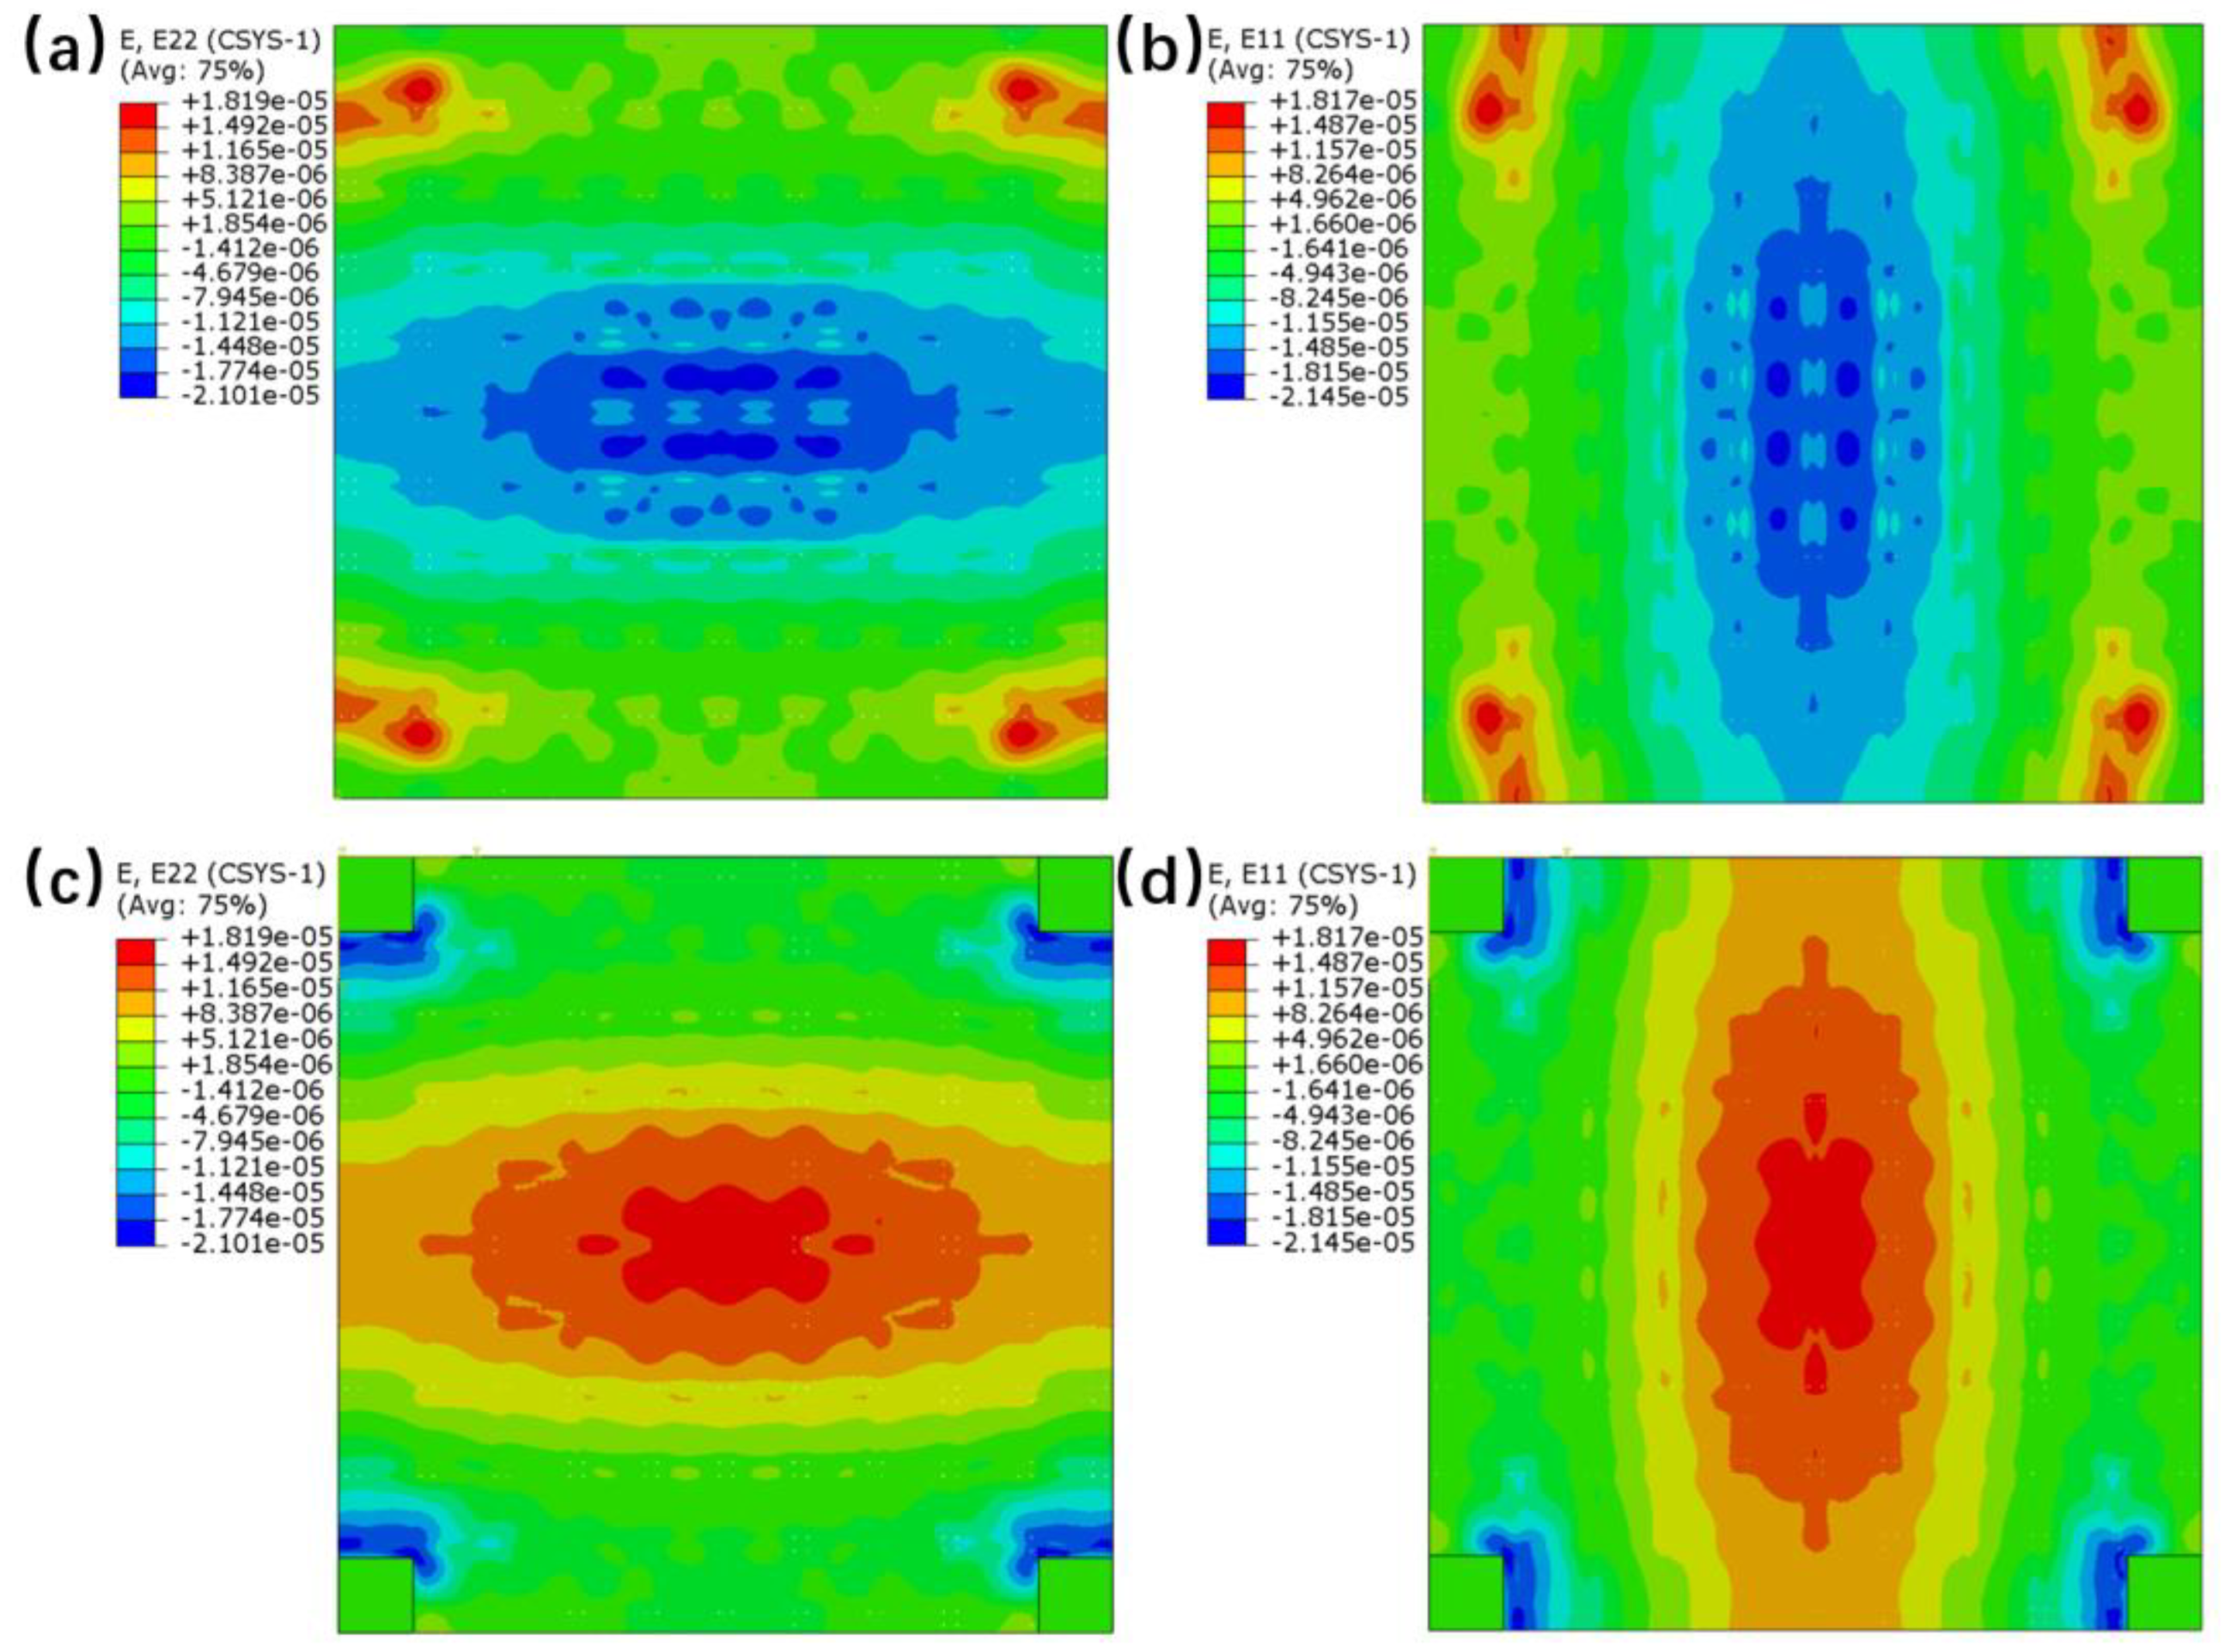
Figure 12.
Crack Distribution on the Top and Bottom Surfaces. (a) Top Slab Damage Cloud Diagram; (b) Bottom Slab Damage Cloud Diagram.
Figure 12.
Crack Distribution on the Top and Bottom Surfaces. (a) Top Slab Damage Cloud Diagram; (b) Bottom Slab Damage Cloud Diagram.
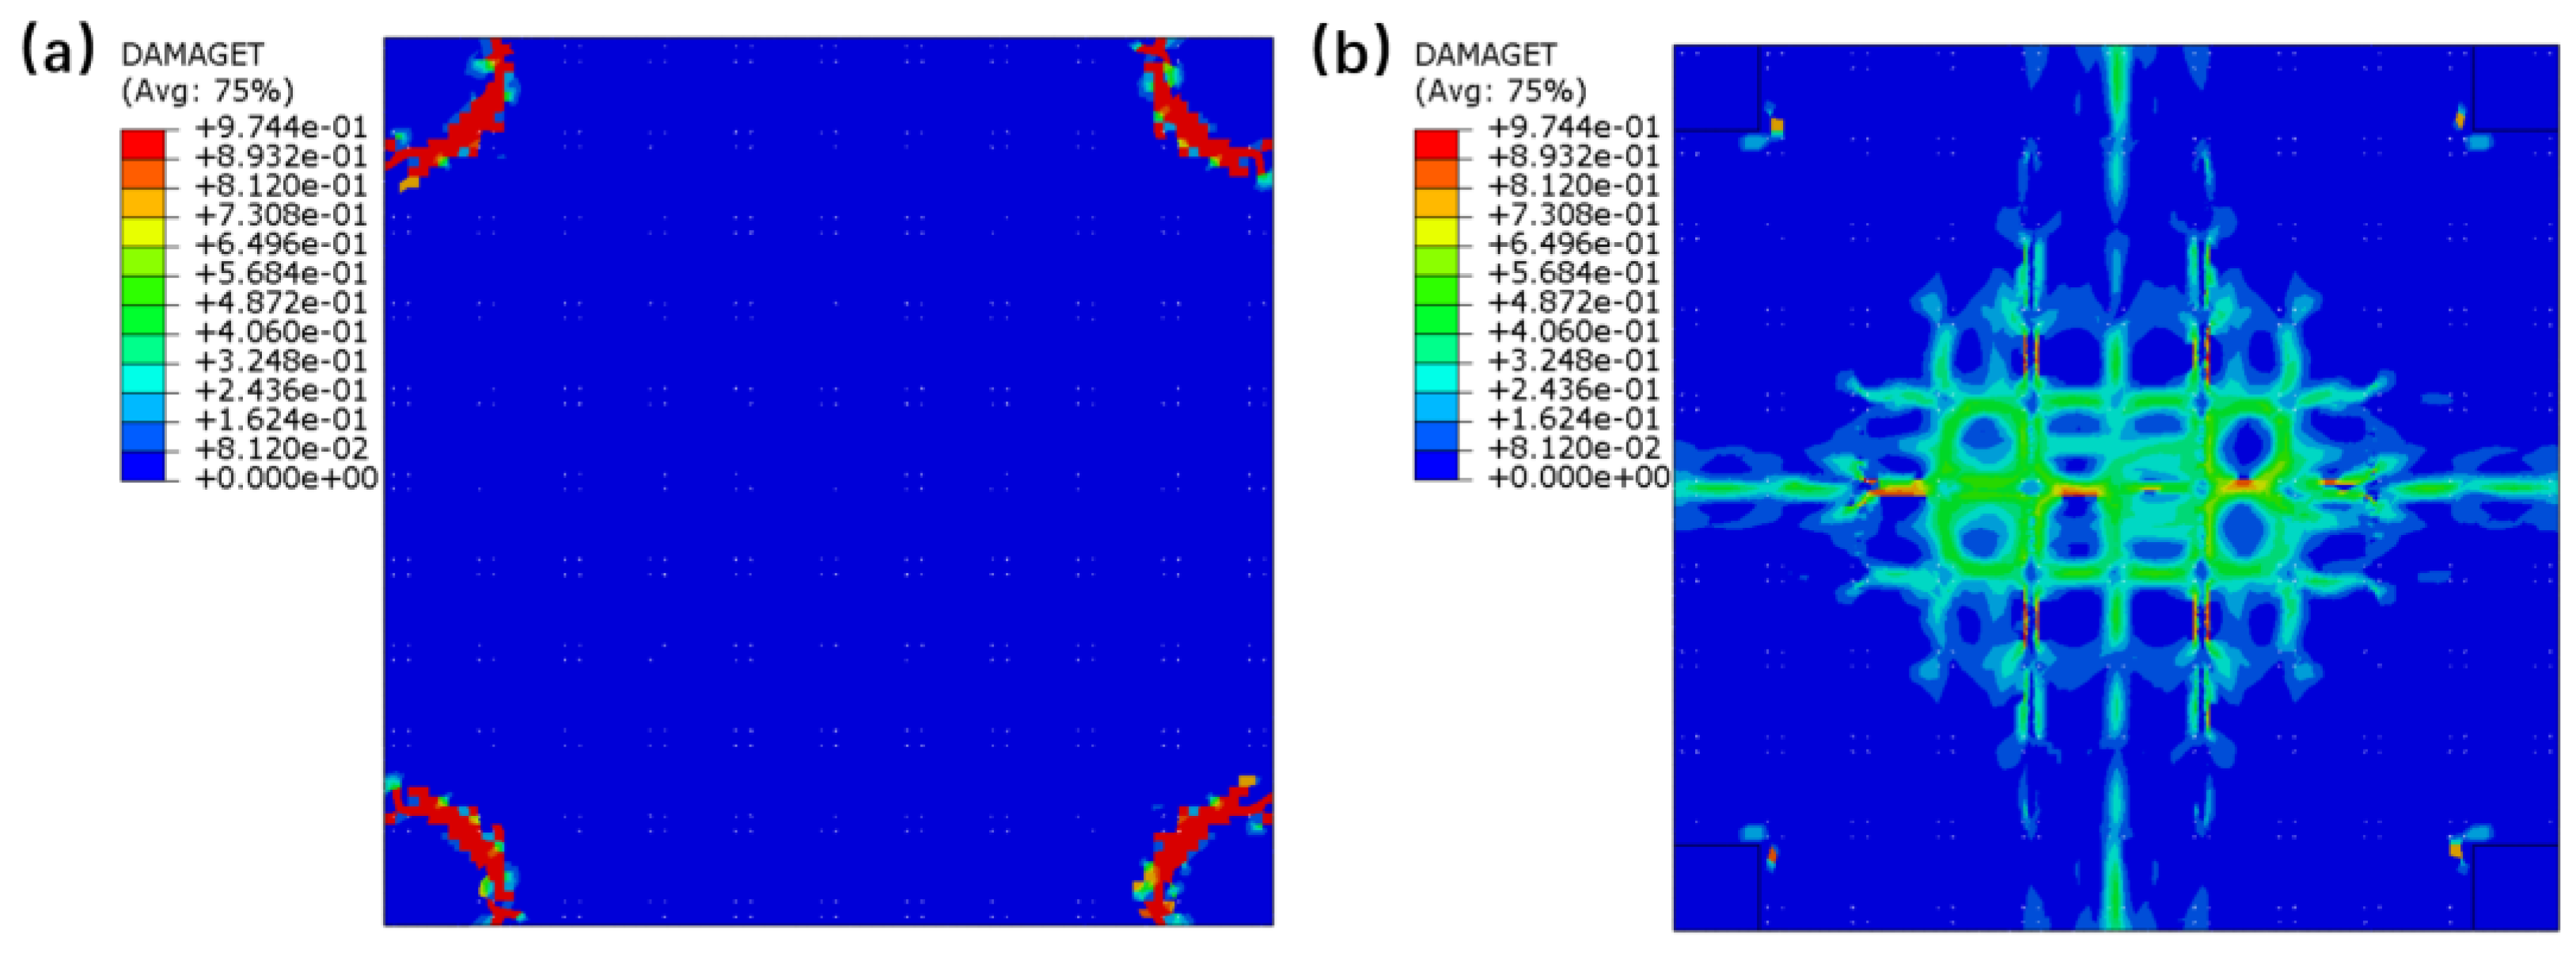
Figure 13.
Comparison of the Rebar Load-Strain Curve between Experiment and Finite Element Simulation.
Figure 13.
Comparison of the Rebar Load-Strain Curve between Experiment and Finite Element Simulation.
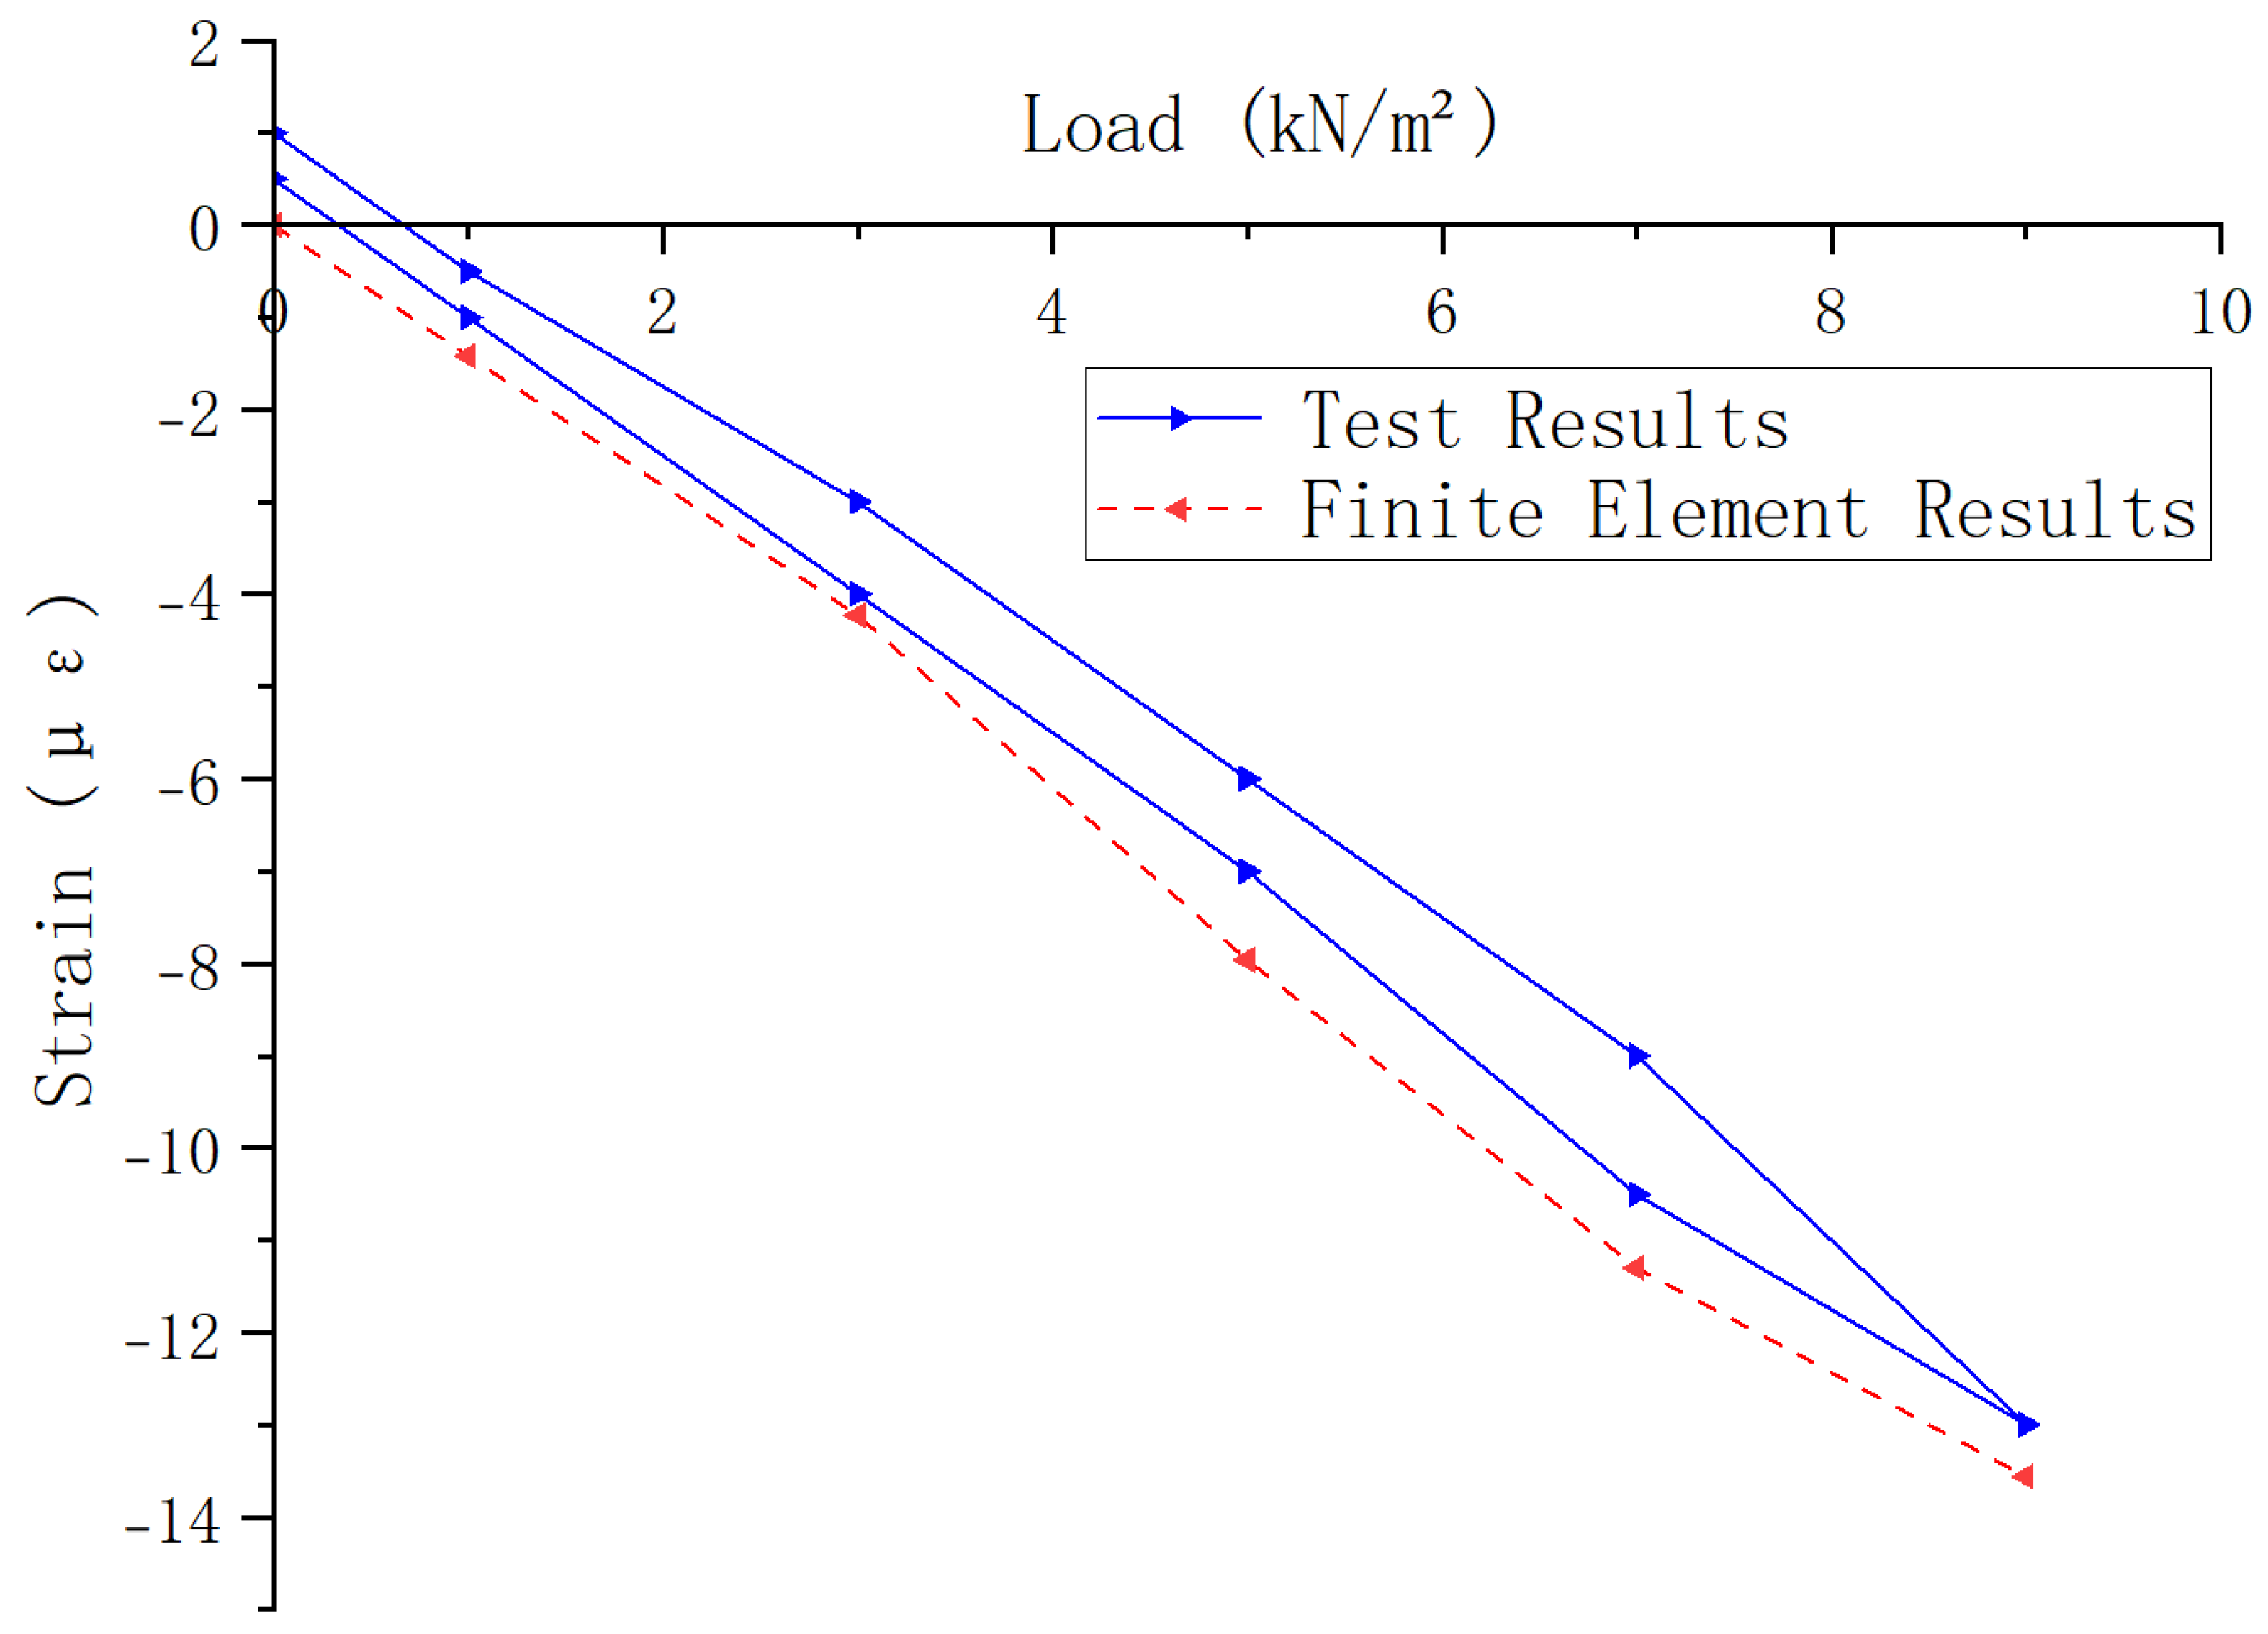
Figure 14.
Comparison of Concrete Load-Strain Curves between Experiment and Finite Element Simulation: (a) X-direction; (b) Y-direction.
Figure 14.
Comparison of Concrete Load-Strain Curves between Experiment and Finite Element Simulation: (a) X-direction; (b) Y-direction.
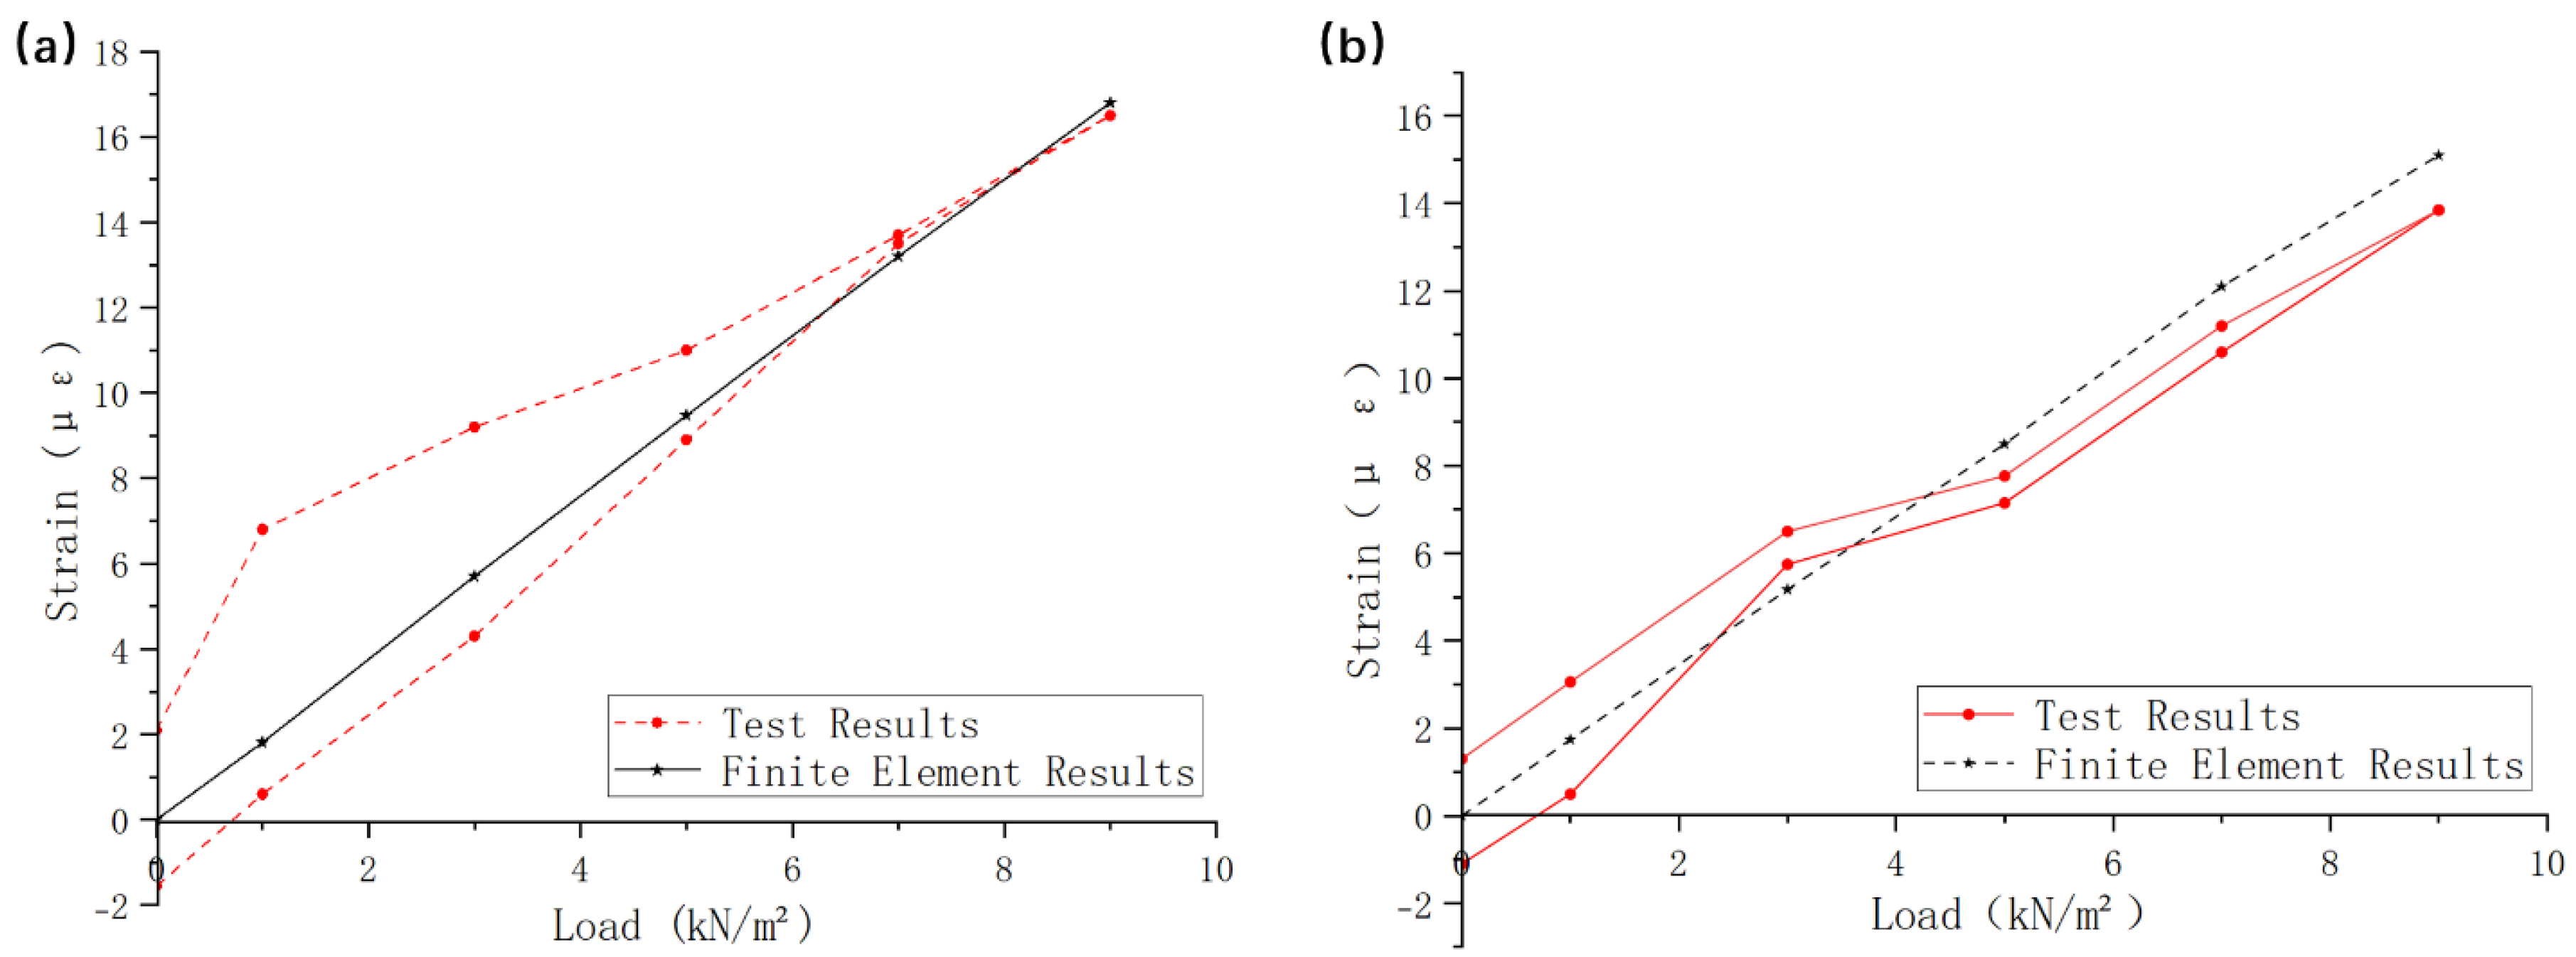

Table 1.
Material Performance Indicators.
| Material | Grade | Density (kN/m³) | Elastic Modulus (GPa) | Poisson's Ratio |
| Concrete | C30 | 24 | 30 | 0.2 |
| Rib Beam Reinforcement | HRB400 | 78 | 200 | 0.3 |
| Surface Reinforcement | HRB300 | 78 | 210 | 0.3 |
Table 2.
Parameter Indicators of Plastic Damage Model.
| Expansion Angle (mm) | Eccentricity | fb0/fc0 | K | Viscous Coefficient |
| 30 | 0.1 | 1.16 | 2/3 | 0.005 |
Disclaimer/Publisher’s Note: The statements, opinions and data contained in all publications are solely those of the individual author(s) and contributor(s) and not of MDPI and/or the editor(s). MDPI and/or the editor(s) disclaim responsibility for any injury to people or property resulting from any ideas, methods, instructions or products referred to in the content. |
© 2025 by the authors. Licensee MDPI, Basel, Switzerland. This article is an open access article distributed under the terms and conditions of the Creative Commons Attribution (CC BY) license (http://creativecommons.org/licenses/by/4.0/).
Copyright: This open access article is published under a Creative Commons CC BY 4.0 license, which permit the free download, distribution, and reuse, provided that the author and preprint are cited in any reuse.


