
Submitted:
22 April 2025
Posted:
22 April 2025
You are already at the latest version
Abstract
Lightweight steel framing (LSF) systems have gained prominence in modern construction due to their efficiency, adaptability, and sustainability. However, traditional facade materials such as stonework remain cost-prohibitive, and brick veneers, though increasingly preferred, pose challenges in seismic regions. This study introduces an innovative porcelain sheathing system for cold-formed steel (CFS) shear walls, offering superior strength-to-weight ratios compared to granite and enhanced crack resistance. Four full-scale CFS shear walls with screwed porcelain sheathing (SPS) were experimentally evaluated under combined cyclic lateral and constant gravity loading. Key parameters, including load capacity, deformation behavior, energy dissipation, and failure modes, were analyzed to estimate the seismic response modification factor (R) for SPS-CFS systems. Results revealed that horizontal sheath orientation, double middle studs, and three blocking rows significantly enhanced lateral resistance (up to 21.1 kN) and drift capacity (2.5%). The calculated R-factor averaged 4.2, exceeding current code recommendations (AISI S213: R=3; AS/NZS 4600: R=2), highlighting the system’s potential for improved seismic resilience. Modifications to minimize brittle failure risks and optimize inelastic response are proposed, alongside discussions on permissible building heights. This research bridges critical gaps in CFS design codes and provides actionable insights for earthquake-prone regions.
Keywords:
porcelain sheathing
; light steel structure
; dry set
; response factor
; cyclic loading
; magnification ratio
; gravity load
1. Introduction
Cold-formed steel (CFS) systems have revolutionized low-rise building construction through their lightweight properties and ease of assembly [1]. In certain areas, CFS shear walls are emerging as innovative structural solutions and are increasingly favored for resisting lateral forces. Despite this progress, seismic design methodologies for CFS systems remain underdeveloped, with current seismic codes lacking comprehensive guidelines for these systems [2,3,4]. As a result, further research is essential to enhance knowledge of key seismic parameters for CFS shear walls, including response modification factors (R-factors), load-bearing capacity, and ductility. Extensive research has emphasized the critical role of sheathing materials in influencing the lateral performance of CFS shear walls. Gad et al. [5], for instance, identified sheathing as a pivotal element affecting the behavior of lightweight steel frames (LSFs). The American Iron and Steel Institute (AISI) has certified materials like steel, gypsum, wood, and concrete—typically secured with self-drilling screws—for use in CFS-LSFs [6]. Masonry infills, such as brick or stone bonded with adhesives, have also been employed, though challenges in material compatibility have driven a shift toward LSF-based systems. While many studies have analyzed structural components with these materials, most concentrate on wet-set applications, which involve labor-intensive installation processes. Esmaili et al. [7], for example, investigated mortar dimensions in brick-sheathed LSFs.
Recent experimental research has investigated CFS lateral load-resisting systems incorporating mechanically fastened sheathing. Although Sharafi et al. and Usefi et al. [8,9] have synthesized findings from such studies, the influence of screwed porcelain sheathing (SPS) on the seismic resilience of CFS shear walls has not yet been thoroughly examined. AISI S400 [10] formally acknowledges CFS shear walls with steel or wood sheathing but excludes gypsum-based systems. Nonetheless, materials like gypsum wall boards (GWBs), Bolivian magnesium boards (BMBs), and calcium silicate boards (CSBs) are commonly utilized for both fire resistance and lateral bracing of studs [11]. Many standards, such as those in Iran [12], allow the use of these materials in lateral load-resisting systems, provided they meet specified performance criteria.
1.1. Previous Research
Pan and Shan [13] investigated the performance of GWB, CSB, and oriented strand board (OSB) sheathing under monotonic shear conditions. Their study identified screw-induced sheath tearing and panel-screw separation as primary failure mechanisms. OSB-sheathed frames demonstrated the maximum shear resistance, whereas GWB specimens showed the lowest. Walls with a 2:1 aspect ratio exhibited a 35% reduction in shear capacity compared to 1:1 configurations. CSB systems displayed superior energy absorption, while GWB performed poorly; ductility trends correlated with screw arrangement and bracing design. Single-sided sheathing outperformed double-sided setups in ductility.
Baran and Alica [14] observed that hold-down fixtures in CFS wall tracks markedly influenced structural behavior, whereas diagonal bracing minimally affected load-bearing capacity and initial stiffness. Swensen et al. [15] noted that contemporary screw designs and adhesive-based sheathing-frame bonding substantially enhanced connection strength over traditional methods. Mohebbi et al. [16] evaluated steel-sheathed CFS walls under cyclic loads, revealing that walls with failed sheathing connections absorbed more energy than those with buckling studs. Double-sided sheathing improved energy dissipation, strength, and stiffness when stud failure was mitigated.
Niari et al. [17] determined that doubling steel sheathing thickness boosted shear capacity by 42%, with failure modes tied to sheathing-fastener separation.
Javaheri et al. [18] tested steel-sheathed walls with varied screw layouts, advocating an increased response modification factor from 6.5 to 7. Closer screw spacing (150 to 100 mm) improved shear strength in single-end stud designs by 16–18%, though double-end configurations showed no gains. Their study involved 24 full-scale walls in eight configurations, applied to three 1.2×2.4-meter panels.
Zhang et al. [19] analyzed corrugated steel-sheathed CFS walls under gravity loads, noting that gravitational loads at the service load level enhanced stiffness and strength, with a proposed 7% drift limit for collapse. Zeynalian and Ronagh [20] assessed fiber cement board (FCB)-sheathed systems, deeming their seismic performance inadequate (R=2.5) but improved to R=5 when paired with X-bracing. Xu et al. [21,22] introduced high-strength lightweight foamed concrete (HLFC) sheathing, which increased lateral strength while shifting failure modes from brittle to ductile. Higher foam grades and stud thickness enhanced performance, though vertical loads reduced ductility.
1.2. Design Standards
AISI standards [23,24] outline criteria for CFS shear walls with R-factors below 3, emphasizing uplift resistance and boundary elements. However, they exclude newer systems like SPS-CFS walls. FEMA 450 [25] and P750 [26] under the National Earthquake Hazard Reduction Program (NEHRP) mandate AISI compliance but face inconsistencies in load/stress criteria, requiring calibration. Many CFS systems lack approved R-factors, defaulting to 3. Technical Instructions (TI) 809-07 [27] recommends an R=4 for diagonally strapped CFS walls, commonly used in U.S. military projects. The Australian/New Zealand Standard (AS/NZS 4600-05) [28] restricts R-factors to 2 in Australia/New Zealand, where seismic risks are low and wind governs design.
1.3. Seismic Response Modification Factor
To design cost-effective and resilient structures, it is essential to balance safety and economy by enabling buildings to endure minor to moderate earthquakes with minimal damage while preventing collapse during severe seismic events. This balance is achieved by reducing seismic loads and leveraging structural ductility and energy absorption, concepts integrated into the seismic response modification factor (R). The R-factor combines two key components: the ductility reduction factor (Rd) and the structural over-strength factor () [25,26,29]. It is mathematically expressed as:
as depicted in Figure. 1, the factors are defined as follows:
thus, the R-factor can also be derived as:
here, represents the elastic response strength, is the idealized yield strength, and denotes the first significant yield strength. Figure 1 visualizes these components by comparing the actual load-displacement curve, an equivalent linear elastic curve, and an idealized bilinear curve derived using the FEMA methodology. The Priestley–Pauli method is often employed to approximate the bilinear behavior of the actual curve [30].
According to FEMA 356 [31], The idealized curve is formed by two lines determined through the equality of the area under the actual curve and the area under the idealized curve using an iterative graphical method. The first line passes the intersection of the origin and the point on the actual curve at 0.6, whereas the second line connects the first line at to the target displacement (), defined as the maximum drift before a substantial strength reduction. , must not exceed the actual curve’s peak base shear. In this study, was set to 60 mm, aligning with FEMA 450 [25] criteria: maximum allowable story drift (0.025H) or displacement at a 20% strength reduction.
The Rd-factor reflects a structure’s inelastic deformation capacity, influenced by ductility, energy dissipation, natural period, and soil properties [32,33]. Newmark and Hall [34] established widely used relationships between Rd and ductility (μ). Structure ductility is defined as Eq. (5). Where, is the maximum drift and is the idealized yield drift.
For varying natural periods (T), the Rd-factor can be calculated using the following sub-equations which have been widely adopted in the literature [33,35]:
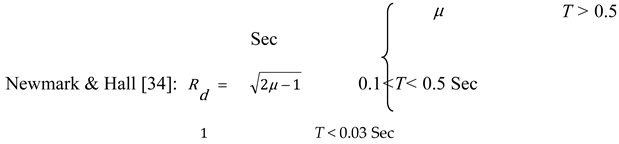
Therefore, the Rd-factor can be derived either geometrically through Figure 1 or using Newmark-Hall method. In this study, Eq. (6) is used to compute Rd (sub-equation with T=0.1−0.5 sec for LSF structures [5]) and is determined by back-calculating design capacities from tested specimen at first yield [18], and is derived via Eq. (3).
2. Research Aims and Focus
Despite progress, consensus on R-factors for CFS systems—particularly SPS configurations—remains elusive. The potential of high-strength porcelain sheathing, unexamined in prior studies, could address critical gaps in strength, weight, and construction efficiency.
Traditional materials dominate existing research, overlooking advanced ceramics like porcelain, which may enhance seismic resilience and cost-effectiveness. This study pioneers experimental evaluation of porcelain-sheathed CFS walls, analyzing sheath component orientation effects, dual middle stud, and addition of horizontal struts together with flat straps (additional blockings). Key findings indicate superior lateral performance with horizontal sheath strips, delayed failure via reinforced middle stud, and enhanced displacement capacity through additional blockings.
By exploring these innovations, the research aims to advance seismic design practices for CFS structures in earthquake-prone regions, offering actionable insights for optimizing CFS wall systems.
3. Test Setup
3.1. Testing Rig and Measurement Systems
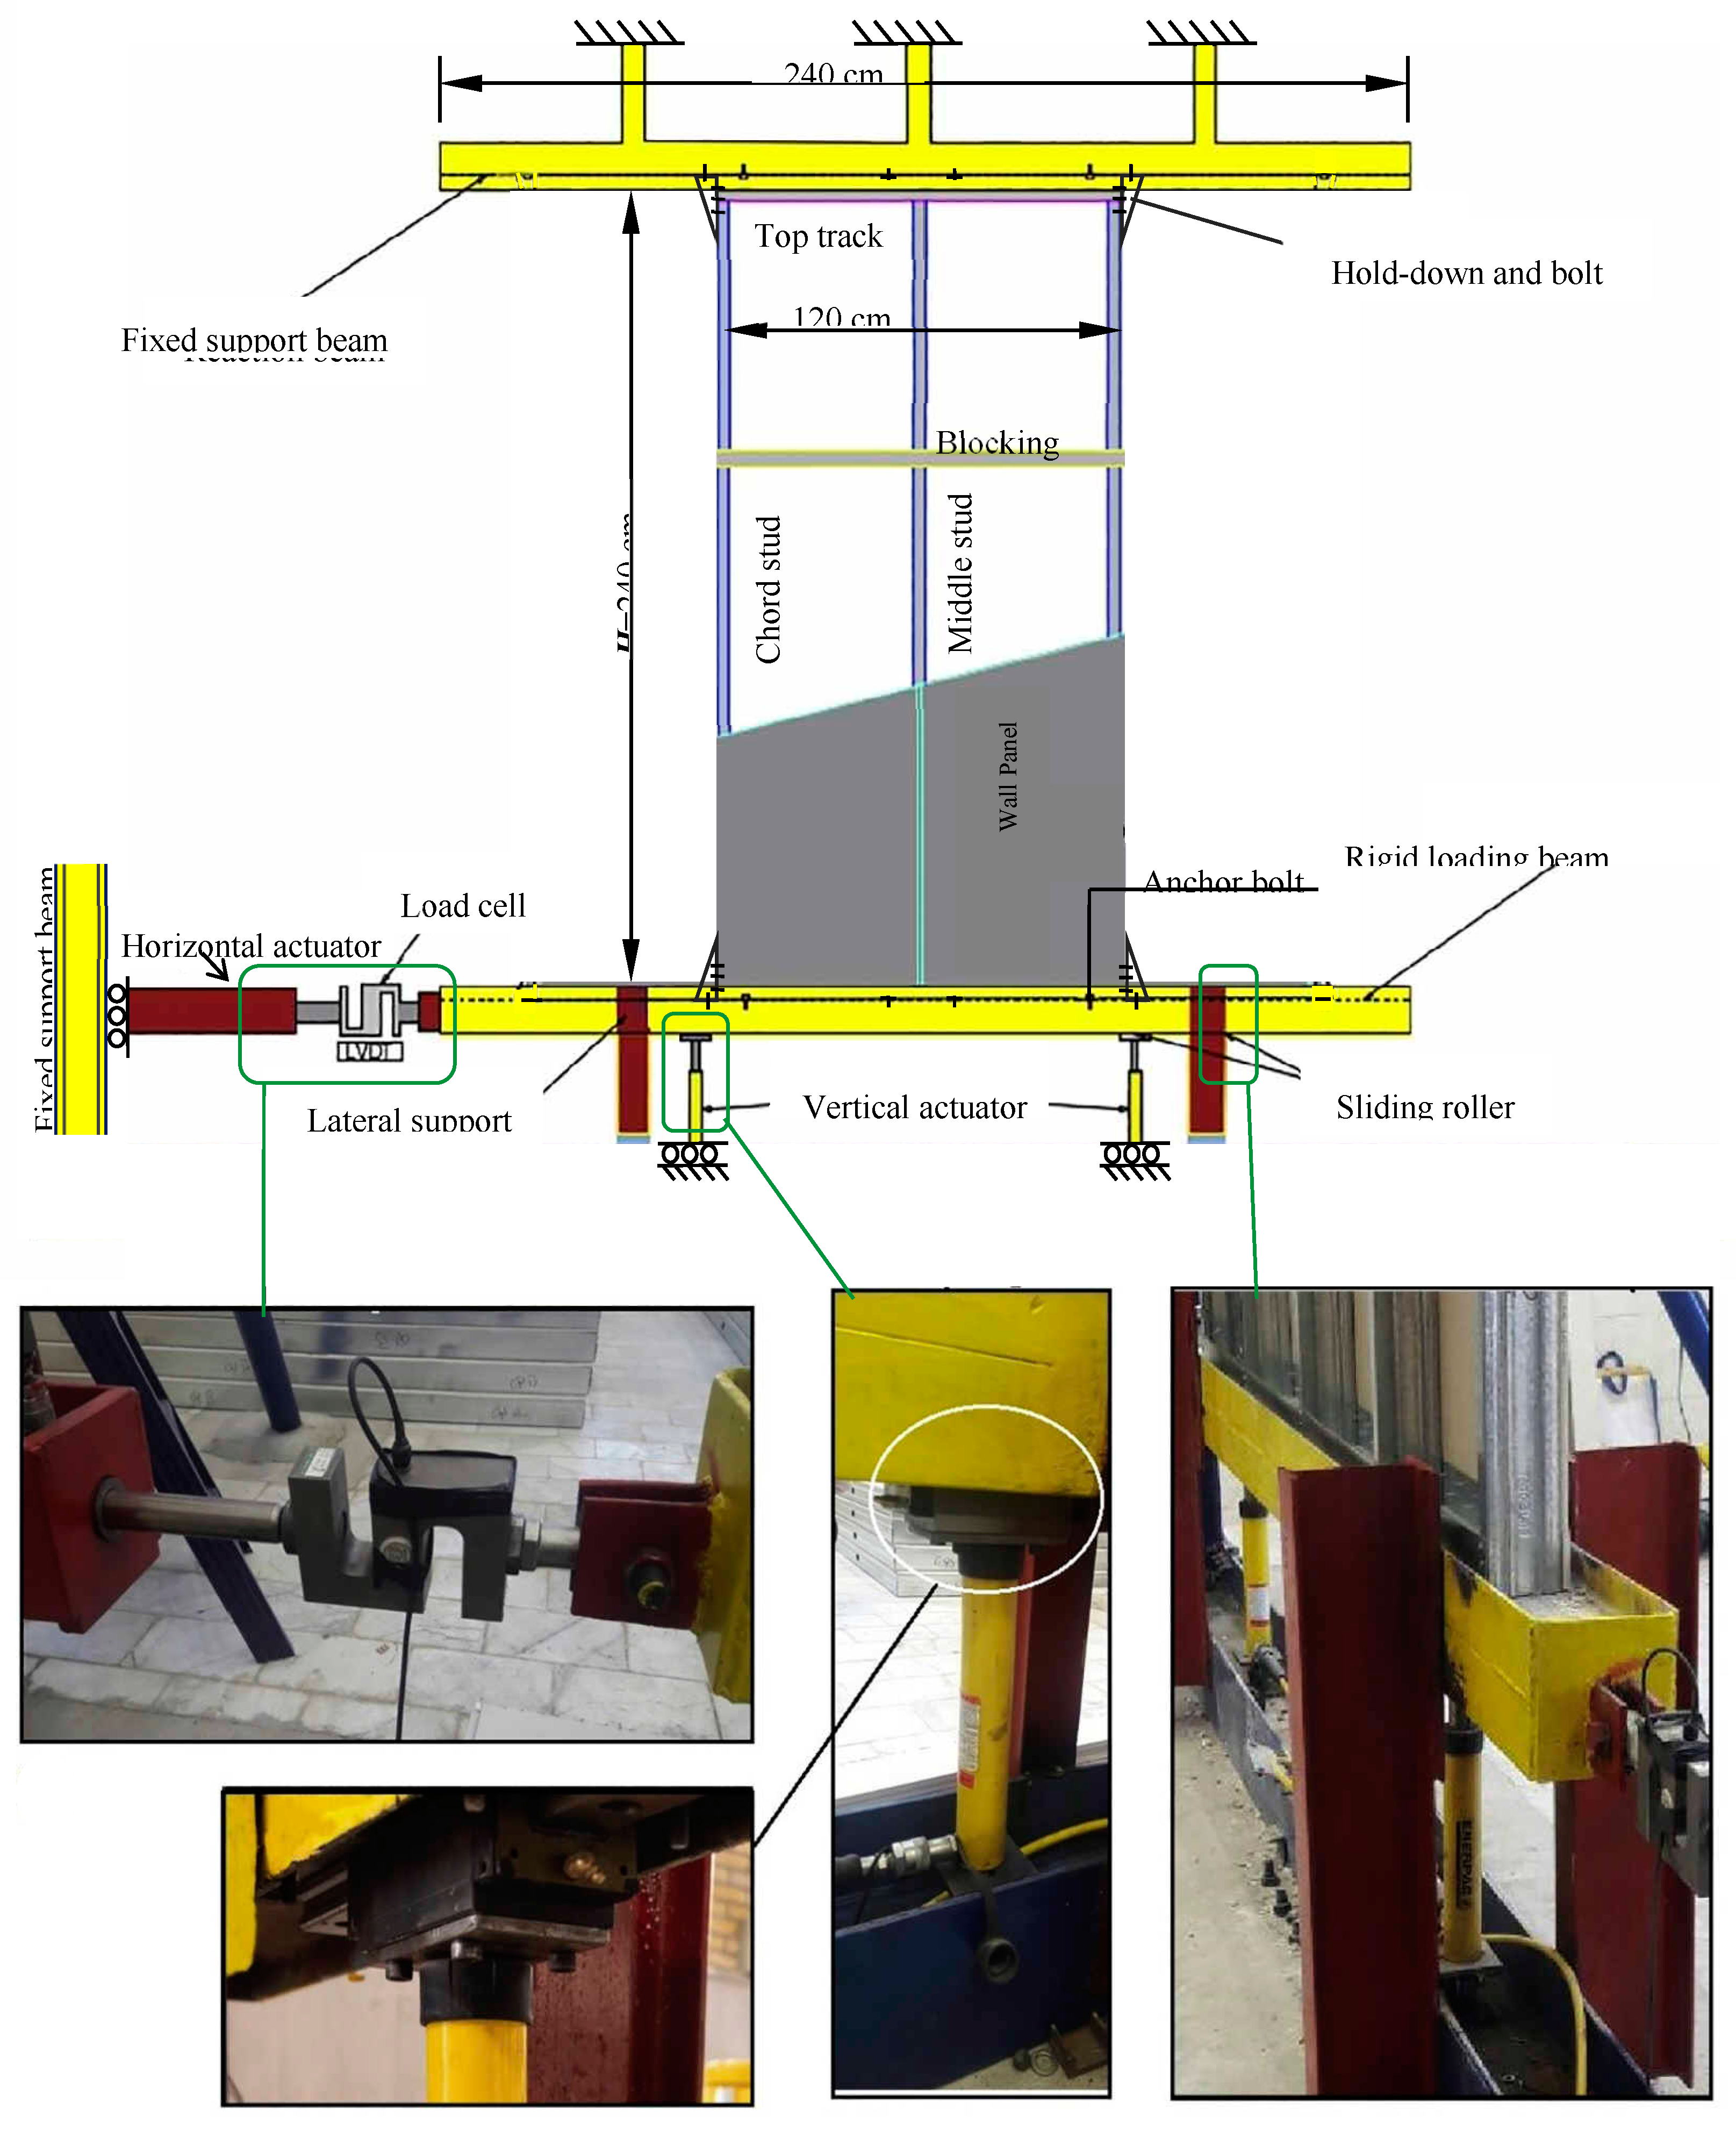
A dependable and accurate experimental configuration is essential for capturing reliable data on the seismic behavior of structural specimens. Figure 2 depicts a schematic of the testing apparatus and support system, engineered to accommodate specimens as large as 2.4×2.4 meters. Specimens were secured between a stationary upper support beam and a rigid lower loading beam using high-strength M16 bolts. These bolts were torqued to roughly 190 Nm (corresponding to 53 kN of tension) to establish a stable connection and eliminate slippage risks. Steel gusset angles were installed at each corner of the specimens to mitigate overturning tendencies and maintain an effective load transfer from the bracing elements to the wall chords and studs. Figure 3 details the configuration of these gusset angles and associated bolts.
A linear variable displacement transducer (LVDT) was deployed to record horizontal displacements at the bottom track, enabling precise monitoring of lateral shifts during cyclic loading. Simultaneously, a load cell measured racking resistance, with all data transmitted to a computerized system for real-time generation of load-displacement curves. Vertical gravity loads were applied using two 200 kN hydraulic jacks. A flow rail roller, positioned between the loading beam and jacks, ensured the loading point synchronized with the wall panel’s lateral displacement. Notably, the gravity load remained fixed throughout testing. This integrated instrumentation framework enabled thorough evaluation of structural response under seismic forces.
3.2. Loading Protocol
3.2.1. Lateral Load
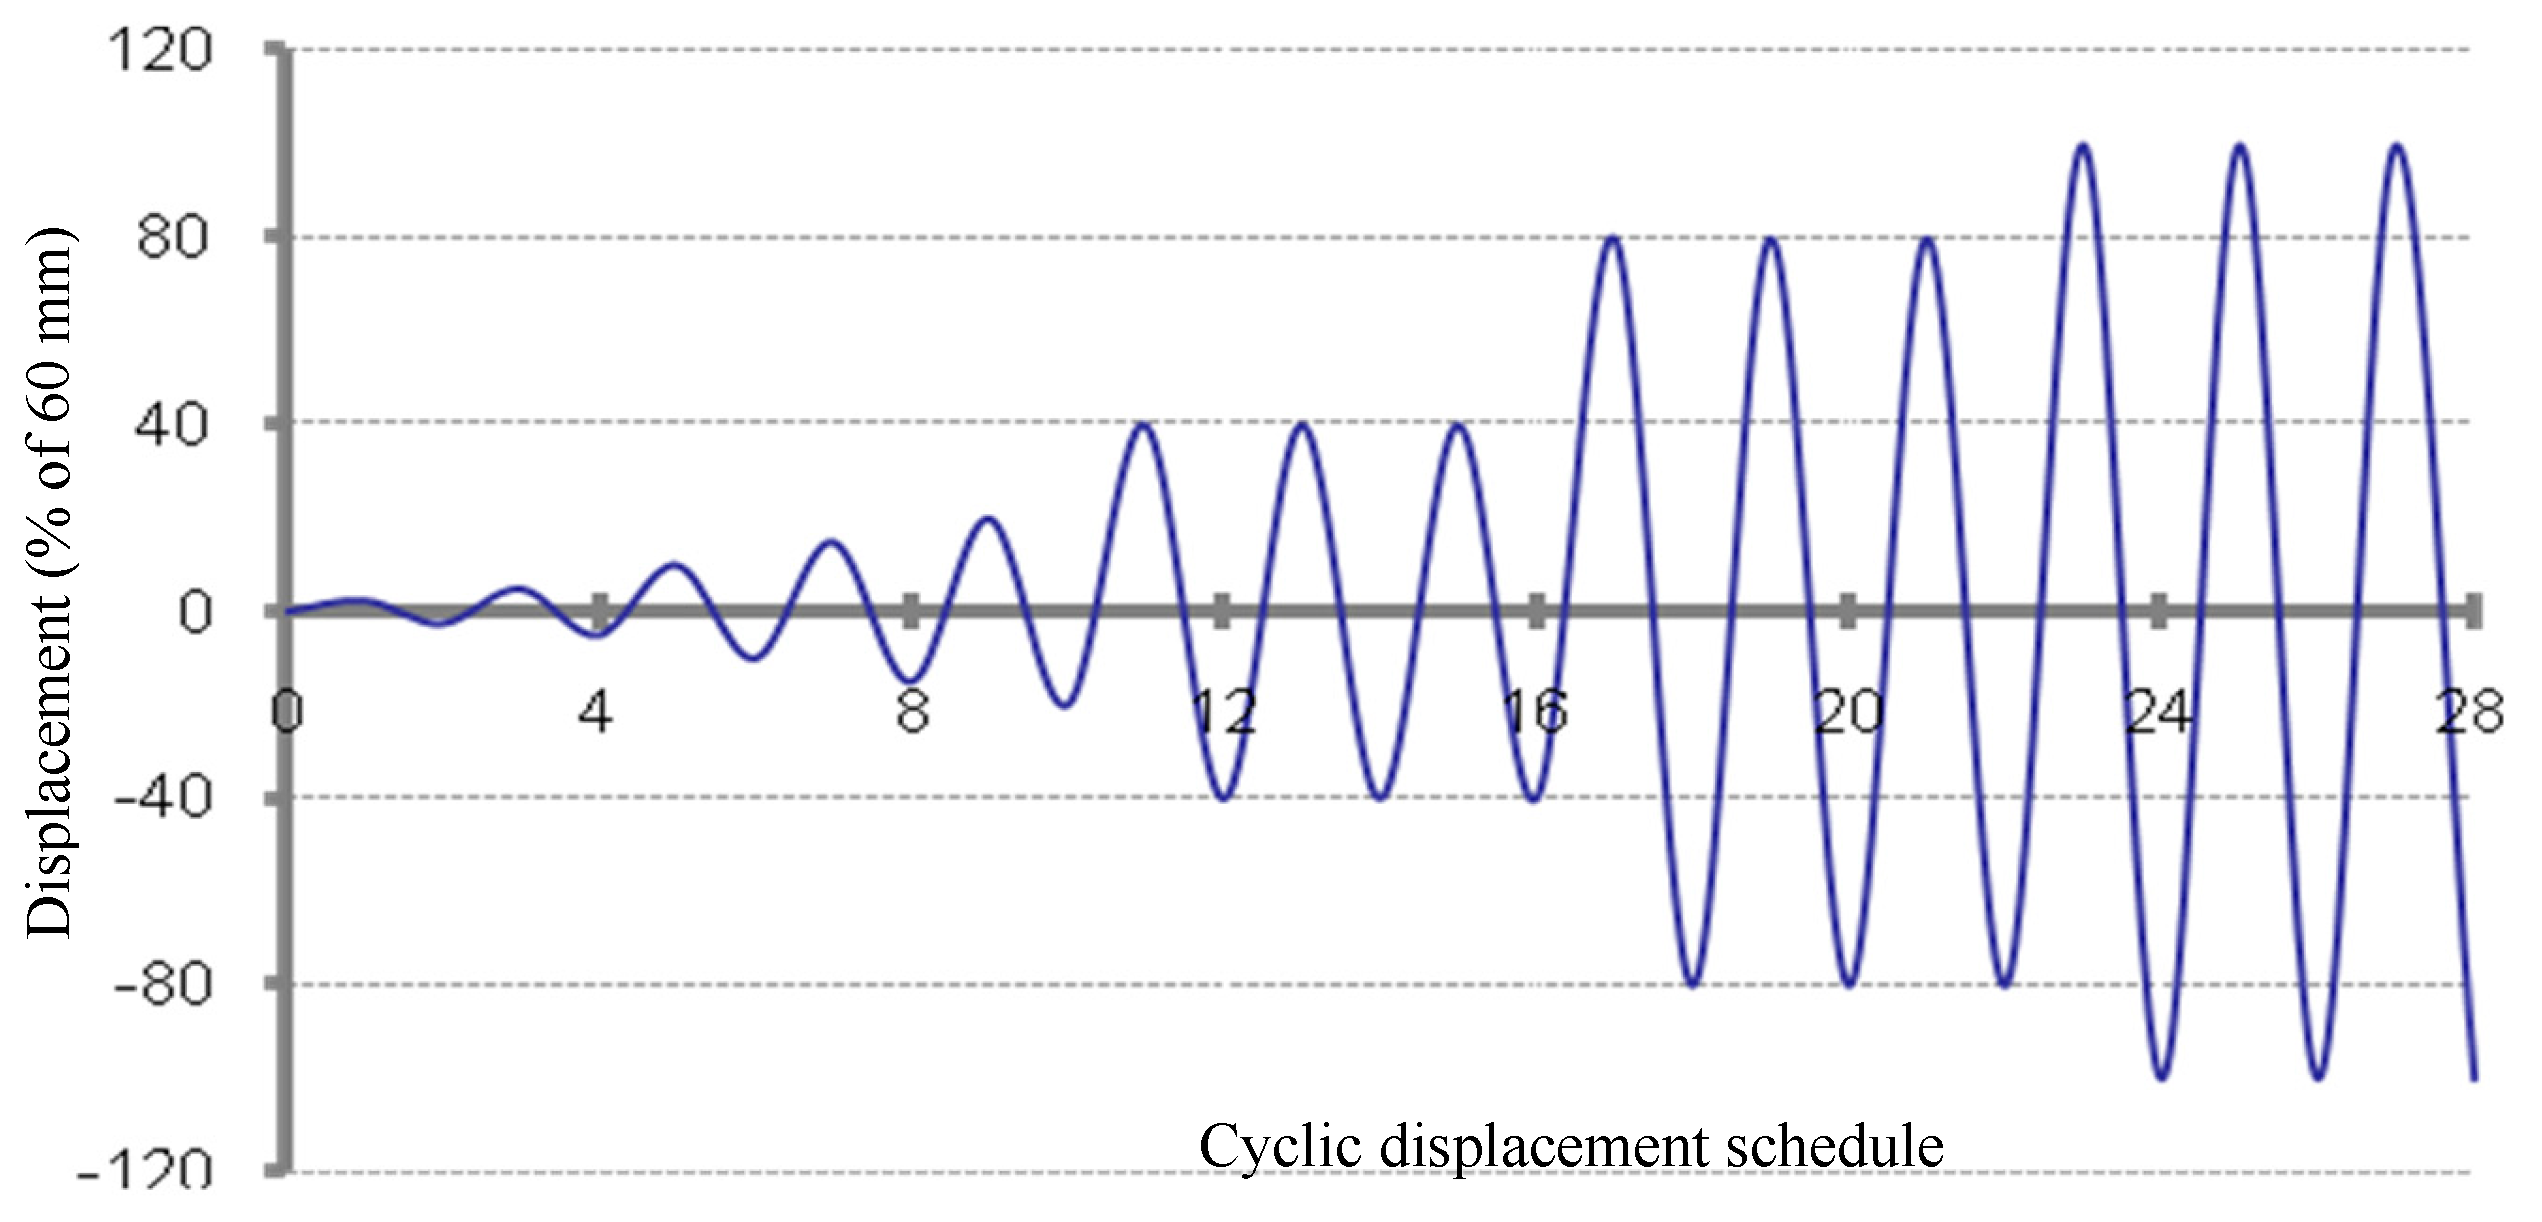
The cyclic testing procedure followed Method B of the ASTM standard [36], involving sequential displacement-controlled cycles applied to the specimens until structural failure or a marked reduction in load-bearing capacity occurred. Table 1 and Figure 4 outline the specific parameters of the displacement regime.
Figure 2.
Schematic of the testing apparatus and support conditions.
The loading actuator had a maximum displacement capacity of 75 mm, equivalent to a 3.125% inter-story drift ratio. This range exceeded the FEMA 450 guideline’s 2.5% drift limit, ensuring compliance with structural safety benchmarks. A constant loading rate of 2 mm/s was maintained, adhering to ASTM E2126-07 specifications for cyclic tests. This standardized approach guaranteed reproducibility, enabling direct performance comparisons across specimens.
Figure 3.
Hold-down components, bolts and gusset angles.
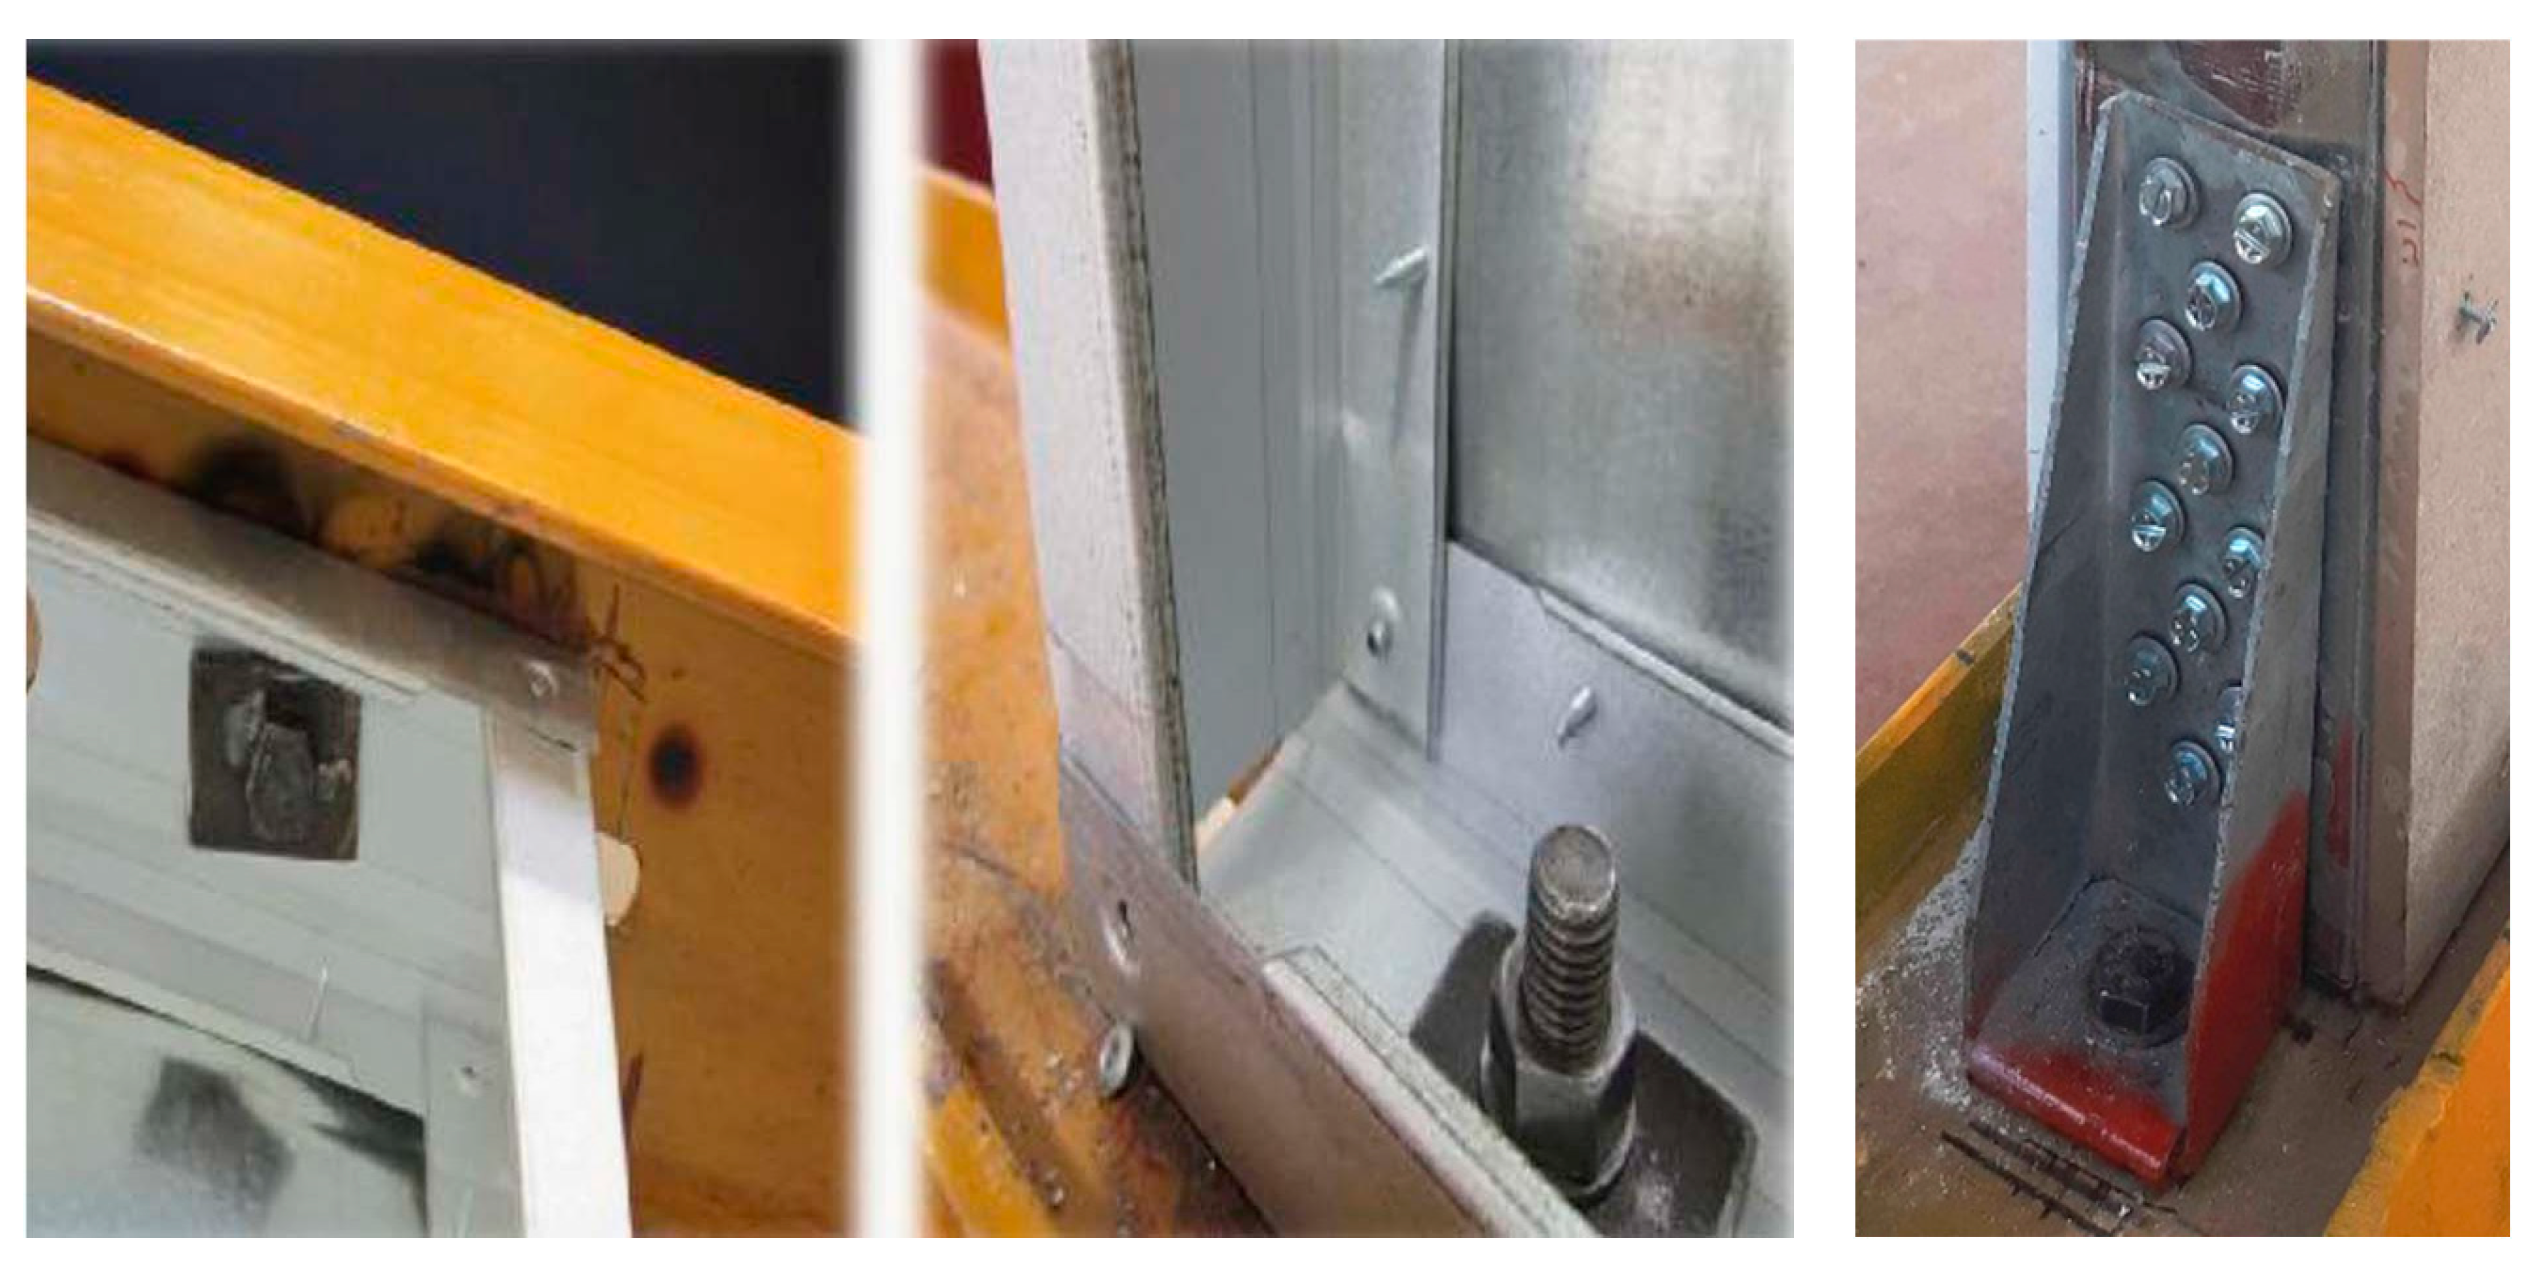
Figure 4.
Cyclic lateral displacement protocol.
3.2.2. Gravity Load
Prior to lateral loading, a uniform axial load of 40 kN was applied to the bottom track of each specimen. This value corresponded to the maximum axial capacity of the bare frames (without sheathing or lateral bracing) before inducing local buckling, as established through prior incremental compression tests. The 40 kN load approximates the allowable compressive strength of each bare frame, calculated as 0.6×Pn×(number of studs), where Pn denotes the nominal compressive strength of the stud—a thin-walled structural member [12,37]. This preloading simulated realistic service conditions and ensured stability during subsequent lateral displacement tests.
4. Experimental Program, Specimens, and Materials
Four full-scale CFS shear wall specimens, each measuring 1.2×2.4 meters, were tested to evaluate the hysteretic lateral performance of varied configurations (Table 2). The CFS sections, with a nominal thickness of 0.7 mm, exhibited the mechanical properties outlined in Table 3. Each specimen featured one-sided porcelain sheathing and integrated plasterboard on the opposite side, secured with screws driven through a minimum of three thread pitches to ensure robust connections. Fabrication and testing were conducted at the Structural and Earthquake Research Center of Islamic Azad University’s Taft Branch, with specimens mounted on a rig for cyclic lateral loading.
Porcelain was selected for its high strength-to-weight ratio, making it ideal for dry construction. Compared to granite, it offers enhanced crack resistance and durability. The 11 mm thick porcelain used here had a tensile strength of 8.5 MPa, compressive strength of 130 MPa, and density of 2200 kg/m³.
Figure 5 illustrates the porcelain sheathing geometry, including material dimensions and placement. Thin joints between frames and porcelain were sealed with silicone to prevent separation during failure. To mitigate stress concentrations in the brittle ceramic, screws were spaced at 15 cm along edges and 20 cm in central regions (Figure 6 and Figure 7).
Specimen nomenclature reflects design variables: - S/D: Single or double middle studs. - H/V: Horizontal or vertical sheathing orientation. - Number: Blocking row count (e.g., D-V-3 = double studs, vertical sheathing, 3 blocking rows). The study compared configurations to assess impacts of sheathing direction, stud arrangement, and blocking on seismic performance: - S-H-3 vs. D-H-3: Single vs. double middle studs. - D-H-3 vs. D-V-3: Horizontal vs. vertical sheathing. - D-V-3 vs. D-V-1: Three vs. one blocking rows. This systematic approach aimed to isolate key factors influencing CFS shear wall behavior under cyclic loads.
5. Experimental Results
5.1. Failure Modes
Test observations revealed that initial failures typically emerged as cracks at plasterboard corners under a displacement of 24 mm (sixth loading step). In specimen D-H-3, shear failure also occurred in screws connecting porcelain sheathing at frame corners. Table 4 provides a comparative summary of the timing, location, quantity, and severity of failure modes across specimens. Ceramic cracking initiated at 48 mm displacement. These results indicate that pairing plasterboard with porcelain sheathing on opposing sides accelerates wall failure. Figure 8 illustrates these failure modes.
Figure 5.
Porcelain side detailing (dimensions in mm).
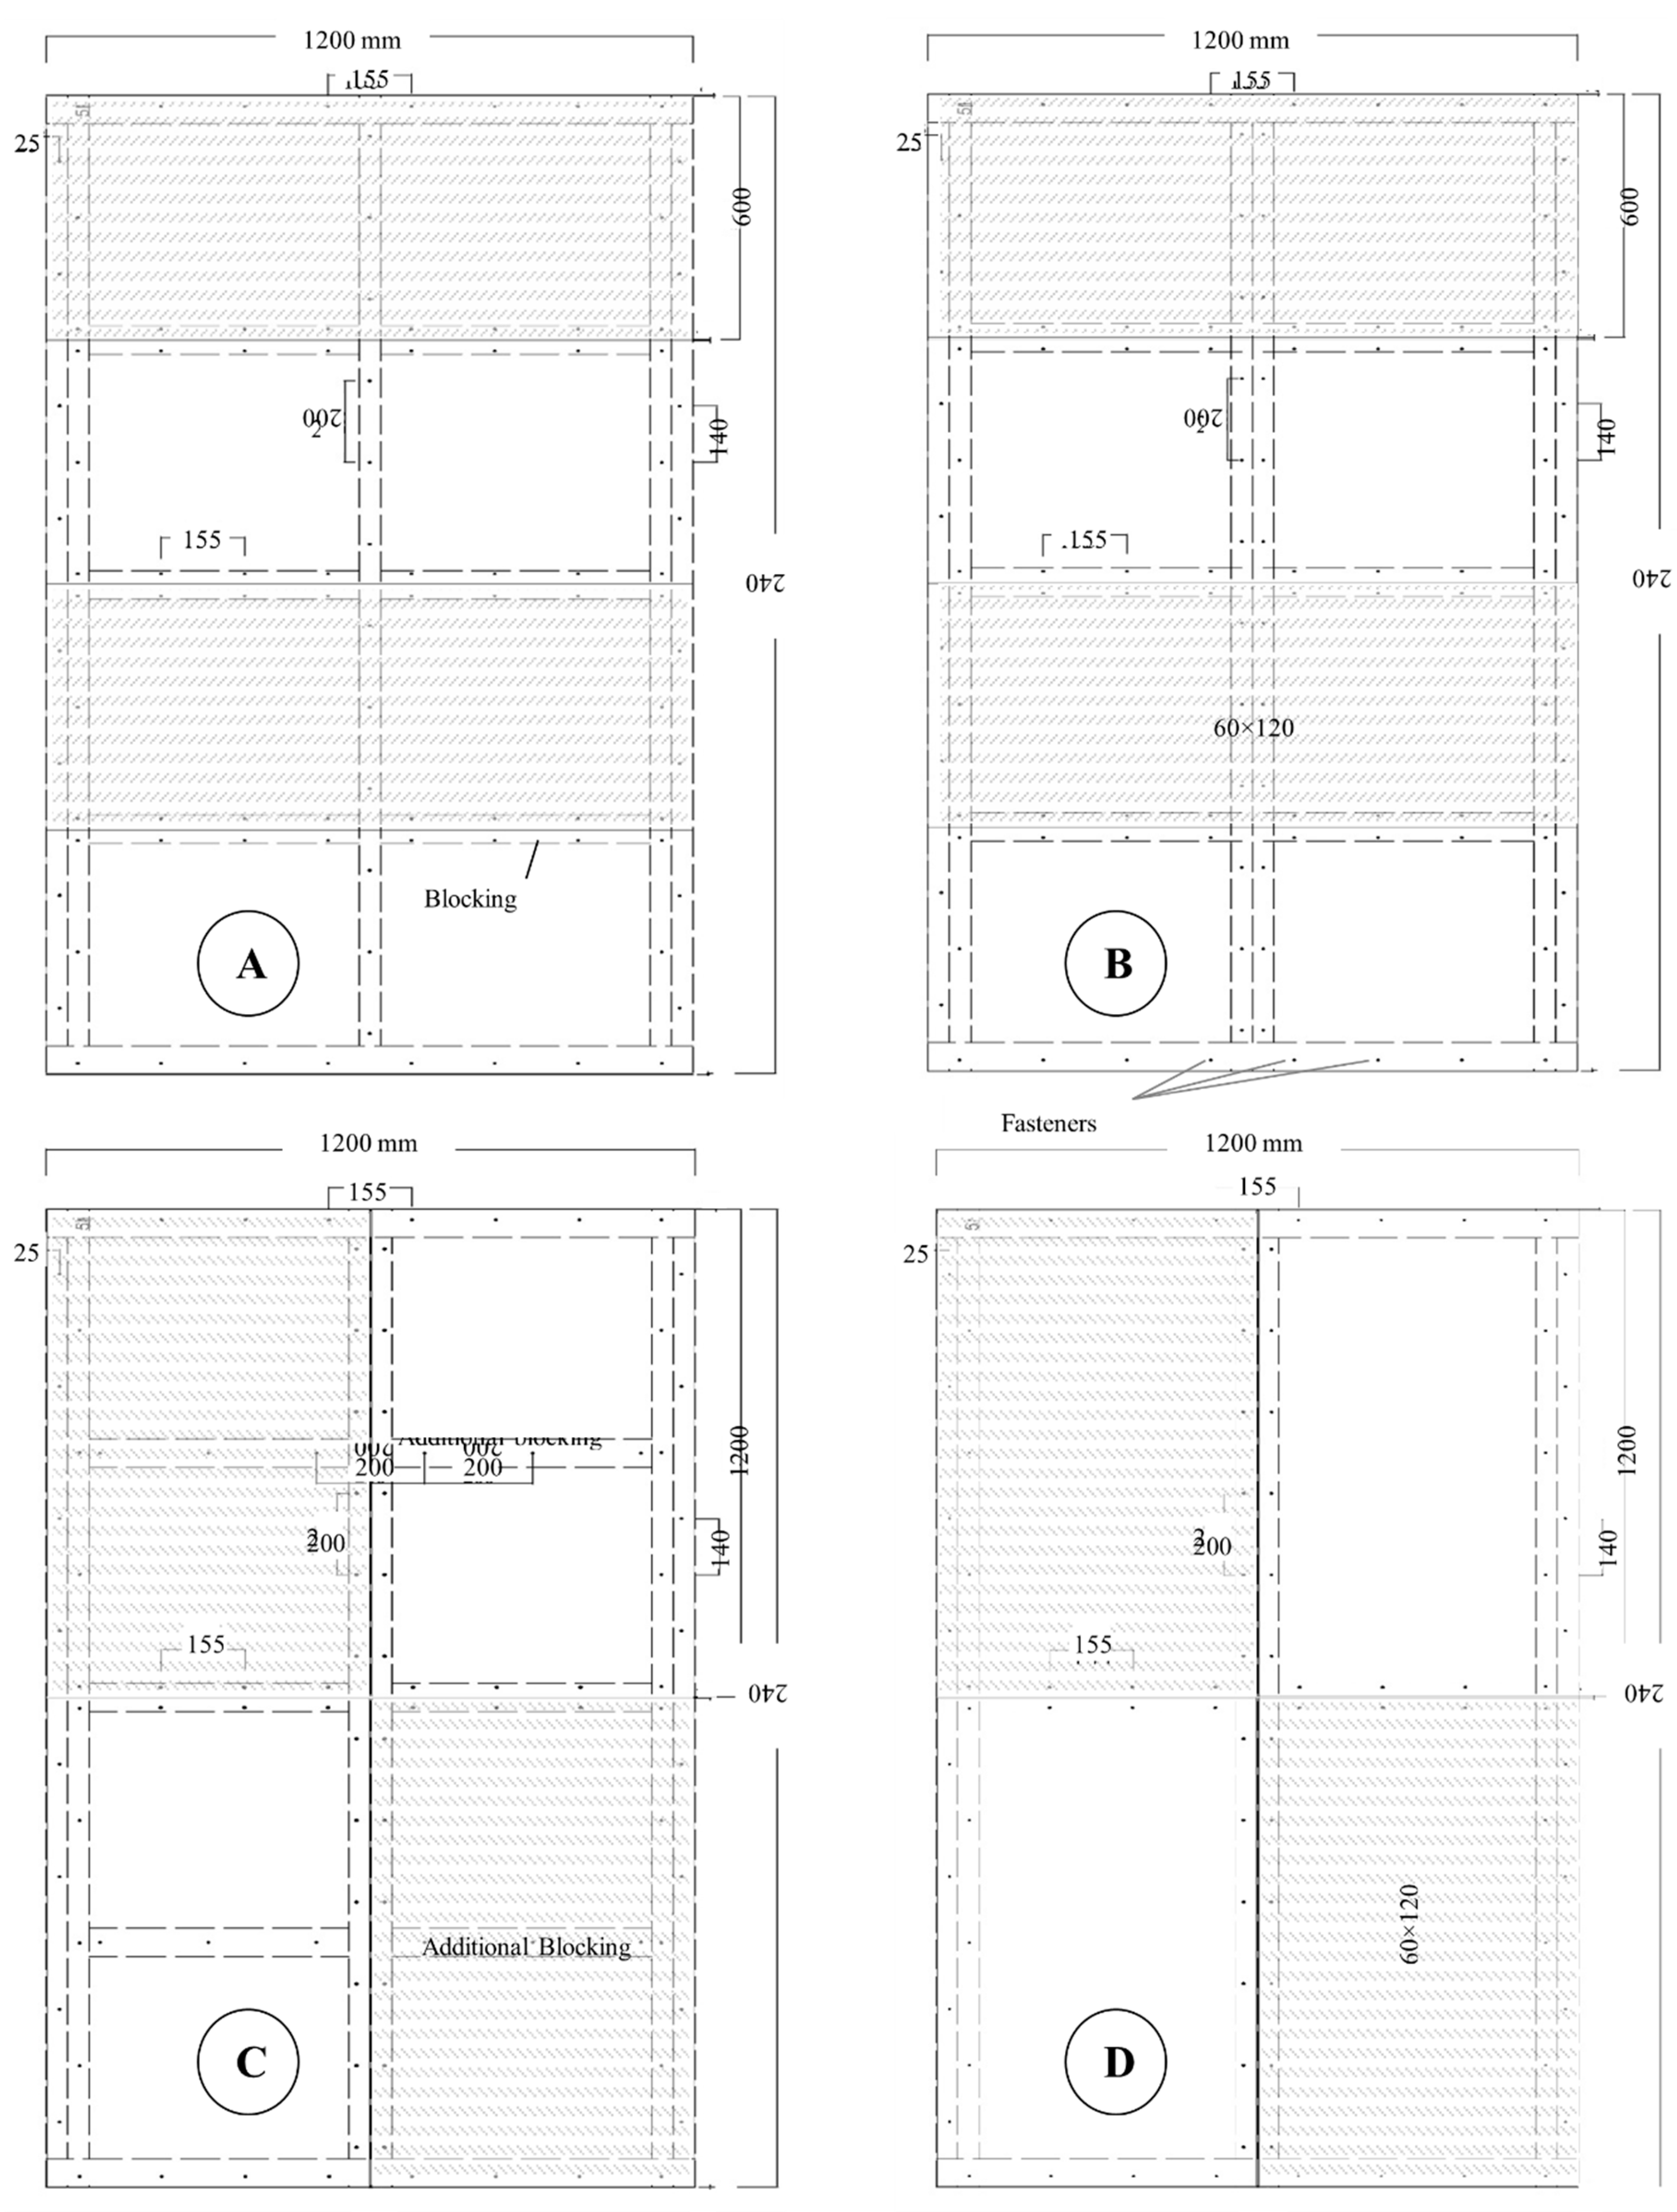
Figure 6.
Plasterboard side detailing (dimensions in mm).
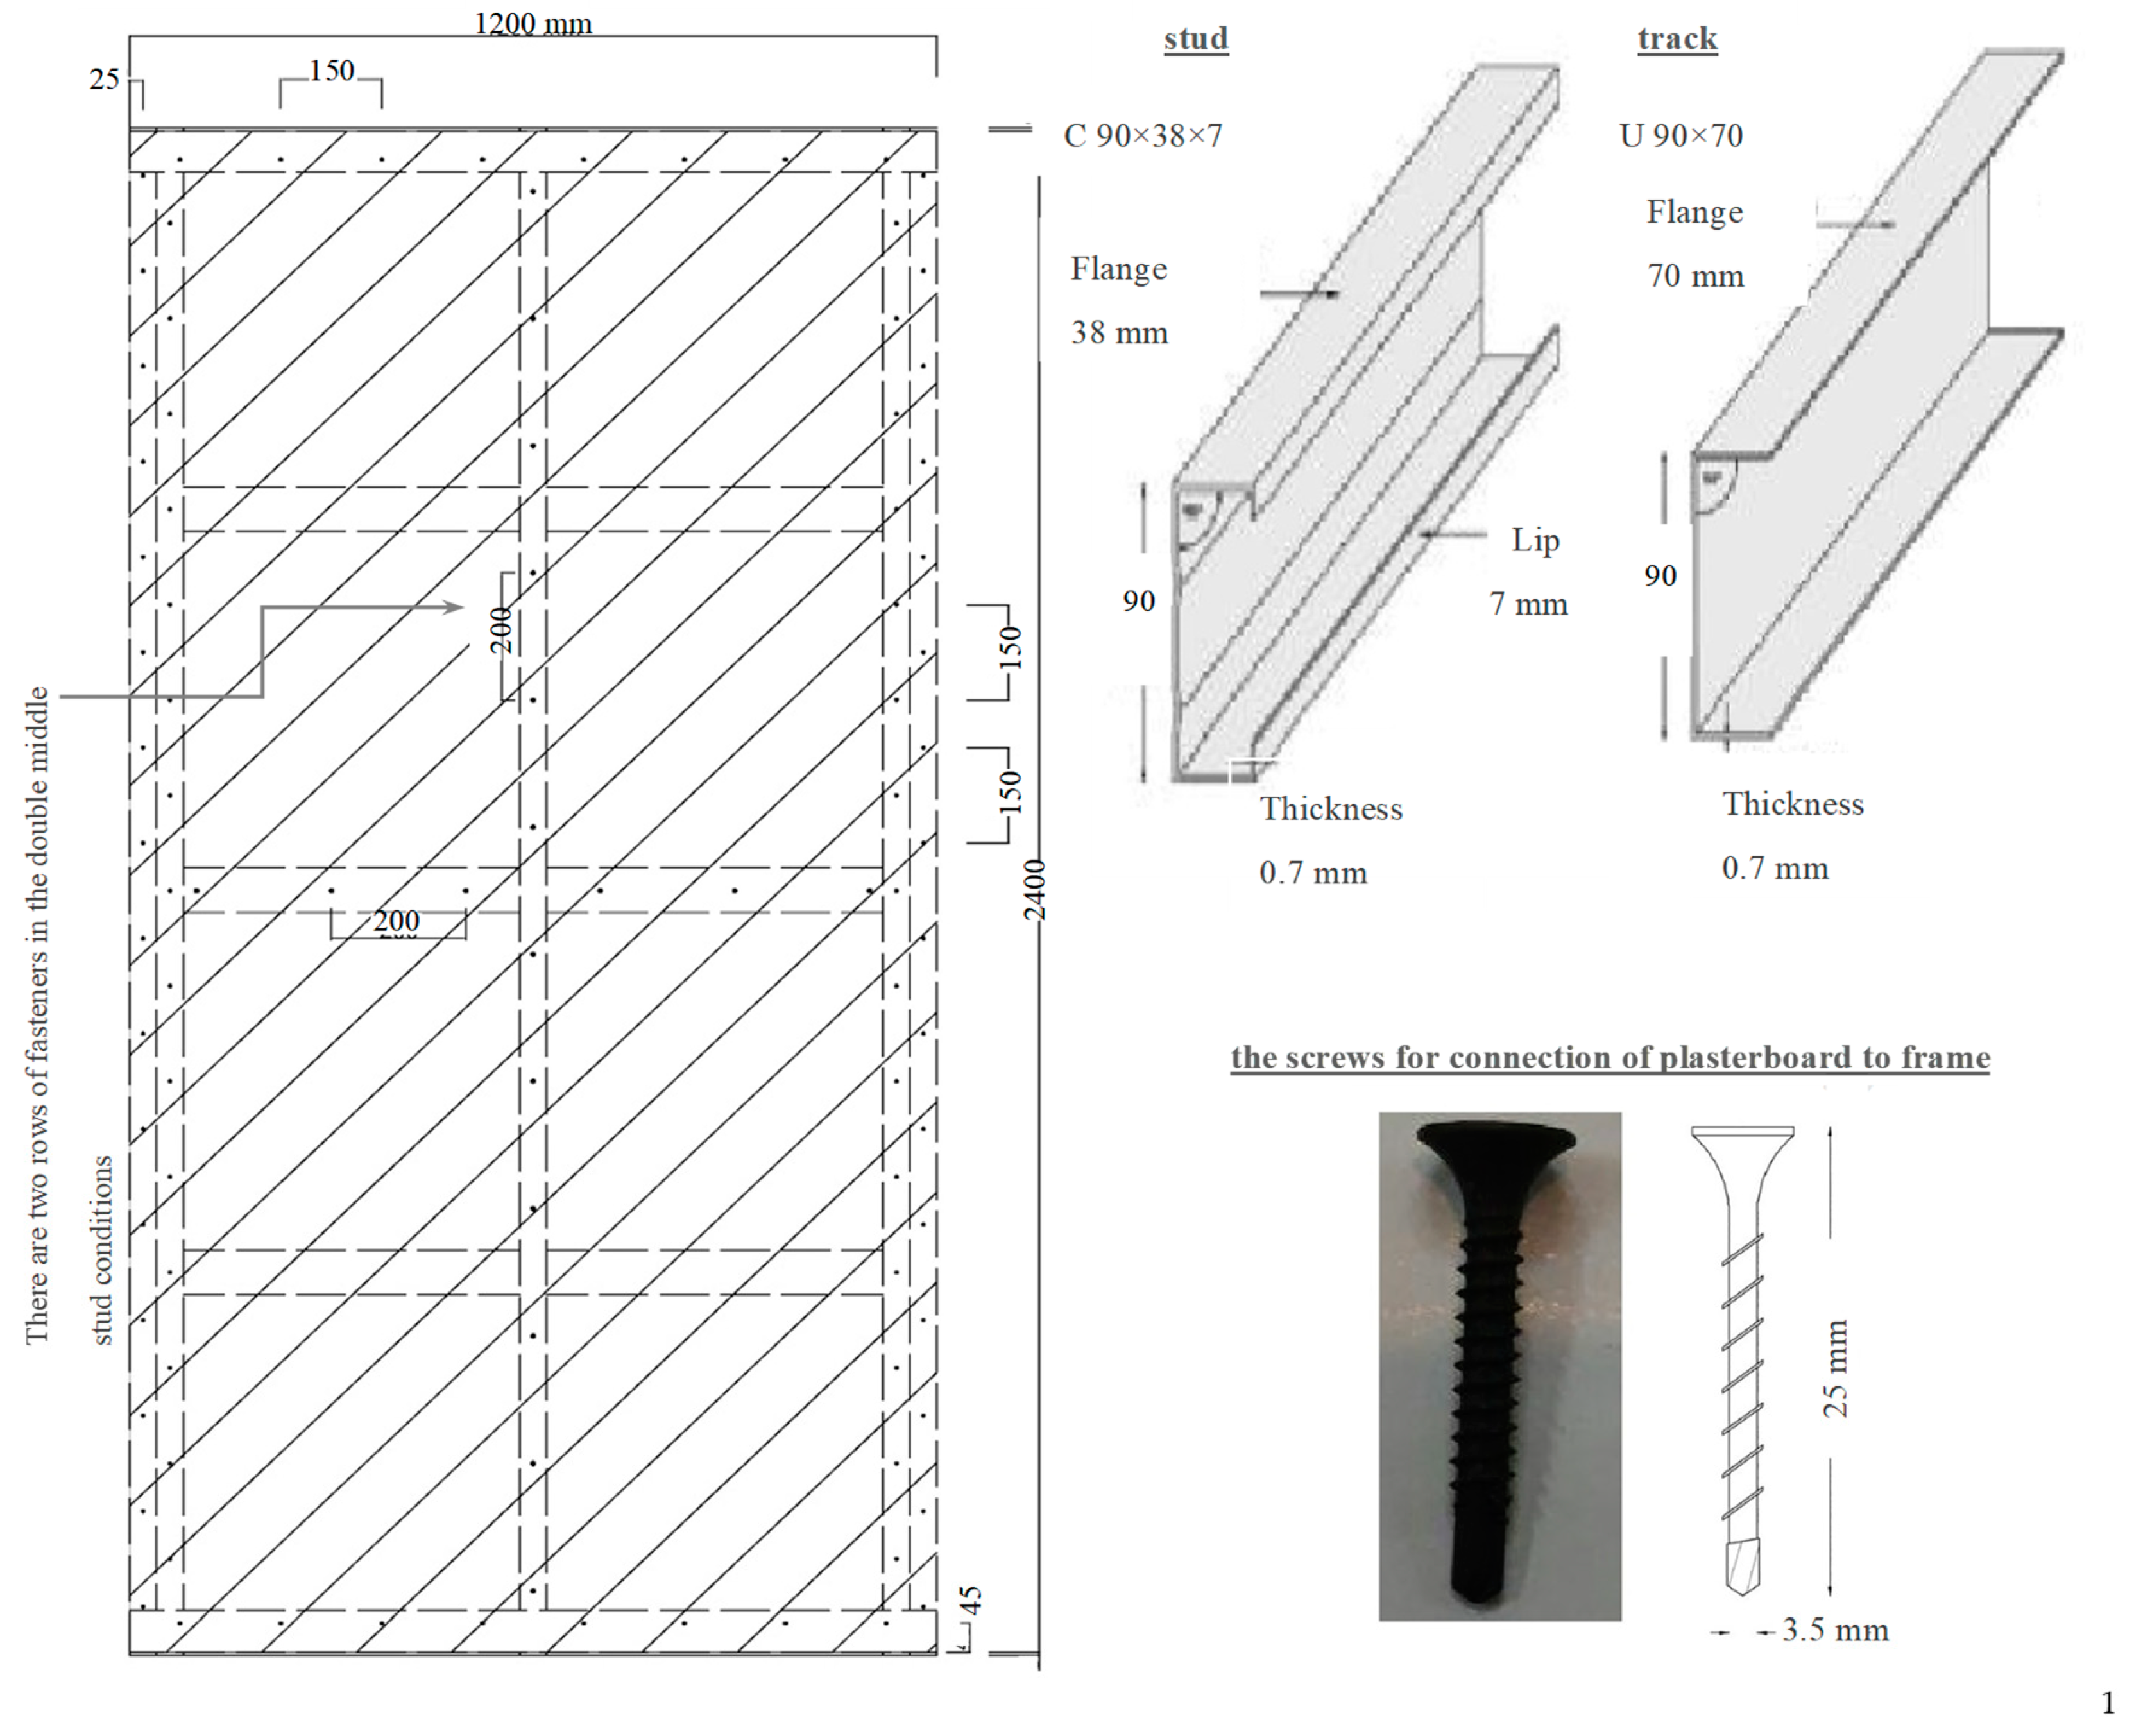
Figure 7.
Flat strap connections to struts and studs.
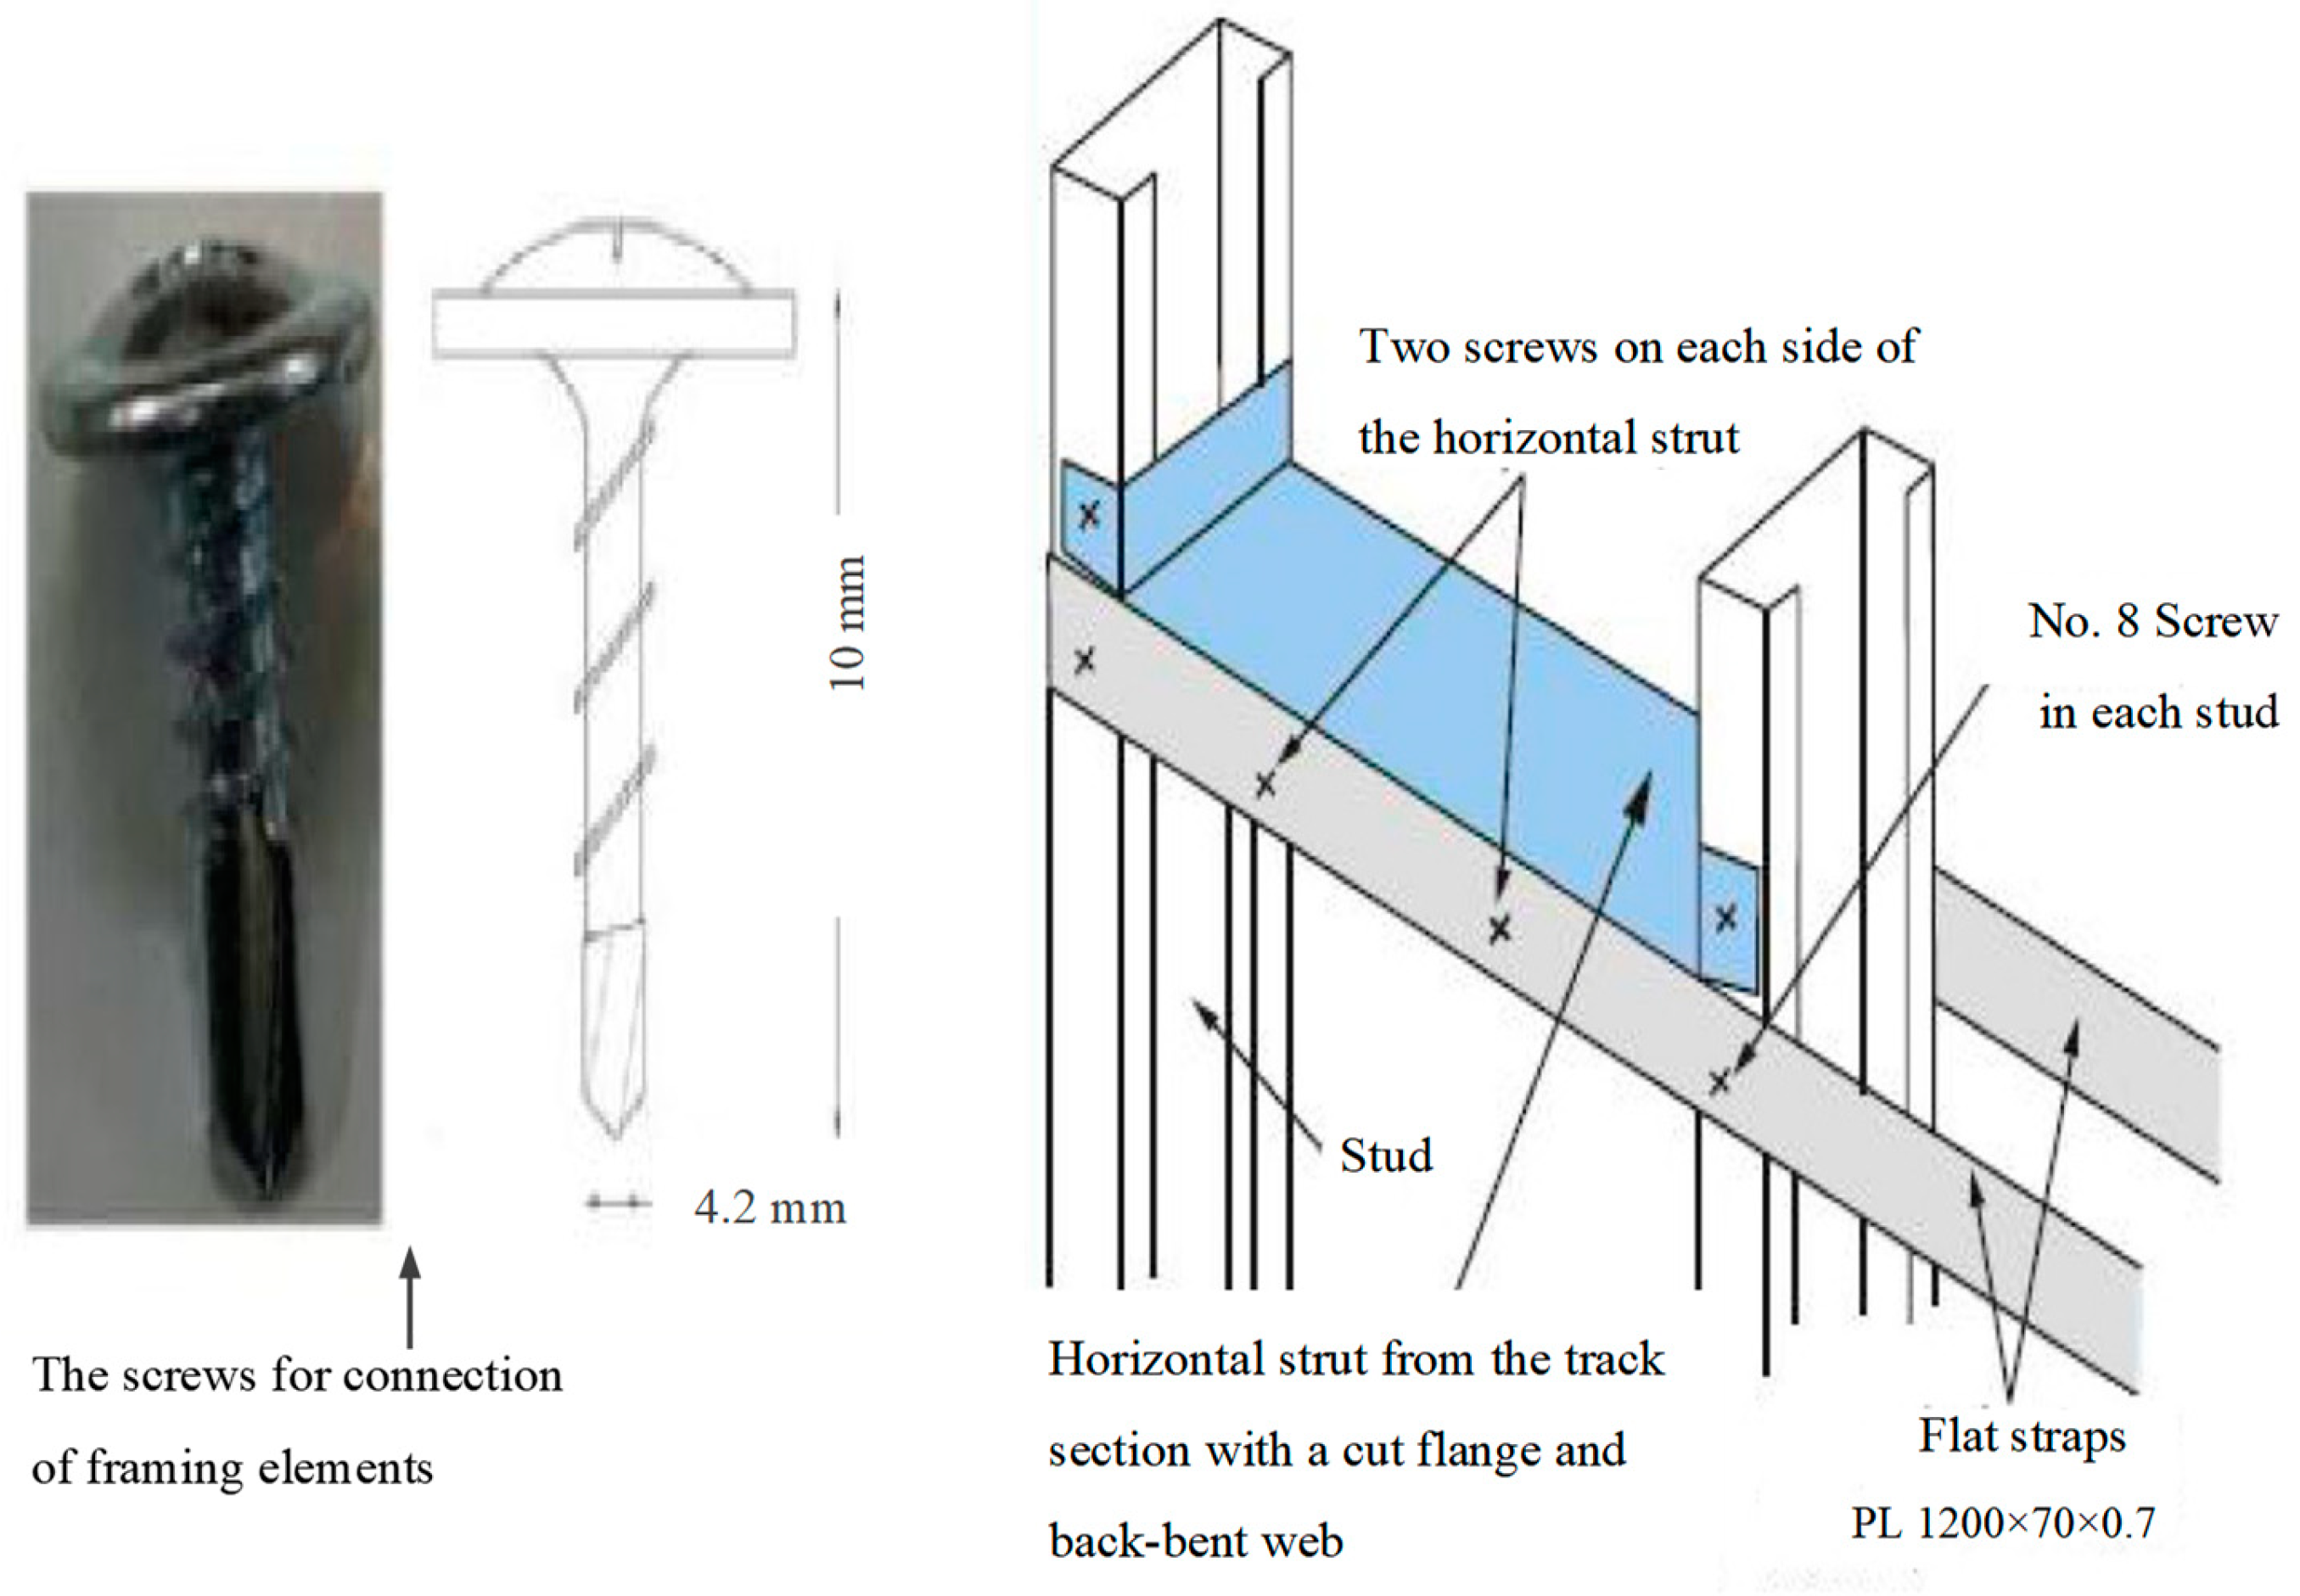
Figure 8.
Failure mode illustrations.
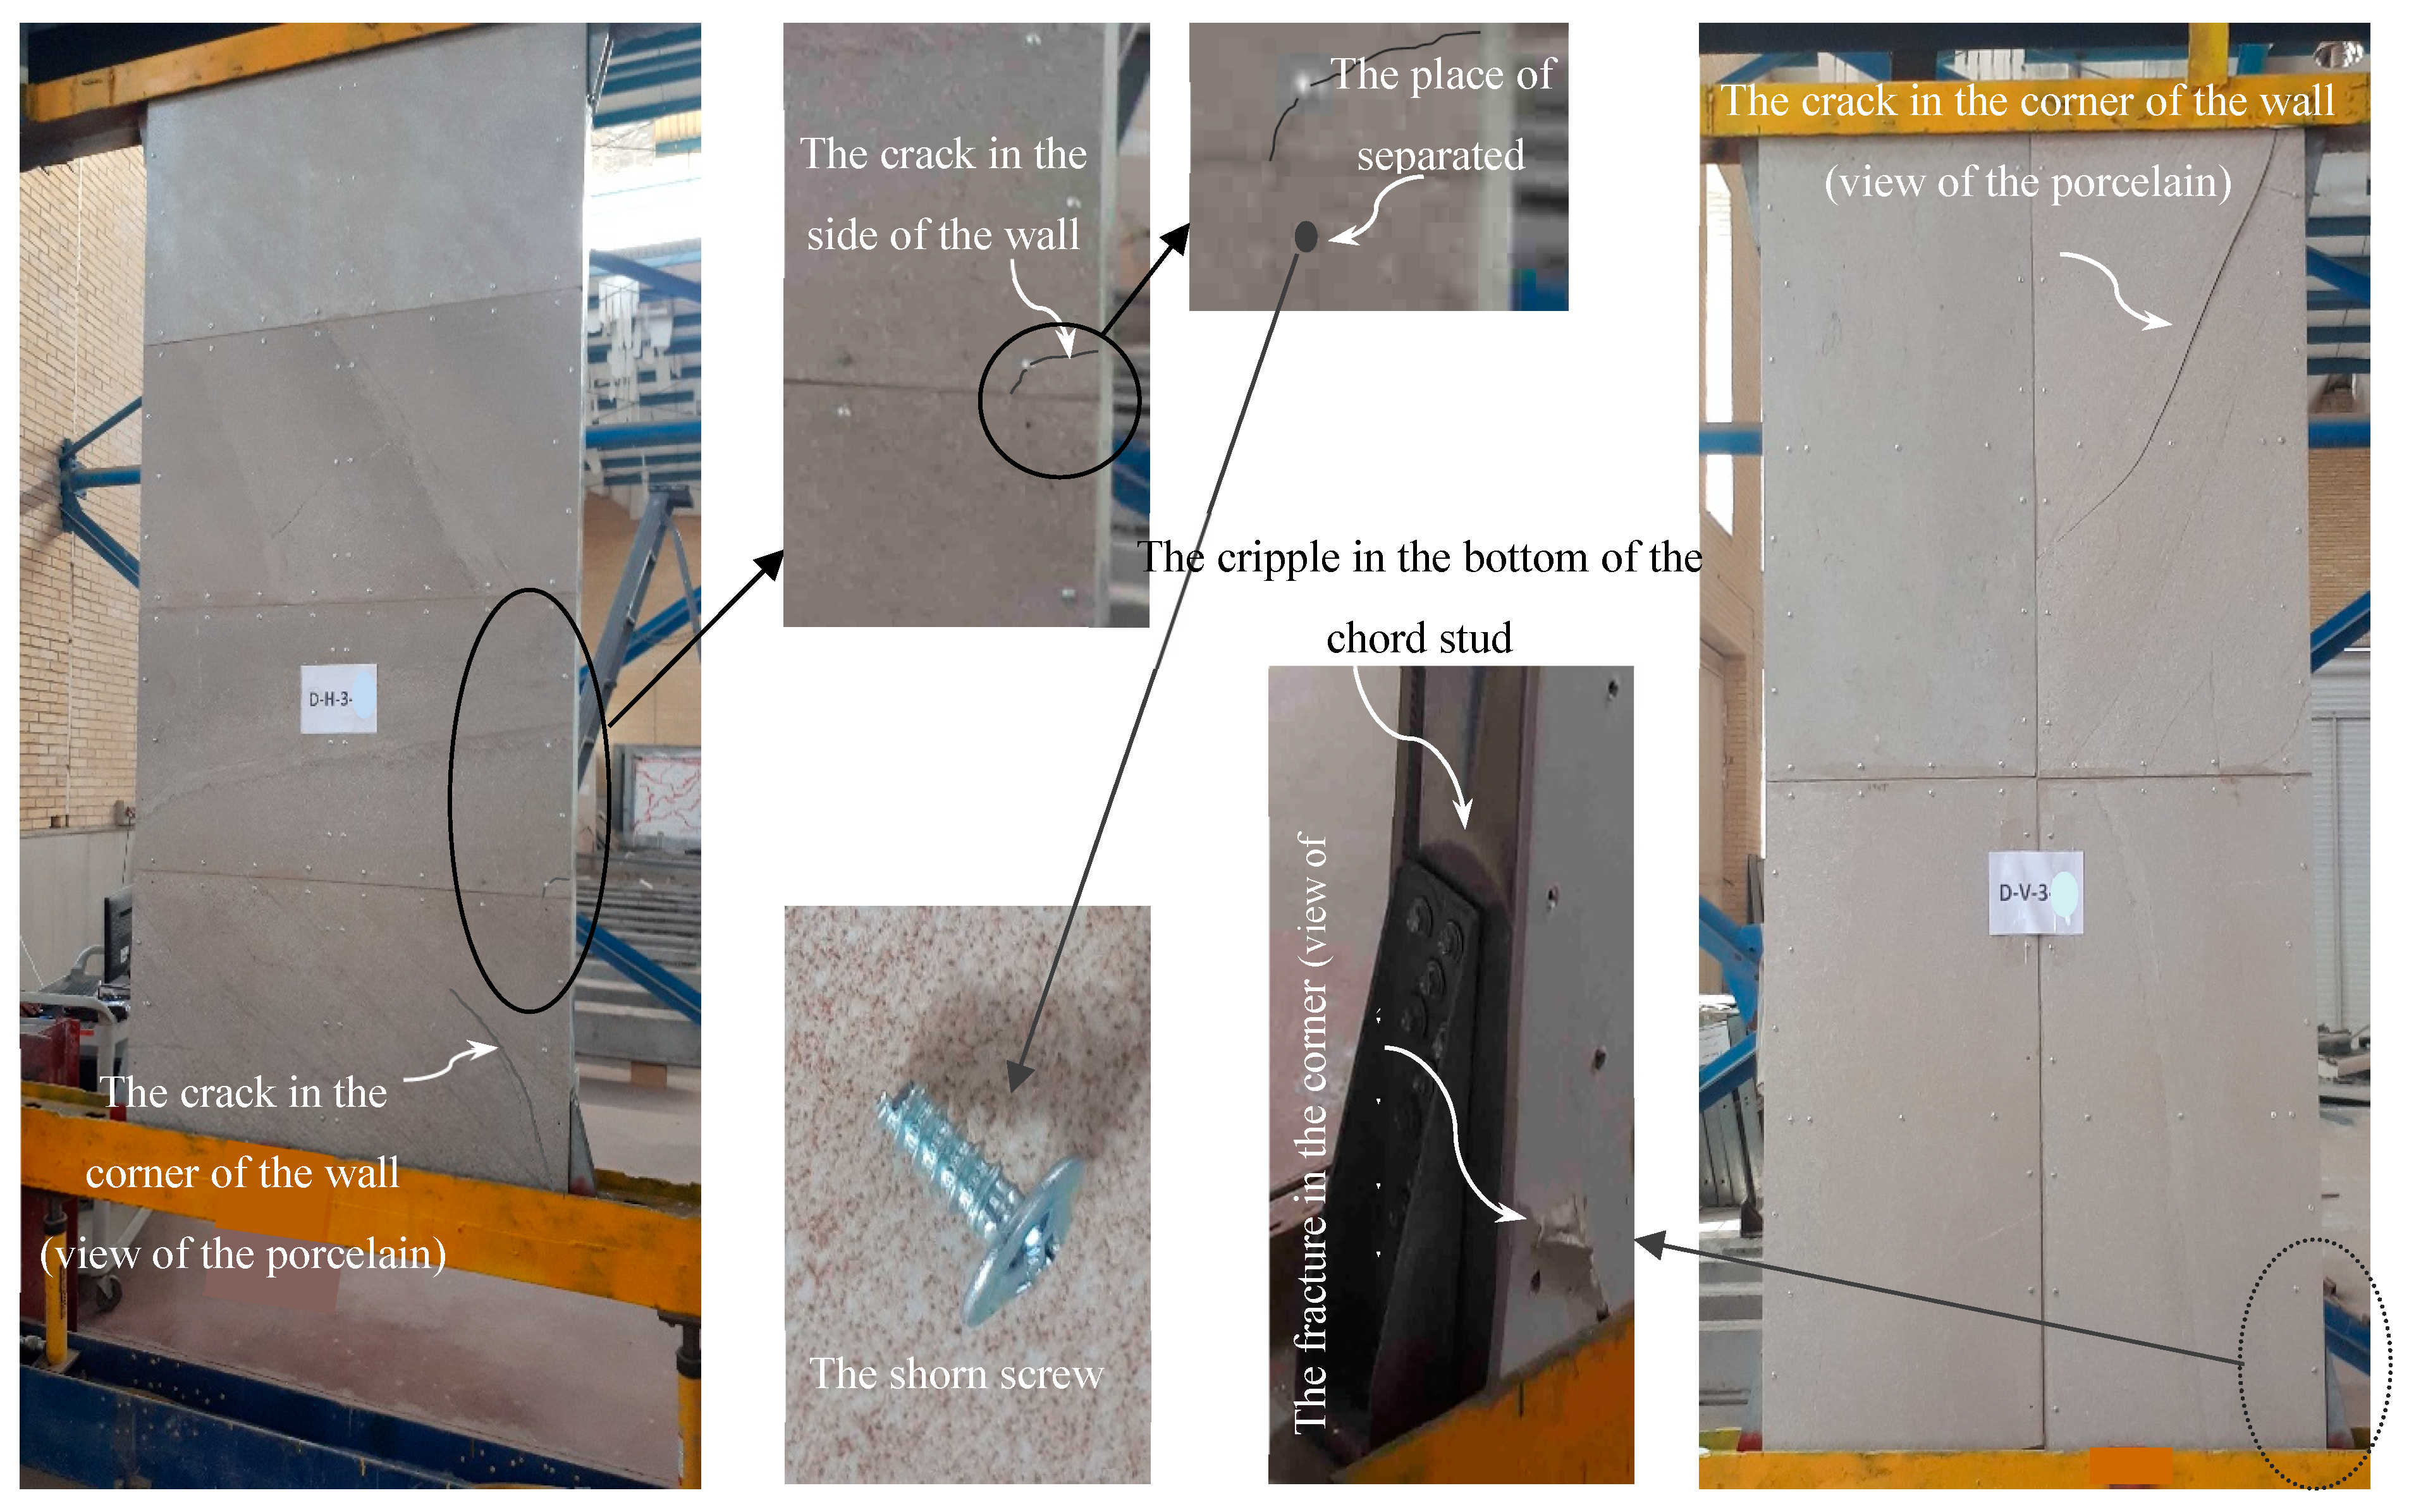
Damage severity was comparable among specimens but marginally higher in S-H-3, likely due to its single middle stud. Plasterboard damage showed minimal sensitivity to configuration changes, whereas porcelain damage decreased by ≥25% when switching from a single to double middle stud. Screw failures in porcelain sheathing (Table 4) were influenced by three factors: middle stud count, sheathing strip orientation, and blocking row quantity. Although some screw heads sheared off, no structural instability occurred, confirming adequate fastener redundancy. Specimen D-H-3 exhibited the highest lateral resistance (21.1 kN) and drift (2.5%).
5.2. Assessment of Seismic Parameters and Discussion
Hysteretic cycles and envelope curves (Figure 9 and Figure 10) were derived from load-displacement data to assess specimen behavior. Energy dissipation per loading step (Table 5) was computed by summing the areas enclosed within the corresponding hysteresis loops.
Significant energy dissipation began at Step 6 (Figure 11), with initial yielding at the end of Step 5 (12 mm). Consequently, the specimens remained elastic below operational earthquake limits (0.005H). The base shear at this threshold could serve as the design strength (). However, to refine the determination of , this study defined it as the base shear at which the actual response curve deviated by 0.005 from the idealized bilinear curve along the displacement axis. The corresponding displacement at this point was designated as.
Figure 12 compares actual and idealized structural responses. Table 6 illustrates calculation of response modification factors. Table 7 summarizes the energy dissipation (E), ductility factor, ultimate strength (Vmax), lateral displacement magnification ratio (Cd), and other seismic parameters.
The computed R-factors for the SPS-CFS system ranged from 4.0 to 4.4, averaging 4.2. This suggests that the R=3 value recommended by codes like AISI S213 and FEMA is acceptable yet conservative, whereas AS4600’s R=2 is overly restrictive. Notably, specimen D-V-3 displayed the lowest Vmax and ∆t despite not having the smallest R.
Horizontal sheath strip demonstrated higher ultimate strength compared to vertical ones. According to Figure 12, specimen D-H-3 maintained stiffness and strength up to the 60 mm (0.025H), outperforming D-V-3 and D-V-1 in seismic performance metrics (stiffness, strength, and energy dissipation).
The double-section middle stud CFS wall with horizontal sheathing exhibited superior lateral performance. This advantage stems from the high stiffness of horizontal sheath components and their distributed stress across tracks and blocking, reducing localized damage. In contrast, vertical sheathing concentrated stress at wall corners, leading to premature failure.
Figure 10.
Hysteretic envelope curve.


Table 6.
Response modification factors.
| Specimen | Direction |
Vy (kN) |
∆y (mm) |
∆t (mm) |
Vs (kN) |
∆s (mm) |
µ | Rd | Ω0 | R | Cd=∆t/∆s |
Vmax (kN) |
|---|---|---|---|---|---|---|---|---|---|---|---|---|
| + | 12.9 | 14.2 | 60 | 8.1 | 9.2 | 4.2 | 2.72 | 1.59 | 4.33 | 6.52 | 18.8 | |
| S-H-3 | Average | 4 | ||||||||||
| _ | 16.38 | 17.74 | 56.4 | 10.28 | 11.4 | 3.18 | 2.3 | 1.59 | 3.66 | 4.95 | 21.2 | |
| + | 17.11 | 26.8 | 60 | 10.6 | 16.88 | 2.2 | 1.9 | 1.61 | 3.1 | 3.55 | 21.5 | |
| D-H-3 | Average | 4.1 | ||||||||||
| _ | 12.05 | 10.67 | 60 | 7.53 | 6.95 | 5.6 | 3.2 | 1.6 | 5.1 | 8.63 | 20.7 | |
| + | 12.6 | 11 | 48 | 7.87 | 7.14 | 4.4 | 2.8 | 1.6 | 4.5 | 6.72 | 16.9 | |
| D-V-3 | Average | 4.1 | ||||||||||
| _ | 12 | 14.4 | 48 | 7.7 | 9.5 | 3.33 | 2.4 | 1.56 | 3.7 | 5.05 | 17.9 | |
| + | 18.2 | 22.12 | 54 | 11.2 | 13.8 | 2.44 | 1.97 | 1.63 | 3.2 | 3.91 | 22 | |
| D-V-1 | Average | 4.4 | ||||||||||
| _ | 8 | 6.7 | 48 | 5.2 | 4.6 | 7.16 | 3.65 | 1.54 | 5.6 | 10.43 | 17.6 |
Table 7.
Key seismic characteristics of specimens.
| Specimen |
Vy (kN) |
Vmax (kN) |
E* (joule) |
∆t/H (%) |
Cd | µ | Ω0 | R |
|---|---|---|---|---|---|---|---|---|
| S-H-3 | 14.6 | 20 | 8658 | 2.4 | 5.7 | 3.7 | 1.6 | 4 |
| D-H-3 | 8.2 | 21.1 | 9990 | 2.5 | 6.1 | 3.9 | 1.6 | 4.1 |
| D-V-3 | 12.1 | 17.4 | 6932 | 2 | 5.9 | 3.9 | 1.6 | 4.1 |
| D-V-1 | 13.3 | 19.8 | 8294 | 2.1 | 7.2 | 4.8 | 1.6 | 4.4 |
| Average | 12.1 | 19.6 | 8469 | 2.3 | 6.2 | 4.1 | 1.6 | 4.2 |
*Cumulative energy dissipation.
Figure 11.
Energy dissipation trends.
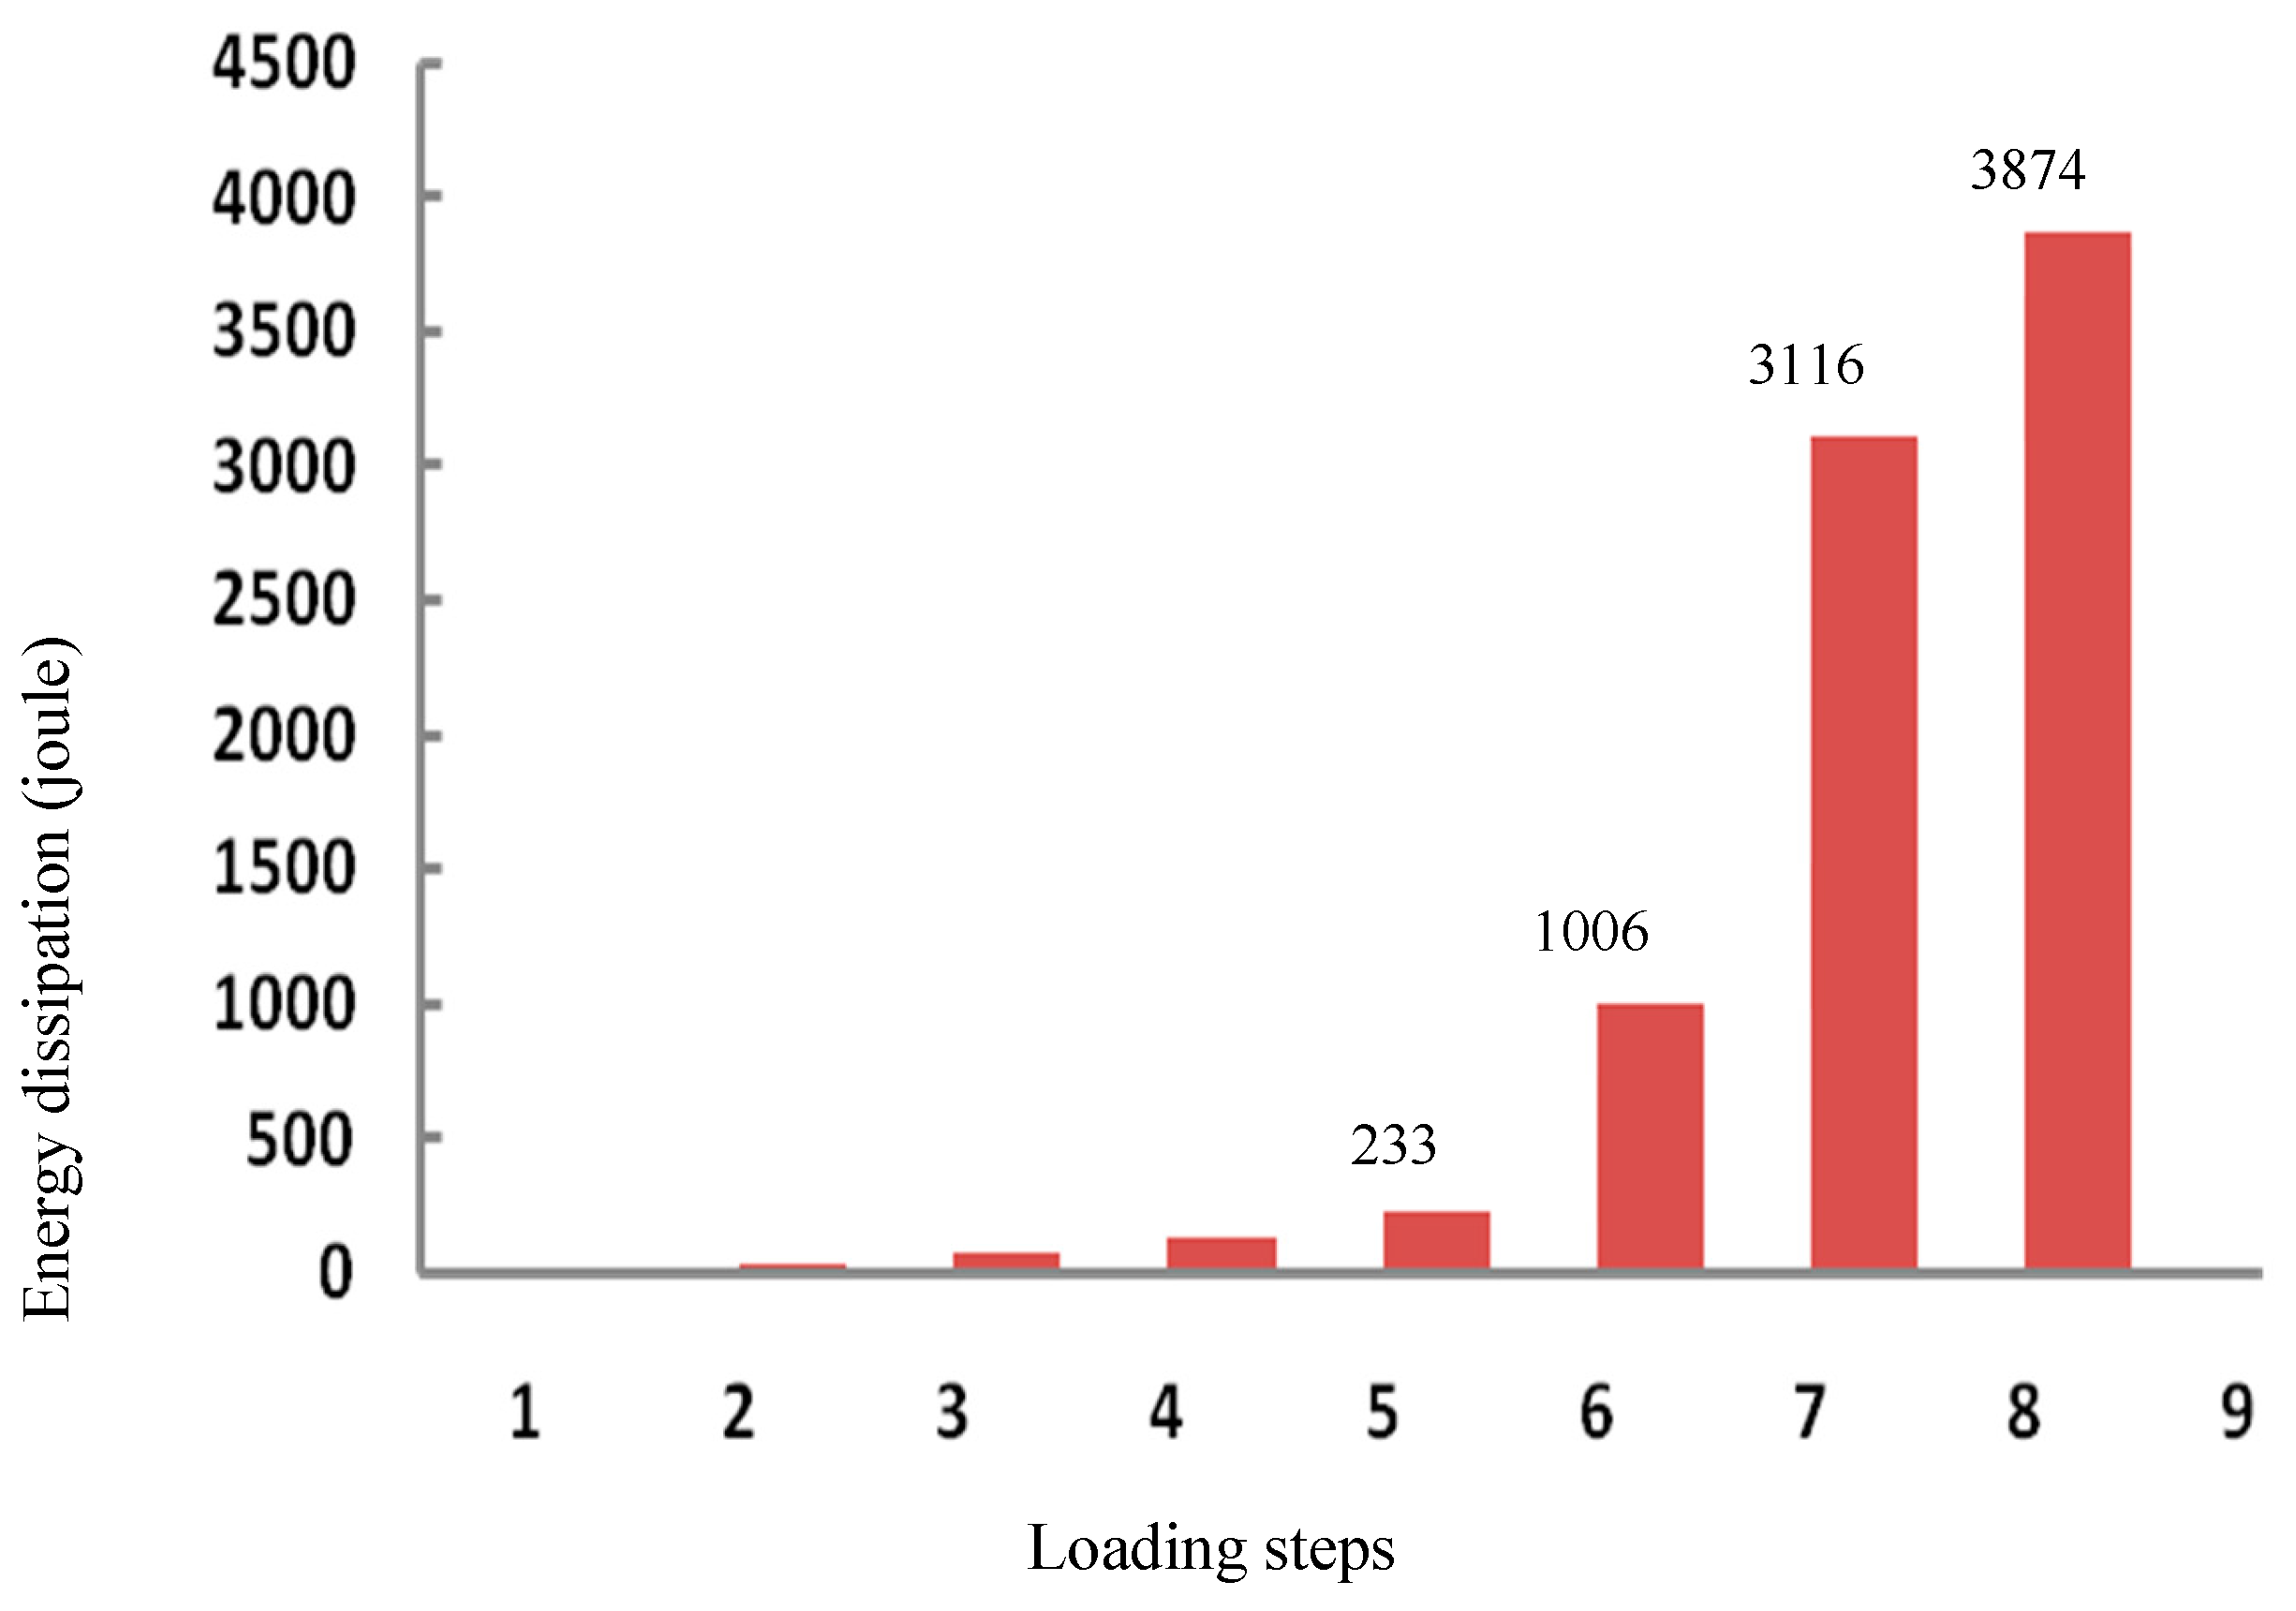
Figure 12.
Idealized vs. actual structural response (FEMA method).
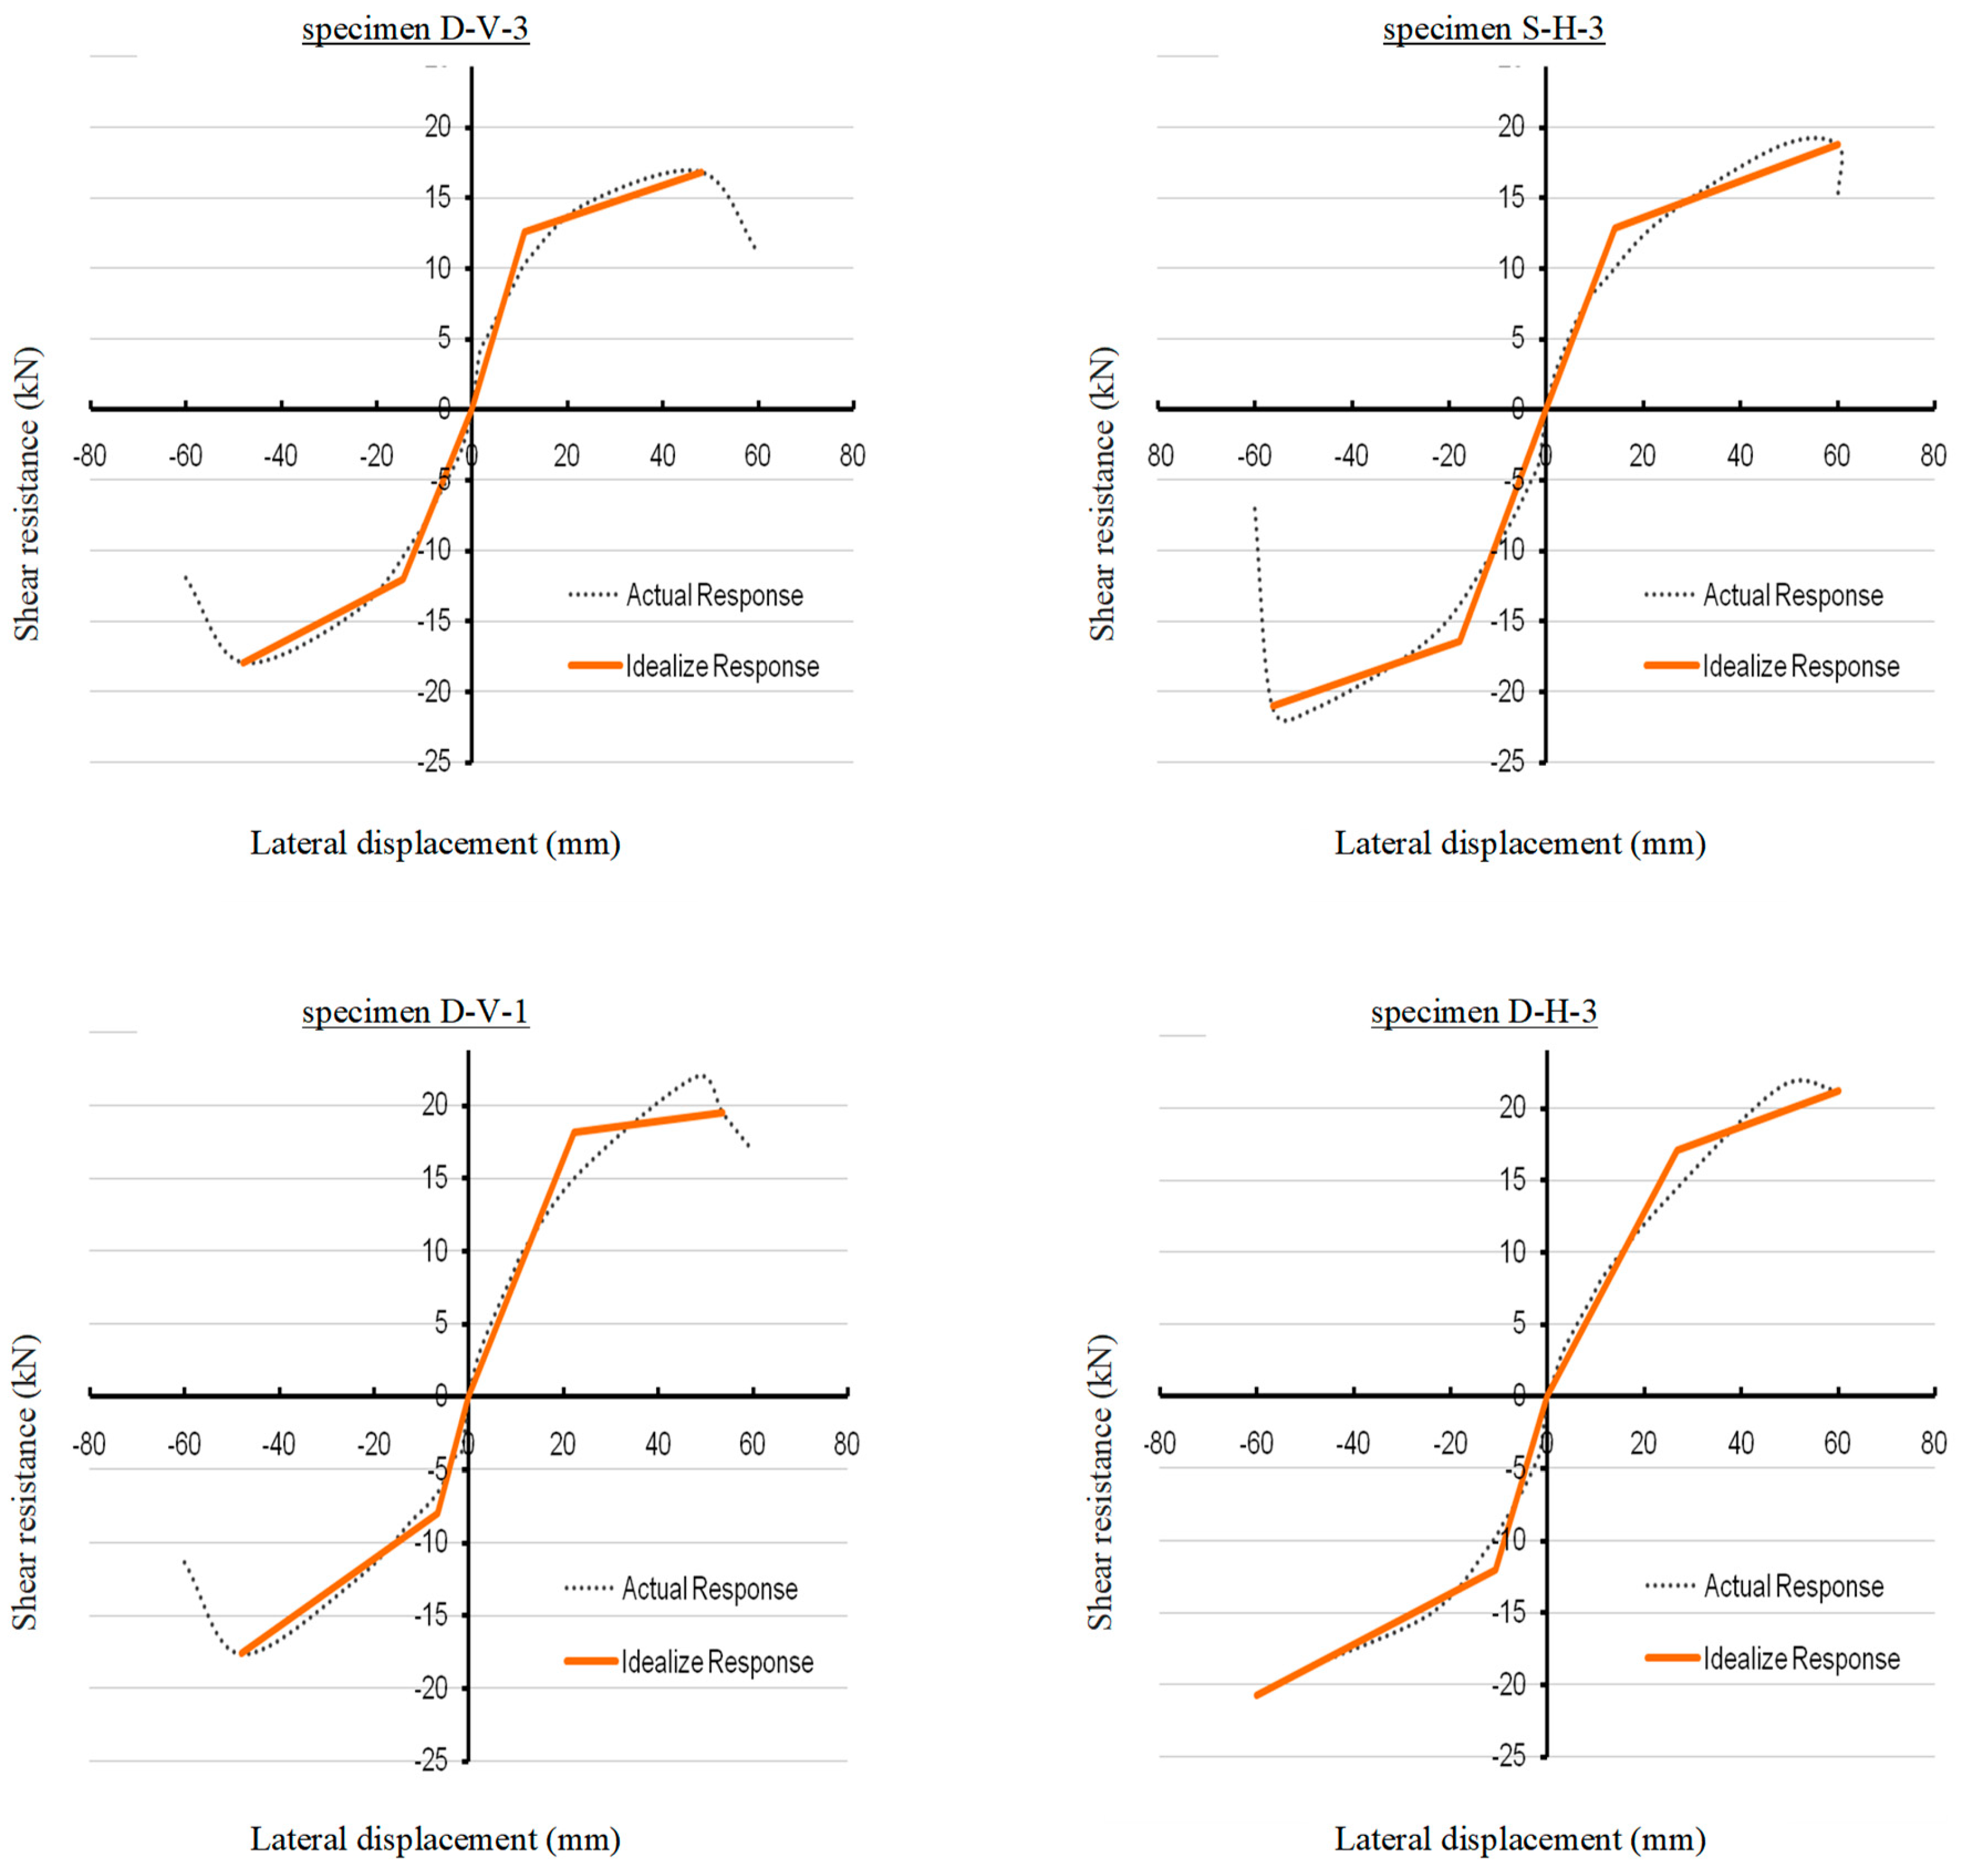
Table 8.
The ratio of Cd to R and related parameters.
| Specimen | Cd | Cd/R | Ω0.R |
|---|---|---|---|
| S-H-3 | 5.7 | 1.4 | 6.4 |
| D-H-3 | 6.1 | 1.5 | 6.6 |
| D-V-3 | 5.9 | 1.4 | 6.6 |
| D-V-1 | 7.2 | 1.6 | 7 |
| Average | 6.2 | 1.5 | 6.7 |
Figure 13, Figure 14, Figure 15 and correlate key parameters. A strong direct relationship exists between R-factor and Cd (Figure 13 and Figure 16). As per Table 7 and Table 8, the Cd/R ratios averaged 1.5, approximating 0.94 times the average as Eq. (7).
Per seismic codes, the maximum elastic displacement ∆e at operational levels must not exceed 0.005H. To prevent damage, the displacement at first yield ∆s should exceed this limit. Given ∆s=12 mm, the maximum permissible height (Hmax) was calculated as 2.4 m. If premature failure is mitigated through reinforcements (like using CFS plates thicker than 0.7 mm, high-strength screws, and porcelain in place of plasterboard), Hmax could reach 9.6 m (48/0.005 based on ∆sf=48 mm in Table 4). Comparatively, other sheathing materials (e.g., GWB, fiber-cement) yield lower Hmax values (e.g., 7.2 m per Iranian Standard 612 [12]).
6. Conclusions and Recommendations
Porcelain sheaths in LSF systems exhibit notable enhancements in seismic performance. The principal insights and guidelines from this study are summarized below:
- Role of Middle Stud Quantity on Lateral Performance:
A comparison of specimens S-H-3 and D-H-3 reveals the significance of middle stud count. The response modification factor (R-factor) rose from 4 (single middle stud) to 4.1 (double middle stud), marking a 3% improvement. The ductility factor (μ) also increased slightly from 3.7 to 3.9, reflecting a marginal 5% gain.
- 2.
- Effect of Sheath Strip Orientation:
Analysis of specimens D-V-3 (vertical strips) and D-H-3 (horizontal strips) demonstrates that strip direction does not influence seismic performance. Both configurations yielded identical R-factors (4.1) and ductility values (μ=3.9), indicating no measurable impact on seismic response modification or ductility.
- 3.
- Impact of Additional Blockings:
Comparing specimens D-V-1 (single middle blocking) and D-V-3 (three spaced blockings) highlights a reduction in performance with added blockings. The R-factor dropped from 4.4 to 4.1 (7% decrease), while ductility (μ) declined from 4.8 to 3.9 (19% reduction).
- 4.
- Average R-Factor and Shear Strength Trends:
The average R-factor across specimens was 4.2, suggesting that code-recommended R-factors (2–3) are conservative. The ultimate shear strength averaged 19.6 kN, with vertical sheath strips and additional blockings significantly reducing shear capacity.
- 5.
- Relationship between R-Factor and magnification ratio (Cd):
A strong linear correlation was observed (Cd=1.5R), offering actionable insights for seismic design strategies.
- 6.
- Design Recommendations:
For structures using porcelain sheaths, walls exceeding 2.4 m in height may experience seismic damage under operational loads. To mitigate this, use CFS plates thicker than 0.7 mm, employ high-strength screws, and replace plasterboards with robust alternatives. These adjustments would prevent premature failure, enabling porcelain sheaths to extend the maximum allowable height of SPS shear walls to 9.6 m—a 33% increase over Iranian Standard limits (7.2 m).
6.1. Future Research Directions
- Examine long-term durability and performance under diverse environmental exposures.
- Assess alternative sheath materials and configurations.
- Validate results through field studies and real-world applications to bolster reliability.
6.2. Limitations
Key constraints include:
- Findings are based on controlled laboratory tests, which may not fully replicate on-site conditions.
- Real-world outcomes may vary due to material inconsistencies and construction practices.
Abbreviations
The following abbreviations are used in this manuscript:
| LSF | Lightweight steel frame |
| CFS | Cold-formed steel |
| SPS | Screwed porcelain sheath |
| GWB | Gypsum wall board |
| BMB | Bolivian magnesium board |
| CSB | Calcium silicate board |
| OSB | Oriented strand board |
| FCB | Fiber cement board |
| HLFC | High-strength lightweight foamed concrete |
| LVDT | Linear variable displacement transducer |
References
- Maizi, S.E.; Hadidane, Y.; Dar, M.A. Flexural design of cold-formed steel built-up sections failing by local buckling: Development of generalized direct strength method. Eng. Struct. 2024, vol. 308, p. 117967. [CrossRef]
- Ran, X.; Shi, Y.; Yao, X.; Zeng, L. Seismic performance of cold-formed steel centre-sheathed shear wall: Simulation and theoretical prediction. J. Constr. Steel Res. 2024, vol. 213, p. 108372. [CrossRef]
- Ran, X.; Shi, Y. Seismic performance optimization and theoretical analysis towards resilient cold-formed steel shear wall. In Struct. 2024, Elsevier, p. 106584. [CrossRef]
- Wang, K.; Wang, Y.H.; Gao, Y.; Zhou, X.H.; Tan, J.K.; Qi, H. Lateral behavior of steel plate shear wall with cold-formed steel strips reinforcing door opening. Thin-Walled Struct. 2023, vol. 190, p. 110981.
- Gad, E.F.; Duffield, C.F.; Hutchinson, G. L.; Mansell, D.S.; Stark, G. Lateral performance of cold-formed steel-framed domestic structures. Eng. Struct. 1999, vol. 21, no. 1, pp. 83–95.
- Zhang, L.; Xu, L.; Ziemian, R.D.; Ziemian, C. Solid blocking effect on lateral bracing requirements for cold-formed steel wall studs. Thin-Walled Struct. 2024, vol. 203, p. 112208.
- Esmaeili-Tafti, M.A.; Javaheri-Tafti, M.R.; Fallah, A.A. Investigation of mortar size on the cyclic behavior of a brick shear wall in a cold-formed steel frame using experimental studies. Asas J. 2021, vol. 23, no. 63, pp. 30–44.
- Sharafi, P.; Mortazavi, M.; Usefi, N.; Kildashti, K.; Ronagh, H.R.; Samali, B. Lateral force resisting systems in lightweight steel frames: Recent research advances. Thin-Walled Struct. 2018, vol. 130, pp. 231–253.
- Usefi, N.; Sharafi, P.; Ronagh, H.R. Numerical models for lateral behavior analysis of cold-formed steel framed walls: State of the art, evaluation and challenges. Thin-Walled Struct. 2019 vol. 138, pp. 252–285.
- American I. and S. Institute. AISI S400: North American standard for seismic design of cold-formed steel structural systems, Washington: DC, 2015.
- Zhang, W.; Xu, X.; Liu, Y.; Yu, C.; Liu, X.; Xie, Z. High-strength cold-formed steel framed shear wall with steel sheet sheathing. Thin-Walled Struct. 2021, vol. 162, p. 107584.
- Building and Housing Research Center. Cold-formed light steel structures design and construction code 612 (structural); BHCR, Tehran, 2013.
- Pan, C.L.; Shan, M.Y. Monotonic shear tests of cold-formed steel wall frames with sheathing. Thin-Walled Struct. 2011, vol. 49, no. 2, pp. 363–370.
- Baran, E.; Alica, C. Behavior of cold-formed steel wall panels under monotonic horizontal loading. J. Constr. Steel Res. 2012, vol. 79, pp. 1–8.
- Swensen, S.; Deierlein, G.G.; Miranda, E. Behavior of screw and adhesive connections to gypsum wallboard in wood and cold-formed steel-framed wallettes. J. Struct. Eng. 2016, vol. 142, no. 4, p. 4015002. [CrossRef]
- Mohebbi, S.; Mirghaderi, R.; Farahbod, F.; Sabbagh, A.B. Experiment work on single and double-sided steel sheathed cold-formed steel shear walls for seismic actions. Thin-Walled Struct. 2015, vol. 91, pp. 50–62. [CrossRef]
- Niari, S.E.; Rafezy, B.; Abedi, K. Seismic behavior of steel sheathed cold-formed steel shear wall: experimental investigation and numerical modeling. Thin-Walled Struct. 2015, vol. 96, pp. 337–347.
- Javaheri-Tafti, M.R.; Ronagh, H.R.; Behnamfar, F.; Memarzadeh, P. An experimental investigation on the seismic behavior of cold-formed steel walls sheathed by thin steel plates. Thin-Walled Struct. 2014, vol. 80, pp. 66–79.
- Zhang, W.; Mahdavian, M.; Li, Y.; Yu, C. Experiments and simulations of cold-formed steel wall assemblies using corrugated steel sheathing subjected to shear and gravity loads. J. Struct. Eng. 2017, vol. 143, no. 3, p. 04016193. [CrossRef]
- Zeynalian, M.; Ronagh, H. R. Seismic performance of cold formed steel walls sheathed by fibre-cement board panels. J. Constr. Steel Res. 2015, vol. 107, pp. 1–11.
- Xu, Z.; Chen, Z.; Osman, B.H.; Yang, S. Seismic performance of high-strength foamed concrete-filled cold-formed steel shear walls. J. Constr. Steel Res. 2018, vol. 143, pp. 148–161.
- Xu, Z.; Chen, Z.; Yang, S. Seismic behavior of cold-formed steel high-strength foamed concrete shear walls with straw boards. Thin-Walled Struct. 2018, vol. 124, pp. 350–365.
- American I. and S. Institute. AISI standard for cold-formed steel framing–lateral design, Washington: DC, 2004.
- AISI. Standard for cold-formed steel framing general provisions, Washington: DC, 2004.
- FEMA. FEMA 450: Recommended provisions for seismic regulations for new buildings and other structures, Washington: DC, 2003.
- FEMA. FEMA 750: Recommended Seismic Provisions for New Buildings and Other Structures, Washington: DC, 2009.
- TI809-07. Design of cold-formed load bearing steel systems and masonry veneer/steel stud walls, Washington: DC, 1998.
- AS/NZS 4600. Cold-formed steel structures, Australia, 2005.
- Uang, C.M. Establishing R (or Rw) and Cd factors for building seismic provisions. J. Struct. Eng. 1991, vol. 117, no. 1, pp. 19–28.
- Ayatollahi, S.R.; Usefi, N.; Ronagh, H.R.; Izadinia, M.; Javaheri, M.R. Performance of gypsum sheathed CFS panels under combined lateral and gravity loading. J. Constr. Steel Res. 2020, vol. 170, p. 106125.
- FEMA. FEMA 356: Prestandard and commentary for the seismic rehabilitation of buildings, Washington: DC, 2000.
- Nassar, A.A. Seismic demands for SDOF and MDOF systems, 1992.
- Miranda, E.; Bertero, V.V. Evaluation of strength reduction factors for earthquake-resistant design. Earthquake spectra 1994, vol. 10, no. 2, pp. 357–379.
- Newmark, N.M.; Hall, W.J. Earthquake spectra and design, 1982.
- Zeynalian, M.; Ronagh, H.R. An experimental investigation on the lateral behavior of knee-braced cold-formed steel shear walls. Thin-Walled Struct. 2012, vol. 51, pp. 64–75. [CrossRef]
- ASTM. Standard test methods for cyclic (reversed) load test for shear resistance of walls for buildings, 2005.
- Yu, w.w.; LaBoube, R.A.; Chen, H. Cold-formed steel design; John Wiley & Sons, 2019.
Figure 1.
General structural response, illustrating concepts of FEMA.
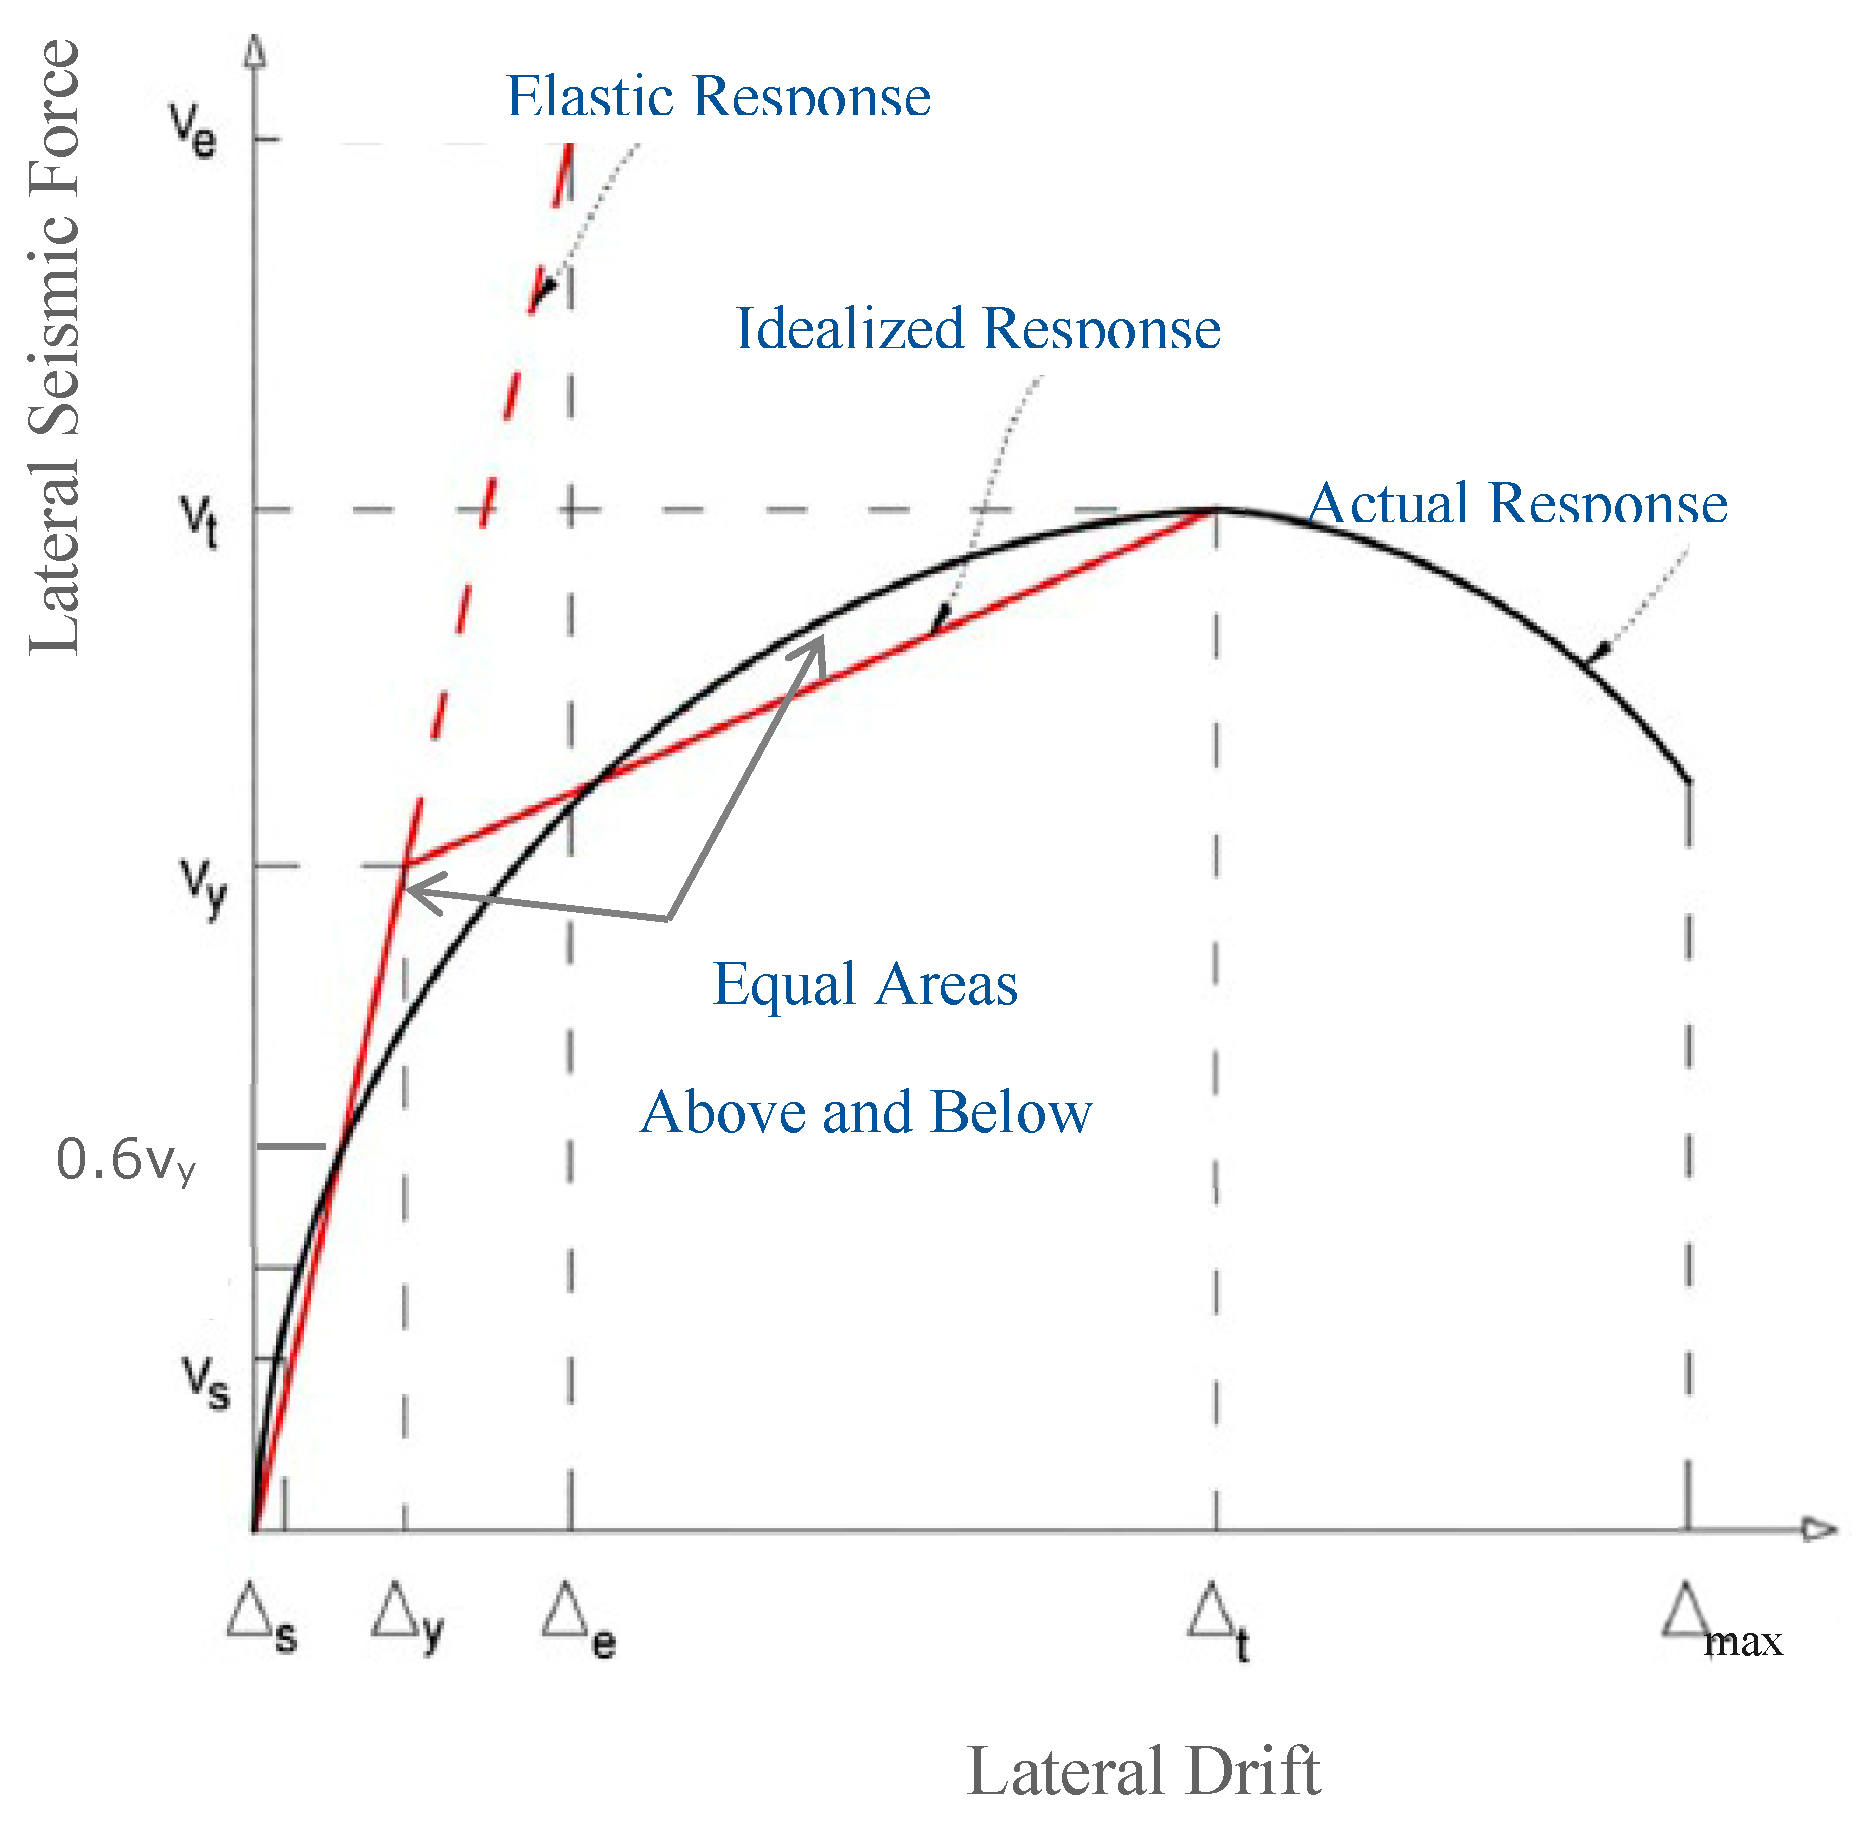
Figure 9.
Hysteretic cycles curve.
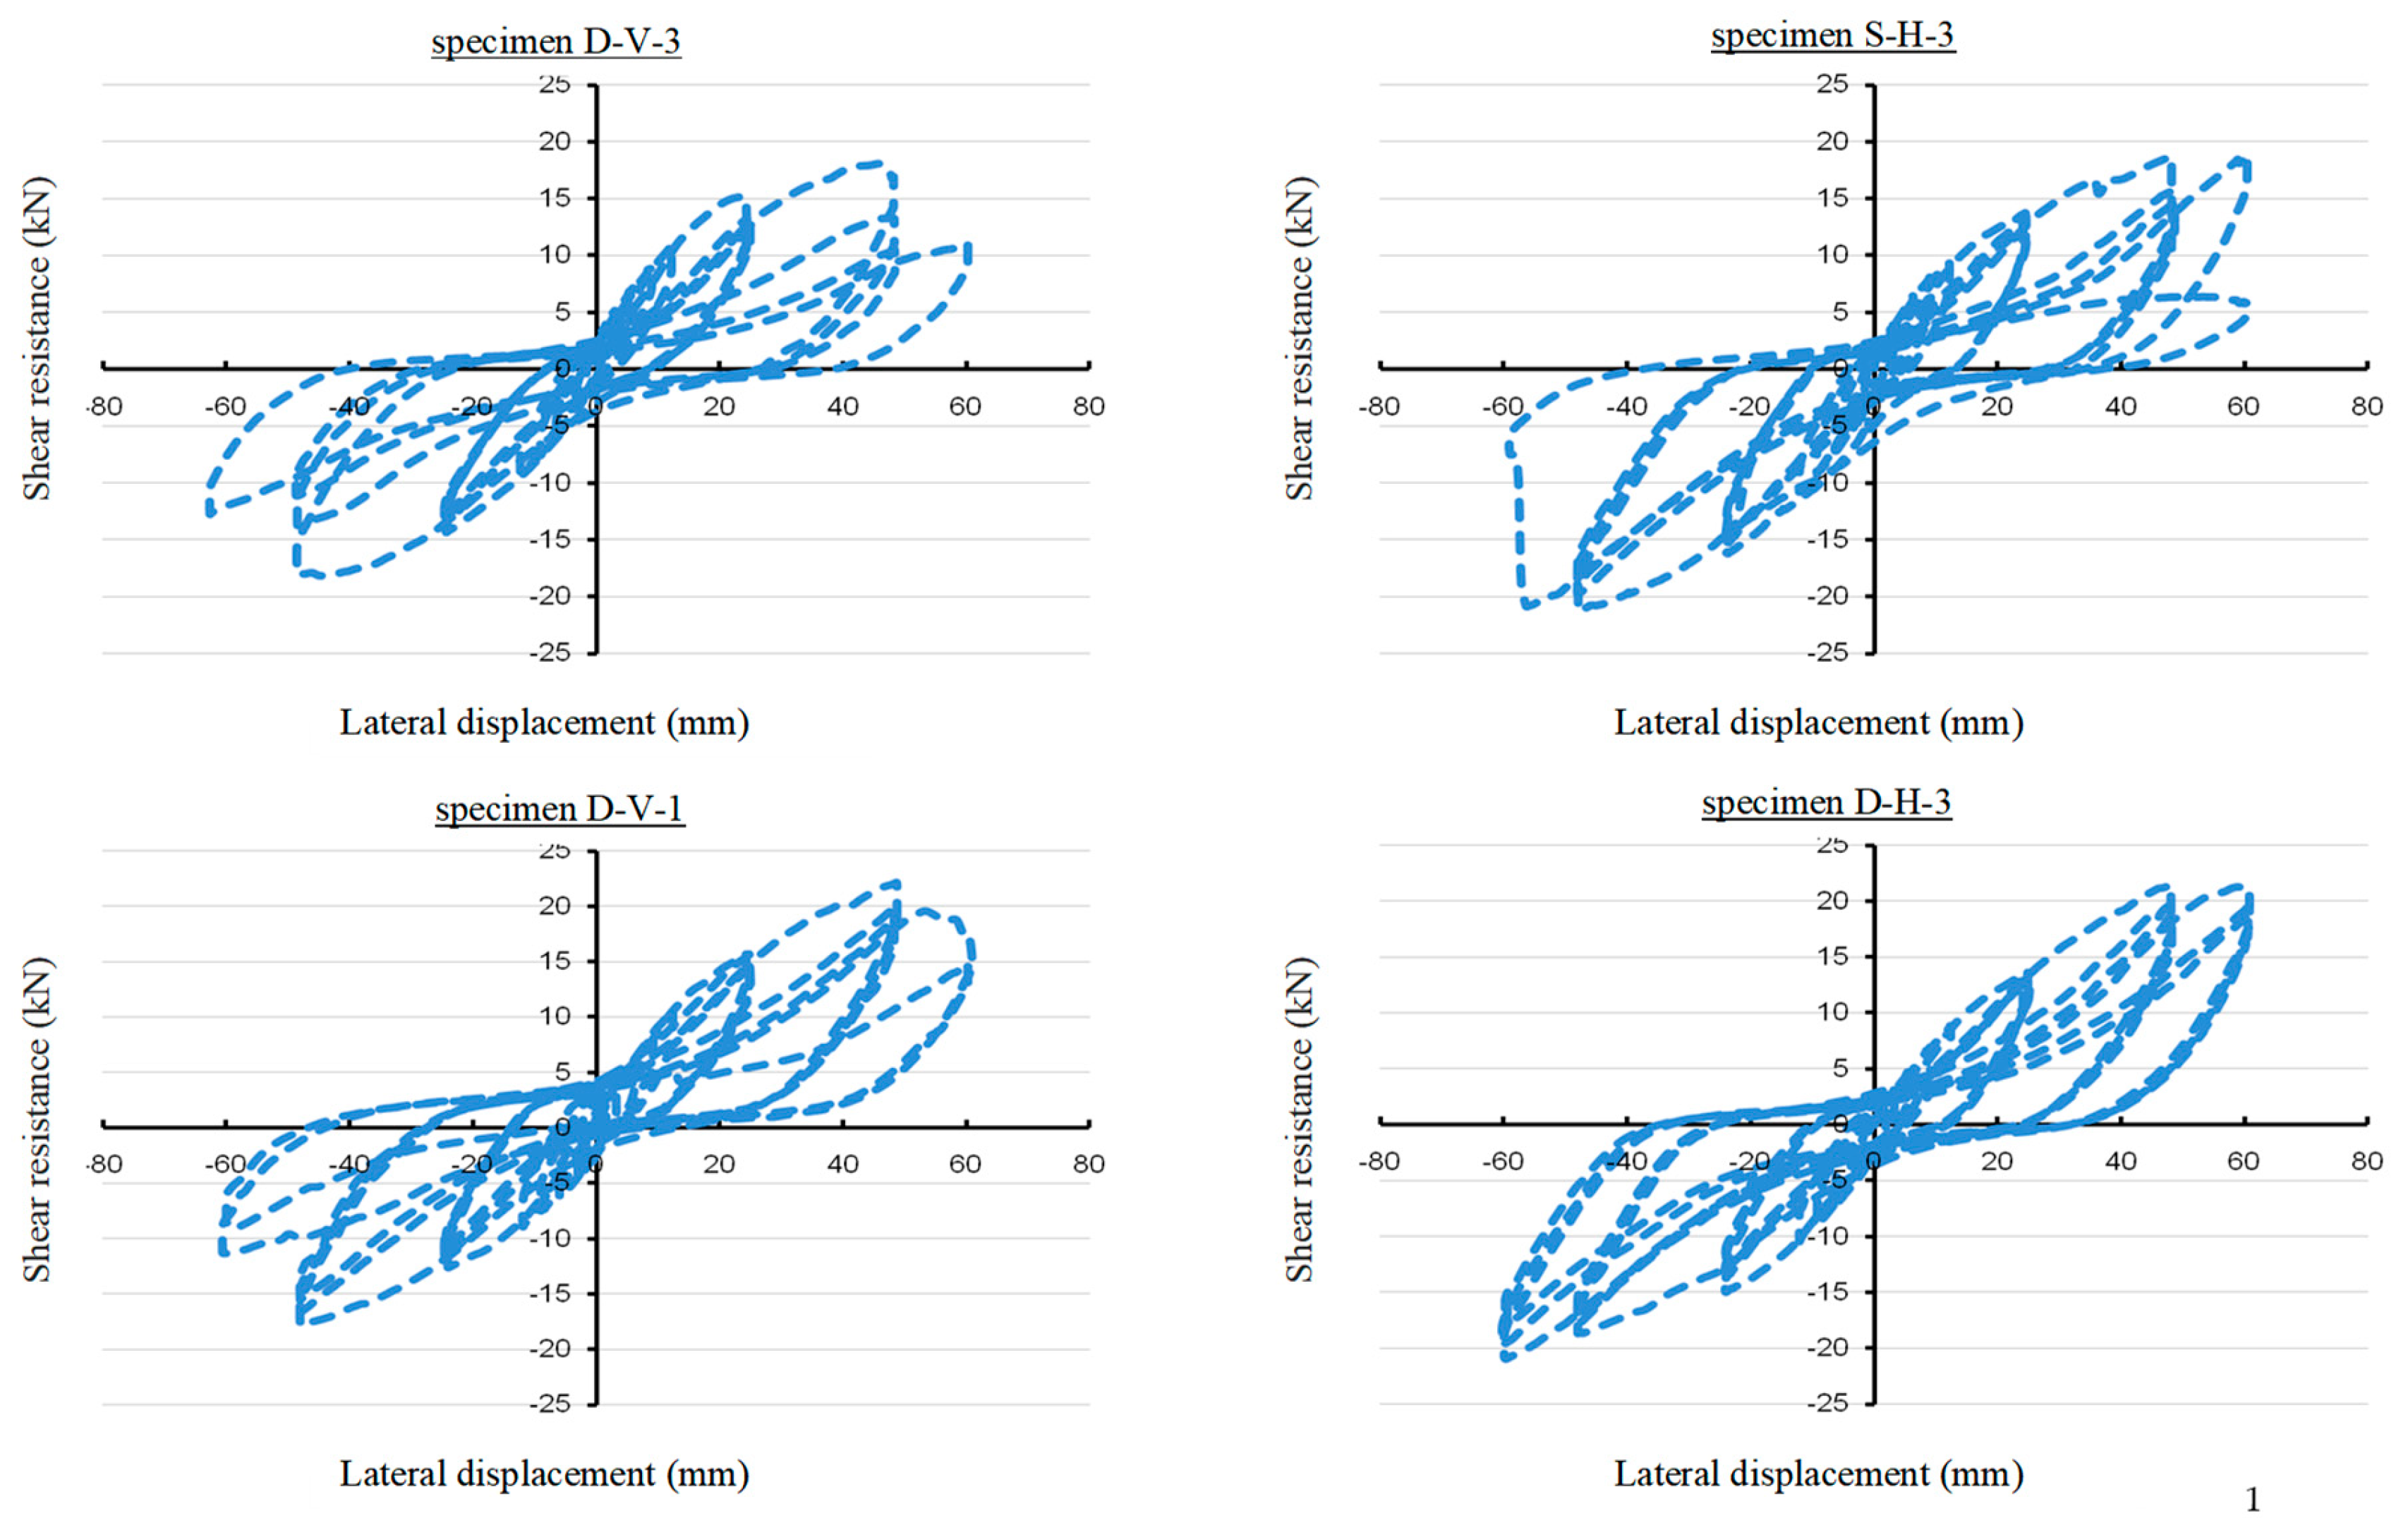
Figure 13.
Comparison of R-factors.
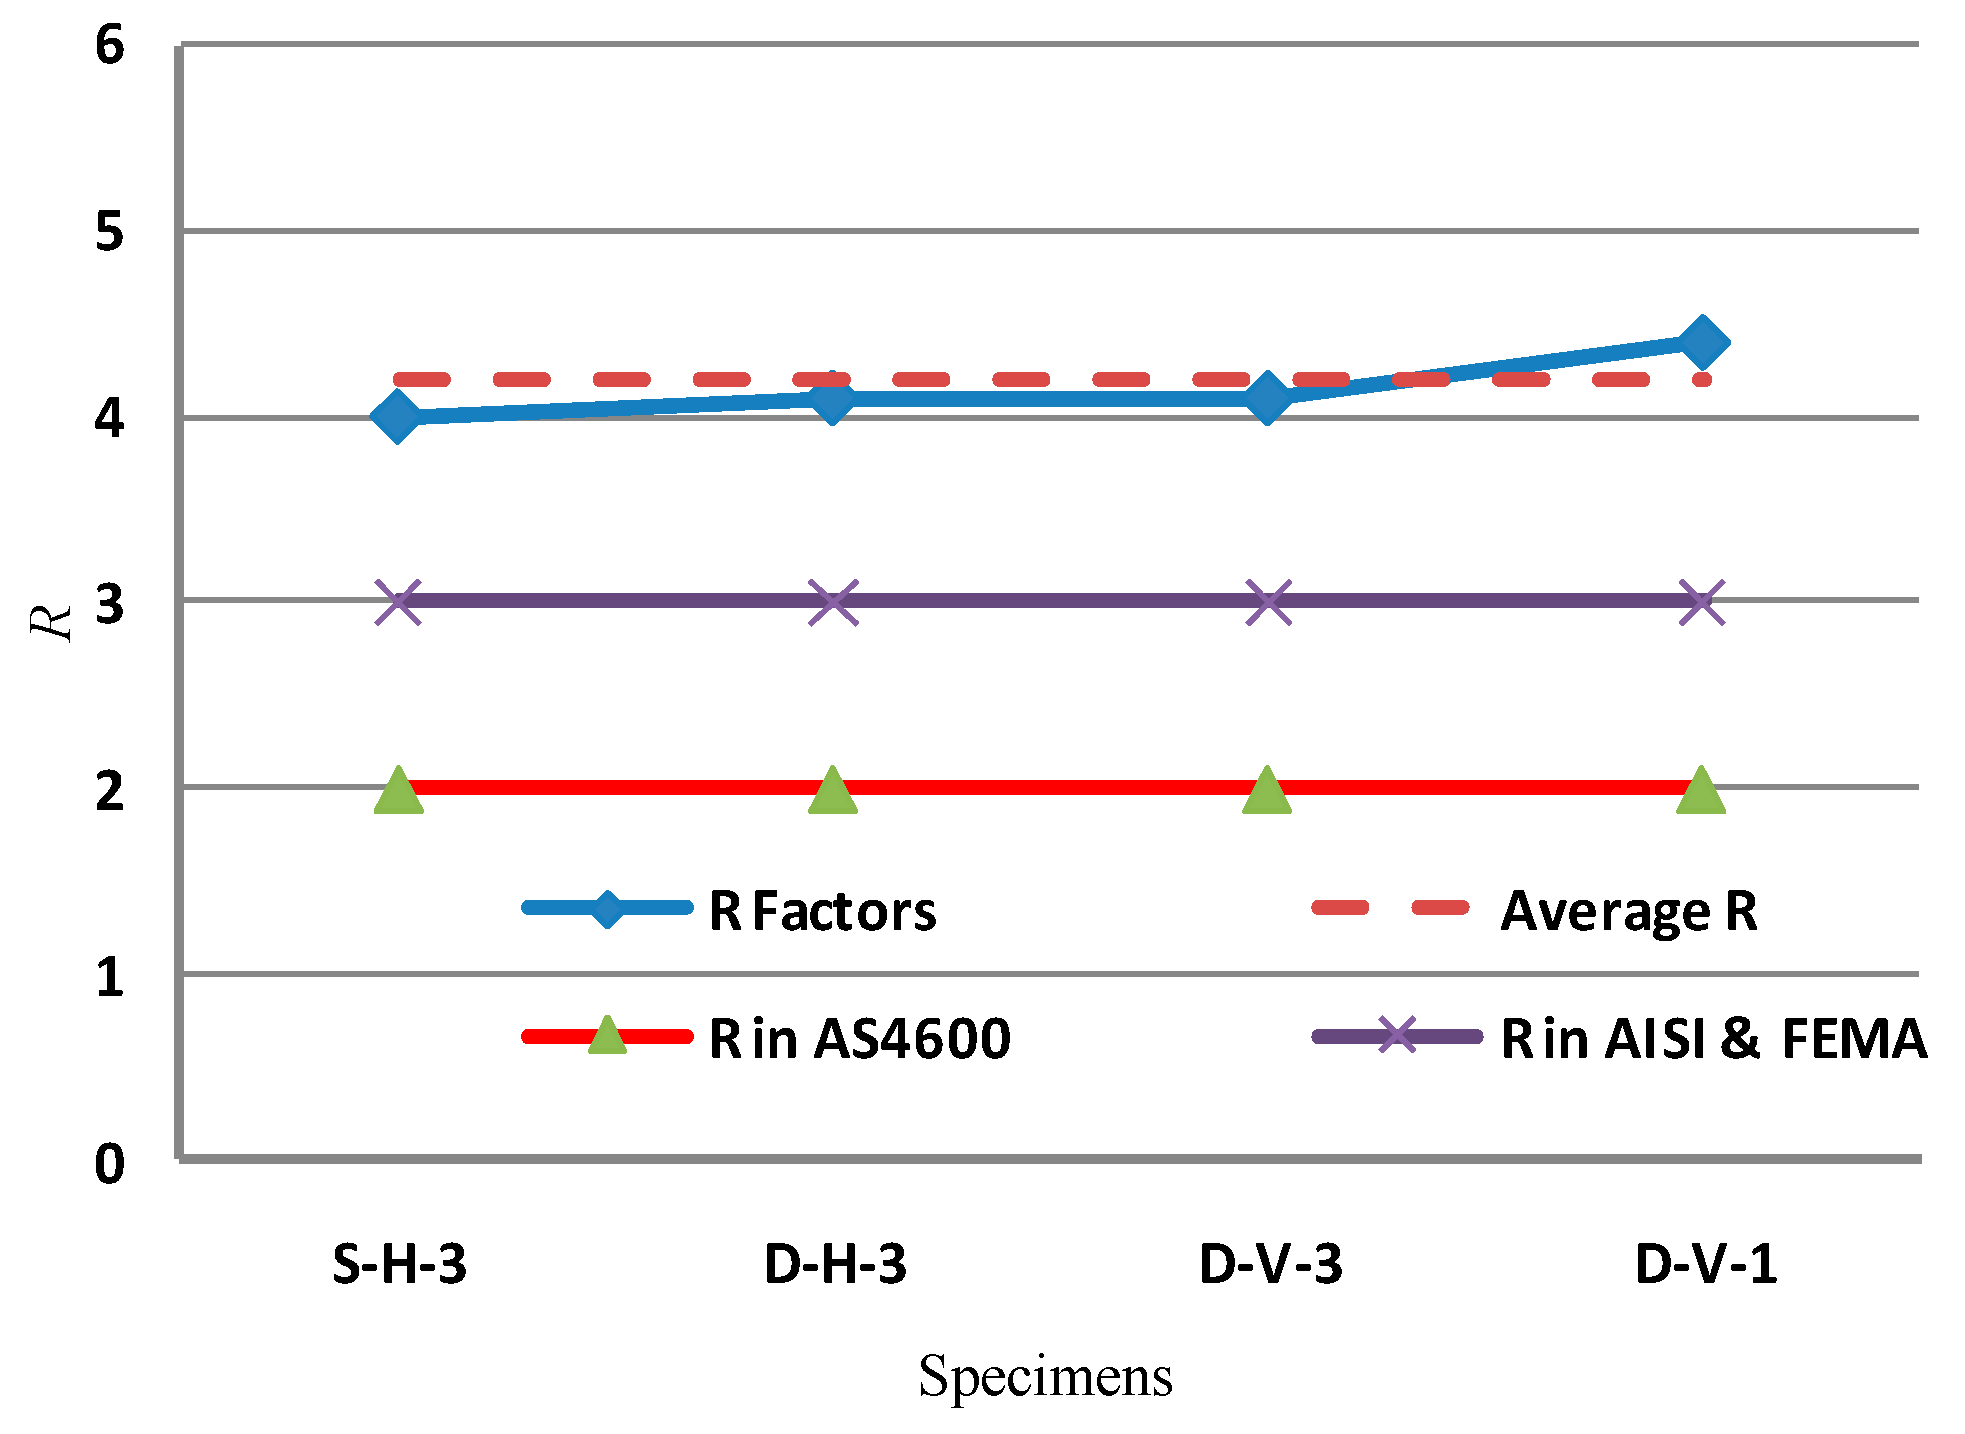
Figure 14.
Comparison of ultimate strength values (in kN).
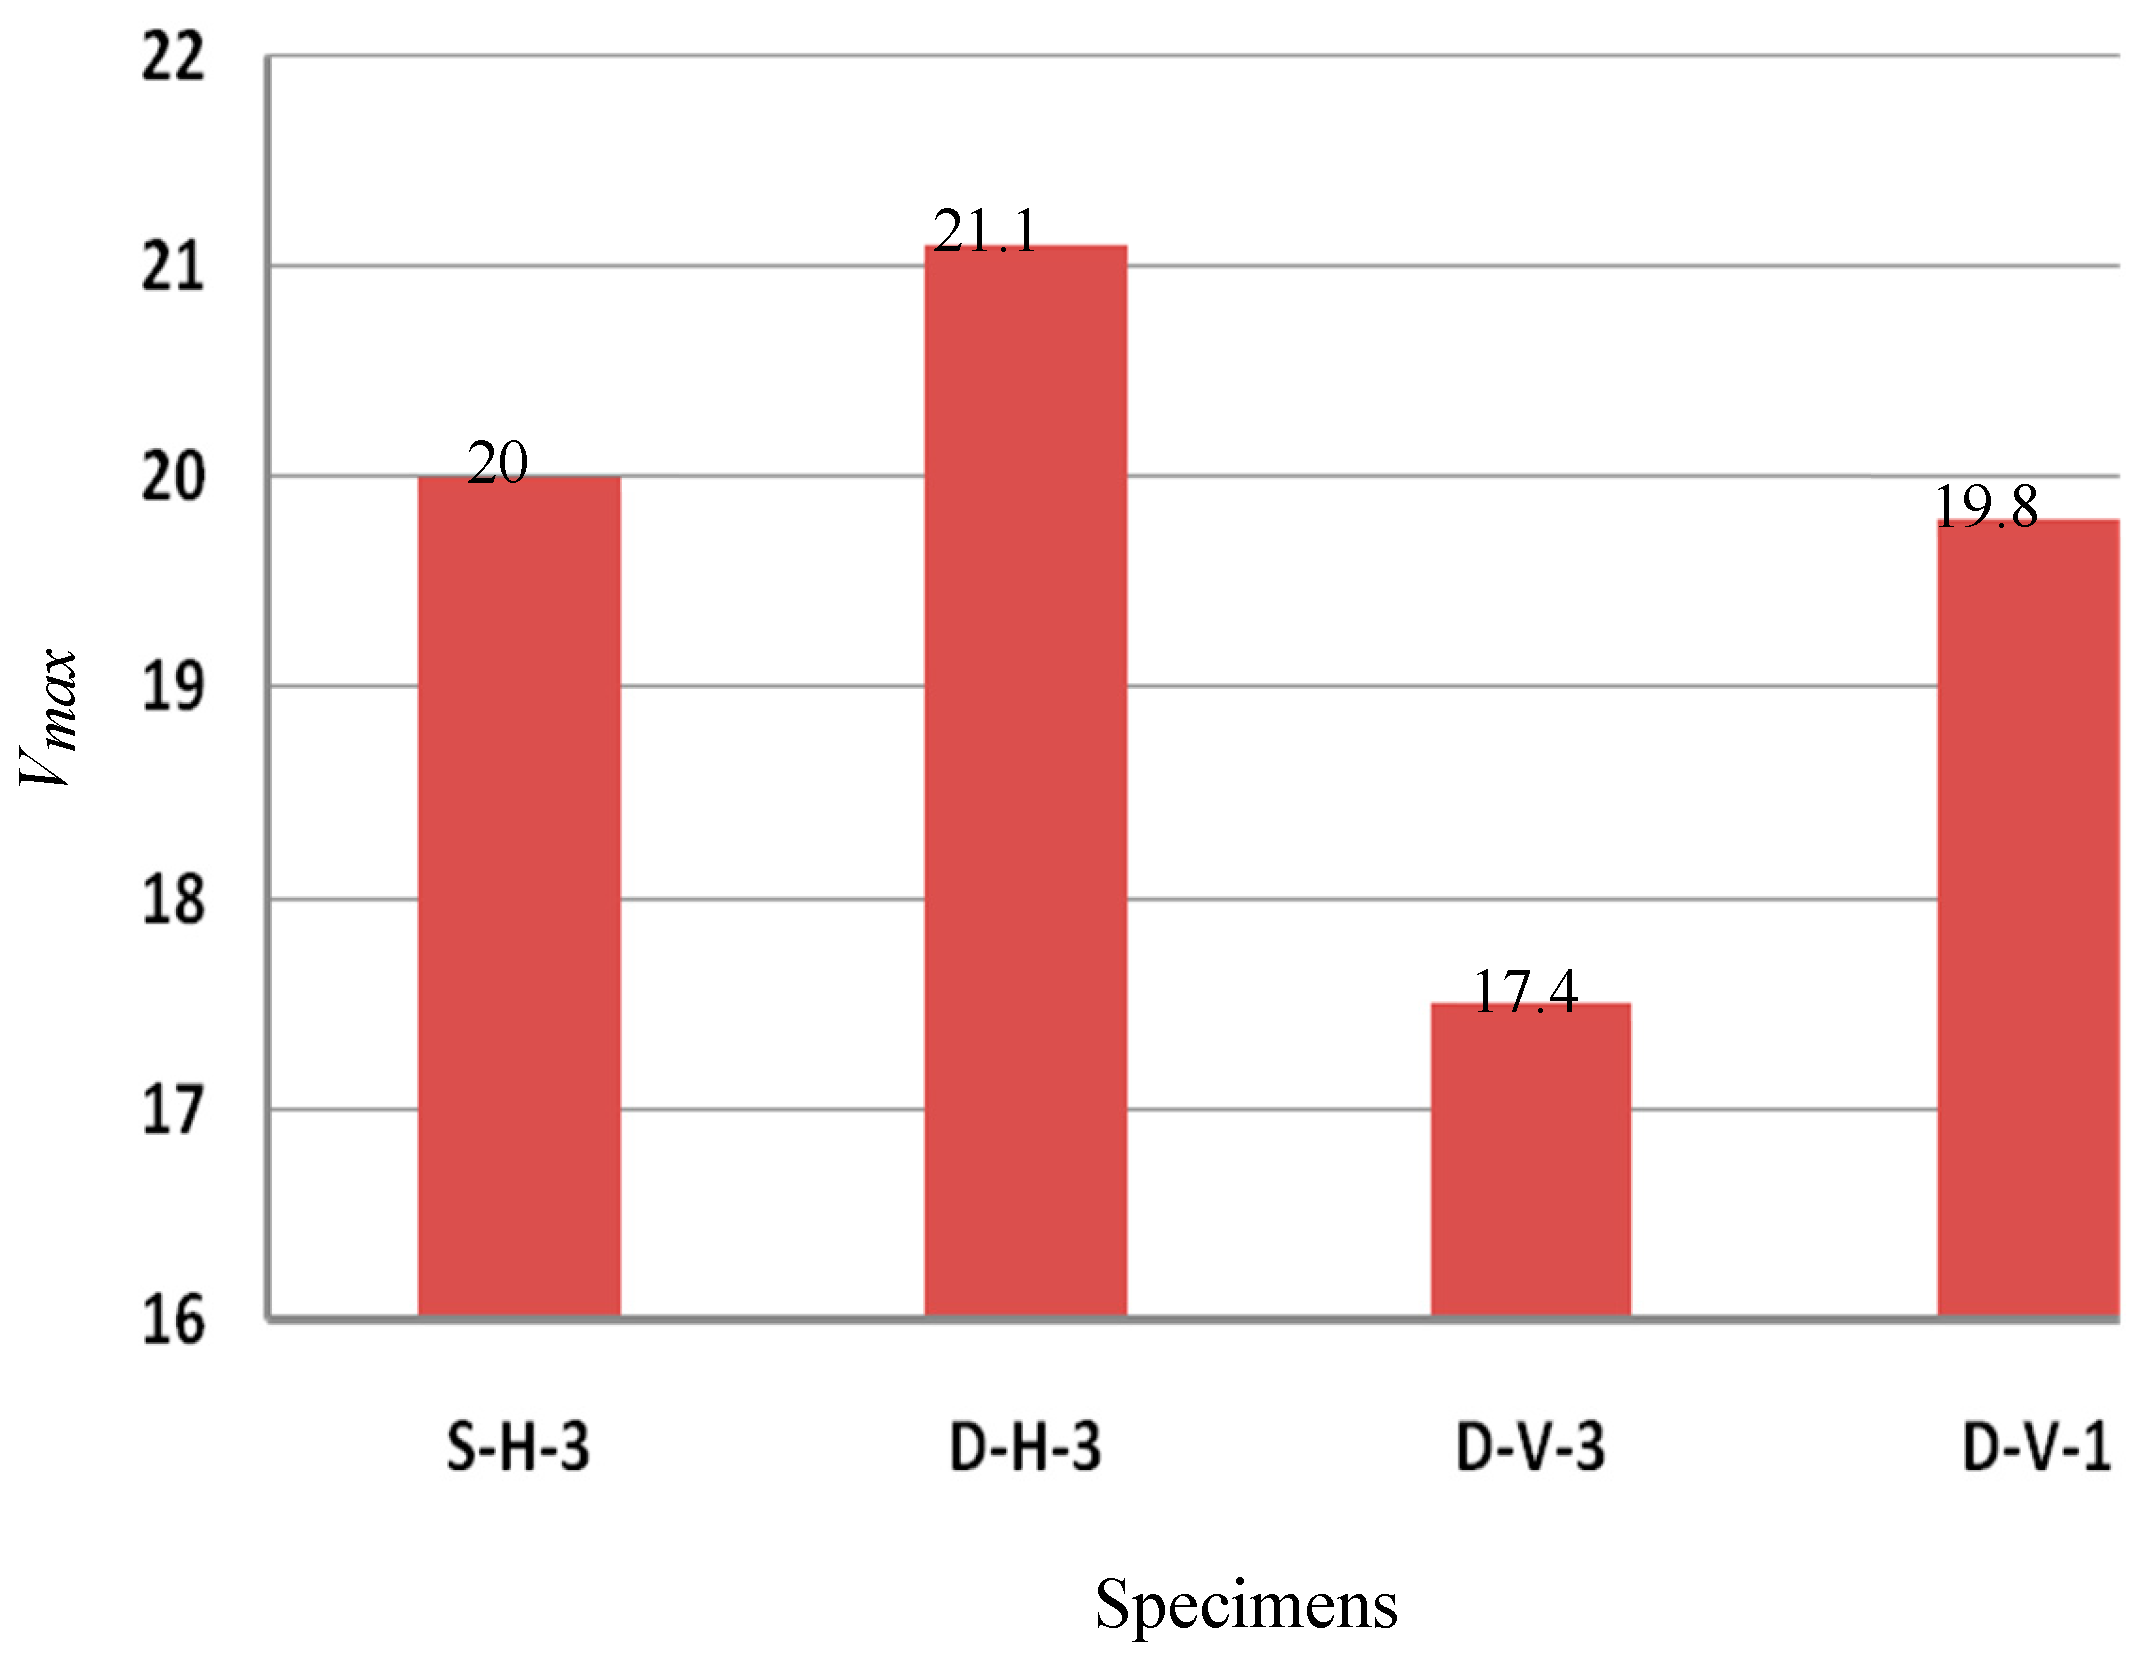
Figure 15.
Comparison of maximum drift ratio values (%).
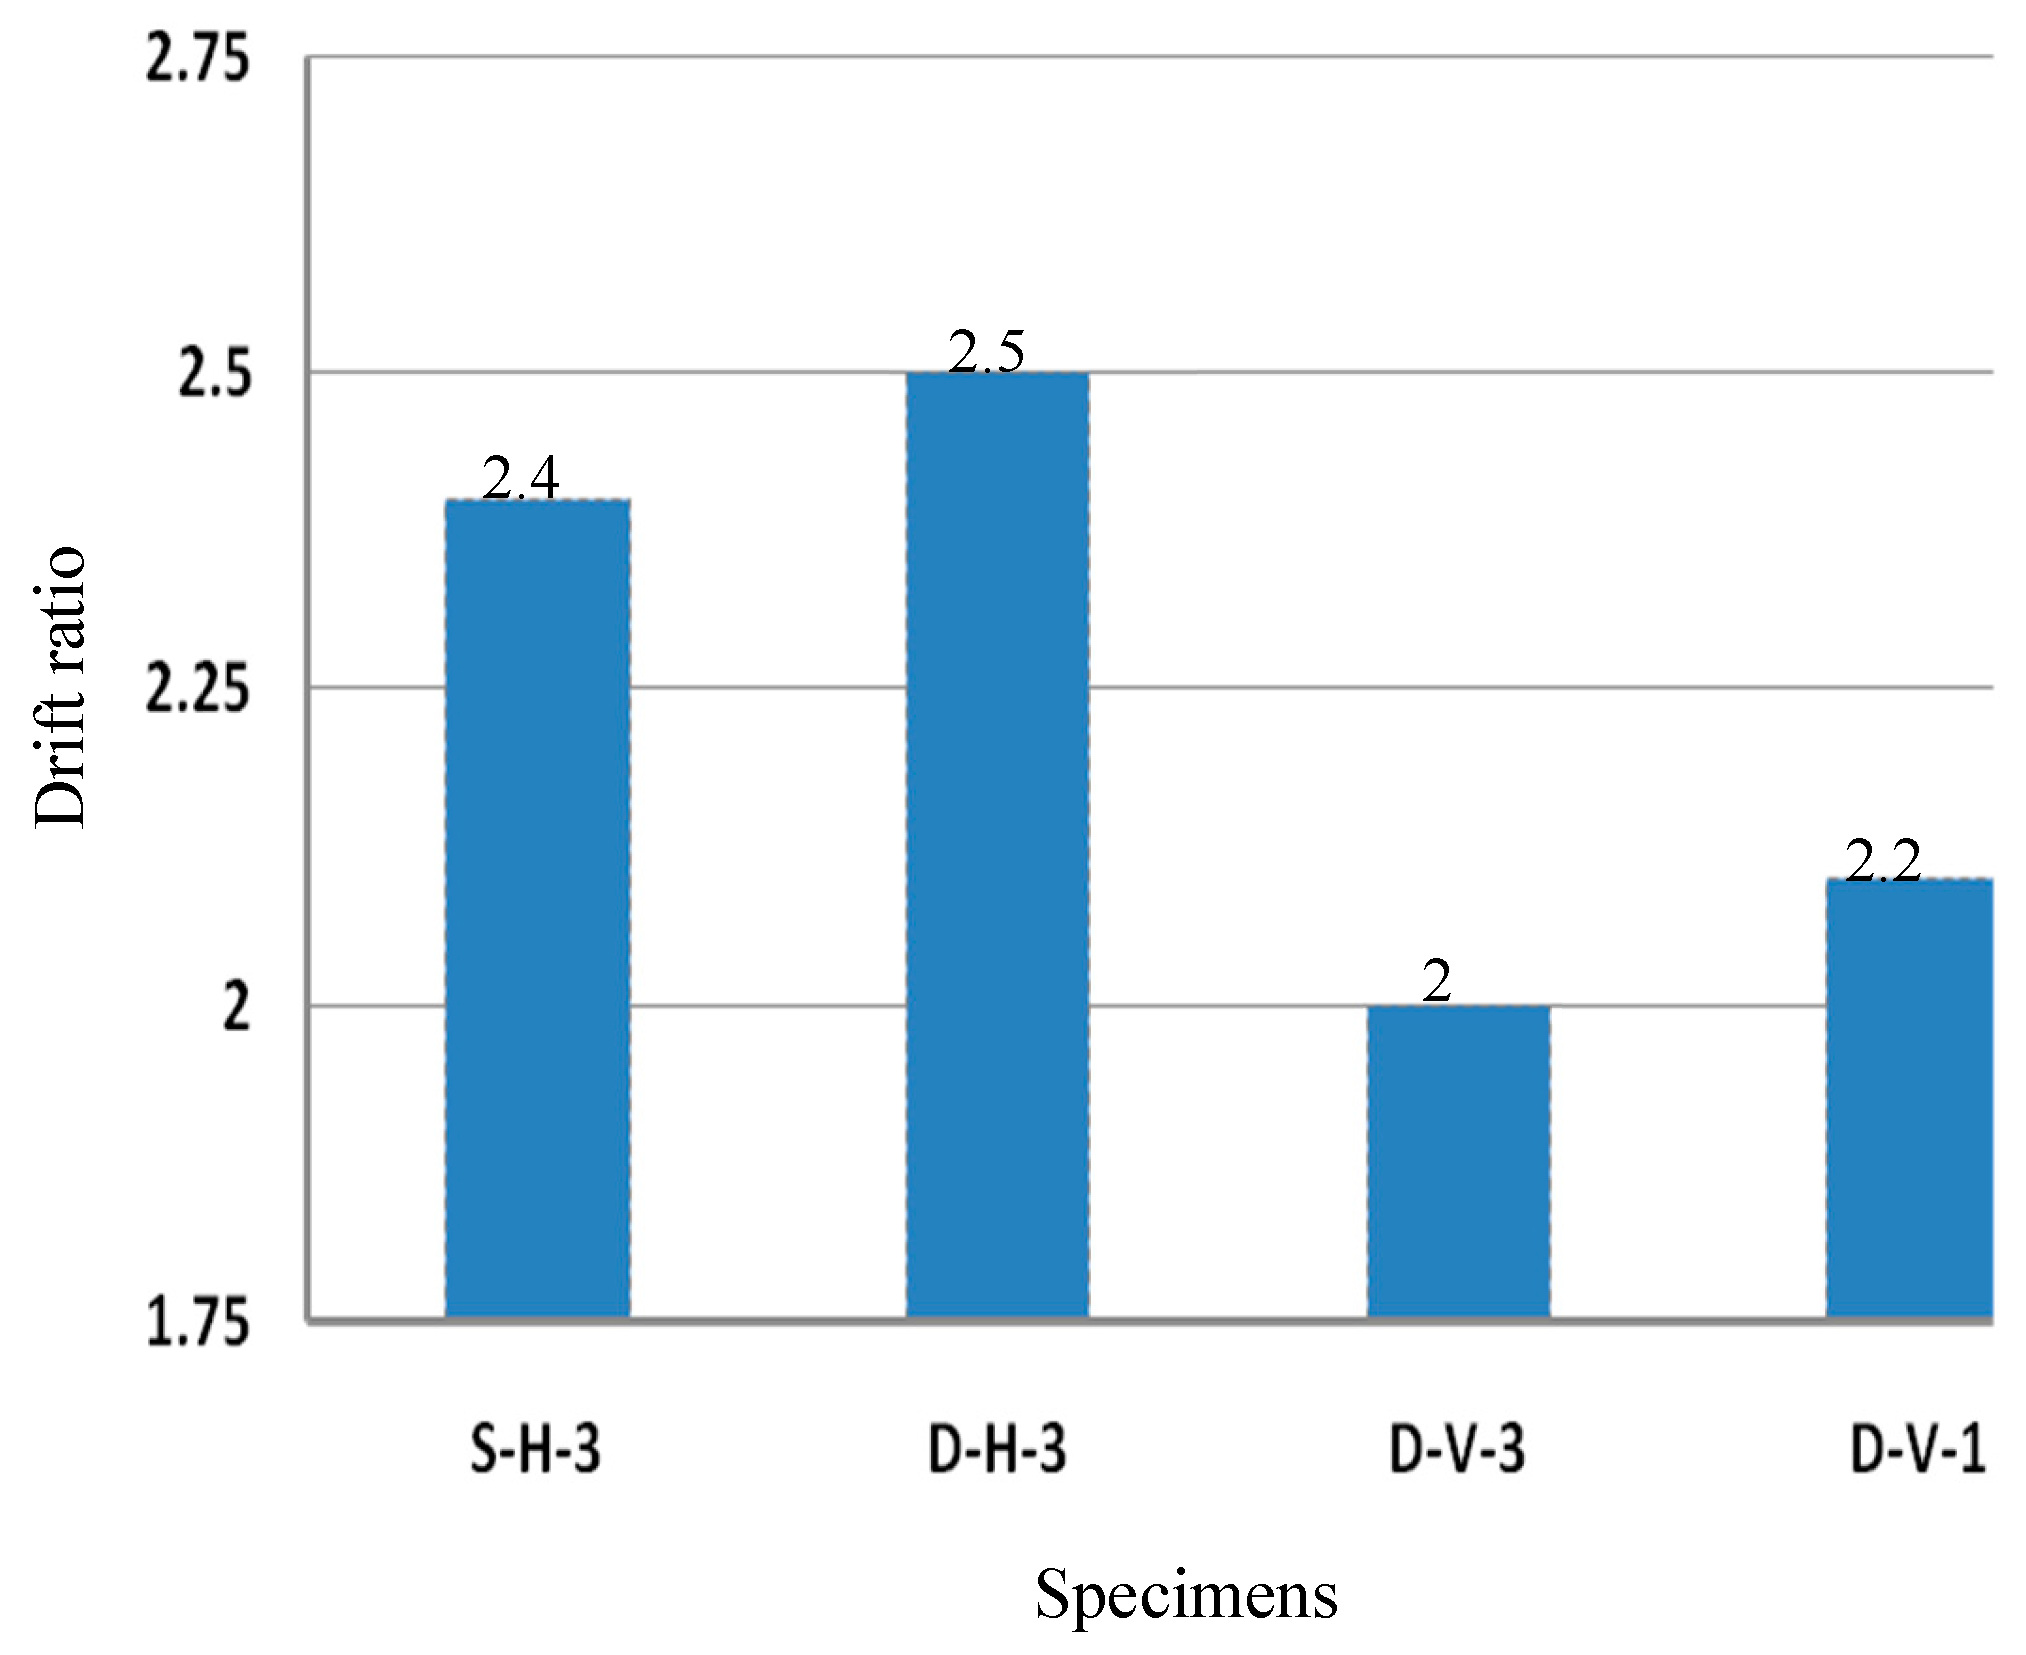
Figure 16.
Comparison of Cd values.
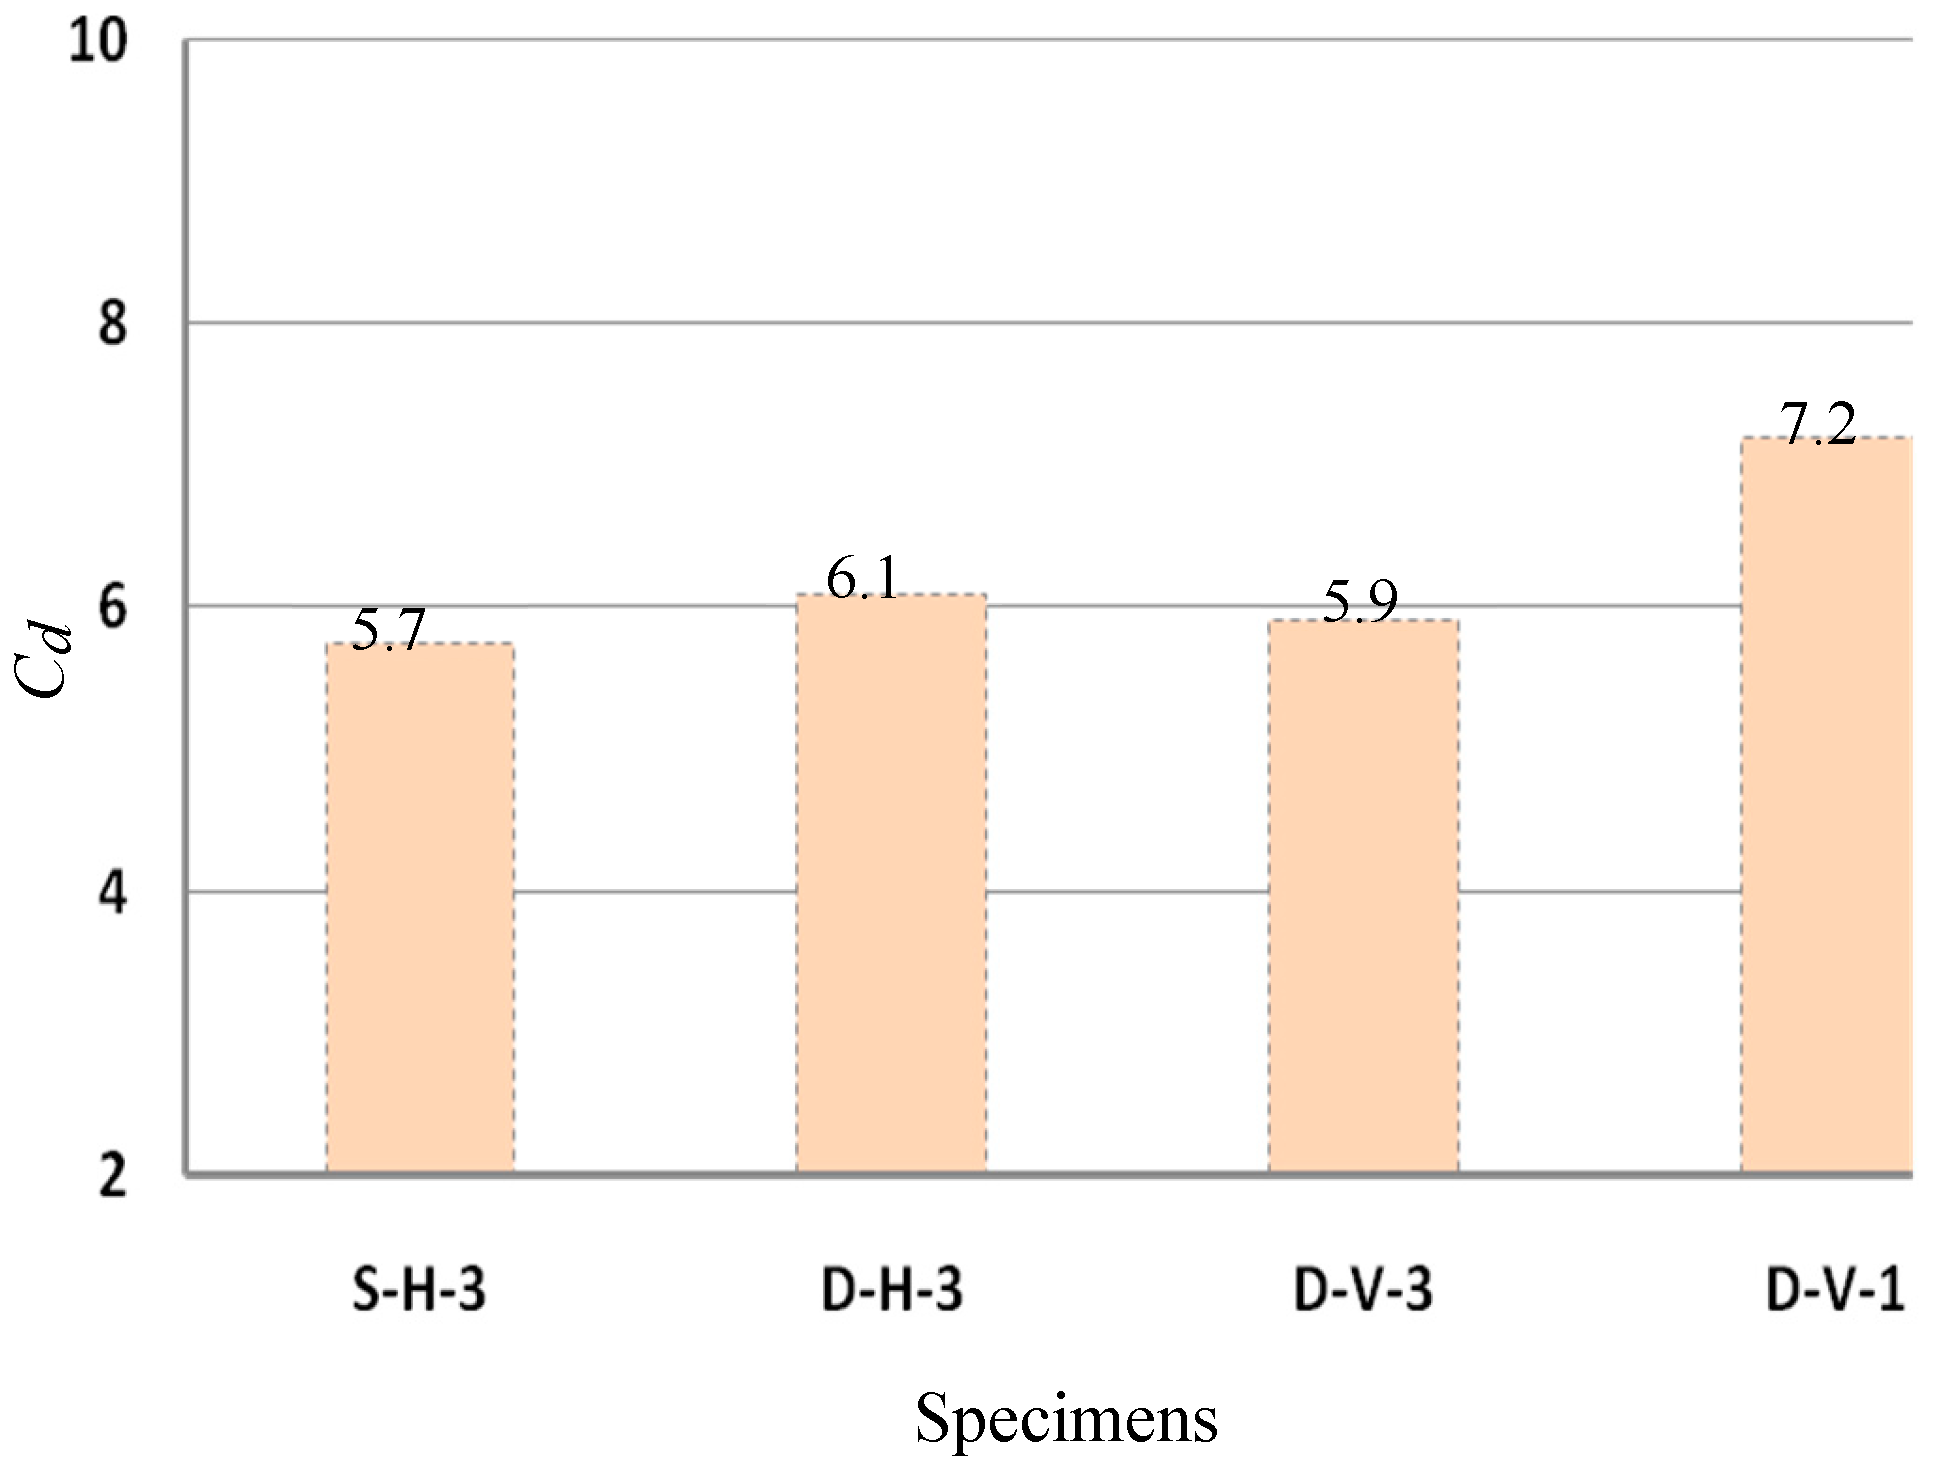
Table 1.
Cyclic displacement schedule.
| Loading step | 1 | 2 | 3 | 4 | 5 | 6 | 7 | 8 |
|---|---|---|---|---|---|---|---|---|
| ASTM displacement (% of) | 1.25 | 2.5 | 5 | 7.5 | 10 | 20 | 40 | 60 |
| Current study displacement (% of) | 2.5 | 5 | 10 | 15 | 20 | 40 | 80 | 120* |
| Displacement amplitude (mm) | 1.5 | 3 | 6 | 9 | 12 | 24 | 48 | 72* |
*Due to actuator travel limits and a maximum permissible displacement of 60 mm, Step 8 was adjusted to 60 mm instead of 72 mm.
Table 2.
Specimen configurations.
| Wall panel | Dimensions (cm) |
Porcelain size (cm) |
Chord studs | Middle studs | Stud spacing (cm) |
Sheathing orientation | Blockingrows | G* (kN) |
Schematic |
|---|---|---|---|---|---|---|---|---|---|
| S-H-3 | 240×120 | 60×120 | Double | Single | 60 | Horizontal | 3 | 40 | Figure 5. A |
| D-H-3 | 240×120 | 60×120 | Double | Double | 60 | Horizontal | 3 | 40 | Figure 5. B |
| D-V-3 | 240×120 | 60×120 | Double | Double | 60 | Vertical | 3 | 40 | Figure 5. C |
| D-V-1 | 240×120 | 60×120 | Double | Double | 60 | Vertical | 1 | 40 | Figure 5. D |
*Gravity load.
Table 3.
The mechanical properties of the CFS sections.
| Nominal grade | 550 MPa | Yield strain | 0.0045 |
| Nominal thickness | 0.7 mm | Ultimate stress, Fu | 617 MPa |
| Elastic modulus | 169 GPa | Ultimate strain | 0.0286 |
| Yield stress, Fy | 592 MPa | Fu/Fy | 1.04 |
Table 4.
Failure observations during lateral loading.
| Specimen | Failure onset displacement, ∆sf (mm) | Fractures count | (mm) | /H (%) | (kN) | |||||
|---|---|---|---|---|---|---|---|---|---|---|
| Board | Porcelain | Screw | Board | Porcelain | Total | |||||
| S-H-3 | 24 | 48 | 48 | 4 | 4 | 8 | 58 | 2.4 | 20 | |
| D-H-3 | 24 | 48 | 24 | 4 | 2 | 6 | 60 | 2.5 | 21.1 | |
| D-V-3 | 24 | 48 | 48 | 4 | 3 | 7 | 48 | 2 | 17.4 | |
| D-V-1 | 24 | 48 | 60 | 4 | 3 | 7 | 51 | 2.1 | 19.8 | |
Table 5.
Energy dissipation per loading step (Joules).
| Specimen: | S-H-3 | D-H-3 | D-V-3 | D-V-1 | Average |
|---|---|---|---|---|---|
| Step | |||||
| 1 | 9 | 9 | 8 | 9 | 9 |
| 2 | 27 | 27 | 25 | 28 | 27 |
| 3 | 70 | 67 | 62 | 73 | 68 |
| 4 | 147 | 129 | 125 | 142 | 136 |
| 5 | 251 | 217 | 220 | 244 | 233 |
| 6 | 1180 | 963 | 834 | 1048 | 1006 |
| 7 | 3436 | 3075 | 2829 | 3125 | 3116 |
| 8 | 3538 | 5503 | 2829 | 3625 | 3874 |
| Total: | 8658 | 9990 | 6932 | 8294 | 8469 |
Disclaimer/Publisher’s Note: The statements, opinions and data contained in all publications are solely those of the individual author(s) and contributor(s) and not of MDPI and/or the editor(s). MDPI and/or the editor(s) disclaim responsibility for any injury to people or property resulting from any ideas, methods, instructions or products referred to in the content. |
© 2025 by the authors. Licensee MDPI, Basel, Switzerland. This article is an open access article distributed under the terms and conditions of the Creative Commons Attribution (CC BY) license (http://creativecommons.org/licenses/by/4.0/).
Copyright: This open access article is published under a Creative Commons CC BY 4.0 license, which permit the free download, distribution, and reuse, provided that the author and preprint are cited in any reuse.


