Submitted:
09 June 2025
Posted:
10 June 2025
You are already at the latest version
Abstract
Aiming at the lightweight design of a bridge-shed integration structure, this paper presents a three-layered absorbing system in which a part of the sand cushion is replaced by expanded polystyrene (EPS) geofoam and the reinforced concrete (RC) protective slab is arranged above the sand cushion to enhance the composite system safety. A three-dimensional Smoothed Particle Hydrodynamics-Finite Element Method (SPH-FEM) coupled numerical model is developed in LS-DYNA, with its validity rigorously verified. The dynamic response of rockfall impacts on the shed slab with composite cushions of various thicknesses is analyzed by varying the thickness composition of sand and EPS materials. To optimize the cushion design, a specific energy dissipation ratio (SEDR), defined as the energy dissipation rate per unit mass (η/M), is introduced as a key performance metric. Furthermore, the complicated interactional mechanism between the rockfall and the optimum thickness composite system is rationally interpreted and the energy dissipation mechanism of the composite cushion is revealed. Using logistic regression, the ultimate stress state of the reactive powder concrete (RPC) slab is methodically analyzed accounting for the speed and mass of the rockfall. The results are indicative of the fact that the composite cushion not only has less dead weight but also exhibits superior impact resistance compared to the 90 cm sand cushions, the impact resistance performance index SEDR of the three-layered absorbing system reaches 2.5, showing a remarkable 55% enhancement compared to the sand cushion (SEDR=1.61). Additionally, both the sand cushion and the RC protective slab effectively dissipate most of the impact energy, while the EPS material experiences relatively little internal energy build-up in comparison. This feature overcomes the traditional vulnerability of EPS subjected to impact loads. One of the highlights of the present investigation is the development of an identification model specifically designed to accurately assess the stress state of RPC slabs under various rockfall impact conditions.
Keywords:
dynamic response
; stress analysis
; composite cushion system
; SPH-FEM coupled method
; logistic regression
1. Introduction
Rockfall hazards constitute a common geological disaster in mountainous regions and pose a substantial threat to mountain transportation infrastructure [1]. Today, the shed-tunnel structure is usually considered as the last safeguard measure near the traffic links and generally consists of RC structures with a sand layer over them. Therefore, the structure is prone to issues such as heavy dead loads and high costs, and its construction is challenging due to the limitations in structural height, traffic restrictions, and topography. Therefore, the adoption of new high-strength materials and innovative protective structure systems is necessary to reduce dead loads, while ensuring a significant increase in protective resistance capability is of great importance.
In general, the Sichuan-Tibet railway, which represents a strategic corridor characterized by a high proportion of bridges to tunnels [2,3], due to the constraints imposed, requires the integration of bridges with shed-tunnel structures. The main aim is to achieve bridge-shed unity protection, given the constraints posed by challenging topographical conditions. Contrary to traditional protective shed-tunnel structures that rely on thick sand layers for energy absorption, bridge-shed integration necessitates minimizing the thickness of the sand layer to reduce dead loads. Hence, the dynamic mechanical behavior of rockfall collapses on the shed slab becomes more significant and necessitates engineers to focus on impact resistance design. Considering the necessity of lighter and thinner design principles in the tunnel slab, the evaluation of their protective performance becomes more significant.
Zhong et al [4] proposed a 120 MPa RPC protective gallery with a 90 cm sand cushion on it and investigated its mechanical behavior and failure morphology due to rock fall. To further reduce the weight of the cushion, utilized EPS geofoam to replace part of the sand to form a sand-EPS composite cushion and examined the dynamic response of the shed-tunnel structure under the influence of rockfall through experiments and numerical simulations. Expanded polystyrene (EPS) foam, with its low density and exceptional shock buffering performance [9,10,11], has emerged as a promising material for various engineering applications [12]. However, EPS geofoam materials are prone to punching and cracking in the presence of impact loading, which seriously affects the normal exploitation of protective cushions [5,13,14]. Given this, the Japanese manual proposes a three-layered absorbing system [15] that includes a RC slab, sand cushion, and EPS geofoam to effectively protect the main structure from rockfall impacts. In addition, other investigators have researched the mechanical aspects of three-layered absorbing systems consisting of a sand layer (top), RC core slab (middle), and EPS block layer (bottom) [16]. Impact-resistant structures are designed to achieve optimal energy absorption efficiency under crash conditions while maintaining minimal mass, for which the Specific Energy Absorption (SEA) serves as a critical evaluation metric of such energy-mass performance characteristics [17,18,19].
To elucidate the energy dissipation mechanisms of individual components within the novel composite cushion system and analyze the dynamic response of the main RPC structure, a comprehensive examination of the rockfall impact dynamics across the entire structural system is imperative. Currently, numerical simulation is a common research tool for exploring mechanical behavior complexities. The key methodologies include the finite element method (FEM), discretizing structures into interconnected elements, and smooth particle hydrodynamics (SPH), a particle-based approach utilized at fluid flows and solid deformations. In general, FEM confronts challenges in simulating large deformations and discontinuous media, whereas SPH struggles with tensile instabilities in solids and complex boundary conditions. The SPH-FEM coupling method exploits the SPH's strength in large deformations to enhance simulation accuracy and stability while maintaining the advantages of FEM. Researchers have investigated the dynamic impact behavior of composite structures employing the SPH-FEM coupling method [20,21,22]. The obtained results revealed that the simulation results of the SPH-FEM coupled model are generally in closer agreement with the experimental data compared to the results obtained from the FEM analysis.
In summary, while the literature on EPS-sand composite cushions primarily focuses on buffering performance, there are almost no reports on the mechanical behavior of three-layered absorbing systems specifically under the impact of falling rocks. Further, the available literature is insufficient, especially in the systematic discussion and definition of rockfall impact energy levels that the three-layered composite system can withstand under various safety stress thresholds, considering the stress state of the concrete material itself. Additionally, the SEA metric fails to account for the influence of impact energy levels on the energy dissipation efficiency of cushion systems. Given the stochastic nature of impact loads, protective structures may encounter impacts with varying energy magnitudes. Therefore, it is necessary to develop novel impact resistance evaluation metrics that explicitly incorporate the effects of impact energy levels.
In the present investigation, a three-layered absorbing system comprising a RC slab, sand layer, and EPS geofoam is proposed. Different from the literature [16], the RC slab is placed on the top layer in this study, so that the rockfall impact energy is more evenly transmitted to the main structure. At the same time, it effectively alleviates the problem of cushioning performance degradation caused by the densification effect of sand medium under impact load. Furthermore, a numerical simulation model of a three-layered absorbing system is developed based on the SPH-FEM coupled framework. A comparative analysis of the dynamic behavior of the tunnel impact under different composite cushion thicknesses is conducted, explicating the impact process and the energy dissipation mechanisms under optimal cushion thickness. Based on the SEA evaluation metric, this study introduces the specific energy dissipation ratio (SEDR) as a supplementary indicator and comparatively analyzes the variation patterns of SEDR in 90cm sand cushion and the three-layered absorbing system under different impact energy levels. Additionally, extensive random sample expansion analyses are performed to propose a stress state identification model based on the use of logistic regression, which leads to an evaluation method for ultimate impact energy based on the RPC slab stress states.
2. Numerical Model of the SPH-FEM Coupled Approach
2.1. SPH Methodology
SPH represents a mesh-free computational approach that originated in astrophysical problems [23]. The SPH method's main formulations are typically developed in two steps. The first step involves kernel approximation, which can be represented as follows [24]:
where W represents the kernel function and h denotes the smoothing length. The field variable of an individual particle can be appropriately evaluated by interpolation of the field variables of the neighboring particles. Herein, the cubic B-spline kernel function in LS-DYNA is effectively utilized to realize the interpolation of the field variables of a particle which can be written as [24]:
where q signifies the relative distance, q=r/h (r is the distance between the particles), and C denotes the normalization coefficient.
The second step is the particle approximation procedure, which can be initiated by:
where wj represents the gravity density of the particles and varies in proportion to the divergence of the fluid, wj=mj/ρj. The governing equations in terms of the conservation of mass, momentum, and energy of SPH are given in the following form [25]:
where σ, v, Π and E in order represent the stress, the velocity, the artificial viscosity and the internal energy.
2.2. SPH-FEM Coupled Algorithm
FEM and SPH methods are two crucial approaches for addressing complex engineering problems, each having its own advantages and disadvantages. The FEM is capable of intuitively simulating the change process of the internal force of the structure under the influence of external loads. Moreover, it has a strong dependence on the element mesh, and the main problem inherent to the FEM method relates to the mesh distortion in large deformation simulations [5]. The meshless property of the SPH approach can appropriately solve the mesh distortion problem, and the SPH particles could better demonstrate the phenomenon of splashing and cratering of the rockfall impact on the sand cushion layer compared to the FEM. However, the computational cost of SPH is very high compared to the FEM method, so the SPH-FEM coupled method can fully utilize the advantages of SPH in handling large deformation problems while enhancing the accuracy and stability of simulation calculations.
The contact between the SPH particle and the FEM element is the key to computational analysis in the SPH-FEM coupled approach. Since the FEM element is in contact with the SPH particle, the contact conditions at the interface follow the Runge-Kutta method:
where g denotes the gap function, and t represents the contact force. The interaction between the SPH particle and the finite element is commonly achieved by the penalty function based on the 'AUTOMATIC_NODES_TO_SURFAC' contact while the SPH particles are set as the slave nodes, the finite element surface is defined as the master surface as illustrated in Figure 1.
In the SPH-FEM coupled framework, the SPH and FEM methods adopt the leapfrog display integral and the central difference method for time integration, respectively. Coupling the two methods requires synchronizing the integrals and adopting the same computational step size in each step in the context of the same computational framework. The primary time step calculations could be provided as [25,26]:
where c, β, and Lmin in order represent the sound speed, the time scale factor, and the smallest element length.
2.3. Validation
Yan et al. [5] examined the dynamic response of sand-EPS composite cushion under the impact of rockfall through physical model experiments, as illustrated in Figure 2(e). The impact test model is essentially composed of three parts: a rock block, composite cushion layer, and gallery model. The rock block was made of high-performance concrete, with a mass of approximately 1410 kg. The impact height of the rockfall ranges from 1.81 m to 33.39 m, corresponding to impact energies of 25 kJ to 250 kJ. For these impact energy levels, the impact force-time history curves and the effective plastic strain of the cushion layer were obtained. Herein, the experimental data can be beneficial in verifying the effectiveness of the SPH-FEM coupled approach in the absorbing system acted upon by the rockfall impact loading.
A schematic representation of the physical model has been provided in Figure 2(c). The RC slab of the gallery has a cube compressive strength of 40 MPa and its 3D dimensions are set to 3.5m(x)×2.2m(y)×0.3m(z). The dimensions of the sand-EPS cushion (0.3m sand + 0.3m EPS) are represented by 2m(x)×2m(y)×0.6m(z). The two layers of reinforcement bars are arranged in the RC protective slab with a space of 100 mm in both directions. Among them, the diameters of the longitudinal and vertical steel bars in order are 20 mm and 14 mm, with a yield strength of 335 MPa. Additionally, the diameter of the stirrup is 12 mm with a yield strength of 330 MPa. The overall representation of the impact experiment has been provided in Figure 2(e).
The SPH-FEM model of the impact test was established by LS-DYNA software, as presented in Figure 2(d). The EPS geofoam was modeled with solid element, where the material type was based on *Crushable Foam (mat 063), and the constitutive curve [5] of the EPS has been illustrated in Figure 2(a). The impact and non-impact area of the sand cushion were modeled by SPH particles and solid element, respectively, which was described by the material model*Crushable Foam (mat 063), and its stress-strain relationship was displayed in Figure 2(b), such that σ=50*ε2 (σ is expressed in MPa) [4]. The rock block was regarded as an ideal rigidity that was simulated by a solid element, and the material type was *RIGID (mat 020). The RC slab was modeled as solid element based on the material type of *JOHNSON_HOLMQUIST_CONCRETE (Mat 111). Moreover, the two concrete members at the bottom were set to solid elements with the type of *ELASTIC (Mat 001). The steel bar was modeled with beam element, and the material type was set as *Mat_Plastic_Kinematic (MAT_003) and it was coupled with the concrete slab by the key word *Constrained_Lagrange_In_Solid. The interactional contacts among SPH particles and block, EPS geofoam, and sand cushion layer (FEM element) were defined as *Contact_Automatic_Node_To_Surface. Moreover, the contact types between the block, sand cushion (FEM element), EPS geofoam, the RPC slab, the concrete members, and the ground were set as *Contact_Automatic_Surface_To_Surface.
The dynamic impact tests on the EPS-Sand cushion layer are performed through LS-DYNA software. The comparative force time history plots of both 50 kJ and 150 kJ impact energy tests have been given in Figure 3. In addition, the corresponding EPS geofoam failure morphology under the impact of 50 kJ energy level is illustrated in Figure 4. The plotted results reveal that the peak value and the changing trend of the impact force history curve are in a reasonably good agreement with the test results. The contact force peak values of the two impact energies obtained by the numerical method in order are 260.8 and 663.6kN, while those of the model test are 301.1 and 726.3kN, respectively. As can be seen from Figure 4, the circular damage failure surface of the EPS foam buffer layer appears at the impact position, and a similar phenomenon is also presented in the numerical simulation, which is more consistent with the impact damage distribution shown in the experiment phenomenon.
A fairly good agreement between the numerical results and the experimental data is attained, and the impact force peak value obtained from the SPH–FEM coupled approach exhibits a discrepancy of 9.6% from the experimental data. Therefore, it can be concluded that the proposed SPH-FEM coupled model is almost reliable in the application of block impact on the Sand-EPS composite buffer layer.
3. Three-Layered Absorbing System Dynamic Response
Zhong et al [4] analyzed the protective performance of the 90 cm sand cushion and the reactive powder concrete (RPC) shed structure under the influence of block impact. The main functionalities of this structure are to further reduce the dead load of the superstructure and protect the EPS geofoam. To this end, a three-layered absorbing system numerical model is developed in this paper, in which a 10 cm thick RC protective slab (top), a 40 cm thick sand cushion (middle), and a 40 cm thick EPS layer (bottom), and the mechanical responses of composite cushion structures with different thicknesses are suitably compared and analyzed. The energy dissipation mechanism of the composite cushion is that block impact energy is transformed into RC protective slab eroding energy, sand cushion internal energy, and EPS elastoplastic deformation energy. However, the specific energy evolution relationship during block impact, especially the energy dissipation of cushion materials, is generally ambiguous, which is also the focus of the present research.
3.1. Comparative Analysis of the Buffer Layer Thickness
The FEM-based model of the block impact test was established by LS-DYNA software, which is presented in Figure 5. The numerical model consists of four parts: concrete members, RPC slab, composite cushion layer, and block, where the cushion layer consists of RC protective slab, sand, and EPS geofoam. The RC protective slab was modeled by a solid element, the material model is based on *MAT_CSCM_CONCRETE (159) with a density of 2650 kg/m3 and a Poisson's ratio of 0.2. A single layer of reinforcements was arranged in the slab with a distance of 100 mm in both directions, and the diameter of the steel mesh was 16 mm with a yield strength of 500 MPa.
The RPC shed slab is established by the solid element and the material model is based on *Mat_Johnson_Holmquist_Concrete, where two layers of rebar are arranged inside the slab, and the longitudinal and transverse reinforcements along both directions are arranged with the numbers of 34 and 29, respectively. More extensive tabulations are also available in reference work [4]. The material parameters of each component have been provided in Table 1. The parameters of RPC slab materials are presented in Table 2.
To investigate the optimal composition of the three-layered absorbing system, three composite systems with various thicknesses were designed: a composite cushion system consisting of 10 cm RC protective slab in the upper layer, 30 cm sand in the middle layer, and 50 cm EPS in the bottom (hereafter referred to as RSE1). To keep the thickness constant for the contrast tests, the sand thicknesses of RSE2 and RSE3 in order are set as 40 cm and 50 cm. The uppermost protective slab of the cushion layer was made of C30 concrete with a density of 2650 kg/m3. The density of EPS material was 20 kg/m3 and that of the sand was 1628 kg/m3 with sand friction angle of 28 degrees and elasticity modulus of 38 MPa.
In this section, the mechanical responses of three cushion systems under different rockfall impact energy levels are compared and analyzed, where an impact load of 50–150kJ was generated by a 760kg weight at free fall heights from 6.68 m to 20.03 m. The changes in concrete principal stress, reinforcement equivalent stress, and contact force in terms of the EPS thickness and the impact energy level are provided in Table 3.
As concluded from Table 2, the changing trend of the maximum principal stress of RPC slab and steel equivalent stress exhibit an increasing trend with decreasing the EPS thickness and increasing the block impact energy. Among three-layered absorbing systems, the dead loads of the main structure under the RSE3 surpass that of system RSE2 by a notable margin of 20.36% and RSE1 by a significant margin of 41.1%. RSE1 exhibits marginally superior cushioning performance compared to RSE2; however, the growth trend of the main structure stresses and reinforcement stresses are relatively moderate.
For lightweight structures, the energy absorbed per unit mass (specific energy absorption, SEA) is commonly adopted as the evaluation index for impact resistance performance, expressed as follows:
Where E denotes the energy dissipated by the cushion system and M represents the total mass of the buffer structure.
ESEA=E/M
Building on this foundation, the present study proposes the specific energy consumption ratio per unit mass (SEDR), defined as:
Where η is the energy consumption ratio of the cushion system.
ESEDR=η/M
A higher SEDR indicates superior energy absorption efficiency under lightweight conditions. As summarized in Table 4, the comparative analysis of lightweight energy dissipation performance metrics for three composite cushion systems under multi-level impact loads reveals distinct characteristics: RSE1, RSE2, and RSE3 exhibit mean performance values of 2.82, 2.42, and 2.05, respectively. Notably, the RSE1 system demonstrated the lowest mass but a marginally lower energy consumption ratio compared to RSE3. Crucially, RSE1 achieved the highest SEDR, demonstrating its optimal balance between mass reduction and energy dissipation capacity, followed by the RSE2 system.
In addition, the use of a relatively thin sand cushion layer may compromise the overall stability of the protective system, exposing the EPS to fragmentation upon block impact, thereby adversely affecting the safety and stability of the structure. Considering the economic implications, the application of RSE2 provides a cost-effective advantage, which results in a substantial savings of 15.6% compared to RSE1, which finally emphasizes the optimality of selecting RSE2 for practical implementations.
3.2. Mechanical Response Analysis of Composite Cushion System
Analysis of dynamic response patterns on the RSE2 composite cushion layer under block impacts has been performed using LS-DYNA dynamics software. A comprehensive analysis of the mechanical aspects of the composite protective system is presented based on three key aspects: dynamic impact process, energy dissipation mechanisms, and displacement response patterns. The impact load of the block with an impact energy of 250 kJ was generated by a weight of 1410 kg at a speed of 18.83 m/s. The impact process, energy distribution, and displacement response of the 250 kJ impact energy in order are illustrated in Figs. 6-8.
The onset of contact between the block and the composite cushion surface is set as 0s. As illustrated in Figure 6, the impact process exhibits a highly transient nature, whereas the composite cushion undergoes significant deformation under the block impact, which shows its effectiveness in absorbing the impact energy.
At t=0s, upon contact between the block and the RC protective slab, the kinetic energy of the block is quickly transferred to the RC slab, which leads to crushing failure in the contact area between the block and the impact surface of the RC protective slab. Subsequently, the impact kinetic energy is divided into three components: RC slab internal energy, additional erosion energy and internal energy of the steer bar, which in order are 60.1kJ, 24.4 and 22.4kJ, as demonstrated in Figure 7, in which the erosion energy arising from the crushing failure of the RC slab during the impact process. The plotted results reveal the diversity of RC slab energy dissipation mechanisms, with these three components accounting for approximately 42.8% of the total impact energy.
As the collision process progresses, the block begins to contact the surface of the sand cushion. Additionally, the surface particles of the sand cushion are deformed due to the impact load, which absorbs and dissipates the impact energy through the displacement and friction between the particles. According to the results plotted in Figure 7, the energy absorbed and dissipated by the sand cushion is approximately 74.7 kJ, which accounts for 30% of the total energy. At t=0.01s, the EPS cushion consumes energy through deformation, reaching a peak energy consumption of approximately 46.4 kJ at t=0.04s, which accounts for approximately 18.5% of the total energy.
According to the above results, the composite protective system has a good energy dissipation effect, which mainly relies on the crushing and rebounding of the RC slab and the friction between the sand particles. The energy dissipation of the EPS cushion occupies only a small part, which takes advantage of the lightweight EPS material and avoids the shortcomings of the EPS material, which easily breaks under the impact load.
The impact process has been illustrated in Figure 8. As shown, the block collides with the RC protective slab and subsequently causes a rapid increase in the vertical displacement within the slab, leading to failure and spalling of the concrete layer at the impacted zone of the composite cushion, as presented in Figure 8(a). At the moment t=0.003s, the vertical displacement of the concrete slab triggers the sand to start falling. As illustrated in Figure 8(b), this process is accompanied by friction, extrusion, and energy dissipation of the sand cushion. As the impact process continues, the displacement margin of sand gradually propagates from the impact contact area to the adjacent regions. At t=0.009s, the displacement of the EPS cushion exhibits a rapid increase in the direction of the rockfall path, initially concentrated in the center of the cushion and subsequently spreading gradually towards its periphery. As the contact area between the rockfall and the protective cushion becomes progressively larger, the displacement fringe of the central cushion region exhibits a distinct pattern, characterized by lower displacement values at the core and progressively higher values radiating outward from the center, as demonstrated in Figure 8. (d). This phenomenon arises from the fact that the EPS located in the central region of the contact surface is predominantly subjected to triaxial compression, whereas the EPS and sand in the peripheral regions mainly experience shear deformation.
3.3. Contrastive Analysis of the Main Structure Mechanical Behavior
To examine the advantages of the three-layered absorbing system developed in this paper, this section aims to analyze the principal stress distribution of the main structure and the stress variation of the reinforcement. To highlight its performance advantages, a comparative analysis has been also carried out with the impact resistance performance to impact loads, demonstrated by a 90cm thick sand cushion in impact experiments [4]. The main aim is to reveal the significant advantages of the composite system in terms of protection efficiency and structural stability based on the multi-dimensional indicators (i.e., concrete principal stress, reinforcement stress, and η/M index). The comparison of the generated stresses in RPC slab and η/M index the have been provided in Table 5 and Figure 9.
As shown in Figure 9, the maximum stress of the steel reinforcement reached 48.94 MPa, while the maximum compressive stress on the RPC slab protected by a 90 cm thick sand cushion was obtained as 11.5 MPa. In contrast, the implementation of a composite cushion resulted in a noticeable reduction in stress levels: the peak stress of the reinforcement reduced to 29.2MPa, marking a 40.34% reduction, whereas the maximum compressive stress on the RPC slab dropped to 7.62 MPa, exhibiting an 33.74% decrease, which shows that the three-layered absorbing system improves the stress distribution through the layered energy absorption mechanism.
In addition, both the three-layered absorbing system and the 90 sand cushion demonstrate favorable energy dissipation performance under the 250 kJ impact energy. However, the impact resistance performance index SEDR of the three-layered absorbing system reaches 2.5, showing a remarkable 55% enhancement compared to the sand cushion (SEDR=1.61). This discrepancy primarily attributes to the lightweight design of the three-layer system, which achieves superior mass efficiency under equivalent energy consumption conditions. As illustrated in Figure 10, the composite cushion system exhibits consistently superior performance to the sand cushion across all energy levels. Notably, the SEDR index of the 90 cm sand cushion presents a gradual decrease with the impact energy increasing, indicating a progressive decline in its cushioning performance.
In contrast, the SEDR curve of the three-layered absorbing system displays an initial increase followed by a decrease, peaking at 750 kJ energy level with a value of 2.67. This peak value represents approximately 1.64 times the maximum SEDR value observed in the 90 cm sand cushion. By comparison, the effectiveness and reliability of the proposed composite cushion system in protecting the main structure from damage acted upon by the block impact are well demonstrated.
4. RPC Slab Ultimate Stress State Analysis
In the current research perspective of shed protection structures, most of the attention is focused on exploring and optimizing their buffer performance. which is necessary to improve the impact resistance capabilities of the structure, especially in the face of natural hazards such as rockfalls and landslides. However, the existing literature and research still lack another aspect, that is, starting from the stress state of the concrete material itself, the impact energy levels of composite protective structures in the presence of various safety stress thresholds have been systematically discussed and defined. This lack of research on the safety threshold of material layer stress state limits our ability to predict the accuracy of the selection of protective materials, the rationality of the structural layout, and the anti-collision ability at the early stage of design.
4.1. Ultimate Stress Index
According to the existing literature [27], when the stress is applied to the concrete with a normal strength of less than 0.3fc, the stress-strain relationship can be closely approximated by a straight line, which indicates that the concrete is in the elastic stage. As the stress gradually approaches the range (0.7 to 0.8) fc, the stress-strain curve of concrete gradually deviates from linearity and exhibits plastic properties characterized by cracks initiated within the concrete, and they do not compromise the overall structural integrity. When the stress exceeds 0.8 fc, longitudinal cracks appear on the surface of the concrete specimen, which indicates that the specimen gradually loses its bearing capacity and enters the plastic damage stage, where significant plastic deformation and accumulation of internal damage occurs. Therefore, to ensure safety, three distinct stress states of concrete slabs are described here:
(a) Linear elastic state:
(b) Elastic-plastic state:
(c) Plastic damage state:
The stress states of concrete slabs described in this section form the basis for appropriate classification via machine learning algorithms, with adjustable threshold stress values based on the specific requirements or constraints of the application or analysis. In this section, the logistic regression algorithm is employed to predict the stress state of the concrete slab subjected to rockfall impact with a three-layered absorbing system. To this end, the stress level of the concrete slab is defined based on the compressive strength (fc), assuming that the slab remains in the elastic stage if the stress (δ) becomes less than 0.3fc. For logistic regression classification, a binary variable y is utilized, where y=0 indicates that the slab is in the elastic phase (i.e., δ < 0.3fc), and y=1 typically represents a different stress state (e.g., plastic or failure) that falls outside this threshold.
4.2. Composite Cushion Stress Recognition Model for Concrete Slab
Logistic regression, as a classification model, employs a linear decision boundary (a straight line in two dimensions or a hyperplane in higher dimensions) in the feature space for binary classification but can be extended to achieve nonlinear boundaries. Based on 100 randomly generated samples that represent different conditions of RPC slabs and the corresponding stress values obtained through numerical calculations, a stress state evaluation model for RPC slabs under optimal thickness cushion protection is implemented via a logistic regression algorithm in Python. This model enables the evaluation of the stress state of RPC slabs under specific impact conditions, as illustrated in Figure 11, where the nonlinear decision boundaries pertinent to the elastic and elastic-plastic behaviors in order are mathematically represented by:
where v denotes the impact velocity, and m represents the rockfall's mass.
The plane coordinates are divided into three regions by two precisely defined boundary curves in Eqs. (14) and (15). Each of these regions corresponds to a distinct stress state of the RPC slab, which enables the classification of its stress state under varying impact conditions. Mapping the rockfall mass and velocity within Region 1 of the Cartesian plane indicates that the RPC slab remains in the elastic state under the corresponding impact conditions. Similarly, Region 2 and Region 3, respectively, indicate that the mechanical behaviors of the RPC slab in order are placed in the elastic-plastic stage and the plastic damage stage under the corresponding impact conditions. Therefore, the decision boundary curves are capable of accurately capturing the stress state of the RPC slab in the presence of the impact caused by falling rocks of a certain quality and speed and thereby facilitate its convenient application in practical engineering.
Based on the two decision boundaries described in Eqs. (14) and (15), the impact energy of rock in both elastic and elastic-plastic states can be calculated, as presented in Table 6. As evident from Table 6 rockfalls with larger masses require significantly less energy to reach their critical state, therefore, an active protective system should be adopted for the threat posed by these falling rocks of large masses. Additionally, Wyllie's research [28] reveals that 90% of falling rocks have a mass of less than 1360 kg and a maximum mass of 4500 kg. Therefore, when a three-layered absorbing system is utilized to reduce the rockfall impact effect with a mass of 4.5 tons or less, the ultimate energy level for the system in the elastic state remains 1000 kJ, whereas the upper limit for the elastic-plastic state where some permanent deformations may occur, is obtained as 2400 kJ.
4.3. Parameter Analysis
(1) Effect of the concrete strength
To examine the effect of concrete strength on the protective capabilities of the shed slab, a slab with concrete strength of 50 MPa was selected for comparative analysis. The comparison of the stress states of the shed slabs can be obtained according to Figure 12, and the nonlinear elastic and elastic-plastic decision boundaries of the C50 slab could be expressed in the following form:
In particular, the number of specimens showing elastic and elastic-plastic behavior increased by 16 and 22, respectively, when the shed slab concrete strength was elevated from 50 MPa to 120 MPa, as evident from Table 7 and Figure 12. Furthermore, at the concrete strength of 120 MPa, the ultimate energy level under elastic conditions rises to 1001.35 kJ, which represents a significant increase of 73.63% compared to the corresponding level at the concrete strength of 50 MPa. Similarly, in the elastic-plastic state, the limit energy level increases to 2352.13 kJ, which represents a significant increase of 32.4% compared to the 50 MPa level. This finding emphasizes the remarkable effect of increasing concrete strength on the protective performance of cave slabs. Specifically, when evaluated in terms of stress-strain behavior, the RPC slab exhibits an impact resistance that is approximately 1.3 to 1.7 times greater than that of C50 concrete.
(2) Effect of the cushion layer thickness
To investigate the effect of different thicknesses of the composite cushion on the protective performance of the shed slab, while preserving the total thickness of the cushion, three different EPS cushion thicknesses of 50cm (RSE1), 40cm (RSE2), and 20cm (RSE4) were chosen. A comparative analysis of stress states within the shed slab is presented in Figure 13. The specific nonlinear elastic and elastic-plastic decision boundaries for RSE1 and RSE4 can be, respectively, provided by:
As presented in Figure 13 and Table 8, the number of samples exhibiting elastic and elastic-plastic behaviors increases gradually with EPS thickening. Furthermore, the decision boundary for each stress state gradually shifts towards the upper right quadrant of the coordinate system. This is mainly because increasing the EPS thickness enhances the impact resistance of the composite system. Specifically, the limiting energy level for RSE4 in the elastic state is obtained as 463.4 kJ, which shows a significant reduction of 53.72% compared to RSE2. On the contrary, in the elastic-plastic state, the ultimate energy level is 1679.51 kJ, which represents a reduction of 28.6%. These findings emphasize the substantial influence of the thickness factor on the protective capabilities of the composite cushion. When the overall thickness remains constant, increasing the EPS thickness leads to the enhancement of the impact resistance of the system.
5. Conclusions
This paper deals with the development of a three-dimensional coupled model of block impact on a three-layered absorbing system via the SPH-FEM coupled approach. Furthermore, this study proposes an evaluation metric to assess the protective performance of lightweight cushion layers, explicitly incorporating the influence of impact energy levels. Finally, based on the logistic regression algorithm, the RPC slab stress state evaluation model is appropriately established accounting for the speed and mass of the rockfall.
The obtained results reveal that the energy dissipation effect of the composite protective cushion is significant, and the RC slab and sand cushion dissipate most of the impact energy. Notably, the energy dissipation by the EPS cushion only reduces 18.5% of the total absorbed impact energy, which effectively lessens the issue of EPS susceptibility to breakage under excessive impact loads Compared with the 90 cm sand cushion, the peak stress of the steel bar was reduced by 40.34%, while the principal compressive stress of the RPC slab showed a 33.74% reduction when using the composite cushion. Additionally, the SEDR index proposed in this study can intuitively quantify the lightweight level and impact resistance of the protective cushion system under different impact energy levels. Specifically, the impact resistance performance index SEDR of the three-layered absorbing system reached 2.5, indicating a 55% enhancement compared to the sand cushion (SEDR=1.61). Furthermore, based on the analysis of the stress state recognition model, the ultimate energy level of the composite cushion consisting of the optimal thickness is 1000 kJ in the elastic state and 2400 kJ in the elastoplastic state. The analysis of the parameters shows that the strength of the concrete and the thickness of the cushion has a significant effect on the protective performance of the shed-tunnel structure, and the impact resistance of the RPC slab is about 1.3-1.7 times that of C50 concrete. The elastic ultimate energy level of the RPC slab in the thickness of is 463.4kJ, which decreases by 53.72% compared with 40cm EPS thickness. The limit energy level of the elastoplastic state is 1962.05 kJ with a reduction of 16.6%. It can be seen that increasing the thickness of EPS could better enhance the impact resistance of the protection system.
Author Contributions
Dongmin Deng: Writing– review & editing, Writing-original draft, Software, Data curation. Hanqing Zhong: Writing-original draft, Software, Data curation, Methodology. Shuisheng Chen: Writing– review & editing, Supervision, Visualization. Zhixiang Yu: Writing– review & editing, Supervision, Methodology.
Acknowledgments
This study is financially supported by the National Natural Science Foundation of China (Grant No.:12062006), the Transport Technology Project of Jiangxi Province, China (Grant No. 2023H0018), Ph.D. Initiation Fund Project (Grant No. 2003423052). The authors would like to express their gratitude to EditSprings (https://www.editsprings.cn) for the expert linguistic services provided.
Conflicts of Interest
The authors declare that they have no known competing financial interests or personal relationships that could have appeared to influence the work reported in this paper.
References
- Cao, Z.; Liu, Z.; Xu, G.; et al. Risk assessment and prevention for typical railway bridge pier under rockfall impact [J]. Structures, 2024, 62, 106178. [Google Scholar] [CrossRef]
- Zhang, D.; Sun, Z.; Fang, Q. Scientific problems and research proposals for Sichuan-Tibet railway tunnel construction [J]. Underground Space, 2021, 7, 419–439. [Google Scholar] [CrossRef]
- Yang, Z.-H.; Guo, C.-B.; Wu, R.-A.; et al. Potential seismic landslide hazard and engineering effect in the Ya’an-Linzhi section of the Sichuan-Tibet transportation corridor, China [J]. China Geology, 2023, 6, 228–240. [Google Scholar] [CrossRef]
- Zhong, H.; Lyu, L.; Yu, Z.; Liu, C. Study on mechanical behavior of rockfall impacts on a shed slab based on experiment and SPH–FEM coupled method [J]. Structures, 2021, 33, 1283–1298. [Google Scholar] [CrossRef]
- Yan, S.; Wang, Y.; Wang, D.; He, S. Application of EPS geofoam in rockfall galleries: Insights from large-scale experiments and FDEM simulations [J]. Geotextiles and Geomembranes, 2022, 50, 677–693. [Google Scholar] [CrossRef]
- Bhatti, A.Q. Computational Modeling of Energy Dissipation Characteristics of Expanded Polystyrene (EPS) Cushion of Reinforce Concrete (RC) Bridge Girder Under Rockfall Impact [J]. International Journal of Civil Engineering, 2018, 16, 1635–1642. [Google Scholar] [CrossRef]
- Zhao, P.; Yuan, S.; Li, L.; et al. Experimental study on the multi-impact resistance of a composite cushion composed of sand and geofoam [J]. Geotextiles and Geomembranes, 2021, 49, 45–56. [Google Scholar] [CrossRef]
- Ouyang, C.; Liu, Y.; Wang, D.; He, S. Dynamic Analysis of Rockfall Impacts on Geogrid Reinforced Soil and EPS Absorption Cushions [J]. KSCE Journal of Civil Engineering, 2019, 23, 37–45. [Google Scholar] [CrossRef]
- Wang, E.; Chen, C.; Zhang, G.; et al. Multiaxial mechanical characterization of additively manufactured open-cell Kelvin foams [J]. Composite Structures, 2023, 305, 116505. [Google Scholar] [CrossRef]
- Li, Y.; Zong, Z.; Sun, T. Crushing behavior and load-reducing performance of a composite structural buffer during water entry at high vertical velocity [J]. Composite Structures, 2021, 255, 112883. [Google Scholar] [CrossRef]
- Tafreshi, S.N.M.; Darabi, N.J.; Azizian, M.; et al. Evaluation of arched EPS block and geocell inclusions in trench backfill for protection of buried flexible pipes [J]. Geotextiles and Geomembranes, 2024, 52, 671–689. [Google Scholar] [CrossRef]
- Solomon, A.A.; Hemalatha, G. Characteristics of expanded polystyrene (EPS) and its impact on mechanical and thermal performance of insulated concrete form (ICF) system [J]. Structures, 2020, 23, 204–213. [Google Scholar] [CrossRef]
- Hsu, S.-H.; Maegawa, K.; Chen, L.H. EXPERIMENTAL STUDY ON THE EPS-BASED SHOCK ABSORBER FOR ROCK-SHED [J]. International Journal of Geomate, 2016, 11, 2534–2540. [Google Scholar] [CrossRef]
- Zhao, P.; Xie, L.; Li, L.; et al. Large-scale rockfall impact experiments on a RC rock-shed with a newly proposed cushion layer composed of sand and EPE [J]. Engineering Structures, 2018, 175, 386–398. [Google Scholar] [CrossRef]
- Association, J.R. Rockfall countermeasures Handbook [M]. Japan: Maruzen Publishing Co; 2000.
- Kishi, N.; Konno, H.; Kawase, R. Development of Three-Layered Absorbing System for Rock-Sheds [J]. Iabse Symposium Report, 2005, 90, 17–22. [Google Scholar] [CrossRef]
- Sun G; Li G; Hou S, et al. Crashworthiness design for functionally graded foam-filled thin-walled structures[J]. Materials Science and Engineering: A, 2010, 527, 1911–1919. [CrossRef]
- Zhang H; Chen P; Lin G, et al. A corrugated gradient mechanical metamaterial: Lightweight, tunable auxeticity and enhanced specific energy absorption[J]. Thin-Walled Structures, 2022, 176, 109355. [CrossRef]
- Ryzińska, G.; David, M.; Prusty, G.; et al. Effect of fibre architecture on the specific energy absorption in carbon epoxy composite tubes under progressive crushing[J]. Composite Structures, 2019, 227, 111292. [Google Scholar] [CrossRef]
- Liu, C.; Liao, H. Buffer Capacity of Steel Shed with Two Layer Absorbing System against the Impact of Rockfall Based on Coupled SPH-FEM Method [J]. Sustainability 2022, 14. [Google Scholar] [CrossRef]
- Zhou, Y.; Sun, Y.; Huang, T.; Cai, W. SPH-FEM simulation of impacted composite laminates with different layups [J]. Aerospace Science and Technology, 2019, 95, 105469. [Google Scholar] [CrossRef]
- Xiao, Y.; Zou, W. FEM-SPH coupling approach for impact response analysis of composite plates with brick-and-mortar structure[J]. International Journal of Computational Methods, 2023, 20, 2350005. [Google Scholar] [CrossRef]
- Liu, M.B.; Liu, G.R. Smoothed Particle Hydrodynamics (SPH): an Overview and Recent Developments [J]. Archives of Computational Methods in Engineering, 2010, 17, 25–76. [Google Scholar] [CrossRef]
- Liu, J.; Wu, C.; Li, J.; et al. Ceramic balls protected ultra-high performance concrete structure against projectile impact–A numerical study [J]. International Journal of Impact Engineering, 2019, 125, 143–162. [Google Scholar] [CrossRef]
- Zhang, Z.; Qiang, H.; Gao, W. Coupling of smoothed particle hydrodynamics and finite element method for impact dynamics simulation [J]. Engineering Structures, 2011, 33, 255–264. [Google Scholar] [CrossRef]
- Huo, Y.; Zhong, Y.; Xin, M.; Li, S. Modeling and simulation of droplet impact on an elastic beam based on FEM-SPH and SPH-SPH FSI methods [J]. Ocean Engineering, 2024, 310, 118730. [Google Scholar] [CrossRef]
- Darwin, D.; Dolan, C.W.; Nilsson, A.H. Basic Principles of Concrete Structures [M]. China Machine Press; 2018.
- W. D. C. Rock fall engineering [M]. Log Angeles: CRC Press; 2014.
Figure 1.
Schematic representation of the SPH-FEM coupled contact at their interface.
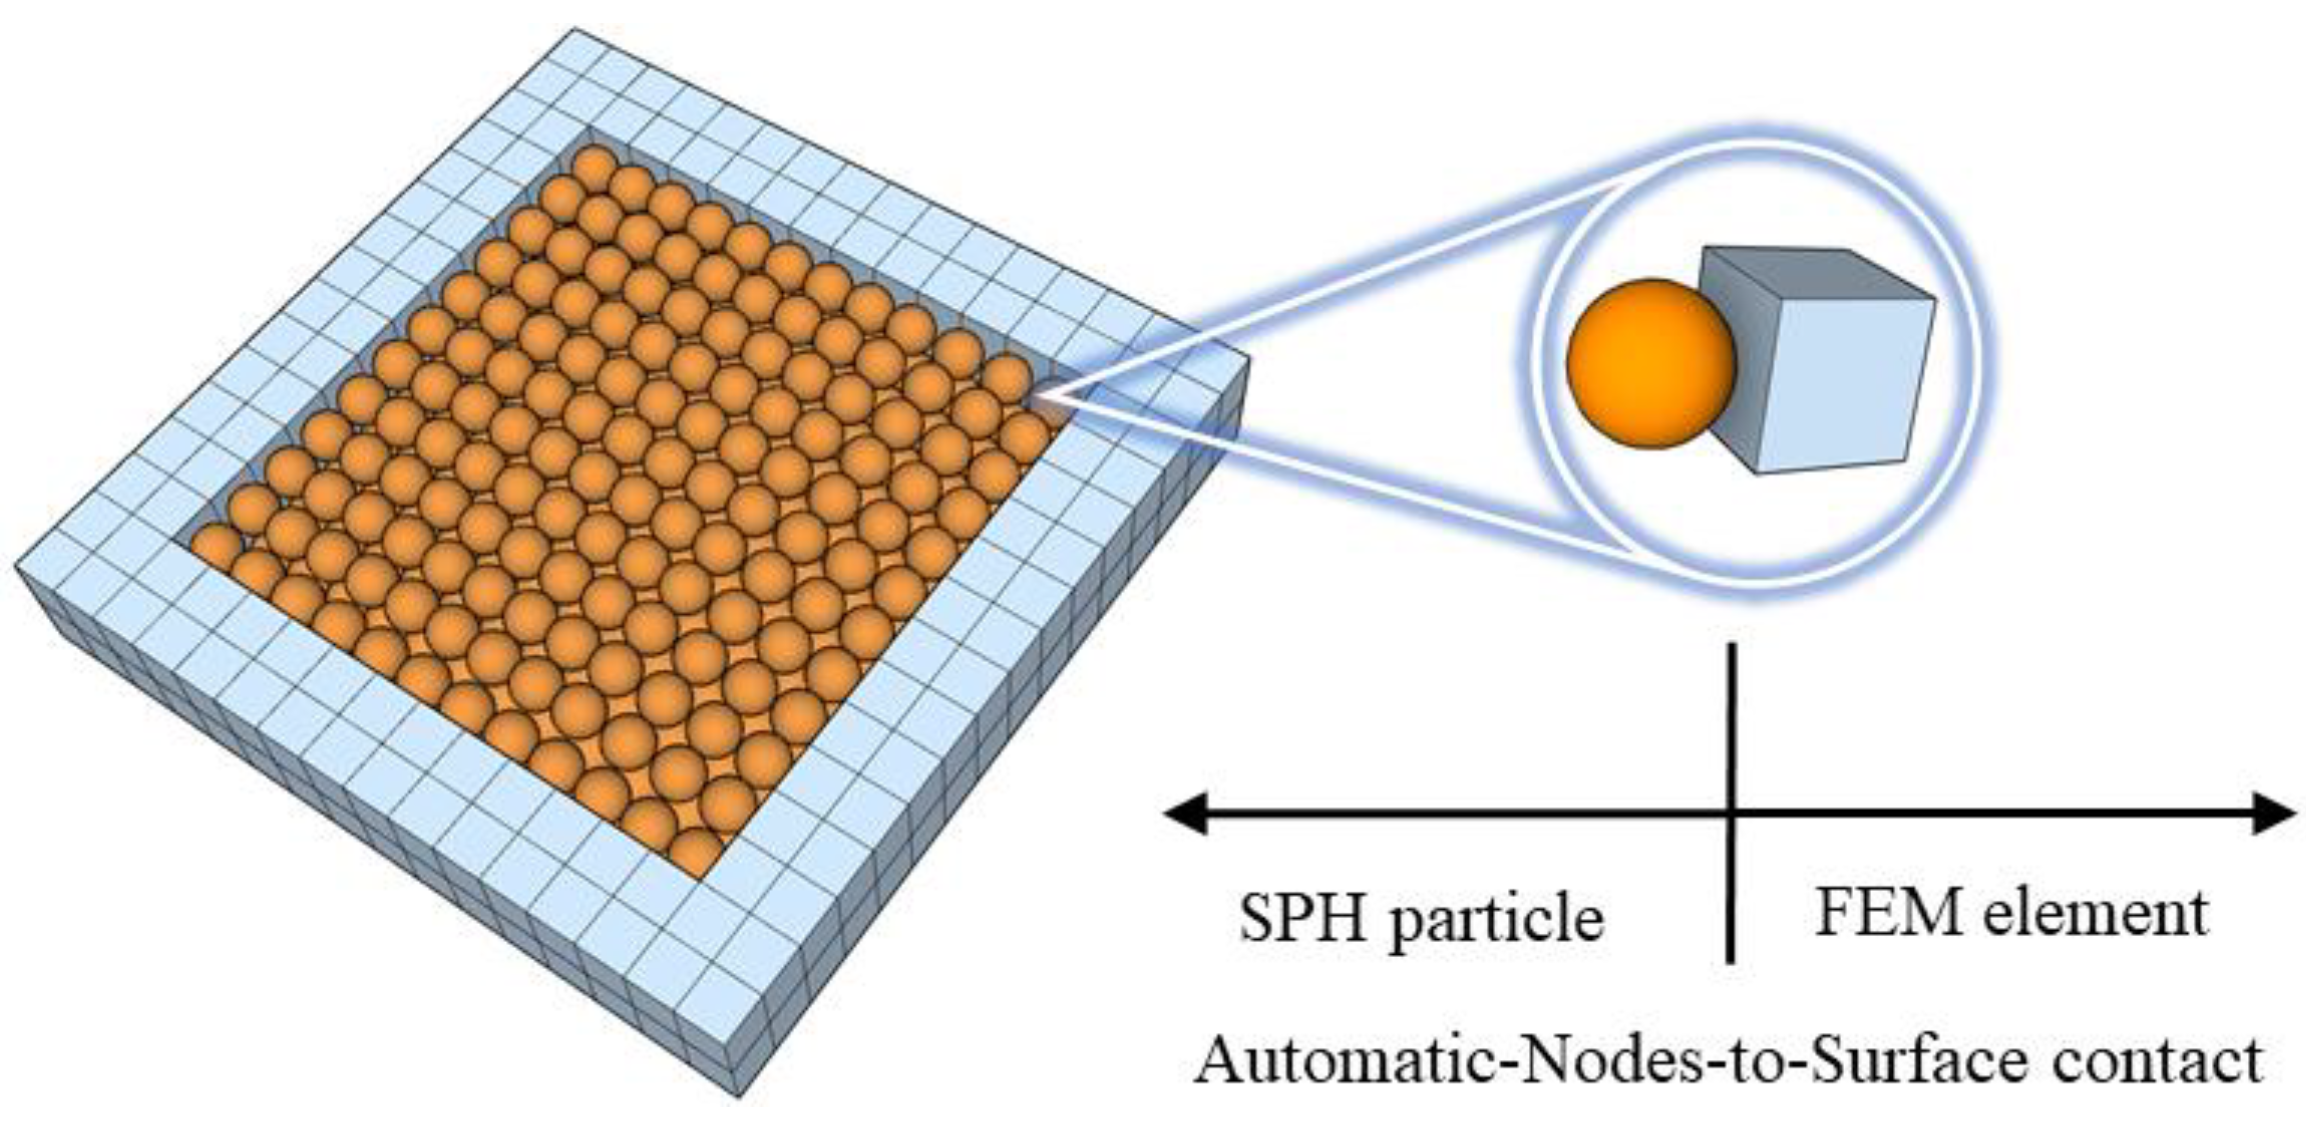
Figure 2.
The materials' constitutive relationships and geometry properties and the equipment utilized for the impact experiment.
Figure 2.
The materials' constitutive relationships and geometry properties and the equipment utilized for the impact experiment.
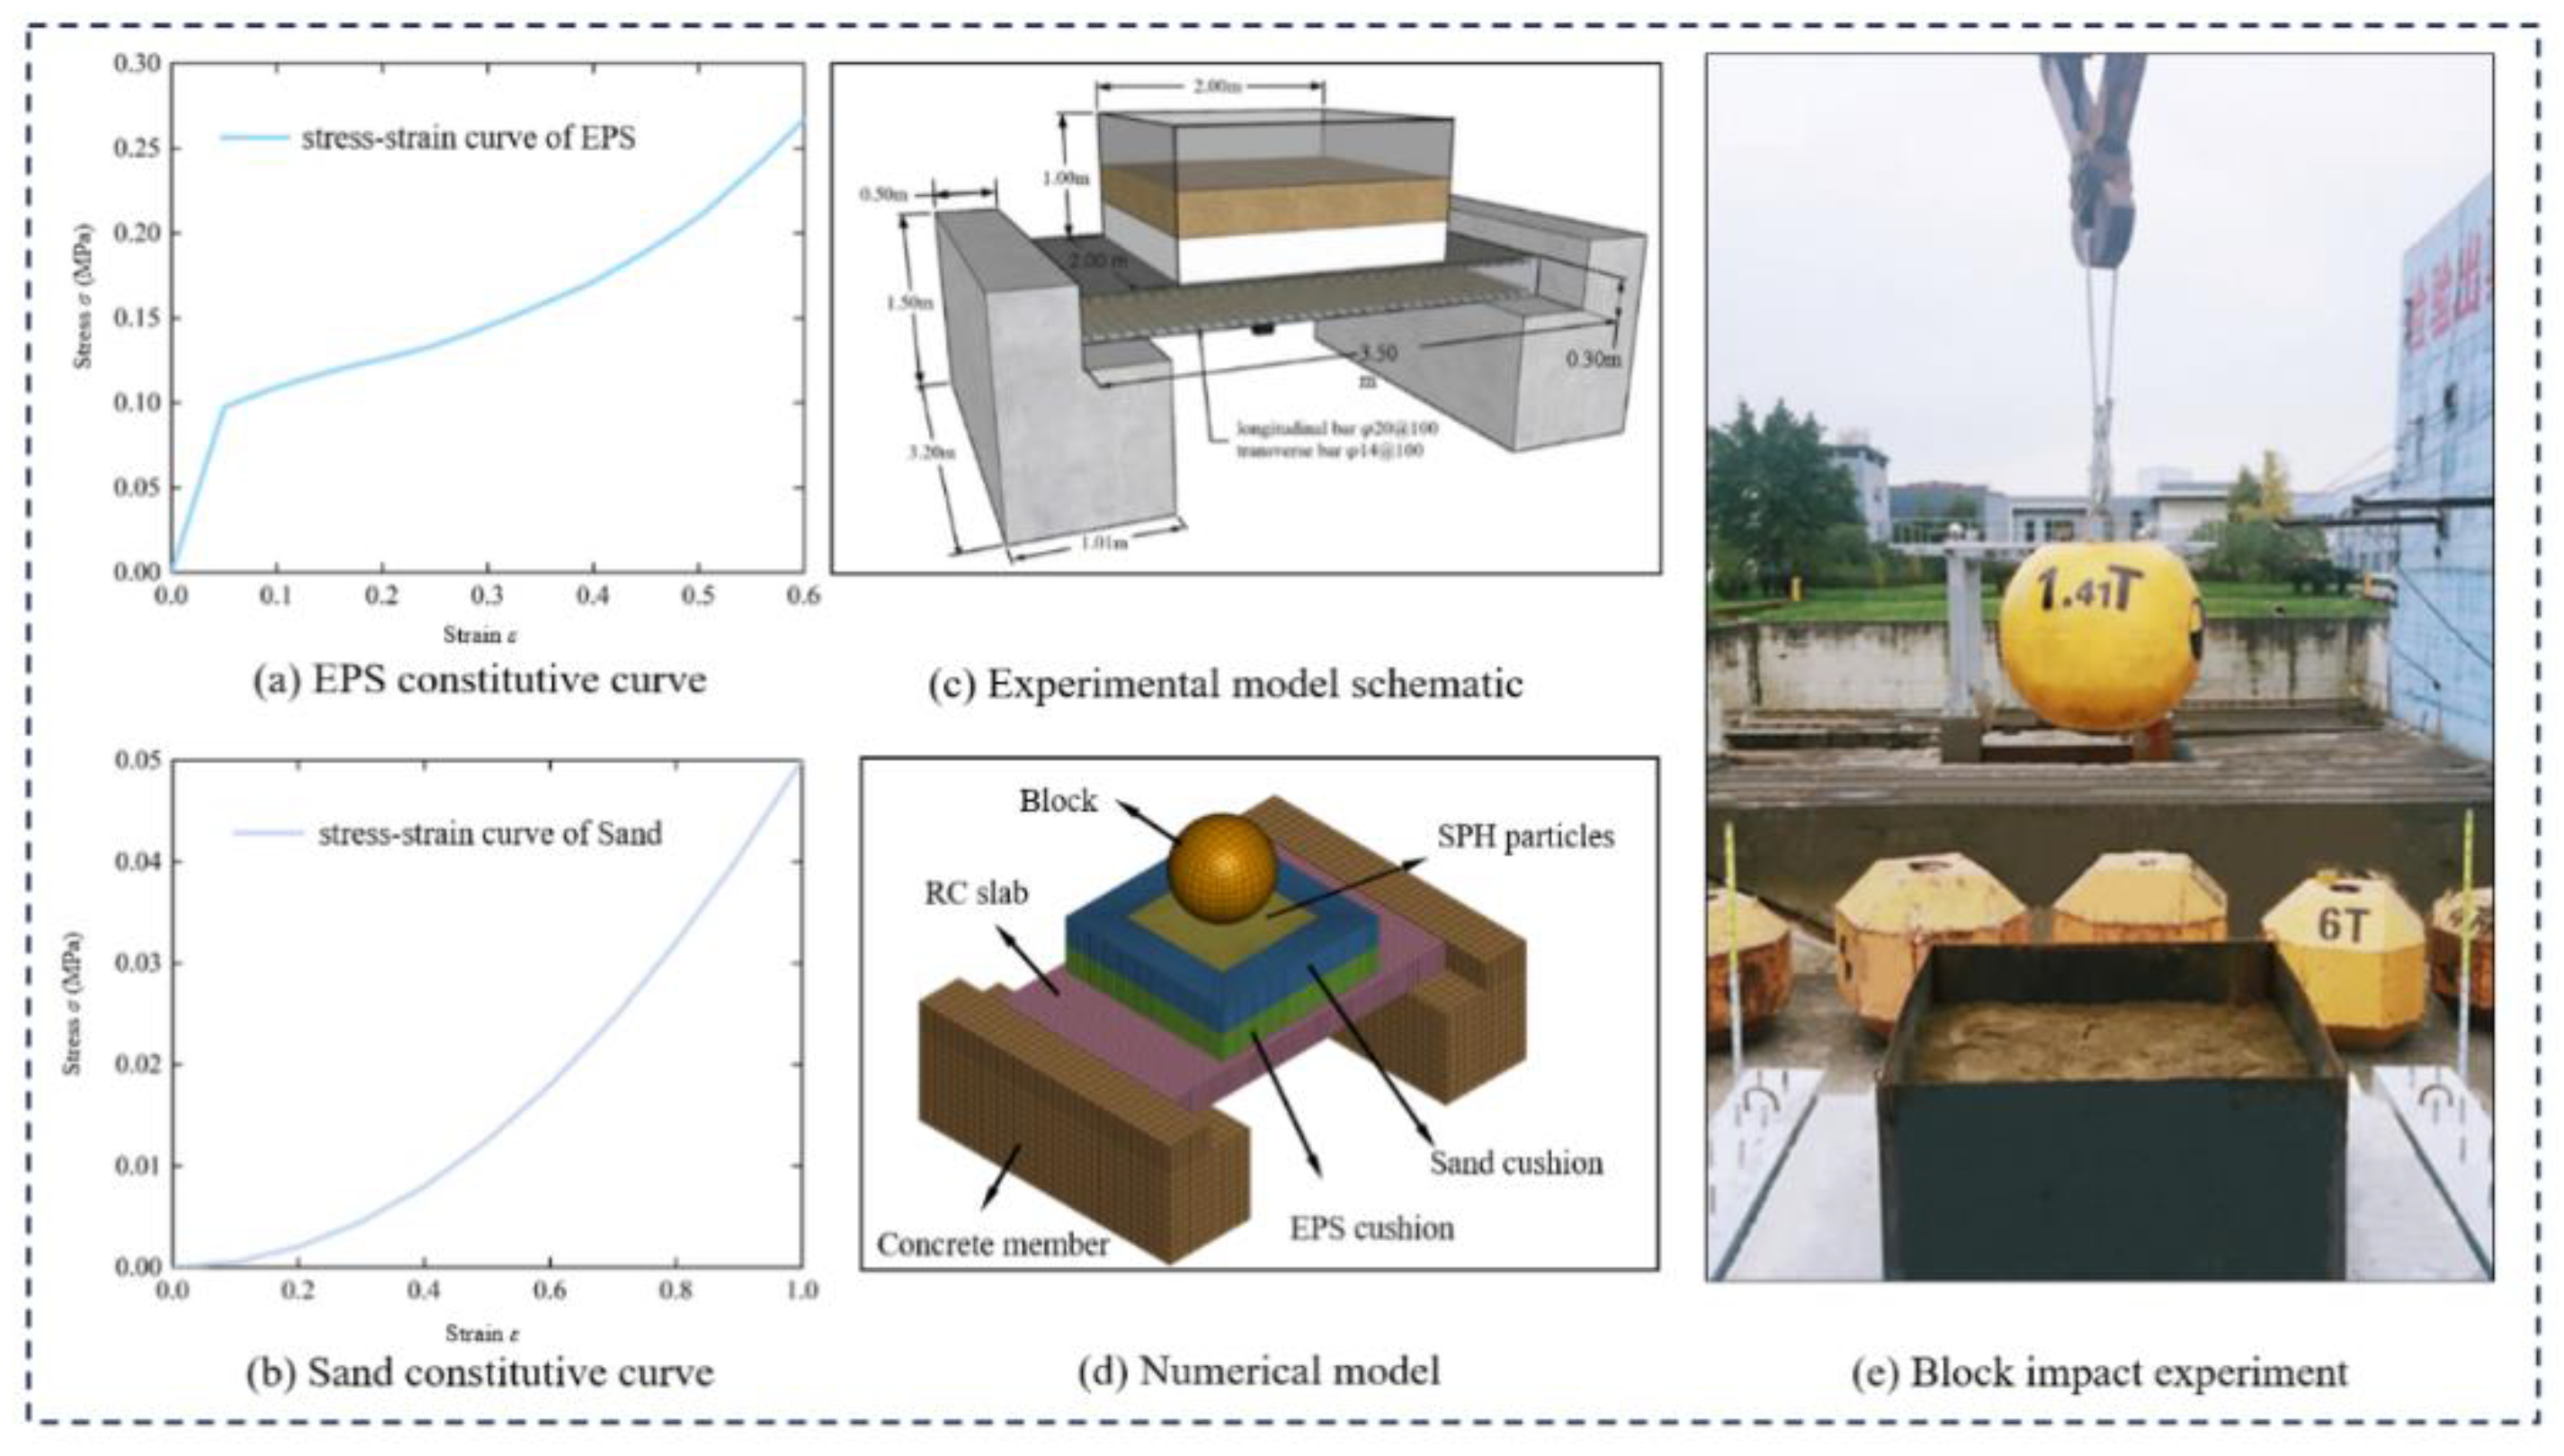
Figure 3.
Comparison between the impact force numerical simulation and the test results for the two sets of impact energy: (a) 50 kJ, (b) 150 kJ.
Figure 3.
Comparison between the impact force numerical simulation and the test results for the two sets of impact energy: (a) 50 kJ, (b) 150 kJ.
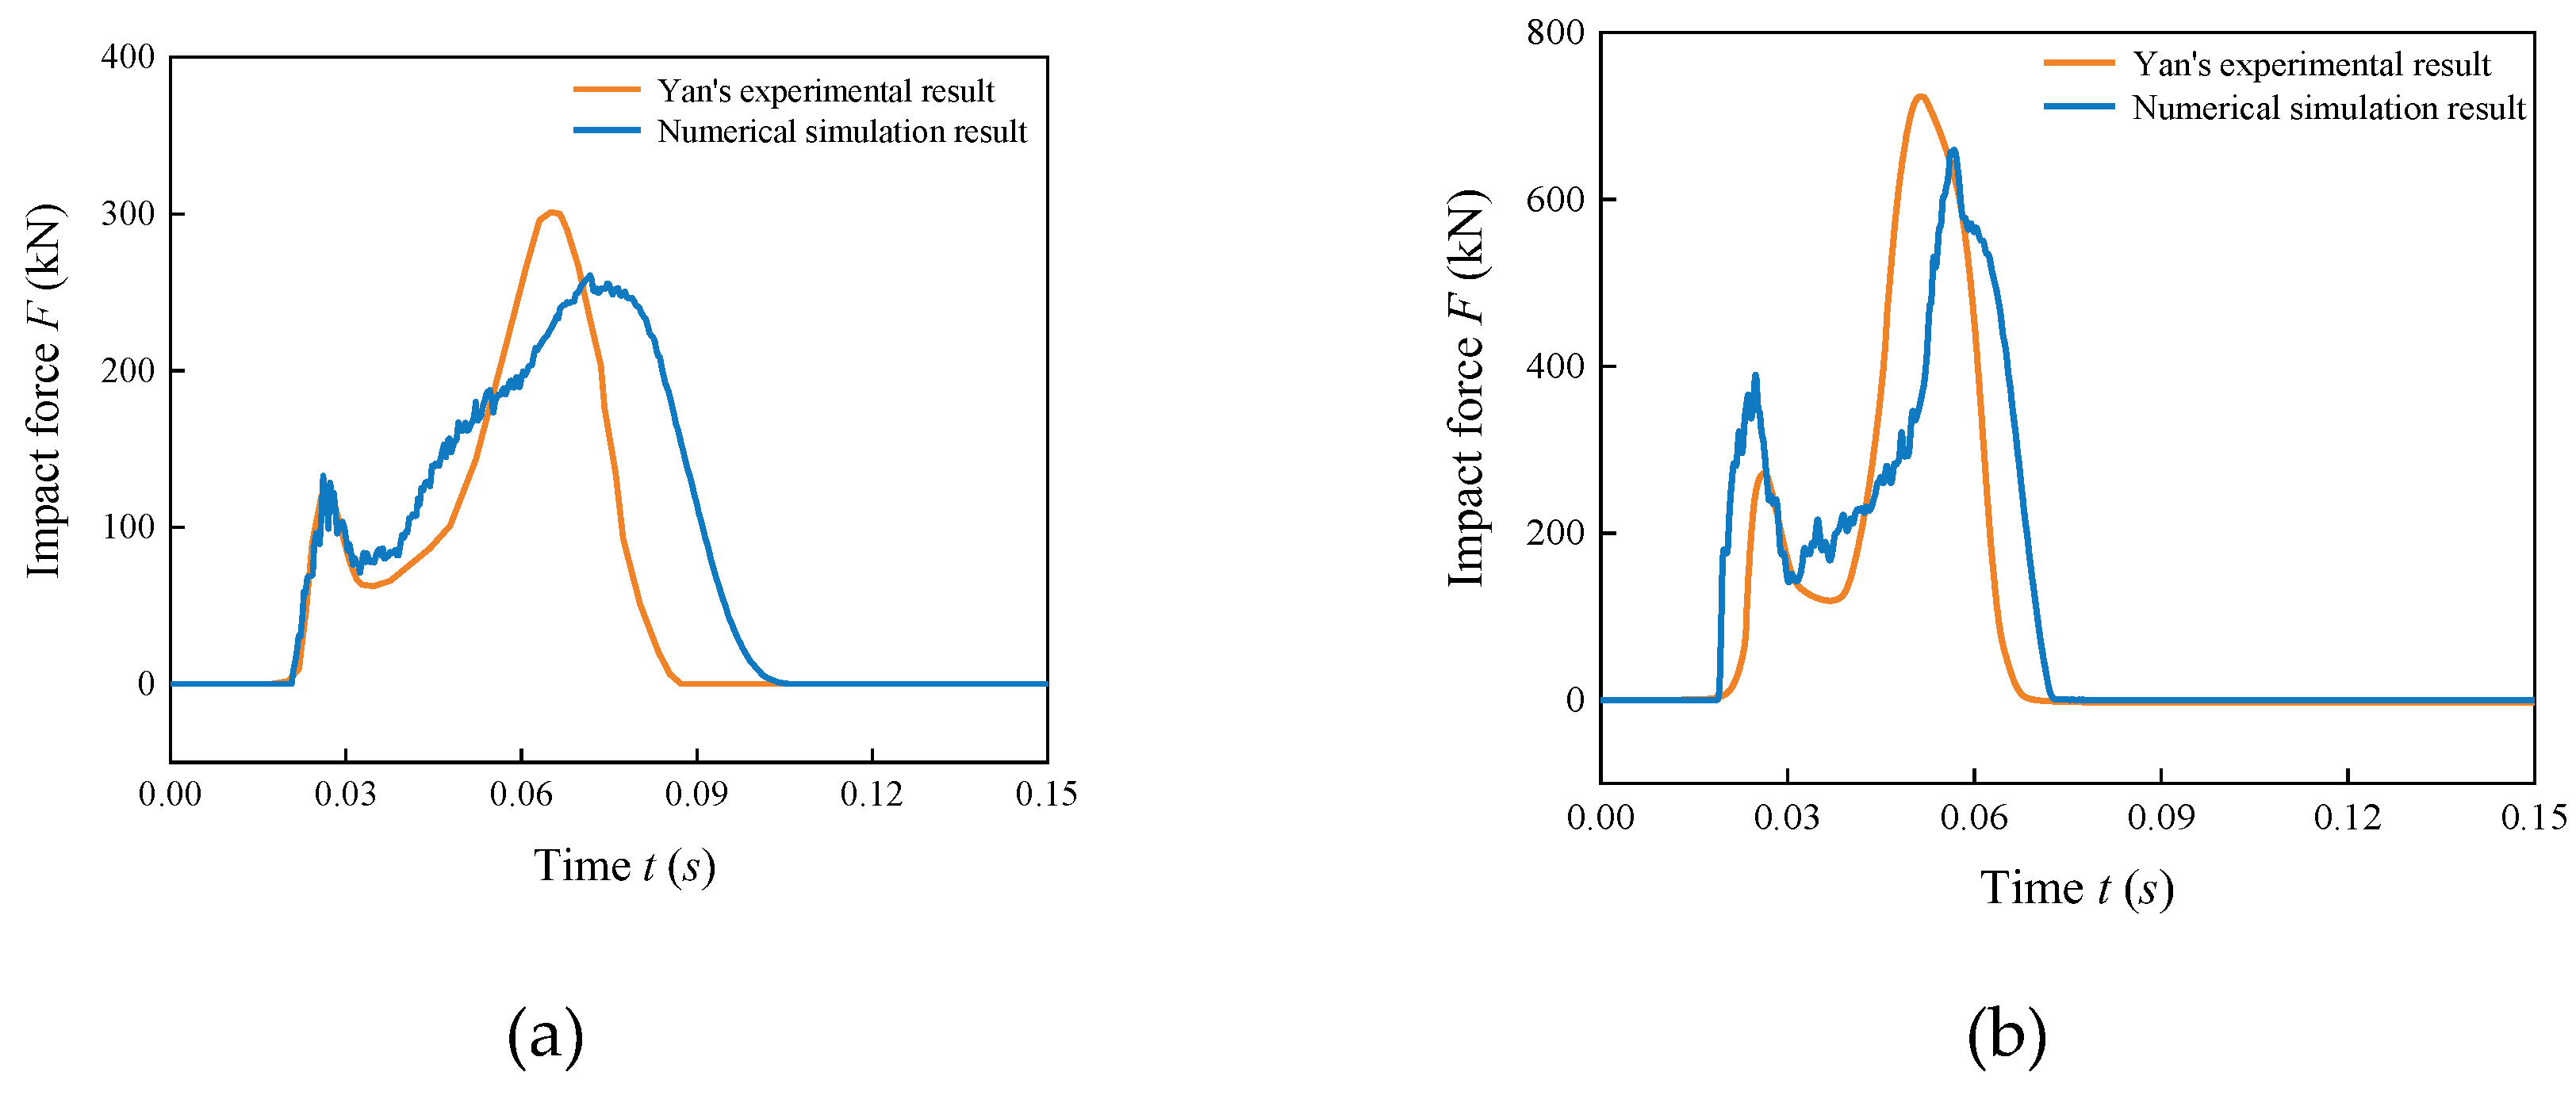
Figure 4.
Simulation and test comparison results of the EPS material deformation.
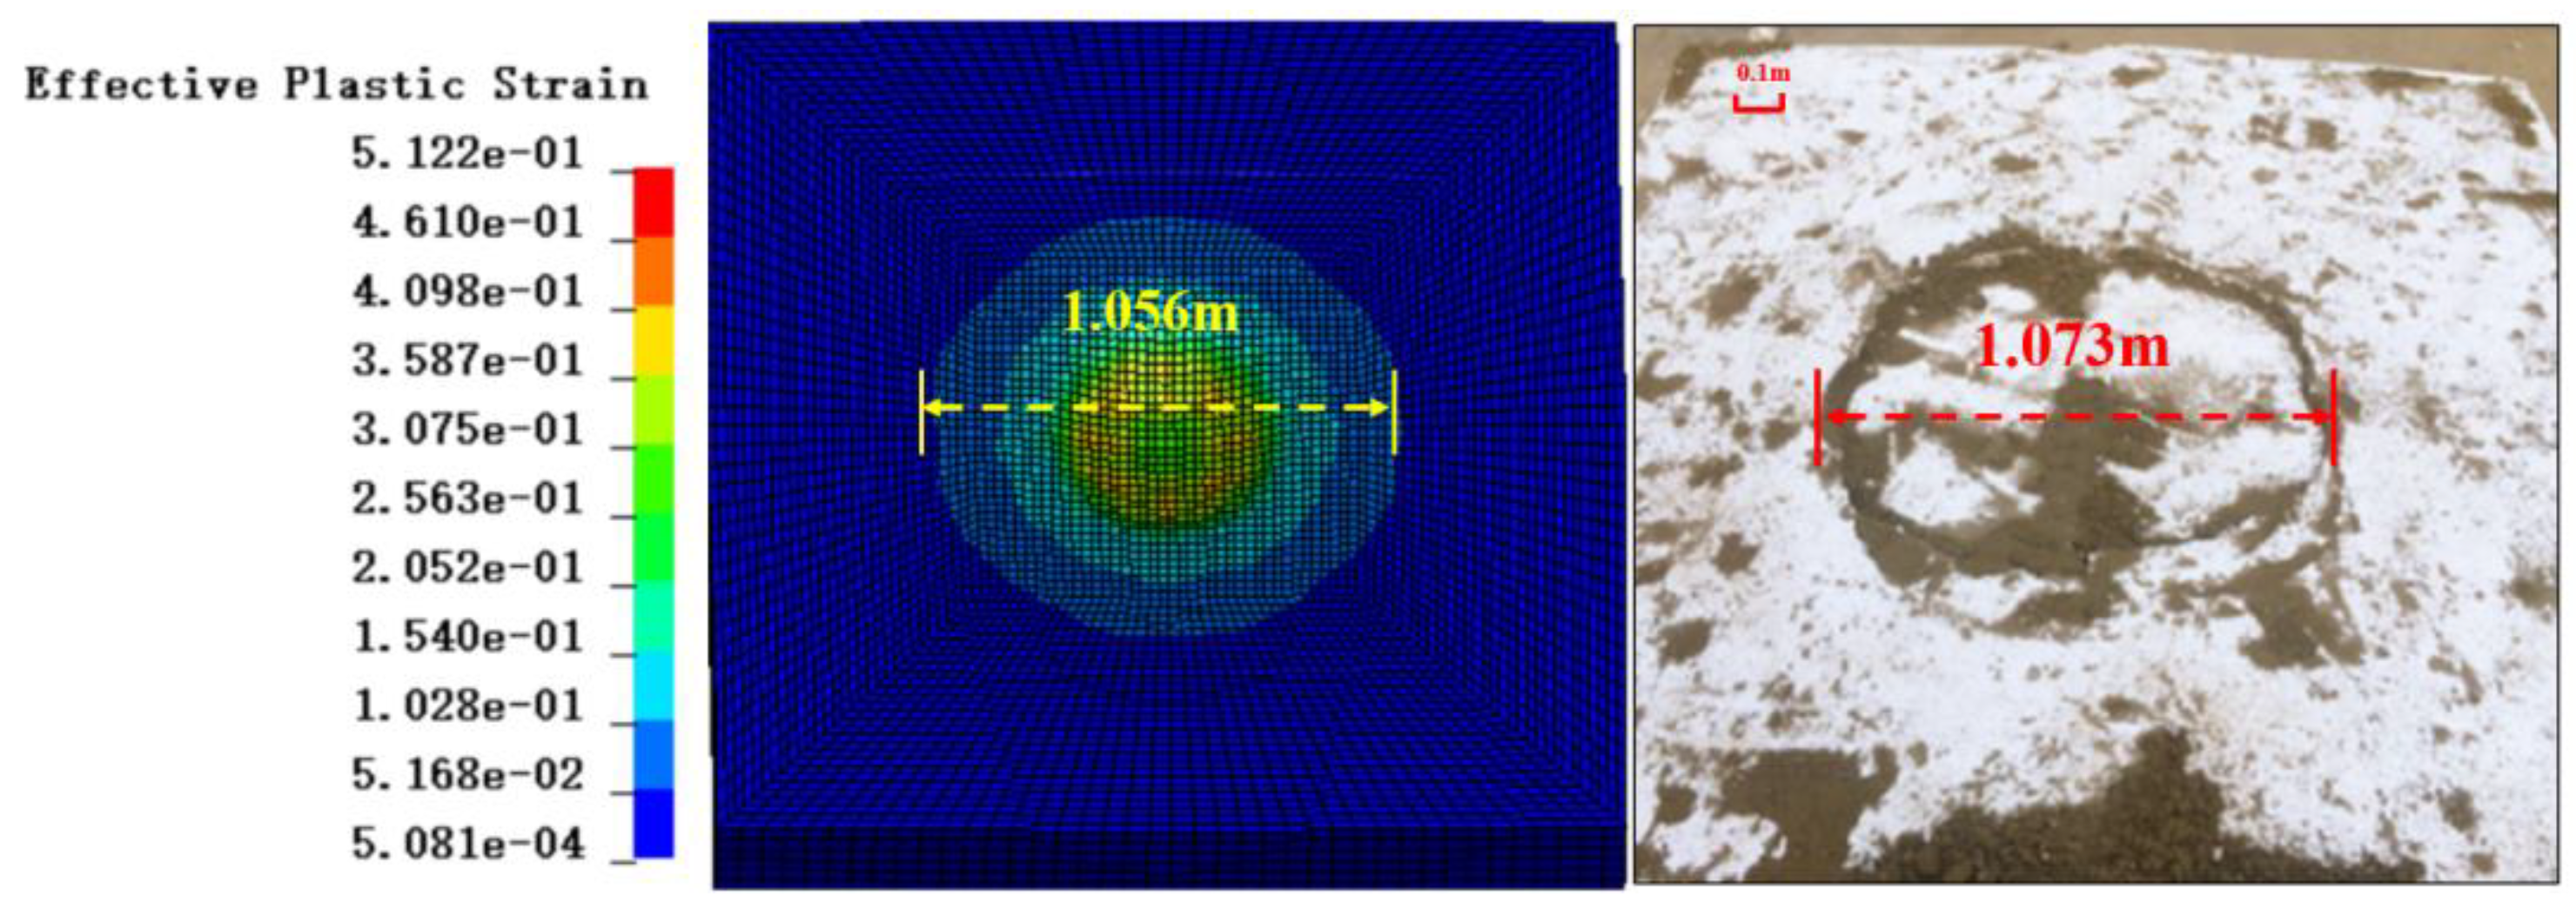
Figure 5.
Numerical model of the three-layered absorbing system.
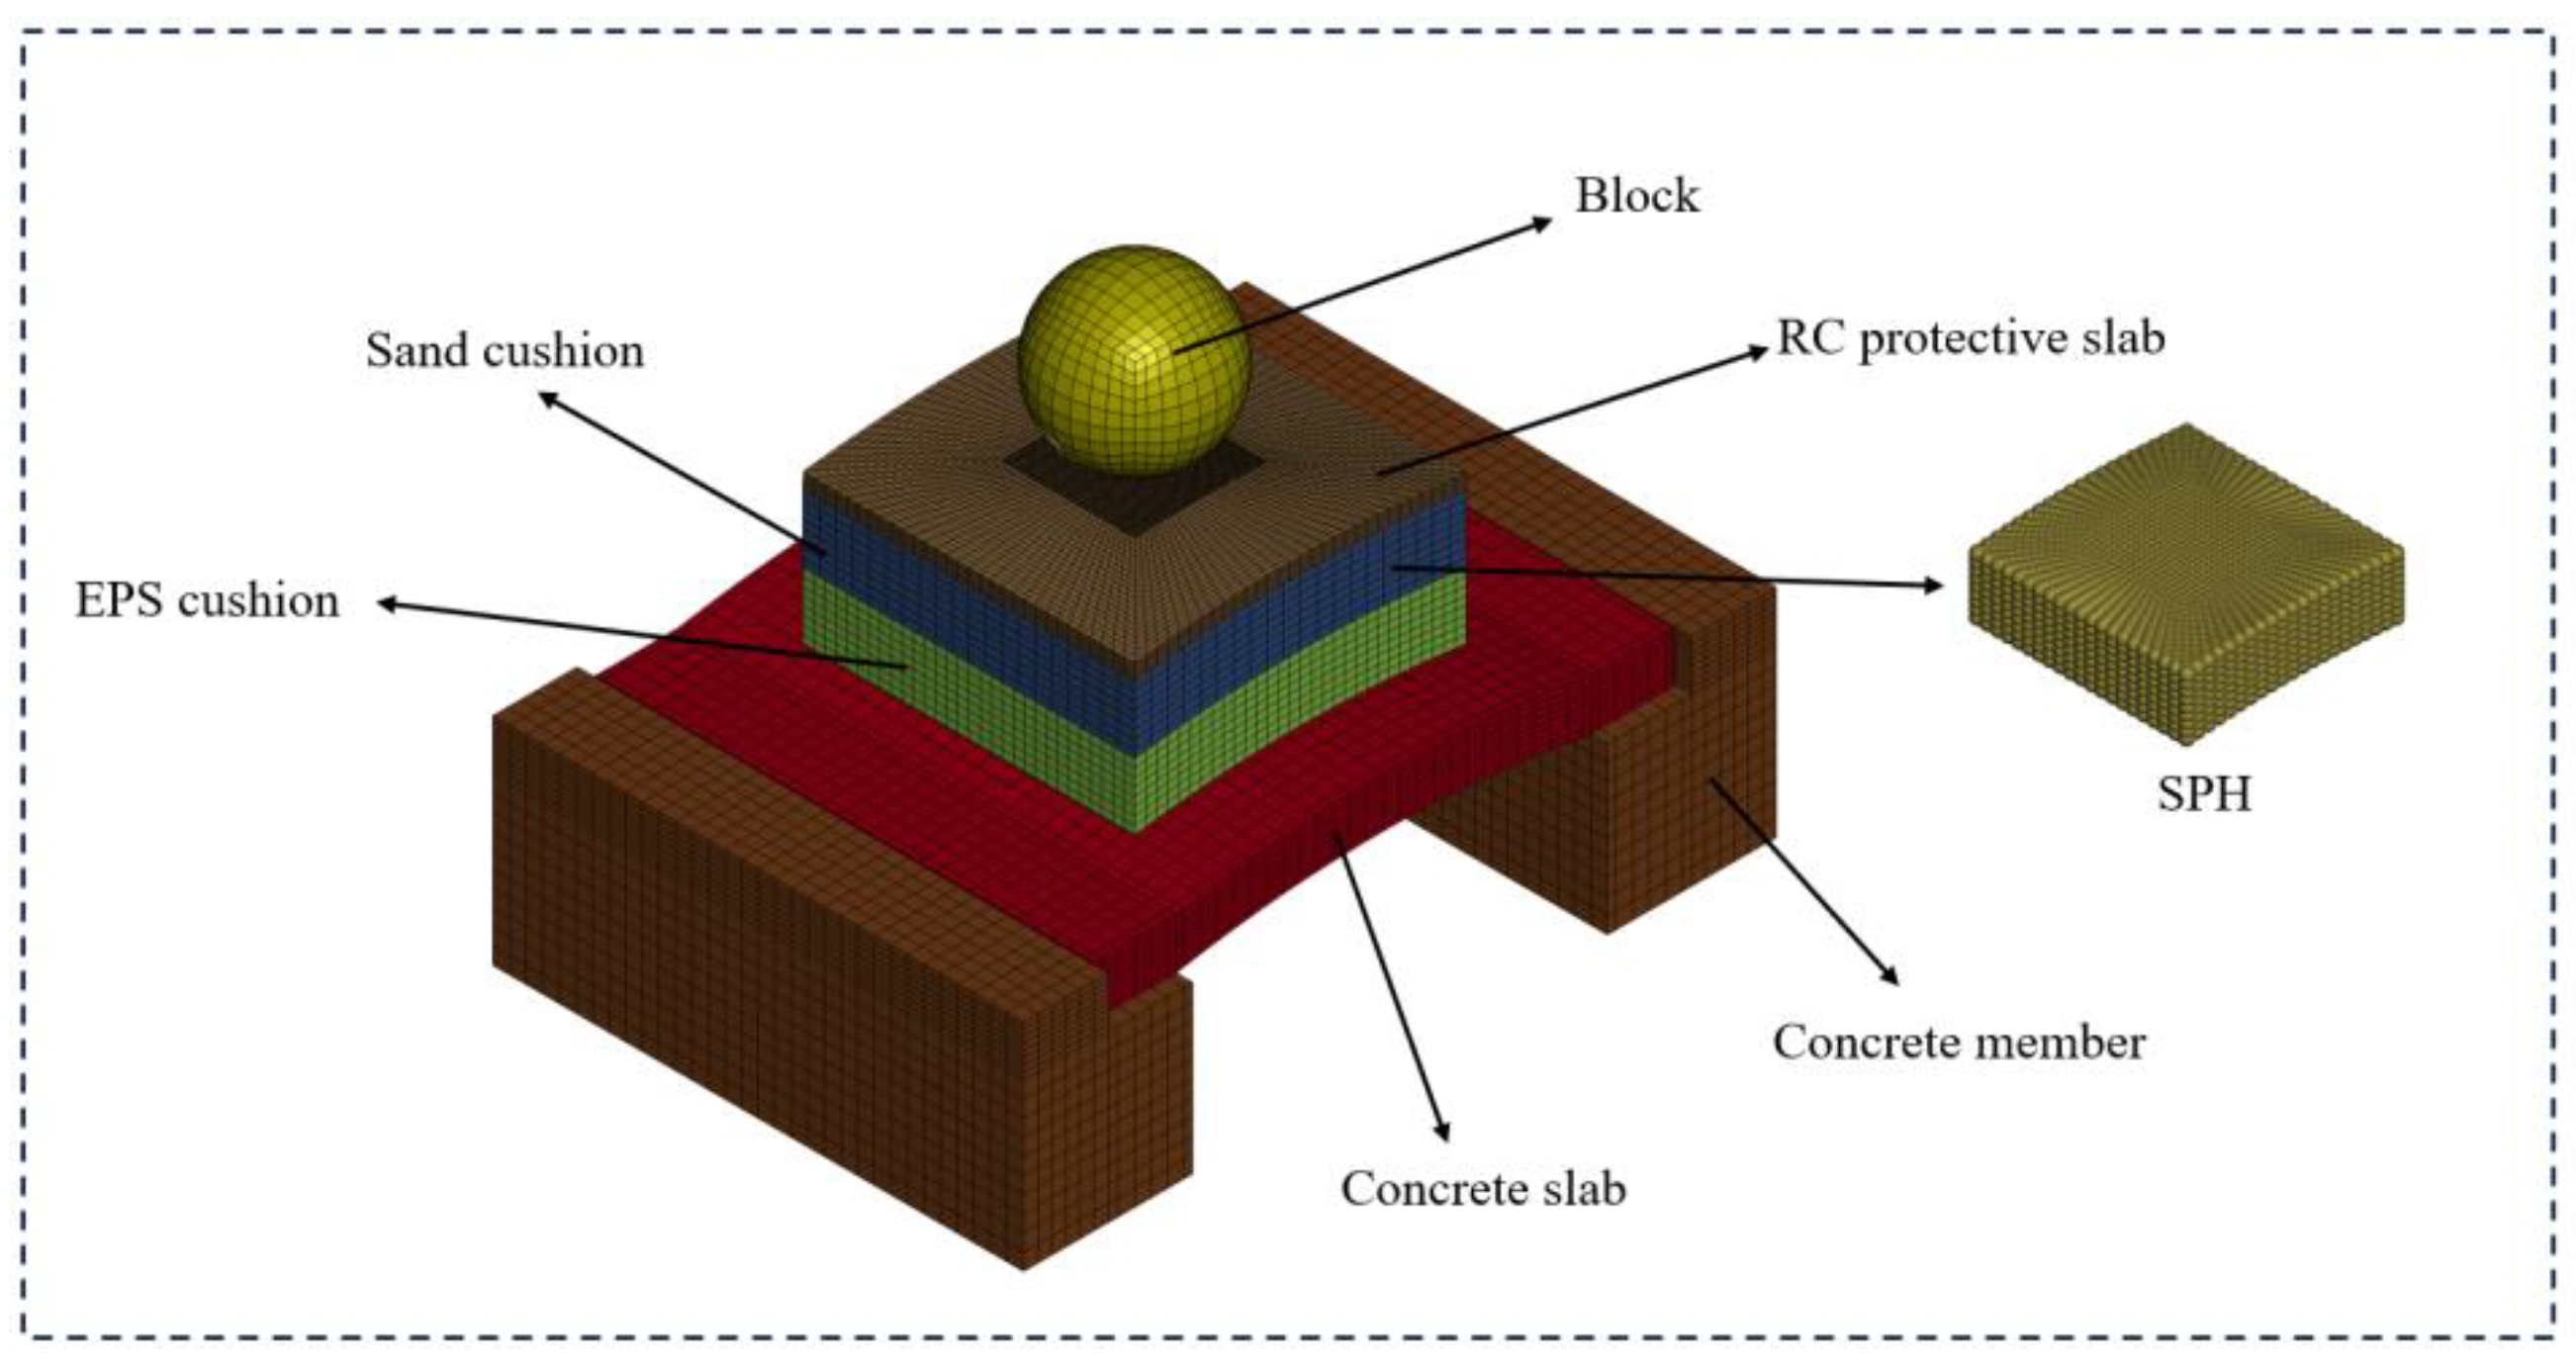
Figure 6.
Numerical simulation impact process in the presence of the 250kj impact energy.
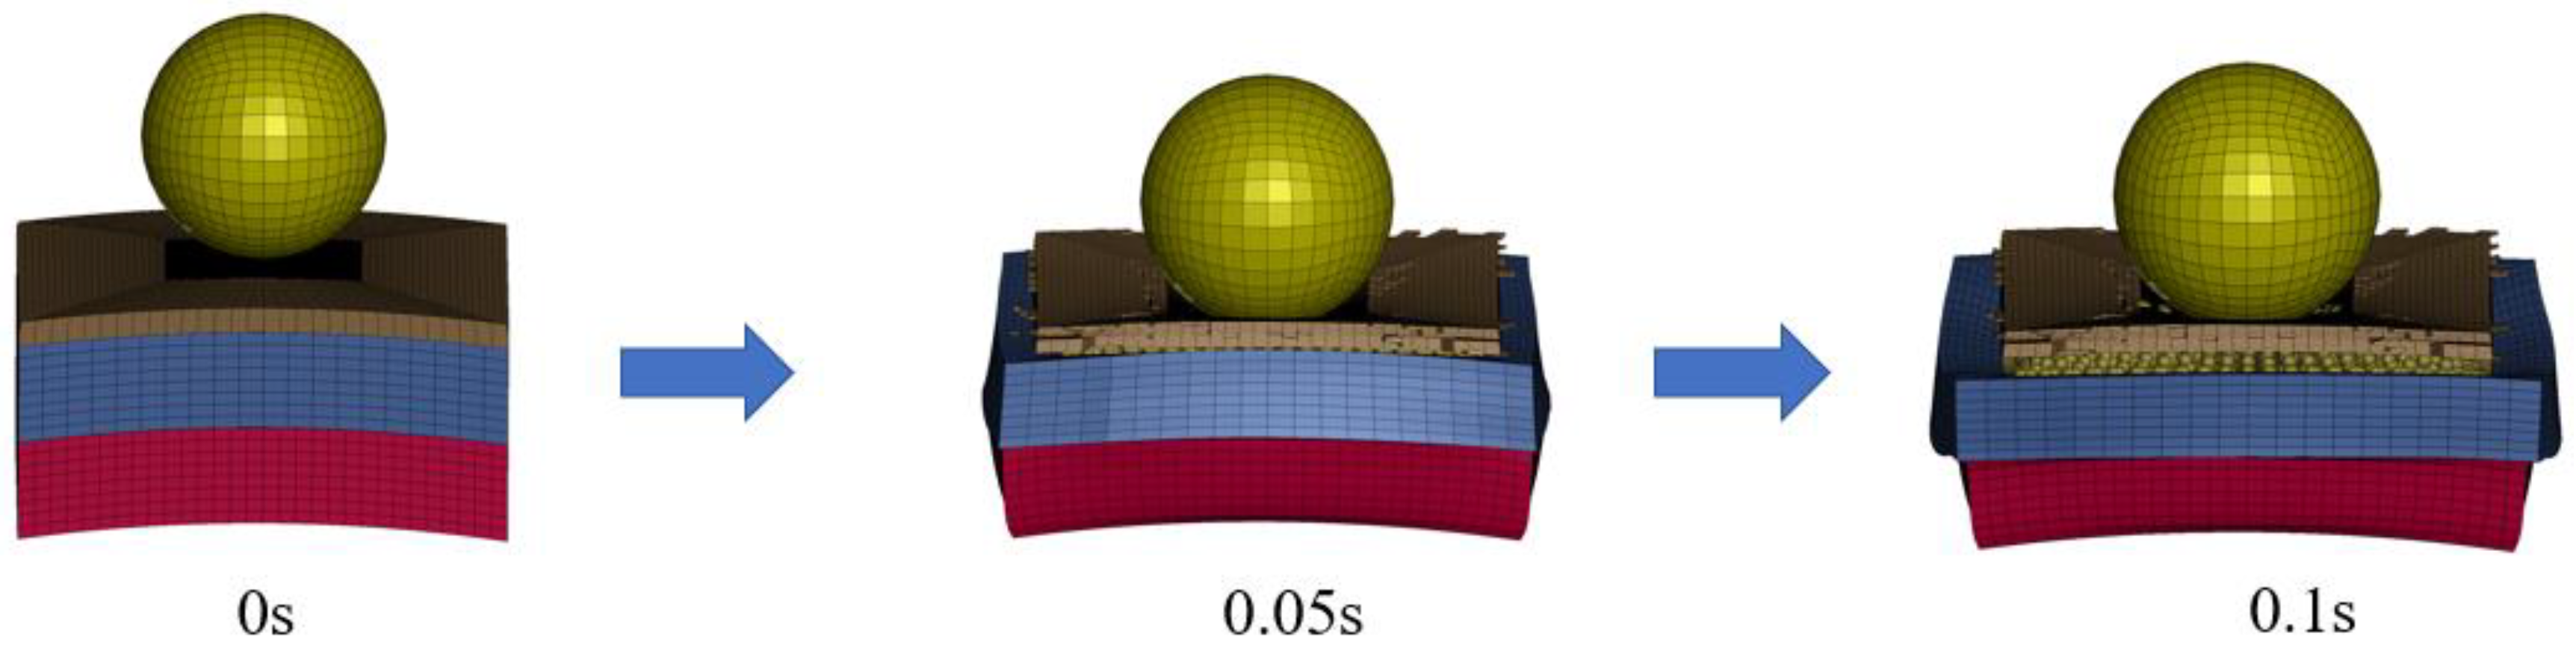
Figure 7.
Evolution of the impact kinetic energy and its components for various cushion layers: (a) Dissipation energy of the composite cushion, (b) Dissipation energy of the RC slab.
Figure 7.
Evolution of the impact kinetic energy and its components for various cushion layers: (a) Dissipation energy of the composite cushion, (b) Dissipation energy of the RC slab.
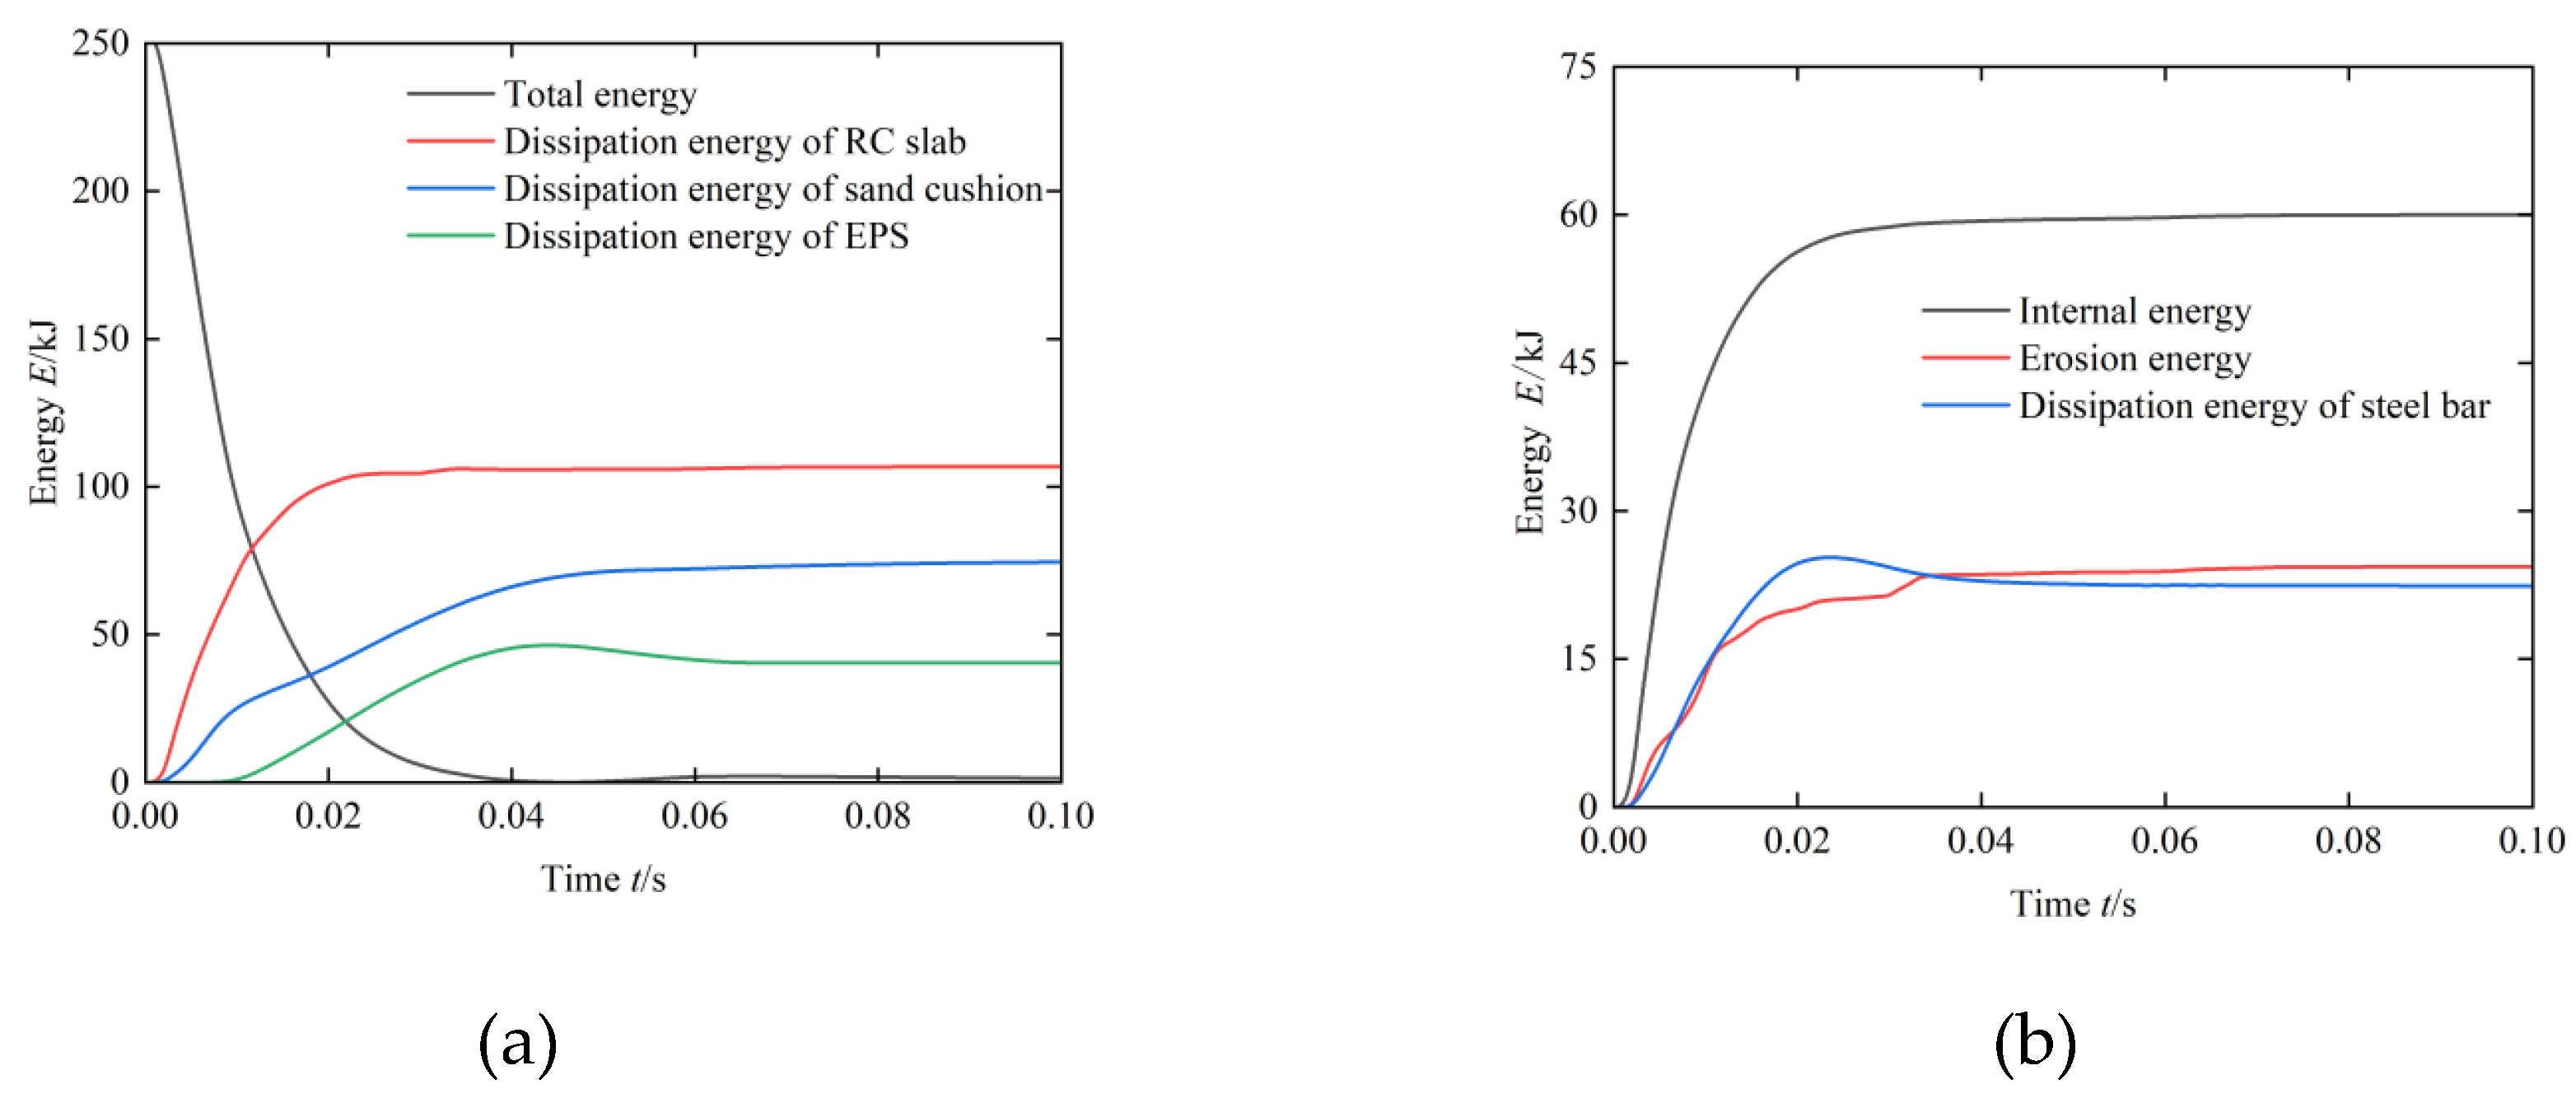
Figure 8.
Vertical displacement response of the composite protective cushion at different moments after impact.
Figure 8.
Vertical displacement response of the composite protective cushion at different moments after impact.
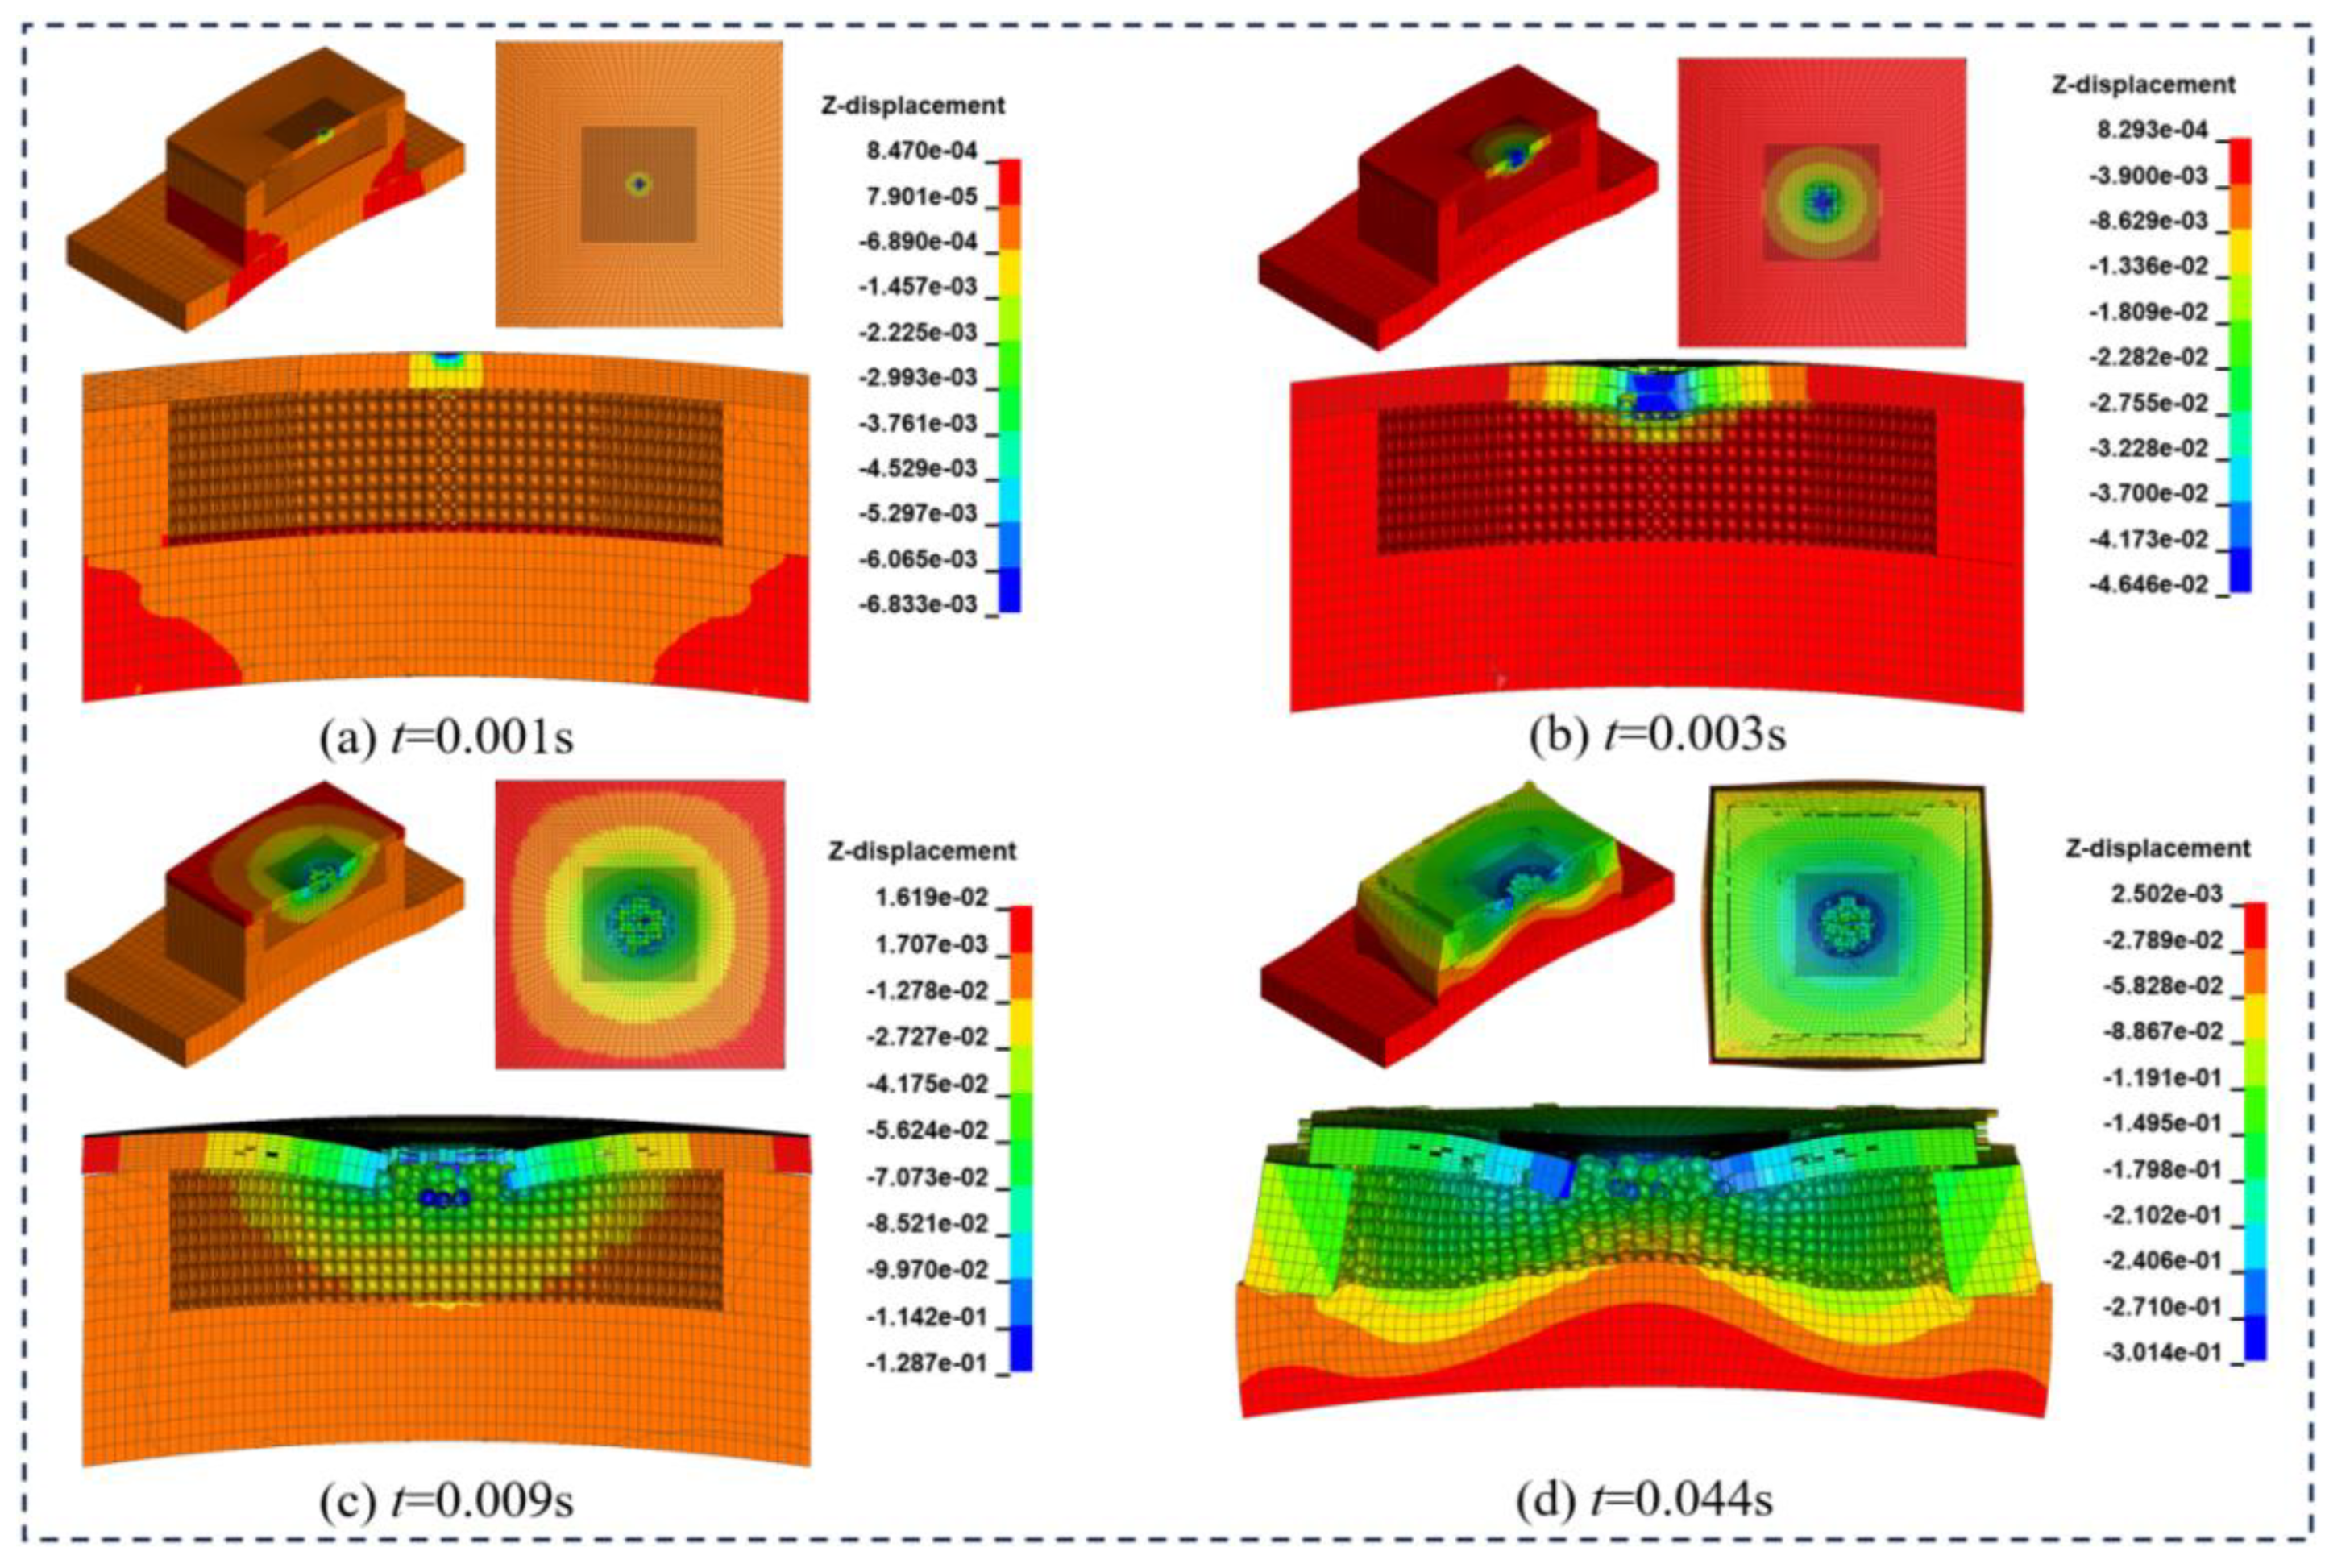
Figure 9.
Comparison of the RPC slab stress (Pa) in the presence of two types of protective cushion: (a) 90cm sand cushion, (b) composite cushion (impact energy=250kJ).
Figure 9.
Comparison of the RPC slab stress (Pa) in the presence of two types of protective cushion: (a) 90cm sand cushion, (b) composite cushion (impact energy=250kJ).
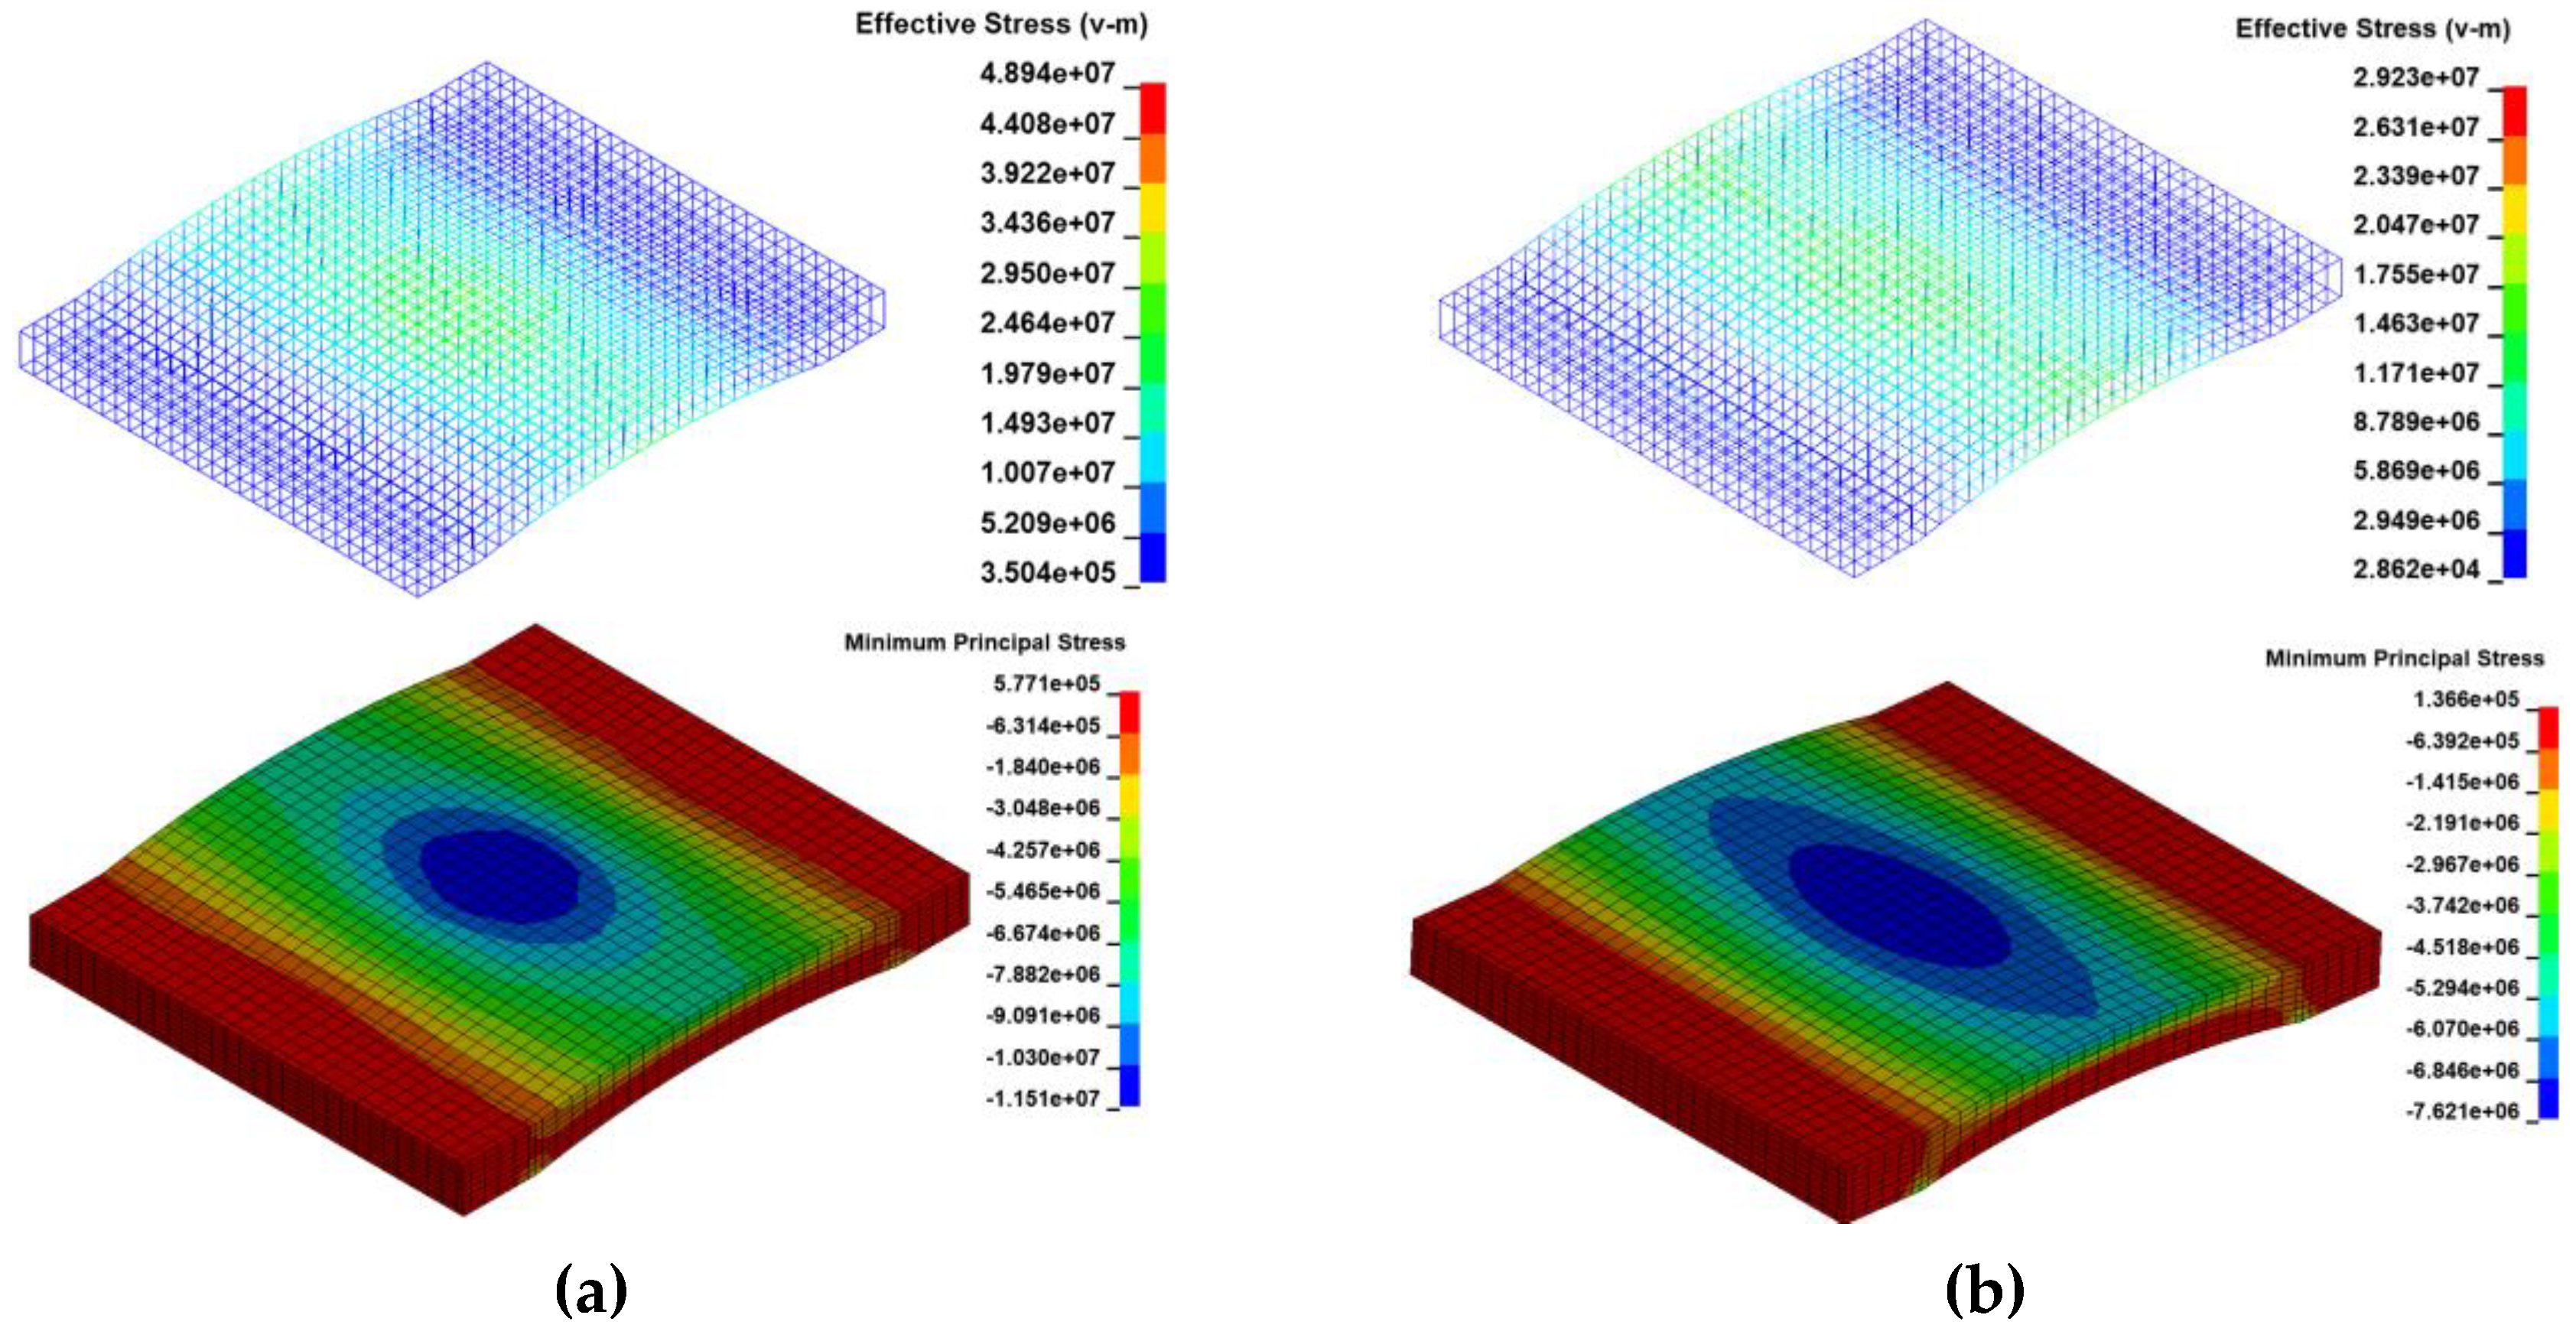
Figure 10.
Comparison of the SERA (η/M) in the presence of two types of protective cushion.
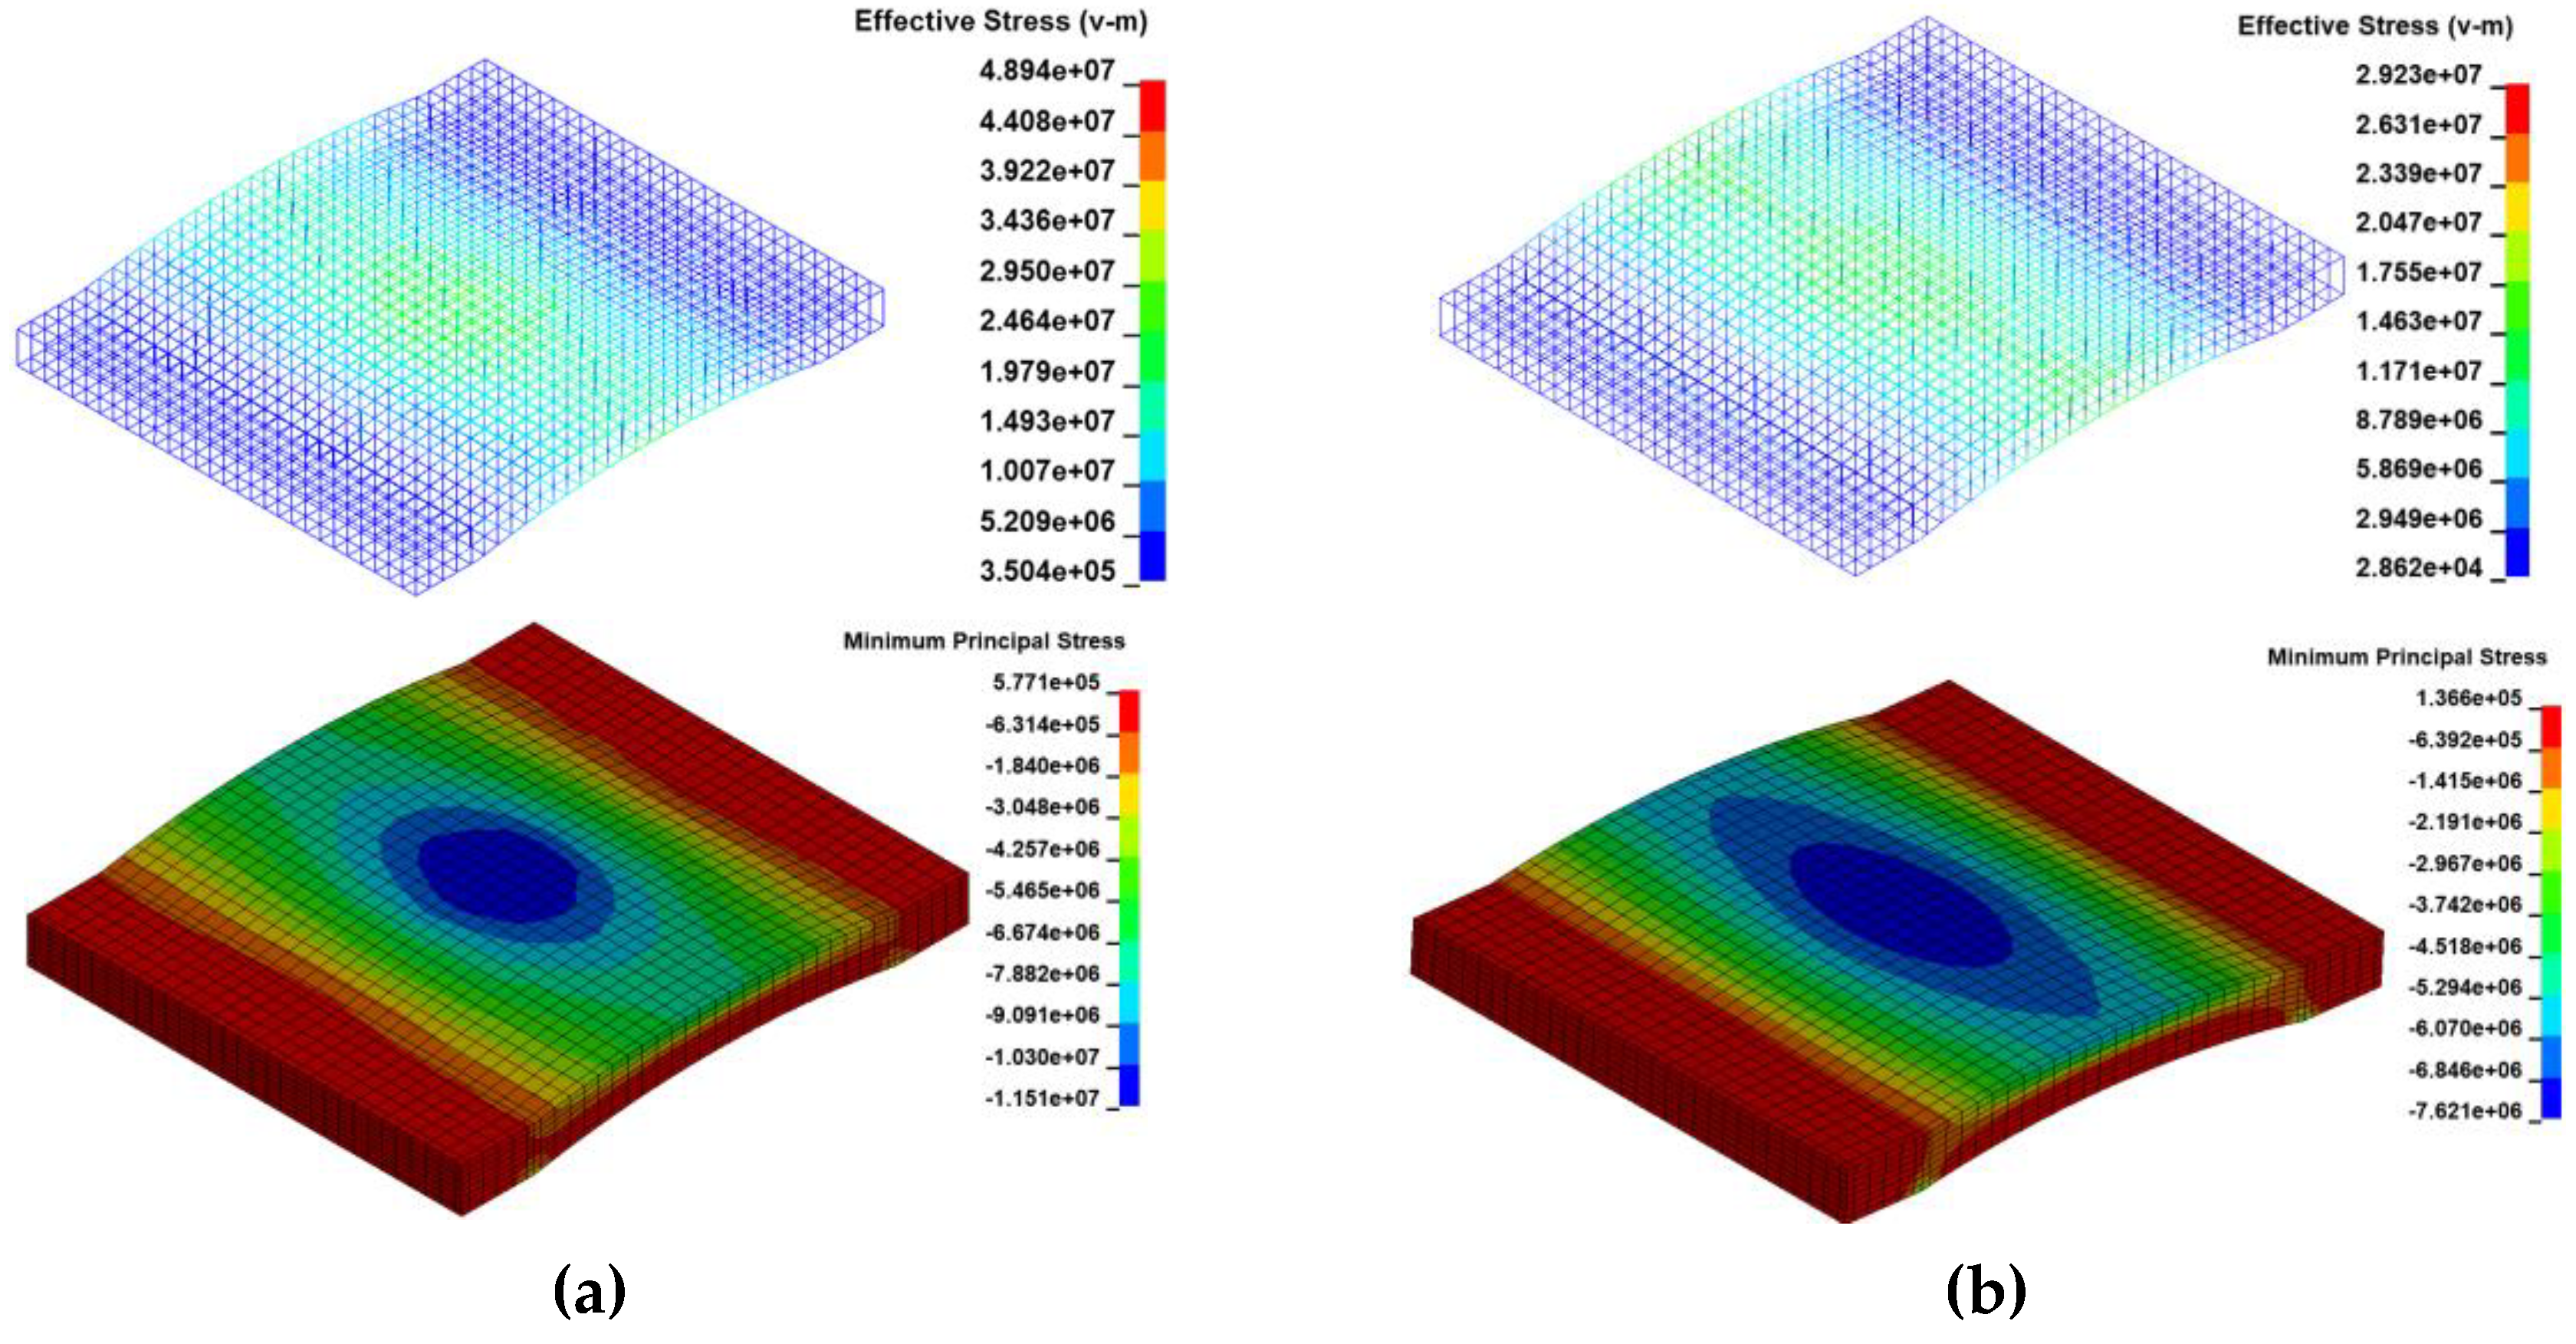
Figure 11.
Classification of the RPC slab stress state subjected to rockfall impact loading.
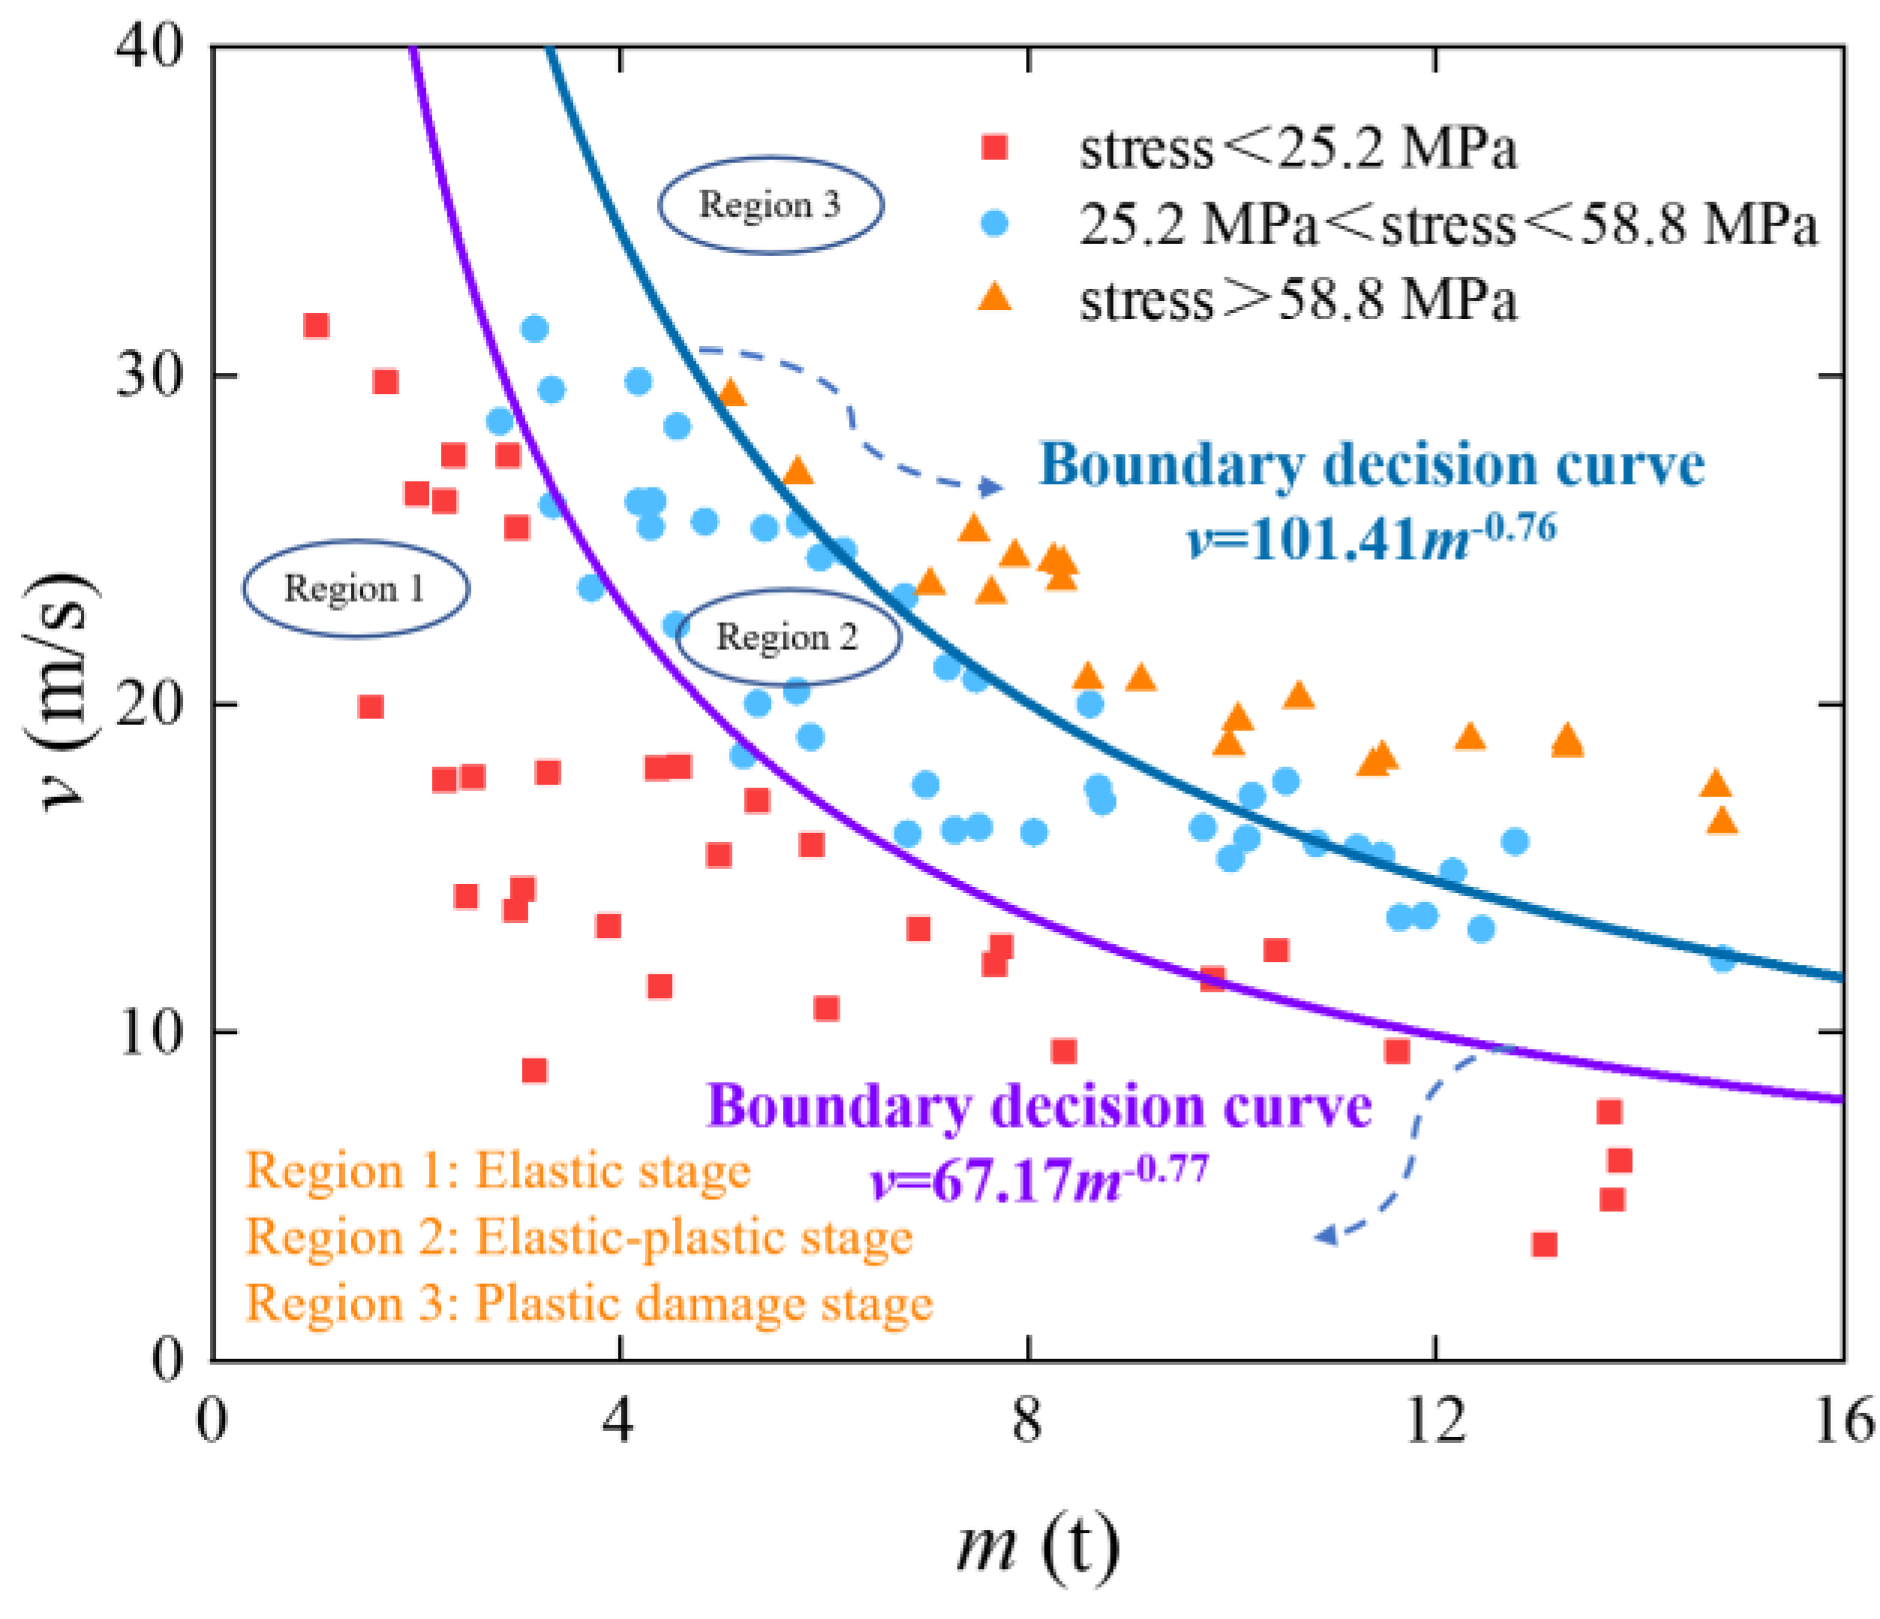
Figure 12.
Classification and comparison of stress states for C120 and C50 concrete slabs: (a) Linear elastic stage, (b) Elastic-plastic stage.
Figure 12.
Classification and comparison of stress states for C120 and C50 concrete slabs: (a) Linear elastic stage, (b) Elastic-plastic stage.
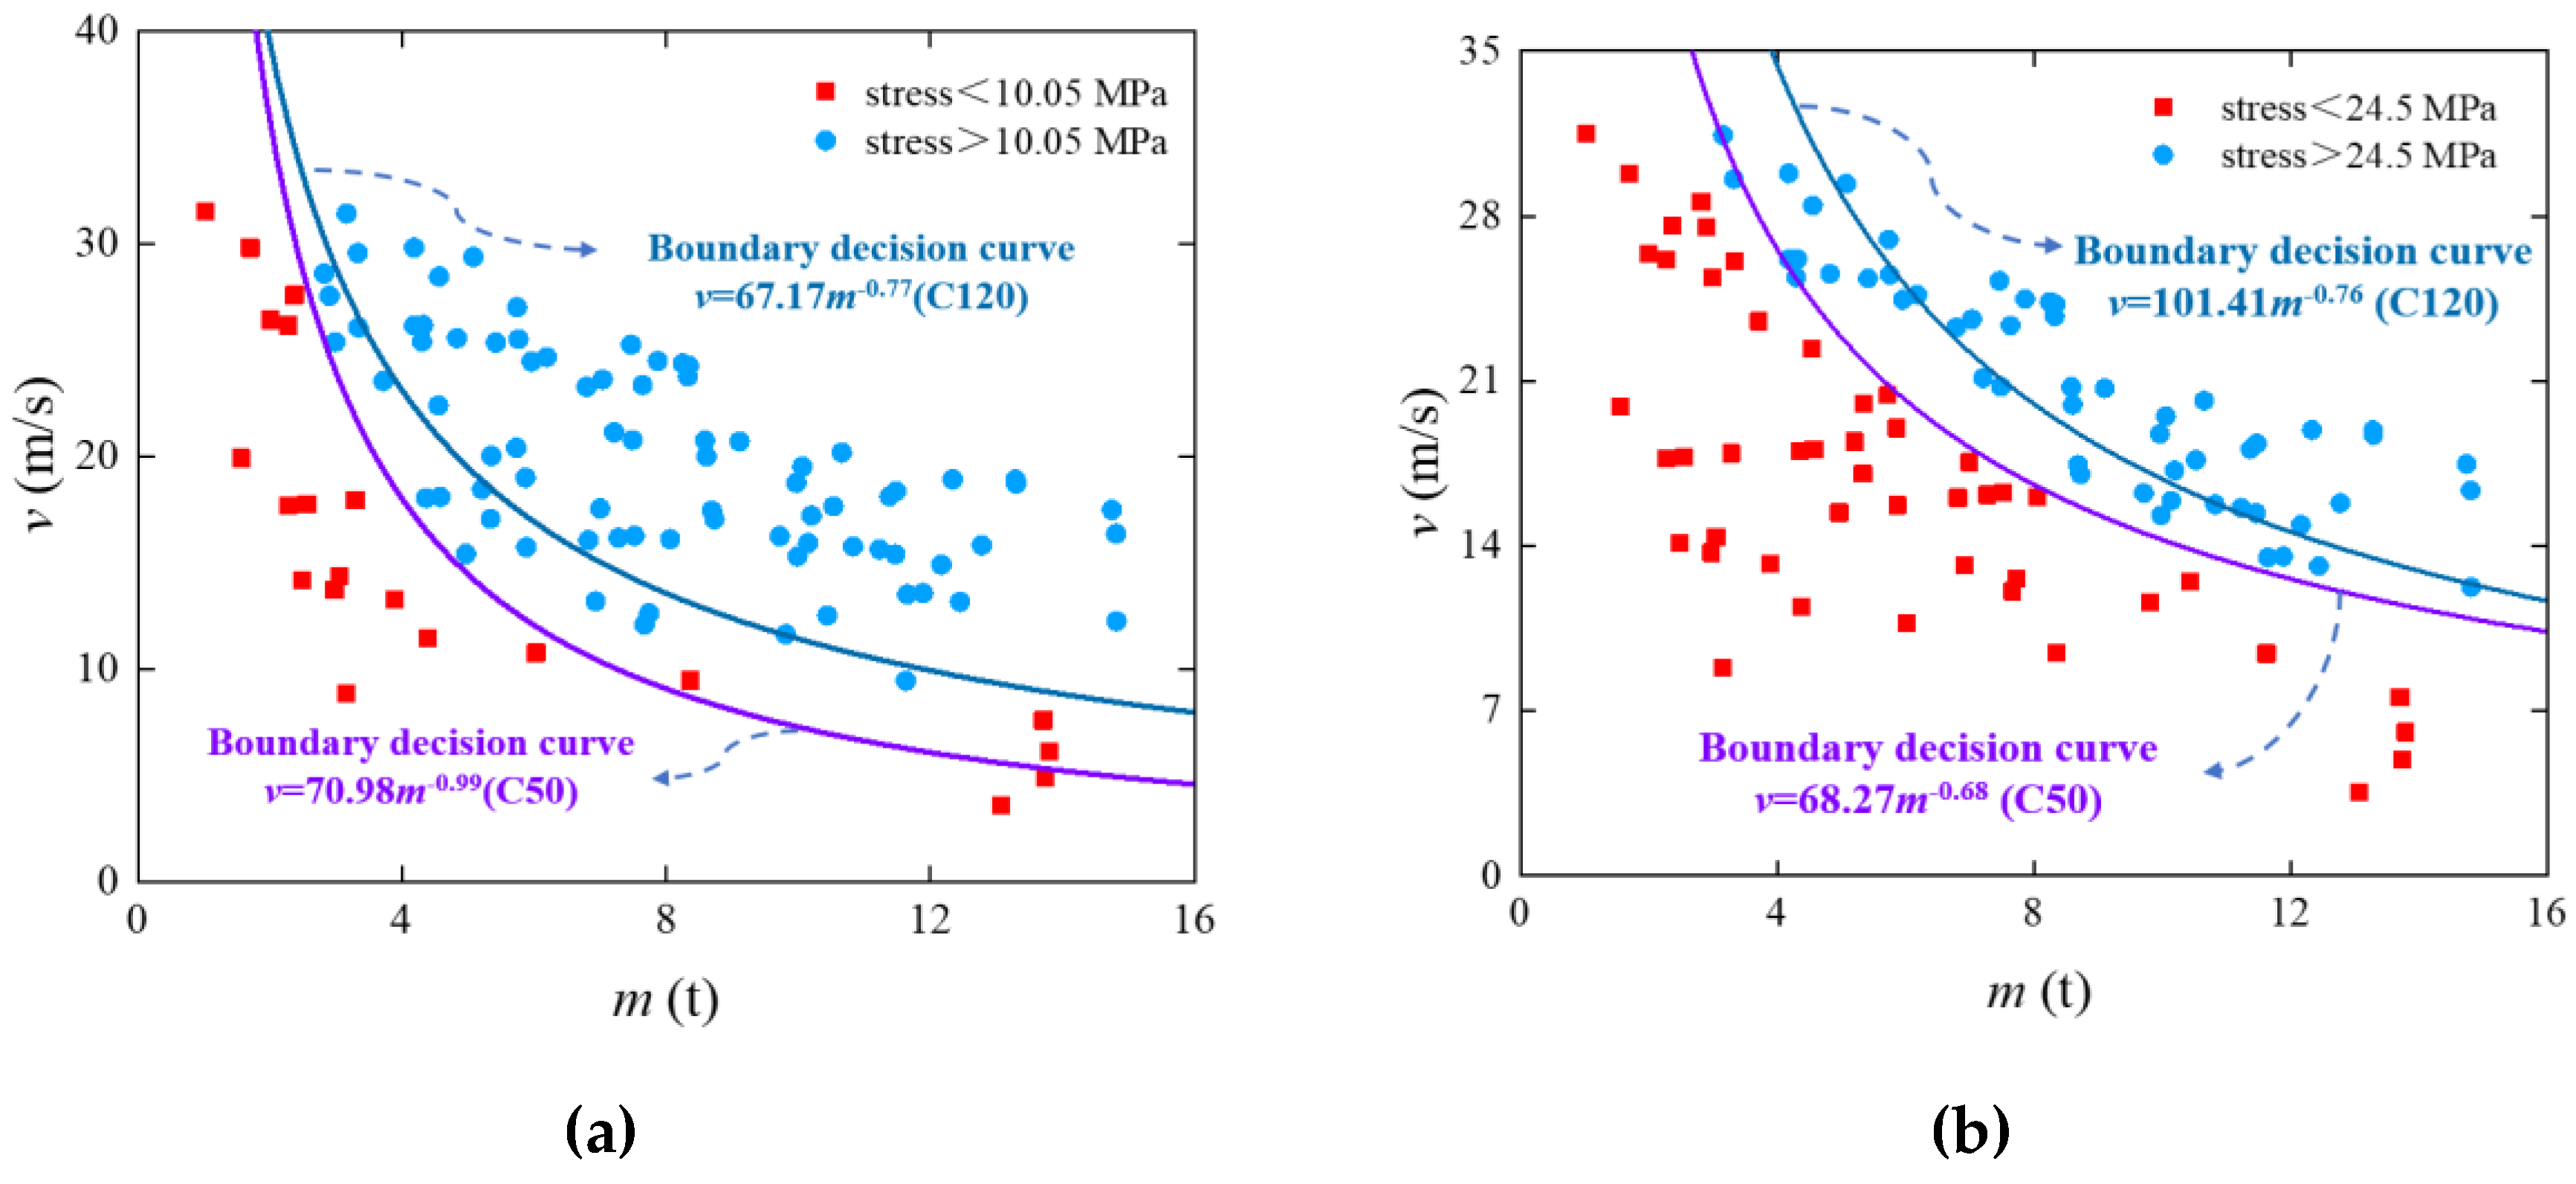
Figure 13.
Classification and comparison of stress states among RSE1, RSE2, and RSE4: (a) Linear elastic stage, (b) Elastic-plastic stage.
Figure 13.
Classification and comparison of stress states among RSE1, RSE2, and RSE4: (a) Linear elastic stage, (b) Elastic-plastic stage.
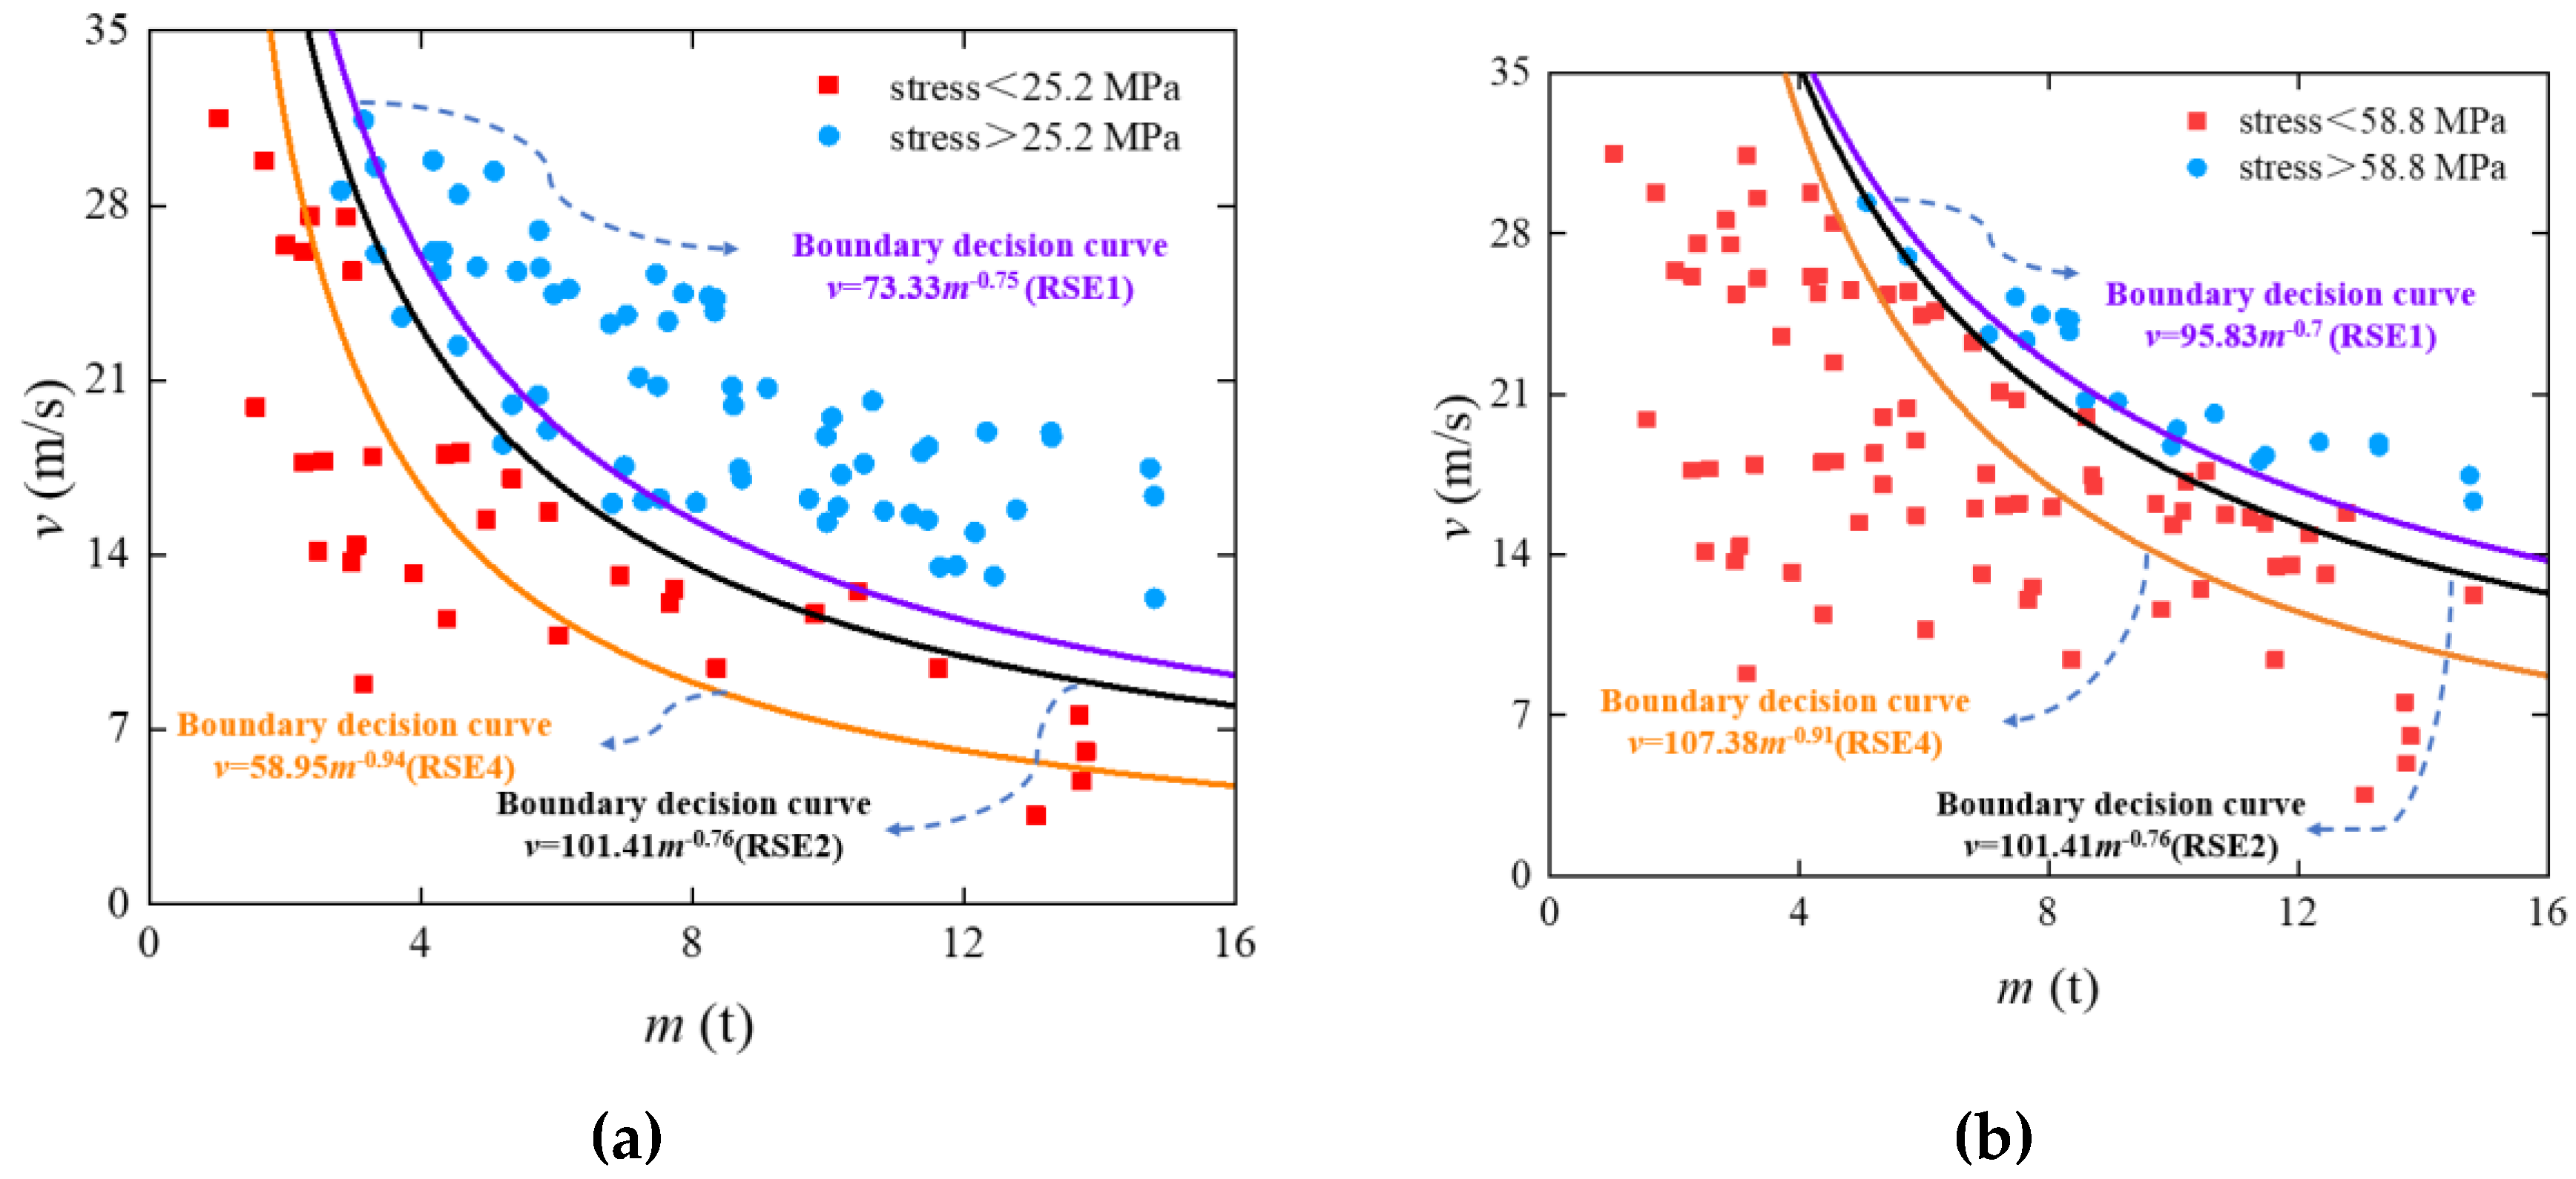

Table 1.
Mechanical parameters of various materials.
| Component | Density (kg/m3) | E (MPa) | Friction angle (o) | Poisson’s ratio |
| Block | 2700 | 2e4 | NA | NA |
| RC protective slab | 2650 | 3e4 | NA | 0.2 |
| Sand cushion | 1628 | 38 | 28 | 0.3 |
| EPS geofoam | 20 | 3.7 | NA | 0.4 |
| Concrete member | 2650 | 3.25e4 | NA | 0.2 |
Table 2.
The properties of RPC slab.
| RO (kg/m3) | G (GPa) | A | B | C |
| 2650 | 16.8 | 0.79 | 1.6 | 0.007 |
| N | FC (MPa) | T (MPa) | EPS0 | EFMIN |
| 0.61 | 84 | 6 | 1 | 0.01 |
| SFMAX | PC (MPa) | UC | PL (GPa) | UL |
| 7 | 28 | 0.001 | 1.4 | 0.1 |
| D1 | D2 | K1 (GPa) | K2 (GPa) | K3 (GPa) |
| 0.04 | 1 | 85 | -171 | 208 |
†Note: RO is the mass density, G is the shear modulus, A is the normalized cohesive strength, B is the normalized pressure hardening, C is the strain rate coefficient, N is the pressure hardening exponent, FC is the quasi-static uniaxial compressive strength, T is the maximum tensile hydrostatic pressure, EPS0 is the reference strain rate, EFMIN is the amount of plastic strain before fracture, SFMAX is the normalized maximum strength, PC is the crushing pressure, UC is the crushing volumetric strain, PL is the locking pressure, UL is the locking volumetric strain, D1 and D2 are the damage constant, K1 ,K2 and K3 are the pressure constant.
Table 3.
The comparison of mechanical response results of three composite systems.
| Test series | Q† (kJ) | σ3 (MPa) | σ1 (MPa) | σs (MPa) | Cost (yuan/m) |
M (kg) |
| RSE1 | 100 | -4.53 | 4.14 | 17.72 | 740 | 3142.5 |
| 200 | -5.46 | 5.04 | 21.33 | |||
| 300 | -6.81 | 6.26 | 26.40 | |||
| RSE2 | 100 | -5.66 | 5.33 | 21.88 | 640 | 3683.3 |
| 200 | -7.03 | 6.75 | 27.14 | |||
| 300 | -8.11 | 7.86 | 30.97 | |||
| RSE3 | 100 | -6.05 | 5.78 | 23.38 | 540 | 4433.43 |
| 200 | -7.26 | 7.16 | 27.9 | |||
| 300 | -8.55 | 8.48 | 32.9 |
†Note: Q is the impact energy, σ1 is the maximum principal stress of the concrete, σ3 is the minimum principal stress of the concrete, σs is the effective stress of the steel, and Fp is the peak value of the contact force between EPS and RPC slab.
Table 4.
The comparison of lightweight energy consumption performance results of the composite systems.
Table 4.
The comparison of lightweight energy consumption performance results of the composite systems.
| Test series | Q† (kJ) | Eslab (kJ) | Erebar (kJ) | Esand (kJ) | Eeps (kJ) | Etotal (kJ) | η | SEDR (10-4) |
| RSE1 | 100 | 33.30 | 7.80 | 22.00 | 23.30 | 86.40 | 0.86 | 2.74 |
| 200 | 74.90 | 16.50 | 41.70 | 45.70 | 178.90 | 0.90 | 2.86 | |
| 300 | 110.20 | 28.40 | 63.50 | 67.60 | 269.70 | 0.90 | 2.86 | |
| RSE2 | 100 | 33.17 | 7.88 | 31.10 | 15.90 | 88.10 | 0.88 | 2.39 |
| 200 | 70.00 | 16.40 | 59.80 | 32.70 | 178.90 | 0.89 | 2.42 | |
| 300 | 102.80 | 29.60 | 90.30 | 48.40 | 271.10 | 0.90 | 2.44 | |
| RSE3 | 100 | 32.86 | 8.00 | 37.70 | 10.90 | 89.46 | 0.90 | 2.03 |
| 200 | 70.70 | 16.80 | 72.10 | 23.10 | 182.70 | 0.91 | 2.05 | |
| 300 | 102.80 | 29.50 | 108.40 | 34.40 | 275.10 | 0.92 | 2.08 |
†Note: η is the energy consumption ratio of the three-layered absorbing system.
Table 5.
Comparison of the stress responses between two types of cushion layers.
| Parameter | 90cm sand cushion | Three-layered absorbing system |
| Maximum reinforcement stress | 48.94Mpa | 29.2Mpa |
| Minimum principal stress of RPC slab | 11.5Mpa | 7.62Mpa |
| Etotal (kJ) | 233.7 | 230.77 |
| η/M (10-4) | 1.61 | 2.5 |
Table 6.
The ultimate impact energy levels of the RPC slab (RSE2) for the two main states.
| Linear elastic state | Elastic-plastic state | ||||
| m (t) | v (m/s) | E (kJ) | m (t) | v (m/s) | E (kJ) |
| 2 | 39.39 | 1551.55 | 3 | 44.00 | 2904.21 |
| 2.5 | 33.17 | 1375.41 | 3.5 | 39.14 | 2680.50 |
| 3 | 28.83 | 1246.45 | 4 | 35.36 | 2500.69 |
| 3.5 | 25.60 | 1146.90 | 4.5 | 32.33 | 2352.13 |
| 4 | 23.10 | 1067.11 | 5 | 29.84 | 2226.73 |
| 4.5 | 21.10 | 1001.35 | 5.5 | 27.76 | 2119.06 |
| 5 | 19.45 | 945.97 | 6 | 25.98 | 2025.32 |
| 5.5 | 18.08 | 898.51 | 6.5 | 24.45 | 1942.75 |
| 6 | 16.90 | 857.27 | 7 | 23.11 | 1869.31 |
| 6.5 | 15.89 | 821.01 | 7.5 | 21.93 | 1803.43 |
†Note: m is the mass of the rockfall (ton), v is the impact velocity (m/s), and E is the impact energy (kJ).
Table 7.
Comparison of ultimate energy levels of various concrete strength levels.
| Concrete strength | m (t) | Elastic state (kJ) | Elastic-plastic state (kJ) |
| 120MPa | 4.5 | 1001.35 | 2352.13 |
| 50MPa | 4.5 | 576.72 | 1776.54 |
Table 8.
Comparison of the ultimate energy levels of various cushion thicknesses.
| Series† | Mass (t) | Elastic state (kJ) | Elastic-plastic state (kJ) |
| RSE1 | 4.5 | 1267.44 | 2515.87 |
| RSE2 | 4.5 | 1001.35 | 2352.13 |
| RSE4 | 4.5 | 463.4 | 1679.51 |
†Note: RSE1, RSE2 are presented in Subsection 2.1, while RSE4 is mainly characterized by 0.1m RC slab+0.6m sand cushion+0.2m EPS cushion.
Disclaimer/Publisher’s Note: The statements, opinions and data contained in all publications are solely those of the individual author(s) and contributor(s) and not of MDPI and/or the editor(s). MDPI and/or the editor(s) disclaim responsibility for any injury to people or property resulting from any ideas, methods, instructions or products referred to in the content. |
© 2025 by the authors. Licensee MDPI, Basel, Switzerland. This article is an open access article distributed under the terms and conditions of the Creative Commons Attribution (CC BY) license (http://creativecommons.org/licenses/by/4.0/).
Copyright: This open access article is published under a Creative Commons CC BY 4.0 license, which permit the free download, distribution, and reuse, provided that the author and preprint are cited in any reuse.


