
Submitted:
09 July 2025
Posted:
09 July 2025
You are already at the latest version
Abstract
Multiple hops performed horizontally in series effectively assess return-to-play readiness, as they mimic the propulsive and decelerative demands of sports. Movement strategy variables offer more insight into injury recovery than outcome-based measures like hop distance alone. This study focused on kinematic and kinetic variables to assess asym-metries during triple-hop (3-Hop) and quintuple-hop (5-Hop) tests with 44 male athletes. The aim was to determine the magnitude and direction of asymmetry and compare the sensitivity of kinematic and kinetic variables. Results showed average kinematic asymmetries below 7.1%, while average kinetic asymmetries were as high as 38.8%, with some variables, especially vertical braking impulses significantly higher (up to 95.4%). These findings suggest that kinetic variables are more sensitive in assessing movement quality, providing better insights for rehabilitation and return-to-play decisions. The study emphasizes the importance of considering both outcome and movement strategy variables in injury recovery. These results have practical applications for clinicians and coaches, offering valuable information to refine exercise prescriptions and improve athlete performance.
Keywords:
braking-demand
; asymmetry
; return-to-play
1. Introduction
Acyclic and cyclic jumps are commonly used to assess limb asymmetry, serving as key indicators of injury risk in rehabilitation management and return-to-play protocols. These jump assessments, conducted with either vertical or horizontal force orientations, offer insights into an individual’s neuromuscular status. When evaluating horizontal asymmetry, the single-leg hop, triple-hop (3-Hop), and crossover hop are the most commonly used assessments(Davey et al., 2021; Kotsifaki et al., 2022; Lloyd et al., 2020; Munro & Herrington, 2011; Sarabon et al., 2023). Davey et al. (2021) (Davey et al., 2021)concluded that the 3-Hop assessments display greater ecological validity for team sport athletes, closely mimicking the propulsive and decelerative force demands associated with short ground contact times (GCT) typically observed in these sports. Despite this suggested validity, the reliability measures reported by researchers (Munro & Herrington, 2011) and their demonstrated application in rehabilitation settings raise concerns that discrete distance values alone do not adequately capture the nuances of movement quality(Kotsifaki et al., 2022). Consequently, Kotsifaki et al. (2022) (Kotsifaki et al., 2022)suggested that a more comprehensive understanding of 3-Hop asymmetry could be achieved by integrating outcome variables with those reflecting underlying movement strategies.
Researchers (Davey et al., 2021; Lloyd et al., 2020; Šarabon et al., 2022) have investigated the usefulness of 3-Hop flight times or hop distances divided by GCT, also known as horizontal reactive strength indexes (RSIhor), in quantifying asymmetry. The main findings from these research groups were: 1) triple hop distance alone masked residual deficits in reactive strength performance; thus, more detailed analyses of individual hop performance may be warranted(Lloyd et al., 2020); 2) although only trivial to small differences in averaged asymmetry were observed, significant within-group variation was noted, highlighting the importance of analyzing data individually(Davey et al., 2021); the direction of asymmetry can fluctuate between hops and test sessions, underlining the value of also monitoring the direction of the imbalance(Davey et al., 2021); and 4) vertical and horizontal reactive strength indexes show a poor level of agreement, and when calculating RSIhor, flight time and hop distance should not be used interchangeably(Sarabon et al., 2023).
It is important to note that research on 3-Hop asymmetry so far has focused on basic kinematic movement strategy variables. Kinetic data, such as vertical and horizontal braking and propulsive impulses and forces, may provide deeper diagnostic insights into cyclic asymmetry and guide more effective exercise prescriptions. For example, Kotsifaki et al. (2021) (Kotsifaki et al., 2021)reported that athletes post-ACLR (anterior cruciate ligament reconstruction) were nearly symmetrical in terms of hop distance (97%), yet they still displayed moderate to large differences in knee function during propulsion (69%). This is further supported by evidence showing that athletes have returned to sport after rehabilitation but still exhibit significant functional deficits in limb symmetry(Herrington et al., 2021; King et al., 2018). Furthermore, the authors of this study have observed that individuals who manage the lower stretch-loading of the 3-Hop assessments, can struggle with the higher stretch-loads associated with the later landings of the quintuple hops (5-Hop). Given the increased stretch-loading in the 5-Hop, greater levels of asymmetry may be detectable in the latter hops. With this information, the primary focus of this paper is to understand the utility of 3-Hop and 5-Hop kinematics and kinetics in describing vertical and horizontal cyclic asymmetries. Specifically, the aims were to: 1) determine the magnitude and direction of asymmetry; 2) assess whether kinematic and/or kinetic variables demonstrate greater asymmetry for the same movement; 3) compare vertical and horizontal asymmetries across hops; and 4) evaluate if the magnitude of asymmetry differs between the 3-Hop and 5-Hop assessments. It was hypothesized that increased asymmetries will be evident in the kinetic measurements of hops that require higher stretch-loads, particularly in the vertical and horizontal braking impulses during steps 3 and 4 of the 5-Hop.
2. Methodology
2.1. Participants
Forty-four male athletes (age 20.1 ± 1.4 years; body mass 71.2 ± 8.6 kg; height 171.9 ± 5.1 cm) from various university sports (kendo, baseball, rowing, athletics, windsurfing, cycling, soccer, and basketball) volunteered to participate. All participants had to be healthy and injury-free at the time of testing. Potential participants were excluded if they had significant historical injuries (e.g., previous ruptures or tears to major tendons or ligaments such as the Achilles or ACL), regardless of the post-injury training period. The study procedures adhered to the Declaration of Helsinki, and ethical approval was granted by the Auckland University of Technology Review Board (reference: 17/133) and the National Institute of Fitness and Sports in Kanoya Review Board (reference: 8-123). Informed consent was obtained prior to inclusion in the study. Body mass was measured to the nearest 0.1 kg, and height was assessed using the methodology outlined by the International Society for the Advancement of Kinanthropometry (Norton, 2018) on a digital scale and stadiometer (Tanita DC-217A, Tokyo, Japan).
2.2. Procedures
Each participant attended a familiarisation session at least three days prior to the first testing session, which included a standardized warm-up protocol that was repeated prior to the testing session. The warm-up consisted of dynamic flexibility exercises for both upper and lower limbs, general movement to elevate body temperature, explosive bounding movements to mimic testing demands, and gradually increasing intensity sprints over 30 m. The testing process commenced five minutes after completing the warm-up.
The 3-Hop test protocol involved three horizontal hops on the same leg (Figure 1), while the 5-Hop test involved five hops on the same leg. Because of the very high stretch-load demands placed on the body by this test, three trials for 3-Hop and two trials for 5-Hop were completed in a randomized order for dominant and non-dominant limbs, minimizing the risk of injury, reducing acute overuse, and reducing fatigue effects. There was a two-minute rest period between the efforts before hopping on the other leg. Each hop began with the subject balancing on their hopping leg before propelling themselves forward for the number of contacts specified in the test. For all tests, the subjects landed on two feet after the final hop; contact with the ground with their hands after landing was permitted if the hopping foot did not move further forward during landing. This was performed to encourage each subject to achieve maximal horizontal displacement. Upper-limb motion was permitted during the hops, replicating the motor patterns associated with athletic movements. Each subject was instructed to "reach the furthest horizontal distance in the shortest possible time”.
The hop trials were conducted on an indoor synthetic track surface (Hasegawa Sports Facilities, Tokyo, Japan) covering 54 inground force platforms in series (TF-90100, TF-3055, TF-32120, Tec Gihan, Kyoto, Japan), all connected to a single computer that collected GRFs at a sampling rate of 1000 Hz. Force plate data were captured for each trial, exported, tagged, and stored for later analysis. The GRF signals collected during the hop trials were filtered using a fourth-order Butterworth low-pass digital filter with a 50 Hz cutoff frequency. Horizontal and vertical hop propulsive and braking kinetics were determined, with associated impulses calculated through the integration of force for each required period. The vertical impulse was identified as the area under the vertical GRF-time curve during the ground contact period, with vertical braking and propulsive impulses obtained by integrating all negative and positive values of horizontal GRF, respectively, over the same period. GRF variables were normalized to body mass. All variables were computed using a custom algorithm (MATLAB R2021a, Mathworks Inc., Natick, Massachusetts, USA).
2.3. Data Processing and Outcome Measures
Touchdown and take-off detection were identified using a 20 N vertical GRF threshold in the filtered data. RSIhor was determined according to the methods outlined by Sarabon et al. (Sarabon et al., 2023)for each step and an average (Total RSIhor) for each hop trial by dividing hop distance by the previous ground contact time. Total RSIhor was calculated by dividing the total hop distance by the sum of all ground contact times.
2.4. Statistical Analysis
Using descriptive statistics (means and standard deviations), centrality and spread were calculated and presented in the tables. Assumptions of univariate normality, outliers, and sphericity were assessed. Outlier analysis was conducted using boxplots, and values larger than three standard deviations (SD) were manually omitted from further analysis. The Shapiro-Wilk test (Shapiro & Wilk, 1965) evaluated normality, and Q-Q plots were used to assess kurtosis and skewness visually. Asymmetry between the dominant and non-dominant limb was determined using average data in Microsoft Excel (version 16.93.1; Washington, USA) using equation 1 (Bishop et al., 2021; Davey et al., 2021) and magnitude of asymmetry reported as a percentage. Direction of asymmetry was determined by comparing mean dominant and non-dominant limb data, with differences determined using pairwise t-tests
=100/IF(dominant>nondominant,dominant,nondominant)*IF(dominant>nondominant,nondominant,dominant)*-1+100
3. Results
The means and standard deviations for all kinematic and kinetic data are detailed in supplementary Tables S1 and S2. Asymmetries in kinematic data for the 3-Hop and 5-Hop protocols are summarized in Table 1. The average kinematic asymmetries were consistently below 7.1%, ranging from 0.00% to 28.9% (RSI). Large standard deviations were observed across all asymmetries, indicating high variability. The magnitude and direction of these asymmetries varied across different kinematic parameters. Notably, greater flight times (0.629 to 1.81%) were observed in the non-dominant limb during all 5-Hop trials, contributing to longer hop durations for the non-dominant limb. However, across the forty kinematic variables, significant differences between limbs of averaged values were only seen in Flight Time (Hop 3) and Hop Time (Hop 2-3) (p<0.05) of 3-Hops which are both closely linked (Table 2). Averaged kinetic asymmetries ranged from 0.0% to 95.4%, with the largest asymmetries observed in the vertical and horizontal braking impulses. The magnitude and direction of the kinetic variables varied across the 3-Hop steps. During the 5-Hop test, greater (31.5-51.8 N.kg) mean maximal vertical force values were consistently observed in the non-dominant limb across steps compared to the dominant limb (31.2-50.1 N.kg), whereas larger (0.833-0.370 Ns.kg) horizontal propulsive impulses were consistently observed in the dominant limb across all hops compared to the non-dominant limb (0.814-0.313 Ns.kg) across steps. Vertical braking impulses for both the 3-Hop and 5-Hop protocols were significantly greater for Hop 1 than subsequent hops (3-Hop: 29.6 ± 24.1%; 5-Hop: 39.8 ± 31.6%). The asymmetry between hops decreased by ~2% across subsequent hops, with reduced between-subject variability (11.2% to 15.6%, range = 0.0% to 53.8%). Vertical propulsive impulse asymmetries were consistent across the 3-Hop and 5-Hop protocols (7.77% to 15.4%, range = 0.0% to 61.6%), with minimal changes in asymmetry between hops (~1% to 2%). Notably, significantly greater variability was observed in the final hop for both the 3-Hop and 5-Hop protocols, inflating the mean values (3-Hop range: 0.0% to 47.5%; 5-Hop range: 0.75% to 61.6%), when compared to earlier hops (range: 0.0% to 31.0%). Horizontal braking impulse asymmetries decreased between each hop for the 3-Hop and 5-Hop protocols (38.8% to 19.9%), with a reduction in between-subject variability (range = 0.0% to 90.9%). A ~14% Δ in asymmetry was observed between Hops 1-2 and Hops 2-3 in the 3-Hop protocol, and a ~4% to 11% Δ was noted between hops in the 5-Hop protocol. In contrast, horizontal propulsive impulse asymmetries increased between hops for both protocols (10.4% to 17.6%). A ~44% Δ in asymmetry was observed between Hops 1-2 and Hops 2-3 in the 3-Hop protocol, while the Δ in asymmetry between hops in the 5-Hop protocol ranged from ~1% to 3%. Significant differences between limbs were only seen in Horizontal Propulsive Impulse (Hops 2-3) of the 3-Hops (p<0.001) and Hops 3-4 and Hops 4-5 in the 5-Hops (p<0.05).
4. Discussion
Physiotherapists and strength and conditioning coaches commonly utilize multiple-hop movements to assess limb asymmetry, which serves as a key indicator of injury risk and plays an essential role in rehabilitation and return-to-play protocols. This research aimed to enhance the understanding of how triple and quintuple hops, and their associated asymmetries could be used effectively in clinical and performance settings. Specifically, the aims were to: 1) determine the magnitude and direction of asymmetry; 2) whether kinematic and or kinetic variables were more sensitive to asymmetries; 3) whether vertical and horizontal asymmetries were comparable across hops; and 4) if the magnitude of asymmetry differed if a 3-Hop or 5-Hop was used. The main findings were as follows: 1) the averaged kinematic asymmetries were below 7.1%, and ranged from 0.00% to 28.9%, with the greatest asymmetries observed in the 5-Hop (hop 2-3) RSI; 2) the average kinetic asymmetries were under 39.8%, ranging from 0.00% to 95.4%, with the largest asymmetries found in vertical braking impulse (hop 1-2); 3) greater asymmetries were noted in braking (mean 14.3-38.8%, max 95.4%) rather than propulsive (mean 7.77-14.8%, max 66.7%) impulses, however there was no increase in asymmetry with greater stretch loads (i.e. hops 3-4) as hypothesized; and, 4) there was a great deal of individual variability across measures.
A primary aim of the study was to determine the magnitude and direction of asymmetry in both the kinematics and kinetics of horizontal multiple-hops in series, specifically GRFs on embedded force platforms. Our findings were that average measures of kinematic asymmetry were <7.1% for both the 3-Hop and 5-Hop assessments, which were in agreement with previously reported kinematic asymmetries (Davey et al., 2021) as well as less than asymmetry thresholds (10-15%) thought to affect performance or increase injury prevalence(Bishop et al., 2018). Davey et al. (2021) (Davey et al., 2021)reported mean asymmetries in kinematic variables of 3-Hop assessment ranging from 3.73 to 7.79% which aligned closely with our findings (2.39 to 5.25%). Whilst the RSI are not directly comparable given different computations (flight time vs. hop distance), the increases in RSI asymmetry observed by Davey et al. (2021) (Davey et al., 2021)between 3-Hops (~7.4 to 11.0%), was not reflected in our results (~5.5 to 6.3%), or for the 5-Hop assessment (~5.5 to 7.0%). The average kinetic asymmetries were substantially greater (<38.8%) than the kinematic asymmetries, with measures reaching as high as 95.4% observed in braking impulse variables. This is likely due to the variability associated with braking movement strategies and/or eccentric force capability(Hovey et al., 2021), along with instantaneous fluctuations in mass-specific impulse. Since impulse is force multiplied by time, and mass-specific impulse is equal to the change in velocity, impulse influences velocity more directly than displacement, which is an integral of velocity over time and less responsive to change. The direction of asymmetries observed for both kinetic and kinematic variables was non-uniform and consistent with previously reported studies.(Bishop et al., 2021; Bishop et al., 2022; Bishop et al., 2019; Davey et al., 2021; Lloyd et al., 2020).
Of interest to the authors was the magnitude of asymmetry associated with kinematic or kinetic variables. As intimated previously, kinetic variables are more sensitive to quantifying movement asymmetry, given that the averaged kinematic asymmetries were below 7.1% (ranging from 0.00% to 28.9%), whereas averaged kinetic asymmetries for 3-Hop and 5-Hop were as high as 38.8% (ranging from 0.00% to 95.4%). Similar kinetic asymmetries have been noted previously in horizontally orientated single-leg jump tasks. Bishop et al. (2021) noted individual asymmetries in peak force (~28%), eccentric impulse (~34%) and concentric impulse (~22%) for single-leg broad jumps(Bishop et al., 2021), however not to the magnitude of those seen in this study, which makes sense given the higher stretch loading associated with multiple hops(Sharp et al., 2024). Our findings support the work of Kotsifaki et al (2021) who suggested that reporting the asymmetry associated with discrete outcome variables such as distance jumped does not adequately characterize the quality of the movement, and that movement strategy (kinetic) variables should be considered as they can give a fuller picture of hip-knee-ankle function in making decisions on return to play.
Additionally, it was of interest whether horizontal and vertical kinetic asymmetries were comparable across hops. When examining propulsive impulses, asymmetries were relatively similar between hops, with horizontal asymmetries being ~2-5% greater than vertical propulsive asymmetries, with this difference increasing with each successive hop. In contrast, horizontal braking impulses, except Hops 1-2, were ~10-20% greater than their vertical counterparts. To the authors' knowledge, no other researchers have examined asymmetries in this manner. Whether these differences can be explained in terms of physical or technical deficiencies is unknown, however, it may be that horizontal eccentric/braking capability was relatively untrained in this cohort. Alternatively, the effect of foot placement relative to the moving center of mass (COM) could have influenced braking forces more than vertical braking impulses. Interestingly, Kotsifaki et al (2021) found that triple hop asymmetry in a cohort recovering from ACL reconstruction was more pronounced in the force generation/concentric phase rather than the force absorption/eccentric phase, which was not the case in this study, the physiological status of the respective cohorts no doubt explaining the differences. Furthermore, Lloyd et al. (2020) concluded that triple hop distance masked the residual deficits in reactive strength performance, and our vertical and horizontal braking asymmetries certainly support such a contention.
It was hypothesized that the increased stretch-load demand of 5-Hop assessment would result in more significant asymmetries in the later hops. Regarding vertical and horizontal propulsive impulse, the actual asymmetry increased by ~7% across jumps. However, contrary to the hypothesis, no significant increase in asymmetries were observed with greater stretch loads (i.e., hops 3-4), in fact vertical and horizontal braking impulse asymmetry decreased by ~13 to 28% across hops. Why this is the case is unclear, and since no other research group has examined the effect of stretch loading asymmetry, comparing our findings is problematic.
It is important to note the large standard deviations observed with some of the averaged asymmetry measurements, highlighting considerable within and intra-subject variability, underlying the importance of looking past the averaged data and more at individual results; this variability reported in previous studies(Bishop et al., 2021; Davey et al., 2021; Lloyd et al., 2020). The levels of variability seen in this study are incomparable to those seen in other multiple hop studies, a phenomenon with this type of testing. Asymmetries higher than 95% were seen in braking impulses, and only comparable to those seen in kinetics of high velocity sprinting, but incidentally not statistically significant due to the high variability seen(Exell et al., 2012). Previously, Bishop et al. (2022) (Bishop et al., 2022)determined that the magnitudes of asymmetry were inconsistent across time points during a competition season; however, they also determined that limb dominance was consistent. It is conceivable that substantial shifts in limb dominance and magnitude are expected, within sessions and over time. The variability in movement strategy, both for propulsion and braking, mainly depends on the preceding hop strategy and is not independent of one another. Therefore, dominance could be influenced by, and frequently change based on, the variable being assessed and the task in question(Dos’Santos et al., 2019). Regardless, this high variability likely precludes any meaningful between-group session comparisons, and our results would support other authors’ suggestions to analyse symmetry data individually(Lloyd et al., 2020).
A limitation to this study was the utilization of a heterogeneous non-injured sample of male university-level athletes; therefore, interpreting these results to other populations, such as females or those with lower limb injuries, must be made cautiously. Whilst every reasonable precaution was taken to ensure subjects were in a similar state of rest from physical training, this could not be guaranteed due to the varied nature of the sports involved. However, other researchers have suggested that this may not impact the direction of asymmetry(Bishop et al., 2022; Davey et al., 2021). Further to this is the determination of dominance between limbs. In this study, dominance was determined by their ‘kicking limb’, whilst this might be a rational approach and commonplace in other studies(Dos’Santos et al., 2019), this does not establish it as a ‘stronger limb’, or a better performing limb in hopping or other sports-related tasks(Dos’Santos et al., 2017), as this is highly individual. Further, there is the potential for this to further mask asymmetry due to quantification of dominance. In contrast, studies in injured cohorts have used affected or injury limb versus non-affected or uninjured limb in their classification(Herrington et al., 2021; Kotsifaki et al., 2022; Lloyd et al., 2020).
5. Conclusion and Practical Application
This research enhances understanding of the asymmetries observed in horizontally oriented hopping tasks. It offers insights into how practitioners can better interpret key kinematic and kinetic factors influencing hop performance. Like many clinicians and practitioners, the authors believe that multiple hops performed in series are a better means to examine the functional status of the leg musculature and identify deficits/asymmetries, compared to a single hop. However, while triple hop distance provides an easy-to-quantify, reliable, and objective measure of performance for clinicians and coaches, distance hopped is an outcome measure that fails to provide insight into movement strategy. This failure to distinguish between the movement characteristics of each hop may mask potential deficiencies such as eccentric braking capability, which, if undetected, could increase injury/re-injury risk. Ultimately, clinicians and coaches need diagnostic information that drives better exercise prescription and enhances patient and athlete outcomes, which an outcome variable such as distance does not provide.
Key considerations to enhance diagnostics based on the findings from a non-injured cohort of male sportsmen are: 1) have clarity about what constitutes an outcome vs movement strategy variable; 2) where possible measure movement strategy variables in tandem with the outcome measure; 3) attempt to differentiate between propulsive and braking strategies; 4) also if possible delineate between horizontal and vertical components; 5) whilst averaged data provides insight into asymmetry, it is recommended that an individualized approach to limb asymmetry and movement strategy is conducted; and, 6) given the small differences in 3-Hop and 5-Hop asymmetry there would seem no reason to use both in an assessment battery. Technology other than force plates, such as phone-based videography or inertial sensors, can provide insight into some movement strategy variables.
Supplementary Materials
The following supporting information can be downloaded at: Preprints.org, Table S1. 3-Hop and 5-Hop kinematics descriptive data; Table S2. 3-Hop and 5-Hop kinetics descriptive data.
Author Contributions
The individuals who contributed to this paper are listed as follows: Conceptualization, A.S. and J.C.; Methodology, A,S., J.C. and J.N.; software, J.N. and R.N.; formal analysis, A.S. and J.C.; investigation, A.S., J.N. and R.N.; resources, R.N. and T.W.; data curation, J.N. and R.N.; writing—original draft preparation, A.S. and J.C.; writing—review and editing, A.S. and J.C.; visualization, A.S. and J.N.; supervision, J.C.; project administration, T.W. All authors have read and agreed to the published version of the manuscript.
Funding
This research received no external funding.
Institutional Review Board Statement
The study was conducted in accordance with the guidelines of the Declaration of Helsinki and was approved by the Auckland University of Technology Ethics Committee (17/133 approved November 1, 2018) and the National Institute of Fitness and Sports in Kanoya (8-123 approved January 30, 2018).
Informed Consent Statement
Informed consent was obtained from all subjects involved in the study.
Data Availability Statement
The raw data supporting the conclusions of this article will be made available by the authors on request.
Acknowledgments
The authors thank all subjects for their participation in this study.
Conflicts of Interest
The authors declare no conflicts of interest.
References
- Davey, K.; Read, P.; Coyne, J.; Jarvis, P.; Turner, A.; Brazier, J.; Šarabon, N.; Jordan, M.J.; Bishop, C. An assessment of the hopping strategy and inter-limb asymmetry during the triple hop test: A test–retest pilot study. Symmetry 2021, 13, 1890. [Google Scholar] [CrossRef]
- Munro, A.G.; Herrington, L.C. Between-session reliability of four hop tests and the agility T-test. J Strength Cond Res 2011, 25, 1470–1477. [Google Scholar] [CrossRef] [PubMed]
- Lloyd, R.S.; Oliver, J.L.; Kember, L.S.; Myer, G.D.; Read, P.J. Individual hop analysis and reactive strength ratios provide better discrimination of ACL reconstructed limb deficits than triple hop for distance scores in athletes returning to sport. Knee 2020, 27, 1357–1364. [Google Scholar] [CrossRef] [PubMed]
- Kotsifaki, A.; Whiteley, R.; Van Rossom, S.; Korakakis, V.; Bahr, R.; Sideris, V.; Graham-Smith, P.; Jonkers, I. Single leg hop for distance symmetry masks lower limb biomechanics: time to discuss hop distance as decision criterion for return to sport after ACL reconstruction? Br. J. Sports Med. 2022, 56, 249–256. [Google Scholar] [CrossRef] [PubMed]
- Šarabon, N.; Kozinc, Z.; Bishop, C. Comparison of vertical and horizontal reactive strength index variants and association with change of direction performance. J Strength Cond Res 2023, 37, 84–90. [Google Scholar] [CrossRef] [PubMed]
- Šarabon, N.; Milinović, I.; Dolenec, A.; Kozinc, Ž.; Babić, V. The reactive strength index in unilateral hopping for distance and its relationship to sprinting performance: How many hops are enough for a comprehensive evaluation? Appl Sci 2022, 12, 11383. [Google Scholar] [CrossRef]
- Kotsifaki, A.; Korakakis, V.; Graham-Smith, P.; Sideris, V.; Whiteley, R. Vertical and horizontal hop performance: Contributions of the hip, knee, and ankle. Sports Health 2021, 13, 128–135. [Google Scholar] [CrossRef] [PubMed]
- King, E.; Richter, C.; Franklyn-Miller, A.; Daniels, K.; Wadey, R.; Moran, R.; Strike, S. Whole-body biomechanical differences between limbs exist 9 months after ACL reconstruction across jump/landing tasks. Scand J Med Sci Sports 2018, 28, 2567–2578. [Google Scholar] [CrossRef] [PubMed]
- Herrington, L.; Ghulam, H.; Comfort, P. Quadriceps strength and functional performance after anterior cruciate ligament reconstruction in professional soccer players at time of return to sport. J Strength Cond Res 2021, 35, 769–775. [Google Scholar] [CrossRef] [PubMed]
- Norton, K.I. Standards for Anthropometry Assessment. In Kinanthropometry and Exercise Physiology, 4th ed.; Norton, K., & Eston, R., Ed. Routledge: Abingdon, 2018; 9781315385662p. [Google Scholar]
- Shapiro, S.S.; Wilk, M.B. An analysis of variance test for normality (complete samples). Biometrika 1965, 52, 591–611. [Google Scholar] [CrossRef]
- Bishop, C.; Lake, J.; Loturco, I.; Papadopoulos, K.; Turner, A.; Read, P. Interlimb asymmetries: The need for an individual approach to data analysis. J Strength Cond Res 2021, 35, 695–701. [Google Scholar] [CrossRef] [PubMed]
- Bishop, C.; Turner, A.; Read, P. Effects of inter-limb asymmetries on physical and sports performance: A systematic review. J Sports Sci 2018, 36, 1135–1144. [Google Scholar] [CrossRef] [PubMed]
- Hovey, S.; Wang, H.; Judge, L.W.; Avedesian, J.M.; Dickin, D.C. The effect of landing type on kinematics and kinetics during single-leg landings. Sports Biomech 2021, 20, 543–559. [Google Scholar] [CrossRef] [PubMed]
- Bishop, C.; Read, P.; Chavda, S.; Jarvis, P.; Turner, A. Using unilateral strength, power and reactive strength tests to detect the magnitude and direction of asymmetry: A test-retest design. Sports 2019, 7, 58. [Google Scholar] [CrossRef] [PubMed]
- Bishop, C.; Read, P.; Chavda, S.; Jarvis, P.; Brazier, J.; Bromley, T.; Turner, A. Magnitude or direction? Seasonal variation of interlimb asymmetry in elite academy soccer players. J Strength Cond Res 2022, 36, 1031–1037. [Google Scholar] [CrossRef] [PubMed]
- Sharp, A.P.; Neville, J.; Nagahara, R.; Wada, T.; Cronin, J.B. Stretch-load demands in multiple hops: Implications for athletic performance and rehabilitation. (in review), 2024.
- Exell, T.A.; Irwin, G.; Gittoes, M.J.R.; Kerwin, D.G. Implications of intra-limb variability on asymmetry analyses. J Sports Sci 2012, 30, 403–409. [Google Scholar] [CrossRef] [PubMed]
- Dos’Santos, T.; Bishop, C.; Thomas, C.; Comfort, P.; Jones, P.A. The effect of limb dominance on change of direction biomechanics: A systematic review of its importance for injury risk. Phys Ther Sport 2019, 37, 179–189. [Google Scholar] [CrossRef] [PubMed]
- Dos’Santos, T.; Thomas, C.; Jones, P.A.; Comfort, P. Asymmetries in single and triple hop are not detrimental to change of direction speed. J Trainol 2017, 6, 35–41. [Google Scholar] [CrossRef] [PubMed]
Figure 1.
The sequence of a right foot 3-Hop test (green).
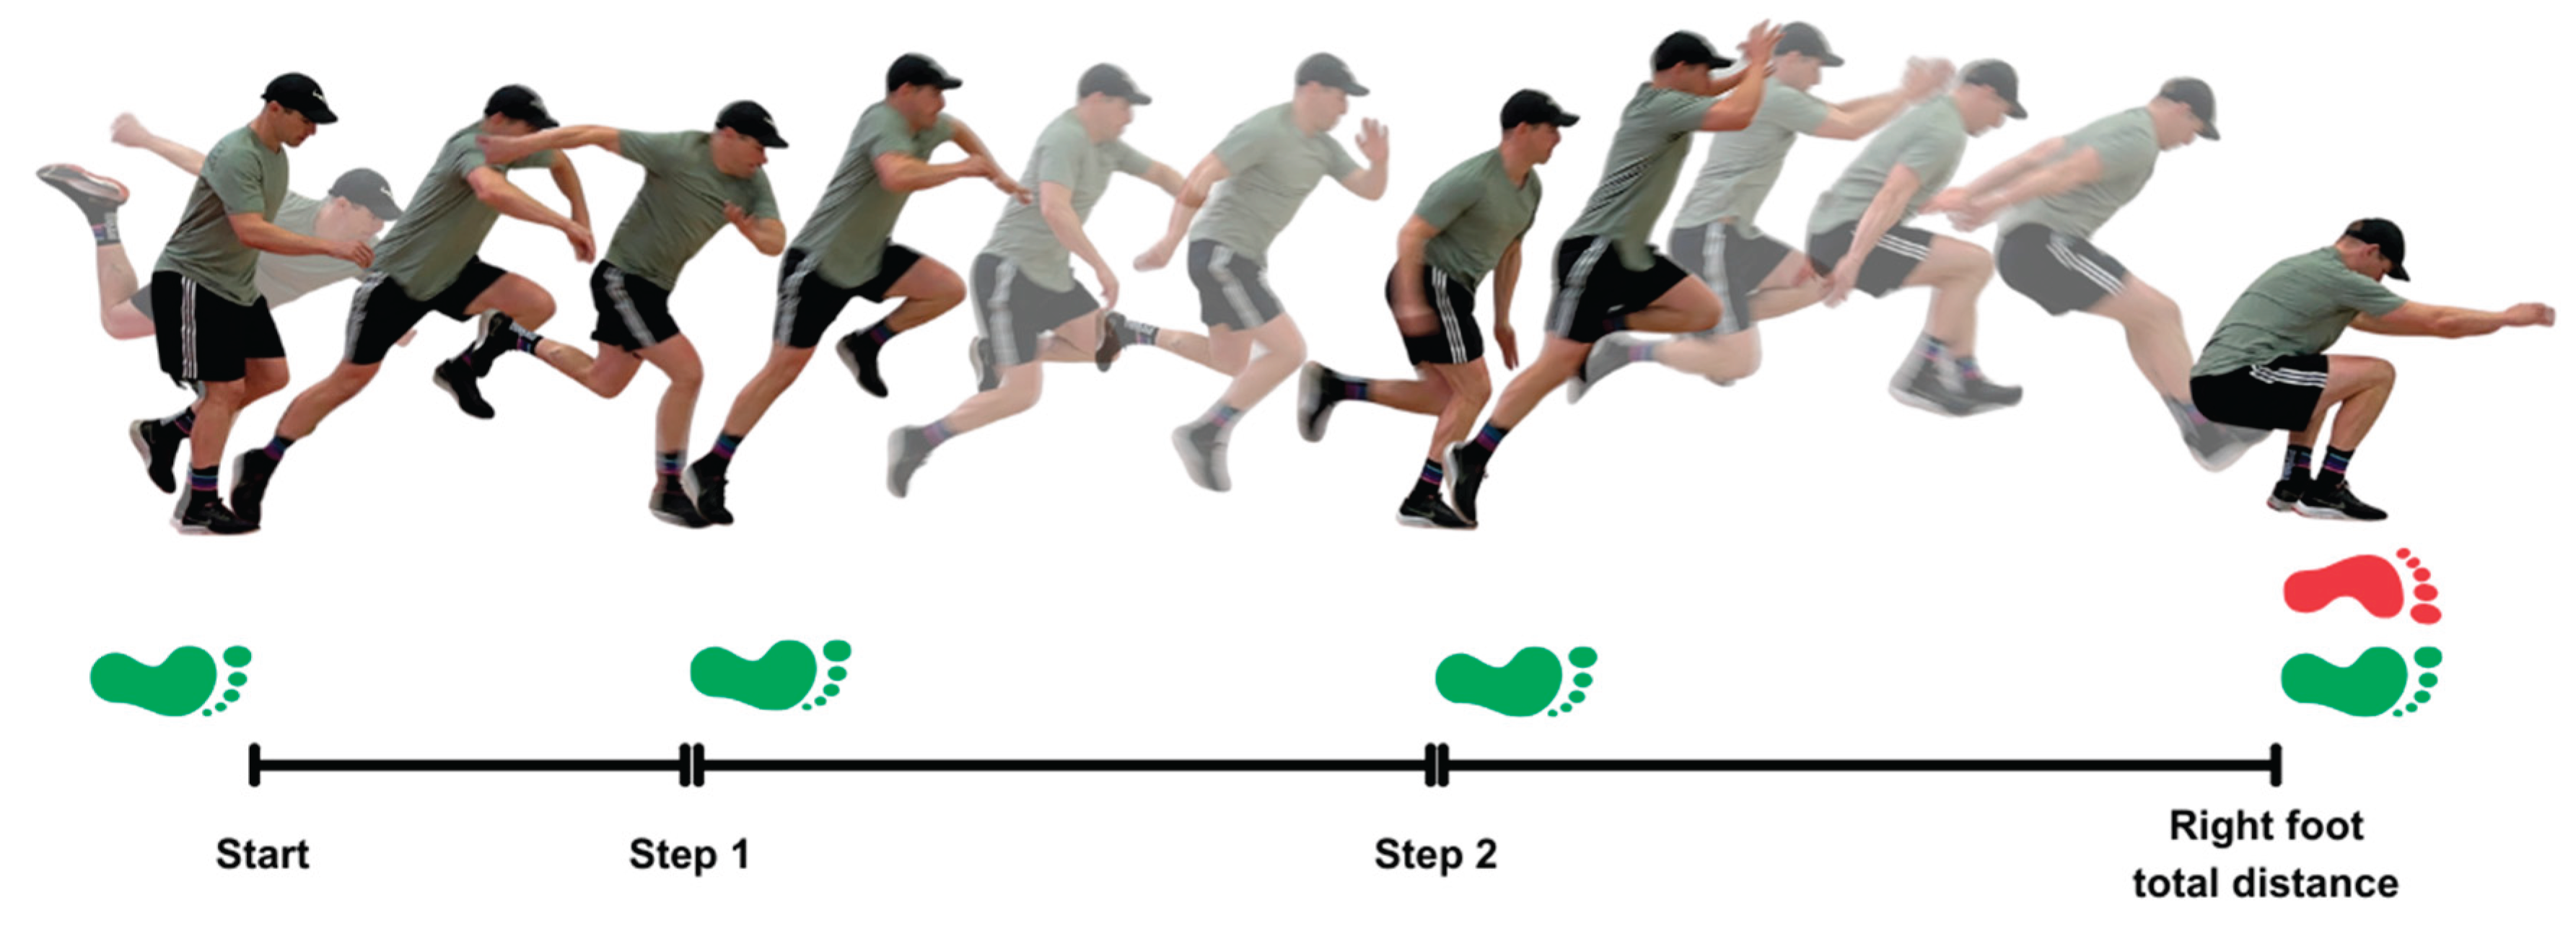

Table 1.
3-Hop and 5-Hop mean asymmetry scores (%) ± standard deviations for hop kinematics.
| 3-Hop | 5-Hop | |||||||
|---|---|---|---|---|---|---|---|---|
| Asymmetry Variable | Means ± SD (%) | Range (%) | Means ± SD (%) | Range (%) | ||||
| Flight Time | ||||||||
| Hop 1 | 4.72 ± 3.85 | 0.00 to 14.3 | 4.63 ± 3.23 | 0.00 to 12.9 | ||||
| Hop 2 | 4.51 ± 3.38 | 0.00 to 11.8 | 6.31 ± 5.94 | 0.00 to 26.5 | ||||
| Hop 3 | 4.59 ± 3.92 | 0.00 to 14.0 | 6.18 ± 4.26 | 0.00 to 17.1 | ||||
| Hop 4 | 5.24 ± 3.98 | 0.00 to 17.1 | ||||||
| Hop 5 | 4.34 ± 3.64 | 0.00 to 14.9 | ||||||
| Ground Contact Time | ||||||||
| Hops 1-2 | 5.41 ± 3.92 | 0.00 to 16.7 | 4.77 ± 4.02 | 0.00 to 17.2 | ||||
| Hops 2-3 | 5.25 ± 3.41 | 0.00 to 14.3 | 5.09 ± 4.02 | 0.00 to 16.7 | ||||
| Hops 3-4 | 5.52 ± 4.42 | 0.00 to 17.9 | ||||||
| Hops 4-5 | 4.58 ± 3.66 | 0.00 to 14.3 | ||||||
| Hops Times | ||||||||
| Hops 1-2 | 3.41 ± 3.14 | 0.00 to 12.3 | 4.52 ± 2.95 | 0.00 to 11.3 | ||||
| Hops 2-3 | 3.49 ± 2.24 | 0.00 to 9.23 | 4.25 ± 2.79 | 0.00 to 10.5 | ||||
| Hop 3-4 | 3.83 ± 3.44 | 0.00 to 12.3 | ||||||
| Hop 4-5 | 3.48 ± 2.75 | 0.00 to 13.0 | ||||||
| Total Hop Time | 2.39 ± 2.18 | 0.00 to 9.20 | 2.45 ± 1.62 | 0.00 to 6.29 | ||||
| Hop Distance | ||||||||
| Hop 1 | 3.67 ± 2.54 | 0.00 to 11.2 | 3.66 ± 3.27 | 0.00 to 12.6 | ||||
| Hop 2 | 3.04 ± 2.41 | 0.00 to 9.41 | 3.50 ± 3.16 | 0.00 to 12.7 | ||||
| Hop 3 | 3.18 ± 2.38 | 0.00 to 11.1 | 3.88 ± 2.35 | 0.40 to 10.1 | ||||
| Hop 4 | 4.01 ± 3.07 | 0.50 to 10.4 | ||||||
| Hop 5 | 4.65 ± 3.19 | 0.00 to 11.9 | ||||||
| Total Hop Distance | 2.39 ± 1.89 | 0.18 to 10.6 | 3.32 ± 2.72 | 0.09 to 9.34 | ||||
| Reactive Strength Index | ||||||||
| Hops 1-2 | 5.45 ± 4.05 | 0.14 to 22.0 | 5.49 ± 4.86 | 0.00 to 25.8 | ||||
| Hops 2-3 | 6.26 ± 4.59 | 0.25 to 17.0 | 6.08 ± 5.92 | 0.13 to 28.9 | ||||
| Hops 3-4 | 7.07 ± 5.29 | 0.13 to 25.4 | ||||||
| Hops 4-5 | 7.04 ± 4.56 | 0.33 to 18.5 | ||||||
| Total RSIhor | 4.87 ± 3.33 | 0.27 to 14.2 | 5.16 ± 4.29 | 0.08 to 20.5 | ||||
Key: SD = Standard Deviation; Time variables = seconds; Distance variables = meters; RSI = m.s-1.
Table 2.
3-Hop and 5-Hop mean asymmetry scores (%) ± standard deviations for hop kinetics.
| 3-Hop | 5-Hop | |||
|---|---|---|---|---|
| Asymmetry Variable | Means ± SD (%) | Range (%) | Means ± SD (%) | Range (%) |
| Maximal Vertical Force | ||||
| Hops 1-2 | 9.94 ± 7.87 | 0.15 – 33.9 | 8.06 ± 7.24 | 0.33 – 30.6 |
| Hops 2-3 | 10.3 ± 7.53 | 0.07 – 29.1 | 10.4 ± 8.88 | 0.08 – 36.6 |
| Hops 3-4 | 11.2 ± 8.70 | 0.96 – 28.3 | ||
| Hops 4-5 | 11.5 ± 7.61 | 0.41 – 29.1 | ||
| Vertical Braking Impulse | ||||
| Hops 1-2 | 29.6 ± 24.1 | 0.00 – 91.2 | 39.8 ± 31.6 | 0.00 – 95.4 |
| Hops 2-3 | 14.3 ± 12.0 | 0.75 – 51.1 | 15.6 ± 12.4 | 0.78 – 53.8 |
| Hops 3-4 | 13.5 ± 10.9 | 0.33 – 40.2 | ||
| Hops 4-5 | 11.2 ± 8.96 | 0.00 – 30.8 | ||
| Vertical Propulsive Impulse | ||||
| Hops 1-2 | 7.77 ± 5.95 | 0.45 – 25.6 | 8.93 ± 6.13 | 0.46 – 27.6 |
| Hops 2-3 | 9.44 ± 8.87 | 0.00 – 47.5 | 7.96 ± 5.44 | 0.00 – 24.3 |
| Hops 3-4 | 10.2 ± 7.15 | 0.32 – 31.0 | ||
| Hops 4-5 | 15.4 ± 14.0 | 0.75 – 61.6 | ||
| Horizontal Braking Impulse | ||||
| Hops 1-2 | 38.8 ± 26.0 | 0.00 – 90.9 | 32.4 ± 23.6 | 0.00 – 87.5 |
| Hops 2-3 | 24.9 ± 16.6 | 0.00 – 72.7 | 36.9 ± 23.6 | 0.00 – 84.0 |
| Hops 3-4 | 25.0 ± 14.2 | 0.00 – 61.3 | ||
| Hops 4-5 | 19.9 ± 15.0 | 1.72 – 51.8 | ||
| Horizontal Propulsive Impulse | ||||
| Hops 1-2 | 10.8 ± 7.07 | 0.00 – 28.4 | 10.4 ± 8.91 | 0.00 – 37.4 |
| Hops 2-3 | 14.8 ± 9.30 | 0.00 – 34.0 | 11.8 ± 8.44 | 0.00 – 31.7 |
| Hops 3-4 | 14.4 ± 9.82 | 0.00 – 42.2 | ||
| Hops 4-5 | 17.6 ± 12.3 | 2.56 – 66.7 | ||
Key: SD = Standard Deviation; Force variables = Ns.kg; Impulse variables.
Disclaimer/Publisher’s Note: The statements, opinions and data contained in all publications are solely those of the individual author(s) and contributor(s) and not of MDPI and/or the editor(s). MDPI and/or the editor(s) disclaim responsibility for any injury to people or property resulting from any ideas, methods, instructions or products referred to in the content. |
© 2025 by the authors. Licensee MDPI, Basel, Switzerland. This article is an open access article distributed under the terms and conditions of the Creative Commons Attribution (CC BY) license (http://creativecommons.org/licenses/by/4.0/).
Copyright: This open access article is published under a Creative Commons CC BY 4.0 license, which permit the free download, distribution, and reuse, provided that the author and preprint are cited in any reuse.


