Submitted:
07 July 2025
Posted:
11 July 2025
Read the latest preprint version here
Abstract
This study investigates the effects of pulsed electric field (PEF) pretreatment—applied prior to malaxation using electric field strengths ranging from 2 to 7 kV/cm for 30 to 90 seconds—on oil yield, quality parameters, and volatile profiles of virgin olive oils (VOO) from four Croatian autochthonous varieties: Istarska bjelica and Rosulja (Istria), and Levantinka and Oblica (Dalmatia). The mild PEF conditions resulted in a significant improvement in oil yield (between 2.5 % and 36 %) for all varieties, with the effects being most pronounced for varieties with lower initial oil yields. While the PEF treatment had a negligible effect on the basic quality parameters, it significantly altered the volatile organic compound (VOC) profiles of the oils. In particular, all treated oils showed an increased content of VOCs originating from the lipoxygenase (LOX) pathway, especially at lower field strengths. In addition, PEF treatment had a significant effect on the composition of VOCs from the LOX path, indicating a change in the activity of the enzymes involved in their biosynthesis. We investigated the effects of PEF treatment on LOX activity and found that it varied by cultivar, indicating a variety-dependent response. In addition, PEF generally had a positive effect on minor VOCs associated with oxidation and microbial activity. These results emphasize the potential of PEF as a non-thermal, environmentally friendly technology to increase the efficiency of oil extraction and improve the aroma profile of VOO.
Keywords:
virgin olive oil
; pulsed electric field
; oil yield
; quality
; lipoxygenase activity
; volatile components
Introduction
Pulsed electric field (PEF) is an emerging, non-thermal food processing technology that has gained significant attention in recent years. It involves subjecting food materials to repeated short pulses of high voltage between two electrodes, typically at room temperature and for a short period of time. This technique significantly reduces energy consumption compared to conventional thermal treatments, while minimizing undesirable changes in the sensory and physical properties of food. As a result, PEF contributes to better preservation of nutritional value and overall product quality. The fundamental mechanism of PEF is increasement of a transmembrane potential in cells, leading to electroporation, which increases cell membrane permeability. Due to this effect, PEF has been widely studied for various applications including the extraction of bioactive compounds, microbial inactivation, and as a pretreatment to enhance drying efficiency [1,2]. In addition, the application of PEF can induce molecular-level changes, modifying the structure, and consequently the functional properties,of biomacromolecules such as starches and proteins, as well as changing the enzyme activity [3]. Most research has concentrated on enzyme inactivation by PEF, but some evidence indicates that, under specific conditions, PEF may increase enzyme activity, depending on the enzyme and the applied parameters [4,5,6].
The specific advantages of PEF technology have driven increased research interest in its application to virgin olive oil (VOO) production. VOO is obtained exclusively through mechanical processes and is renowned for its unique sensory characteristics and high nutritional value. Phenolic compounds are the main compounds linked to high nutritional value of VOO, but they also play a crucial role in defining it’s the key sensory attributes, particularly bitterness and pungency. However, the overall sensory quality of VOO is primarily determined by its volatile organic compound (VOC) profile. VOCs in VOO originate from three main sources: (i) the lipoxygenase (LOX) pathway, (ii) oxidative degradation of fatty acids (OX), and (iii) microbiological activity (MBA) during processing. While OX and MBA are primarily associated with the formation of volatiles that contribute to undesirable sensory attributes, the LOX pathway involves a sequence of enzymatic reactions that generate C5 and C6 VOCs, key compounds responsible for the pleasant green and fruity aromas characteristic of high-quality VOO [7].
One of the major challenges in VOO production is the relatively low efficiency of conventional extraction methods. Typically, only around 80% of the oil contained in the olive fruit is effectively recovered, while the remainder remains trapped within intact cells or emulsified in the aqueous phase [8,9]. Electroporation of cell membranes induced by PEF treatment facilitates the release of oil that is otherwise inaccessible through conventional technology, thereby enhancing extraction efficiency. Increases in oil yield of up to 25%, depending on the specific PEF parameters applied, have been reported in the literature [10,11,12,13]. Importantly, these yield improvements have not been associated with negative effects on oil quality or the development of sensory defects. However, modifications in the VOC profile have been observed following PEF treatment. For instance, Tamborrino et al. [12] reported a reduction in C5 and C6 alcohols, while Navarro et al. [11] found a significant increase in 2-hexenal, indicating that PEF may influence the activity of enzymes involved in the LOX pathway. Moreover, Veneziani et al. [14] additionally emphasized the important role of genetic variability among olive varieties in modulating both oil yield and changes in the VOC profile under PEF treatment.
Given that the effects of PEF depend on both the processing parameters and the olive variety—along with potential interactions between the two—the aim of the present study was to evaluate the impact of PEF pretreatment on oil yield, quality parameters, and VOC profiles of VOO extracted from four Croatian autochthonous cultivars: two from Istria region, Istarska bjelica and Rosulja, and two from Dalmatia, Levantinka and Oblica. PEF treatment was applied prior to malaxation, using electric field strengths ranging from 2 to 7 kV/cm and treatment durations between 30 and 90 seconds.
2. Results and Discussion
2.1. Oil Yield and Quality Parameters of Croatian Virgin Olive Oils
The olive varieties analyzed in this study exhibited substantial variation in oil yield, ranging from 5% to 16% (Table 1). The Istrian varieties (Istarska bjelica and Rosulja) had significantly lower oil yields compared to the Dalmatian varieties, with Levantinka having the highest oil yield, which was significantly higher than that of Oblica and both Istrian varieties.
Previously published data also reflect considerable variability in oil yield across these varieties. For Istarska bjelica, reported oil yields range from 10% to 25% [15,16,17,18] while for Rosulja, values between 5% and 18% have been documented [15,19]. According to Žanetić et al. [20], Levantinka typically exhibits an oil content of approximately 20%, with an average yield around 12.5% [18]. Oblica displays a broader yield range, varying between 13% and 22%, influenced by cultivation conditions and fruit maturity index [18,21].
Climatic conditions during the oil accumulation period (July–August 2022) differed notably between the regions from which the oil-producing fruits originated, possibly contributing to the observed differences in oil yield (Tables S1 and S2). In Dalmatia, average monthly temperatures during this period were approximately 2 °C higher than those recorded in Istria. However, when compared to the respective five-year regional averages, Dalmatia showed only a marginal increase of +0.3 °C, whereas Istria experienced a more pronounced increase of approximately +1.4 °C. Additionally, both regions received significantly reduced precipitation during the same period. During this period (July–August 2022), precipitation levels were significantly lower than the five-year average—more than eight times lower in Istria and up to twelve times lower in Dalmatia according to data from the Croatian Meteorological and Hydrological Service (CMHS) (Tables S1 and S2). Previous research has shown that elevated temperatures during fruit development can adversely affect oil biosynthesis, leading to lower yields [22]. However, the extent of this impact is variety-dependent, as olive genotypes exhibit differing levels of tolerance to heat and drought stress. Oblica, and particularly Levantinka, are recognized for their resilience to water deficit conditions [23,24] which likely contributed to their superior oil yields despite the adverse climatic conditions of the 2021/2022 olive season.
The basic quality parameters of the oil (Table 1)—including acidity as indicators of hydrolytic degradation, and peroxide value (PV) and specific extinction coefficients at 232 and 268 nm (K232 and K268) as markers of oxidative deterioration — were found to vary significantly among varieties. Nevertheless, all measured values remain well within the regulatory limits established for extra VOO under EU legislation [25].
2.2. Lipoxygenase Activity and Composition of Volatile Compounds in Croatian Virgin Olive Oils
The quality of virgin olive oil (VOO) is determined not only by its basic physicochemical parameters but also by its sensory attributes. Phenolic compounds contribute significantly to desirable sensory characteristics, bitterness and pungency. In contrast, VOCs are primarily responsible for the oil’s aromatic profile. As previously mentioned, VOCs derived from the LOX pathway play a key role in creating the distinctive green and fruity notes that are characteristic of high-quality VOO [7].
Lipoxygenase (LOX) is the initial enzyme in the LOX pathway, catalyzing the oxidation of free polyunsaturated fatty acids to form conjugated hydroperoxides. The activity of this enzyme has been identified as a limiting factor in the biosynthesis of VOCs in VOO [26,27]. For this reason, LOX activity was selected in this study as a key parameter for monitoring the formation of VOCs in produced VOOs. LOX activity in Croatian VOOs is presented in Table 2. The results reveal a significant effect of olive variety on LOX activity. Specifically, the Istrian varieties demonstrated significantly higher LOX activity compared to the Dalmatian varieties, with the Rosulja variety exhibiting the highest overall activity. The influence of variety on the VOC of VOO is well-documented and is largely attributed to genetic differences affecting enzyme activity [28,29,30,31,32,33]. In addition to varietal genetics, environmental factors and geographical origin also contribute to variability in LOX activity. Some studies have suggested that geographical origin may be an even stronger determinant of the volatile profile than variety alone [34]. Padilla et al. [35] further showed that environmental conditions—such as temperature, light exposure, mechanical wounding, and water availability—can modulate the expression of the 13-LOX gene at the transcriptional level, thereby influencing LOX enzyme activity. Notably, their research indicated that lower temperatures could enhance LOX activity. Based on these findings, it is reasonable to conclude that the elevated LOX activity observed in the Istrian varieties likely resulted from the combined influence of varietal genetics, regional origin, and environmental conditions, particularly temperature (Table 2, Tables S1 and S2).
To the best of our knowledge, the only prior study investigating LOX activity in Croatian olive varieties was conducted by Soldo et al. [33], focusing exclusively on Dalmatian varieties. Among these, Oblica and Levantinka—also included in the present study—were analyzed. The authors reported a significant increase in LOX activity with advancing fruit maturity over a three-year period. Additionally, they also reported that Oblica consistently exhibited higher LOX activity than Levantinka at comparable maturity indices across multiple harvest seasons. Our findings are consistent with this study, as we observed a similar trend: Oblica, at a maturity index of 1.75, showed higher LOX activity than Levantinka at a maturity index of 2.01 (Table 2).
The total mass fraction VOCs derived from the LOX pathway show a partial correlation with measured LOX activity (Table 2). Although Rosulja had significantly higher LOX activity compared to the other varieties studied, the total concentration of its LOX-derived VOCs did not differ significantly from those measured in Istarska bjelica and Oblica. However, Istarska bjelica and Oblica showed a significant difference in content of VOCs originating from LOX path between them. Levantinka, which demonstrated the lowest LOX activity, also had the lowest concentration of VOCs from the LOX-pathway, supporting the hypothesis that LOX activity is a limiting factor in the biosynthesis of these compounds [26].
Overall, the Istrian varieties tended to produce a higher total mass fraction of LOX-derived volatiles than the Dalmatian varieties. These findings are consistent with previous studies, which reported that lower ambient temperatures during fruit development are associated with enhanced accumulation of LOX-pathway compounds [36,37]. Similarly, Lukić et al. [32] also observed higher concentrations of LOX-derived volatiles in oils from Istrian varieties compared to those from Dalmatian varieties.
Furthermore, the composition of VOCs derived from the LOX pathway is strongly influenced by the geographical origin of olive growth. In oils produced from Istrian varieties, aldehydes are the predominant VOC class accounting for 68 % of LOX volatiles in Rosulja and 77 % in Istarska bjelica. On the other hand, alcohols are more abundant in oils from Dalmatian varieties, 79 and 87 % in Levantinka and Oblica VOO, respectively (Table 2). This difference is likely associated with increased activity of alcohol dehydrogenase (ADH) in the Dalmatian varieties, which catalyzes the conversion of aldehydes into their corresponding alcohols.
The predominant compound derived from the LOX pathway in Istrian VOOs is 2-hexenal, which makes up more than 50% of the total LOX-derived volatiles. This observation is consistent with earlier studies, which also identified 2-hexenal as the major aldehyde in the oils of Istarska bjelica and Rosulja varieties [32,38,39,40]. In contrast, the dominant VOCs from the LOX path in Dalmatian olive varieties are the C6 alcohols, 2-hexen-1-ol and (Z)-3-hexen-1-ol. In Oblica VOO, (Z)-3-hexen-1-ol accounts for approximately 47.5% of LOX-derived VOCs, while 2-hexen-1-ol constitutes around 20%. The Levantinka variety exhibits nearly inverse proportions, with (Z)-3-hexen-1-ol accounting for 28.6% and 2-hexen-1-ol approximately 47% (Table 2). These differences suggest variety-specific activity of isomerase enzymes, responsible for the interconversion of these structural isomers. Variation in LOX-pathway enzyme activity is also reflected in the activity of alcohol acetyl transferase (AAT), which was found to be significantly higher in Levantinka than in Oblica, and higher than in Istrian varieties as well. This increased enzymatic activity is supported by the presence of esters such as 3-hexenyl acetate and hexyl acetate in Levantinka VOO. Lukić et al.[32] also reported (Z)-3-hexen-1-ol as the predominant LOX-pathway alcohol in Oblica VOOs. Some of the other studies have identified 2-hexenal as the dominant VOC from the LOX path in both Oblica and Levantinka [33,41]. Furthermore, ester formation in Dalmatian varieties was shown to vary over the harvest season and was closely linked to fruit maturity index, as reported by Soldo et al. [33].
In present study, C5 ketones were also identified among the VOC originating from the LOX pathway. 1-penten-3-one was consistently detected across all analyzed oils, whereas pentan-3-one was detected exclusively in the Rosulja variety. Significant inter-variety differences were found for nearly all VOCs derived from the LOX path. Exceptions included the relative proportions of 2-hexen-1-ol as well as (E)-2-penten-1-ol and pentan-3-one, both of which were present at low concentrations and did not exhibit significant varietal variation.
In addition to LOX pathway products, which constitute the predominant fraction of VOCs in studied oils, volatiles resulting from fatty acid oxidation (OX) and microbiological activity (MBA) were also detected in all analyzed samples (Table 2). The olive variety exerted a significant influence on the concentrations of these non-LOX volatiles. Notably, Istarska bjelica had significantly higher levels of both compound groups, approximately four-fold higher concentrations of OX products and two-fold higher concentrations of MBA derived volatiles compared to other varieties. The elevated levels of OX products in Istarska bjelica VOOs were primarily attributed to increased concentrations of 2,4-hexadienal and, in particular, 4-oxohex-2-enal (Table 2), a secondary oxidation product resulting from the degradation of polyunsaturated fatty acids [42]. Additionally, Tukey’s post-hoc analysis revealed a significant difference (p ≤ 0.05) in pentanal concentrations between Istrian and Dalmatian varieties, with higher levels detected in the latter. The composition of MBA products also exhibited significant variation based on the geographical origin of the olives. In Istrian varieties, particularly Istarska bjelica, the branched-chain aldehydes 2-methylbutanal and 3-methylbutanal were prevalent, whereas Dalmatian varieties showed higher levels of pentan-1-ol (Table 2). These branched aldehydes are products of amino acid catabolism and are associated with the development of the fusty sensory defect. In contrast, pentan-1-ol, formed via yeast- and mold-induced fermentation, is linked to the winey–vinegary defect. The aforementioned branched aldehydes are characterized by malty, sweet, and ripe odor notes and possess a nasal odor threshold significantly lower than the concentrations detected in Istarska bjelica and are likely to have an impact on sensory profile of the produced oil. Conversely, the odor threshold of pentan-1-ol exceeds the concentrations observed in Oblica VOO suggesting that its presence is unlikely to negatively affect the sensory quality of produced oils [7].
2.3. Effect of Pulsed Electric Field on Oil Yield and Quality Parameters
The application of PEF technology in VOO production has been extensively investigated over the past decade. Due to its capacity to disrupt olive cell structures, PEF has been shown to enhance oil extractability and improve oil quality, particularly through its influence on the release of bioactive compounds and the preservation of key sensory attributes of VOO. Reported increases in oil yield following PEF treatment range from 2.3% to 25% [11,12,13,14,43,44,45]. Importantly, these studies consistently indicate that PEF does not negatively affect the physico-chemical quality parameters required for VOO classification, nor does it induce sensory defects. However, most studies employed moderate electric field strengths (up to 2 kV/cm) with variable treatment durations. In our previous work, we examined the influence of electric field strength and PEF treatment duration on the activity of β-glucosidase and LOX enzymes in model systems [6]. The results indicated that electric field strength positively affected β-glucosidase activity, whereas treatment duration significantly influenced LOX activity. These findings suggest that PEF could enhance the formation of phenolic and volatile compounds, thereby improving the sensory profile of VOO, depending on the applied parameters. Furthermore, Tamborrino et al. [12] reported that PEF treatment modified the concentrations of specific oleuropein and ligstroside derivatives, as well as certain volatile alcohols. Moreover, Venenziani et al. [14] highlighted that the effect of PEF is variety dependent. Based on these insights, the present study aimed to evaluate the impact of PEF pretreatment on selected autochthonous Croatian olive varieties. PEF was applied prior to malaxation, with experimental combinations of electric field strength (2 and 7 kV/cm) and treatment duration (30 and 90 seconds) designed according to a central composite experimental design. The resulting data were used to develop two-factor interaction models for each variety. Model parameters, including regression coefficients and p-values, are provided in the supplementary material (Tables S3-S5).
Response surface plots derived from the developed models, illustrating the relative change in oil yield for each of the four investigated olive varieties, are presented in Figure 1a–d. The application of PEF treatment resulted in enhanced oil extraction efficiency across all varieties; however, the extent of this improvement was dependent on the specific variety. In Istarska bjelica, the increase ranged from 10.7% to 26.1% (Figure 1a), while in Rosulja, it reached values from 9.7% up to 36% compared to the untreated control (Figure 1b). These enhancements are notably higher than those reported in previously published studies [12,14,43,45]. In contrast, the Dalmatian varieties exhibited a significantly lower increase in oil yield after PEF treatment. Specifically, the Oblica variety showed an increase of up to 4% (Figure 1d), while Levantinka reached a maximum of only 2.5% (Figure 1c). Notably, the Istrian olive varieties, which had lower baseline oil yields for controls - averaging 5.5% (Table 1), exhibited substantially greater relative improvements upon PEF pretreatment compared to the Dalmatian varieties (Figure 1a-d). This difference can be attributed to differences in the oil-to-water ratio between olive varieties (see Subsection 3.1. Plant Material). The Istrian varieties, characterized by a lower content, possess a correspondingly higher water content, which enhances the electrical conductivity of the olive paste. Increased conductivity facilitates more effective transmission of PEF, thereby promoting greater cell membrane permeabilization and structural disruption [46] ,which in turn improves oil release. Ultimately, this indicates that the greatest impact of PEF on oil extraction efficiency can be achieved in olives with lower initial oil yield, whether due to inherent varietal characteristics or as a consequence of low oil content due to increasingly prevalent adverse climatic conditions associated with climate change.
A comparison of variety responses to varying PEF parameters revealed distinct differences in sensitivity to electric field strength and treatment duration. In Istarska bjelica (Figure 1a), the highest yield increase was observed at the maximum field strength, whereas treatment time alone had a slightly negative effect. Conversely, at lower field strengths, longer treatment durations were necessary to achieve comparable yield improvements. In Rosulja (Figure 1b), the highest relative increase in yield occurred at lower electric field strengths, indicating an inverse response compared to Istarska bjelica. A similar pattern was observed in Oblica (Figure 1d), though with an added positive influence of treatment time. Notably, in Oblica, increasing the field strength beyond about 3 kV/cm led to a yield reduction of up to 5% compared to the control. This may be attributed to enhanced emulsion stability resulting from PEF-induced structural modifications of proteins and phospholipids, which are released into the matrix upon cell disruption and contribute to emulsification, thereby reducing extractable oil [47]. Levantinka (Figure 1c), which exhibited the highest initial oil yield among the tested varieties (Table 1), showed the greatest relative increase at medium field strengths, with an additional positive effect of prolonged treatment time. In contrast, shorter durations at both low and high field strengths resulted in decreased yields relative to the control. It should be noted, however, that, according to the statistical analysis (Table S3), none of the fitted models adequately described the experimental data. Although the R² values were relatively low (R² < 0.7), these experimental data remain valuable for identifying overall trends and informing future optimization strategies. The observed variability in the central point replicates illustrates the complexity of the system under investigation.
Figures 2 to 5 present the response surface plots illustrating the effects of PEF parameters on basic quality parameters. Unlike the data on extraction yield, these results are expressed as absolute differences compared to the untreated control, allowing for a more transparent assessment of parameter deviations in relation to legally established limits. This approach facilitates the evaluation of whether regulatory limits were exceeded for parameters subject to official quality standards [25].
Changes in acidity are shown in Figures 2a–d. The maximum deviation from the control was 0.04% oleic acid, and the acidity of all produced oils was well below the regulatory limit of 0.8% for extra VOO, indicating that PEF treatment did not significantly promote hydrolytic degradation. With the exception of Oblica, all varieties exhibited similar trends in acidity response to PEF treatment. A minimal increase in acidity was observed at lower electric field strengths, while higher field strengths led to a slight decrease. This pattern may be attributed to variations in lipase activity under different PEF treatments. Similar findings were reported by Yang et al. [43], who observed an increase in acidity after PEF treatment at 1.6 kV/cm, potentially due to enhanced lipase activity while Ho et al. [48] reported that higher voltages of 5 and 15 kV/cm reduced lipase activity by up to 30%. Oblica differed from the other varieties, showing a consistent but minimal increase in acidity (0.02–0.03%) regardless of treatment parameters. Statistical analysis (Table S3) showed that the response surface models for Istarska bjelica and Levantinka had good predictive value (R² > 0.7), whereas no significant model fit was found for Oblica and Rosulja. In Istarska bjelica, electric field strength was the primary factor influencing acidity variation. In Levantinka, both electric field strength and treatment time contributed similarly, with a statistically significant effect observed for the square of time.
PEF treatment had a relatively minor effect on primary oxidation products determined by PV, as shown in Figure 3a–d. However, the response varied among varieties. In the Istrian varieties, PV generally decreased across all treatment conditions (Figure 3a and 3b). A slight increase was observed only in Istarska bjelica under the highest electric field strength and longest treatment duration. This reduction in PV may be attributed to peroxidase inactivation by PEF and/or the enhanced activity of antioxidant compounds, particularly polyphenols, which inhibit oxidative degradation. Lukić et al. [32] previously reported that Istrian varieties investigated in this study contain significantly higher polyphenol concentrations compared to Oblica. This could explain why Oblica showed an increase in PV under all treatment conditions (Figure 3d). The smallest changes were observed in Levantinka (Figure 3c), suggesting minimal sensitivity of this variety to PEF in terms of oxidative stability.
Statistical modeling (Table S3) indicated good fit for the Istrian varieties (R² > 0.8), although the influencing factors differed between them. In Istarska bjelica, electric field strength was the most significant factor, with both its linear and quadratic terms showing a statistically significant positive effect on PV increase. In Rosulja, treatment duration had the strongest influence, particularly the quadratic term, as well as its interaction with electric field strength. Additionally, the quadratic term for electric field strength was also statistically significant (p ≤ 0.05), indicating a non-linear relationship. No significant model was obtained for Levantinka or Oblica, reflecting their limited or inconsistent response to PEF with respect to PV.
The trends observed for the extinction coefficient at 232 nm (K232), which also indicates the presence of primary oxidation products, were largely consistent with those of PV (Figure 4a–d). In Rosulja, K232 values decreased across all PEF treatments (Figure ab), while Oblica showed a consistent increase, reflecting its greater susceptibility to oxidative changes (Figure 4d). Levantinka again demonstrated the greatest resistance, with minimal changes in K232, suggesting strong oxidative stability under PEF conditions (Figure 4c). In Istarska bjelica, a slight increase in K232 was observed despite a decrease in PV (Figure 4a). Notably, the response surface plots for K232 for Istarska bjelica are almost identical to those for PV, and electric field strength was found to have a statistically significant (p<0.05) positive effect on K232 values (Table S4). In contrast, no clear patterns were observed for K268, which reflects secondary oxidation products (Figure 5a–d). None of the fitted models for K268 achieved satisfactory predictive power (R² < 0.7), and no statistically significant effects of the PEF parameters were identified (Table S4).
Overall, the application of PEF treatment under the tested conditions had a minor or negligible impact on the basic quality parameters of VOO. All values remained well below the regulatory limit for extra VOO across all varieties, indicating no significant hydrolytic or oxidative degradation.
2.4. Effect of Pulsed Electric Field on Lipoxygenase Activity and Volatile Compounds
Response surface plots illustrating the behavior of LOX activity under Pulsed treatment for each variety are presented in Figure 6. LOX activity is expressed as a relative difference (%) compared to the untreated control. The results indicate a clear variety-dependent response to PEF. In the Istrian varieties, which exhibited high baseline LOX activity, PEF generally led to a reduction in enzyme activity. Conversely, the Dalmatian varieties, characterized by lower initial LOX activity, showed an increase after the treatment. The reduction of the LOX activity was the most pronounced in Rosulja, which had the highest LOX activity in the control samples and exhibited a reduction of up to 95% after PEF treatment (Figure 6b). In Istarska bjelica, the decrease was smaller but still notable, with up to a 25% reduction (Figure 6a). The response surface models for the Istrian varieties demonstrated good predictive accuracy (R² > 0.7), with treatment time identified as the most influential factor (Table S4). Interestingly, the effect of time differed between these two varieties: in Istarska bjelica, a slight increase in LOX activity was observed at the shortest treatment time, while in Rosulja, the greatest reduction occurred under the same condition. In Istarska bjelica, all tested factors—except the linear term of electric field strength—had a statistically significant influence on LOX activity (p ≤ 0.05). In Rosulja, treatment time and the quadratic term of electric field strength had significant positive impact on the enzyme’s activity.
As previously noted, PEF treatment had an opposite effect on LOX activity in the Dalmatian varieties compared to the Istrian varieties. This effect was particularly pronounced in Levantinka, where LOX activity increased by up to 180% relative to the control. Both electric field strength and treatment duration exhibited positive linear effects on enzyme activity; however, their interaction had a negative influence, suggesting that certain parameter combinations may counteract the individual enhancing effects. The greatest increases in LOX activity were observed under two contrasting conditions: high electric field strength with short treatment time, and low field strength with prolonged treatment. In Oblica, a similar trend was observed, with both electric field strength and treatment duration positively influencing LOX activity. The maximum increase occurred under the most intense treatment conditions tested. Despite these observed trends, the response surface models for both Dalmatian varieties showed limited predictive power (R² < 0.7), indicating that the models do not fully capture the variability or complexity of LOX behavior under PEF in Dalmatian varieties (Table S4).
Possible explanation for the contrasting behavior of LOX activity between the studied variety groups, and the greater sensitivity observed in the Istrian varieties, may lie in differences in fruit water content. As we previously noted, higher moisture levels in the Istrian varieties likely increased the conductivity, enabling more efficient transmission of the electric field during PEF treatment. As a result, the treatment effect may be amplified, potentially causing greater structural disruption of the enzyme and leading to its inactivation. These assumptions are supported by findings by Luo et al. [4], who reported that increasing electric field strength over 5 kV/cm enhances LOX inactivation through conformational changes in the enzyme’s secondary structure. On the other hand, our previous study on LOX behavior in model systems [6] demonstrated that exposure to weak or moderate electric fields can increase LOX activity. This observation supports the results obtained for the Dalmatian varieties, which showed an increase in LOX activity under PEF application.
When comparing the effects of PEF treatment on LOX enzyme activity (Figure 6) and the concentration of volatile compounds generated via the LOX pathway (Figure 7), the results may initially appear inconsistent. In the Istrian varieties, LOX activity was reduced relative to the control, yet an overall increase in LOX-derived volatile compounds was observed. On the other hand, in the Dalmatian varieties, an increase in volatile compounds was also recorded, although not proportional to the observed rise in LOX activity. At first glance, these findings may seem contradictory, particularly considering that LOX activity is generally regarded as the rate-limiting step in the biosynthesis of volatile compounds in VOO [26]. However, upon closer examination, certain patterns and correlations emerge that help better to understand these results.
All of the studied varieties responded better to low electric field strengths. In Istarska bjelica (Figure 7a), the highest increase in LOX pathway volatiles (~55%) was observed under the mildest PEF treatment conditions, which also coincided with an increase in LOX enzyme activity. Similarly, in Rosulja and Levantinka (Figure 7b and 7c), the largest increases in LOX-derived volatiles (~18%) were recorded under conditions that produced the highest LOX activity—specifically, low electric field strength combined with longer treatment times. The most notable discrepancy among results was observed in Oblica, where the highest concentration of LOX volatiles occurred at the lowest electric field strength (Figure 7d), despite LOX activity being slightly higher at more intense PEF conditions (Figure 6d).
Several factors may have influenced the observed results. In our previous research using model systems simulating the malaxation process, we found that LOX activity reaches a plateau during malaxation, after which the concentration of hydroperoxides begins to decline [6]. Given the high initial LOX activity in the Istrian varieties (Table 2), partial enzyme inactivation induced by PEF treatment has not been sufficient to prevent the achievement and even an elevation of this activity plateau. Moreover, the achievement of LOX activity plateau is also dependent on substrate availability. A limited concentration of free linoleic or linolenic acid, which serve as substrates for LOX, could explain the relatively modest increase in LOX-derived volatiles in Levantinka, despite a significant increase in enzyme activity (Figure 6c). It is also important to consider that, although LOX activity is often regarded as the limiting factor in the LOX pathway, it is only one of the enzymes involved in the biosynthesis of volatile compounds. Each of these downstream enzymes may respond differently to PEF treatment, further contributing to the complexity of the observed outcomes. Finally, it should be noted that all predictive models, except for Rosulja, showed limited statistical accuracy (R² < 0.7), suggesting that the current models do not fully account for the variability or complexity of LOX-derived volatile biosynthesis under PEF conditions (Table S5).
The composition of volatile compounds in VOO produced under PEF treatment is presented by variety in Table 3, Table 4, Table 5 and Table 6. Results are expressed as absolute differences in individual compound concentrations (mg/kg) relative to the control. Positive values indicate an increase, while negative values indicate a decrease in compound levels.
In Istarska bjelica (Table 3), changes in the total concentration of LOX pathway volatiles were largely driven by variations in the dominant compound, 2-hexenal. Notably, the concentration of this compound either doubled or decreased by almost 100% compared to the control, depending on the PEF treatment conditions. Increases were observed after treatments with low electric field strengths (1 and 2 kV/cm) and moderate strength (4.5 kV/cm) applied for 18 sec. In contrast, higher field strengths (7 and 8 kV/cm) led to a substantial reduction in 2-hexenal content. Interestingly, in samples treated with higher electric field intensities, the reduction in 2-hexenal was accompanied by a corresponding increase in its alcohol derivatives, specifically 2-hexen-1-ol and (Z)-3-hexen-1-ol, which are formed by ADH. This suggests that, while LOX activity may be partially inhibited under higher PEF intensities, ADH activity may be simultaneously promoted, possibly due to different sensitivities of these enzymes to electric field strength.
One-way ANOVA confirmed that PEF treatment had a statistically significant effect on the concentrations of several volatile compounds, including 2-pentenal, 2-hexenal, 3-penten-1-ol, hexan-1-ol, 2-hexen-1-ol, (Z)-3-hexen-1-ol, and 1-penten-3-one (p ≤ 0.05). Tukey’s HSD test further revealed significant differences between oils produced using low versus high electric field strengths.
In Rosulja (Table 4), where 2-hexenal is also the dominant volatile compound, no consistent trend was observed in its concentration in response to PEF treatment. Unlike in Istarska bjelica, neither electric field strength nor treatment duration showed a clear influence on the overall volatile profile—except in the case of esters. Specifically, the content of hexyl acetate and 3-hexenyl acetate declined noticeably under more intense PEF treatments. Tukey’s HSD test confirmed that oils obtained using lower electric field strengths contained significantly higher levels of these esters. This reduction is likely attributable to decreased activity of AAT, the enzyme responsible for ester formation. Furthermore, PEF treatment had a significant effect on the concentrations of 2-pentenal, hexan-1-ol, 3-hexen-1-ol, 1-penten-3-one, and the detected esters (p ≤ 0.05).
In Levantinka, PEF treatment significantly affected the majority of volatile compounds derived from the LOX pathway (Table 5). The only exceptions were 2-pentenal, 1-penten-3-ol, (Z)-2-penten-1-ol, and hexyl acetate, for which no significant changes were observed. Among all treated samples, the oil obtained following treatment with an electric field strength of 2 kV/cm for 90 seconds stood out. This sample had a significantly different LOX volatile profile compared to the other produced VOOs. Unlike the other Levantinka samples, where alcohols were typically dominant, the volatile profile of this sample was characterized by significantly higher levels of their corresponding aldehydes. Specifically, significant increases in 2-methyl-4-pentenal, 3-hexenal, and 2-hexenal were observed, accompanied by a reduction in (Z)-3-hexen-1-ol and 2-hexen-1-ol. This shift suggests a possible reduction in ADH activity under these PEF conditions, although the mechanism behind this effect remains unclear. Interestingly, this sample also exhibited the highest concentration of 3-hexenyl acetate, which is synthesized from (Z)-3-hexen-1-ol via the action of AAT. This finding implies that, despite reduced ADH activity, AAT activity may have been maintained or even enhanced. It is noteworthy that the response of ADH to PEF in Levantinka did not follow the same pattern as observed in Istarska bjelica, suggesting that enzyme sensitivity to PEF may depend on the initial activity levels present in untreated fruit.
The impact of PEF treatment on LOX pathway volatiles was least pronounced in oils from the Oblica variety (Table 6). Among the compounds analyzed, only (Z)-3-hexen-1-ol, the dominant volatile, showed sensitivity to PEF, though no significant differences were observed between treated samples according to Tukey’s HSD test. A significant effect was also noted for 2-hexenal, but both its concentration and the magnitude of change were minimal, suggesting limited practical relevance in sensory characteristic of these oils.
The effect of PEF treatment on oxidation-derived volatile compounds was generally positive, resulting in a significant reduction of OX products across all studied varieties, as shown in Figure 8. The most pronounced decrease occurred in the Istrian varieties, with Rosulja showing nearly a 70% reduction. This decline in OX compounds, observed in both Istarska bjelica and Rosulja (Table 3 and Table 4), was primarily driven by decreased concentrations of secondary oxidation products such as 4-oxohex-2-enal and 2,4-hexadienal, which originate from the oxidative degradation of polyunsaturated fatty acids. In both Istrian varieties ((Figure 8a and 8b), the electric field strength had a significant impact on the reduction of OX products. Furthermore, extending the PEF treatment duration in Rosulja amplified this effect. A less pronounced trend of OX volatile decrease was observed in Dalmatian varieties. For instance, in Levantinka (Figure 8c), shorter treatment times achieved the greatest reduction in OX products, whereas longer durations attenuated this effect. In Oblica (Figure 8d), mild PEF conditions slightly increased OX compounds, but increasing the electric field strength resulted in a significant reduction. This decrease in Oblica oils was primarily associated with reduced levels of 2,4-hexadienal, while 4-oxohex-2-enal was undetectable (Table 6). The reduction of OX products following PEF treatment is likely attributable to enhanced extraction of bioactive compounds, such as polyphenols and tocopherols [14,43]. These antioxidants play a crucial role in protecting polyunsaturated fatty acids from oxidative degradation, thereby improving the oxidative stability of the oil.
According to the results of statistical analysis (Table S5), all predictive models assessing the impact of PEF on OX volatiles exhibited low explanatory power (R² < 0.5), suggesting that additional factors—such as fatty acid composition, concentrations of bioactive compounds, presence of prooxidants, and enzymatic activities involved in OX volatile formation—significantly influence the observed outcomes.
The influence of olive variety, as well as the geographical origin of cultivation, is evident in the response of MBA compounds to PEF treatment (Figure 9). The specific microbiota associated with olives is known to vary depending on the cultivation area, and these microorganisms are responsible for the formation of MBA-related volatiles [49]. The resistance of these microorganisms to inactivation by PEF treatment can differ based on species and cell structure [50]. As we mentioned, in Istrian varieties, the dominant MBA products are branched-chain aldehydes, 2-methylbutanal and 3-methylbutanal, while in Dalmatian varieties, 1-penten-3-ol is the most abundant. These differences support the hypothesis that distinct microbial populations are associated with each geographical region and variety. Interestingly, an overall increase in MBA products was observed in Istrian varieties following PEF treatment, with Rosulja showing the most pronounced increase—up to 350% compared to the control. While PEF is known to inactivate microorganisms, with the effect enhanced at higher electric field strengths [1], this inactivation trend was only evident in Istarska bjelica where moderate electric field strengths led to an increase in MBA volatiles. However, higher field intensities and longer treatment durations resulted in a significant reduction of approximately 60% (Figure 9a). In contrast, no such reduction was observed in Rosulja (Figure 9b), suggesting that the specific microbial population in this variety may be more resistant to PEF or respond differently to cell permeabilization. Martínez et al. [51] have noted that PEF-induced membrane permeabilization in microbial cells can lead to the release of intracellular metabolites into the surrounding medium. This phenomenon may explain the increase in MBA-related volatiles, as microbial metabolites are released upon membrane disruption.
Dalmatian varieties responded to PEF treatment opposite to the Istrian ones. An increase in electric field strength led to the expected reduction in MBA-related volatiles, likely due to the inactivation of microorganisms responsible for off-flavors VOOs. As observed with OX volatiles, the predictive models for MBA compounds (Table S5) showed limited explanatory power and were unable to identify any significant influence of individual treatment parameters on the composition of MBA-derived volatiles.
Previous studies have demonstrated that PEF treatment has minimal or negligible effects on the sensory attributes of VOOs, does not induce sensory defects, and may even enhance desirable characteristics [10,11,13,14]. Our results indicate that PEF processing parameters can significantly modulate the concentration and profile of volatile compounds. This modulation is particularly pronounced in volatiles associated with the LOX pathway, although substantial alterations were also observed in volatiles linked to OX processes and in the levels of MBA compounds. Notably, the response to the PEF treatment exhibited significant dependence on the olive variety. To comprehensively evaluate the effects of these compositional changes on oil quality, future studies should integrate sensory analysis along with detailed chemical characterization.
3. Materials and Methods
3.1. Plant Material
In this study, olive fruits (Olea europaea L.) from two Istrian varieties (Istarska bjelica and Rosulja) and two Dalmatian varieties (Oblica and Levantinka), each grown in their area of origin, were harvested at their optimal stage of ripeness. The Oblica and Istrian varieties were harvested in mid-October 2022, while Levantinka was harvested in early November the same year. The ripeness of the fruits was assessed using the maturity index (MI), determined based on skin and pulp coloration. The recorded MI values were: 1.32 for Istarska bjelica, 2.19 for Rosulja, 2.01 for Levantinka, and 1.75 for Oblica. Moisture and oil content were also measured for each variety: Istarska bjelica had 68.59% moisture and 11.97% oil; Rosulja 66.27% moisture and 10.30% oil; Levantinka 40.42% moisture and 21.87% oil; and Oblica 62.05% moisture and 16.28% oil. All olive fruit characterizations were performed according to the standard methods outlined in the International Olive Council (IOC) guidelines [52].
3.2. Olive Oil Production
The olive fruits (1 kg) were crushed using a laboratory-scale metal hammer mill (Enotecnica Pillan, Camisano Vicentino, Italy) operating at 3000 rpm. The resulting olive paste was immediately filled into the pulsed electric field (PEF) treatment chamber, ensuring it was filled to the top to eliminate air gaps and prevent plasma discharge. The PEF treatment was carried out using a high-voltage generator (HVG60/1 PEF; Impel d.o.o., Zagreb, Croatia). The treatment chamber consisted of two stainless steel electrodes with a diameter of 230 mm and 25 mm apart.
The PEF treatments were designed according to a central composite experimental plan, with electric field strengths of 2 and 7 kV/cm and treatment durations of 30 and 90 seconds as factorial points. A constant frequency of 150 Hz was applied in all treatments, with each pulse lasting 2 μs.
After the PEF treatment, the olive paste was transferred to a cylindrical stainless-steel vessel placed in a water bath (Stuart SBS40, Cole-Parmer, Vernon Hills, IL, USA). The control samples (prepared in triplicate) were processed identically, but without PEF treatment; these were malaxed immediately after crushing.
Malaxation was performed using an overhead stirrer (VELP Scientifica, Usmate, Italy) equipped with a modified agitator with paddles on three levels to ensure uniform mixing throughout the paste. Malaxation was carried out at approximately 150 rpm for 40 minutes at 27 °C. After malaxation, the olive paste was centrifuged at 5500 g for 10 minutes (Rotina 380, Hettich, Tuttlingen, Germany). The resulting liquid phase was decanted into a glass cylinder and the oil fraction was measured to determine the extraction yield. The oil was further clarified by centrifugation (Rotina 380R, Hettich, Tuttlingen, Germany) at 5500 g for 5 minutes at 18 °C. The obtained VOO was stored in 250 mL dark glass bottles under nitrogen atmosphere at 15–20 °C until further analysis.
3.3. Oil Yield
The oil yield (Y), defined as the percentage of oil (g) extracted per 100 g of olive paste [53], was calculated using the following equation:
where Voil (mL) is the volume of the extracted oil, 0.915 (g/mL) is the standard density of VOO and Wolives (g) is the mass of the olive paste.
3.4. Basic Quality Parameters
Basic quality parameters were determined using standard analytical methods. The peroxide value was measured in accordance with ISO 3960 [54]. Free fatty acid content and spectrophotometric measurements in the ultraviolet range (K232, K268, and ΔK) were determined according to the official methods of the International Olive Council (IOC) [55,56].
3.5. Lipoxygenase (LOX) Activity
25 g of olive paste was sampled after the malaxation phase, flash-frozen in liquid nitrogen, and stored at −20 °C until analysis. This material was used for the determination of lipoxygenase (LOX) activity.
Enzyme extraction was performed using a modified protocol based on the method of Luaces et al. [57]. Briefly, 5 g of frozen olive paste was homogenized in 20 mL of 100 mM phosphate buffer (pH 6.7) containing 0.1% Triton X, 1 mM ethylenediaminetetraacetic acid (EDTA), 0.1 mM phenylmethylsulphonyl fluoride (PMSF), 0.1 mM benzamidine, and 5 mM α-aminocaproic acid. The homogenization was conducted in two 1-minute cycles at 11,000 rpm using a GLH 850 homogenizer (Omni International, Kennesaw, USA). The resulting homogenate was filtered under vacuum through two layers of Miracloth, followed by centrifugation at 27,000 g for 30 minutes at 4 °C. The clear supernatant was collected and used as the crude enzyme extract.
LOX activity was determined using a modified version of the method described by Soldo et al. [58], with α-linolenic acid (ALA) as the substrate, prepared according to the protocol described in our previous work [6]. The reaction mixture consisted of 4 mL of 0.1 M phosphate buffer (pH 6.0), 500 μL of crude enzyme extract, and 500 μL of ALA solution. The mixture was stirred at 25 °C for 30 minutes on a magnetic stirrer. The reaction was terminated by adjusting the pH to 2.0 with HCl, followed by the addition of 1 mL of butylated hydroxytoluene (BHT, 0.25 mM) as an internal standard.
The formed ALA hydroperoxides (hydroperoxy octadecatrienoic acids -HPOTs) were extracted three times with 10 mL of a hexane:isopropanol mixture (95:5, v/v). The combined organic extracts were evaporated under reduced pressure at 40 °C using a Hei-VAP rotary evaporator (Heidolph Instruments GmbH & Co., Schwabach, Germany). The dried residue was reconstituted in 1.5 mL of an acetonitrile:water mixture (67:33, v/v).
High-performance liquid chromatography (HPLC) was performed using an Agilent 1200 LC system (Agilent Technologies, Santa Clara, CA, USA) equipped with a C18 column (Luna, 250 mm × 4.6 mm, 5 μm, 100 Å; Phenomenex, Torrance, USA) maintained at 35 °C. The injection volume was 10 μL. Eluent A was 0.25% acetic acid (aqueous), and eluent B was acetonitrile. The flow rate was set to 1 mL/min. The gradient program was as follows: 63% B at 0 min, held until 17 min; ramped to 80% B from 17 to 20 min, held until 32 min; returned to 63% B from 32 to 35 min, followed by equilibration for an additional 10 min. Detection was performed using a diode array detector (DAD) at 234 nm.
HPOTs were identified by comparing retention times and UV spectra to a commercial standard of 13(S)-hydroperoxy-9(Z),11(E),15(Z)-octadecatrienoic acid. Quantification was conducted using an internal standard method, taking into account the response factor ratio between HPOT and BHT. LOX activity was expressed as the amount of HPOT synthesized by 1 μmol of enzyme at 25 °C.
Protein Determination
The protein content of the enzyme extract was determined using the Bradford method [59]. In brief, 300 μL of the enzyme extract was added to 1.2 mL of Bradford reagent, and the absorbance was measured against a blank after a 5-minute reaction at room temperature at 595 nm. Crystalline bovine serum albumin (BSA) was used as the standard protein to generate the calibration curve.
3.6. Volatile Components
Volatile compounds were isolated using solid phase microextraction (SPME) and analyzed by gas chromatography coupled with mass spectrometry (GC/MS), following a previously described method [60] with minor modifications. A 2 cm DVB/CAR/PDMS fiber with a film thickness of 50/30 μm (Supelco, Sigma-Aldrich, Merck) was used for extraction.
For each sample, 15 mg of internal standard (0.15% solution of 4-methyl-2-pentanol in freshly refined sunflower oil) was added to 10 g of virgin olive oil (VOO) in a 20 mL headspace vial sealed with a silicone septum. The vial was then placed in a heating block at 40 °C with continuous magnetic stirring (Pierce Reacti-Therm Heating/Stirring Module, Artisan, Champaign, IL, USA). After a 10-minute equilibration period, the SPME fiber was exposed to the headspace for 30 minutes and then immediately desorbed in the GC injector in splitless mode at 260 °C for 1 minute.
Analysis was carried out using an Agilent 8890 GC system coupled with an Agilent 7000D Triple Quadrupole mass detector. Separation was achieved using an HP-5 column (30 m × 0.25 mm × 0.25 μm; Agilent Technologies). The oven temperature program was as follows: initial temperature of 30 °C held for 3 minutes, ramped to 150 °C at 5 °C/min, then to 250 °C at 20 °C/min, and held at the final temperature for 5 minutes. The ion source and transfer line temperatures were set at 250 °C and 260 °C, respectively. Helium served as the carrier gas at a constant flow rate of 1.5 mL/min. Mass spectra were recorded over the m/z range 50–550.
To determine retention indices, a homologous series of n-alkanes (C8–C20) was analyzed under identical chromatographic conditions. Volatile compounds were identified by comparing their mass spectra to the NIST mass spectral library and by calculating Kovats retention indices, which were matched with literature values. Quantification was performed using the internal standard method described above.
3.7. Statistical Analysis
A central composite design (CCD) was employed to investigate the effects of pulsed electric field (PEF) treatment parameters on selected variables. The experimental design included two factorial points: electric field strengths of 2 and 7 kV/cm and treatment durations of 30 and 90 seconds. To assess the influence of olive variety on oil yield, basic quality parameters, lipoxygenase (LOX) activity, and volatile compound composition, a one-way analysis of variance (ANOVA) was conducted on control sample data, followed by Tukey’s Honest Significant Difference (HSD) test for post hoc comparisons. The same approach was applied to evaluate differences in volatile profiles between PEF treatments within each variety.
To determine the effects of PEF parameters on yield, quality indices, LOX activity, and grouped volatile compounds (LOX pathway, OX, and MBA volatiles), response surface methodology (RSM) was applied. All models were fitted using a second-order polynomial equation, and response surface plots were generated to visualize interactions between electric field strength and treatment duration. Model adequacy was assessed using regression coefficients and the coefficient of determination (R²).
All statistical analyses were performed using XLSTAT 2023 (Lumivero, Denver, CO, USA), with significance set at p ≤ 0.05.
5. Conclusions
This study evaluated the effects of PEF pretreatment on four autochthonous Croatian olive varieties, two Istrian (Istarska bjelica and Rosulja) and two Dalmatian (Levantinka and Oblica). Different combinations of electric field strength (2 and 7 kV/cm) and treatment duration (30 and 90 seconds) were applied prior to malaxation. The results showed that the PEF treatment improved the efficiency of oil extraction in all varieties tested, with improvements ranging from 2.5 % to 36 % depending on the variety. In general, the most favorable results were obtained under milder PEF conditions, namely lower field strength and/or shorter treatment duration. The greatest increase in oil yield was observed in varieties with lower initial yield, indicating that PEF is particularly effective in such cases.
The treatment had negligible effects on the basic quality parameters of the VOOs, with all values remaining well below the legal limits for extra VOO classification. In addition, significant changes were observed in the VOC content and composition of the oils produced. All varieties showed an increase in the content of major fraction of VOCs, the ones originating from the LOX pathway, especially at lower electric field strength. However, the response of LOX enzyme activity itself was variety-dependent — it decreased in varieties with high initial activity (in Rosulja, up to 95 %) and increased in varieties with lower activity (in Levantinka, up to 180 %). This discrepancy suggests that other endogenous enzymes involved in the LOX pathway are also affected by PEF and that their response has a significant impact on the final aroma profile of VOO produced with PEF treatment. In addition, PEF treatment led to a consistent reduction in OX volatiles, indicating improved oxidative stability. The effects on MBA volatiles varied by variety and region, with an increase observed in Istrian varieties and a decrease in Dalmatian varieties, probably due to differences in the indigenous microbiota and their sensitivity to PEF.
Overall, PEF pretreatment represents a promising non-thermal technology to increase oil yield in olive processing without compromising oil quality, while also affecting the volatile compounds profile in a complex, variety-dependent manner. These results underline the importance of tailoring PEF parameters to individual olive varieties in order to optimize both extraction efficiency and sensory quality.
Author Contributions
Conceptualization, Klara Kraljić, Sandra Balbino, Tomislava Vukušić Pavičić, Zoran Herceg and Dubravka Škevin; Data curation, Klara Kraljić and Dubravka Škevin; Formal analysis, Klara Kraljić and Dubravka Škevin; Funding acquisition, Zoran Herceg and Dubravka Škevin; Investigation, Katarina Filipan, Sandra Balbino, Marko Obranović, Mia Ivanov, Višnja Stulić, Mia Tokić and Marko Belavić; Methodology, Klara Kraljić and Igor Stuparević; Project administration, Klara Kraljić and Dubravka Škevin; Resources, Klara Kraljić, Tomislava Vukušić Pavičić, Igor Stuparević and Dubravka Škevin; Software, Klara Kraljić; Supervision, Klara Kraljić and Dubravka Škevin; Validation, Klara Kraljić; Visualization, Klara Kraljić and Dubravka Škevin; Writing – original draft, Klara Kraljić and Dubravka Škevin; Writing – review & editing, Tomislava Vukušić Pavičić and Maja Jukić Špika.
Funding
This work was supported by the Croatian Science Foundation under the project number HRZZ-IP-2020-02-7553 and by the Republic of Croatia Ministry of Science and Education through the European Regional Development Fund through the project “Equipping the Semi-Industrial Practice for the Development of New Food Technologies” (KK.01.1.1.02.0001).
Data Availability Statement
Data are available upon request from the authors.
Acknowledgments
We thank Melisa Trputec (University of Zagreb, Faculty of Food Technology and Biotechnology) for technical assistance in olive oil analyses.
Abbreviations
The following abbreviations are used in this manuscript:
| VOO | Virgin olive oil |
| PEF | Pulsed electric field |
| PV | Peroxide value |
| VOC | Volatile organic compounds |
| LOX | Lipoxygenase |
| HPOT | Hydroperoxy-octadecatrienoic acid |
| ADH | Alcohol dehydrogenase |
| AAT | Alcohol acetyl transferase (AAT) |
| OX | Oxidation |
| MBA | Microbiological activity |
| DAD | Diode array detector |
| ALA | α-linolenic acid |
References
- Yan, B.; Li, J.; Liang, Q.C.; Huang, Y.; Cao, S.L.; Wang, L.H.; Zeng, X.A. From Laboratory to Industry: The Evolution and Impact of Pulsed Electric Field Technology in Food Processing. Food Rev Int 2025, 41, 373–398. [Google Scholar] [CrossRef]
- Nowosad, K.; Sujka, M.; Pankiewicz, U.; Kowalski, R. The Application of PEF Technology in Food Processing and Human Nutrition. J Food Sci Technol 2021, 58, 397–411. [Google Scholar] [CrossRef] [PubMed]
- Ohshima, T.; Tanino, T.; Guionet, A.; Takahashi, K.; Takaki, K. Mechanism of Pulsed Electric Field Enzyme Activity Change and Pulsed Discharge Permeabilization of Agricultural Products. Jpn J Appl Phys 2021, 60, 060501. [Google Scholar] [CrossRef]
- Luo, W.; Zhang, R.B.; Wang, L.M.; Chen, J.; Guan, Z.C. Conformation Changes of Polyphenol Oxidase and Lipoxygenase Induced by PEF Treatment. J Appl Electrochem 2010, 40, 295–301. [Google Scholar] [CrossRef]
- Aguiló-Aguayo, I.; Sobrino-López, Á.; Soliva-Fortuny, R.; Martín-Belloso, O. Influence of High-Intensity Pulsed Electric Field Processing on Lipoxygenase and β-Glucosidase Activities in Strawberry Juice. Innov Food Sci Emerg Technol 2008, 9, 455–462. [Google Scholar] [CrossRef]
- Kraljić, K.; Balbino, S.; Filipan, K.; Herceg, Z.; Stuparević, I.; Ivanov, M.; Vukušić Pavičić, T.; Jakoliš, N.; Škevin, D. Innovative Approaches to Enhance Activity of Endogenous Olive Enzymes—A Model System Experiment: Part II—Non-Thermal Technique. Processes 2023, 11, 3283. [Google Scholar] [CrossRef]
- Cecchi, L.; Migliorini, M.; Mulinacci, N. Virgin Olive Oil Volatile Compounds: Composition, Sensory Characteristics, Analytical Approaches, Quality Control, and Authentication. J Agric Food Chem 2021, 69, 2013–2040. [Google Scholar] [CrossRef]
- Clodoveo, M.L.; Hachicha Hbaieb, R. Beyond the Traditional Virgin Olive Oil Extraction Systems: Searching Innovative and Sustainable Plant Engineering Solutions. Food Res Int 2013, 54, 1926–1933. [Google Scholar] [CrossRef]
- Aguilera, M.P.; Beltran, G.; Sanchez-Villasclaras, S.; Uceda, M.; Jimenez, A. Kneading Olive Paste from Unripe ‘Picual’ Fruits: I. Effect on Oil Process Yield. J Food Eng 2010, 97, 533–538. [Google Scholar] [CrossRef]
- Leone, A.; Tamborrino, A.; Esposto, S.; Berardi, A.; Servili, M. Investigation on the Effects of a Pulsed Electric Field (PEF) Continuous System Implemented in an Industrial Olive Oil Plant. Foods 2022, Vol. 11, Page 2758 2022, 11, 2758. [Google Scholar] [CrossRef]
- Navarro, A.; Ruiz-Méndez, M.V.; Sanz, C.; Martínez, M.; Rego, D.; Pérez, A.G. Application of Pulsed Electric Fields to Pilot and Industrial Scale Virgin Olive Oil Extraction: Impact on Organoleptic and Functional Quality. Foods 2022, 11, 2022. [Google Scholar] [CrossRef] [PubMed]
- Tamborrino, A.; Urbani, S.; Servili, M.; Romaniello, R.; Perone, C.; Leone, A. Pulsed Electric Fields for the Treatment of Olive Pastes in the Oil Extraction Process. Appl Sci 2019, 10, 114. [Google Scholar] [CrossRef]
- Puértolas, E.; Martínez de Marañón, I. Olive Oil Pilot-Production Assisted by Pulsed Electric Field: Impact on Extraction Yield, Chemical Parameters and Sensory Properties. Food Chem 2015, 167, 497–502. [Google Scholar] [CrossRef] [PubMed]
- Veneziani, G.; Esposto, S.; Taticchi, A.; Selvaggini, R.; Sordini, B.; Lorefice, A.; Daidone, L.; Pagano, M.; Tomasone, R.; Servili, M. Extra-Virgin Olive Oil Extracted Using Pulsed Electric Field Technology: Cultivar Impact on Oil Yield and Quality. Front Nutr 2019, 6. [Google Scholar] [CrossRef]
- Brkić Bubola, K.; Lukić, M.; Novoselić, A.; Krapac, M.; Lukić, I. Olive Fruit Refrigeration during Prolonged Storage Preserves the Quality of Virgin Olive Oil Extracted Therefrom. Foods 2020, 9, 1445. [Google Scholar] [CrossRef]
- Marcelić, Š.; Vidović, N.; Pasković, I.; Lukić, M.; Špika, M.J.; Palčić, I.; Lukić, I.; Petek, M.; Pecina, M.; Herak Ćustić, M.; et al. Combined Sulfur and Nitrogen Foliar Application Increases Extra Virgin Olive Oil Quantity without Affecting Its Nutritional Quality. Horticulturae 2022, 8, 203. [Google Scholar] [CrossRef]
- Majetić Germek, V.; Butinar, B.; Pizzale, L.; Bučar-Miklavčič, M.; Conte, L.S.; Koprivnjak, O. Phenols and Volatiles of Istarska Bjelica and Leccino Virgin Olive Oils Produced with Talc, NaCl and KCl as Processing Aids. J Am Oil Chem Soc 2016, 93, 1365–1372. [Google Scholar] [CrossRef]
- Škevin, D.; Balbino, S.; Žanetić, M.; Jukić Špika, M.; Koprivnjak, O.; Filipan, K.; Obranović, M.; Žanetić, K.; Smajić, E.; Radić, M.; et al. Improvement of Oxidative Stability and Antioxidative Capacity of Virgin Olive Oil by Flash Thermal Pretreatment – Optimization Process. Foods 2025, submited. [Google Scholar] [CrossRef]
- Product-Specification-EXTRA-VIRGIN-OLIVE-OIL-OF-HERZEGOVINA. Available online: https://fsa.gov.ba/wp-content/uploads/2025/06/product-specification-extra-virgin-olive-oil-of-herzegovina.pdf (accessed on 20 May 2025).
- Žanetić, M.; Jukić Špika, M.; Ožić, M.M.; Brkić Bubola, K. Comparative Study of Volatile Compounds and Sensory Characteristics of Dalmatian Monovarietal Virgin Olive Oils. Plants 2021, 10, 1995. [Google Scholar] [CrossRef]
- Jukić Špika, M.; Žanetić, M.; Kraljić, K.; Pasković, I.; Škevin, D. Changes in Olive Fruit Characteristics and Oil Accumulation in ‘Oblica’ and ‘Leccino’ during Ripening. Acta Hortic 2018, 543–548. [Google Scholar] [CrossRef]
- Nissim, Y.; Shloberg, M.; Biton, I.; Many, Y.; Doron-Faigenboim, A.; Zemach, H.; Hovav, R.; Kerem, Z.; Avidan, B.; Ben-Ari, G. High Temperature Environment Reduces Olive Oil Yield and Quality. PLoS One 2020, 15, e0231956. [Google Scholar] [CrossRef]
- Strikic, F.; Bandelj Mavsar, D.; Perica, S.; Cmelik, Z.; Satovic, Z.; Javornik, B. The Main Croatian Olive Cultivar, ‘Oblica’, Shows High Morphological but Low Molecular Diversity. J Hortic Sci Biotechnol 2009, 84, 345–349. [Google Scholar] [CrossRef]
- Žanetić, M.; Cerretani, L.; Del Carlo, M. Preliminary Characterisation of Monovarietal Extra-Virgin Olive Oils Obtained from Dif-Ferent Cultivars in Croatia. J Commod Sci Technol Qual 2007, 46, 79–94. [Google Scholar]
- Commission Delegated Regulation Commission Delegated Regulation (EU) 2022/2104 of 29 July 2022 Supplementing Regulation (EU) No 1308/2013 of the European Parliament and of the Council as Regards Marketing Standards for Olive Oil, and Repealing Commission Regulation (EEC) No 2568/91 and Commission Implementing Regulation (EU) No 29/2012. 2022.
- Sánchez-Ortiz, A.; Romero-Segura, C.; Sanz, C.; Pérez, A.G. Synthesis of Volatile Compounds of Virgin Olive Oil Is Limited by the Lipoxygenase Activity Load during the Oil Extraction Process. J Agric Food Chem 2012, 60, 812–822. [Google Scholar] [CrossRef]
- Salas, J.J.; Williams, M.; Harwood, J.L.; Sánchez, J. Lipoxygenase Activity in Olive (Olea Europaea) Fruit. J Am Oil Chem Soc 1999, 76, 1163–1168. [Google Scholar] [CrossRef]
- Tomé-Rodríguez, S.; Ledesma-Escobar, C.A.; Penco-Valenzuela, J.M.; Priego-Capote, F. Cultivar Influence on the Volatile Components of Olive Oil Formed in the Lipoxygenase Pathway. LWT-Food Sci Technol 2021, 147, 111485. [Google Scholar] [CrossRef]
- Luna, G.; Morales, M.T.; Aparicio, R. Characterisation of 39 Varietal Virgin Olive Oils by Their Volatile Compositions. Food Chem 2006, 98, 243–252. [Google Scholar] [CrossRef]
- García-Vico, L.; Belaj, A.; Sánchez-Ortiz, A.; Martínez-Rivas, J.M.; Pérez, A.G.; Sanz, C. Volatile Compound Profiling by HS-SPME/GC-MS-FID of a Core Olive Cultivar Collection as a Tool for Aroma Improvement of Virgin Olive Oil. Molecules 2017, 22, 141. [Google Scholar] [CrossRef]
- Kesen, S.; Kelebek, H.; Selli, S. Characterization of the Key Aroma Compounds in Turkish Olive Oils from Different Geographic Origins by Application of Aroma Extract Dilution Analysis (AEDA). J Agric Food Chem 2014, 62, 391–401. [Google Scholar] [CrossRef]
- Lukić, I.; Lukić, M.; Žanetić, M.; Krapac, M.; Godena, S.; Bubola, K.B. Inter-Varietal Diversity of Typical Volatile and Phenolic Profiles of Croatian Extra Virgin Olive Oils as Revealed by GC-IT-MS and UPLC-DAD Analysis. Foods 2019, Vol. 8, Page 565 2019, 8, 565. [Google Scholar] [CrossRef]
- Soldo, B.; Jukić Špika, M.; Pasković, I.; Vuko, E.; Polić Pasković, M.; Ljubenkov, I. The Composition of Volatiles and the Role of Non-Traditional LOX on Target Metabolites in Virgin Olive Oil from Autochthonous Dalmatian Cultivars. Molecules 2024, 29, 1696. [Google Scholar] [CrossRef]
- Tura, D.; Failla, O.; Bassi, D.; Attilio, C.; Serraiocco, A. Regional and Cultivar Comparison of Italian Single Cultivar Olive Oils According to Flavor Profiling. Eur J Lipid Sci Technol 2013, 115, 196–210. [Google Scholar] [CrossRef]
- Padilla, M.N.; Hernández, M.L.; Sanz, C.; Martínez-Rivas, J.M. Stress-Dependent Regulation of 13-Lipoxygenases and 13-Hydroperoxide Lyase in Olive Fruit Mesocarp. Phytochem 2014, 102, 80–88. [Google Scholar] [CrossRef] [PubMed]
- Romero, N.; Saavedra, J.; Tapia, F.; Sepúlveda, B.; Aparicio, R. Influence of Agroclimatic Parameters on Phenolic and Volatile Compounds of Chilean Virgin Olive Oils and Characterization Based on Geographical Origin, Cultivar and Ripening Stage. J Sci Food Agric 2016, 96, 583–592. [Google Scholar] [CrossRef] [PubMed]
- Inglese, P.; Famiani, F.; Galvano, F.; Servili, M.; Esposto, S.; Urbani, S. Factors Affecting Extra-Virgin Olive Oil Composition. In Horticultural Reviews, Editor Janick, J.; Publisher: John Wiley & Sons, Inc., Hoboken, NJ, USA, 2010; Volume 38, pp. 83–147. [Google Scholar]
- Brkić Bubola, K.; Koprivnjak, O.; Sladonja, B.; Lukić, I. Volatile Compounds and Sensory Profiles of Monovarietal Virgin Olive Oil from Buža, Črna and Rosinjola Cultivars in Istria (Croatia). Food Technol Biotechnol 2012, 50, 192–198. Available online: https://hrcak.srce.hr/83932 (accessed on 12 February 2025).
- Majetić Germek, V.; Butinar, B.; Pizzale, L.; Bučar-Miklavčič, M.; Conte, L.S.; Koprivnjak, O. Phenols and Volatiles of Istarska Bjelica and Leccino Virgin Olive Oils Produced with Talc, NaCl and KCl as Processing Aids. J Am Oil Chem Soc 2016, 93, 1365–1372. [Google Scholar] [CrossRef]
- Koprivnjak, O.; Majetić, V.; Brkić Bubola, K.; Kosić, U. Variability of Phenolic and Volatile Compounds in Virgin Olive Oil from Leccino and Istarska Bjelica Cultivars in Relation to Their Fruit Mixtures. Food Technol Biotechnol 2012, 50, 216–221. [Google Scholar]
- Šarolić, M.; Gugić, M.; Friganović, E.; Tuberoso, C.I.G.; Jerković, I. Phytochemicals and Other Characteristics of Croatian Monovarietal Extra Virgin Olive Oils from Oblica, Lastovka and Levantinka Varieties. Molecules 2015, Vol. 20, Pages 4395-4409 2015, 20, 4395–4409. [Google Scholar] [CrossRef]
- Ahonen, E.; Damerau, A.; Suomela, J.P.; Kortesniemi, M.; Linderborg, K.M. Oxidative Stability, Oxidation Pattern and α-Tocopherol Response of Docosahexaenoic Acid (DHA, 22:6n–3)-Containing Triacylglycerols and Ethyl Esters. Food Chem 2022, 387, 132882. [Google Scholar] [CrossRef]
- Yang, S.; Li, S.; Li, G.; Li, C.; Li, W.; Bi, Y.; Wei, J. Pulsed Electric Field Treatment Improves the Oil Yield, Quality, and Antioxidant Activity of Virgin Olive Oil. Food Chem X 2024, 22, 101372. [Google Scholar] [CrossRef]
- Martínez-Beamonte, R.; Ripalda, M.; Herrero-Continente, T.; Barranquero, C.; Dávalos, A.; López de las Hazas, M.C.; Álvarez-Lanzarote, I.; Sánchez-Gimeno, A.C.; Raso, J.; Arnal, C.; et al. Pulsed Electric Field Increases the Extraction Yield of Extra Virgin Olive Oil without Loss of Its Biological Properties. Front Nutr 2022, 9. [Google Scholar] [CrossRef] [PubMed]
- Abenoza, M.; Benito, M.; Saldaña, G.; Álvarez, I.; Raso, J.; Sánchez-Gimeno, A.C. Effects of Pulsed Electric Field on Yield Extraction and Quality of Olive Oil. Food Bioproc Tech 2013, 6, 1367–1373. [Google Scholar] [CrossRef]
- Töpfl, S. Pulsed Electric Fields (PEF) for Permeabilization of Cell Membranes in Food-and Bioprocessing: Applications, Process and Equipment Design and Cost Analysis. Doctoral thesis, Technical University of Berlin, Berlin, Germany, Date of Completion 22 September 2006.
- Taha, A.; Casanova, F.; Šimonis, P.; Stankevič, V.; Gomaa, M.A.E.; Stirkė, A. Pulsed Electric Field: Fundamentals and Effects on the Structural and Techno-Functional Properties of Dairy and Plant Proteins. Foods 2022, 11, 1556. [Google Scholar] [CrossRef] [PubMed]
- Ho, S.Y.; Mittal, G.S.; Cross, J.D. Effects of High Field Electric Pulses on the Activity of Selected Enzymes. J Food Eng 1997, 31, 69–84. [Google Scholar] [CrossRef]
- Fakas, S.; Kefalogianni, I.; Makri, A.; Tsoumpeli, G.; Rouni, G.; Gardeli, C.; Papanikolaou, S.; Aggelis, G. Characterization of Olive Fruit Microflora and Its Effect on Olive Oil Volatile Compounds Biogenesis. Eur J Lipid Sci Technol 2010, 112, 1024–1032. [Google Scholar] [CrossRef]
- Saldaña, G.; Álvarez, I.; Condón, S.; Raso, J. Microbiological Aspects Related to the Feasibility of PEF Technology for Food Pasteurization. Crit Rev Food Sci Nutr 2014, 54, 1415–1426. [Google Scholar] [CrossRef]
- Martínez, J.M.; Delso, C.; Álvarez, I.; Raso, J. Pulsed Electric Field-Assisted Extraction of Valuable Compounds from Microorganisms. Compr Rev Food Sci Food Saf 2020, 19, 530–552. [Google Scholar] [CrossRef]
- COI/OH/Doc. No 1 2011 Guide for the determination of the characteristics of oil-olives. Available online: https://www.internationaloliveoil.org/what-we-do/chemistry-standardisation-unit/standards-and-methods/ (accessed on 5 December 2023).
- Clodoveo, M.L. Malaxation: Influence on Virgin Olive Oil Quality. Past, Present and Future e An Overview. Trends Food Sci Technol 2012, 25, 13–23. [Google Scholar] [CrossRef]
- ISO 3960:2017 - Animal and Vegetable Fats and Oils — Determination of Peroxide Value — Iodometric (Visual) Endpoint Determination. Available online: https://www.iso.org/standard/71268.html (accessed on 4 December 2023).
- COI/T.20/Doc. No 34/Rev. 1 2017 Method determination of free fatty acids, cold method. Available online: https://www.internationaloliveoil.org/what-we-do/chemistry-standardisation-unit/standards-and-methods/ (accessed on 5 December 2023).
- COI/T.20/Doc. No 19/Rev. 5 2019 Method of analysis spectrophotometric investigation in the ultraviolet. Available online: https://www.internationaloliveoil.org/what-we-do/chemistry-standardisation-unit/standards-and-methods/ (accessed on 4 December 2023).
- Luaces, P.; Sanz, C.; Pérez, A.G. Thermal Stability of Lipoxygenase and Hydroperoxide Lyase from Olive Fruit and Repercussion on Olive Oil Aroma Biosynthesis. J Agric Food Chem 2007, 55, 6309–6313. [Google Scholar] [CrossRef]
- Barbara, S.; Matilda, Š.; Gloria, M.; Maja, P.V.; Ljubenkov, I. Evaluation of Olive Fruit Lipoxygenase Extraction Protocols on 9- and 13-Z,E-HPODE Formation. Molecules 2016, Vol. 21, Page 506 2016, 21, 506. [Google Scholar] [CrossRef]
- Bradford, M.M. A Rapid and Sensitive Method for the Quantitation of Microgram Quantities of Protein Utilizing the Principle of Protein-Dye Binding. Anal Biochem 1976, 72, 248–254. [Google Scholar] [CrossRef] [PubMed]
- Kraljić, K.; Stjepanović, T.; Obranović, M.; Pospišil, M.; Balbino, S.; Škevin, D. Influence of Conditioning Temperature on the Quality, Nutritional Properties and Volatile Profile of Virgin Rapeseed Oil. Food Technol Biotechnol 2018, 56. [Google Scholar] [CrossRef] [PubMed]
Figure 1.
Three-dimensional response surface plots showing the effect of electric field strength (kV/cm) and treatment time (s) on oil yield (%) in Croatian olive varieties: (a) Istarska bjelica; (b) Rosulja; (c) Levantinka; (d) Oblica. Results for each variety are expressed as relative change (RC [%]) in yield compared to the control, calculated as 100 × (treatment − control) / control.
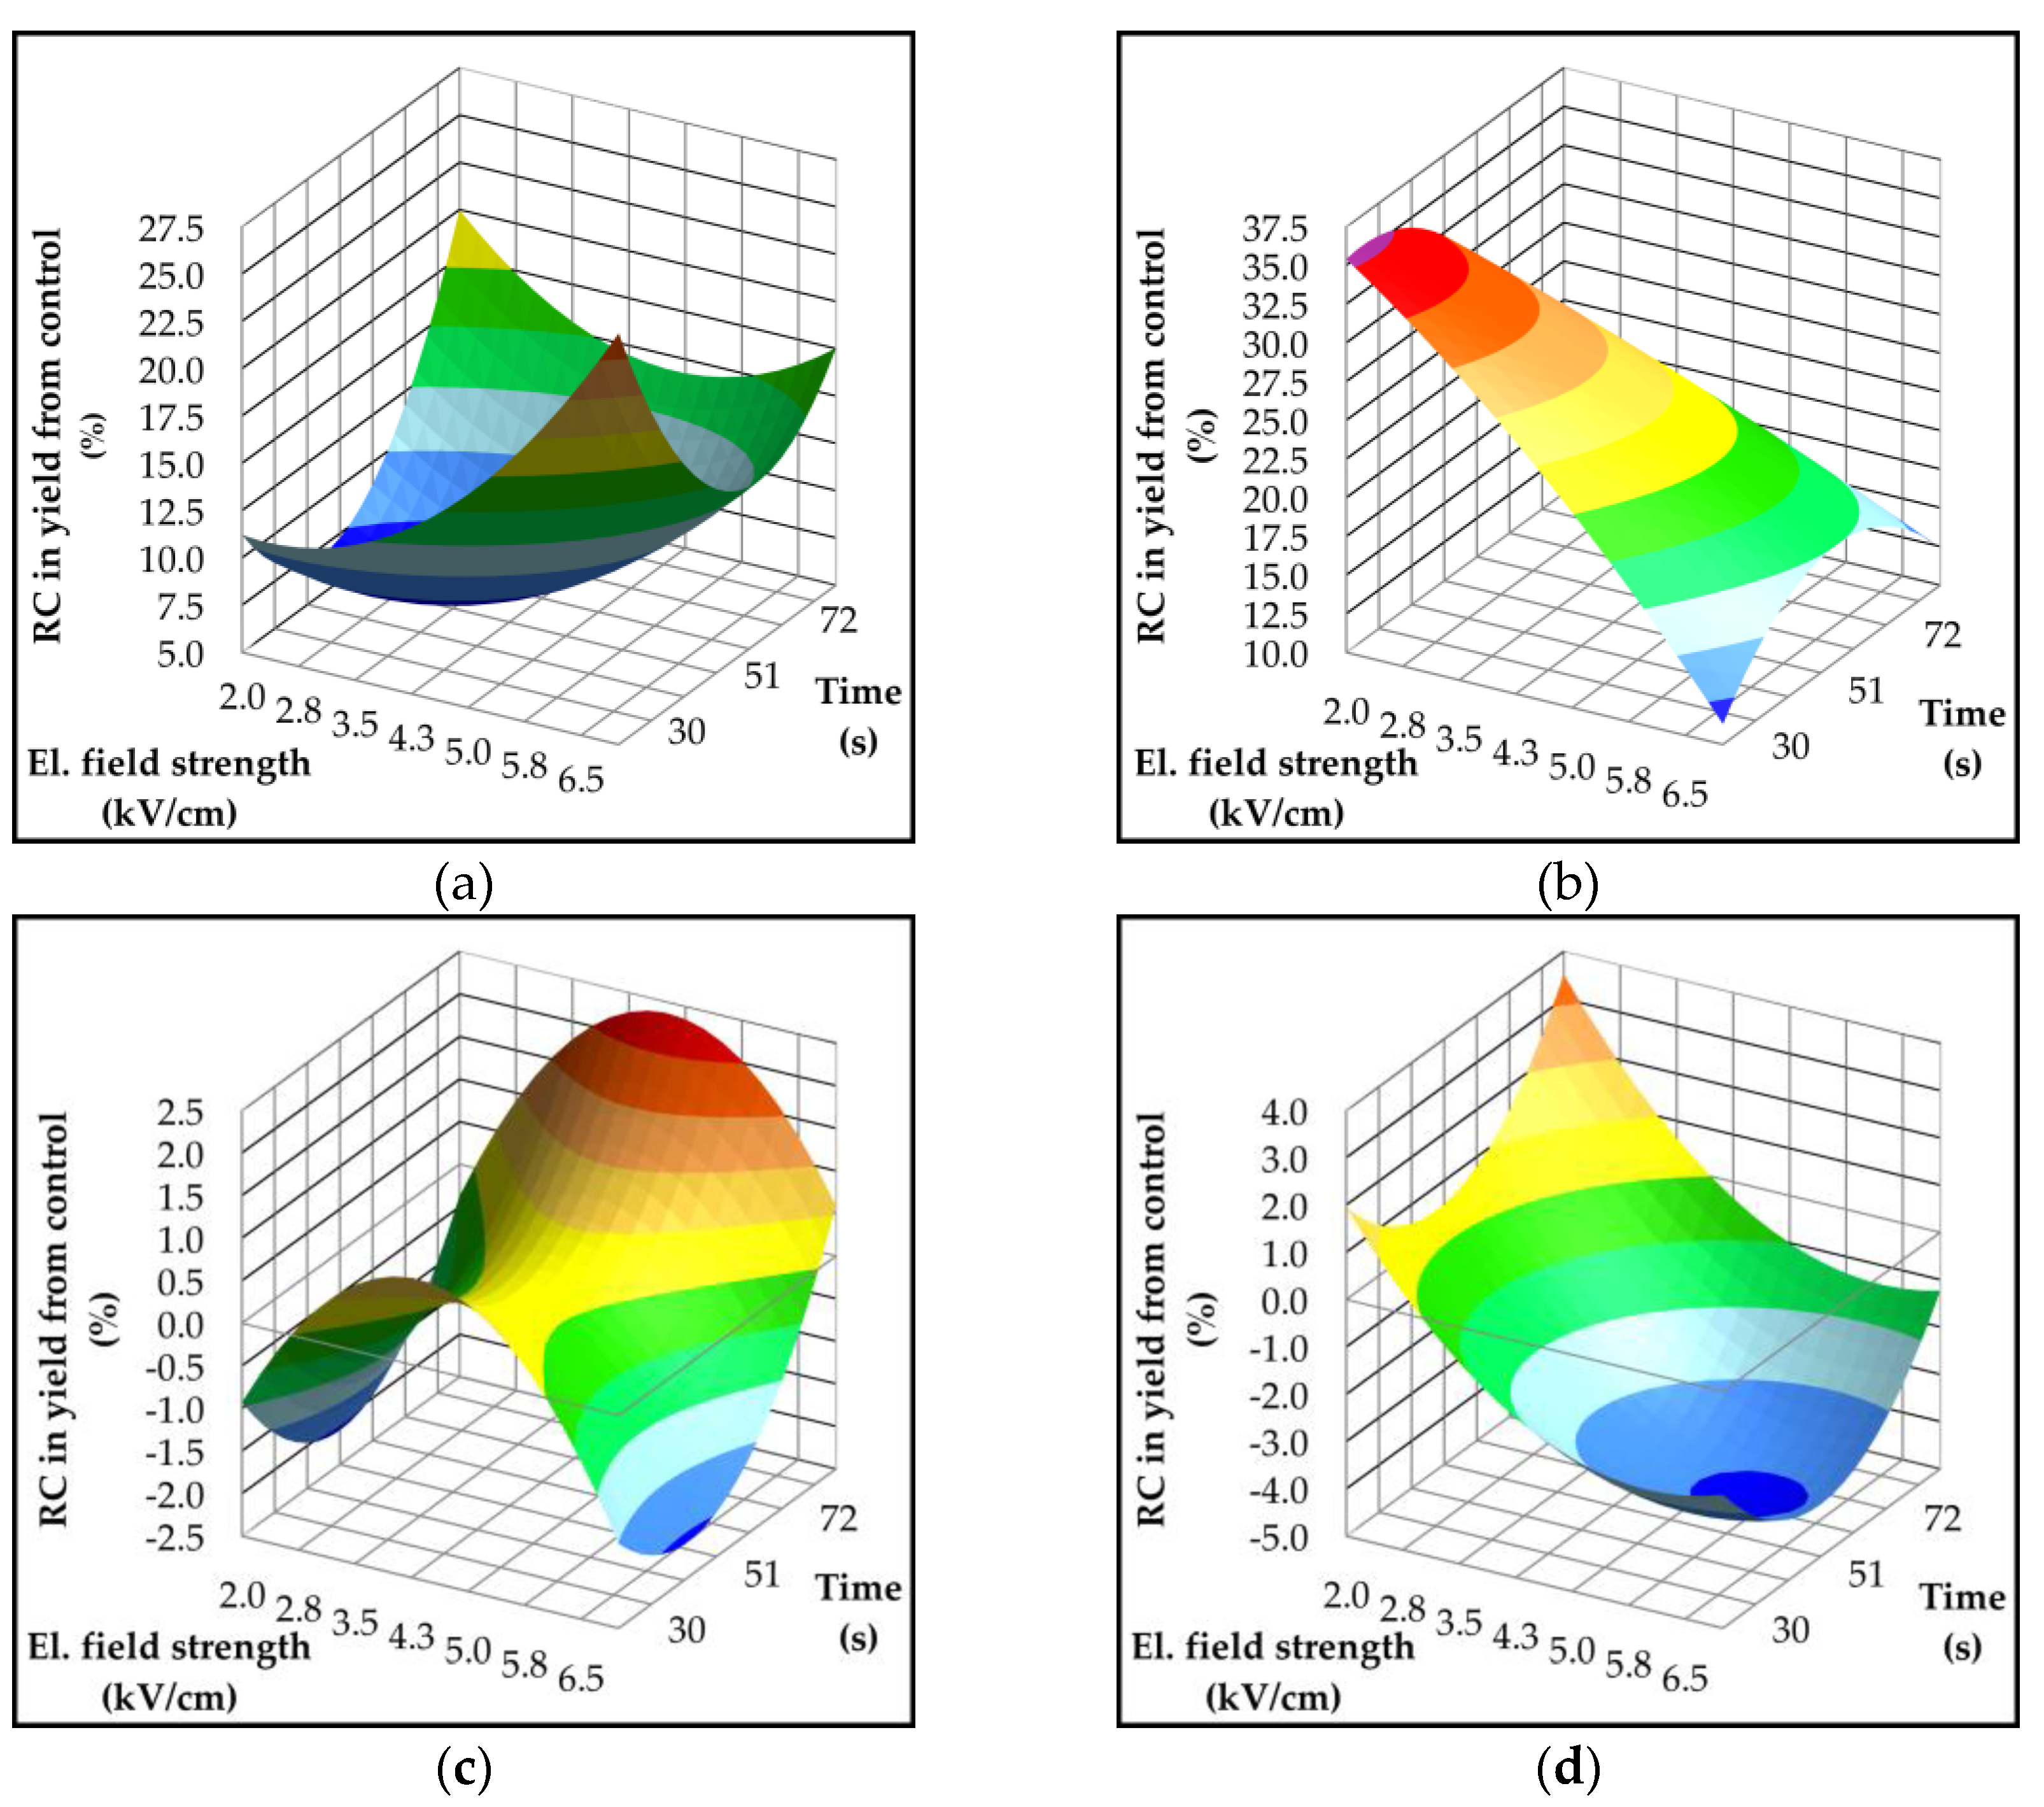
Figure 2.
Three-dimensional response surface plots showing the effect of electric field strength (kV/cm) and treatment time (s) on acidity (% oleic fatty acid) in Croatian olive varieties (a) Istarska bjelica; (b) Rosulja; (c) Levantinka; (d) Oblica. Results for each variety are expressed as the difference in acidity compared to the control, calculated as treatment − control.
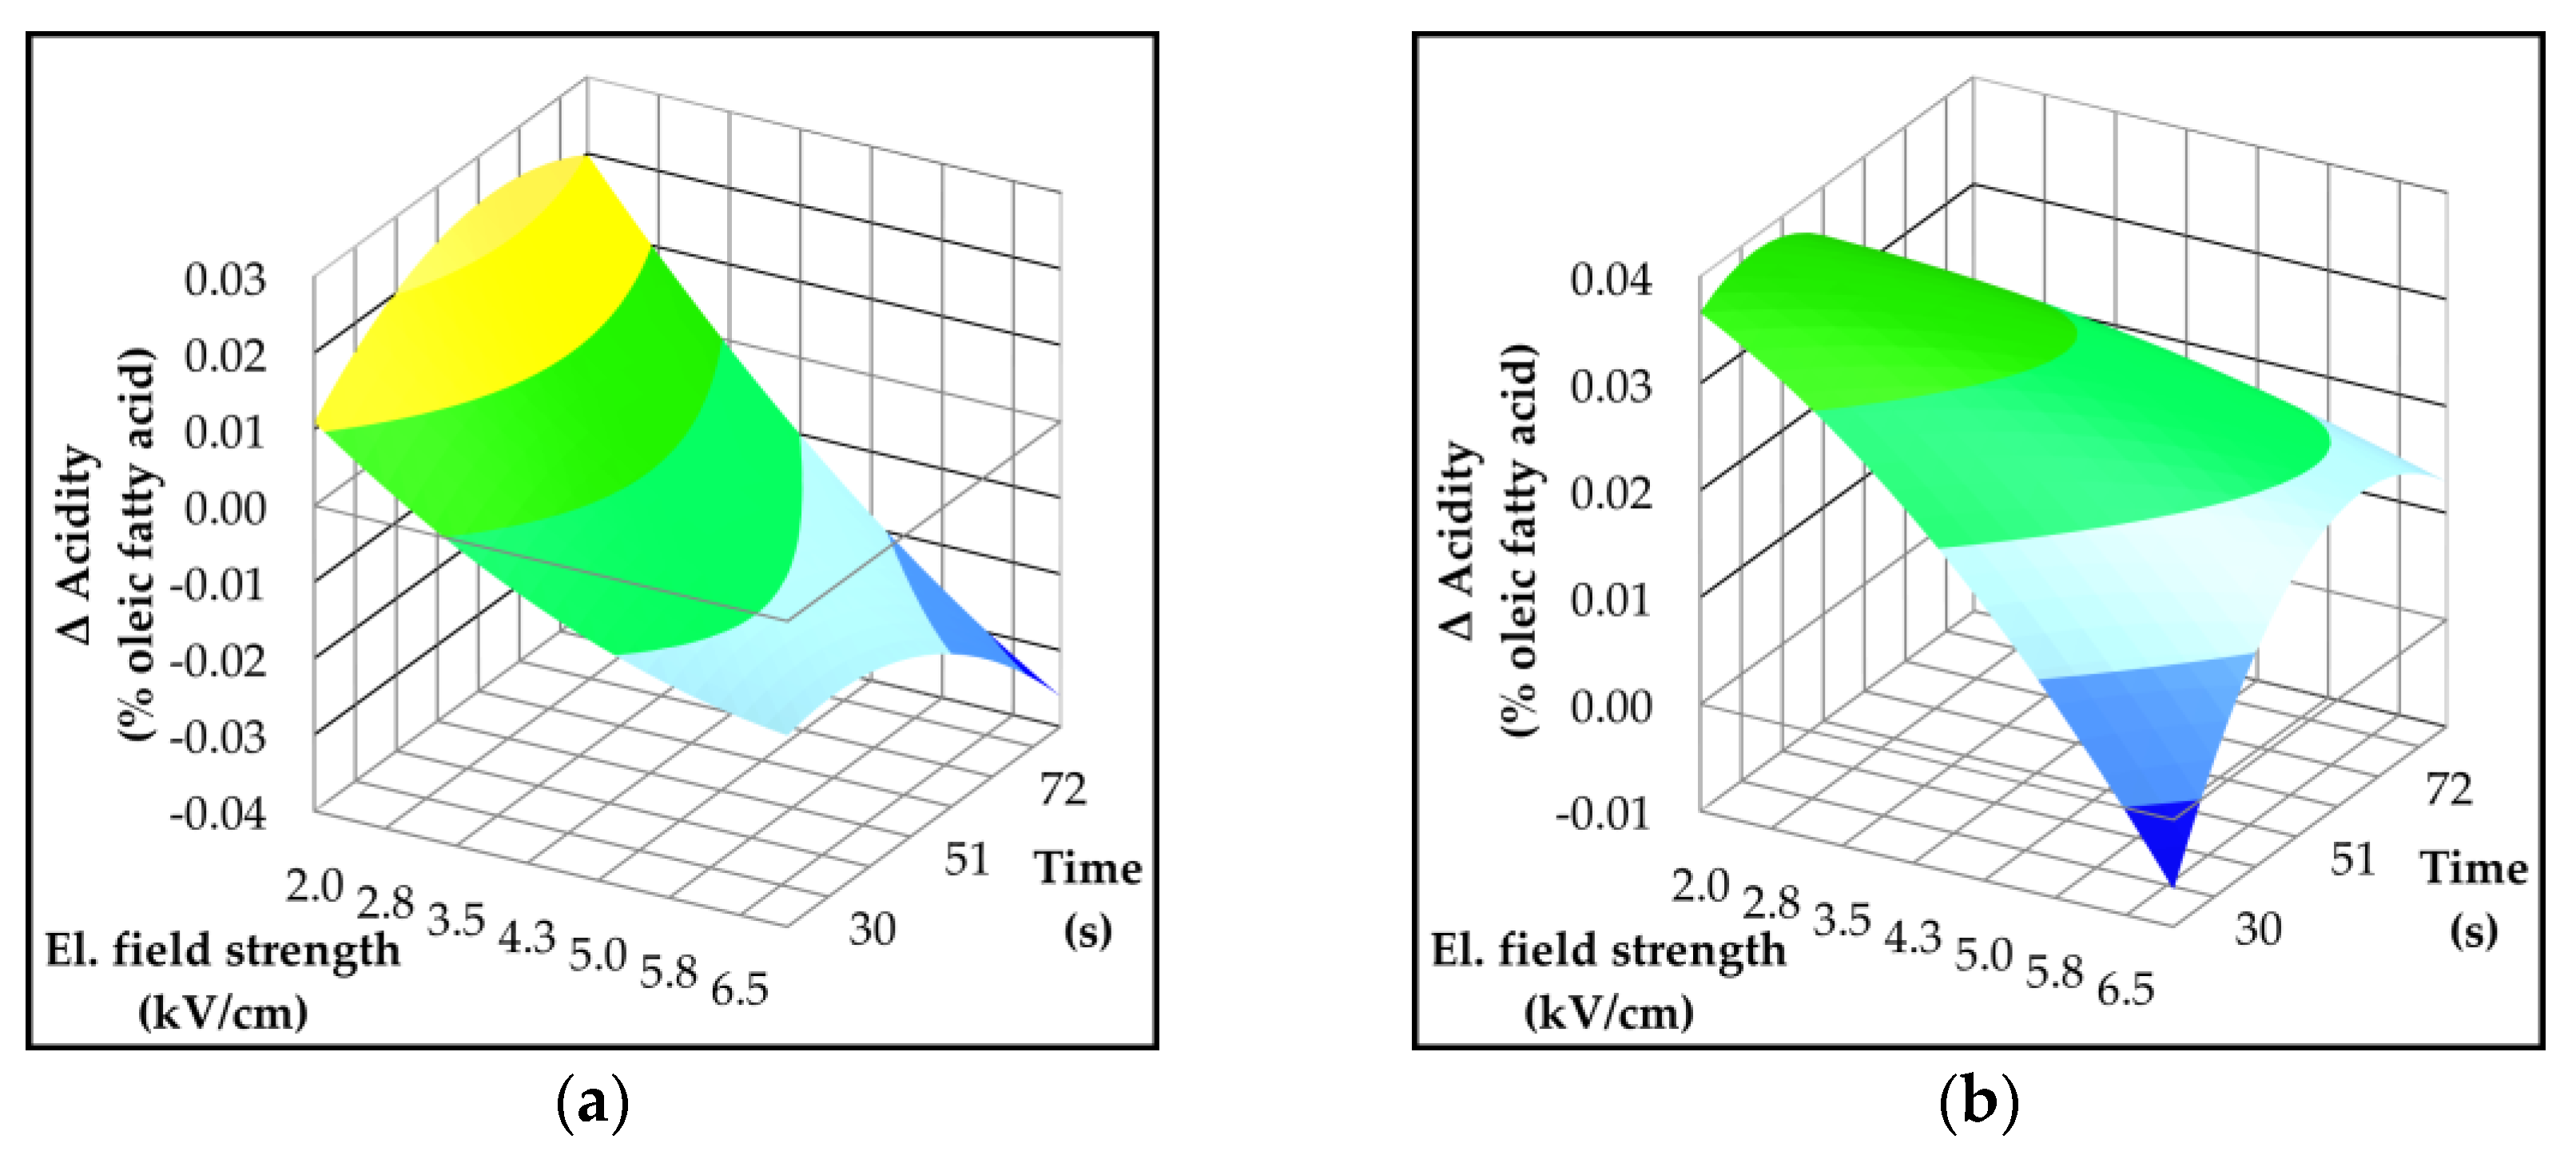
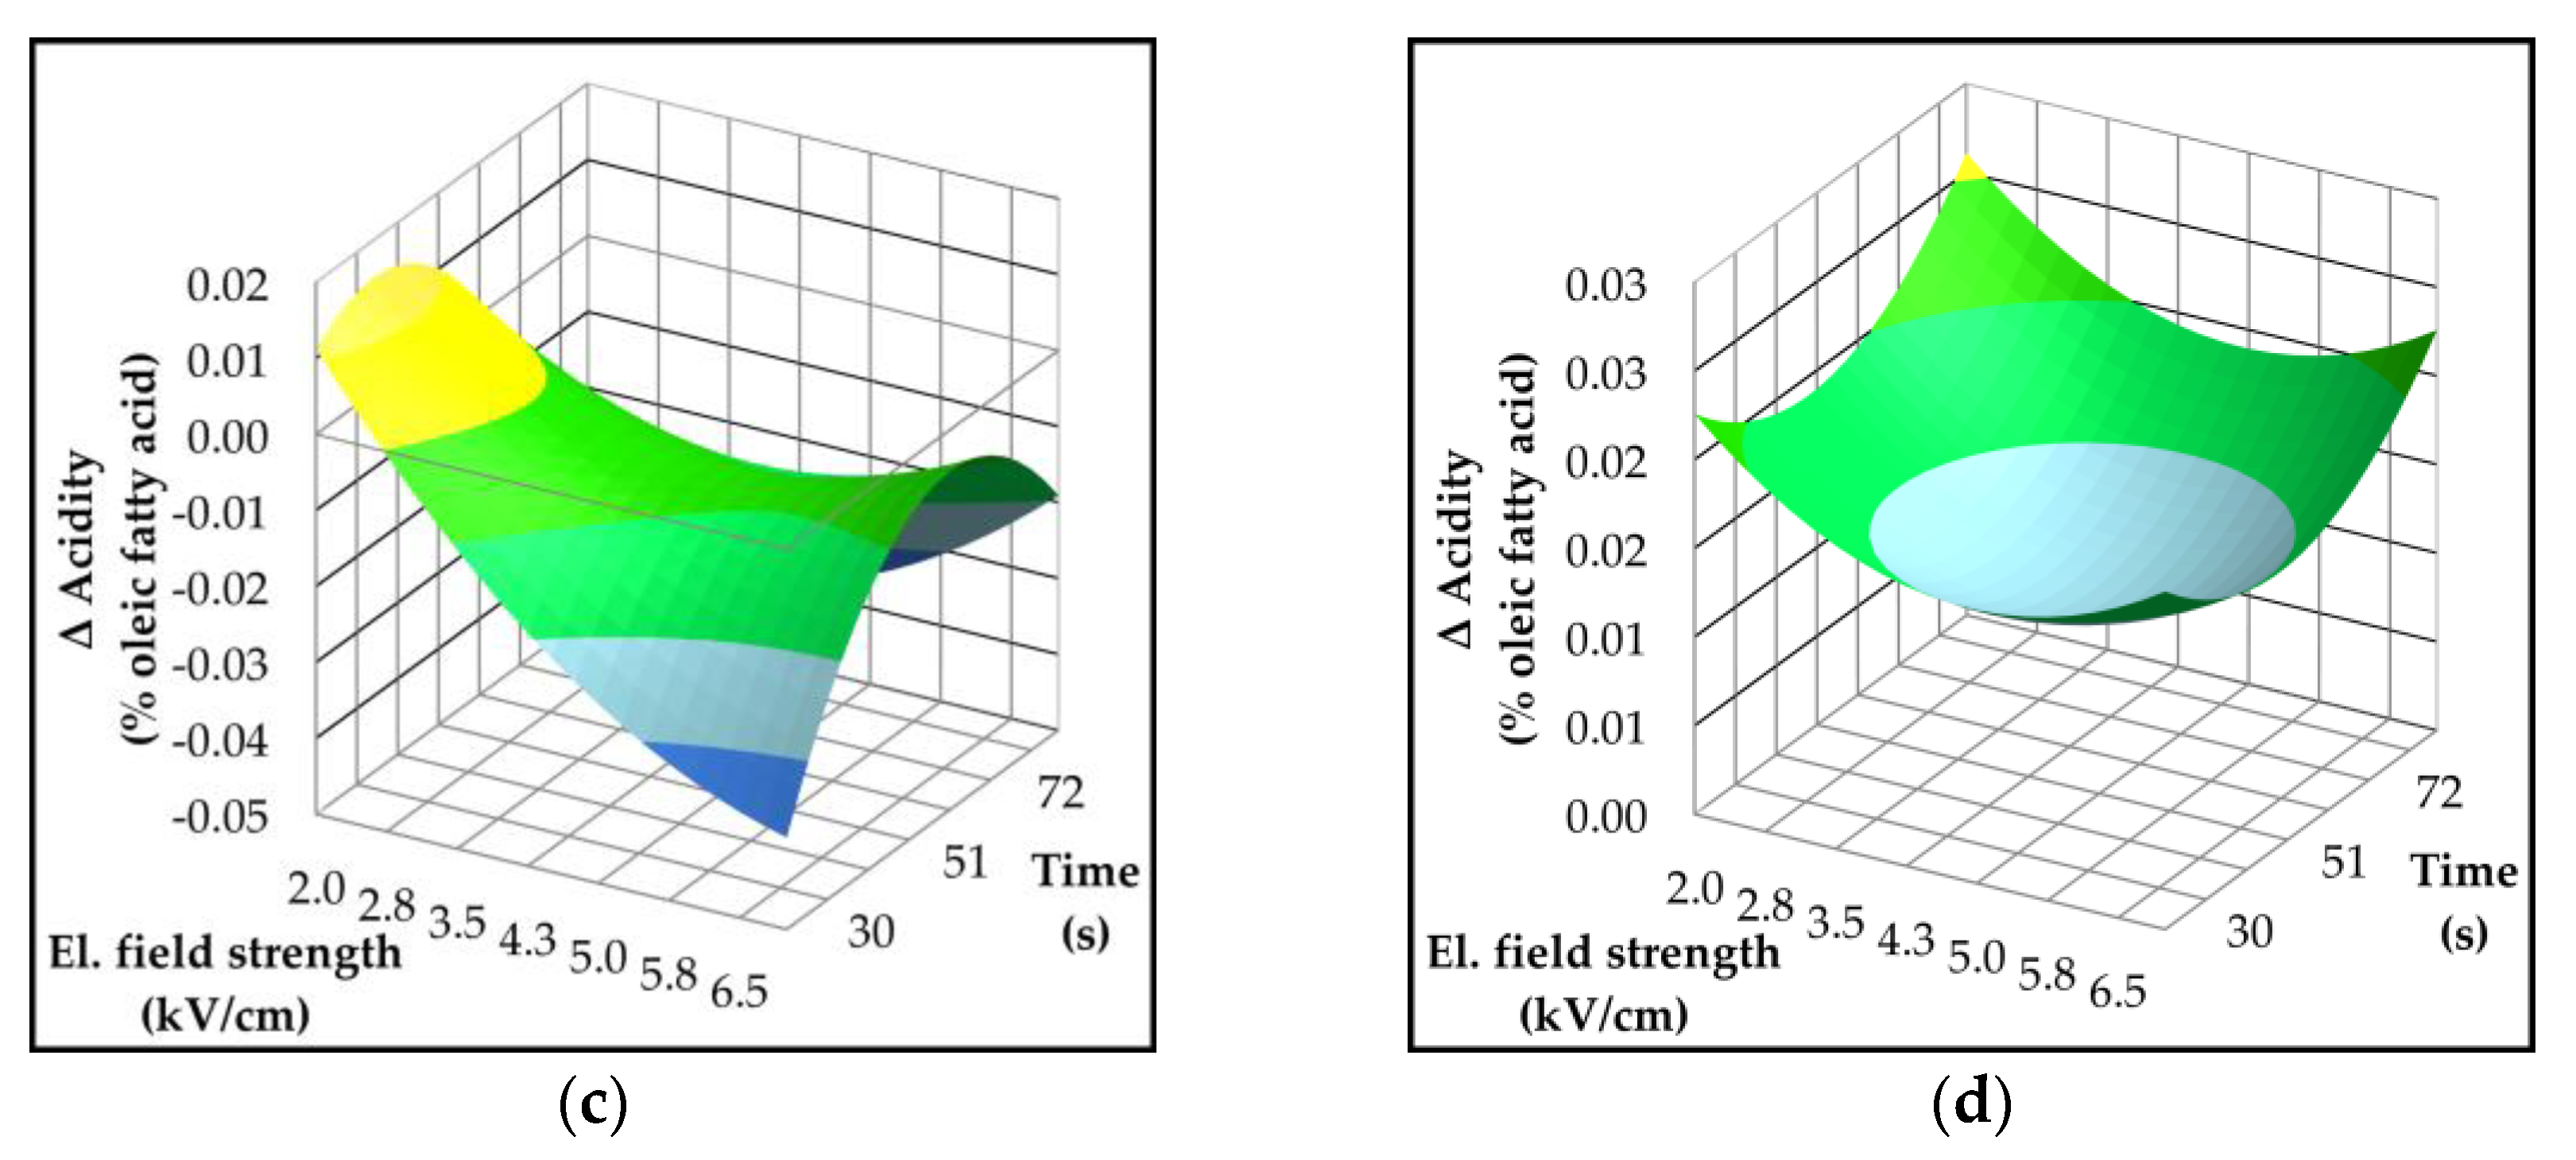
Figure 3.
Three-dimensional response surface plots showing the effect of electric field strength (kV/cm) and treatment time (s) on peroxide value - PV (meqO2/kg) in Croatian olive varieties (a) Istarska bjelica; (b) Rosulja; (c) Levantinka; (d) Oblica. Results for each variety are expressed as the difference in PV compared to the control.
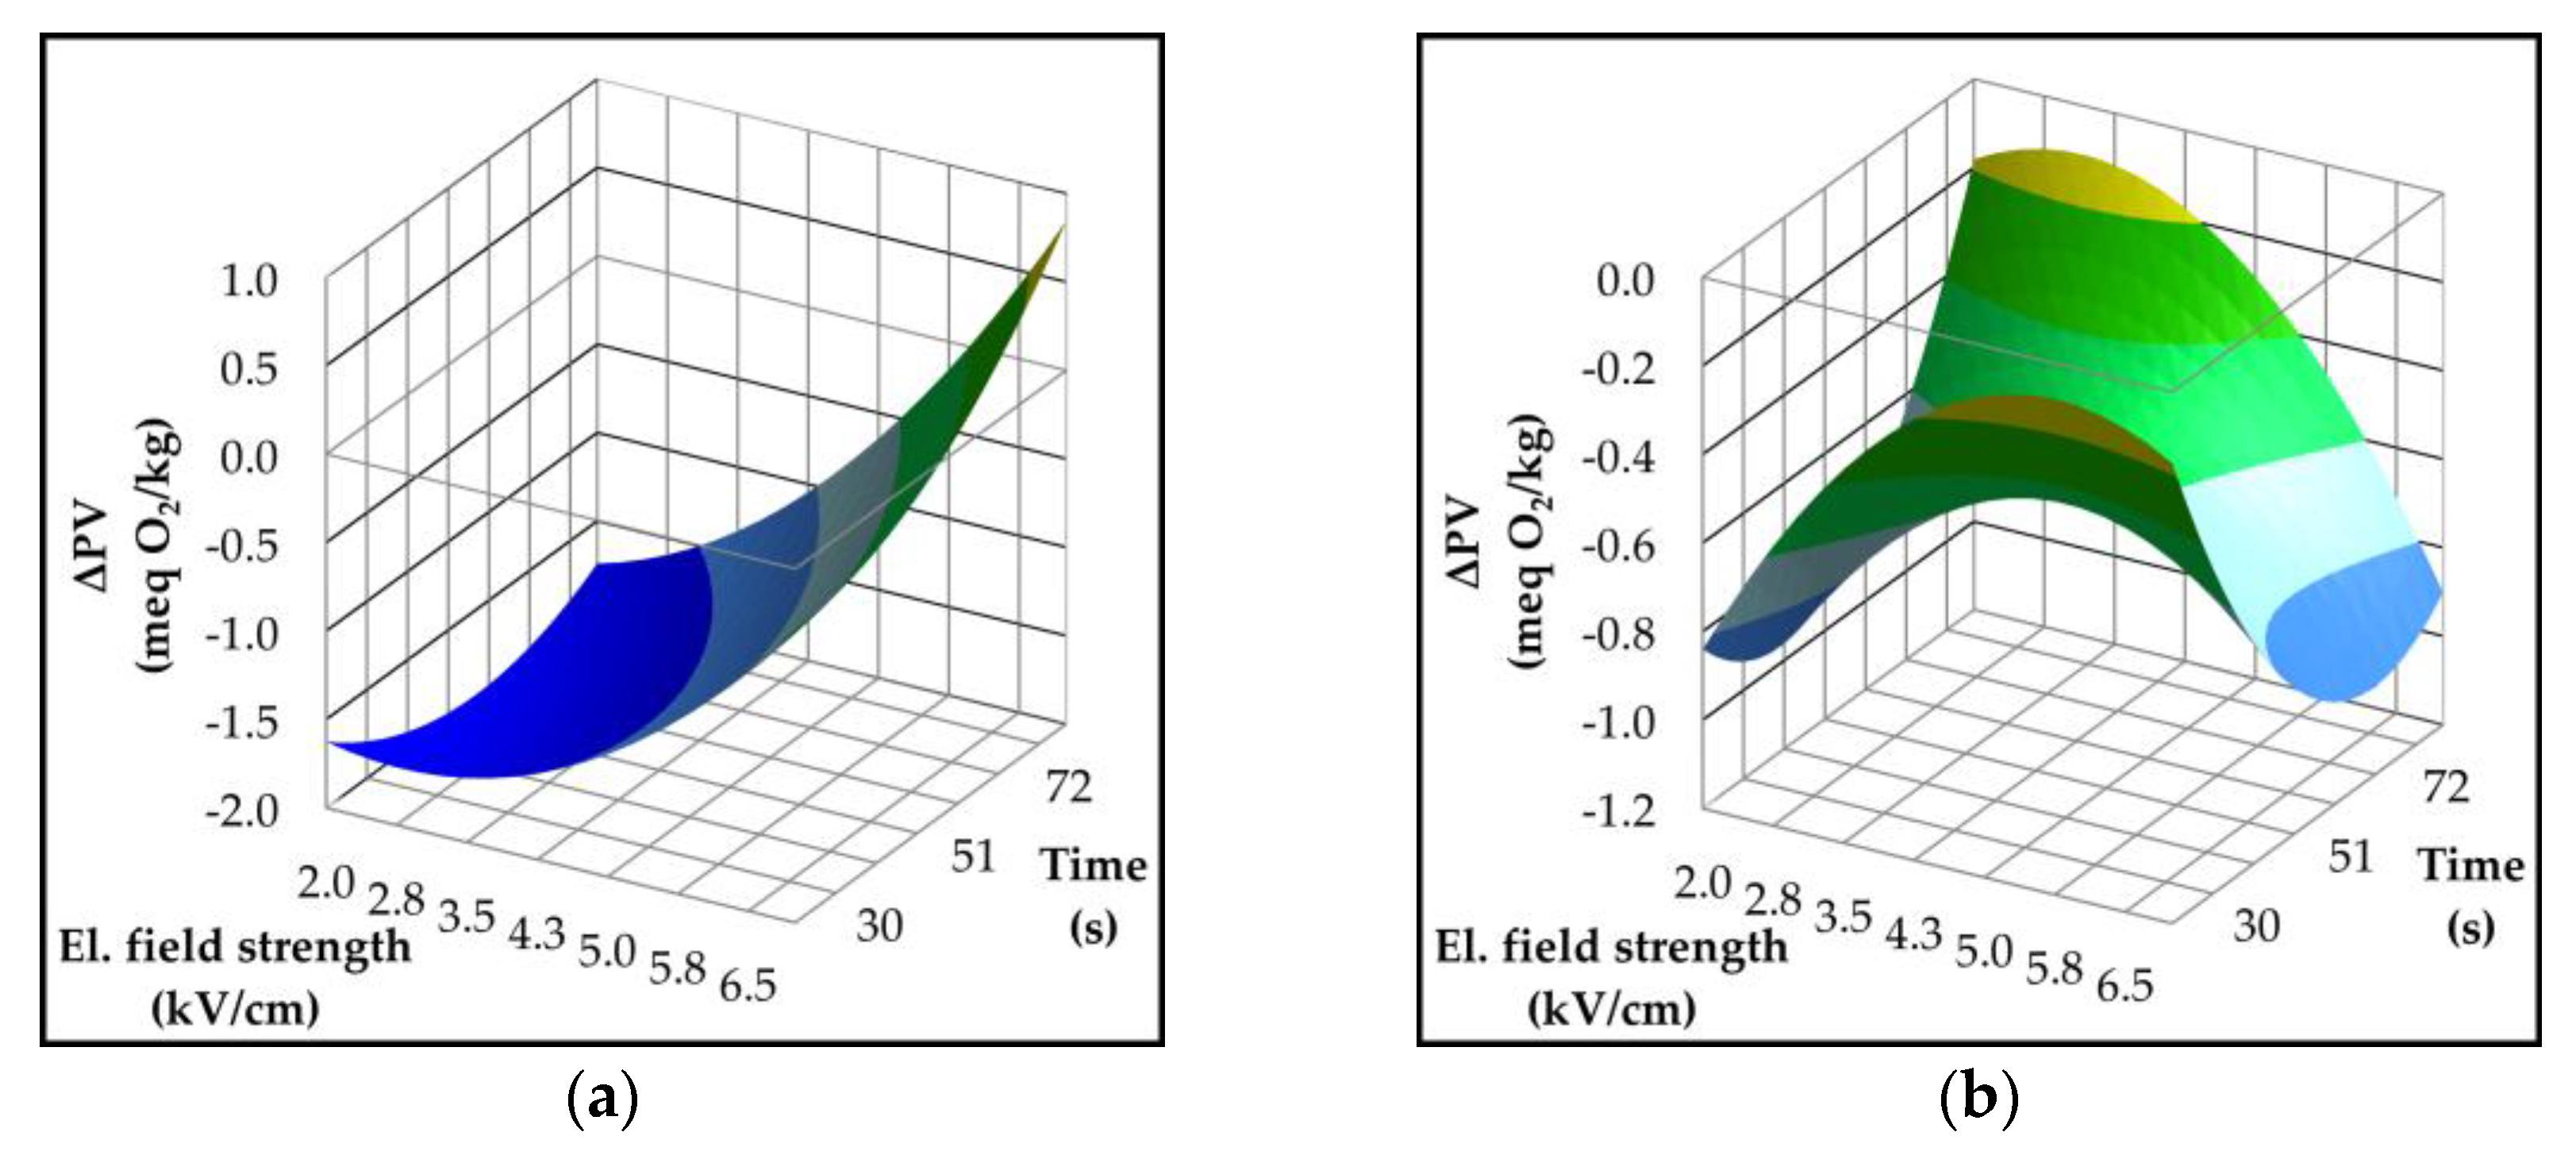
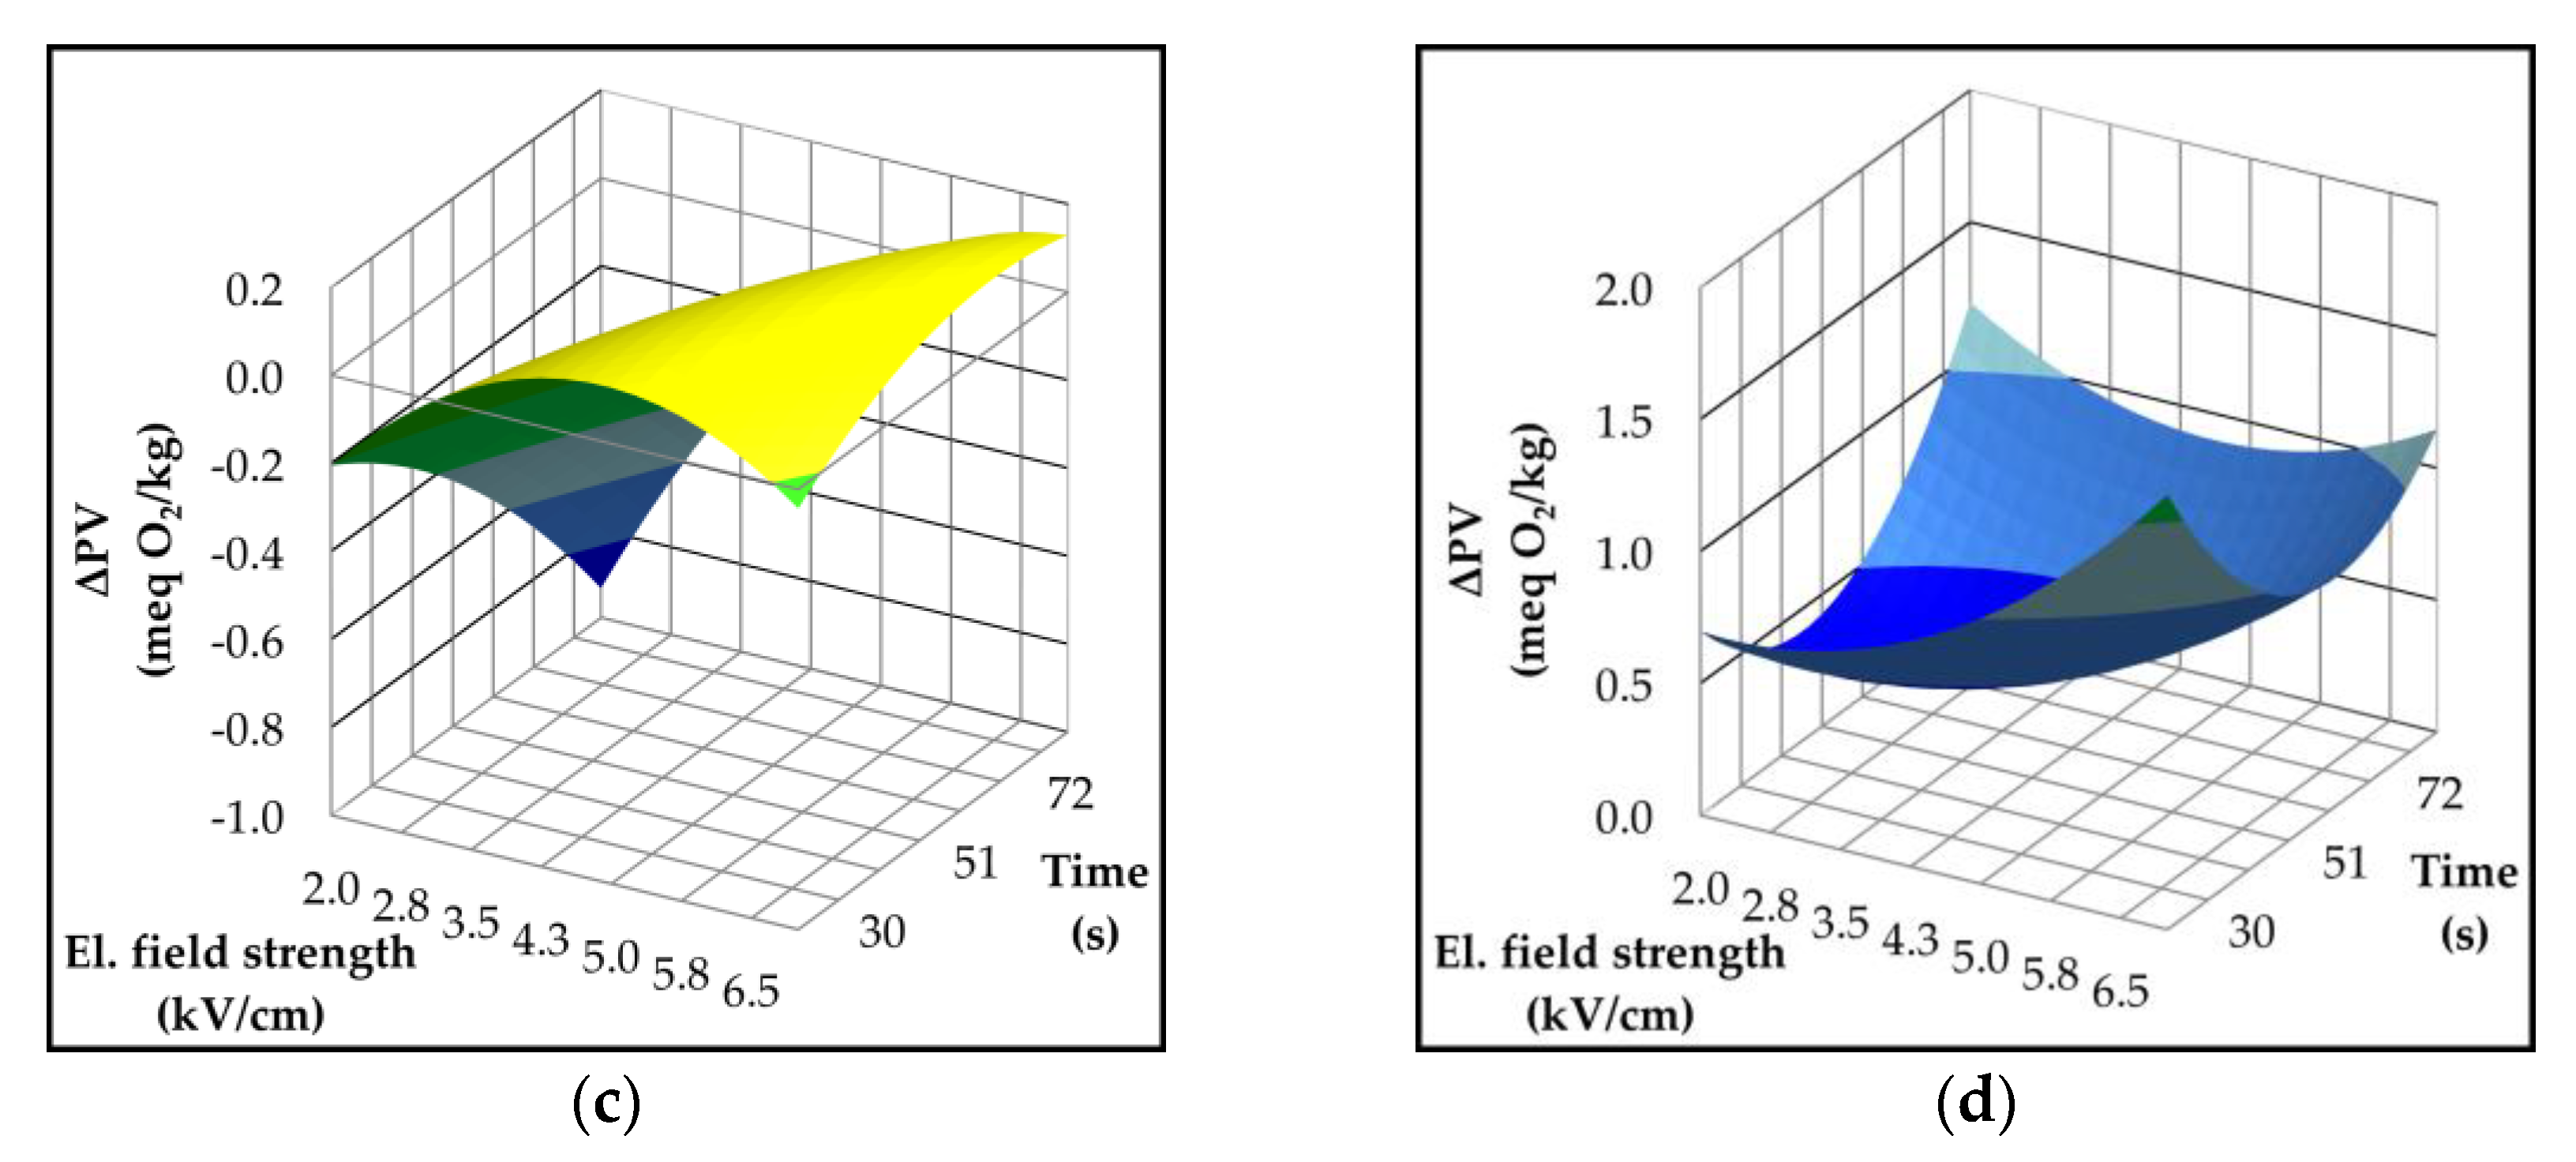
Figure 4.
Three-dimensional response surface plots showing the effect of electric field strength (kV/cm) and treatment time (s) on K232 in Croatian olive varieties (a) Istarska bjelica; (b) Rosulja; (c) Levantinka; (d) Oblica. Results for each variety are expressed as the difference in K232 value compared to the control.
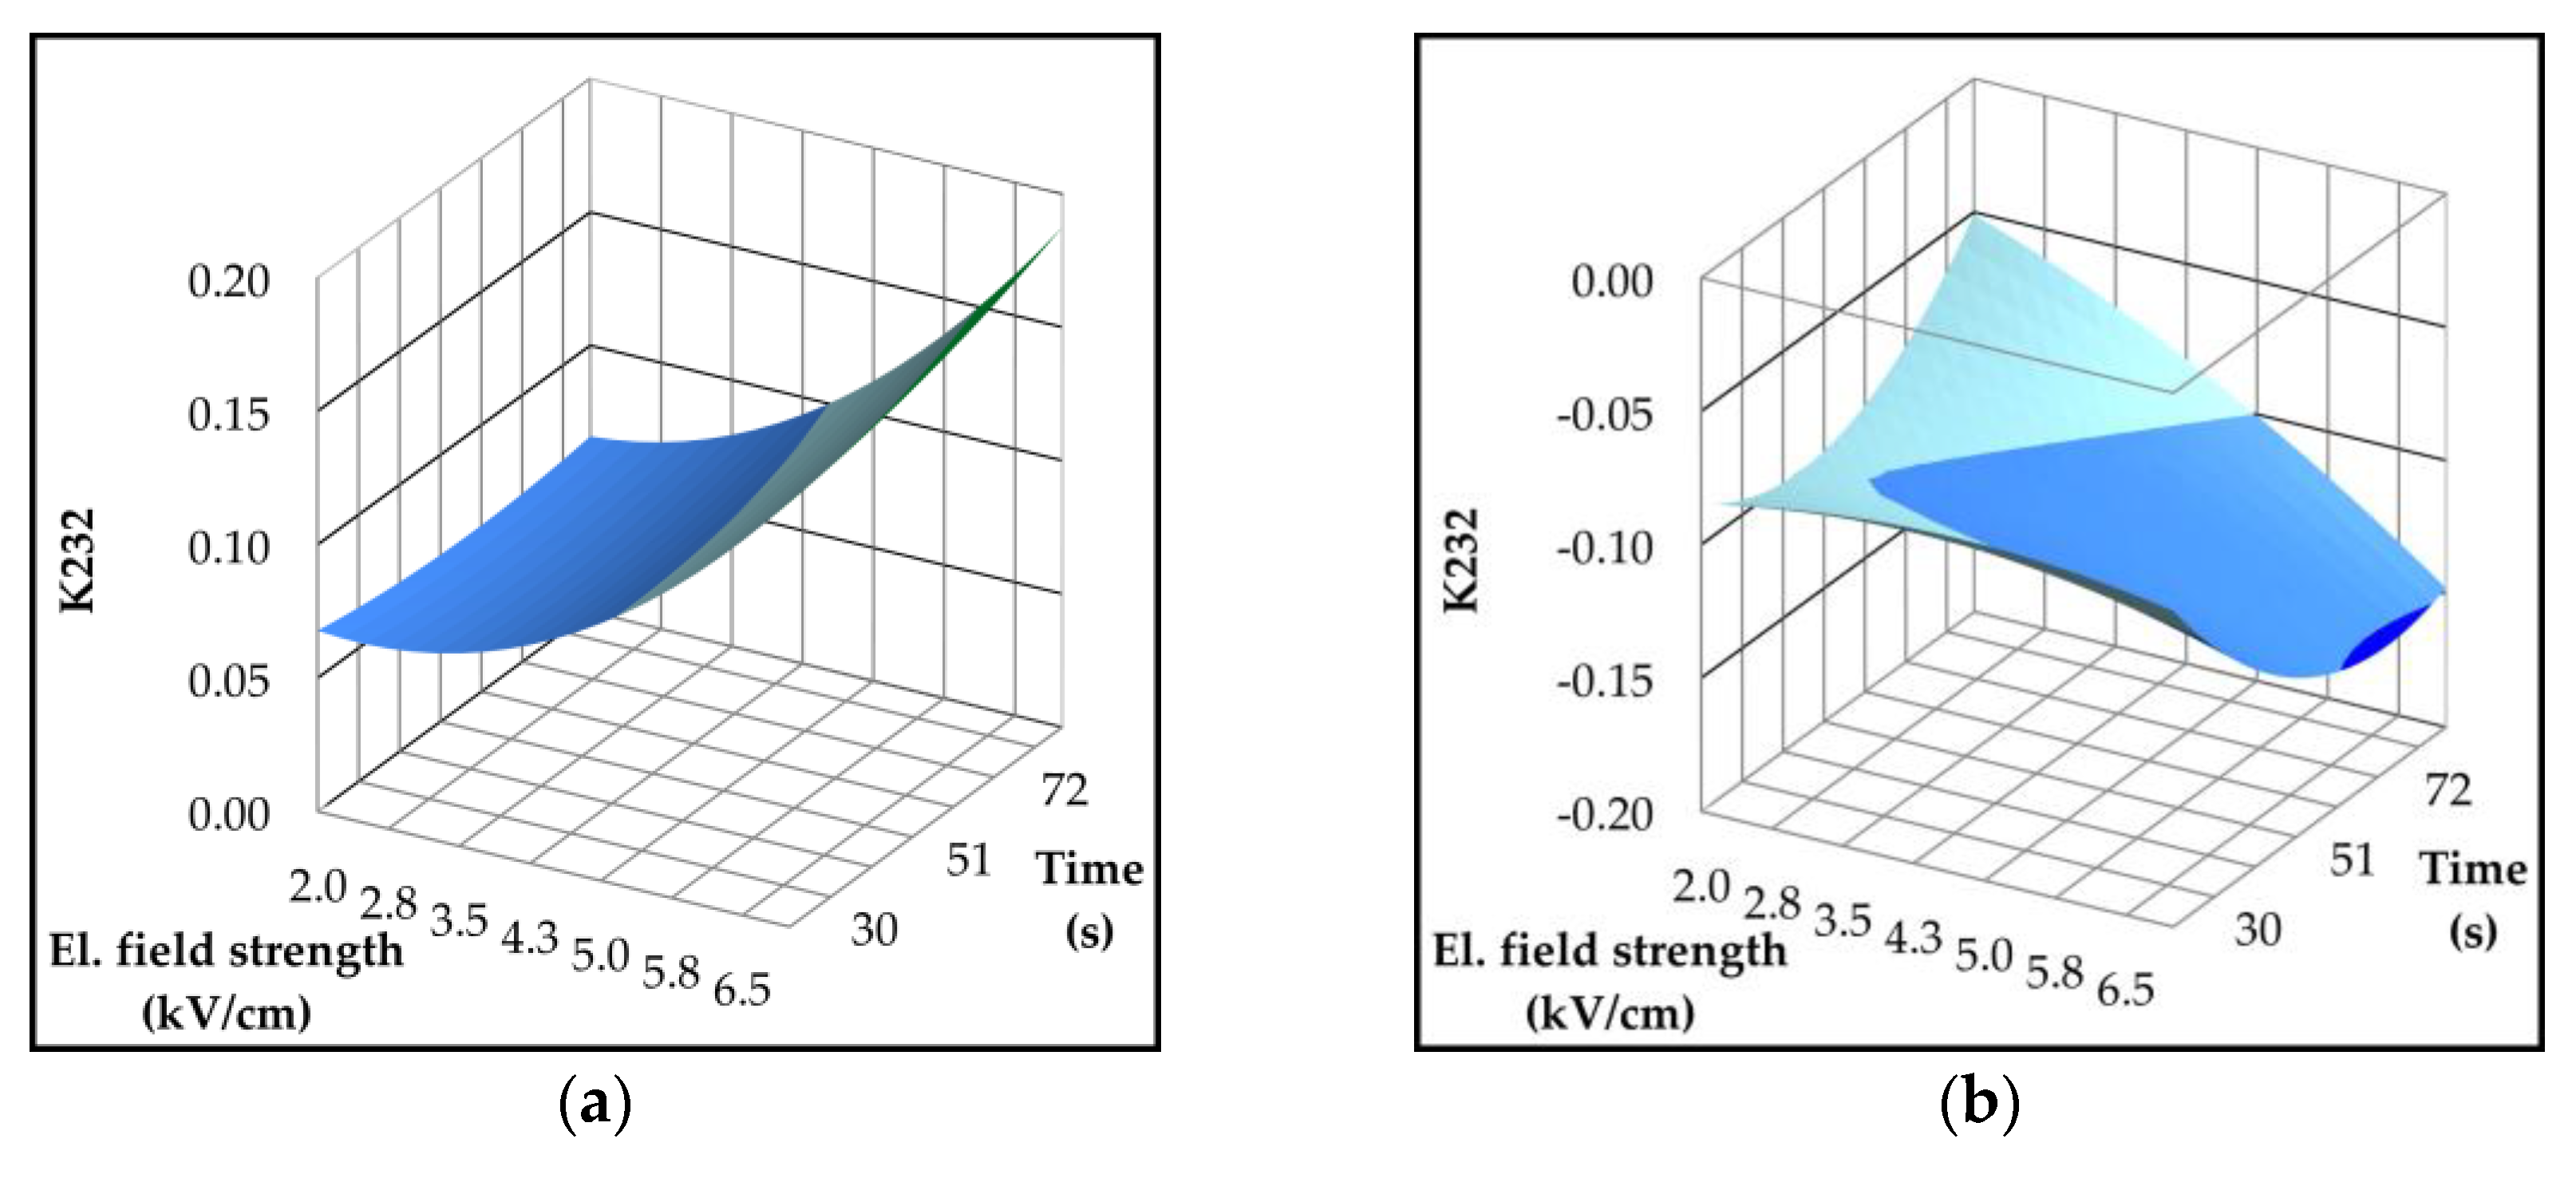
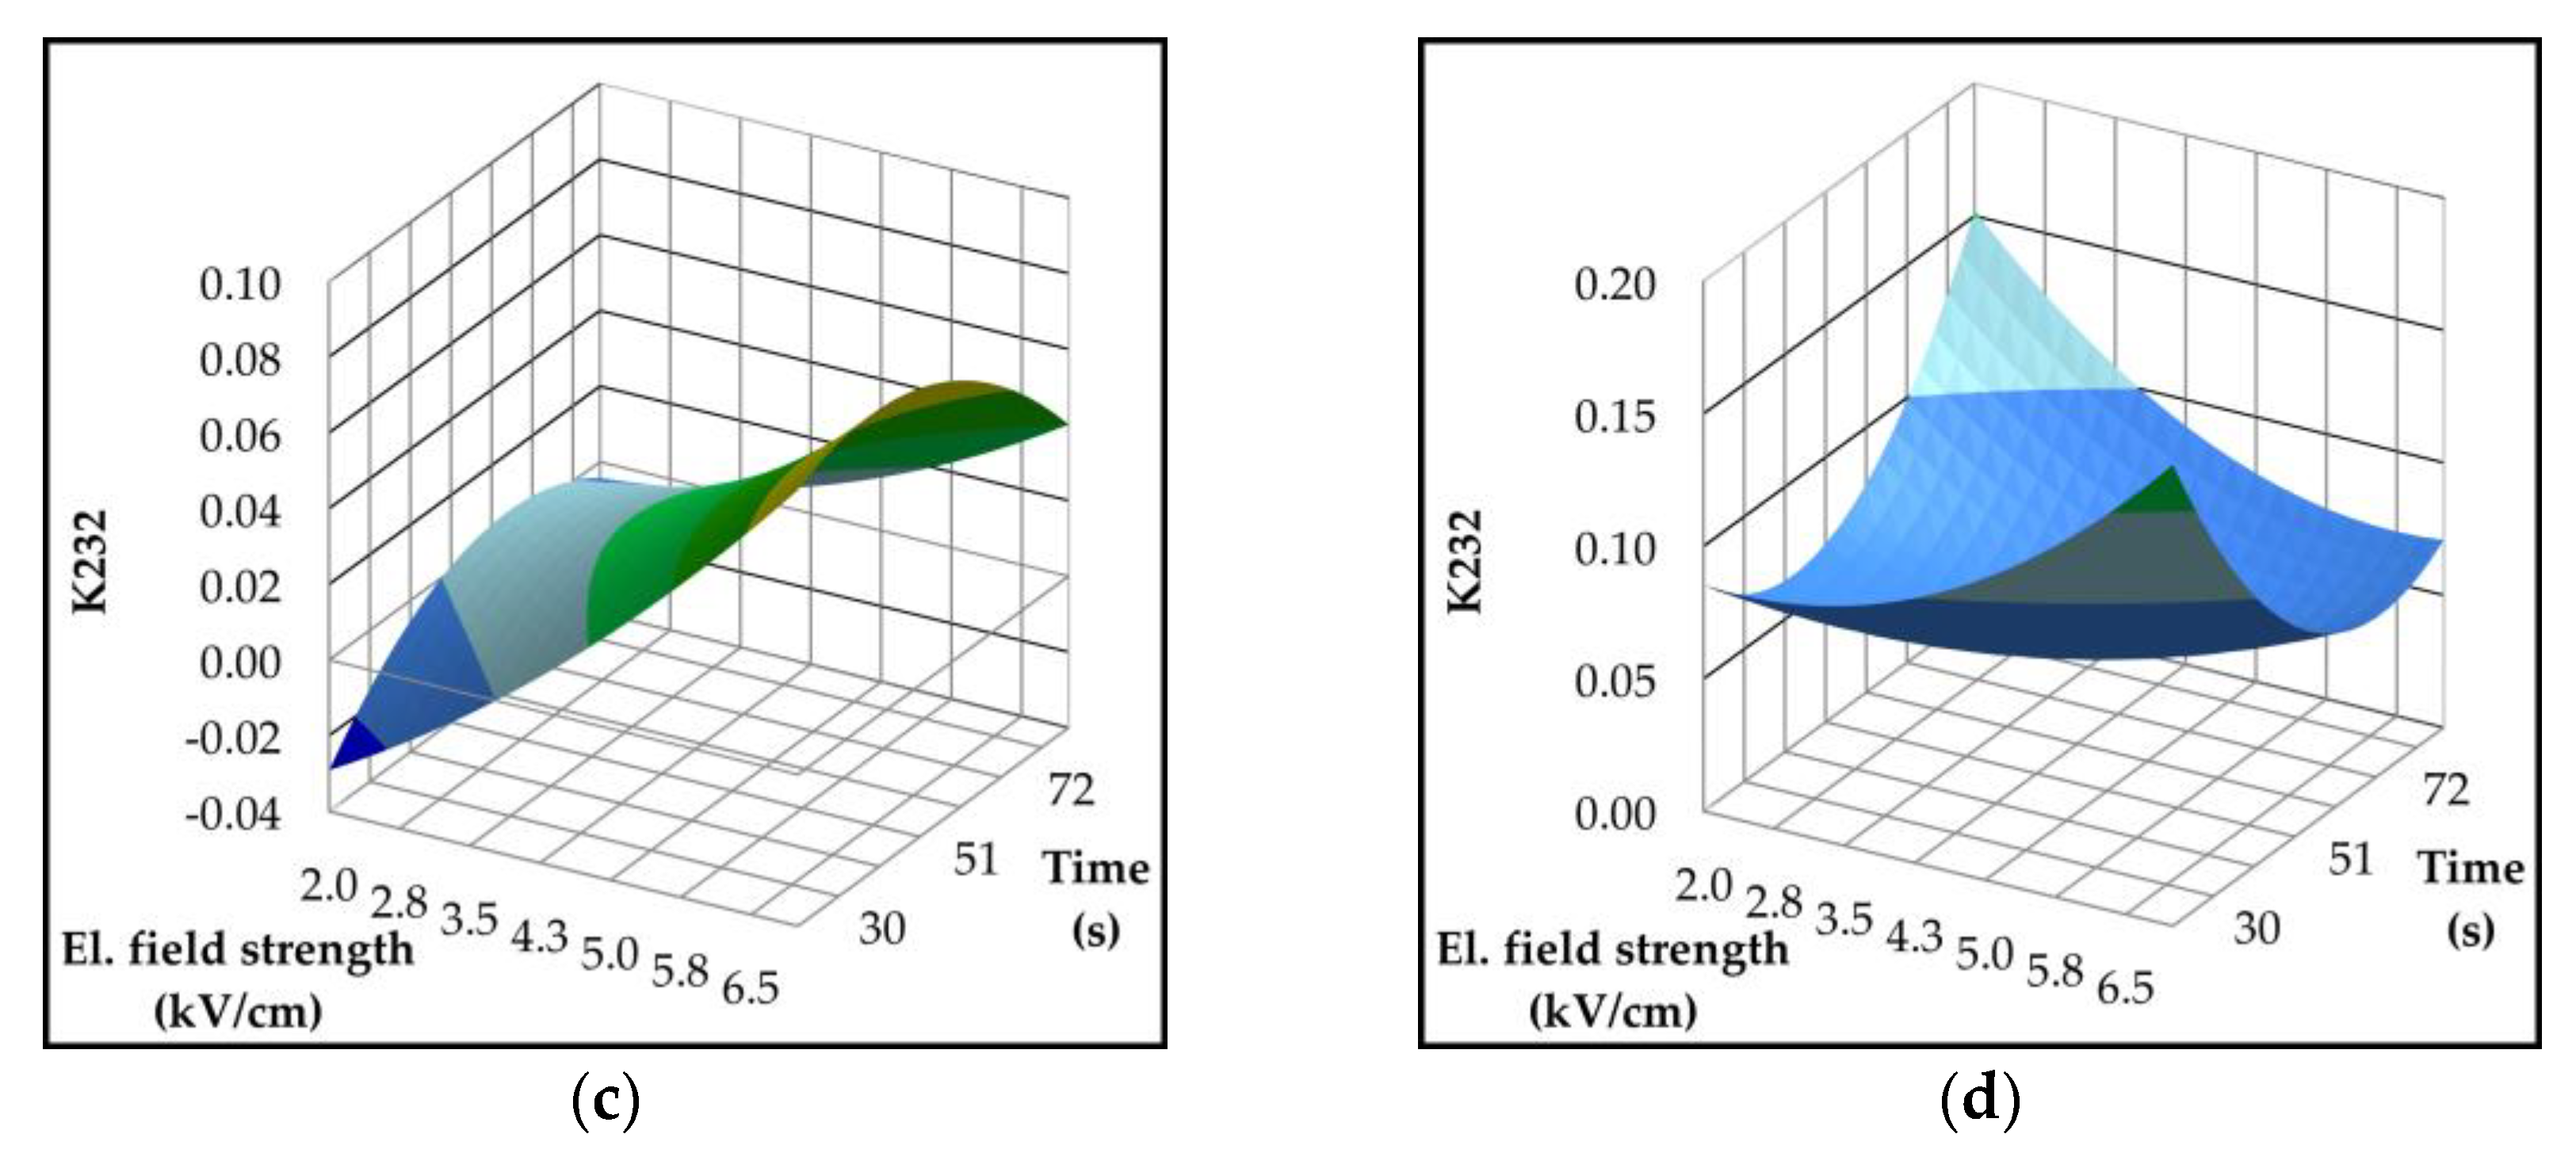
Figure 5.
Three-dimensional response surface plots showing the effect of electric field strength (kV/cm) and treatment time (s) on K268 in Croatian olive varieties (a) Istarska bjelica; (b) Rosulja; (c) Levantinka; (d) Oblica. Results for each variety are expressed as the difference in K268 value compared to the control.
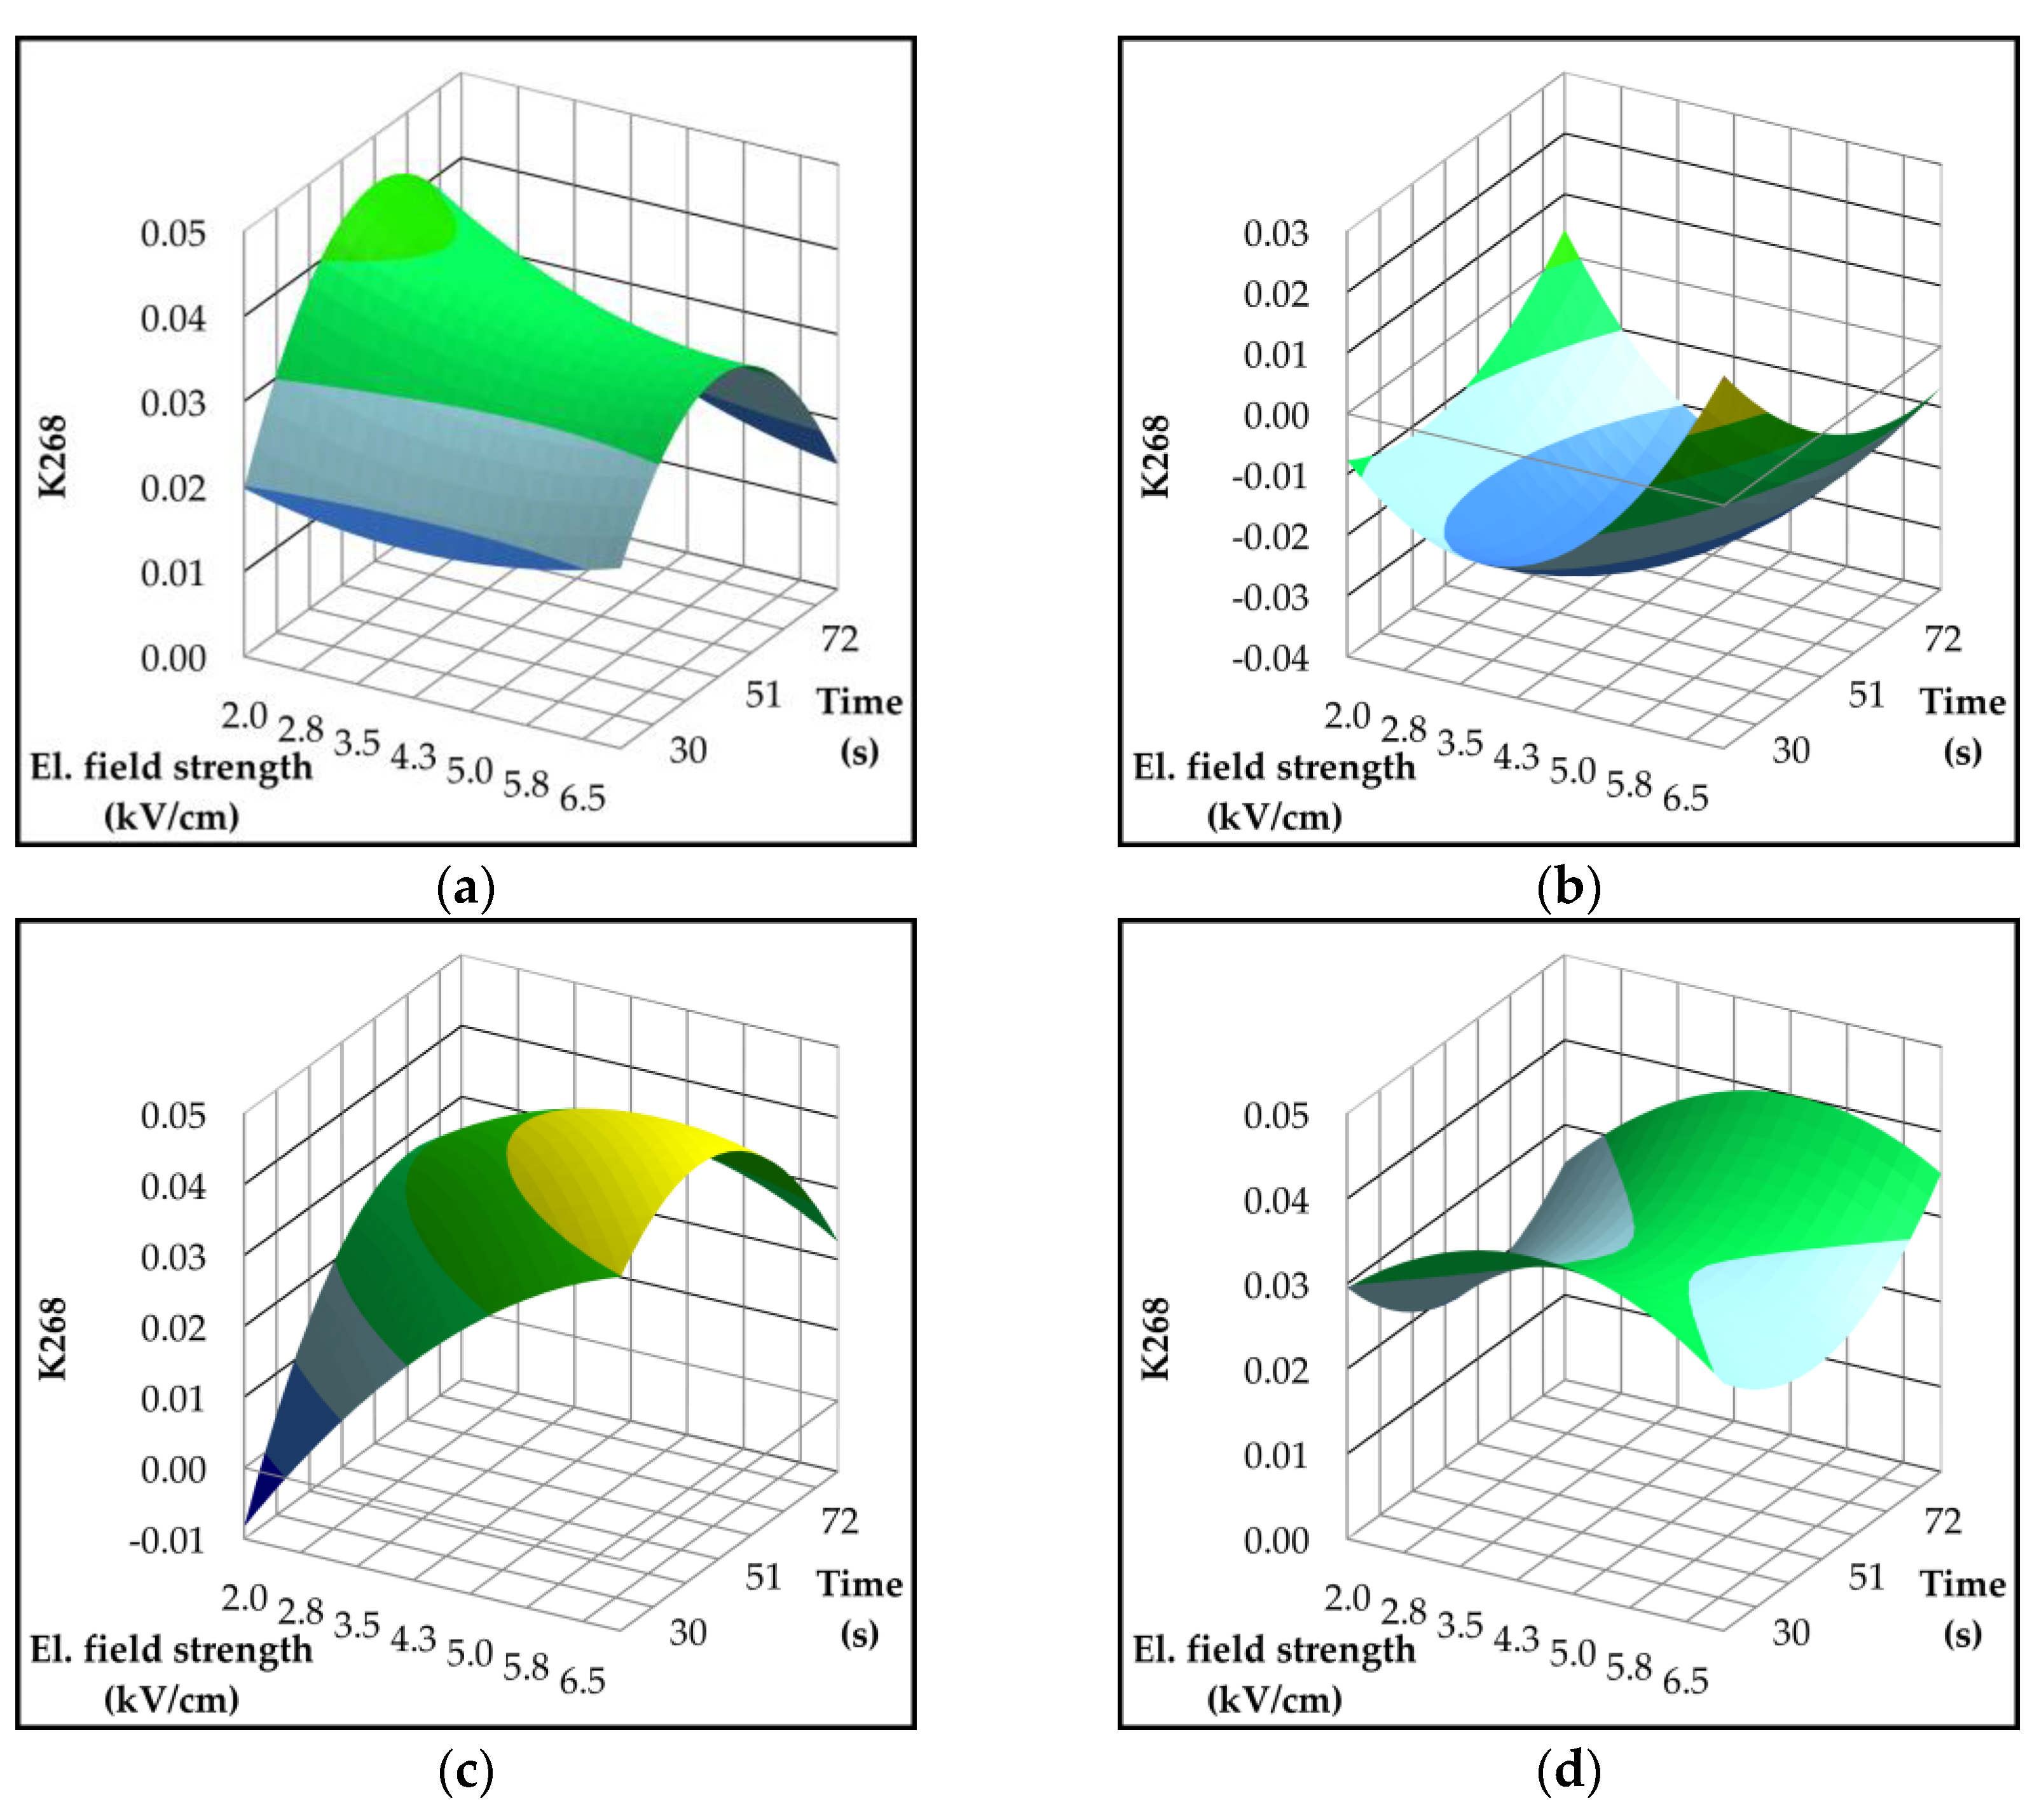
Figure 6.
Three-dimensional response surface plots showing the effect of electric field strength (kV/cm) and treatment time (s) on lipoxygenase (LOX) activity (μmol hydroperoxy-octadecatrienoic acid (HPOT)/mg protein) in Croatian olive varieties (a) Istarska bjelica; (b) Rosulja; (c) Levantinka; (d) Oblica. Results for each variety are expressed as relative change – RC (%) in LOX activity compared to the control, calculated as [(treatment − control) / control] × 100.
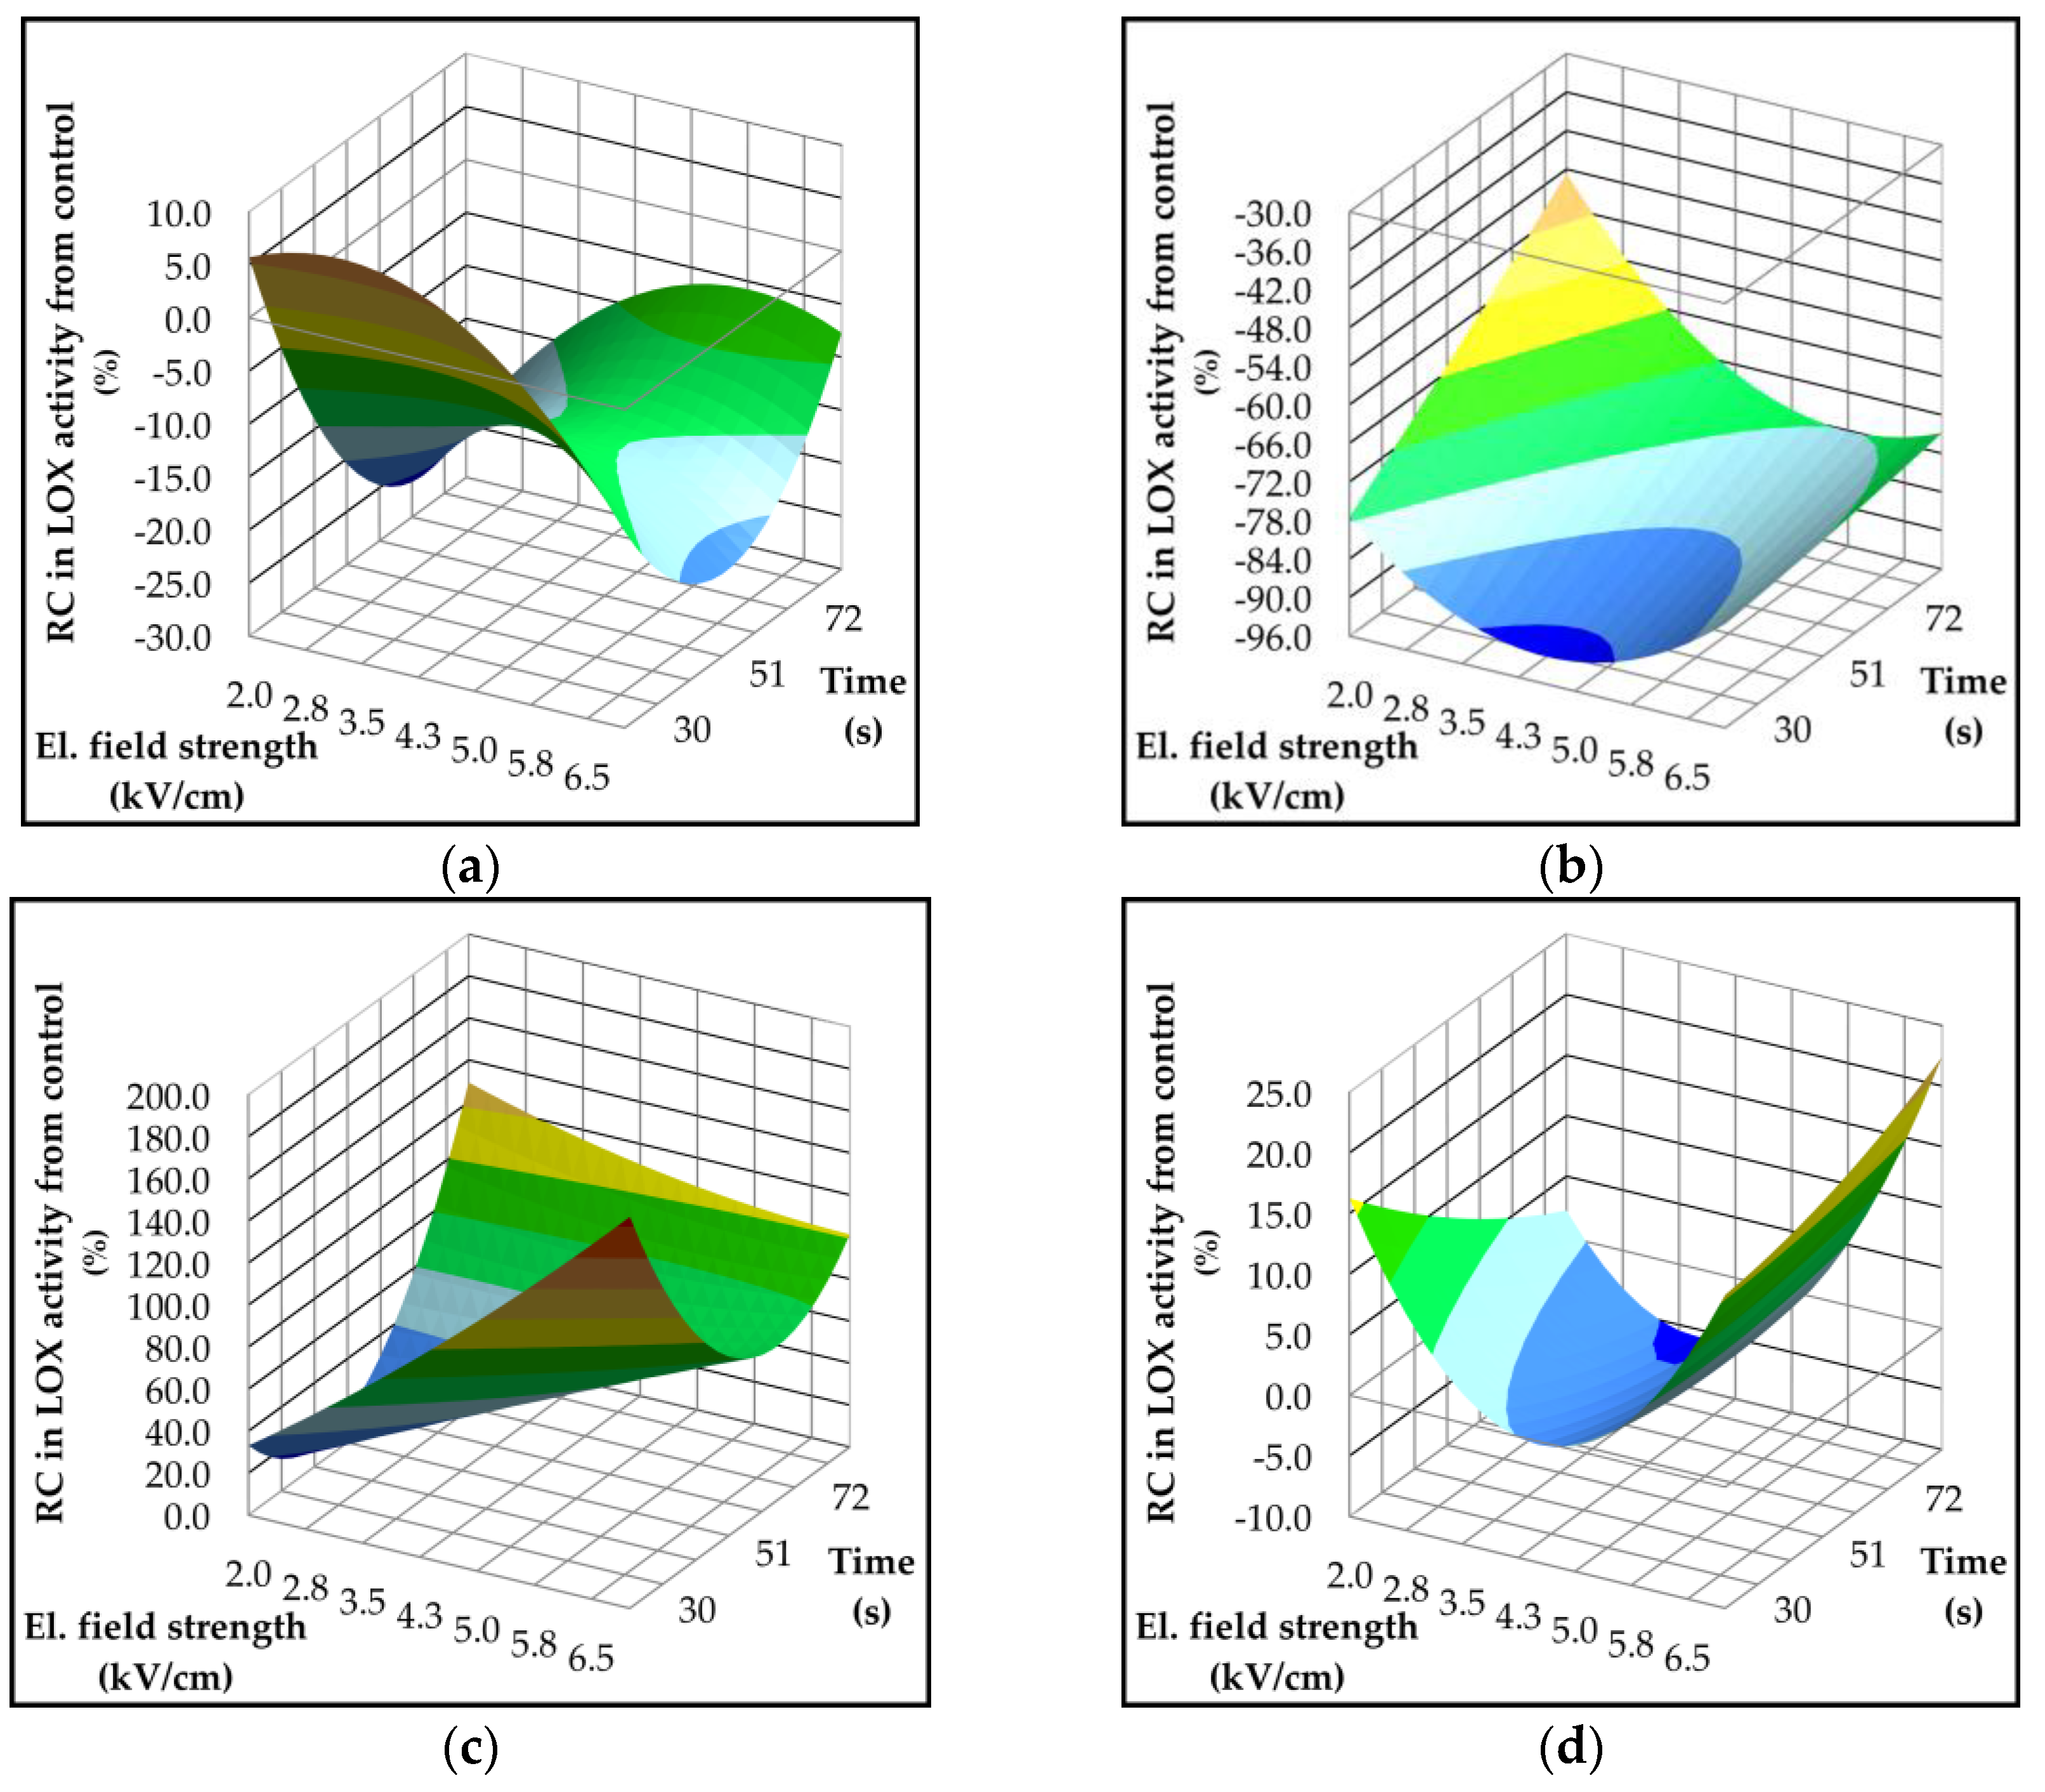
Figure 7.
Three-dimensional response surface plots showing the influence of electric field strength (kV/cm) and treatment time (s) on formation of volatile components (mg/kg) associated with the lipoxygenase (LOX) pathway in Croatian olive varieties (a) Istarska bjelica; (b) Rosulja; (c) Levantinka; (d) Oblica. Results for each variety are expressed as relative change – RC (%) in LOX pathway compared to the control, calculated as [(treatment − control) / control] × 100.
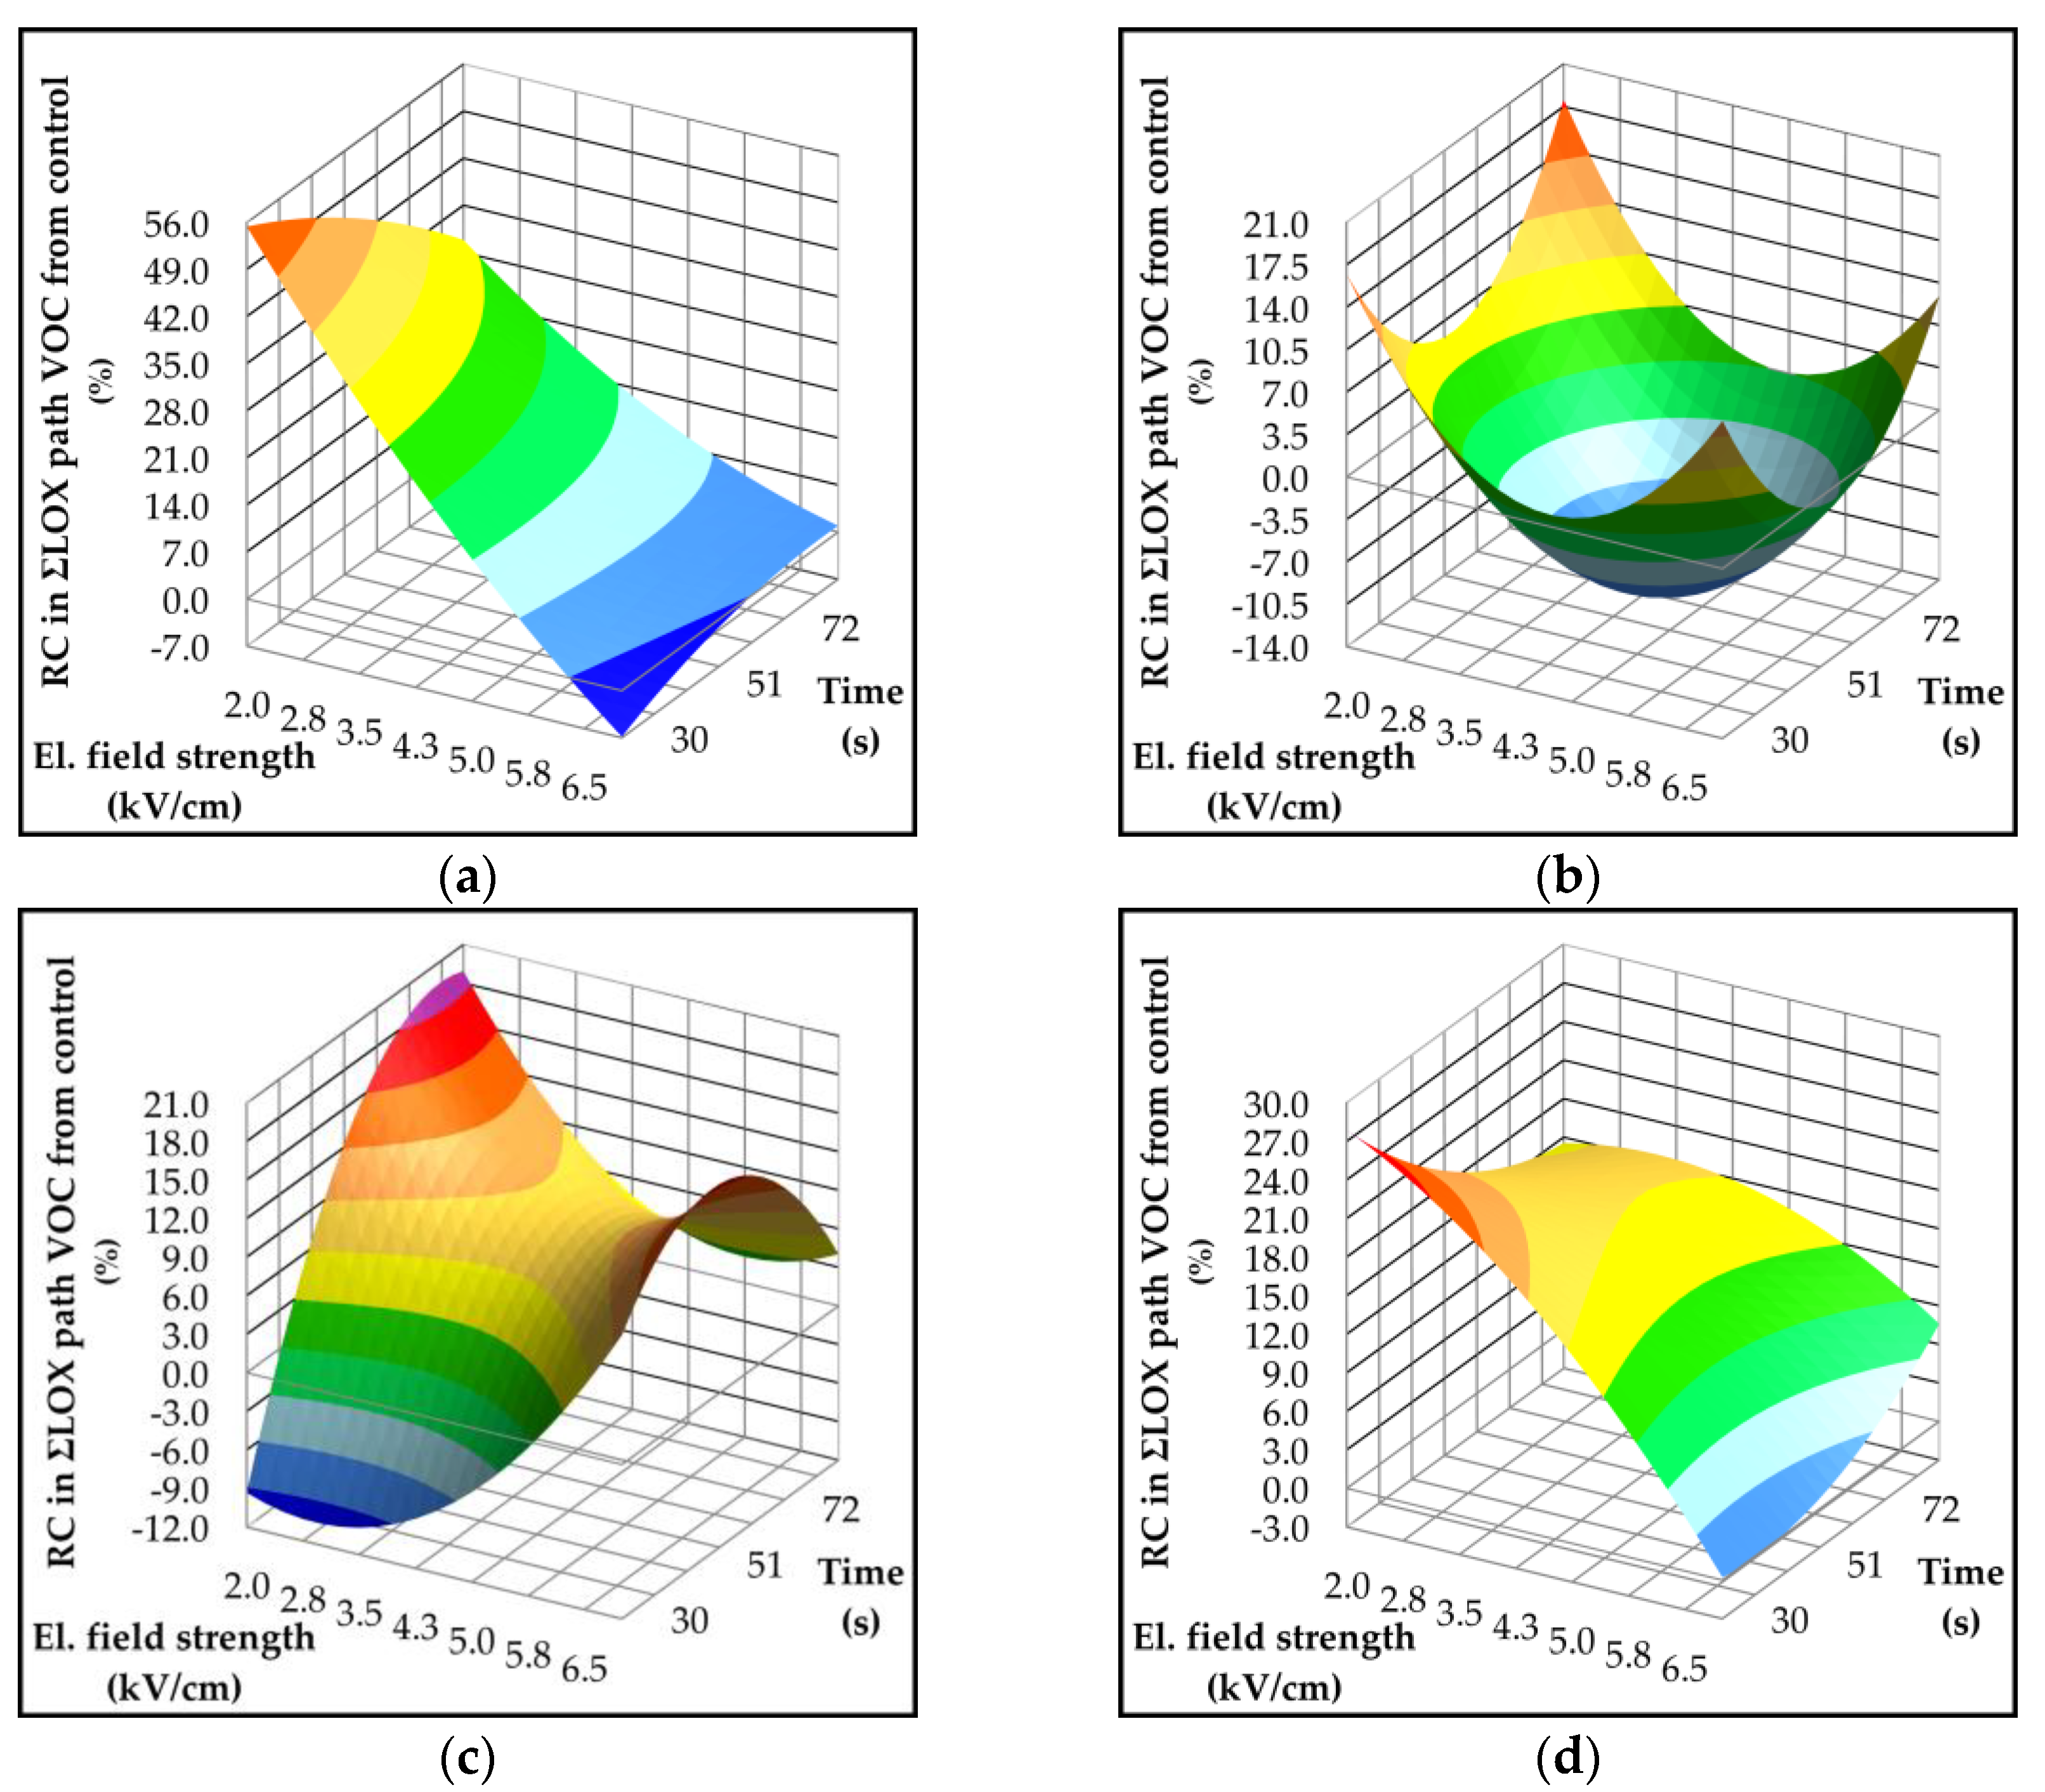
Figure 8.
Three-dimensional response surface plots showing the influence of electric field strength (kV/cm) and treatment time (s) on formation of volatile components (mg/kg) associated with the oxidation (OX) in Croatian olive varieties (a) Istarska bjelica; (b) Rosulja; (c) Levantinka; (d) Oblica.
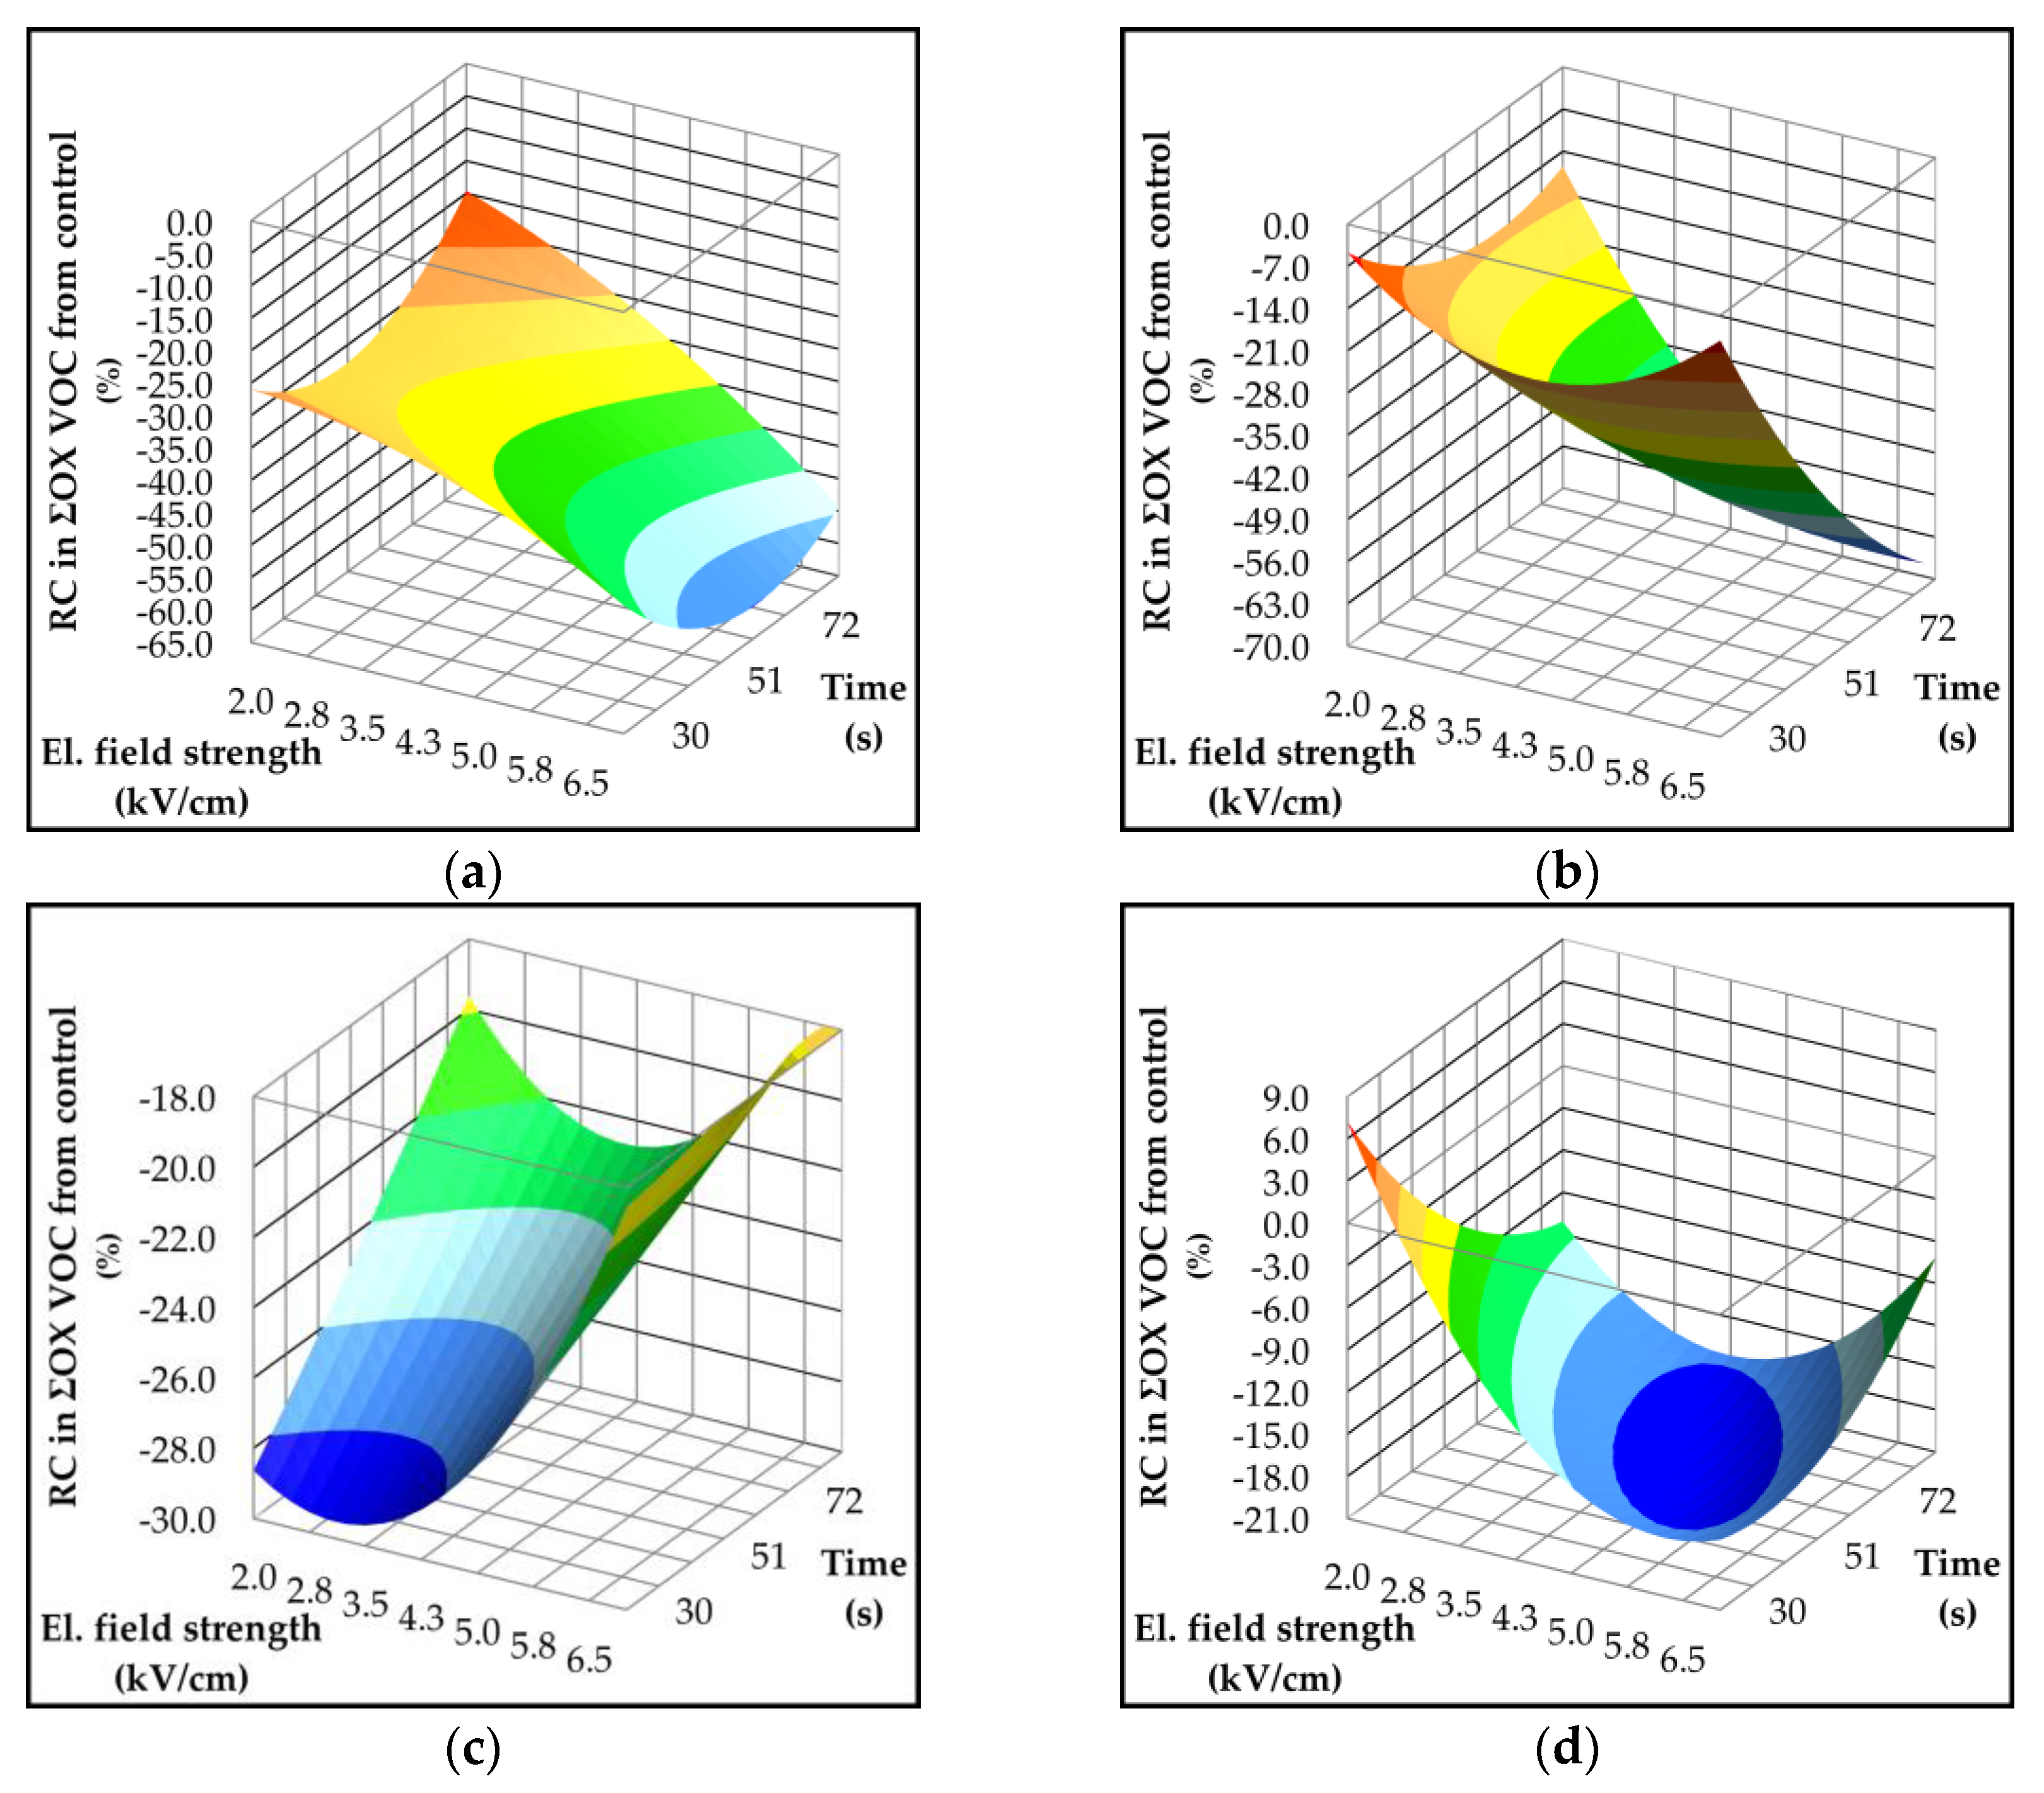
Figure 9.
Three-dimensional response surface plots showing the influence of electric field strength (kV/cm) and treatment time (s) on formation of volatile components (mg/kg) associated with the microbial activity (MBA) in Croatian olive varieties (a) Istarska bjelica; (b) Rosulja; (c) Levantinka; (d) Oblica.
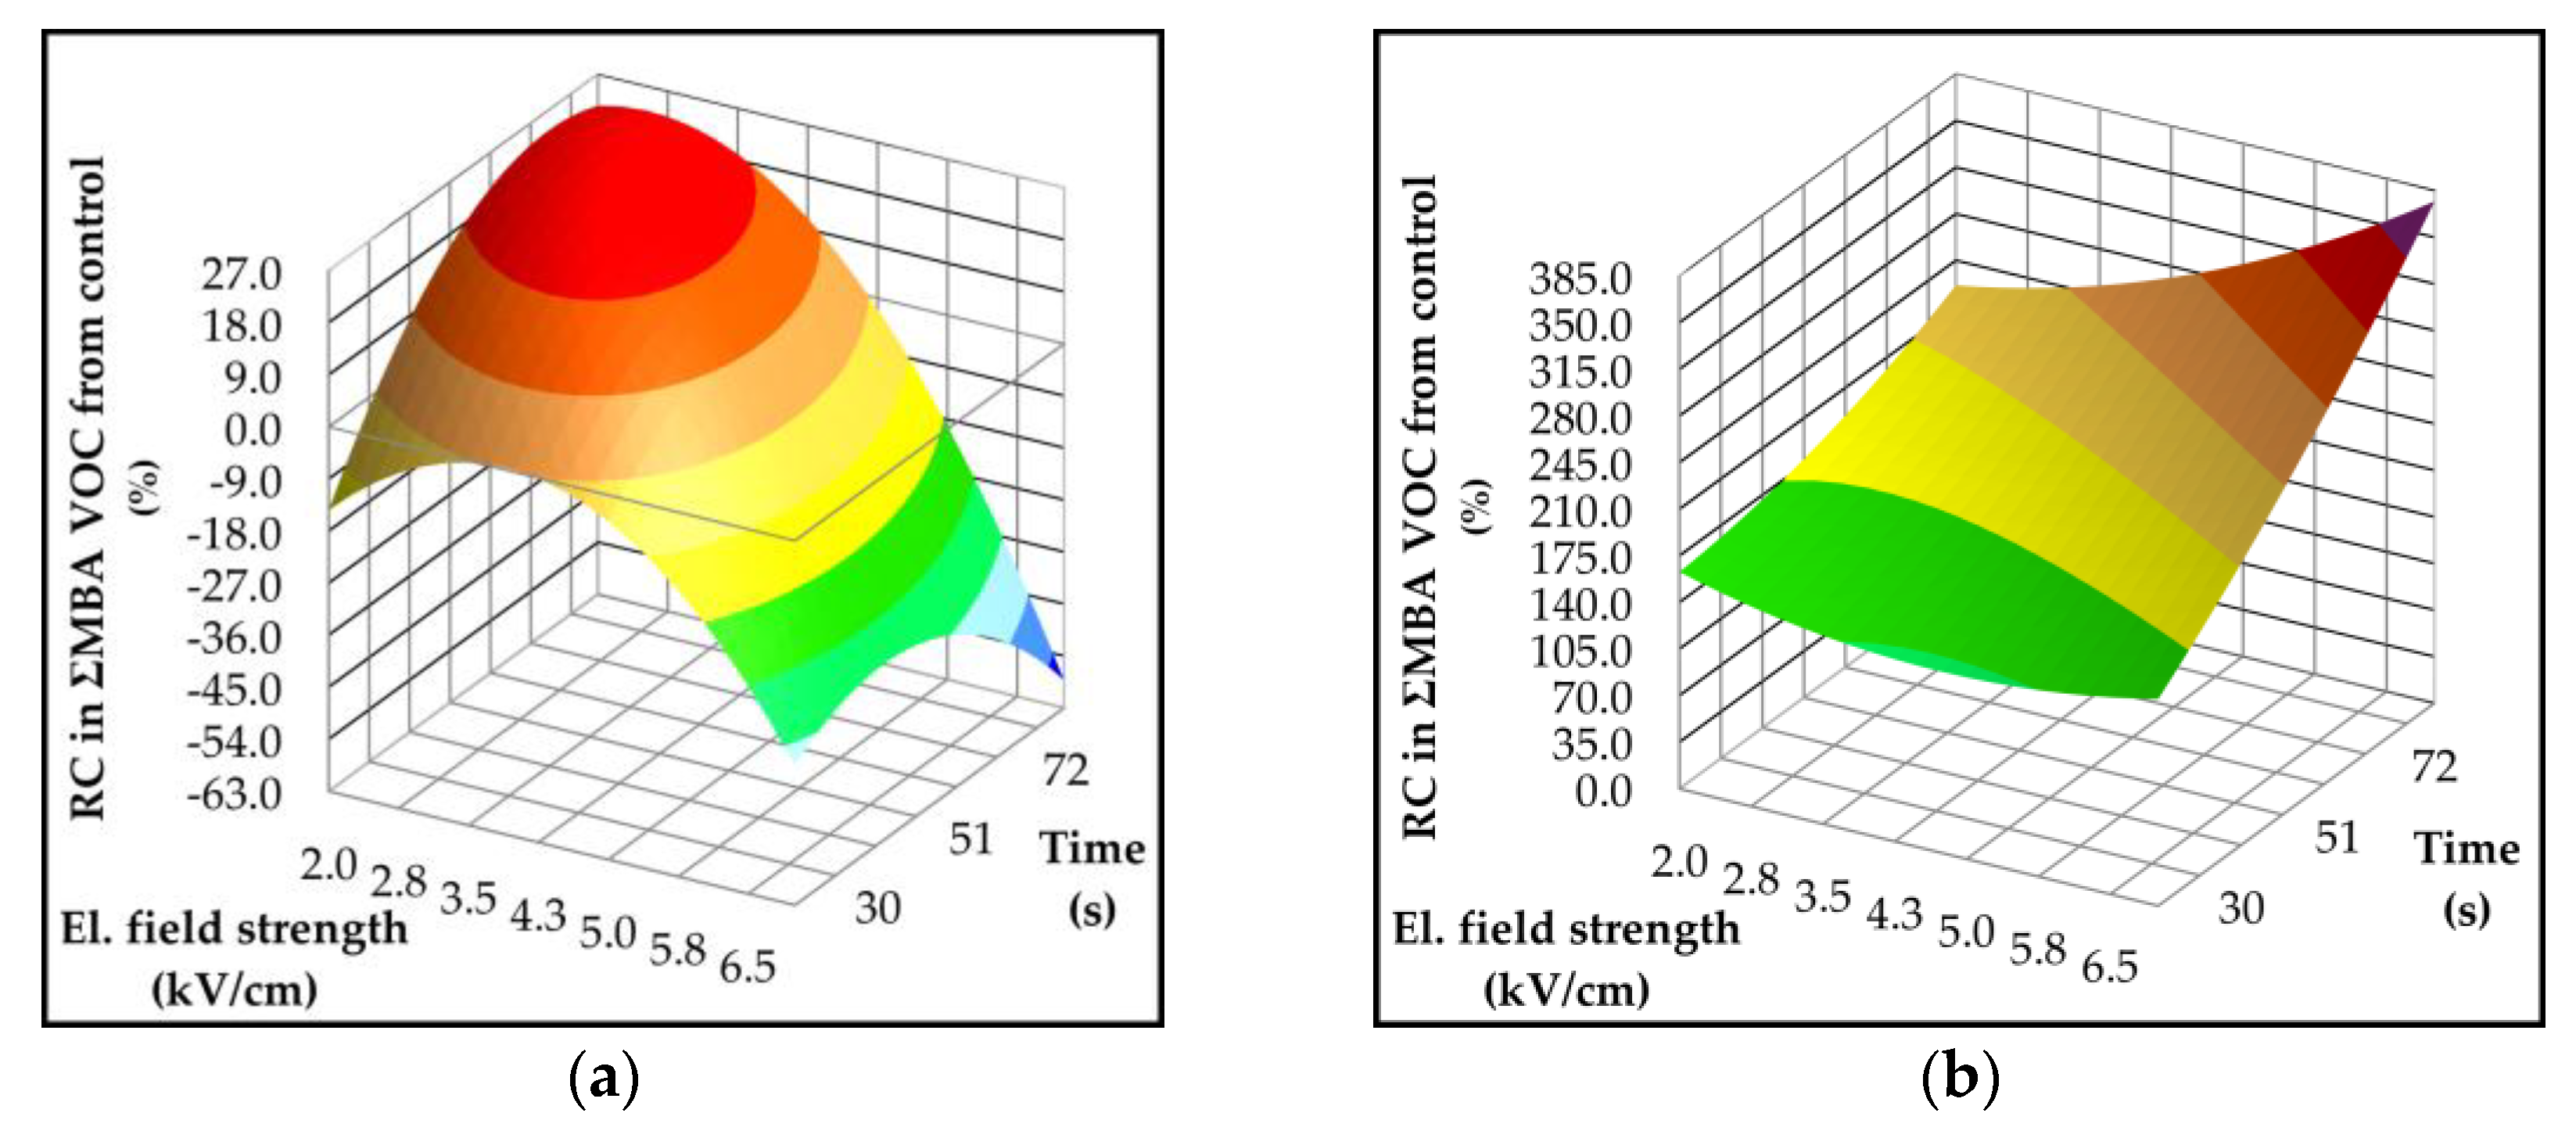
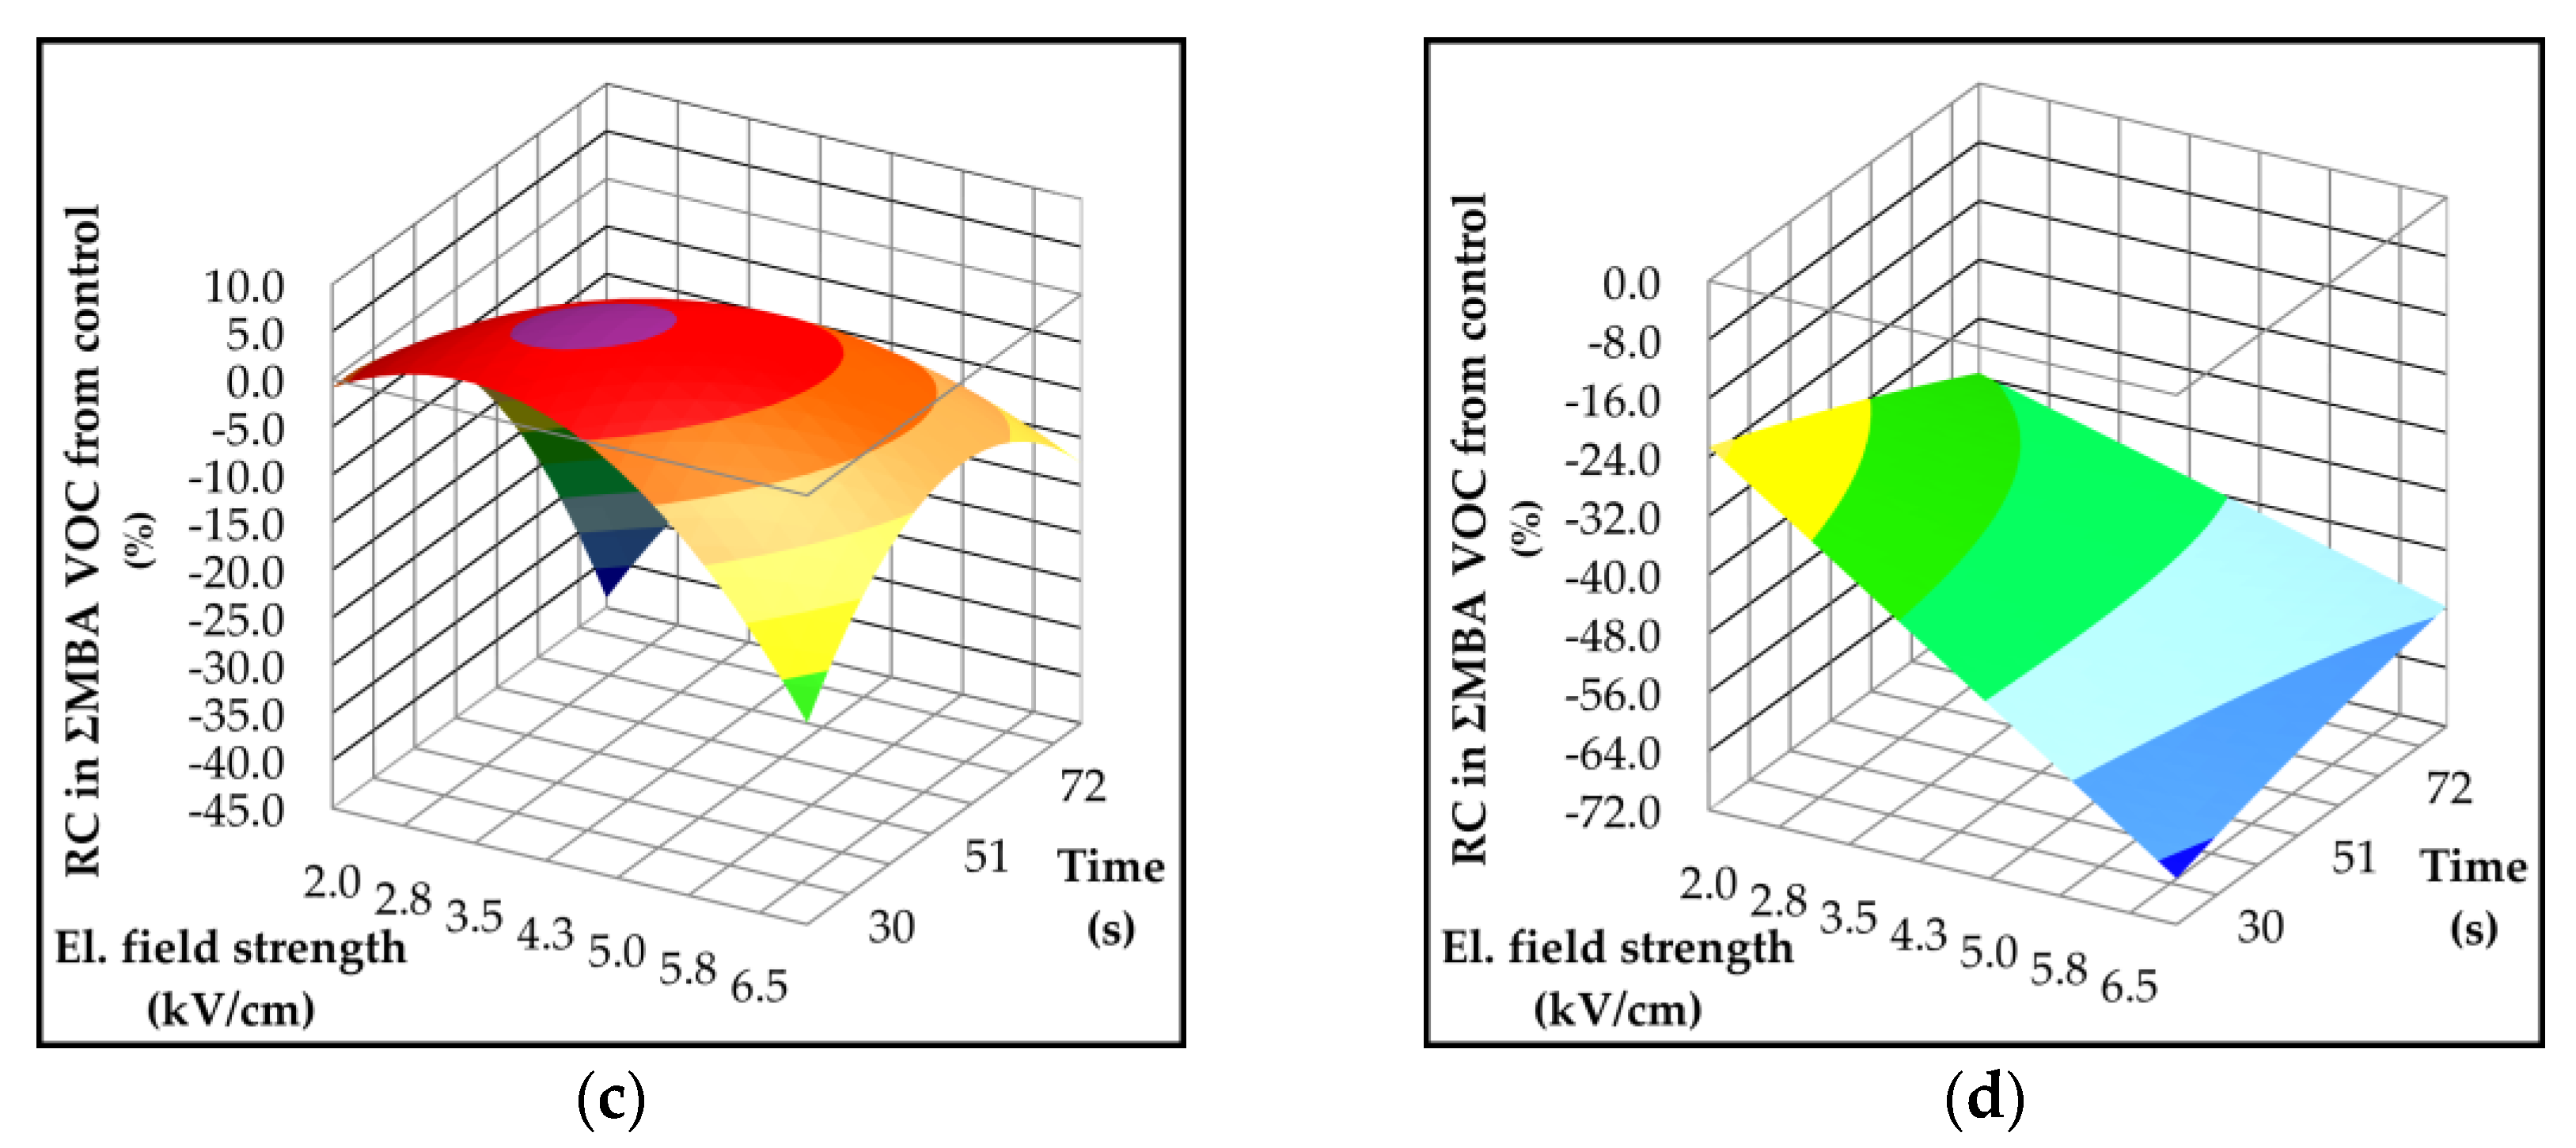

Table 1.
Extraction yield, basic quality parameters (acidity, peroxide value – PV and K-values) of control samples. Data are expressed as mean ± standard deviation.
Table 1.
Extraction yield, basic quality parameters (acidity, peroxide value – PV and K-values) of control samples. Data are expressed as mean ± standard deviation.
| Parameter | p-value | Variety | ||||
| Istarska bjelica | Rosulja | Levantinka | Oblica | |||
| Yield (%) | p ≤ 0.001 | 5.31 + 0.65 c | 5.74 + 0.56 c | 16.12 + 0.19 a | 11.19 + 0.79 b | |
| Acidity (% oleic fatty acid) | p ≤ 0.001 | 0.29 + 0.02 b | 0.37 + 0.01 a | 0.31 + 0.01 b | 0.20 + 0.01 c | |
| PV (meq O2/kg) | p ≤ 0.05 | 4.7 + 1.4 a | 4.3 + 0.2 ab | 2.7 + 0.2 b | 4.4 + 0.4 ab | |
| K-values | K232 | p ≤ 0.001 | 1.77 + 0.11 a | 1.93 + 0.03 a | 1.42 + 0.04 b | 1,49 + 0,04 b |
| K268 | p ≤ 0.001 | 0.13 + 0.02 ab | 0.17 + 0.01 a | 0.11 + 0.03 bc | 0,07 + 0,01 c | |
| ΔK | p = 0.119 | 0.00 + 0.00 | -0.01 + 0.01 | -0.01 + 0.01 | 0,00 + 0,00 | |
Values in each row followed by different letters are significantly different (p ≤ 0.05) according to Tukey’s multiple comparison test.
Table 2.
Lipoxygenase (LOX) activity (µmol HPOT*/mg protein) and composition of volatile compounds (VOC) (mg/kg) in control olive oil samples from Croatian varieties. Values are presented as mean ± standard deviation.
Table 2.
Lipoxygenase (LOX) activity (µmol HPOT*/mg protein) and composition of volatile compounds (VOC) (mg/kg) in control olive oil samples from Croatian varieties. Values are presented as mean ± standard deviation.
| Parameter | p-value | Variety | |||||
|---|---|---|---|---|---|---|---|
| Istarska bjelica | Rosulja | Levantinka | Oblica | ||||
| LOX Activity (µmol HPOT*/mg protein) |
p ≤ 0.001 | 15.48 + 0.61 b | 23.46 + 0.67 a | 2.42 + 0.36 d | 9.88 + 0.48 c | ||
| Volatile compound (mg/kg) |
RID** | ||||||
| from LOX path | |||||||
| 2-pentenal | A | p ≤ 0.001 | 0.68 ± 0.07 a | 0.10 ± 0.09 b | nd*** b | nd b | |
| 2-methyl-4-pentenal + 3-hexenal |
B B |
p ≤ 0.001 | 16.91 ± 1.01 a | 4.50 ± 0.88 b | 0.34 ± 0.18 c | 4.38 ± 0.68 b | |
| 2-hexenal | A | p ≤ 0.001 | 39.39 ± 6.56 a | 40.34 ± 2.79 a | 2.29 ± 2.53 b | 1.35 ± 0.49 b | |
| 1-penten-3-ol | A | p ≤ 0.01 | 0.87 ± 0.09 ab | 0.64 ± 0.15 b | 0.97 ± 0.10 a | 0.59 ± 0.09 b | |
| (E)-2-penten-1-ol | B | p = 0.441 | nd | nd | 0.07 ± 0.12 | nd | |
| (Z)-2-penten-1-ol | B | p ≤ 0.001 | 2.29 ± 0.32 a | 1.12 ± 0.17 b | 1.23 ± 0.10 b | 0.76 ± 0.09 b | |
| hexan-1-ol | B | p ≤ 0.001 | 0.33 ± 0.10 b | 0.99 ± 1.25 b | 3.42 ± 2.49 b | 9.94 ± 0.98 a | |
| 2-hexen-1-ol | A | p = 0.363 | 0.64 ± 0.32 | 10.25 ± 5.93 | 12.48 ± 1.56 | 8.50 ± 2.06 | |
| (E)-3-hexen-1-ol | A | p ≤ 0.001 | nd b | nd b | 0.50 ± 0.44 b | 1.29 ± 0.19 a | |
| (Z)-3-hexen-1-ol | A | p ≤ 0.001 | 9.78 ± 1.55 b | 6.83 ± 2.63 b | 7.59 ± 0.97 b | 19.48 ± 0.69 a | |
| 1-penten-3-one | A | p ≤ 0.001 | 4.48 ± 0.52 a | 1.08 ± 0.57 b | 1.07 ± 0.63 b | 0.51 ± 0.11 b | |
| pentan-3-one | B | p = 0.441 | nd | 0.25 ± 0.43 | nd | nd | |
| hexyl acetate | B | p ≤ 0.001 | nd b | nd b | 1.47 ± 0.20 a | nd b | |
| 3-hexenyl acetate | A | p ≤ 0.001 | nd b | 0.38 ± 0.12 b | 2.11 ± 0.38 a | nd b | |
| Total | p ≤ 0.01 | 75.37 ± 7.84 a | 66.48 ± 16.76 ab | 33.54 ± 5.08 c | 46.8 ± 3.61 bc | ||
| from OX | |||||||
| pentanal | A | p ≤ 0.001 | 0.43 ± 0.09 b | 0.21 ± 0.2 b | 1.32 ± 0.06 a | 1.06 ± 0.15 a | |
| 2,4-hexadienal | A | p ≤ 0.001 | 2.99 ± 0.92 a | 0.77 ± 0.2 b | 0.11 ± 0.04 b | 0.10 ± 0.05 b | |
| 4-oxohex-2-enal | B | p ≤ 0.001 | 4.94 ± 0.38 a | 0.91 ± 0.26 b | 0.19 ± 0.19 c | 0.03 ± 0.05 c | |
| nonanal | B | p = 0.07 | 0.18 ± 0.08 | 0.27 ± 0.07 | 0.14 ± 0.03 | 0.15 ± 0.02 | |
| Total | p ≤ 0.001 | 8.53 ± 1.16 a | 2.16 ± 0.56 b | 1.77 ± 0.25 b | 1.33 ± 0.1 b | ||
| from MBA | |||||||
| 2-methylbutanal | C | p ≤ 0.001 | 0.53 ± 0.21 a | 0.06 ± 0.05 b | nd b | 0.01 ± 0.02 b | |
| 3-methylbutanal | B | p ≤ 0.001 | 0.35 ± 0.10 a | nd b | nd b | nd b | |
| pentan-1-ol | B | p ≤ 0.05 | nd b | 0.06 ± 0.10 b | 0.24 ± 0.07 ab | 0.43 ± 0.23 a | |
| Total | p ≤ 0.05 | 0.89 ± 0.32 a | 0.12 ± 0.14 b | 0.24 ± 0.07 b | 0.45 ± 0.26 ab | ||
*HPOT - hydroperoxy-octadecatrienoic acid; **RID - reliability of identification: A-level — agreement of retention index (RI) and mass spectrum with those of an authentic compound; B-level — difference between experimental RI and literature RI < 20 and mass spectrum similarity match > 900; C-level — at least agreement of mass spectrum > 800; ***nd – not detected; values in each row followed by different letters are significantly different (p ≤ 0.05) according to Tukey’s multiple comparison tests.
Table 3.
Volatile compound composition (mg/kg) in oils extracted from the Istarska bjelica olive variety after pulsed electric field (PEF) pretreatment. Values are reported as mean ± standard deviation, representing differences in compound content relative to the untreated control.
Table 3.
Volatile compound composition (mg/kg) in oils extracted from the Istarska bjelica olive variety after pulsed electric field (PEF) pretreatment. Values are reported as mean ± standard deviation, representing differences in compound content relative to the untreated control.
| Volatile compound | RID* | p-value | Field strength (kV/cm) / Time (s) | ||||||||
|---|---|---|---|---|---|---|---|---|---|---|---|
| 1 / 60 | 2 / 30 | 2 / 90 | 4.5 / 18 | 4.5 / 60 | 4.5 / 102 | 7 / 30 | 7 / 90 | 8 / 60 | |||
| from LOX path | |||||||||||
| 2-pentenal | A | p ≤ 0.001 | -0.23 ± 0.10 a | -0.23 ± 0.07 a | -0.26 ± 0.04 a | -0.27 ± 0.07 a | -0.19 ± 0.08 a | -0.19 ± 0.12 a | -0.26 ± 0.14 a | -0.68 ± 0.00 b | -0.68 ± 0.00 b |
|
2-methyl-4-pentenal + 3-hexenal |
B B |
p = 0.129 | -7.54 ± 0.85 | -6.24 ± 0.71 | -6.17 ± 0.78 | -9.16 ± 1.17 | -9.64 ± 5.05 | -2.12 ± 4.08 | -4.88 ± 3.94 | -8.33 ± 0.23 | -14.51 ± 0.09 |
| 2-hexenal | A | p ≤ 0.001 | 45.82 ± 5.33 a | 47.44 ± 7.31 a | 45.22 ± 6.2 a | 39.08 ± 11.11 a | 24.77 ± 12.32 ab | -2.63 ± 9.54 bc | -5.58 ± 11.11 c | -25.91 ± 0.31 c | -37.61 ± 0.41 c |
| 1-penten-3-ol | A | p ≤ 0.01 | -0.07 ± 0.04 b | -0.07 ± 0.07 b | -0.02 ± 0.08 ab | -0.18 ± 0.07 b | -0.02 ± 0.15 ab | -0.04 ± 0.23 ab | -0.11 ± 0.24 b | 0.26 ± 0.05 ab | 0.40 ± 0.02 a |
| (E) -2-penten-1-ol | B | ** | 0.00 ± 0.00 | 0.00 ± 0.00 | 0.00 ± 0.00 | 0.00 ± 0.00 | 0.00 ± 0.00 | 0.00 ± 0.00 | 0.00 ± 0.00 | 0.32 ± 0.01 | 0.00 ± 0.00 |
| (Z) -2-penten-1-ol | B | p = 0.473 | -0.20 ± 0.09 | -0.22 ± 0.23 | -0.17 ± 0.17 | -0.57 ± 0.30 | -0.18 ± 0.35 | -0.27 ± 0.57 | -0.49 ± 0.56 | -0.06 ± 0.05 | 0.23 ± 0.12 |
| hexan-1-ol | B | p ≤ 0.001 | 0.18 ± 0.13 c | 0.06 ± 0.02 c | 0.03 ± 0.01 c | -0.04 ± 0.05 c | 0.04 ± 0.12 c | -0.17 ± 0.03 c | -0.16 ± 0.05 c | 2.91 ± 0.39 b | 5.56 ± 0.09 a |
| 2-hexen-1-ol | A | p ≤ 0.001 | 0.73 ± 0.12 c | 0.62 ± 0.11 cd | 0.52 ± 0.11 cd | 0.34 ± 0.14 cd | 0.36 ± 0.28 cd | -0.33 ± 0.08 d | -0.27 ± 0.12 cd | 21.18 ± 0.92 a | 18.97 ± 0.23 b |
| (Z) -3-hexen-1-ol | A | p ≤ 0.001 | -1.47 ± 0.75 b | -1.06 ± 0.72 b | -1.02 ± 0.49 b | -2.33 ± 1.18 b | -1.32 ± 1.36 b | -1.96 ± 1.96 b | -2.65 ± 2.36 b | 20.44 ± 0.94 a | 26.16 ± 4.21 a |
| 1-penten-3-one | A | p ≤ 0.001 | -1.38 ± 0.18 b | -1.14 ± 0.21 b | -1.14 ± 0.17 bc | -1.67 ± 0.30 b | -1.56 ± 0.46 b | -0.78 ± 0.86 b | -1.52 ± 1.05 b | -3.13 ± 0.09 c | 0.96 ± 0.03 a |
| from OX | |||||||||||
| pentanal | A | p ≤ 0.001 | -0.08 ± 0.13 b | -0.07 ± 0.02 b | -0.08 ± 0.01 b | -0.11 ± 0.04 b | -0.06 ± 0.13 b | -0.12 ± 0.01 b | -0.14 ± 0.14 b | 0.92 ± 0.05 a | 1.13 ± 0.05 a |
| 2,4-heksadienal | A | p ≤ 0.05 | -1.10 ± 0.96 ab | -0.12 ± 0.26 a | -0.09 ± 0.27 a | -1.59 ± 0.82 ab | -0.87 ± 0.81 ab | -0.94 ± 0.47 ab | -1.7 ± 0.27 ab | -1.84 ± 0.65 ab | -2.77 ± 0.03 b |
| 4-oxohex-2-enal | B | p ≤ 0.05 | -1.74 ± 0.85 a | -1.18 ± 0.07 a | -1.46 ± 0.38 a | -1.41 ± 0.72 a | -2.49 ± 1.48 a | -0.52 ± 1.43 a | -0.93 ± 1.34 a | -3.58 ± 0.18 a | -4.59 ± 0.05 a |
| nonanal | B | p = 0.109 | -0.05 ± 0.12 | 0.03 ± 0.01 | -0.18 ± 0.00 | 0.06 ± 0.03 | -0.07 ± 0.11 | -0.18 ± 0.00 | -0.13 ± 0.07 | -0.18 ± 0.00 | -0.09 ± 0.12 |
| from MBA | |||||||||||
| 2-methylbutanal | C | p ≤ 0.01 | 0.01 ± 0.07 abc | 0.07 ± 0.04 abc | 0.12 ± 0.07 ab | -0.23 ± 0.04 abc | 0.13 ± 0.19a | 0.02 ± 0.13 abc | -0.03 ± 0.19 abc | -0.28 ± 0.00 bc | -0.43 ± 0.01 c |
| 3-methylbutanal | B | p ≤ 0.01 | -0.02 ± 0.06 ab | -0.03 ± 0.01 ab | 0.02 ± 0.03 ab | -0.16 ± 0.03 abc | 0.04 ± 0.11 a | -0.02 ± 0.08 ab | -0.07 ± 0.10 abc | -0.19 ± 0.01 bc | -0.35 ± 0.00 c |
*RID – Reliability of Identification: A-level – agreement of retention index (RI) and mass spectrum with those of an authentic compound; B-level – difference between experimental and literature RI < 20 and mass spectrum similarity match > 900; C-level – mass spectrum similarity match > 800; ** not enough variance to compute p-value; values in each row followed by different letters are significantly different (p ≤ 0.05) according to Tukey’s multiple comparison test.
Table 4.
Volatile compound composition (mg/kg) in oils extracted from the Rosulja olive variety after pulsed electric field (PEF) pretreatment. Values are reported as mean ± standard deviation, representing differences in compound content relative to the untreated control.
Table 4.
Volatile compound composition (mg/kg) in oils extracted from the Rosulja olive variety after pulsed electric field (PEF) pretreatment. Values are reported as mean ± standard deviation, representing differences in compound content relative to the untreated control.
| Volatile compound | RID* | p-value | Field strength (kV/cm) / Time (s) | ||||||||
|---|---|---|---|---|---|---|---|---|---|---|---|
| 1 / 60 | 2 / 30 | 2 / 90 | 4.5 / 18 | 4.5 / 60 | 4.5 / 102 | 7 / 30 | 7 / 90 | 8 / 60 | |||
| from LOX path | |||||||||||
| 2-pentenal | A | p ≤ 0.01 | 0.07 ± 0.06 a | -0.10 ± 0.00 b | -0.01 ± 0.01 ab | 0.04 ± 0.02 ab | -0.02 ± 0.05 ab | 0.14 ± 0.01 a | 0.04 ± 0.01 ab | -0.04 ± 0.08 ab | 0.01 ± 0.00 ab |
|
2-methyl-4-pentenal + 3-hexenal |
B B |
p = 0.614 | 0.48 ± 0.25 | -1.25 ± 0.25 | -3.03 ± 0.18 | 0.46 ± 0.84 | -1.82 ± 2.46 | -2.40 ± 0.06 | 0.30 ± 0.86 | -3.20 ± 0.02 | -1.27 ± 0.15 |
| 2-hexenal | A | p = 0.096 | 20.09 ± 2.19 | -22.81 ± 2.18 | -29.38 ± 1.29 | 17.4 ± 6.26 | -14.85 ± 23.63 | 22.06 ± 1.40 | 18.36 ± 12.51 | -28.59 ± 0.10 | -18.71 ± 1.62 |
| 1-penten-3-ol | A | p = 0.554 | -0.04 ± 0.02 | 0.21 ± 0.03 | 0.29 ± 0.15 | 0.10 ± 0.05 | 0.20 ± 0.21 | 0.17 ± 0.03 | 0.02 ± 0.10 | 0.24 ± 0.00 | 0.23 ± 0.06 |
| (Z) -2-penten-1-ol | B | p = 0.101 | 0.10 ± 0.05 | 0.19 ± 0.12 | 0.32 ± 0.23 | 0.19 ± 0.16 | 0.11 ± 0.15 | 0.27 ± 0.04 | 0.19 ± 0.21 | 0.37 ± 0.02 | 0.37 ± 0.09 |
| hexan-1-ol | B | p ≤ 0.001 | -0.65 ± 0.01 b | 7.18 ± 0.67 a | 7.66 ± 1.13 a | -0.68 ± 0.00 b | 0.27 ± 1.34 b | -0.64 ± 0.07 b | -0.68 ± 0.06 b | 0.09 ± 1.37 b | 6.25 ± 0.36 a |
| 2-hexen-1-ol | A | p = 0.109 | -9.47 ± 0.03 | 19.95 ± 2.85 | 27.72 ± 4.97 | -9.16 ± 0.07 | 7.83 ± 16.68 | -8.95 ± 0.19 | -9.11 ± 0.24 | 31.14 ± 11.40 | 15.32 ± 1.72 |
| (Z) -3-hexen-1-ol | A | p ≤ 0.01 | -0.08 ± 0.74 abc | 8.80 ± 1.52 a | 7.76 ± 1.57 ab | -1.08 ± 0.45 bc | 1.39 ± 3.51 abc | -1.41 ± 0.14 bc | -1.17 ± 1.22 c | 3.73 ± 0.16 abc | 5.20 ± 0.75 abc |
| 1-penten-3-one | A | p = 0.153 | 0.43 ± 0.08 | -0.04 ± 0.17 | 0.11 ± 0.16 | 0.34 ± 0.06 | -0.52 ± 0.64 | 0.31 ± 0.08 | 0.17 ± 0.21 | -0.44 ± 0.00 | 0.24 ± 0.02 |
| pentan-3-on | B | p ≤ 0.01 | -0.08 ± 0.24 a | 0.67 ± 0.01 a | 0.93 ± 0.18 a | -0.25 ± 0.00 a | 0.28 ± 0.34 a | -0.25 ± 0.00 a | -0.25 ± 0.00 a | 0.92 ± 0.04 a | 0.95 ± 0.19 a |
| hexyl acetate | B | p ≤ 0.01 | 0.12 ± 0.01 a | 0.04 ± 0.06 ab | 0.00 ± 0.00 b | 0.00 ± 0.00 b | 0.01 ± 0.03 b | 0.00 ± 0.00 b | 0.00 ± 0.00 b | 0.00 ± 0.00 b | 0.00 ± 0.00 b |
| 3-hexenyl acetate | A | p ≤ 0.001 | 0.52 ± 0.15 a | 0.32 ± 0.14 a | -0.12 ± 0.06 bc | -0.26 ± 0.01 c | -0.26 ± 0.13 c | -0.26 ± 0.01 c | -0.13 ± 0.07 bc | -0.11 ± 0.02 bc | 0.19 ± 0.03 ab |
| from OX | |||||||||||
| pentanal | A | p = 0.149 | -0.03 ± 0.27 | -0.22 ± 0.00 | -0.22 ± 0.00 | 0.09 ± 0.31 | -0.16 ± 0.13 | 0.15 ± 0.01 | 0.16 ± 0.06 | -0.22 ± 0.00 | -0.22 ± 0.00 |
| 2,4-heksadienal | A | p = 0.778 | 0.46 ± 0.26 | -0.09 ± 0.27 | -0.36 ± 0.24 | 0.09 ± 0.22 | -0.21 ± 0.59 | 0.03 ± 0.08 | 0.19 ± 0.32 | -0.49 ± 0.01 | -0.29 ± 0.06 |
| 4-oxohex-2-enal | B | p = 0.077 | 0.52 ± 0.20 | -0.55 ± 0.17 | -0.79 ± 0.00 | -0.15 ± 0.14 | -0.51 ± 0.46 | -0.78 ± 0.00 | -0.08 ± 0.32 | -0.76 ± 0.06 | -0.68 ± 0.03 |
| nonanal | B | p ≤ 0.001 | 0.11 ± 0.01 a | 0.08 ± 0.05 ab | 0.01 ± 0.03 abc | 0.02 ± 0.02 abc | -0.11 ± 0.04 d | -0.02 ± 0.02 bcd | -0.04 ± 0.07 cd | -0.01 ± 0.02 abc | 0.04 ± 0.03 abc |
| from MBA | |||||||||||
| 2-methylbutanal | C | p ≤ 0.01 | 0.02 ± 0.00 ab | -0.06 ± 0.00 b | 0.00 ± 0.01 ab | 0.16 ± 0.03 a | 0.00 ± 0.00 b | 0.16 ± 0.00 a | 0.10 ± 0.03 ab | -0.03 ± 0.04 ab | 0.02 ± 0.00 ab |
| 3-methylbutanal | B | p ≤ 0.001 | 0.00 ± 0.00 b | 0.00 ± 0.00 b | 0.00 ± 0.00 b | 0.00 ± 0.00 b | 0.00 ± 0.00 b | 0.12 ± 0.00 a | 0.09 ± 0.02 ab | 0.00 ± 0.00 b | 0.00 ± 0.00 b |
| pentan-1-ol | B | p = 0.172 | -0.06 ± 0.00 | 0.43 ± 0.04 | 0.54 ± 0.08 | -0.06 ± 0.00 | 0.24 ± 0.32 | -0.06 ± 0.00 | -0.06 ± 0.00 | 0.51 ± 0.01 | 0.40 ± 0.04 |
*RID – Reliability of Identification: A-level – agreement of retention index (RI) and mass spectrum with those of an authentic compound; B-level – difference between experimental and literature RI < 20 and mass spectrum similarity match > 900; C-level – mass spectrum similarity match > 800; values in each row followed by different letters are significantly different (p ≤ 0.05) according to Tukey’s multiple comparison test.
Table 5.
Volatile compound composition (mg/kg) in oils extracted from the Levantinka olive variety after pulsed electric field (PEF) pretreatment. Values are reported as mean ± standard deviation, representing differences in compound content relative to the untreated control.
Table 5.
Volatile compound composition (mg/kg) in oils extracted from the Levantinka olive variety after pulsed electric field (PEF) pretreatment. Values are reported as mean ± standard deviation, representing differences in compound content relative to the untreated control.
| Volatile compound | RID* | p-value | Field strength (kV/cm) / Time (s) | ||||||||
|---|---|---|---|---|---|---|---|---|---|---|---|
| 1 / 60 | 2 / 30 | 2 / 90 | 4.5 / 18 | 4.5 / 60 | 4.5 / 102 | 7 / 30 | 7 / 90 | 8 / 60 | |||
| from LOX path | |||||||||||
| 2-pentenal | A | ** | 0.00 ± 0.00 | 0.00 ± 0.00 | 0.21 ± 0.02 | 0.00 ± 0.00 | 0.00 ± 0.00 | 0.00 ± 0.00 | 0.00 ± 0.00 | 0.00 ± 0.00 | 0.00 ± 0.00 |
|
2-methyl-4-pentenal + 3-hexenal |
B B |
p ≤ 0.001 | 0.07 ± 0.01 b | 0.23 ± 0.07 b | 2.14 ± 0.21 a | 0.05 ± 0.01 b | 0.20 ± 0.34 b | -0.14 ± 0.01 b | -0.22 ± 0.02 b | 0.08 ± 0.04 b | 1.49 ± 0.15 a |
| 2-hexenal | A | p ≤ 0.001 | -1.32 ± 0.19 c | -1.82 ± 0.07 c | 20.27 ± 2.10 a | -0.17 ± 0.45 c | 1.40 ± 2.64 c | -1.98 ± 0.02 c | -2.18 ± 0.01 c | 0.42 ± 0.29 c | 13.62 ± 0.95 b |
| 1-penten-3-ol | A | p = 0.079 | 0.04 ± 0.11 | 0.00 ± 0.12 | -0.09 ± 0.07 | -0.09 ± 0.01 | 0.10 ± 0.17 | 0.20 ± 0.06 | 0.24 ± 0.09 | 0.20 ± 0.13 | 0.00 ± 0.06 |
| (E) -2-penten-1-ol | B | p ≤ 0.01 | 0.19 ± 0.05 a | 0.10 ± 0.00 ab | -0.07 ± 0.00 b | 0.01 ± 0.11 ab | -0.03 ± 0.08 ab | 0.03 ± 0.09 ab | 0.16 ± 0.02 ab | 0.16 ± 0.03 ab | 0.00 ± 0.11 ab |
| (Z) -2-penten-1-ol | B | p = 0.079 | 0.20 ± 0.21 | 0.01 ± 0.07 | 0.17 ± 0.11 | -0.05 ± 0.03 | 0.01 ± 0.09 | -0.09 ± 0.05 | 0.03 ± 0.07 | 0.04 ± 0.16 | 0.11 ± 0.04 |
| hexan-1-ol | B | p ≤ 0.01 | -1.12 ± 0.61 ab | -0.16 ± 0.59 ab | -2.93 ± 0.04 b | -1.60 ± 0.00 ab | 1.88 ± 2.24 a | -1.21 ± 0.19 ab | -1.05 ± 0.10 ab | -1.89 ± 0.26 ab | 1.10 ± 0.33 ab |
| 2-hexen-1-ol | A | p ≤ 0.001 | 3.92 ± 2.80 a | -0.16 ± 1.47 a | -11.62 ± 0.01 b | -2.53 ± 0.02 a | -1.58 ± 2.80 a | 3.11 ± 1.29 a | 0.94 ± 0.76 a | -0.92 ± 1.31 a | -2.75 ± 0.67 a |
| (E) -3-hexen-1-ol | A | p ≤ 0.05 | 0.27 ± 0.08 a | 0.11 ± 0.09 a | -0.50 ± 0.00 a | -0.16 ± 0.49 a | -0.20 ± 0.34 a | 0.19 ± 0.07 a | 0.09 ± 0.04 a | -0.50 ± 0.00 a | -0.50 ± 0.00 a |
| (Z) -3-hexen-1-ol | A | p ≤ 0.001 | 1.37 ± 1.47 a | 0.16 ± 1.05 ab | -4.09 ± 0.28 d | -1.44 ± 0.05 bc | 0.78 ± 0.82 ab | 1.17 ± 0.65 a | 0.82 ± 0.41 ab | -2.5 ± 0.67 cd | 0.30 ± 0.44 ab |
| 1-penten-3-one | A | p ≤ 0.01 | -0.64 ± 0.01 a | 0.07 ± 0.11 a | 1.00 ± 0.14 a | 0.30 ± 0.05 a | 0.69 ± 0.88 a | -0.65 ± 0.01 a | -0.76 ± 0.04 a | -0.70 ± 0.07 a | 0.62 ± 0.07 a |
| hexyl acetate | B | p = 0.052 | 0.25 ± 0.37 | -0.02 ± 0.16 | 0.48 ± 0.18 | -0.13 ± 0.08 | 0.02 ± 0.24 | 0.44 ± 0.19 | 0.25 ± 0.16 | 0.15 ± 0.13 | 0.29 ± 0.15 |
| 3-hexenyl acetate | A | p ≤ 0.01 | 1.02 ± 0.58 abc | 0.52 ± 0.27 abc | 1.88 ± 0.44 a | 0.47 ± 0.04 abc | 0.08 ± 0.59 c | 1.19 ± 0.28 ab | 0.77 ± 0.13 abc | 0.84 ± 0.32 abc | 0.25 ± 0.16 bc |
| from OX | |||||||||||
| pentanal | A | p ≤ 0.001 | -0.1 ± 0.12 ab | -0.17 ± 0.13 ab | -0.91 ± 0.03 c | -0.29 ± 0.03 ab | -0.22 ± 0.09 ab | -0.03 ± 0.04 a | -0.02 ± 0.09 a | -0.08 ± 0.14 ab | -0.35 ± 0.13 b |
| 2,4-heksadienal | A | p ≤ 0.001 | -0.11 ± 0.00 c | -0.11 ± 0.00 c | 0.23 ± 0.11 a | -0.11 ± 0.00 c | -0.11 ± 0.00 c | -0.11 ± 0.00 c | -0.11 ± 0.00 c | -0.11 ± 0.00 c | 0.04 ± 0.00 b |
| 4-oxohex-2-enal | B | p ≤ 0.001 | -0.19 ± 0.00 c | -0.19 ± 0.00 c | 0.25 ± 0.14 a | -0.19 ± 0.00 c | -0.18 ± 0.03 c | -0.19 ± 0.00 c | -0.19 ± 0.00 c | -0.19 ± 0.00 c | 0.04 ± 0.01 b |
| nonanal | B | p = 757 | 0.02 ± 0.06 | 0.02 ± 0.02 | 0.04 ± 0.02 | 0.01 ± 0.01 | 0.04 ± 0.03 | 0.02 ± 0.02 | 0.04 ± 0.01 | 0.04 ± 0.02 | 0.05 ± 0.04 |
| from MBA | |||||||||||
| 2-methylbutanal | C | p ≤ 0.001 | 0.00 ± 0.00 c | 0.00 ± 0.00 c | 0.09 ± 0.00 a | 0.00 ± 0.00 c | 0.00 ± 0.00 c | 0.00 ± 0.00 c | 0.00 ± 0.00 c | 0.06 ± 0.00 b | 0.00 ± 0.00 c |
| pentan-1-ol | B | p ≤ 0.001 | -0.03 ± 0.03 a | 0.02 ± 0.04 a | -0.24 ± 0.00 b | -0.07 ± 0.00 ab | 0.03 ± 0.08 | -0.04 ± 0.01 a | 0.01 ± 0.02 a | -0.10 ± 0.02 ab | -0.09 ± 0.01 ab |
*RID – Reliability of Identification: A-level – agreement of retention index (RI) and mass spectrum with those of an authentic compound; B-level – difference between experimental and literature RI < 20 and mass spectrum similarity match > 900; C-level – mass spectrum similarity match > 800; ** not enough variance to compute p-value; values in each row followed by different letters are significantly different (p ≤ 0.05) according to Tukey’s multiple comparison test.
Table 6.
Volatile compound composition (mg/kg) in oils extracted from the Oblica olive variety after pulsed electric field (PEF) pretreatment. Values are reported as mean ± standard deviation, representing differences in compound content relative to the untreated control.
Table 6.
Volatile compound composition (mg/kg) in oils extracted from the Oblica olive variety after pulsed electric field (PEF) pretreatment. Values are reported as mean ± standard deviation, representing differences in compound content relative to the untreated control.
| Volatile compound | RID* | p-value | Field strength (kV/cm) / Time (s) | ||||||||
|---|---|---|---|---|---|---|---|---|---|---|---|
| 1 / 60 | 2 / 30 | 2 / 90 | 4.5 / 18 | 4.5 / 60 | 4.5 / 102 | 7 / 30 | 7 / 90 | 8 / 60 | |||
| from LOX path | |||||||||||
|
2-methyl-4-pentenal + 3-hexenal |
B B |
p = 0.370 | -0.09 ± 1.23 | -2.17 ± 1.23 | -1.4 ± 1.97 | 1.71 ± 0.76 | -1.89 ± 2.14 | -3.27 ± 1.34 | -1.21 ± 1.45 | -1.03 ± 2.92 | -2.06 ± 1.43 |
| 2-hexenal | A | p ≤ 0.001 | 0.19 ± 0.04 b | -0.36 ± 0.00 bc | 0.24 ± 0.20 b | 2.51 ± 0.14 a | 0.14 ± 0.31 b | -0.10 ± 0.10 bc | 0.13 ± 0.11 b | -0.33 ± 0.15 bc | -0.78 ± 0.01 c |
| 1-penten-3-ol | A | p = 0.688 | 0.01 ± 0.06 | 0.02 ± 0.01 | -0.05 ± 0.06 | -0.08 ± 0.16 | -0.06 ± 0.08 | -0.02 ± 0.05 | -0.10 ± 0.03 | 0.00 ± 0.07 | 0.00 ± 0.04 |
| (E) -2-penten-1-ol | B | p = 0.724 | 0.00 ± 0.00 | 0.00 ± 0.00 | 0.00 ± 0.00 | 0.08 ± 0.11 | 0.02 ± 0.04 | 0.08 ± 0.11 | 0.06 ± 0.08 | 0.05 ± 0.07 | 0.07 ± 0.09 |
| (Z) -2-penten-1-ol | B | p = 0.463 | 0.03 ± 0.05 | 0.07 ± 0.05 | -0.03 ± 0.12 | -0.10 ± 0.18 | -0.06 ± 0.16 | -0.15 ± 0.15 | -0.13 ± 0.04 | -0.01 ± 0.00 | -0.22 ± 0.01 |
| hexan-1-ol | B | p = 0.581 | 3.86 ± 0.84 | 3.75 ± 0.12 | 4.52 ± 1.07 | 3.85 ± 4.34 | -1.55 ± 7.33 | 1.53 ± 1.19 | 2.27 ± 1.17 | 5.07 ± 2.18 | -2.43 ± 0.46 |
| 2-hexen-1-ol | A | p = 0.997 | 6.37 ± 0.31 | 8.10 ± 0.20 | 3.53 ± 0.96 | 6.57 ± 4.80 | 7.65 ± 10.65 | 10.1 ± 1.60 | 7.73 ± 1.48 | 6.13 ± 2.40 | 5.88 ± 0.43 |
| (E) -3-hexen-1-ol | A | p = 0.550 | -0.94 ± 0.18 | 0.03 ± 0.01 | 0.13 ± 0.00 | -0.31 ± 1.39 | -0.28 ± 0.60 | 0.17 ± 0.13 | -0.15 ± 0.12 | 0.24 ± 0.20 | -0.10 ± 0.03 |
| (Z) -3-hexen-1-ol | A | p ≤ 0.05 | 1.52 ± 0.53 a | -0.52 ± 0.37 a | -0.19 ± 1.59 a | -2.91 ± 4.98 a | 3.33 ± 5.37 a | -4.59 ± 1.00 a | -6.97 ± 1.04 a | -1.54 ± 2.61 a | -7.73 ± 0.37 a |
| 1-penten-3-one | A | p = 0.179 | 0.48 ± 0.09 | 0.48 ± 0.02 | 0.45 ± 0.04 | 0.25 ± 0.24 | 0.35 ± 0.36 | 0.11 ± 0.02 | 0.13 ± 0.01 | 0.67 ± 0.16 | -0.10 ± 0.06 |
| from OX | |||||||||||
| pentanal | A | p = 0.415 | 0.14 ± 0.07 | 0.14 ± 0.04 | -0.08 ± 0.06 | 0.02 ± 0.34 | -0.10 ± 0.18 | 0.01 ± 0.07 | -0.13 ± 0.05 | -0.02 ± 0.12 | 0.09 ± 0.04 |
| 2,4-heksadienal | A | p ≤ 0.001 | -0.01 ± 0.01 a | -0.10 ± 0.00 c | -0.10 ± 0.00 c | -0.05 ± 0.02 b | -0.10 ± 0.00 c | -0.10 ± 0.01 c | -0.10 ± 0.02 c | -0.10 ± 0.03 c | -0.10 ± 0.04 c |
| nonanal | B | p = 0.893 | 0.03 ± 0.01 | 0.03 ± 0.02 | -0.01 ± 0.00 | 0.00 ± 0.04 | -0.02 ± 0.06 | -0.01 ± 0.01 | 0.00 ± 0.01 | 0.00 ± 0.02 | -0.03 ± 0.00 |
| from MBA | |||||||||||
| pentan-1-ol | B | p ≤ 0.01 | -0.16 ± 0.04 abc | -0.02 ± 0.02 a | -0.11 ± 0.08 ab | -0.26 ± 0.10 bc | -0.20 ± 0.07 abc | -0.25 ± 0.03 bc | -0.22 ± 0.03 abc | -0.18 ± 0.02 abc | -0.35 ± 0.00 c |
*RID – Reliability of Identification: A-level – agreement of retention index (RI) and mass spectrum with those of an authentic compound; B-level – difference between experimental and literature RI < 20 and mass spectrum similarity match > 900; C-level – mass spectrum similarity match > 800; values in each row followed by different letters are significantly different (p ≤ 0.05) according to Tukey’s multiple comparison test.
Disclaimer/Publisher’s Note: The statements, opinions and data contained in all publications are solely those of the individual author(s) and contributor(s) and not of MDPI and/or the editor(s). MDPI and/or the editor(s) disclaim responsibility for any injury to people or property resulting from any ideas, methods, instructions or products referred to in the content. |
© 2025 by the authors. Licensee MDPI, Basel, Switzerland. This article is an open access article distributed under the terms and conditions of the Creative Commons Attribution (CC BY) license (http://creativecommons.org/licenses/by/4.0/).
Copyright: This open access article is published under a Creative Commons CC BY 4.0 license, which permit the free download, distribution, and reuse, provided that the author and preprint are cited in any reuse.


